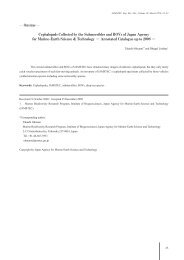
Marine Ecosystems Research Department - jamstec japan agency ...
Marine Ecosystems Research Department - jamstec japan agency ...
Marine Ecosystems Research Department - jamstec japan agency ...

You also want an ePaper? Increase the reach of your titles
YUMPU automatically turns print PDFs into web optimized ePapers that Google loves.
1000<br />
Japan <strong>Marine</strong> Science and Technology Center<br />
Frontier Observational <strong>Research</strong> System for Global Change<br />
Mooring Sites as of March 1, 2003<br />
29˚N<br />
Amami-Ohshima<br />
29<br />
1000<br />
1000<br />
1000<br />
Amami-Ohshima<br />
28˚N<br />
AE01<br />
28<br />
1000<br />
1000<br />
Latitude (N)<br />
27<br />
26<br />
1000<br />
1000<br />
1000<br />
1000<br />
1000<br />
1000<br />
Okinawa<br />
1000<br />
27˚N<br />
26˚N<br />
Okinawa<br />
OS-Line<br />
OS01<br />
E-Line<br />
AE-Line<br />
E07<br />
AE08<br />
25<br />
24<br />
1000<br />
Miyakojima<br />
1000<br />
124 125 126 127 128 129 130 131 132<br />
Longitude (E)<br />
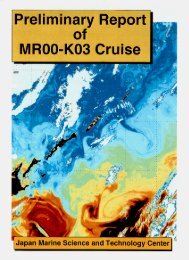
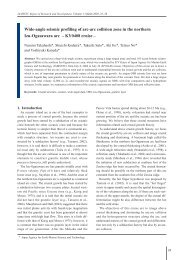
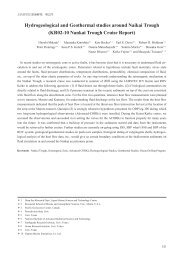
Fig. 8 Locations of moored instruments deployed in December<br />
2002 by S/V Yokosuka.<br />
mark: PIES, mark: CPIES, markCurrent meters<br />
University), October (R/V Chofumaru of the Japan<br />
Meteorological Agency) and December (S/V Yokosuka)<br />
along the ground trucks of the satellite altimeter. From<br />
the data obtained by these hydrographic observations<br />
in , we have obtained the following results:<br />
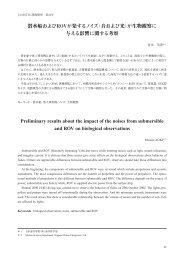
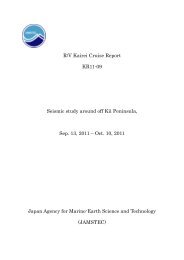
) In June, September and October, the volume transport<br />
of the Ryukyu Current System southeast of<br />
Amami-Ohshima Island was much larger than that<br />
southeast of Okinawa Island by - Sv. This<br />
large difference can be explained well by the westward<br />
current flowing into the region between<br />
Amami-Ohshima and Okinawa Islands (Fig. ).<br />
AE01 AE03 AE05 AE07<br />
0<br />
25˚N<br />
127˚E 128˚E 129˚E 130˚E 131˚E 132˚E<br />
Transport<br />
(Sv)<br />
AE-Line<br />
E-Line<br />
OS-Line<br />
Res i due<br />
OS06<br />
E01<br />
Jun.<br />
R/V Mirai<br />
22.08<br />
29.08<br />
-4.49<br />
+2.51<br />
Sep.<br />
T/S Kakuyo-maru<br />
17.10<br />
6.15<br />
7.05<br />
-3.90<br />
Oct.<br />
R/V Chofu-maru<br />
19.36<br />
17.53<br />
4.81<br />
+2.98<br />
upper layer (01000dbar) referred to shipboard ADCP data at 100m depth<br />
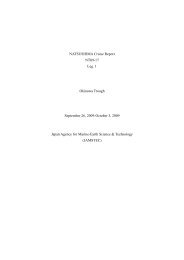
Fig. 9 Map showing the volume transport budget in the area<br />
enclosed by AE-line southeast of Amami-Ohshima Island,<br />
OS-line southeast of Okinawa Island, and E-line connecting<br />
the southeasternmost stations of AE- and OS-lines in June<br />
(Red), September (Blue) and October (Green). Numerals in<br />
the bottom table are the geostrophic volume transport in<br />
Sv in the top 1000 dbar layer referred to current velocity at<br />
100m depth measured by ship-mounted ADCP.<br />
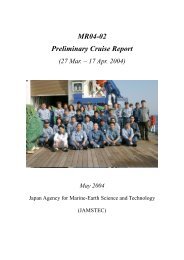
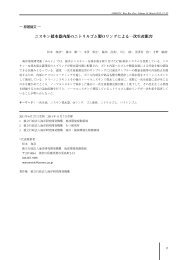
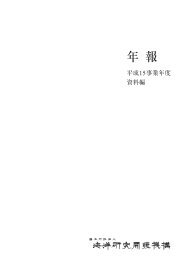
) Around -m depth layer in the southeast of<br />
Amami-Ohshima Island, there was a subsurface<br />
maximum velocity core in June, September and<br />
October. The difference of current speed at the<br />
maximum core from that of surrounding was more<br />
than cm/s (Fig.).<br />
Contour interval; 0.1m/s<br />
dbar<br />
200<br />
400<br />
600<br />
800<br />
1000<br />
1200<br />
1400<br />
1600<br />
1800<br />
2000<br />
Jun. Sep. Oct.<br />
Geostrophic current velocity<br />
referred to Shipboard ADCP data at 100m Depth<br />
Fig.10 Vertical sections of geostrophic current referred to current velocity at 100m depth<br />
measured by ship-mounted ADCP in the southeast of Amami-Ohshima Island in June<br />
(left), September (middle) and October (right) of 2002. Shaded areas indicate the southwestward<br />
current. Contour interval is 0.1 m/s.<br />
163