Marine Ecosystems Research Department - jamstec japan agency ...
Marine Ecosystems Research Department - jamstec japan agency ...
Marine Ecosystems Research Department - jamstec japan agency ...

You also want an ePaper? Increase the reach of your titles
YUMPU automatically turns print PDFs into web optimized ePapers that Google loves.
JAMSTEC 2002 Annual Report<br />
Institute for Frontier <strong>Research</strong> on Earth Evolution (IFREE)<br />
4. Plate Dynamics Modeling <strong>Research</strong> Group<br />
4.1. Outline<br />
The objective of our group is to develop models for<br />
subduction zone structure, deformation, failure, and flow<br />
mechanisms. Numerical modeling is done with crustal<br />
structure data obtained from the structure research group.<br />
Results from rock experiments and field surveys of the<br />
material property research group also aid in numerical<br />
fault zone simulations. The Earth Simulator (ES) supercomputer<br />
provides the computational power for large<br />
scale -D numerical models to obtain an integrated<br />
model of subduction dynamics. Several simulation codes<br />
for the ES are being developed.<br />
4.2. Results<br />
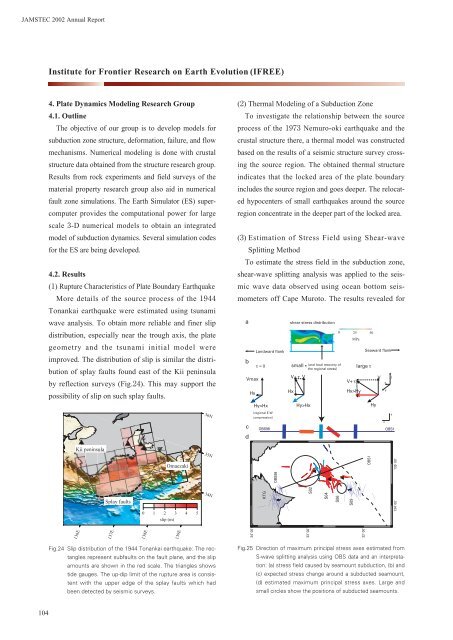
() Rupture Characteristics of Plate Boundary Earthquake<br />
More details of the source process of the <br />
Tonankai earthquake were estimated using tsunami<br />
wave analysis. To obtain more reliable and finer slip<br />
distribution, especially near the trough axis, the plate<br />
geometry and the tsunami initial model were<br />
improved. The distribution of slip is similar the distribution<br />
of splay faults found east of the Kii peninsula<br />
by reflection surveys (Fig.). This may support the<br />
possibility of slip on such splay faults.<br />
36N<br />
() Thermal Modeling of a Subduction Zone<br />
To investigate the relationship between the source<br />
process of the Nemuro-oki earthquake and the<br />
crustal structure there, a thermal model was constructed<br />
based on the results of a seismic structure survey crossing<br />
the source region. The obtained thermal structure<br />
indicates that the locked area of the plate boundary<br />
includes the source region and goes deeper. The relocated<br />
hypocenters of small earthquakes around the source<br />
region concentrate in the deeper part of the locked area.<br />
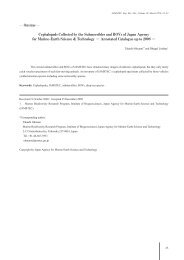
() Estimation of Stress Field using Shear-wave<br />
Splitting Method<br />
To estimate the stress field in the subduction zone,<br />
shear-wave splitting analysis was applied to the seismic<br />
wave data observed using ocean bottom seismometers<br />
off Cape Muroto. The results revealed for<br />
a<br />
b<br />
Vmax<br />
c<br />
d<br />
Hx<br />
Landward flank<br />
τ = 0<br />
Hy>Hx<br />
(regional E-W<br />
compression)<br />
OBS98<br />
shear stress distribution<br />
V+ τ V<br />
Hx<br />
small τ<br />
Hy>Hx<br />
0<br />
(and local recovery of<br />
the regional stress)<br />
25<br />
V+ τ<br />
MPa<br />
Hx>Hy<br />
large τ<br />
50<br />
Seaward flank<br />
Hy<br />
V<br />
x<br />
x<br />
y<br />
z<br />
y<br />
OBS1<br />
Kii peninsula<br />
Splay faults<br />
Omaezaki<br />
0 1 2 3 4 5<br />
slip (m)<br />
35N<br />
34N<br />
KTG<br />
OBS98<br />
S02<br />
S04<br />
S06<br />
S09<br />
OBS1<br />
134˚ 00' 135˚ 00'<br />
136E<br />
137E<br />
138E<br />
139E<br />
34˚ 00'<br />
33˚ 00'<br />
32˚ 00'<br />
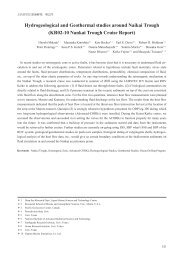
Fig.24 Slip distribution of the 1944 Tonankai earthquake: The rectangles<br />
represent subfaults on the fault plane, and the slip<br />
amounts are shown in the red scale. The triangles shows<br />
tide gauges. The up-dip limit of the rupture area is consistent<br />
with the upper edge of the splay faults which had<br />
been detected by seismic surveys.<br />
Fig.25 Direction of maximum principal stress axes estimated from<br />
S-wave splitting analysis using OBS data and an interpretation:<br />
(a) stress field caused by seamount subduction, (b) and<br />
(c) expected stress change around a subducted seamount,<br />
(d) estimated maximum principal stress axes. Large and<br />
small circles show the positions of subducted seamounts.<br />
104