leachate flow in leakage collection layers due to defects in ...
leachate flow in leakage collection layers due to defects in ... leachate flow in leakage collection layers due to defects in ...
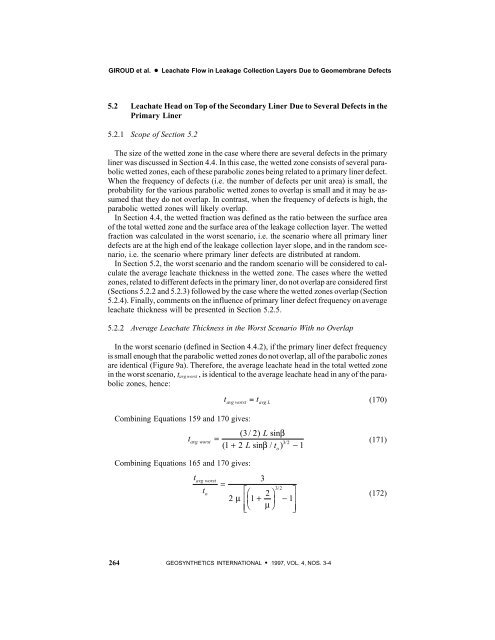
GIROUD et al. D Leachate Flow in Leakage Collection Layers Due to Geomembrane Defects 5.2 Leachate Head on Top of the Secondary Liner Due to Several Defects in the Primary Liner 5.2.1 Scope of Section 5.2 The size of the wetted zone in the case where there are several defects in the primary liner was discussed in Section 4.4. In this case, the wetted zone consists of several parabolic wetted zones, each of these parabolic zones being related to a primary liner defect. When the frequency of defects (i.e. the number of defects per unit area) is small, the probability for the various parabolic wetted zones to overlap is small and it may be assumed that they do not overlap. In contrast, when the frequency of defects is high, the parabolic wetted zones will likely overlap. In Section 4.4, the wetted fraction was defined as the ratio between the surface area of the total wetted zone and the surface area of the leakage collection layer. The wetted fraction was calculated in the worst scenario, i.e. the scenario where all primary liner defects are at the high end of the leakage collection layer slope, and in the random scenario, i.e. the scenario where primary liner defects are distributed at random. In Section 5.2, the worst scenario and the random scenario will be considered to calculate the average leachate thickness in the wetted zone. The cases where the wetted zones, related to different defects in the primary liner, do not overlap are considered first (Sections 5.2.2 and 5.2.3) followed by the case where the wetted zones overlap (Section 5.2.4). Finally, comments on the influence of primary liner defect frequency on average leachate thickness will be presented in Section 5.2.5. 5.2.2 Average Leachate Thickness in the Worst Scenario With no Overlap In the worst scenario (defined in Section 4.4.2), if the primary liner defect frequency is small enough that the parabolic wetted zones do not overlap, all of the parabolic zones are identical (Figure 9a). Therefore, the average leachate head in the total wetted zone in the worst scenario, t avg worst , is identical to the average leachate head in any of the parabolic zones, hence: t avg worst Combining Equations 159 and 170 gives: t avg worst Combining Equations 165 and 170 gives: t avg worst t o = t avg L ( 3/ 2) L sinb = 32 ( 1+ 2 L sin b / t ) / -1 3 = 2 2 m 1+ m L F NM HG o 32 / I - KJ O QP 1 (170) (171) (172) 264 GEOSYNTHETICS INTERNATIONAL S 1997, VOL. 4, NOS. 3-4
GIROUD et al. D Leachate Flow in Leakage Collection Layers Due to Geomembrane Defects where μ is defined by Equation 109. Values of t avg worst /t o as a function of μ are given in Table 6. Table 6. Values of t avg worst /t o , t avg rand /t o , t avg rand /t avg worst ,andt avg rand λ rand /(t avg worst λ worst ). μ t avgworst t o t avgrand t o t avgrand t avgworst t avgrand λ rand t avgworst λ worst 1 × 10 -4 0.0053 0.0072 1.3572 0.5429 2 × 10 -4 0.0075 0.0102 1.3572 0.5429 3 × 10 -4 0.0092 0.0125 1.3571 0.5429 5 × 10 -4 0.0119 0.0161 1.3571 0.5430 1 × 10 -3 0.0168 0.0227 1.3570 0.5431 2 × 10 -3 0.0237 0.0321 1.3567 0.5432 3 × 10 -3 0.0290 0.0393 1.3564 0.5434 5 × 10 -3 0.0374 0.0507 1.3558 0.5438 1 × 10 -2 0.0527 0.0713 1.3543 0.5446 2 × 10 -2 0.0740 0.0999 1.3512 0.5464 3 × 10 -2 0.0900 0.1213 1.3478 0.5482 5 × 10 -2 0.1147 0.1538 1.3408 0.5517 1 × 10 -1 0.1575 0.2083 1.3225 0.5507 2 × 10 -1 0.2114 0.2717 1.2855 0.5787 3 × 10 -1 0.2472 0.3091 1.2507 0.5963 5 × 10 -1 0.2947 0.3505 1.1892 0.6297 6 × 10 -1 0.3117 0.3623 1.1624 0.6451 7 × 10 -1 0.3259 0.3708 1.1379 0.6594 8 × 10 -1 0.3380 0.3769 1.1152 0.6728 9 × 10 -1 0.3484 0.3812 1.0942 0.6849 1.000 0.3575 0.3841 1.0746 0.6959 1.0696 0.3632 0.3855 1.0616 0.7029 2 0.4102 0.43 1.04 0.83 3 0.4342 0.45 1.03 0.89 5 0.4570 0.47 1.02 0.93 1 × 10 1 0.4769 0.48 1.01 0.96 2 × 10 1 0.4880 0.49 1.01 0.98 3 × 10 1 0.4919 0.49 1.00 0.98 5 × 10 1 0.4951 0.50 1.00 0.99 1 × 10 2 0.4975 0.50 1.00 0.99 2 × 10 2 0.4988 0.50 1.00 1.00 3 × 10 2 0.4992 0.50 1.00 1.00 5 × 10 2 0.4995 0.50 1.00 1.00 ∞ 0.5000 0.5000 1.0000 1.0000 Notes: The tabulated values were calculated using the following equations: t avg worst /t o , Equation 172; and t avg rand /t o , Equation 189 for 0 < μ ≤ 1.0696. Values of t avg rand /t avg worst for μ > 1.0696 were interpolated graphically between 1.0616 and 1.000. Values of t avg rand /t o for μ > 1.0696 were then derived. Values of t avg rand λ rand /(t avg worst λ worst ) were calculated using Equation 192 for μ ≤ 1.0696 and were calculated numerically (using values of λ rand and λ worst from Table 3) for μ > 1.0696. The dimensionless parameter μ is defined by Equation 108. It is important to note that the tabulated values are valid only if the wetted areas related to various defects in the primary liner do not overlap. GEOSYNTHETICS INTERNATIONAL S 1997, VOL. 4, NOS. 3-4 265
- Page 1 and 2: Technical Paper by J.P. Giroud, B.A
- Page 3 and 4: GIROUD et al. D Leachate Flow in Le
- Page 5 and 6: GIROUD et al. D Leachate Flow in Le
- Page 7 and 8: GIROUD et al. D Leachate Flow in Le
- Page 9 and 10: GIROUD et al. D Leachate Flow in Le
- Page 11 and 12: GIROUD et al. D Leachate Flow in Le
- Page 13 and 14: GIROUD et al. D Leachate Flow in Le
- Page 15 and 16: GIROUD et al. D Leachate Flow in Le
- Page 17 and 18: GIROUD et al. D Leachate Flow in Le
- Page 19 and 20: GIROUD et al. D Leachate Flow in Le
- Page 21 and 22: GIROUD et al. D Leachate Flow in Le
- Page 23 and 24: GIROUD et al. D Leachate Flow in Le
- Page 25 and 26: GIROUD et al. D Leachate Flow in Le
- Page 27 and 28: GIROUD et al. D Leachate Flow in Le
- Page 29 and 30: GIROUD et al. D Leachate Flow in Le
- Page 31 and 32: GIROUD et al. D Leachate Flow in Le
- Page 33 and 34: GIROUD et al. D Leachate Flow in Le
- Page 35 and 36: GIROUD et al. D Leachate Flow in Le
- Page 37 and 38: GIROUD et al. D Leachate Flow in Le
- Page 39 and 40: GIROUD et al. D Leachate Flow in Le
- Page 41 and 42: GIROUD et al. D Leachate Flow in Le
- Page 43 and 44: GIROUD et al. D Leachate Flow in Le
- Page 45 and 46: GIROUD et al. D Leachate Flow in Le
- Page 47 and 48: GIROUD et al. D Leachate Flow in Le
- Page 49: GIROUD et al. D Leachate Flow in Le
- Page 53 and 54: GIROUD et al. D Leachate Flow in Le
- Page 55 and 56: GIROUD et al. D Leachate Flow in Le
- Page 57 and 58: GIROUD et al. D Leachate Flow in Le
- Page 59 and 60: GIROUD et al. D Leachate Flow in Le
- Page 61 and 62: GIROUD et al. D Leachate Flow in Le
- Page 63 and 64: GIROUD et al. D Leachate Flow in Le
- Page 65 and 66: GIROUD et al. D Leachate Flow in Le
- Page 67 and 68: GIROUD et al. D Leachate Flow in Le
- Page 69 and 70: GIROUD et al. D Leachate Flow in Le
- Page 71 and 72: GIROUD et al. D Leachate Flow in Le
- Page 73 and 74: GIROUD et al. D Leachate Flow in Le
- Page 75 and 76: GIROUD et al. D Leachate Flow in Le
- Page 77 and 78: GIROUD et al. D Leachate Flow in Le
GIROUD et al. D Leachate Flow <strong>in</strong> Leakage Collection Layers Due <strong>to</strong> Geomembrane Defects<br />
5.2 Leachate Head on Top of the Secondary L<strong>in</strong>er Due <strong>to</strong> Several Defects <strong>in</strong> the<br />
Primary L<strong>in</strong>er<br />
5.2.1 Scope of Section 5.2<br />
The size of the wetted zone <strong>in</strong> the case where there are several <strong>defects</strong> <strong>in</strong> the primary<br />
l<strong>in</strong>er was discussed <strong>in</strong> Section 4.4. In this case, the wetted zone consists of several parabolic<br />
wetted zones, each of these parabolic zones be<strong>in</strong>g related <strong>to</strong> a primary l<strong>in</strong>er defect.<br />
When the frequency of <strong>defects</strong> (i.e. the number of <strong>defects</strong> per unit area) is small, the<br />
probability for the various parabolic wetted zones <strong>to</strong> overlap is small and it may be assumed<br />
that they do not overlap. In contrast, when the frequency of <strong>defects</strong> is high, the<br />
parabolic wetted zones will likely overlap.<br />
In Section 4.4, the wetted fraction was def<strong>in</strong>ed as the ratio between the surface area<br />
of the <strong>to</strong>tal wetted zone and the surface area of the <strong>leakage</strong> <strong>collection</strong> layer. The wetted<br />
fraction was calculated <strong>in</strong> the worst scenario, i.e. the scenario where all primary l<strong>in</strong>er<br />
<strong>defects</strong> are at the high end of the <strong>leakage</strong> <strong>collection</strong> layer slope, and <strong>in</strong> the random scenario,<br />
i.e. the scenario where primary l<strong>in</strong>er <strong>defects</strong> are distributed at random.<br />
In Section 5.2, the worst scenario and the random scenario will be considered <strong>to</strong> calculate<br />
the average <strong>leachate</strong> thickness <strong>in</strong> the wetted zone. The cases where the wetted<br />
zones, related <strong>to</strong> different <strong>defects</strong> <strong>in</strong> the primary l<strong>in</strong>er, do not overlap are considered first<br />
(Sections 5.2.2 and 5.2.3) followed by the case where the wetted zones overlap (Section<br />
5.2.4). F<strong>in</strong>ally, comments on the <strong>in</strong>fluence of primary l<strong>in</strong>er defect frequency on average<br />
<strong>leachate</strong> thickness will be presented <strong>in</strong> Section 5.2.5.<br />
5.2.2 Average Leachate Thickness <strong>in</strong> the Worst Scenario With no Overlap<br />
In the worst scenario (def<strong>in</strong>ed <strong>in</strong> Section 4.4.2), if the primary l<strong>in</strong>er defect frequency<br />
is small enough that the parabolic wetted zones do not overlap, all of the parabolic zones<br />
are identical (Figure 9a). Therefore, the average <strong>leachate</strong> head <strong>in</strong> the <strong>to</strong>tal wetted zone<br />
<strong>in</strong> the worst scenario, t avg worst , is identical <strong>to</strong> the average <strong>leachate</strong> head <strong>in</strong> any of the parabolic<br />
zones, hence:<br />
t<br />
avg worst<br />
Comb<strong>in</strong><strong>in</strong>g Equations 159 and 170 gives:<br />
t<br />
avg worst<br />
Comb<strong>in</strong><strong>in</strong>g Equations 165 and 170 gives:<br />
t<br />
avg worst<br />
t<br />
o<br />
= t<br />
avg L<br />
( 3/ 2) L s<strong>in</strong>b<br />
=<br />
32<br />
( 1+ 2 L s<strong>in</strong> b / t ) / -1<br />
3<br />
=<br />
2<br />
2 m 1+<br />
m<br />
L<br />
F<br />
NM<br />
HG<br />
o<br />
32 /<br />
I<br />
-<br />
KJ<br />
O<br />
QP<br />
1<br />
(170)<br />
(171)<br />
(172)<br />
264 GEOSYNTHETICS INTERNATIONAL S 1997, VOL. 4, NOS. 3-4


