Quantitative paleoenvironmental and paleoclimatic reconstruction ...
Quantitative paleoenvironmental and paleoclimatic reconstruction ...
Quantitative paleoenvironmental and paleoclimatic reconstruction ...

Create successful ePaper yourself
Turn your PDF publications into a flip-book with our unique Google optimized e-Paper software.
ARTICLE IN PRESS<br />
N.D. Sheldon, N.J. Tabor / Earth-Science Reviews xxx (2009) xxx–xxx<br />
43<br />
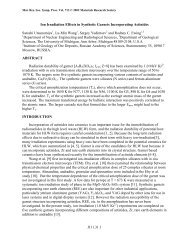
Fig. 24. Comparison of MAT derived from EEMT <strong>and</strong> Salinization. A) MAT estimates based on Salinization (y-axis) <strong>and</strong> EEMT (x-axis) are generally negatively correlated. B) MAT<br />
estimates from Salinization (filled diamonds) <strong>and</strong> EEMT (open squares) as a function of time show considerable overlap when errors are included, but EEMT generally predicts<br />
warmer conditions than Salinization.<br />
However, the uncertainty on the MAT estimates using Eq. (70) are<br />
fairly large <strong>and</strong> non-linear owing to the form of Eq. (69). On average for<br />
these samples the error in MAT is +4 °C <strong>and</strong> − 4.7 °C (Fig. 24),<br />
comparable to the error on Eq. (25). Breaking it down further, the<br />
component of error due to uncertainty in EEMT is only 0.76 °C (±1σ),<br />
whereas the component of the error due to the uncertainty of the MAP<br />
estimate is 3.2–3.9 °C, thus a more precise estimate for MAP would<br />
increase the precision of Eq. (70) considerably. One additional<br />
consideration is that if a fixed EEMT is assumed, then MAT <strong>and</strong> MAP<br />
are inversely related. However, the MAP <strong>and</strong> MAT data compiled by<br />
Sheldon et al. (2002) for 126 modern soils had an R 2 =0.54, which<br />
though far from definitive, suggests at least some relationship between<br />
MAP <strong>and</strong> MAT, so the fixed EEMT assumption is not strictly correct. On<br />
the other h<strong>and</strong>, if one assumes that the MAT <strong>and</strong> MAP values reported<br />
by Sheldon (2006d) are correct, then applying Eq. (69) gives a mean<br />
EEMT values of 19,286 (±1σ of 4482) kJ m − 2 yr − 1 , which is<br />
substantially lower than the mean Alfisol EEMT value obtained by<br />
Rasmussen <strong>and</strong> Tabor (2007), but not beyond the range of error. The<br />
most likely explanation for this difference is that paleosols are all<br />
basalt-parented, whereas the equation was derived from soils with<br />
various igneous parent materials, though a secondary consideration<br />
may be the elevation variations among the soils analyzed by<br />
Rasmussen <strong>and</strong> Tabor (2007) whereas the Miocene paleosols all<br />
formed in the same relatively low elevation setting.<br />
Thus, the QPEM model offers a lot of promise for applications<br />
ranging from taxonomy to <strong>paleoclimatic</strong> <strong>reconstruction</strong>. However,<br />
care is needed in applying it thoughtfully to paleosols given different<br />
potential sources of uncertainty. Further development may also be<br />
needed for other types of parent materials, but we think that in the<br />
long-run, these potential issues will be possible to deal with <strong>and</strong> that a<br />
QPEM that integrates both MAP <strong>and</strong> MAT (which are not really<br />
independent of one another) will be a powerful tool for paleosols<br />
research.<br />
8.3. “Clumped isotope” paleothermometry<br />
A recent innovation in stable isotope geochemistry that is relevant<br />
for the study of paleosols is the analysis of doubly rather than<br />
singly substituted isotopologues (Eiler, 2007). The term isotopologue<br />
refers to each possible isotopic configuration for a given compound.<br />
For example, conventional gas-source δ 13 C analyses are measuring<br />
13 C 16 O 2 (z=45), which is one of 12 possible isotopologues for CO 2 .<br />
Traditional mass-spectrometer configuration allows for measurements<br />
of z=44, 45, or 46. Addition of a extra faraday cup makes the<br />
measurement of masses 47–49 possible, which in turn makes it<br />
possible to measure more isotopologues than were previously<br />
available. The abundance of the doubly substituted CO 2 isotopologue<br />
( 13 C 18 O 16 O) produced by phosphoric acid digestion of carbonate<br />
minerals is proportional to the concentration of 13 C\ 18 O bonds in the<br />
reacted carbonate; that concentration is a function of the formation<br />
temperature of the carbonate minerals (Ghosh et al., 2006a,b; Eiler,<br />
2007) <strong>and</strong> can be used as a paleothermometer (Ghosh et al., 2006a,b).<br />
13 C 18 O 16 O abundance in the evolved CO 2 is measured in “per mil”<br />
relative to the expected amount of all CO 2 isotopologues in a<br />
r<strong>and</strong>omized gas sample. The proportionality of the 13 C\ 18 O bonds is<br />
described as follows:<br />
Δ 47 = 0:0592 × 10 6 × T − 2 − 0:02 ð71Þ<br />
where Δ 47 isotopic enrichment relative to the r<strong>and</strong>omized gas sample<br />
<strong>and</strong> T is the temperature (K), <strong>and</strong> where the precision due to the<br />
analytical uncertainty is ~2 °C (Ghosh et al., 2006a,b). Unlike<br />
traditional oxygen isotope-based water-carbonate paleothermometers,<br />
there is no dependence in this relationship on either the<br />
δ 18 O of the water nor on the δ 13 C of the dissolved inorganic carbon<br />
from which the carbonate formed (Ghosh et al., 2006a,b), therefore<br />
obviating the need for any unconstrained assumptions of either air or<br />
soil water isotopic compositions. This method has been applied successfully<br />
to pedogenic carbonates (Ghosh et al., 2006b) as a means of<br />
calculating uplift rates in the Altiplano by putting the values derived<br />
from Eq. (8) into a lapse-rate model. A thorough review of the<br />
potential applications of “clumped-isotope” paleothermometry to<br />
paleoaltimetry may be found in Quade et al. (2007).<br />
Paleoaltimetry is just the tip of the proverbial iceberg in terms of<br />
the potential <strong>paleoclimatic</strong> <strong>and</strong> <strong>paleoenvironmental</strong> applications of<br />
this technique (e.g., Eiler, 2007) because there is no dependence on<br />
the initial δ 18 Oorδ 13 C values of the system (which hampers many<br />
existing proxies), only on the temperature at which the doubly<br />
substituted 13 C 18 O 16 O isotopologue was formed. However, to reach the<br />
full potential of the technique, there is at least one outst<strong>and</strong>ing issue<br />
that needs to be considered, namely the relationship between the soil<br />
temperature <strong>and</strong> the air temperature. It is not clear that these two<br />
values are necessarily the same because the soil temperature can<br />
easily exceed the air temperature in areas either with very warm<br />
temperatures (or warm seasons of the year) or where the albedo of<br />
the ground surface is low. To illustrate this, consider the difference<br />
between digging up your garden early in the spring or at the height of<br />
summer. In early spring (e.g., April in the Northern Hemisphere), the<br />
soil temperature essentially matches the air temperature, whereas in<br />
summer (e.g., August in the Northern Hemisphere) the soil temperature<br />
may be many degrees warmer than air above it. Given that<br />
pedogenic carbonates form only during certain warm times of the year<br />
(Breecker et al., 2009), un-corrected isotopologue paleotemperatures<br />
are potentially biased towards recording summer temperatures<br />
rather than mean annual temperatures. Nonetheless, the problem is<br />
likely tractable with further consideration of the timing of pedogenic<br />
carbonate formation <strong>and</strong> of the relationship between soil <strong>and</strong> air<br />
temperatures.<br />
Please cite this article as: Sheldon, N.D., Tabor, N.J., <strong>Quantitative</strong> <strong>paleoenvironmental</strong> <strong>and</strong> <strong>paleoclimatic</strong> <strong>reconstruction</strong> using paleosols, Earth-<br />
Science Reviews (2009), doi:10.1016/j.earscirev.2009.03.004