Quantitative paleoenvironmental and paleoclimatic reconstruction ...
Quantitative paleoenvironmental and paleoclimatic reconstruction ...
Quantitative paleoenvironmental and paleoclimatic reconstruction ...

Create successful ePaper yourself
Turn your PDF publications into a flip-book with our unique Google optimized e-Paper software.
ARTICLE IN PRESS<br />
40 N.D. Sheldon, N.J. Tabor / Earth-Science Reviews xxx (2009) xxx–xxx<br />
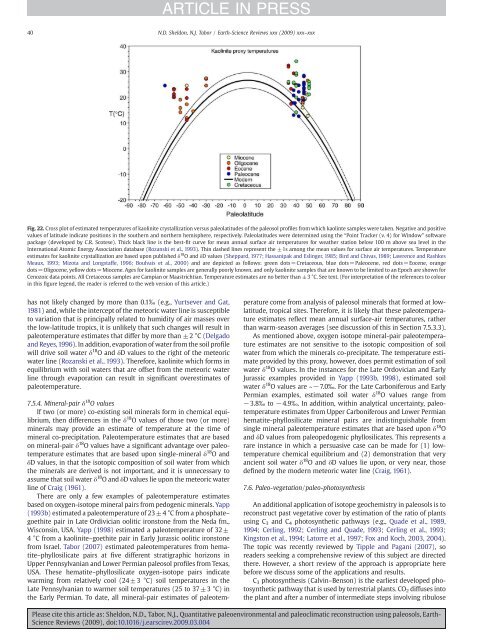
Fig. 22. Cross plot of estimated temperatures of kaolinite crystallization versus paleolatitudes of the paleosol profiles from which kaolinte samples were taken. Negative <strong>and</strong> positive<br />
values of latitude indicate positions in the southern <strong>and</strong> northern hemisphere, respectively. Paleolatitudes were determined using the “Point Tracker (v. 4) for Window” software<br />
package (developed by C.R. Scotese). Thick black line is the best-fit curve for mean annual surface air temperatures for weather station below 100 m above sea level in the<br />
International Atomic Energy Association database (Rozanski et al., 1993). Thin dashed lines represent the ±1s among the mean values for surface air temperatures. Temperature<br />
estimates for kaolinite crystallization are based upon published δ 18 O <strong>and</strong> δD values (Sheppard, 1977; Hassanipak <strong>and</strong> Eslinger, 1985; Bird <strong>and</strong> Chivas, 1989; Lawrence <strong>and</strong> Rashkes<br />
Meaux, 1993; Mizota <strong>and</strong> Longstaffe, 1996; Boulvais et al., 2000) <strong>and</strong> are depicted as follows: green dots=Cretaceous, blue dots=Paleocene, red dots=Eocene, orange<br />
dots=Oligocene, yellow dots=Miocene. Ages for kaolinite samples are generally poorly known, <strong>and</strong> only kaolinite samples that are known to be limited to an Epoch are shown for<br />
Cenozoic data points. All Cretaceous samples are Campian or Maastrichtian. Temperature estimates are no better than ±3 °C. See text. (For interpretation of the references to colour<br />
in this figure legend, the reader is referred to the web version of this article.)<br />
has not likely changed by more than 0.1‰ (e.g., Yurtsever <strong>and</strong> Gat,<br />
1981) <strong>and</strong>, while the intercept of the meteoric water line is susceptible<br />
to variation that is principally related to humidity of air masses over<br />
the low-latitude tropics, it is unlikely that such changes will result in<br />
paleotemperature estimates that differ by more than ±2 °C (Delgado<br />
<strong>and</strong> Reyes,1996). In addition, evaporation of water from the soil profile<br />
will drive soil water δ 18 O <strong>and</strong> δD values to the right of the meteoric<br />
water line (Rozanski et al., 1993). Therefore, kaolinite which forms in<br />
equilibrium with soil waters that are offset from the meteoric water<br />
line through evaporation can result in significant overestimates of<br />
paleotemperature.<br />
7.5.4. Mineral-pair δ 18 O values<br />
If two (or more) co-existing soil minerals form in chemical equilibrium,<br />
then differences in the δ 18 O values of those two (or more)<br />
minerals may provide an estimate of temperature at the time of<br />
mineral co-precipitation. Paleotemperature estimates that are based<br />
on mineral-pair δ 18 O values have a significant advantage over paleotemperature<br />
estimates that are based upon single-mineral δ 18 O <strong>and</strong><br />
δD values, in that the isotopic composition of soil water from which<br />
the minerals are derived is not important, <strong>and</strong> it is unnecessary to<br />
assume that soil water δ 18 O <strong>and</strong> δD values lie upon the meteoric water<br />
line of Craig (1961).<br />
There are only a few examples of paleotemperature estimates<br />
based on oxygen-isotope mineral pairs from pedogenic minerals. Yapp<br />
(1993b) estimated a paleotemperature of 23±4 °C from a phosphate–<br />
goethite pair in Late Ordivician oolitic ironstone from the Neda fm.,<br />
Wisconsin, USA. Yapp (1998) estimated a paleotemperature of 32±<br />
4 °C from a kaolinite–goethite pair in Early Jurassic oolitic ironstone<br />
from Israel. Tabor (2007) estimated paleotemperatures from hematite–phyllosilicate<br />
pairs at five different stratigraphic horizons in<br />
Upper Pennsylvanian <strong>and</strong> Lower Permian paleosol profiles from Texas,<br />
USA. These hematite–phyllosilicate oxygen-isotope pairs indicate<br />
warming from relatively cool (24±3 °C) soil temperatures in the<br />
Late Pennsylvanian to warmer soil temperatures (25 to 37±3 °C) in<br />
the Early Permian. To date, all mineral-pair estimates of paleotemperature<br />
come from analysis of paleosol minerals that formed at lowlatitude,<br />
tropical sites. Therefore, it is likely that these paleotemperature<br />
estimates reflect mean annual surface-air temperatures, rather<br />
than warm-season averages (see discussion of this in Section 7.5.3.3).<br />
As mentioned above, oxygen isotope mineral-pair paleotemperature<br />
estimates are not sensitive to the isotopic composition of soil<br />
water from which the minerals co-precipitate. The temperature estimate<br />
provided by this proxy, however, does permit estimation of soil<br />
water δ 18 O values. In the instances for the Late Ordovician <strong>and</strong> Early<br />
Jurassic examples provided in Yapp (1993b, 1998), estimated soil<br />
water δ 18 O values are ~−7.0‰. For the Late Carboniferous <strong>and</strong> Early<br />
Permian examples, estimated soil water δ 18 O values range from<br />
−3.8‰ to −4.9‰. In addition, within analytical uncertainty, paleotemperature<br />
estimates from Upper Carboniferous <strong>and</strong> Lower Permian<br />
hematite-phyllosilicate mineral pairs are indistinguishable from<br />
single mineral paleotemperature estimates that are based upon δ 18 O<br />
<strong>and</strong> δD values from paleopedogenic phyllosilicates. This represents a<br />
rare instance in which a persuasive case can be made for (1) lowtemperature<br />
chemical equilibrium <strong>and</strong> (2) demonstration that very<br />
ancient soil water δ 18 O <strong>and</strong> δD values lie upon, or very near, those<br />
defined by the modern meteoric water line (Craig, 1961).<br />
7.6. Paleo-vegetation/paleo-photosynthesis<br />
An additional application of isotope geochemistry in paleosols is to<br />
reconstruct past vegetative cover by estimation of the ratio of plants<br />
using C 3 <strong>and</strong> C 4 photosynthetic pathways (e.g., Quade et al., 1989,<br />
1994; Cerling, 1992; Cerling <strong>and</strong> Quade, 1993; Cerling et al., 1993;<br />
Kingston et al., 1994; Latorre et al., 1997; Fox <strong>and</strong> Koch, 2003, 2004).<br />
The topic was recently reviewed by Tipple <strong>and</strong> Pagani (2007), so<br />
readers seeking a comprehensive review of this subject are directed<br />
there. However, a short review of the approach is appropriate here<br />
before we discuss some of the applications <strong>and</strong> results.<br />
C 3 photosynthesis (Calvin–Benson) is the earliest developed photosynthetic<br />
pathway that is used by terrestrial plants. CO 2 diffuses into<br />
the plant <strong>and</strong> after a number of intermediate steps involving ribulose<br />
Please cite this article as: Sheldon, N.D., Tabor, N.J., <strong>Quantitative</strong> <strong>paleoenvironmental</strong> <strong>and</strong> <strong>paleoclimatic</strong> <strong>reconstruction</strong> using paleosols, Earth-<br />
Science Reviews (2009), doi:10.1016/j.earscirev.2009.03.004