Quantitative paleoenvironmental and paleoclimatic reconstruction ...
Quantitative paleoenvironmental and paleoclimatic reconstruction ...
Quantitative paleoenvironmental and paleoclimatic reconstruction ...

Create successful ePaper yourself
Turn your PDF publications into a flip-book with our unique Google optimized e-Paper software.
EARTH-01563; No of Pages 52<br />
ARTICLE IN PRESS<br />
Earth-Science Reviews xxx (2009) xxx–xxx<br />
Contents lists available at ScienceDirect<br />
Earth-Science Reviews<br />
journal homepage: www.elsevier.com/locate/earscirev<br />
<strong>Quantitative</strong> <strong>paleoenvironmental</strong> <strong>and</strong> <strong>paleoclimatic</strong> <strong>reconstruction</strong> using paleosols<br />
Nathan D. Sheldon a, ⁎, Neil J. Tabor b<br />
a Department of Geological Sciences, University of Michigan, 2534 CC Little, 1100 N. University Ave., Ann Arbor, MI 48109, USA<br />
b Department of Earth Sciences, Southern Methodist University, P.O. Box 750395, Dallas, TX 75275, USA<br />
article<br />
info<br />
abstract<br />
Article history:<br />
Received 8 April 2008<br />
Accepted 15 March 2009<br />
Available online xxxx<br />
Keywords:<br />
paleosols<br />
paleoclimate<br />
paleoenvironments<br />
isotopes<br />
geochemistry<br />
pedogenesis<br />
Paleosols (fossil soils) are preserved throughout the geologic record in depositional settings ranging from<br />
alluvial systems to between basalt flows. Until recently, paleosols were studied using primarily qualitative<br />
methods. In recent years, paleopedology has shifted from a largely qualitative field based on comparisons<br />
with modern analogues to an increasingly quantitative endeavor. Some of this change has been a result of<br />
applying existing techniques to new materials, but many of the innovations have been the result of applying<br />
new techniques to new materials, including thermodynamic modeling of soil formation, isotope<br />
geochemistry, <strong>and</strong> applications of empirical relationships derived from modern soils. A variety of semiquantitative<br />
<strong>and</strong> quantitative tools has been developed to examine past weathering <strong>and</strong> pedogenesis, <strong>and</strong> to<br />
reconstruct both <strong>paleoenvironmental</strong> <strong>and</strong> <strong>paleoclimatic</strong> conditions at the time that the paleosols formed.<br />
Though it is often not possible to achieve the same temporal resolution as with marine records for<br />
<strong>paleoclimatic</strong> <strong>reconstruction</strong>s, proxies based on paleosols are potentially a much more direct means of<br />
making <strong>paleoclimatic</strong> <strong>reconstruction</strong>s because soils form at the Earth's surface, in direct contact with the<br />
atmospheric <strong>and</strong> climatic conditions at the time of their formation. Paleoclimatic <strong>and</strong> environmental<br />
properties that may be reconstructed using the new proxies include provenance, weathering intensity, mean<br />
annual precipitation <strong>and</strong> temperature during pedogenesis, nutrient fluxes into <strong>and</strong> out of the paleosols, the<br />
atmospheric composition of important gases including CO 2 <strong>and</strong> O 2 , the moisture balance during pedogenesis,<br />
the soil gas composition, reconstructed vegetative covering, <strong>and</strong> paleo-altitude.<br />
© 2009 Elsevier B.V. All rights reserved.<br />
Contents<br />
1. Introduction . . . . . . . . . . . . . . . . . . . . . . . . . . . . . . . . . . . . . . . . . . . . . . . . . . . . . . . . . . . . . . . 0<br />
2. Qualitative methods . . . . . . . . . . . . . . . . . . . . . . . . . . . . . . . . . . . . . . . . . . . . . . . . . . . . . . . . . . . 0<br />
2.1. Taxonomic <strong>and</strong> stratigraphic approaches . . . . . . . . . . . . . . . . . . . . . . . . . . . . . . . . . . . . . . . . . . . . . . 0<br />
2.2. Semi-quantitative methods . . . . . . . . . . . . . . . . . . . . . . . . . . . . . . . . . . . . . . . . . . . . . . . . . . . . 0<br />
2.2.1. Compaction. . . . . . . . . . . . . . . . . . . . . . . . . . . . . . . . . . . . . . . . . . . . . . . . . . . . . . . . 0<br />
2.2.2. Ichnology . . . . . . . . . . . . . . . . . . . . . . . . . . . . . . . . . . . . . . . . . . . . . . . . . . . . . . . . 0<br />
3. <strong>Quantitative</strong> methods overview . . . . . . . . . . . . . . . . . . . . . . . . . . . . . . . . . . . . . . . . . . . . . . . . . . . . . . 0<br />
4. Clay mineralogy of soils <strong>and</strong> paleosols . . . . . . . . . . . . . . . . . . . . . . . . . . . . . . . . . . . . . . . . . . . . . . . . . . . 0<br />
4.1. Occurrence of clay minerals . . . . . . . . . . . . . . . . . . . . . . . . . . . . . . . . . . . . . . . . . . . . . . . . . . . . 0<br />
5. Whole rock geochemistry. . . . . . . . . . . . . . . . . . . . . . . . . . . . . . . . . . . . . . . . . . . . . . . . . . . . . . . . . 0<br />
5.1. Analytical methods . . . . . . . . . . . . . . . . . . . . . . . . . . . . . . . . . . . . . . . . . . . . . . . . . . . . . . . . 0<br />
5.2. Provenance <strong>and</strong> pedogenesis . . . . . . . . . . . . . . . . . . . . . . . . . . . . . . . . . . . . . . . . . . . . . . . . . . . . 0<br />
5.2.1. Major element ratios <strong>and</strong> pedogenic processes . . . . . . . . . . . . . . . . . . . . . . . . . . . . . . . . . . . . . . . 0<br />
5.2.2. Major element weathering indices . . . . . . . . . . . . . . . . . . . . . . . . . . . . . . . . . . . . . . . . . . . . . 0<br />
5.2.3. Trace element ratios . . . . . . . . . . . . . . . . . . . . . . . . . . . . . . . . . . . . . . . . . . . . . . . . . . . 0<br />
5.2.4. Rare earth elements. . . . . . . . . . . . . . . . . . . . . . . . . . . . . . . . . . . . . . . . . . . . . . . . . . . . 0<br />
5.3. Mass-balance calculations . . . . . . . . . . . . . . . . . . . . . . . . . . . . . . . . . . . . . . . . . . . . . . . . . . . . . 0<br />
5.3.1. Pedogenesis <strong>and</strong> diagenesis . . . . . . . . . . . . . . . . . . . . . . . . . . . . . . . . . . . . . . . . . . . . . . . . 0<br />
5.3.2. Precambrian atmospheric CO 2 from mass balance. . . . . . . . . . . . . . . . . . . . . . . . . . . . . . . . . . . . . . 0<br />
5.4. Paleotemperature . . . . . . . . . . . . . . . . . . . . . . . . . . . . . . . . . . . . . . . . . . . . . . . . . . . . . . . . . 0<br />
⁎ Corresponding author. Tel.: +1 734 647 7569.<br />
E-mail address: nsheldon@umich.edu (N.D. Sheldon).<br />
0012-8252/$ – see front matter © 2009 Elsevier B.V. All rights reserved.<br />
doi:10.1016/j.earscirev.2009.03.004<br />
Please cite this article as: Sheldon, N.D., Tabor, N.J., <strong>Quantitative</strong> <strong>paleoenvironmental</strong> <strong>and</strong> <strong>paleoclimatic</strong> <strong>reconstruction</strong> using paleosols, Earth-<br />
Science Reviews (2009), doi:10.1016/j.earscirev.2009.03.004
ARTICLE IN PRESS<br />
2 N.D. Sheldon, N.J. Tabor / Earth-Science Reviews xxx (2009) xxx–xxx<br />
5.5. Paleoprecipitation . . . . . . . . . . . . . . . . . . . . . . . . . . . . . . . . . . . . . . . . . . . . . . . . . . . . . . . . . 0<br />
5.5.1. Content of Fe–Mn nodules in vertisols . . . . . . . . . . . . . . . . . . . . . . . . . . . . . . . . . . . . . . . . . . . 0<br />
5.5.2. Depth to Bk horizon . . . . . . . . . . . . . . . . . . . . . . . . . . . . . . . . . . . . . . . . . . . . . . . . . . . . 0<br />
5.5.3. Bw/Bt horizon geochemistry . . . . . . . . . . . . . . . . . . . . . . . . . . . . . . . . . . . . . . . . . . . . . . . . 0<br />
5.6. Long-term chemical weathering . . . . . . . . . . . . . . . . . . . . . . . . . . . . . . . . . . . . . . . . . . . . . . . . . . 0<br />
6. Thermodynamic approaches. . . . . . . . . . . . . . . . . . . . . . . . . . . . . . . . . . . . . . . . . . . . . . . . . . . . . . . . 0<br />
6.1. Simple versus complex systems . . . . . . . . . . . . . . . . . . . . . . . . . . . . . . . . . . . . . . . . . . . . . . . . . . . 0<br />
6.2. Single-equation approaches . . . . . . . . . . . . . . . . . . . . . . . . . . . . . . . . . . . . . . . . . . . . . . . . . . . . 0<br />
6.2.1. Precambrian atmospheric CO 2 . . . . . . . . . . . . . . . . . . . . . . . . . . . . . . . . . . . . . . . . . . . . . . . 0<br />
6.2.2. Earliest Triassic soil formation . . . . . . . . . . . . . . . . . . . . . . . . . . . . . . . . . . . . . . . . . . . . . . . 0<br />
6.3. Multiple-equation approaches . . . . . . . . . . . . . . . . . . . . . . . . . . . . . . . . . . . . . . . . . . . . . . . . . . . 0<br />
7. Stable isotope approaches . . . . . . . . . . . . . . . . . . . . . . . . . . . . . . . . . . . . . . . . . . . . . . . . . . . . . . . . . 0<br />
7.1. Stableisotopiccompositionofpedogenicmineralsas<strong>paleoenvironmental</strong>proxies. . . . . . . . . . . . . . . . . . . . . . . . . . . . . . 0<br />
7.1.1. Mineral-water isotope fractionation <strong>and</strong> the jargon of stable isotope geochemistry . . . . . . . . . . . . . . . . . . . . . . . 0<br />
7.1.2. Stable isotope fractionation factors of common pedogenic minerals . . . . . . . . . . . . . . . . . . . . . . . . . . . . . . 0<br />
7.1.3. Relationship between hydrogen <strong>and</strong> oxygen isotopes in continental waters . . . . . . . . . . . . . . . . . . . . . . . . . . 0<br />
7.2. Carbon in soils. . . . . . . . . . . . . . . . . . . . . . . . . . . . . . . . . . . . . . . . . . . . . . . . . . . . . . . . . . . 0<br />
7.2.1. One-component soil CO 2 . . . . . . . . . . . . . . . . . . . . . . . . . . . . . . . . . . . . . . . . . . . . . . . . . . 0<br />
7.2.2. Two-component soil CO 2 . . . . . . . . . . . . . . . . . . . . . . . . . . . . . . . . . . . . . . . . . . . . . . . . . . 0<br />
7.2.3. Three-component soil CO 2 . . . . . . . . . . . . . . . . . . . . . . . . . . . . . . . . . . . . . . . . . . . . . . . . . 0<br />
7.3. Soil <strong>and</strong> paleosol carbonate. . . . . . . . . . . . . . . . . . . . . . . . . . . . . . . . . . . . . . . . . . . . . . . . . . . . . 0<br />
7.3.1. Pedogenic calcite δ 18 O values . . . . . . . . . . . . . . . . . . . . . . . . . . . . . . . . . . . . . . . . . . . . . . . . 0<br />
7.3.2. Pedogenic siderite as a proxy for soil moisture δ 18 O values . . . . . . . . . . . . . . . . . . . . . . . . . . . . . . . . . . 0<br />
7.4. δ 13 C values of soil carbonate . . . . . . . . . . . . . . . . . . . . . . . . . . . . . . . . . . . . . . . . . . . . . . . . . . . . 0<br />
7.4.1. Calcite from one-component of soil CO 2 . . . . . . . . . . . . . . . . . . . . . . . . . . . . . . . . . . . . . . . . . . . 0<br />
7.4.2. δ 13 C of pedogenic siderite . . . . . . . . . . . . . . . . . . . . . . . . . . . . . . . . . . . . . . . . . . . . . . . . . 0<br />
7.4.3. Calcite derived from 2-component soil CO 2 mixing . . . . . . . . . . . . . . . . . . . . . . . . . . . . . . . . . . . . . 0<br />
7.4.4. Soil carbonates formed by mixing of three-components of soil CO 2 . . . . . . . . . . . . . . . . . . . . . . . . . . . . . . 0<br />
7.5. δ 18 O <strong>and</strong> δD of hydroxylated minerals . . . . . . . . . . . . . . . . . . . . . . . . . . . . . . . . . . . . . . . . . . . . . . . . 0<br />
7.5.1. Origin of residual deposits . . . . . . . . . . . . . . . . . . . . . . . . . . . . . . . . . . . . . . . . . . . . . . . . . 0<br />
7.5.2. Variations in soil moisture δ 18 O <strong>and</strong> δD values. . . . . . . . . . . . . . . . . . . . . . . . . . . . . . . . . . . . . . . . 0<br />
7.5.3. Single-mineral paleotemperature estimates . . . . . . . . . . . . . . . . . . . . . . . . . . . . . . . . . . . . . . . . . 0<br />
7.5.4. Mineral-pair δ 18 O values . . . . . . . . . . . . . . . . . . . . . . . . . . . . . . . . . . . . . . . . . . . . . . . . . . 0<br />
7.6. Paleo-vegetation/paleo-photosynthesis . . . . . . . . . . . . . . . . . . . . . . . . . . . . . . . . . . . . . . . . . . . . . . . 0<br />
8. Future approaches <strong>and</strong> challenges . . . . . . . . . . . . . . . . . . . . . . . . . . . . . . . . . . . . . . . . . . . . . . . . . . . . . 0<br />
8.1. Boron isotopes . . . . . . . . . . . . . . . . . . . . . . . . . . . . . . . . . . . . . . . . . . . . . . . . . . . . . . . . . . . 0<br />
8.2. Energy balance models. . . . . . . . . . . . . . . . . . . . . . . . . . . . . . . . . . . . . . . . . . . . . . . . . . . . . . . 0<br />
8.3. “Clumped isotope” paleothermometry. . . . . . . . . . . . . . . . . . . . . . . . . . . . . . . . . . . . . . . . . . . . . . . . 0<br />
9. Summary . . . . . . . . . . . . . . . . . . . . . . . . . . . . . . . . . . . . . . . . . . . . . . . . . . . . . . . . . . . . . . . . 0<br />
Acknowledgements . . . . . . . . . . . . . . . . . . . . . . . . . . . . . . . . . . . . . . . . . . . . . . . . . . . . . . . . . . . . . . 0<br />
References . . . . . . . . . . . . . . . . . . . . . . . . . . . . . . . . . . . . . . . . . . . . . . . . . . . . . . . . . . . . . . . . . . 0<br />
1. Introduction<br />
Increasing recognition of paleosols (fossil soils; Fig. 1) in nonmarine<br />
strata has opened up new types of <strong>paleoenvironmental</strong> <strong>and</strong><br />
<strong>paleoclimatic</strong> <strong>reconstruction</strong>s. While good quantitative <strong>paleoclimatic</strong><br />
data may be obtained from plant fossil assemblages using either<br />
nearest living relative (e.g., Leopold <strong>and</strong> Clay-Poole, 2001; Utescher<br />
<strong>and</strong> Mosbrugger, 2007) or leaf morphometric approaches (e.g., Wolfe,<br />
1994; Uhl et al., 2007), those approaches yield snap shots of past<br />
environments <strong>and</strong> are relatively rare in the fossil record. Paleosols<br />
preserved in continental basins on the other h<strong>and</strong>, raise the possibility<br />
of long-term, fairly continuous <strong>paleoclimatic</strong> records, potentially with<br />
a temporal resolution that equals that of marine proxy records (e.g.,<br />
Retallack et al., 2004b; Sheldon <strong>and</strong> Retallack, 2004; Retallack, 2007).<br />
The last point is crucial because unlike most marine proxies, which are<br />
fundamentally indirect climatic records, paleosols formed at the<br />
Earth's surface, in direct contact with climatic <strong>and</strong> environmental<br />
conditions that prevailed at the time of their formation. Potentially<br />
then, paleosol-based proxies could be among the most powerful tools<br />
for reconstructing past environments. Until recently, paleopedology<br />
(the study of paleosols) was largely a qualitative science that relied on<br />
the recognition of features similar to modern soils that allowed for a<br />
“nearest living relative” comparison. That is, a paleosol was identified<br />
as indicating an ancient grassl<strong>and</strong> if it had features similar to a modern<br />
grassl<strong>and</strong> (Fig. 2). This approach still underlies most paleopedology,<br />
but has some fundamental limitations, namely the need for taxonomic<br />
uniformitarianism. Continuing on with the grassl<strong>and</strong> example, the<br />
origin of grasses is most likely in the Cenozoic (e.g., Strömberg, 2002).<br />
However, paleosol-based estimates for the origin of grassl<strong>and</strong>s as<br />
evidenced by Mollisol-like paleosols range from Eocene to Miocene<br />
(Retallack, 1997a,b, 2001a,b) depending on the strictness of one's<br />
taxonomy. Furthermore, others (Terry, 2001) have described Oligocene-age<br />
paleosols as “Mollisols” without meaning to connote that a<br />
grassl<strong>and</strong> ecosystem was present. On the other h<strong>and</strong>, there are some<br />
types of paleosols found in the Earth's past for which there are<br />
imperfect analogues (e.g., Retallack, 1997c; Sheldon, 2005), or for<br />
which there is no appropriate modern analogue owing to different<br />
environmental <strong>and</strong> ecological conditions in Earth's past. For example,<br />
weathering at the Earth's surface was occurring in the Precambrian<br />
(e.g., Driese, 2004; Sheldon, 2006b), but under the influence of<br />
microbial enhancement only in the absence of higher plants.<br />
The emergence of new quantitative techniques for reconstructing<br />
various <strong>paleoenvironmental</strong> <strong>and</strong> <strong>paleoclimatic</strong> conditions using<br />
whole rock <strong>and</strong> isotopic geochemistry has fundamentally changed<br />
the field of paleopedology. Proxies for variables ranging from levissage<br />
to mean annual precipitation to the composition of the paleoatmosphere<br />
at the time of the paleosols' formation have now been<br />
developed. Some of the approaches that we describe in this review<br />
have been widely applied, others have not but could have wider<br />
applicability. We also attempt to “gaze into the crystal ball” to evaluate<br />
Please cite this article as: Sheldon, N.D., Tabor, N.J., <strong>Quantitative</strong> <strong>paleoenvironmental</strong> <strong>and</strong> <strong>paleoclimatic</strong> <strong>reconstruction</strong> using paleosols, Earth-<br />
Science Reviews (2009), doi:10.1016/j.earscirev.2009.03.004
ARTICLE IN PRESS<br />
N.D. Sheldon, N.J. Tabor / Earth-Science Reviews xxx (2009) xxx–xxx<br />
3<br />
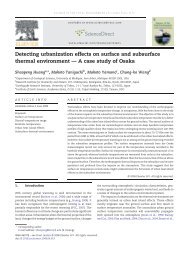
Fig. 1. Photos of representative paleosols. A) Painted Hills Unit, Eocene, Oregon. Dominated by Alfisol-like paleosols. B) Mascall Formation overlook, Miocene, Oregon. Near-mollic<br />
Inceptisol-like paleosols. C) Classic “red beds” from the Permian Cala del Vino Formation, Sardinia. D) Close-up of root mat carbonate rhizoliths, Renova Group, Montana.<br />
some future directions <strong>and</strong> some ways in which existing proxies may<br />
be extended. In general, no single proxy for weathering processes or<br />
past environmental conditions, or single type of quantitative data is<br />
without limitations. Therefore, a multi-proxy approach is key both to<br />
giving the investigator the widest possible range of information, but<br />
also to ensure reproducibility of her/his results. Thus, the approach<br />
Fig. 2. Comparison between modern soil <strong>and</strong> paleosol equivalent. A) Modern xeric Mollisol, southwestern Montana; B) late Miocene xeric Mollisol, central Oregon.<br />
Please cite this article as: Sheldon, N.D., Tabor, N.J., <strong>Quantitative</strong> <strong>paleoenvironmental</strong> <strong>and</strong> <strong>paleoclimatic</strong> <strong>reconstruction</strong> using paleosols, Earth-<br />
Science Reviews (2009), doi:10.1016/j.earscirev.2009.03.004
ARTICLE IN PRESS<br />
4 N.D. Sheldon, N.J. Tabor / Earth-Science Reviews xxx (2009) xxx–xxx<br />
Fig. 3. Comparing taxonomic schemes. A) Paleosol-specific classification scheme; B) equivalent taxonomic units, modern soil Orders are from Soil Survey Staff (2006). Part A is<br />
modified after Mack et al. (1993).<br />
that has emerged, <strong>and</strong> that we endorse here, is to try to quantify past<br />
pedogenic processes <strong>and</strong> the environmental conditions present at the<br />
time that the soils formed, with taxonomy <strong>and</strong> “nearest living relative”<br />
analogues of paleosols serving as an important additional tool rather<br />
than as the focal direction.<br />
2. Qualitative methods<br />
2.1. Taxonomic <strong>and</strong> stratigraphic approaches<br />
There is a long history of using qualitative methods to describe<br />
paleosols <strong>and</strong> to characterize the <strong>paleoclimatic</strong> <strong>and</strong> <strong>paleoenvironmental</strong><br />
conditions in which the paleosols formed. These qualitative<br />
methods include both taxonomic <strong>and</strong> stratigraphic approaches, <strong>and</strong><br />
still form an important template of basic information onto which the<br />
newer quantitative methods are applied. While it is beyond the scope<br />
of this review to look at those approaches in any exhaustive fashion,<br />
interested readers are directed to earlier review papers by Retallack<br />
(1991) <strong>and</strong> Kraus (1999) that detail many of the commonly applied<br />
approaches to paleosol taxonomy whether using modern analogues<br />
(Retallack <strong>and</strong> Germán-Heins, 1994), modern taxonomy (pedotype<br />
approach; e.g., Retallack, 1994), or paleosol-specific taxonomy (e.g.,<br />
Mack et al., 1993). The fundamental difference is that the paleosolspecific<br />
taxonomy is a hierarchical system that relies primarily on<br />
observable features in the paleosols (Fig. 3; Table 1), whereas the<br />
modern analogue <strong>and</strong> modern soil taxonomic approaches attempt to<br />
identify a larger number of characteristics <strong>and</strong> may require the<br />
investigator to ab<strong>and</strong>on their sensu stricto usage because some key<br />
modern taxonomic features (e.g., cation exchange capacity) are not<br />
preserved by paleosols. Fig. 3 also includes a list of taxonomic<br />
equivalents between the modern soil <strong>and</strong> paleosol-specific taxonomic<br />
schemes.<br />
Stratigraphic approaches to the study of paleosols include<br />
applications of sequence stratigraphy <strong>and</strong> of the pedofacies concept<br />
(e.g., Kraus, 1999). Sequence stratigraphy is a conceptual framework<br />
for evaluating depositional systems in terms of the balance between<br />
accommodation space for deposition <strong>and</strong> basin filling processes. It<br />
assumes cyclical deposition due either to fluctuating climatic conditions<br />
or sea level cyclicity. Sequence stratigraphy has been fairly<br />
widely applied in continental, paleosol-bearing sections on both deeptime<br />
geologic (various, e.g., McCarthy <strong>and</strong> Plint, 2003; Atchley et al.,<br />
2004; Clevel<strong>and</strong> et al., 2007; Ruskin <strong>and</strong> Jordan, 2007; Mack et al., in<br />
revision) <strong>and</strong> Quaternary (Kemp et al., 2006) time scales. The<br />
pedofacies concept advocated by Kraus <strong>and</strong> others (Bown <strong>and</strong><br />
Table 1<br />
Paleosol taxonomic modifiers (Mack et al., 1993).<br />
Modifier Feature<br />
Albic<br />
Presence of an eluvial (E) horizon [Fe <strong>and</strong> Al compounds accumulated]<br />
Allophanic Presence of allophone or other amorphous Si <strong>and</strong> Al compounds<br />
Argillic Presence of illuvial [downward transported] clay<br />
Calcic Presence of pedogenic carbonate<br />
Carbonaceous Presence of dark organic matter, but not coal<br />
Concretionary Presence of globules with concentric fabric<br />
Dystric Low base status as indicated by relative paucity of chemically unstable<br />
grains such as feldspars <strong>and</strong> volcanic rock fragments<br />
Eutric High base status as indicated by the abundance of chemically unstable<br />
grains such as feldspars <strong>and</strong> volcanic rock fragments<br />
Fragic Subsurface horizon that was hard at the time of soil formation (e.g.,<br />
root traces <strong>and</strong> burrows terminate or are diverted at this horizon; hard<br />
pan)<br />
Gleyed Evidence of periodic waterlogging such as drab hues, mottles of drab<br />
colors <strong>and</strong> yellow, red, or brown, presence of pedogenic pyrite or<br />
siderite<br />
Gypsic Presence of vadose gypsum or anhydrite<br />
Nodular Presence of globules with undifferentiated internal fabric; typically<br />
composed of carbonate, silica, or Fe-oxides<br />
Ochric Presence of a light-colored A horizon<br />
Salic<br />
Presence of pedogenic salts more soluble than gypsum (e.g., halite)<br />
Vertic Presence of decimeter-scale dessication cracks, wedge-shaped peds,<br />
hummock <strong>and</strong> swale structures (gilgai micro-relief), slickensides, or<br />
clastic dikes<br />
Vitric Presence of relict or actual volcanic glass shards or pumice<br />
Please cite this article as: Sheldon, N.D., Tabor, N.J., <strong>Quantitative</strong> <strong>paleoenvironmental</strong> <strong>and</strong> <strong>paleoclimatic</strong> <strong>reconstruction</strong> using paleosols, Earth-<br />
Science Reviews (2009), doi:10.1016/j.earscirev.2009.03.004
ARTICLE IN PRESS<br />
N.D. Sheldon, N.J. Tabor / Earth-Science Reviews xxx (2009) xxx–xxx<br />
5<br />
Kraus, 1987; Kraus, 1987; Kraus, 1997) is based on the idea that<br />
paleosol formation should be viewed in terms of the depositional<br />
processes <strong>and</strong> system that it formed in (as individual facies within the<br />
depositional system), rather than as an independent entity. Summing<br />
up their findings from the Eocene Willwood Formation briefly,<br />
paleosol maturity should increase with distance away from a fluvial<br />
channel, going from Entisol-like (Protosol) paleosols immediately<br />
adjacent to the channel to more well-developed paleosols on more<br />
distal areas of the floodplain (Bown <strong>and</strong> Kraus, 1987; Kraus <strong>and</strong> Aslan,<br />
1993; Kraus, 1997). Flood frequency (i.e., recurrence interval), flood<br />
intensity (e.g., proportion of the floodplain inundated), <strong>and</strong> rate of<br />
accommodation space creation (denudation/subsidence) are important<br />
controlling variables (Kraus, 1999). More recent applications of<br />
the pedofacies concept have found more complex maturity-floodplain<br />
position relationships (Hamer et al., 2007b), but the general concept<br />
appears widely applicable. Applications of sequence stratigraphy <strong>and</strong><br />
the pedofacies concept are particularly important in long-term<br />
<strong>paleoclimatic</strong> studies, because paleosol maturity has often been<br />
used to indicate climatic intensity (references in Retallack, 2001b;<br />
Retallack et al., 2000). While maturity <strong>and</strong> weathering intensity may<br />
indicate climatic conditions (Retallack <strong>and</strong> Germán-Heins, 1994), they<br />
could equally indicate long formation times <strong>and</strong> floodplain stability<br />
(Kraus, 1997). Cyclical changes to the depositional system are<br />
probably due to short-term climate fluctuations or to locally<br />
magnified effects based on global drivers such as Milankovitch<br />
cyclicity (e.g., Retallack et al., 2004b), <strong>and</strong> need to be taken into<br />
account when reconstructing past climatic <strong>and</strong> environmental<br />
conditions. The approach advocated by Buck <strong>and</strong> Mack (1995),<br />
Sheldon et al. (2002), Sheldon <strong>and</strong> Retallack (2004), <strong>and</strong> Sheldon<br />
(2006c) is to compare only paleosols of similar maturity <strong>and</strong> similar<br />
inferred physiographic setting (i.e., similar pedofacies) when reconstructing<br />
past climatic conditions. By confining proxy-based <strong>reconstruction</strong>s<br />
of paleo-precipitation <strong>and</strong> paleo-temperature to<br />
moderately to well-developed paleosols (Inceptisol-like to Alfisollike),<br />
those authors have reconstructed past climatic conditions that<br />
very closely match <strong>reconstruction</strong>s based on fossil floras (Sheldon<br />
et al., 2002; Sheldon <strong>and</strong> Retallack, 2004). Close consideration of data<br />
quality <strong>and</strong> recognition of alluvial stratigraphy often lead to fairly<br />
substantial differences in climatic histories (e.g., Terry, 2001 versus<br />
Retallack, 1983), so careful underst<strong>and</strong>ing of stratigraphic <strong>and</strong> facies<br />
relationships is critical.<br />
2.2. Semi-quantitative methods<br />
2.2.1. Compaction<br />
Sheldon <strong>and</strong> Retallack (2001) presented a straightforward method<br />
for evaluating the effects of compaction on paleosols <strong>and</strong> for<br />
decompacting soils to their original thickness at the time of their<br />
formation. That paper also reviewed previous attempts to make the<br />
same types of calculations from Retallack (1994) <strong>and</strong> Caudill et al.<br />
(1997), both of which mis-estimated compaction of shallowly buried<br />
paleosols, <strong>and</strong> demonstrated the issues associated with those previous<br />
methods. The decompaction method of Sheldon <strong>and</strong> Retallack (2001)<br />
can only be considered to be semi-quantitative because it relies on<br />
accurate taxonomic description of the paleosols in order to determine<br />
the correct constants to use in the generalized equation.<br />
Soils <strong>and</strong> their associated sediments are compactable because they<br />
include some porosity between the individual constituent grains. How<br />
compactable a given soil or sediment type will be is a function of their<br />
solidity (the fractional complement to porosity):<br />
S i = ρ d<br />
ρ s<br />
where ρ d is the dry bulk density of the soil <strong>and</strong> ρ s is the solid grain<br />
bulk density of the material that was weathered to form the soil. For<br />
ð1Þ<br />
most soils, ρ s will be 2.5–2.9 g cm 3 , where 2.7 g cm 3 is a reasonable<br />
value for clay-rich soils (Sheldon <strong>and</strong> Retallack, 2001; Table 2). The<br />
compaction of a given soil is given by:<br />
C = S i<br />
S b<br />
where S b is the burial solidity, which should exceed S i for a material<br />
that has been compacted, thus giving Cb1. For normally pressured<br />
sections, the generalized compaction equation of Sclater <strong>and</strong> Christie<br />
(1980) may be used as a starting point:<br />
F = F 0 e − kD<br />
where F is the fractional burial porosity, F 0 is the initial porosity, D is<br />
the burial depth expressed in km, <strong>and</strong> k is an empirically derived<br />
curve-fitting constant (for equation, see Sheldon <strong>and</strong> Retallack, 2001).<br />
Because porosity is the complement of solidity (i.e., F 0 =1− S i <strong>and</strong><br />
F=1−S b ), Eq. (2) can be combined with Eq. (3) <strong>and</strong> re-arranged to<br />
give compaction (C) as follows:<br />
C =<br />
−S i<br />
h i ð4Þ<br />
F 0<br />
e kD − 1<br />
Fig. 6 depicts compactibility differences among some common soil<br />
orders with burial depth using constants for S i , F 0 , <strong>and</strong> k from Table 2.<br />
The method has been widely applied both to long sequences of<br />
paleosols (e.g., Sheldon <strong>and</strong> Retallack, 2004; Clevel<strong>and</strong> et al., 2007)<br />
<strong>and</strong> to individual paleosols for <strong>paleoclimatic</strong> (e.g., Prochnow et al.,<br />
2006; Retallack, 2007) <strong>and</strong> paleoaltimetry (e.g., Takeuchi et al., 2007)<br />
applications. In general, this method gives results that closely match<br />
independent estimates of compaction, though the results depend in<br />
part on accurate taxonomic description of the paleosols because there<br />
is a wide range in the properties of analogous modern soils (Table 2).<br />
Table 2<br />
Paleosol decompaction constants.<br />
Substrate Density Range σ S i F 0 k<br />
Marine (Sclater <strong>and</strong> Christie, 1980)<br />
Shale 1.07 – – 0.37 0.63 0.51<br />
S<strong>and</strong> 1.35 – – 0.51 0.49 0.27<br />
Chalk 0.81 – – 0.30 0.70 0.71<br />
Shaley s<strong>and</strong> 1.18 – – 0.44 0.56 0.39<br />
Soil types<br />
Alfisol (n =46) 1.68 1.33–1.97 0.16 0.65 0.35 0.15<br />
Andisol (n =26) 0.79 0.44–1.50 0.27 0.30 0.70 0.71<br />
Aridisol (n =24) 1.60 1.39–1.76 0.09 0.62 0.38 0.17<br />
Entisol (n =3) 1.61 1.60–1.64 – 0.62 0.38 0.17<br />
Histosol (n =13) 0.07 0.04–0.10 0.02 0.06 0.94 2.09<br />
Inceptisol (n =41) 1.32 0.65–1.92 0.39 0.51 0.49 0.27<br />
Mollisol (n =50) 1.42 0.85–1.91 0.25 0.55 0.45 0.23<br />
Oxisol (n =31) 1.30 0.96–1.46 0.11 0.50 0.50 0.29<br />
Spodosol (n =20) 0.97 0.30–1.87 0.47 0.37 0.63 0.52<br />
Ultisol (n =38) 1.50 0.97–1.84 0.27 0.58 0.42 0.20<br />
Vertisol (n =380) 1.80 1.55–2.06 0.16 0.69 0.31 0.12<br />
Modern floodplain (Nadon <strong>and</strong> Issler, 1997)<br />
Inorganic silts <strong>and</strong> clays<br />
Mean (Liquid limit b50) a – – – 0.635 0.365 0.16<br />
Mean (Liquid limit N50) b – – – 0.511 0.489 0.27<br />
S<strong>and</strong>s<br />
Mean c – – – 0.692 0.308 0.12<br />
Note: Units of density <strong>and</strong> range are g cm − 3 . Units on k are ×10 − 5 cm − 1 . Original<br />
sources for the paleosol data contained in the table are given in Sheldon <strong>and</strong> Retallack<br />
(2001).<br />
a Silts (n=61) <strong>and</strong> clays (n=261); porosity ranges from 35.72% to 37.34%.<br />
b Silts (n=9) <strong>and</strong> clays (n=61); porosity ranges from 46.96% to 50.80%.<br />
c Clean (graded; n=20), clean (poorly graded; n=62), silty s<strong>and</strong>s (n=153), <strong>and</strong><br />
clayey s<strong>and</strong>s (n=88); porosity ranges from 30.10% to 31.59%.<br />
ð2Þ<br />
ð3Þ<br />
Please cite this article as: Sheldon, N.D., Tabor, N.J., <strong>Quantitative</strong> <strong>paleoenvironmental</strong> <strong>and</strong> <strong>paleoclimatic</strong> <strong>reconstruction</strong> using paleosols, Earth-<br />
Science Reviews (2009), doi:10.1016/j.earscirev.2009.03.004
ARTICLE IN PRESS<br />
6 N.D. Sheldon, N.J. Tabor / Earth-Science Reviews xxx (2009) xxx–xxx<br />
76% of original thickness given independent constraints on burial<br />
depth.<br />
The primary disadvantages to the approach of Sheldon <strong>and</strong><br />
Retallack (2001) are that it requires accurate soil taxonomy <strong>and</strong> that<br />
it requires a fairly accurate estimate of the burial overburden. Because<br />
the differences in compactibility among different soil orders can be<br />
fairly large (Fig. 4), accurate taxonomic identification is very<br />
important. Similarly, most of the compaction predicted by Eq. (4)<br />
occurs within burial depths of 4 km or less, with very little change<br />
among deeply buried paleosols. Thus, uncertainty in burial depth of<br />
even 500 m for shallowly buried paleosols would have a large effect on<br />
the calculated compaction.<br />
Fig. 4. Compactibility of different soil orders.<br />
To give one specific example, Retallack (1986) used ptygmatically<br />
folded clastic dikes in the ~2.2 Ga Hekpoort paleosol to estimate that it<br />
had been compacted to 67–73% of its original thickness. Sheldon <strong>and</strong><br />
Retallack (2001) used Eq. (4) <strong>and</strong> constants for a Vertisol (Retallack,<br />
1986; Driese et al., 2005) fromTable 2 to estimate compaction to 72–<br />
2.2.2. Ichnology<br />
A number of recent workers have begun integrating continental<br />
ichnology with studies of paleosols (e.g., Genise et al., 2004; Kirkl<strong>and</strong>,<br />
2006; Kraus <strong>and</strong> Hasiotis, 2006; Laza, 2006; Hamer et al., 2007a,b),<br />
<strong>and</strong> trace fossils have been key to underst<strong>and</strong>ing some early<br />
ecosystems (e.g., Feakes et al., 1989; Retallack <strong>and</strong> Feakes, 1987). A<br />
wide variety of animal <strong>and</strong> plant traces have been identified (e.g.,<br />
Hasiotis, 2004) that are useful in <strong>paleoenvironmental</strong> <strong>reconstruction</strong>s<br />
using paleosols. In particular, rhizolith or root trace density (Fig. 1D)<br />
<strong>and</strong> penetration depth have been used to underst<strong>and</strong> vegetation type<br />
<strong>and</strong> density (O'Geen <strong>and</strong> Busacca, 2001; Retallack, 2007) <strong>and</strong> to<br />
characterize the paleohydrological setting (Kraus <strong>and</strong> Hasiotis, 2006).<br />
In marine settings, a semi-quantitative ichnofabric index has been<br />
created (Droser <strong>and</strong> Bottjer, 1986) that looks at total bioturbation<br />
density. Attempts to apply this method to paleosols have been<br />
relatively rare <strong>and</strong> as Genise et al. (2004) point out, well-developed<br />
Fig. 5. Bioturbation index versus root size in paleosols. Data are from N.D. Sheldon <strong>and</strong> J.M.M. Hamer (unpublished). See text for discussion.<br />
Please cite this article as: Sheldon, N.D., Tabor, N.J., <strong>Quantitative</strong> <strong>paleoenvironmental</strong> <strong>and</strong> <strong>paleoclimatic</strong> <strong>reconstruction</strong> using paleosols, Earth-<br />
Science Reviews (2009), doi:10.1016/j.earscirev.2009.03.004
ARTICLE IN PRESS<br />
N.D. Sheldon, N.J. Tabor / Earth-Science Reviews xxx (2009) xxx–xxx<br />
7<br />
paleosols may be nearly devoid of bioturbation <strong>and</strong> poorly developed<br />
paleosols may be very heavily bioturbated, so the definitions<br />
appropriate to a marine setting do not necessarily apply to a<br />
continental setting. In part, this is due to fluctuating water tables<br />
<strong>and</strong> redox conditions in continental settings. Whereas hydrological<br />
<strong>and</strong> chemical conditions in a marine setting may be relatively uniform<br />
over long periods of time, they may fluctuate on very short time scales<br />
in continental settings (i.e., seasonally), which affects both the<br />
creation <strong>and</strong> preservation of ichnofabric. Furthermore, bioturbation<br />
in paleosols may be the result of either animals or plants, so care is<br />
needed to delineate both types. For example, while most animals in<br />
continental settings (exceptions are bivalves or gastropods) are<br />
unlikely to burrow down past the level of the water table, plant<br />
roots are very likely to extend to that depth beneath the surface. An<br />
example of an attempt to use ichnology semi-quantitatively rather<br />
than qualitatively may be found in Fig. 5 using previously unpublished<br />
data collected from Miocene paleosols in Montana formed on finegrained<br />
overbank flood deposits. Working independently, one half of<br />
the team (N.D. Sheldon <strong>and</strong> J.M.M. Hamer) measured various root<br />
trace parameters (mean diameter, maximum diameter, range of root<br />
diameter at a given stratigraphic level) <strong>and</strong> the other half of the team<br />
made semi-quantitative assessments of the degree of bioturbation<br />
made by animals throughout a 60 m section (Fig. 5). This approach<br />
yielded a couple of interesting results. The highest mean root<br />
diameters, maximum root diameter (<strong>and</strong> by extension maximum<br />
plant size), <strong>and</strong> maximum range of root diameters are associated with<br />
moderate degrees of bioturbation, suggesting that while some<br />
bioturbation helps plant communities to become established, heavy<br />
bioturbation may impede growth of high stature plants, instead<br />
favoring low stature or fast-growing plants. The data also skew toward<br />
mid-range root diameters in heavily bioturbated paleosols <strong>and</strong> only<br />
small roots (with a small size range) are found in weakly bioturbated<br />
paleosols (Fig. 5). While more work is needed to confirm these results<br />
<strong>and</strong> to extend them to other depositional settings, these results<br />
suggest that there is considerable scope for integrating semiquantitative<br />
as well as qualitative ichnological data with studies of<br />
paleosols.<br />
3. <strong>Quantitative</strong> methods overview<br />
In recent years, paleopedology has shifted from a largely<br />
qualitative field based on comparisons with modern analogues to an<br />
increasingly quantitative endeavor. Some of this change has been a<br />
result of applying existing techniques to new materials (Sections 4<br />
<strong>and</strong> 5 below, clay mineralogy <strong>and</strong> whole rock geochemistry), but<br />
many of the innovations have been the result of applying new<br />
techniques to new materials, including thermodynamic modeling of<br />
soil formation, isotope geochemistry, <strong>and</strong> applications of empirical<br />
relationships derived from modern soils. Paleoclimatic <strong>and</strong> environmental<br />
properties that may reconstructed using the new proxies<br />
include provenance, weathering intensity, mean annual precipitation<br />
<strong>and</strong> temperature during pedogenesis, nutrient fluxes into <strong>and</strong> out of<br />
the paleosols, the atmospheric composition of important gases<br />
including CO 2 <strong>and</strong> O 2 , reconstructed vegetative covering, <strong>and</strong> paleoaltitude.<br />
4. Clay mineralogy of soils <strong>and</strong> paleosols<br />
The clay size fraction in soils is operationally defined as the<br />
population of grains <strong>and</strong> crystals that are b2 μm equivalent spherical<br />
diameter (e.s.d.; e.g., Soil Survey Staff, 1975). In a strict sense,<br />
therefore, clay minerals can be any mineral in the soil that is b2 μm<br />
e.s.d. In practice, however, the term clay minerals usually refers to<br />
finely crystalline minerals that result from pedogenic alteration, <strong>and</strong><br />
most commonly is applied to phyllosilicates, oxides, <strong>and</strong> oxyhydroxides.<br />
It has long been recognized that soil clay minerals are<br />
correlated with climate factors, such as temperature <strong>and</strong> water<br />
availability in the soil, because these factors strongly affect the<br />
amount <strong>and</strong> effectiveness of chemical weathering in the soil profile.<br />
The correlation of soil clay mineralogy with climate conditions has<br />
been reviewed extensively in numerous studies over the past five<br />
decades (e.g., Jackson, 1964; Pedro, 1982; Wilson, 1999), <strong>and</strong> this<br />
contribution makes no attempt to provide a thorough review of this<br />
subject. Earlier reviews suggest generally that clay mineralogy follows<br />
a weathering pattern, from hot <strong>and</strong> humid to cool <strong>and</strong> dry, in the order<br />
kaolinite→smectite→vermiculite→chlorite <strong>and</strong> mixed-layer phyllosilicates<br />
→Illite <strong>and</strong> mica. We provide below a brief summary of<br />
methods for clay mineral identification, <strong>and</strong> the occurrence of<br />
kaolinites <strong>and</strong> smectites in soil <strong>and</strong> paleosol profiles. This reflects<br />
that these two phyllosilicates are among the most abundant minerals<br />
that have been identified in paleosols, <strong>and</strong> therefore also most<br />
commonly have undergone quantitative geochemical analysis.<br />
4.1. Occurrence of clay minerals<br />
K<strong>and</strong>ite minerals, a group of 1:1 phyllosilicates, are recognized by a<br />
basal d(001) spacing of ~7 Å that exp<strong>and</strong>s to 10 Å upon solvation with<br />
hydrazine <strong>and</strong> Dimethylsulfoxide (DMSO; Jackson <strong>and</strong> Abdel-Kader,<br />
1978; Calvert, 1984). Kaolinite <strong>and</strong> Halloysite are common pedogenic<br />
minerals in soil profiles (Wilson, 1999), although halloysite is not a<br />
common constituent of paleosol profiles (Srodon, 1999). Pedogenic<br />
kaolinites form in well-drained <strong>and</strong> acidic soils with moderate silica<br />
activity <strong>and</strong> very low base cation activity in soil solutions (Dixon,<br />
1989). This corresponds generally with soil formation in warm <strong>and</strong><br />
humid climate. Kaolinite-dominated soil profiles are frequently<br />
associated with oxide <strong>and</strong> oxyhydroxide minerals such as goethite,<br />
hematite <strong>and</strong> gibbsite (e.g., Bárdossy et al., 1977; Tardy et al., 1990a,b).<br />
Kaolinite may also occur as a minor constituent in soils dominated by<br />
2:1 phyllosilicates (Nash et al., 1988). Kaolinite is an abundant clay<br />
mineral in paleosol profiles that formed in paleotropical sites (e.g.,<br />
Retallack <strong>and</strong> Germán-Heins, 1994; Gill <strong>and</strong> Yemane, 1996; Tabor <strong>and</strong><br />
Montañez, 2004; Jacobs et al., 2005). Notable dissimilarities between<br />
modern pedogenic kaolinites <strong>and</strong> geological deposits include finer<br />
grain size, greater degree of disorder, <strong>and</strong> small amounts of<br />
isomophous substitution of Fe for Al in modern soil kaolinites (e.g.,<br />
Herbillon et al., 1976). This may indicate that at least some diagenetic<br />
transformations occur in kaolinites.<br />
Smectites, a large group of 2:1 phyllosilicate minerals, are recognized<br />
by a basal d(001) spacing of ~12–14 Å which exp<strong>and</strong>s to<br />
~18 Å in response to Mg-saturation <strong>and</strong> glycerol solvation, or<br />
expansion to ~20 Å upon glycol solvation (Moore <strong>and</strong> Reynolds,<br />
1996). Montmorillonite <strong>and</strong> bedellite are the most common smectite<br />
minerals in soils <strong>and</strong> paleosols, <strong>and</strong> both minerals permit a substantial<br />
amount of isomorphous substitution in the tetrahedral <strong>and</strong> octahedral<br />
layers (Wilson, 1999; Tabor et al., 2004a,b; Tabor <strong>and</strong> Montañez,<br />
2005). Pedogenic smectite forms in poorly drained soils characterized<br />
by high pH, with high chemical activity of silica <strong>and</strong> basic cations<br />
(Borchardt, 1989). This corresponds generally to intermittently poorly<br />
drained environments, including monsoonal <strong>and</strong> xeric climates<br />
characterized by strongly seasonal precipitation. Smectite-dominated<br />
soil profiles are frequently associated with hematite <strong>and</strong> calcite.<br />
The clay size fraction in soils <strong>and</strong> paleosols is seldom composed of a<br />
single mineral. Rather, it typically includes mixtures of phyllosilicate,<br />
Fe- <strong>and</strong> Al- (oxyhydr) oxides, quartz <strong>and</strong> occasionally feldspars that<br />
cannot easily be separated from each other. As a result, mineralogical<br />
<strong>and</strong> geochemical characterization of discrete minerals in the soil (or<br />
paleosol) clay size fraction is complicated. Three approaches have<br />
been used to address complex clay mineral mixtures: (1) Adopt<br />
assumptions about the composition of minerals in the mixtures that<br />
are not under study in order to calculate an end-member composition<br />
for the mineral of interest (e.g., Bird <strong>and</strong> Chivas, 1988a,b; Lawrence<br />
<strong>and</strong> Rashkes Meaux, 1993), (2) ignore complications that may arise<br />
Please cite this article as: Sheldon, N.D., Tabor, N.J., <strong>Quantitative</strong> <strong>paleoenvironmental</strong> <strong>and</strong> <strong>paleoclimatic</strong> <strong>reconstruction</strong> using paleosols, Earth-<br />
Science Reviews (2009), doi:10.1016/j.earscirev.2009.03.004
ARTICLE IN PRESS<br />
8 N.D. Sheldon, N.J. Tabor / Earth-Science Reviews xxx (2009) xxx–xxx<br />
from variability in mineral content of the clay size fraction (Tabor<br />
et al., 2004a,b), or (3) utilize non-routine physical <strong>and</strong> chemical<br />
separation (Munsterman <strong>and</strong> Kerstholt, 1996; see also review of<br />
separation techniques in Gilg <strong>and</strong> Sheppard, 1996) or spectroscopic<br />
techniques (Tabor <strong>and</strong> Montañez, 2005) in order to delineate the<br />
relative concentrations of different minerals in the clay-size fraction.<br />
5. Whole rock geochemistry<br />
5.1. Analytical methods<br />
Paleosols may be analyzed as “whole rocks” in a manner similar to<br />
other geological materials. Typically, this involves the use of either X-<br />
ray fluorescence (XRF) or inductively coupled plasma optical/atomic<br />
emission spectroscopy (ICP-OES/AES) or mass spectrometry (ICP-<br />
MS). Both types of analyses offer different advantages <strong>and</strong> disadvantages.<br />
XRF analysis is non-destructive, offers a wide variety of major<br />
(from fused glasses), <strong>and</strong> trace <strong>and</strong> rare Earth (from pressed pellets),<br />
is relatively low-cost, <strong>and</strong> offers both precise <strong>and</strong> accurate results.<br />
Disadvantages of XRF analysis include “fussy” sample preparation that<br />
involves measurement of sample masses to many decimal points of<br />
precision, slow machine run times, <strong>and</strong> a lack of availability as many<br />
universities have shifted to ICP-based analysis because it can be used<br />
on a wider range of materials (e.g., soils <strong>and</strong> water too). Though<br />
neither ICP-OES/AES nor ICP-MS offer easily the full range of elements<br />
that can be analyzed by XRF, the combination of both techniques<br />
yields a similar suite. Other advantages include relatively “unfussy”<br />
sample preparation, low-costs, <strong>and</strong> quick analysis times. Disadvantages<br />
include the need to use both techniques to get adequate precision<br />
for the full suite of elements that are typically of interest, that<br />
ICP analysis is a destructive technique, Si volatilization in the presence<br />
of HF, <strong>and</strong> the use of highly reactive HF <strong>and</strong>/or perchloric acid to<br />
achieve sample dissolution.<br />
One common problem with studies of paleosols is in having a wellconstrained<br />
parent material to analyze as well. As will be discussed<br />
below, many of the geochemical proxies that have been proposed for<br />
analyzing past climatic <strong>and</strong> environmental conditions <strong>and</strong> past pedogenic<br />
processes are based on comparison with the chemical composition<br />
of the protolith/parent material. Thus, regardless of analytical<br />
methodology, it is very important that complete profiles (i.e., at least<br />
one sample of each horizon) including C or R horizon samples be<br />
collected whenever possible.<br />
5.2. Provenance <strong>and</strong> pedogenesis<br />
A number of different proxies based on whole rock geochemical<br />
analyses (Table 3) have been proposed for evaluating pedogenic<br />
processes in paleosols (see Retallack, 1997a,b,c). Most are based on<br />
ratios between different elements (Table 3), but in general, little<br />
Table 4<br />
Molar masses.<br />
Molecular masses of common oxides <strong>and</strong> elements<br />
Oxide/element<br />
Molar mass<br />
(g mol − 1 )<br />
Al 2 O 3 101.96<br />
Ba 137.3<br />
CaO 56.08<br />
Ce 140.12<br />
K 2 O 94.2<br />
La 138.91<br />
Lu 175<br />
MgO 40.32<br />
MnO 60.94<br />
Na 2 O 61.98<br />
Nb 92.9<br />
Nd 144.2<br />
P 2 O 5 189.94<br />
Rb 85.47<br />
SiO 2 60.09<br />
Sm 150.4<br />
Sr 87.6<br />
Th 232.04<br />
TiO 2 79.9<br />
U 238<br />
Yb 173<br />
Zr 91.22<br />
justification has been given in the literature for why particular elemental<br />
ratios are meaningful. We are hoping to rectify that situation in<br />
this review by presenting clear examples of how <strong>and</strong> why (Table 3)<br />
different pedogenic processes may be evaluated using elemental<br />
geochemistry. By convention, major element data are presented as<br />
weight percentages of oxides <strong>and</strong> trace elements as ppm. From there,<br />
the convention is to convert the raw abundances into moles by<br />
dividing the weight percentage (or ppm) by the molecular mass<br />
(Table 4) before the equations are solved. For all of the geochemical<br />
functions that we present, the molar rather than oxide equivalent for a<br />
given element is shown (i.e., Ca rather than CaO, Na rather than Na 2 O,<br />
etc.; Table 3).<br />
5.2.1. Major element ratios <strong>and</strong> pedogenic processes<br />
“Major elements” refers to the primary rock-forming elements Ca,<br />
Fe, K, Mg, Na, along with Al, O, <strong>and</strong> Si as building block elements for<br />
silicate minerals, <strong>and</strong> minor amounts of Mn, P, <strong>and</strong> Ti (Li, 2000).<br />
Typically, major element concentrations are measurable in terms of<br />
weight percent. The rock-forming elements can be separated according<br />
to redox sensitivity (Fe 2+/3+ <strong>and</strong> Mn 2+/3+/4+ ), valence (Ti 4+ or<br />
P 5+ ), or chemical affinity (K <strong>and</strong> Na versus Ca <strong>and</strong> Mg). In particular,<br />
chemical affinity is useful because the majority of CO 2 consumption<br />
during weathering (e.g., Sheldon, 2006d) involves the monovalent<br />
alkali (K <strong>and</strong> Na) <strong>and</strong> divalent alkaline earth elements (Ca <strong>and</strong> Mg).<br />
Table 3<br />
Molecular weathering <strong>and</strong> pedogenesis ratios.<br />
Ratio Formula Rationale Pedogenic process<br />
Major elements<br />
ΣBases/Al<br />
ΣBases<br />
Al<br />
ΣBases =Ca+Mg+Na+K<br />
Common rock-forming alkaline <strong>and</strong> alkaline earth elements are lost relative to Al during pedogenesis<br />
Base loss Base/Ti Base cations (Ca, Mg, Na, K) should be leached during weathering at normal pH conditions <strong>and</strong> Ti<br />
accumulated<br />
Hydrolysis<br />
Clayeyness Al/Si Al accumulated as clay minerals form Hydrolysis<br />
Gleization FeO/Fe 2 O 3 Fe 2+ is most common <strong>and</strong> mobile under reducing conditions, whereas Fe 3+ is immobile under oxidizing Oxidation<br />
conditions<br />
Provenance Ti/Al Ti is most readily removed by physical weathering, Al by chemical weathering Acidification (~pH)<br />
Salinization K+Na<br />
Alkali elements accumulate as soluble salts not removed<br />
Salinization<br />
Al<br />
Trace elements<br />
Leaching Ba/Sr Sr solubility NBa solubility Leaching/hydrolysis<br />
Parent Material La/Ce, Sm/Nd, U/Th Different parent materials have different initial trace element ratios prior to pedogenesis, but most of those<br />
elements are immobile during weathering, so the paleosol ratio should approximate the parent material ratio<br />
Acidification (~pH)<br />
Leaching<br />
Please cite this article as: Sheldon, N.D., Tabor, N.J., <strong>Quantitative</strong> <strong>paleoenvironmental</strong> <strong>and</strong> <strong>paleoclimatic</strong> <strong>reconstruction</strong> using paleosols, Earth-<br />
Science Reviews (2009), doi:10.1016/j.earscirev.2009.03.004
ARTICLE IN PRESS<br />
N.D. Sheldon, N.J. Tabor / Earth-Science Reviews xxx (2009) xxx–xxx<br />
9<br />
For example, the large atomic radius alkali elements fit into different<br />
sites in minerals than the somewhat smaller alkaline earth elements.<br />
Observations of modern weathering of basalt parent soils suggest that<br />
the alkaline earth elements (which are also associated with more<br />
mafic minerals) weather more readily than the alkali elements<br />
(Chadwick et al., 1999), a pattern also observed in paleosols with a<br />
basaltic parent (see Section 5.3.1 for details; Sheldon, 2003; Tabor<br />
et al., 2004a; Sheldon, 2006c,d), though laterites formed on basalt do<br />
not necessarily conform to this rule of thumb (Hill et al., 2000).<br />
Elemental ratios are favoured over simple single-element measurements<br />
because the absolute abundance of an element within a soil/<br />
paleosol can vary dramatically over small spatial scales (e.g., between<br />
horizons), because the textural heterogeneity common in soils/<br />
paleosols can give rise to chemical heterogeneity, <strong>and</strong> because more<br />
process information is gained by looking at how two or more elements<br />
change with respect to one another.<br />
Examples of commonly applied major element ratios used to<br />
explain individual pedogenic processes are given in Table 3. Proxies for<br />
hydrolysis include ΣBases/Al (see Section 5.2.2) <strong>and</strong> Al/Si. Al/Si is<br />
thought to be a measure of “clayeyness” because Al accumulates in<br />
clay minerals relative to a silicate mineral parent. The ratio was first<br />
proposed (though inverted from the present form) by Ruxton (1968)<br />
<strong>and</strong> has been widely applied (various, e.g., Retallack et al., 2000;<br />
Prochnow et al., 2006; Sheldon, 2006b; Hamer et al., 2007b). Among<br />
the applications of the Al/Si ratio is the confirmation of field<br />
classification of Bt horizons (Sheldon, 2005; Hamer et al., 2007b)<br />
<strong>and</strong> as a measure of provenance (e.g., Sheldon, 2006a). The primary<br />
weakness of applying the Al/Si ratio is that it is difficult to account for<br />
syn-formational additions of Si due to aeolian processes, although by<br />
looking at a suite of elements that are also prone to windborne addition<br />
(i.e., other commonly occurring crustal elements; alternatively,<br />
with REE, see Ziegler et al., 2007), it is often possible to distinguish<br />
that process from pedogenic changes.<br />
The gleization ratio, Fe 2+ /Fe 3+ , is the most commonly applied<br />
major element ratio for underst<strong>and</strong>ing oxidation, though others have<br />
been proposed as well (see Retallack, 2001b for examples) based on<br />
Mn or on some combination of Fe <strong>and</strong> Mn. Gleization is sometimes<br />
used interchangeably with hydromorphism, <strong>and</strong> refers to the in situ<br />
reduction of Fe <strong>and</strong> Mn due to waterlogged conditions (Bockheim <strong>and</strong><br />
Gennadiyev, 2000). As with other major element ratios, it is important<br />
to consider the parent material chemical composition (e.g., Driese<br />
et al., 2003) because the initial, unweathered gleization ratio may be<br />
very different for different parent materials. For example, unweathered<br />
basalt will typically have a gleization ratio in excess of 2, whereas<br />
samples from well-drained paleosols derived from basalt will typically<br />
have gleization ratios much less than 0.5 (Sheldon, 2003) owing to<br />
oxidation during weathering. Sayyed <strong>and</strong> Hundekari (2006) found a<br />
similar pattern, with gleization ratios in unweathered basalts of 4–5,<br />
<strong>and</strong> values generally b1 for modern soils <strong>and</strong> paleosols derived from<br />
basalt. Driese (2004) also presented a similar result when comparing<br />
modern <strong>and</strong> Precambrian Vertisols. An additional application of the<br />
gleization ratio has been to look at redox changes across mass<br />
extinction events. In the earliest Triassic, southern hemisphere highpaleolatitude<br />
Gondwanan paleosols consistently show higher gleization<br />
ratios (i.e., more reduced conditions) than their latest Permian<br />
predecessors, coincident with Permian-Triassic extinction, <strong>and</strong> often<br />
over the space of cms (Retallack, 1999; Sheldon, 2006a). This has been<br />
interpreted to represent a very rapid (b10,000 year; Retallack <strong>and</strong><br />
Jahren, 2008) shift to highly reducing soil gas conditions. Given that<br />
paleosols above <strong>and</strong> below the boundary represent wetl<strong>and</strong> settings<br />
(which should be fairly reduced anyway), this change is striking<br />
(Sheldon, 2006a). The primary weakness of applying the gleization<br />
ratio is one of constraining the timing of the reduction of Fe 3+ to Fe 2+ ,<br />
because groundwater movement during early diagenesis (i.e., typically<br />
reducing waters) or exposure of the paleosol profiles to oxidizing<br />
waters during uplift <strong>and</strong> exposure could, theoretically at least, change<br />
the ratio. Ways to account for this possibility include careful<br />
characterization of the Fe-bearing minerals using petrography, SEM,<br />
or microprobe analysis, field observations of redoximorphic features<br />
in the paleosol (Kraus <strong>and</strong> Aslan, 1993), <strong>and</strong> mass-balance calculations<br />
(see Section 5.3.1 for details) of both redox-sensitive <strong>and</strong> redoxinsensitive<br />
elements to look for evidence of diagenetic changes.<br />
Salinization (Table 3) is the process by which otherwise mobile<br />
elements (K <strong>and</strong> Na) accumulate as soluble salts in a soil or paleosol.<br />
Examples of this process can be found fairly commonly in modern<br />
(e.g., Buck et al., 2006), Cenozoic (e.g., Hartley <strong>and</strong> May, 1998), <strong>and</strong><br />
Mesozoic (e.g., Lawton <strong>and</strong> Buck, 2006) soils <strong>and</strong> paleosols that form<br />
in arid regions or deserts. Older examples are much more rare because<br />
salts are often removed by diagenesis, leaving evaporite mineral<br />
pseudomorphs rather than the original minerals. The salinization ratio<br />
may also be related to mean annual temperature in some settings (see<br />
Section 5.4; Sheldon et al., 2002), <strong>and</strong> though other ratios have been<br />
proposed (see Retallack, 2001a,b), only this one has been widely<br />
applied. However, salinization is not one of the most reliable<br />
pedogenic process indicators because of differences in behaviour<br />
between in K <strong>and</strong> Na during pedogenesis. In general, Na is less subject<br />
to diagenetic redistribution (Retallack, 1991). To verify salinization<br />
results, investigators should also look for other aridity indicators such<br />
as pedogenic carbonate nodules <strong>and</strong> physical presence of evaporite<br />
minerals in h<strong>and</strong> specimen or thin section.<br />
Leaching may be quantified in paleosols using a base loss ratio<br />
where the abundance of a given base is divided by the abundance of Ti.<br />
This approach, though simple, bypasses the problem associated<br />
with full mass-balance calculations of needing to measure or estimate<br />
bulk density values for paleosol <strong>and</strong> parent material samples (see<br />
Section 5.3). In particular, it may be valuable for paleosols recovered<br />
from deep drilling cores where there is a limited amount of material<br />
available <strong>and</strong> using some of it for bulk density measurements (which<br />
are effectively destructive if the clod-paraffin method is used) is not<br />
possible (Sheldon, 2006c). The keys to using base loss ratios are that<br />
they must be plotted as a function of depth because different horizons<br />
should show different elemental behaviour, <strong>and</strong> that multiple<br />
elements need to be plotted, included both alkali <strong>and</strong> alkaline earth<br />
elements to capture the full range of pedogenic processes. P/Ti may<br />
also be plotted as a rough guide to paleo-fertility. This approach has<br />
been applied to basalt-parented paleosols thus far (Tabor et al., 2004a;<br />
Sheldon, 2006c), but should in theory, be widely applicable. The<br />
primary potential problem with this approach is with low-Ti parent<br />
materials, because then relatively minor differences in Ti content<br />
could show apparently large differences in pedogenesis. Thus, this<br />
approach to quantifying leaching works best for paleosols that have<br />
igneous or metamorphic parent materials, <strong>and</strong> less well for paleosols<br />
that formed on limestone or relatively quartz-rich parent materials.<br />
The Ti/Al ratio is particularly useful as a provenance indicator<br />
because Ti contents may be quite variable among different types of<br />
rocks, even as Al contents are relatively constant (e.g., granite vs.<br />
basalt; Li, 2000). In general, the more mafic the parent material, the<br />
higher the Ti/Al ratio will be (Fig. 6; Maynard, 1992). Furthermore,<br />
because both elements are relatively immobile, the ratio should<br />
remain constant during pedogenesis at near-neutral pHs (5.5–8), <strong>and</strong><br />
should also be constant as a function of depth within a paleosol<br />
(Sheldon, 2006a). At near-neutral conditions, Al is slightly more<br />
mobile than Ti (Li, 2000), <strong>and</strong> Al can be mobilized significantly in<br />
older soils (e.g., N150 Ka, Kurtz et al., 2000). Ti <strong>and</strong> Al are most mobile<br />
under acidic pH conditions, so the ratio should also potentially shift<br />
from the parent material value according to the pH at the time of<br />
formation. Neither element is redistributed readily by diagenesis, so<br />
the Ti/Al ratio should be a reliable indicator of provenance even for<br />
Precambrian paleosols if they formed at near neutral pH conditions<br />
<strong>and</strong> had short to moderate (b100 Ka) formation times, though<br />
potentially, it also may be used as paleo-weathering intensity<br />
measurement in paleosols that do not exhibit constant values with<br />
Please cite this article as: Sheldon, N.D., Tabor, N.J., <strong>Quantitative</strong> <strong>paleoenvironmental</strong> <strong>and</strong> <strong>paleoclimatic</strong> <strong>reconstruction</strong> using paleosols, Earth-<br />
Science Reviews (2009), doi:10.1016/j.earscirev.2009.03.004
ARTICLE IN PRESS<br />
10 N.D. Sheldon, N.J. Tabor / Earth-Science Reviews xxx (2009) xxx–xxx<br />
depth in the profile (see below). Applications of the Ti/Al ratio include<br />
confirming similar provenance for latest Permian <strong>and</strong> earliest Triassic<br />
paleosols in a study of weathering intensity changes across the<br />
boundary (Sheldon, 2006a), to compare modern <strong>and</strong> Precambrian<br />
weathering of Vertisol-like paleosols (Driese et al., 2007), to compare<br />
provenance between different pedotypes <strong>and</strong> potential sediment<br />
source areas using Oligocene–Miocene paleosols (Hamer et al.,<br />
2007b), <strong>and</strong> to infer parent material homogeneity in Precambrian<br />
paleosols (e.g., Rye <strong>and</strong> Holl<strong>and</strong>, 2000).<br />
Fig. 6 depicts the Ti/Al ratio as a function of depth for various<br />
weakly- to moderately-developed paleosols that formed on different<br />
types of parent material. In each case, the mean parent material value<br />
is very close to the values at any position within the profile (i.e., nearly<br />
constant depth profile), <strong>and</strong> both mudstone <strong>and</strong> s<strong>and</strong>stone parents<br />
are characterized by low Ti/Al ratios. In contrast, basalt-parented<br />
paleosols show somewhat more variability with depth due typically to<br />
a minor component of ash <strong>and</strong>/or sediment, but also significantly<br />
higher Ti/Al ratios throughout the profiles. Taken together, these<br />
results suggest that the Ti/Al ratio is a reliable indicator of provenance<br />
(e.g., Stiles <strong>and</strong> Stensvold, 2008).<br />
An example of using the Ti/Al ratio to examine weathering<br />
intensity is found in Fig. 7. In contrast to the moderately developed<br />
basalt-parented paleosols results shown in Fig. 6, the paleosols in<br />
Fig. 7 show significantly reduced Ti/Al ratios in the upper part of their<br />
profiles. The paleosols in Fig. 6 are all identified as being Inceptisollike<br />
or Andisol-like (Protosol), whereas the more developed paleosols<br />
in Fig. 7 are all identified as being Alfisol-like (Argillisol). Closer<br />
inspection of the chemical data of Sheldon (2003, 2006d) indicates<br />
that both Ti <strong>and</strong> Al have been lost, but that Ti has been more extensively<br />
lost. In thin section, Ti-bearing minerals like rutile <strong>and</strong> Feoxides<br />
show minimal alteration. This suggests that the Ti loss at the<br />
top of the paleosols profiles is due to physical removal rather than<br />
chemical dissolution. That idea is further supported by the fact that<br />
the highest Ti/Al ratios are in the parental basalt. If Ti has been<br />
dissolved <strong>and</strong> transported within the profile downward into the B<br />
horizon of the paleosols, then that accumulation would result in the<br />
highest Ti/Al ratios at that level, which is not observed in any of the<br />
Fig. 6. Ti/Al ratios for moderately developed paleosols. Squares are basalt-parented<br />
Quaternary paleosols; data are from Sheldon (2006c). Diamonds are for s<strong>and</strong>stoneparented<br />
latest Permian <strong>and</strong> earliest Triassic paleosols; data are from Sheldon (2006a).<br />
Triangles are from mudstone-parented Eocene <strong>and</strong> Oligocene paleosols; data are from<br />
Sheldon et al. (2009).<br />
Fig. 7. Ti/Al ratios for well-developed paleosols on basalt. Data are from middle Miocene<br />
paleosols (Sheldon, 2003, 2006d).<br />
profiles. The primary weaknesses of this approach are with low Ti<br />
parent materials <strong>and</strong> in differentiating between chemical <strong>and</strong> physical<br />
removal of either Ti or Al during pedogenesis, though petrography/<br />
SEM studies offer a means to account for the second problem.<br />
5.2.2. Major element weathering indices<br />
The other primary use of major element geochemistry has been to<br />
identify single indices that quantify the totality of weathering processes.<br />
The first of these was proposed by Nesbitt <strong>and</strong> Young (1982)<br />
<strong>and</strong> is called the “chemical index of alteration” or CIA:<br />
CIA = 100 ×<br />
Al<br />
Al þ Ca þ K þ Na<br />
where each of the elemental concentrations is coverted to moles. The<br />
CIA is a measurement of the weathering of feldspar minerals <strong>and</strong> their<br />
hydration to form clay minerals. As clay content increases Al should<br />
also increase, whereas Ca, K, <strong>and</strong> Na contents should decrease, leading<br />
to higher CIA values. For example, a pure sample of microcline<br />
(KAlSi 3 O 8 ) would have a CIA value of 50. If it was weathered to form<br />
pure illite (which has a chemical formula similar to muscovite<br />
[KAl 3 Si 3 O 10 (OH) 2 ]), the CIA value would increase to 75. Similarly, if<br />
the illite was completely leached of K <strong>and</strong> kaolinite was formed, the<br />
CIA value would further increase up to 100. Depending on the parent<br />
material chemistry, CIA changes during weathering may be quite large<br />
or relatively small. For example, tholeiitic basalt has CIA values of 40–<br />
45 (Sheldon, 2003); the formation of Alfisol-like paleosols (Argillisols)<br />
on tholeiitic basalts of the Columbia River Flood Basalt group<br />
under temperate conditions gave rise to B horizon CIA values of 60–70<br />
(Sheldon, 2003). Parent materials that have already been cycled as<br />
sediments or which are clay-rich in the first place may start out with<br />
CIA values of 60–70, with weathering leading to even higher values. In<br />
general, the CIA is most useful for silicate rocks because a typical<br />
limestone would have very low Al levels to start with <strong>and</strong> thus, a very<br />
low CIA value that might not change appreCIAbly during pedogenesis.<br />
More recent authors (Maynard, 1992; Fedo et al., 1995) have been<br />
concerned about post-burial addition of K by metasomatism <strong>and</strong> have<br />
modified the CIA to account for metasomatism by removing K from<br />
their modified CIA expressions in different ways. A second potential<br />
issue with K arises from illitization of clay minerals (e.g., smectites) in<br />
ð5Þ<br />
Please cite this article as: Sheldon, N.D., Tabor, N.J., <strong>Quantitative</strong> <strong>paleoenvironmental</strong> <strong>and</strong> <strong>paleoclimatic</strong> <strong>reconstruction</strong> using paleosols, Earth-<br />
Science Reviews (2009), doi:10.1016/j.earscirev.2009.03.004
ARTICLE IN PRESS<br />
N.D. Sheldon, N.J. Tabor / Earth-Science Reviews xxx (2009) xxx–xxx<br />
11<br />
sub-metamorphic burial conditions. This is particularly important for<br />
Paleozoic <strong>and</strong> older paleosols because smectite is meta-stable <strong>and</strong><br />
may be altered to illite in the presence of K-rich pore waters. Nonetheless,<br />
unless there is evidence of K metasomatism or illitization (<strong>and</strong><br />
this is primarily of interest in metamorphosed areas or with very old, i.e.,<br />
Precambrian, paleosols) from petrography or some other method, the<br />
CIA is a good tool for evaluating chemical weathering <strong>and</strong> for comparing<br />
different paleosols. Both the CIA-K of Maynard (1992) <strong>and</strong> PIA of Fedo<br />
et al. (1995) of B horizons in soils are well-correlated with mean annual<br />
precipitation (see Section 5.5; Sheldon et al., 2002), so the primary<br />
recent use of the CIA-K has been for estimating <strong>paleoclimatic</strong> conditions<br />
(e.g., Nordt et al., 2006; Hamer et al., 2007a,b).<br />
One final consideration with this type of weathering index is that<br />
there is one piece of nomenclatural confusion that has been propagated<br />
through the literature. The “chemical index of weathering”<br />
(CIW; Harnois, 1988) <strong>and</strong> CIA-K (Maynard, 1992) were developed for<br />
different purposes (Harnois (1988) was concerned about the inconsistent<br />
behaviour of K during pedogenesis, <strong>and</strong> Maynard (1992) was<br />
concerned about K addition by metasomatism), but, nevertheless,<br />
involve the same equation:<br />
Al<br />
CIWðCIA − KÞ = 100 ×<br />
Al þ Ca þ Na<br />
Retallack (various, e.g., 2001b; see Colman, 1982) has advocated a<br />
slightly different weathering index because while CIA <strong>and</strong> its variants<br />
give a good accounting of feldspar weathering, other types of minerals<br />
are not necessarily captured by that index, in particular Mg-bearing<br />
minerals. The ΣBases/Al ratio (Table 3) is designed to overcome this<br />
<strong>and</strong> is calculated with the following expression (again, using<br />
molecular values for each element):<br />
P Bases<br />
Al<br />
Ca þ K þ Mg þ Na<br />
=<br />
Al<br />
The ΣBases/Al ratio is susceptible to the same potential issues with<br />
metasomatically altered paleosols as the CIA, but again, unless there is<br />
some reason to suspect post-burial alteration, the ratio may be used to<br />
describe weathering of paleosols. ΣBases/Al has been used for a<br />
variety of purposes including characterizing weathering intensity<br />
(e.g., Retallack, 1999; Bestl<strong>and</strong>, 2000; Retallack <strong>and</strong> Krull, 1999;<br />
Sayyed <strong>and</strong> Hundekari, 2006) <strong>and</strong> for taxonomic purposes (Sheldon<br />
et al., 2002). Sayyed <strong>and</strong> Hundekari (2006) compared a variety of<br />
weathering ratios including the ΣBases/Al ratio to examine differences<br />
between near-modern <strong>and</strong> Cretaceous weathering on “red bole”<br />
<strong>and</strong> “green bole” paleosols formed on Deccan Traps basalt flows. A<br />
ΣBases/Al ratio of 0.5 is a statistically significant dividing line between<br />
Alfisols (N0.5; dystric Argillisols) <strong>and</strong> Ultisols (b0.5; eutric Argillisols);<br />
that criterion is roughly equivalent to the Soil Survey Staff<br />
(2006) base saturation criteria of 35% to separate between base-rich<br />
Alfisols <strong>and</strong> base-poor Ultisols (Sheldon et al., 2002). An example<br />
where that criterion was applied can be found in Sheldon (2005), who<br />
used it to confirm a field identification of Alfisol-like paleosols. In<br />
addition, Clechenko et al. (2007) discuss a thick paleosol associated<br />
with the Paleocene–Eocene boundary as being comparable to a<br />
modern Ultisol. Using data from their paper (their Table 1), an average<br />
ΣBases/Al of 0.3 is obtained for the paleosols, lending additional<br />
support to this criterion as a means for distinguishing between paleo-<br />
Alfisols <strong>and</strong> paleo-Ultisols. A further application of the ΣBases/Al ratio<br />
can be found in Perez-Huerta <strong>and</strong> Sheldon (2006), who used it to<br />
examine how short-term sea level (i.e., glacio-eustatic) changes<br />
affected nutrient availability in shallow marine settings where the<br />
ΣBases/Al ratio was used to represent the fluctuating continental<br />
input derived from soils.<br />
ð6Þ<br />
ð7Þ<br />
Darmody et al. (2005) presented two other measurements of<br />
chemical weathering that they applied to modern soil formation with<br />
granitic parent materials:<br />
WI − 1=<br />
WI − 2=<br />
Si þ Ca<br />
Fe þ Ti<br />
Si þ Ca<br />
Fe þ Ti þ Al<br />
Darmody et al. (2005) found strong positive correlations between<br />
WI-1, WI-2, <strong>and</strong> Si/Al [1/“clayeyness” (Section 5.2.1)], <strong>and</strong> strong<br />
negative correlations with the CIW of Harnois (1988), suggesting that<br />
all of the ratios were capturing weathering intensity. To date, Eqs. (8)<br />
<strong>and</strong> (9) have not been widely applied to paleosols. One exception is<br />
Kahmann et al. (2008), who compared results between a number of<br />
indices <strong>and</strong> found that WI-1 <strong>and</strong> WI-2 were in relatively poor<br />
concordance with other weathering indices <strong>and</strong> also with estimates of<br />
mean annual precipitation derived from CIA-K values (see Section<br />
5.5.3). However, the parent material being studied by Kahmann et al.<br />
(2008; sediments) was very different than that being studied by<br />
Darmody et al. (2005). Thus, at this point, results using Eqs. (8)<br />
<strong>and</strong> (9) are equivocal <strong>and</strong> more testing is needed to determine if the<br />
relationships that Darmody et al. (2005) found are widely applicable<br />
or only apply to cases with granitic parent materials.<br />
5.2.3. Trace element ratios<br />
Trace element abundances vary considerably among different<br />
paleosol types <strong>and</strong> parent materials. In general, to be useful a trace<br />
element must be present at the 10 s–100 s ppm level, because the<br />
analytical uncertainty using either XRF or ICP is a couple of ppm. As<br />
with major elements, ratios between trace elements are favoured both<br />
as means of normalizing differences but also because different<br />
elements are gained or lost due to different pedogenic processes.<br />
Trace element geochemistry in paleosols has been used for a variety of<br />
applications including examining weathering intensity (e.g., Kahmann<br />
et al., 2008), evaluating leaching (Sheldon, 2006a; Retallack,<br />
2001a,b, 1999), <strong>and</strong> for provenance (Hamer et al., 2007b; Sheldon<br />
et al., 2009; Sheldon, 2006a). The most commonly used ratio is Ba/Sr,<br />
which is thought to represent leaching behaviour during weathering<br />
(Table 3; Sheldon, 2006a; Retallack, 2001b), where higher values<br />
represented more leaching. Both are alkaline earth elements <strong>and</strong> have<br />
similar atomic radii <strong>and</strong> similar chemical affinities, but Sr is<br />
significantly more soluble than Ba (Vinogradov, 1959), so under<br />
most conditions it will be leached more readily. Thus, a heavily<br />
leached paleosol should have relatively lower Ba/Sr ratios near the top<br />
of the profile <strong>and</strong> relatively high Ba/Sr ratios lower in the profile if a B<br />
horizon is present (Sheldon, 2006a). The Ba/Sr ratio has been used to<br />
characterize leaching behaviour in paleosols throughout the geologic<br />
record including Precambrian (Retallack <strong>and</strong> Mindszenty, 1994),<br />
Permian–Triassic (Krull <strong>and</strong> Retallack, 2000; Sheldon, 2006a), <strong>and</strong><br />
Cenozoic (Terry, 2001) examples. There are two potential weaknesses<br />
of applying the Ba/Sr ratio. First, the chemical behaviour of Ba is less<br />
well understood than Sr, particularly in soils. Second, different parent<br />
materials have variable initial concentrations (<strong>and</strong> textures due to<br />
different mineral composition), so relatively minor changes in absolute<br />
abundance in samples with small initial amounts could be<br />
interpreted as intensive leaching when the process was of relatively<br />
little importance.<br />
An additional trace element ratio that is potentially useful is U/Th<br />
(Table 3). U <strong>and</strong> Th are both actinide elements; This typically more<br />
abundant in most potential parent rocks except for limestones (e.g., Li,<br />
2000). Th <strong>and</strong> U are both relatively immobile during weathering<br />
except under intense conditions (Li, 2000), or where there is a strong<br />
ð8Þ<br />
ð9Þ<br />
Please cite this article as: Sheldon, N.D., Tabor, N.J., <strong>Quantitative</strong> <strong>paleoenvironmental</strong> <strong>and</strong> <strong>paleoclimatic</strong> <strong>reconstruction</strong> using paleosols, Earth-<br />
Science Reviews (2009), doi:10.1016/j.earscirev.2009.03.004
ARTICLE IN PRESS<br />
12 N.D. Sheldon, N.J. Tabor / Earth-Science Reviews xxx (2009) xxx–xxx<br />
redox gradient, because while U 4+ is insoluble under oxidizing<br />
conditions, U 6+ is soluble. Thus, during weathering, a few scenarios<br />
are possible that may give insight into both provenance <strong>and</strong> pedogenesis.<br />
The first is that U is leached away during pedogenesis <strong>and</strong> Th<br />
remains, leaving the upper horizons of the soil/paleosols with lower<br />
U/Th ratios than the parent material. This would indicate very intense<br />
weathering <strong>and</strong> a strong redox gradient. If the U is redistributed by<br />
lessivage rather than leached away, then the U/Th ratio should be<br />
highest in Bw/Bt horizons, <strong>and</strong> elevated relative to the parent material<br />
ratio (e.g., supporting data from Sheldon, 2006a). Alternatively, if<br />
pedogenesis was not very intense <strong>and</strong> there was no significant redox<br />
gradient, then the U/Th ratio should be constant with depth in a soil<br />
(e.g., data in Condie et al., 1995). Measurements of modern weathering<br />
suggest that the second scenario, U redistribution <strong>and</strong> accumulation<br />
in soils, is most likely (van der Weijden <strong>and</strong> van der Weijden,<br />
1995; Pett-Ridge et al., 2007). Examples in paleosols can be found<br />
among diverse settings, including basalt-parent laterites (Kisakürek<br />
et al., 2004) <strong>and</strong> s<strong>and</strong>stone-parented Inceptisol-like palesols (Sheldon,<br />
2006a). However, Pett-Ridge et al. (2007) also demonstrate that<br />
U that has accumulated in paleosols that are more than 150 Ka old is<br />
largely derived from atmospheric deposition (i.e., aerosols) rather<br />
than from weathering of the parent material. Thus, the U/Th ratio is<br />
probably most useful in paleosols with short-moderate formation<br />
times (see Section 5.3.1 for ways to address this in paleosols).<br />
Another trace element of interest is Nb, which is a transition metal<br />
that exhibits similar chemical behaviour to V, Ti, <strong>and</strong> Zr, all of which<br />
are typically relatively immobile during weathering. Kurtz et al.<br />
(2000) studied a climosequence of soils developed on Hawaiian<br />
basalts that range in age from 0.3 to 4100 Ka, <strong>and</strong> found that Nb <strong>and</strong> Ta<br />
were essentially completely immobile during weathering whereas<br />
other refractive elements including Zr, Al, Hf, <strong>and</strong> Th all displayed at<br />
least some limited mobility, particularly in the older soils. Because Nb<br />
is more abundant than Ta, it is preferable as an immobile index<br />
element in mass balance calculations (see Section 5.3). Kahmann et al.<br />
(2008) found that Nb was also the least immobile element during<br />
pedogenesis of Mississippian paleosols when compared with a whole<br />
suite of different refractory elements <strong>and</strong> suggested that Nb could be<br />
used as an index element to evaluate gains <strong>and</strong> losses of other elements<br />
during pedogenesis.<br />
5.2.4. Rare earth elements<br />
The rare earth elements (REE) are the lanthanide series elements<br />
(atomic numbers 57–71). The REE have similar atomic radii <strong>and</strong> all<br />
share a trivalent state (though some are divalent <strong>and</strong> monovalent as<br />
well), <strong>and</strong> some are not particularly rare relative to other transition<br />
metals (e.g., Ce; Tyler, 2004). They may be separated according to<br />
mass into light REE (LREE; atomic masses b153: La, Ce, Pr, Nd, Sm, <strong>and</strong><br />
Eu) <strong>and</strong> heavy REE (HREE; atomic masses N153: Gd, Tb, Dy, Ho, Er, Tm,<br />
Yb, <strong>and</strong> Lu). As with the Earth's crust, LREE are typically more abundant<br />
than HREE in soils. REE values are typically normalized <strong>and</strong><br />
reported relative to some common st<strong>and</strong>ard such as the North American<br />
Shale Composite (NASC; Li, 2000) or to chondritic meteorites<br />
(Nakamura, 1974). The solubility of the REE elements is typically low<br />
at near neutral pHs (Li, 2000; see Wimpenny et al., 2007 for discussion<br />
on pH effects on REE <strong>and</strong> platinum group elements), with increasing<br />
solubility resulting from more acidic pHs (Tyler, 2004). Their leaching<br />
behaviour varies according to regional humidity. Extremely humid<br />
climates with acidic soils (Spodosols <strong>and</strong> laterites, e.g., Oxisols) may<br />
be leached of REE more than other elemental constituents (Tyler,<br />
2004), but otherwise, REE tend to accumulate during weathering (e.g.,<br />
Zhang et al., 2007). Also, evidence for leaching of REE in laterites is<br />
equivocal, because a number of studies have found that they actually<br />
accumulate even in those intensely weathered settings (e.g., Walter<br />
et al., 1995; Koppi et al., 1996; Nesbitt <strong>and</strong> Markovics, 1997; Braun<br />
et al., 1998; Hill et al., 2000), suggesting perhaps that podzolization<br />
leaches REE, but not in most cases of lateritization. Kahmann et al.<br />
(2008) also found a strong relationship between clay content <strong>and</strong><br />
trace element <strong>and</strong> REE accumulation even in Histosol-like paleosols<br />
(low pH, low Eh), lending further support to the idea that under most<br />
conditions, REEs will accumulate during pedogenesis. Thus, one<br />
application of REE chemistry to is assess weathering intensity, because<br />
if the formation times are similar, a more intensely weathered soil will<br />
show more enrichment in REE than a less intensely weathered soil (all<br />
other conditions being equal; Sheldon, 2006a). Sheldon (2006a) used<br />
REE data (among other indicators of leaching) to argue that there<br />
was a significant enhancement in chemical weathering across the<br />
Permian–Triassic boundary based on a nearly order of magnitude<br />
increase in abundance in both LREE <strong>and</strong> HREE in earliest Triassic<br />
paleosols as compared with latest Permian paleosols. Another<br />
application of this general principle (i.e., accumulation of REE during<br />
weathering) comes from a basalt-parented chronosequence in which<br />
Zhang et al. (2007) found the following relationship relating ΣREE<br />
(ppm) to formation time:<br />
<br />
<br />
Age 10 4 ΣREE − 105:2<br />
years =<br />
1:082<br />
ð10Þ<br />
where R 2 =0.95 for the empirical relationship. Though this relationship<br />
is probably only applicable to basalt-parented paleosols because<br />
of differences in initial (i.e., parent material) REE concentrations, the<br />
high precision that they report suggests that similar chronofunctions<br />
could be developed for other parent materials as well.<br />
Another potential application of REE geochemistry is as a means<br />
for determining provenance (Table 3). Sheldon (2006a <strong>and</strong> supplemental<br />
data) has proposed that the molecular ratios of Sm/Nd, La/Ce,<br />
<strong>and</strong> Yb/Lu are useful as a means for determining provenance because<br />
the elements in each pair are both relatively abundant in most<br />
potential silicate parent materials <strong>and</strong> because the solubility of all of<br />
the elements is similar. As with the U/Th ratio, under moderate<br />
weathering conditions, constant Sm/Nd, La/Ce, <strong>and</strong> Yb/Lu ratios<br />
would be expected in paleosol profiles when plotted against depth.<br />
Given the similar chemical behaviour of each of those element pairs,<br />
the paleosol value should match the parent material value quite<br />
closely if there are no additional sources of sediment (e.g., aeolian<br />
addition) <strong>and</strong> if they are derived from a common protolith. Thus, by<br />
comparing Sm/Nd, La/Ce, <strong>and</strong> Yb/Lu ratios as a function of paleosol<br />
depth, Sheldon (2006a) confirmed results from Ti/Al ratios that<br />
indicated that although there was a substantial increase in paleosol<br />
<strong>and</strong> sediment maturity across the Permian–Triassic boundary it could<br />
not be attributed to a shift in provenance, <strong>and</strong> was instead due to<br />
enhanced chemical weathering <strong>and</strong> leaching (based on total REE<br />
abundance <strong>and</strong> Ba/Sr ratios). These REE ratios for provenance are<br />
therefore useful both as a check on other provenance indicators <strong>and</strong> as<br />
an independent means for assessing other processes such as aeolian<br />
addition of dust.<br />
A final paleosols REE proxy that has been proposed is to use REE<br />
“fingerprinting” to identify fossil bones associated with particular<br />
paleosol horizons. This was proposed as a means for National Parks to<br />
determine whether or not bones for sale in rock <strong>and</strong> gem shops had been<br />
poached from National Park l<strong>and</strong>s. Trueman (1999) proposed that<br />
because the ionic radii of trivalent REEs are similar to Ca 2+ , they should<br />
be readily incorporated into bone apatite during early diagenesis.<br />
Applying this general principle, Metzger et al. (2004) found that REE<br />
signatures of bones, though highly variable within a site, were<br />
significantly enhanced compared to sites without paleosol formation.<br />
They further found that the greater degree of pedogenesis, the higher<br />
the HREE concentration was within bones, regardless of soil horizon, <strong>and</strong><br />
that fossil bone REE signatures from different depositional environments<br />
<strong>and</strong> different types of paleosols were distinguishable. There is<br />
some overlap in REE values between similar sites <strong>and</strong> similar paleosols,<br />
so while it is probably not possible to “fingerprint” sites to an absolute<br />
Please cite this article as: Sheldon, N.D., Tabor, N.J., <strong>Quantitative</strong> <strong>paleoenvironmental</strong> <strong>and</strong> <strong>paleoclimatic</strong> <strong>reconstruction</strong> using paleosols, Earth-<br />
Science Reviews (2009), doi:10.1016/j.earscirev.2009.03.004
ARTICLE IN PRESS<br />
N.D. Sheldon, N.J. Tabor / Earth-Science Reviews xxx (2009) xxx–xxx<br />
13<br />
certainty, fossils collected from different paleoenvironments including<br />
paleosols should be distinguishable.<br />
In general, the difficulties with applying different REE geochemical<br />
proxies are the same. First, though many REEs may be obtained by<br />
relatively conventional means (XRF or ICP-MS), there is additional<br />
cost relative to major element geochemistry. Second, many potential<br />
soil <strong>and</strong> paleosol parent materials are relatively low in REE prior to<br />
pedogenesis, so only a long formation time or relatively intense<br />
weathering will result in easily decipherable REE patterns. Third,<br />
though elemental ratios show some promise, individual REEs are not<br />
useful because it is the pattern of their distribution both between<br />
samples, <strong>and</strong> relative both to some st<strong>and</strong>ard (NASC or chondrites) <strong>and</strong><br />
to the parent material chemistry.<br />
5.3. Mass-balance calculations<br />
5.3.1. Pedogenesis <strong>and</strong> diagenesis<br />
Many geologic <strong>and</strong> pedogenic processes can be most easily<br />
discussed in terms of which elements are involved in a given process<br />
<strong>and</strong> how their abundance <strong>and</strong> distribution changed as the soil<br />
developed from the protolith. One common method of assessing<br />
gains <strong>and</strong> losses of various elements in soils is through constitutive<br />
mass balance (see Brimhall <strong>and</strong> Dietrich (1987); Chadwick et al.<br />
(1990)). Mass balance calculations have also been used extensively<br />
with paleosols to underst<strong>and</strong> pedogenesis (various, e.g., Driese et al.,<br />
2000, 2007; Bestl<strong>and</strong>, 2002; Sheldon, 2003, 2005; Hamer et al.,<br />
2007b). Mass balance can be reduced to two concepts, strain (ε) ofan<br />
“immobile” element <strong>and</strong> transport (τ) of a second element with<br />
respect to the immobile element. While a more thorough discussion<br />
may be found in any of the original references mentioned above, the<br />
basic concept is that if elements that were immobile during weathering<br />
can be identified then it is possible to assess losses <strong>and</strong> gains of<br />
mobile elements compared to the immobile element. This has in it the<br />
underlying assumption of open system transport, that is, that mass<br />
may be lost or gained by the system. In real terms, the gains <strong>and</strong> losses<br />
of elements could be due to a variety of physical <strong>and</strong> chemical<br />
processes. For example, the loss of a given element could represent<br />
pedogenic processes while the addition of another element could be<br />
from aeolian processes. The open system mass-transport function for<br />
element j in the weathered sample (w) isdefined as follows:<br />
"<br />
τ j; w=<br />
ρ w C #<br />
h i<br />
j;w<br />
e<br />
ρ p C i;w +1 − 1<br />
j;p<br />
ð11Þ<br />
where ρ w is the density of the weathered material, C j,w is the chemical<br />
concentration (weight percentage) of element j in the weathered<br />
material, ρ p is the density of the parent material, <strong>and</strong> C j,p is the<br />
chemical concentration (weight percentage or molar mass) of<br />
element j in the parent material. In many cases, ρ w values must either<br />
be assumed based on modern analogues or adjusted from measured<br />
values to take into account compaction of the paleosol (Eq. (4);<br />
Sheldon <strong>and</strong> Retallack, 2001) after its formation. If τ j,w =0 (i.e.,<br />
element w was immobile), then ε i,w can be solved for separately, thus<br />
bypassing volume (as in the classical definition of strain) as follows:<br />
where ε i,w is the strain on immobile element i in the weathered<br />
sample. Selection of immobile elements is often made on the basis of<br />
theory rather than observations: Ti, Nb, Al, <strong>and</strong> Zr are typically assumed<br />
to be immobile during weathering. However, it is possible to<br />
assess the immobility by comparing the relative mobilities of a<br />
supposedly immobile element assuming that another element is immobile<br />
(Chadwick et al., 1990). For example, one could plot τ Ti,w,ε(Zr)<br />
against ε Zr,w <strong>and</strong> τ Zr,w,ε(Ti) against ε Ti,w to determine which element<br />
was truly immobile during weathering. If more than one element<br />
shows similar immobility, then the usual convention is to use the<br />
more abundant element. Thus, while Nb is immobile in most settings,<br />
if Zr is similarly immobile, it would be the element of choice for the<br />
calculations because it is typically 5+ times as abundant. An<br />
additional consideration with the selection of putatively immobile<br />
elements for use in mass balance calculations is the texture of the<br />
paleosols. For example, Stiles et al. (2003) found lower ε Ti values than<br />
ε Zr values in a modern climosequence, where the Zr resided almost<br />
exclusively within the s<strong>and</strong> <strong>and</strong> coarse-size fractions of the soils while<br />
Ti resided preferentially in smaller size fractions. There was little<br />
chemical weathering of the Zr-bearing zircons evident in SEM as<br />
compared with Ti-bearing minerals, so the lower ε Zr values represent<br />
physical, rather than chemical weathering, <strong>and</strong> preferential removal of<br />
larger grain sizes. Thus, Stiles et al. (2003) advocate using Ti as the<br />
immobile element in clay-dominated soils <strong>and</strong> paleosols <strong>and</strong> Zr as the<br />
immobile element in coarser-grained soils <strong>and</strong> paleosols.<br />
To illustrate some of these concepts, an example using data from<br />
Sheldon (2003) is presented. The middle Miocene Picture Gorge<br />
Subgroup is part of the Columbia River flood basalt province; between<br />
Picture Gorge flows, a variety of paleosols have been preserved<br />
including Alfisol-like (Argillisol) <strong>and</strong> Histosol-like paleosols (Sheldon,<br />
2003). For the Picture Gorge paleosols, Zr was determined to be the<br />
least mobile of the typically immobile elements (Fig. 8; as compared<br />
with Ti <strong>and</strong> Nd). ε Zr values indicate slight addition of Zr, but significant<br />
loss of Ti (τ Ti ). This pattern indicates that Zr is more immobile than Ti<br />
because an element (Zr in this case) that is chemically immobile <strong>and</strong><br />
only redistributed by physical weathering processes should accumulate<br />
during regular pedogenesis. If the plot is reversed (ε Ti versus τ Zr ),<br />
unrealistic addition (200% addition) of both elements is indicated,<br />
because there are virtually no Ti- or Zr-bearing minerals observed in<br />
thin section (Sheldon, 2003, 2006d). Thus, for other mass balance<br />
calculations Zr is used as the immobile element. The gains or losses of<br />
alkali (K, Na, Rb) <strong>and</strong> alkaline earth elements (Ca, Mg, Sr) can then be<br />
calculated <strong>and</strong> plotted as a function of depth for a typical Picture Gorge<br />
paleosol (Fig. 9). Ca <strong>and</strong> Na were lost extensively throughout the<br />
profile with more than 80% of Ca <strong>and</strong> 60% of Na removed relative to<br />
the parental basalt (Fig. 9A), a pattern similar to modern basalts<br />
(Chadwick et al., 1999) <strong>and</strong> other basalt-parented paleosols (Sheldon,<br />
2006c). In contrast, both K <strong>and</strong> Rb were added to the paleosols relative<br />
to the basaltic parent, except deep in the profile (Fig. 9B). Rb addition<br />
is systematically higher than K addition, a pattern that was interpreted<br />
by Sheldon (2003) as indicating airborne addition of volcanic ash from<br />
a local source. Given that both elements have the same chemical<br />
affinities, if the addition of both elements was instead due to metasomatism,<br />
the τ values would be equal (Sheldon, 2003). Plants use K<br />
as an important cellular electrolyte, whereas Rb is not a biologically<br />
important cation, so the difference between the two should represent<br />
"<br />
e i;w =<br />
ρ p C #<br />
j;p<br />
− 1<br />
ρ w C j;w<br />
ð12Þ<br />
Fig. 8. Immobile element determination.<br />
Please cite this article as: Sheldon, N.D., Tabor, N.J., <strong>Quantitative</strong> <strong>paleoenvironmental</strong> <strong>and</strong> <strong>paleoclimatic</strong> <strong>reconstruction</strong> using paleosols, Earth-<br />
Science Reviews (2009), doi:10.1016/j.earscirev.2009.03.004
ARTICLE IN PRESS<br />
14 N.D. Sheldon, N.J. Tabor / Earth-Science Reviews xxx (2009) xxx–xxx<br />
Fig. 9. Mass-balance of major <strong>and</strong> trace elements. Ca <strong>and</strong> Na are lost throughout the profiles, whereas both K <strong>and</strong> Rb were added.<br />
pedogenesis. The equation for delineating pedogenesis from addition<br />
is:<br />
Δ P = τ K − τ Rb<br />
ð13Þ<br />
where Δ P is the change in K due to pedogenesis. Fig. 10 shows Δ P<br />
values as a function of depth in the same paleosol in Fig. 9B. The<br />
adjusted K loss is now similar to that of Na, another alkali element,<br />
which is similar to the pattern observed in modern basalt-parented<br />
soils (Chadwick et al., 1999). Thus, mass balance may be used to<br />
differentiate between different pedogenic processes <strong>and</strong> sources of<br />
elemental additions <strong>and</strong> losses.<br />
The obvious limitation to applying any type of mass balance<br />
calculation is being able to demonstrate that one or more elements<br />
was immobile or nearly immobile during weathering. Because true<br />
immobility is unlikely, the relative degree of immobility is important.<br />
ε i,w values of ±0.4 indicate limited mobility, but ideally, unless<br />
there is a strong basis for inferring addition or removal by physical<br />
weathering processes, values closer to 0 are preferable. For example,<br />
when volcanic rocks weather, many of the mafic minerals (e.g.,<br />
olivine, pyroxene, plagioclase feldspar) chemically weather readily<br />
under most pH conditions, whereas rutile (TiO 2 ) will only be removed<br />
by physical weathering except at very acidic pH conditions.<br />
Thus, addition of Ti 4+ is unsurprising in that case <strong>and</strong> the relative<br />
degree of enrichment will in fact be tracking pedogenesis, <strong>and</strong> at<br />
least indirectly, giving weathering intensity. If on the other h<strong>and</strong> ε Ti,w<br />
is less than 0 in the same setting, that suggests that some erosion of<br />
the paleosol has taken place or that there has been downprofile<br />
translocation of the Ti-bearing minerals. Distinguishing between<br />
those processes is key to underst<strong>and</strong>ing how that paleosol<br />
developed. Therefore, care is needed in selecting <strong>and</strong> testing<br />
“immobile” elements to ensure that they truly represent pedogenic<br />
immobility.<br />
The other factor that is important in considering mass balance<br />
results is the role that formation time plays. Short duration, intense<br />
weathering may result in similar elemental gains <strong>and</strong> losses as long<br />
duration, low intensity weathering. Tightly constraining formation<br />
times for paleosols, in particular for pre-Quaternary paleosols, is very<br />
difficult, though a few methods have been proposed that are independent<br />
of chemical composition (cf. Sections 5.2.3–5.2.4; Birkel<strong>and</strong>,<br />
1999; Retallack, 2001a,b; Sheldon, 2003; Retallack, 2005b). For<br />
example, Sheldon (2003) used data from Markewich et al. (1990) to<br />
propose the following relationship relating formation time (T f in<br />
years) to Bt horizon thickness (T Bt ):<br />
where R 2 =0.87, no error function was calculated because the relation<br />
falls apart for very long-formation times. Retallack (2005b) did<br />
something similar for Bk horizons where he found a relationship<br />
between soil age (A in Ka) <strong>and</strong> nodule size (S in cm):<br />
A = 3:92S 0:34<br />
ð15Þ<br />
where R 2 =0.57 <strong>and</strong> the st<strong>and</strong>ard error is 1.8 Ka. While these<br />
chronofunctions hold some promise for paleosols with either Bt or<br />
Bk horizons, they are both based on relatively few data (n=10 for<br />
Sheldon, 2003; n=9 for Retallack, 2005b) <strong>and</strong> many soil/paleosols<br />
types lack those particular horizons. Semi-quantitative relationships<br />
discussed in Birkel<strong>and</strong> (1999) also offer some promise for at least<br />
making appropriate order-of-magnitude age estimates, but significantly<br />
more work is needed in this area.<br />
5.3.2. Precambrian atmospheric CO 2 from mass balance<br />
Because Precambrian paleosols formed at the Earth's surface, in<br />
direct contact with the atmosphere at the time of their formation, they<br />
are considered to be one the best lines of evidence for determining the<br />
composition of the Precambrian atmosphere (e.g., Zbinden et al.,<br />
1988; Holl<strong>and</strong> <strong>and</strong> Zbinden, 1988; Rye et al., 1995; Rye <strong>and</strong> Holl<strong>and</strong>,<br />
1998; Retallack, 2001b; Sheldon, 2006b). The three gases of primary<br />
interest are CO 2 <strong>and</strong> CH 4 (Pavlov et al., 2000, 2003) as greenhouse<br />
gases that allowed the Earth to overcome the “faint young Sun”<br />
paradox (Kasting, 1993) early in its history, <strong>and</strong> O 2 , because there is<br />
T f<br />
= 17:07 ðT Bt Þ 2 + 645:8 ðT Bt Þ ð14Þ<br />
Fig. 10. True K mass balance.<br />
Please cite this article as: Sheldon, N.D., Tabor, N.J., <strong>Quantitative</strong> <strong>paleoenvironmental</strong> <strong>and</strong> <strong>paleoclimatic</strong> <strong>reconstruction</strong> using paleosols, Earth-<br />
Science Reviews (2009), doi:10.1016/j.earscirev.2009.03.004
ARTICLE IN PRESS<br />
N.D. Sheldon, N.J. Tabor / Earth-Science Reviews xxx (2009) xxx–xxx<br />
15<br />
extensive evidence to suggest that O 2 levels increased substantially at<br />
~2.3 Ga ago (various; Bekker et al., 2004 <strong>and</strong> references therein).<br />
Underst<strong>and</strong>ing the “faint young Sun” paradox is one of the fundamental<br />
questions in Earth Sciences, because with significantly reduced<br />
solar insolation, the Earth should have been completely glaciated if<br />
there was not significantly higher levels of greenhouse forcing than at<br />
present (Kasting, 1993).<br />
As will be discussed further below in Section 6.2, one of the<br />
difficulties of reconstructing CO 2 <strong>and</strong> CH 4 levels is to divorce the<br />
method from assumptions about precisely what level of oxygen was<br />
present. For example, Holl<strong>and</strong> <strong>and</strong> Zbinden (1988) discuss a method<br />
that looks at the balance between O 2 <strong>and</strong> CO 2 as indicated by<br />
weathering processes in a ~1.1 Ga old paleosol in the form of a ratio<br />
between CO 2 <strong>and</strong> O 2 consumption. Of potentially wider applicability<br />
is a method for calculating CO 2 levels that is independent of<br />
any assumptions about the atmospheric O 2 level. Sheldon (2006b)<br />
presented such a model based on mass-balance calculations (see<br />
Section 5.3.1) of silicate weathering that related elemental weathering<br />
to atmospheric CO 2 levels.<br />
During silicate weathering, total CO 2 consumption can be approximated<br />
by the following reactions:<br />
MgO þ 2CO 2 þ H 2 O→Mg 2þ þ 2HCO − 3<br />
CaO þ 2CO 2 þ H 2 O→Ca 2þ þ 2HCO − 3<br />
Na 2 O þ 2CO 2 þ H 2 O→2Na þ þ 2HCO − 3<br />
K 2 O þ 2CO 2 þ H 2 O→2K þ þ 2HCO − 3<br />
ð16Þ<br />
ð17Þ<br />
ð18Þ<br />
ð19Þ<br />
where, for example, each mole of base cation (e.g., MgO) liberated<br />
requires two moles of CO 2 (e.g., Holl<strong>and</strong> <strong>and</strong> Zbinden, 1988). Although<br />
other elements are weathered, with few exceptions (e.g., a quartz<br />
arenite) the parent rock concentration of the bases in reactions (17–<br />
20) are at least 1–2 orders of magnitude larger than any other mobile<br />
element. Because K may be remobilized metasomatically <strong>and</strong> accumulated<br />
in paleosols after burial (e.g., Maynard, 1992), it has to be<br />
dealt with differently than Ca, Mg, <strong>and</strong> Na, typically by assuming that K<br />
mass transfer values should be equal to Na mass transfer values or<br />
potentially, by using Eq. (14).<br />
Mass transfer values (Eq. (12)) for each of those individual cations<br />
can be transformed into mass fluxes as follows:<br />
<br />
m j;flux gcm − 2<br />
= ρ p<br />
C j;p<br />
100<br />
Z = D<br />
Z j;w<br />
Z =0<br />
τ j;w ðÞ z dZ<br />
ð20Þ<br />
where Z is the depth in the soil profile <strong>and</strong> D j,w is the total depth of the<br />
profile (e.g., Chadwick et al., 1990). Given that many Precambrian<br />
paleosols have been deeply buried <strong>and</strong> show evidence of significant<br />
compaction (e.g., Retallack, 1986 showed ptygmatically folded quartz<br />
dikes), it is necessary to decompact the paleosols to their original<br />
thickness D j,w using Eq. (4). After the compaction-corrected mass<br />
fluxes are calculated for each individual base cation <strong>and</strong> coverted to<br />
moles, because 2 mol of CO 2 are required to liberate each mole of base<br />
cation (Eqs. 17–20) the total flux of CO 2 required for the observed<br />
weathering (M) is given by:<br />
<br />
<br />
M mols CO 2 cm − 2 =2 X m j; flux ð21Þ<br />
Soils do not form instantaneously, so to calculate a true flux value,<br />
M must be divided by time (T). With limited biological productivity as<br />
in the Precambrian, the time-averaged flux (M/T) is a product of two<br />
distinct sources of CO 2 ,CO 2 in the atmosphere being added by rainfall<br />
to the soils (X rain ), <strong>and</strong> CO 2 added by direct diffusion into the soils<br />
(X diff ). Holl<strong>and</strong> <strong>and</strong> Zbinden (1988) quantified X rain <strong>and</strong> X diff as<br />
follows:<br />
M<br />
<br />
T mol cm − 2 yr − 1<br />
K CO2 r<br />
= X rain + X diff ≈pCO 2 + κ D <br />
CO 2<br />
α<br />
10 3 L<br />
ð22Þ<br />
where pCO 2 is the partial pressure of atmospheric CO 2 (atm), K CO2 is<br />
the Henry's Law constant for CO 2 , r is rainfall rate (cm yr − 1 ), D CO2 is<br />
the diffusion constant for CO 2 in air (0.162 cm 2 s − 1 ; CRC H<strong>and</strong>book),<br />
α is the ratio of diffusion constant for CO 2 in soil divided by the<br />
diffusion constant for CO 2 in air (discussed below), L is the depth to<br />
the water table, <strong>and</strong> κ is a constant which is the ratio of seconds in a<br />
year divided by the number of cm 3 per mol of gas at st<strong>and</strong>ard<br />
temperature <strong>and</strong> pressure (1.43×10 3 (s cm 3 )/(mol year)). There is no<br />
explicit term including any CO 2 processes involving a terrestrial<br />
biosphere (i.e., it is assumed to play a negligible role), a point that was<br />
further discussed by Sheldon (2006b), but which is a reasonable<br />
simplifying assumption (however, see Yapp <strong>and</strong> Poths, 1993). Eq. (23)<br />
also assumes that the CO 2 diffusion constant <strong>and</strong> gradient are constant<br />
with depth, <strong>and</strong> that the partial pressure of atmospheric CO 2 is much<br />
larger than the partial pressure of CO 2 at the water table (depth=L).<br />
Eq. (23) can be rearranged to solve for atmospheric pCO 2 as follows:<br />
M<br />
pCO 2 = h i<br />
T K CO r 2<br />
+ κ D ð23Þ<br />
CO α 2<br />
10 3 L<br />
Thus, by quantifying M using direct measurements of paleosol mass<br />
balance <strong>and</strong> estimating T <strong>and</strong> L, it is possible to calculate the partial<br />
pressure of atmospheric CO 2 at the time the paleosols formed. Sheldon<br />
(2006b <strong>and</strong> supplemental materials) discusses the uncertainties in the<br />
model assumptions, but in general, only T is poorly constrained <strong>and</strong><br />
makes a significant (N10%) difference to the calculated pCO 2 value.<br />
Among the results of applying this mass-balance paleobarometer<br />
were that the pCO 2 value ~2.2 Ga ago was 23 ×3<br />
3 times present<br />
atmospheric levels (PAL), an amount insufficient to overcome the<br />
“faint young Sun” paradox at that time, that similar pCO 2 values<br />
persisted until at least 1.8 Ga ago, <strong>and</strong> that much lower pCO 2 values<br />
were present by 1.1 Ga ago (Sheldon, 2006b). Each of those<br />
conclusions was based on analysis of multiple contemporaneous or<br />
near-contemporaneous paleosols. The finding that pCO 2 levels at<br />
~2.2 Ga ago were insufficient to overcome the “faint young Sun”<br />
paradox is further supported by atmospheric modeling results (Pavlov<br />
et al., 2000, 2003), which also suggest the need for an additional<br />
greenhouse gas such as CH 4 . The third conclusion, of relatively low<br />
pCO 2 levels (b10 PAL) ~1.1 Ga ago is also supported by recent results<br />
from a completely independent proxy, a paleobarometer derived from<br />
calcified cyanobacteria (Kah <strong>and</strong> Riding, 2007). Thus, if a reasonable<br />
estimate for T may be made, then this method appears to be very<br />
useful for estimating Precambrian pCO 2 .<br />
5.4. Paleotemperature<br />
In addition to isotopic paleothermometers (see Section 7 below),<br />
there have been recent attempts to develop paleothermometry based<br />
on empirical relationships relating mean annual temperature (MAT)<br />
to the geochemical composition of modern soils. Using data from<br />
Marbut (1935) <strong>and</strong> modern measurements of MAT, Sheldon et al.<br />
(2002) proposed the following relationship between MAT <strong>and</strong><br />
salinization of a Bw or Bt horizon (Table 3):<br />
Tð ○ CÞ = − 18:5S +17:3 ð24Þ<br />
Please cite this article as: Sheldon, N.D., Tabor, N.J., <strong>Quantitative</strong> <strong>paleoenvironmental</strong> <strong>and</strong> <strong>paleoclimatic</strong> <strong>reconstruction</strong> using paleosols, Earth-<br />
Science Reviews (2009), doi:10.1016/j.earscirev.2009.03.004
ARTICLE IN PRESS<br />
16 N.D. Sheldon, N.J. Tabor / Earth-Science Reviews xxx (2009) xxx–xxx<br />
where the st<strong>and</strong>ard error (SE) is ±4.4°C, S is salinization (Table 3),<br />
<strong>and</strong> R 2 =0.37 for the empirical fit. The underlying principle is that<br />
alkali elements (K <strong>and</strong> Na) are typically accumulated in desert<br />
settings, which usually have relatively low MAT (even if they are<br />
seasonally or daily high). Thus, paleosols with high salinization ratios<br />
should have low MAT values. The relationship is applicable to lowl<strong>and</strong><br />
settings <strong>and</strong> moderate soil formation times (b100 Ka). It is not<br />
applicable to hillslope, montane, wetl<strong>and</strong>, or tropical (e.g., laterites)<br />
paleosols (Sheldon et al., 2002). A second Inceptisol-specific (~Protosol)<br />
relationship between MAT <strong>and</strong> “clayeyness” (Al/Si; Table 3) of<br />
the Bw or Bt horizon has also been proposed:<br />
Tð ○ CÞ =46:9C +4 ð25Þ<br />
where the SE is ±0.6 °C, C is clayeyness (Table 3), <strong>and</strong> R 2 =0.96<br />
(Sheldon, 2006c) for the empirical fit. Though Eq. (24) is relatively<br />
imprecise, the relationship is highly significant (t-test=8.5154,<br />
F-test = 72.58) <strong>and</strong> when applied to appropriate paleosols, gives<br />
results that are consistent with paleotemperature estimates based<br />
on leaf-margin <strong>and</strong> nearest living relative estimates from plants<br />
(Sheldon et al., 2002; Sheldon <strong>and</strong> Retallack, 2004; Sheldon, 2009). It<br />
has been applied to Cenozoic (Sheldon et al., 2002; Sheldon <strong>and</strong><br />
Retallack, 2004; Hamer et al., 2007b), Mesozoic (Retallack, 2005a),<br />
<strong>and</strong> Paleozoic (Sheldon, 2005) paleosols. The more precise Inceptisol-only<br />
Eq. (25) is potentially applicable over a wider range of<br />
estimated paleotemperatures, though Inceptisol-like paleosols are<br />
typically rare at very high or very low MATconditions. Nonetheless, it<br />
also gives paleotemperature results that are consistent with independent<br />
estimates based on fossil floras <strong>and</strong> faunas (Hamer et al.,<br />
2007a). The Inceptisol paleothermometer has been applied to<br />
Quaternary paleosols from Hawai'i (Sheldon, 2006c), Miocene<br />
paleosols (Hamer et al., 2007a), <strong>and</strong> Eocene–Oligocene transition<br />
paleosols (Sheldon, 2009). The primary weakness of both elementbased<br />
paleothermometers is that a variety of processes, including<br />
some not related to temperature, may alter chemical composition, so<br />
care is needed not to overinterpret results based solely on these<br />
approaches. As with many of the proxies that we are discussing, if<br />
possible, results should be verified using multiple proxies.<br />
5.5. Paleoprecipitation<br />
A variety of different quantitative proxies have been developed for<br />
estimating mean annual precipitation (MAP). Water availability is one of<br />
the key factors in determining the relative effectiveness of many<br />
pedogenic processes. For example, leaching of base cations is limited in<br />
arid settings (Retallack, 2001b) <strong>and</strong> enhanced in humid settings (e.g.,<br />
Sayyed <strong>and</strong> Hundekari, 2006). A variety of different paleoprecipitation<br />
proxies have been developed, all based on empirical relationships derived<br />
from modern soils. Each of the proxies that we will discuss is based on the<br />
properties of a single horizon or soil feature, so which proxy is most<br />
appropriate for a given setting will depend on what type of paleosol is<br />
being analyzed. Examples to be discussed include proxies based the iron<br />
content of Mn nodules in Vertisols, the depth to a Bk horizon below a<br />
paleosol surface, <strong>and</strong> the chemical composition of a Bw/Bt horizon.<br />
5.5.1. Content of Fe–Mn nodules in vertisols<br />
Stiles et al. (2001) studied a modern climosequence developed on<br />
the Texas Gulf Coastal Plain. Most of the soils there are Vertisols forming<br />
under modern MAP ranging from 800 to 1500 mm yr −1 (Stiles et al.,<br />
2001). They also observed that Fe–Mn nodules were common in the soils<br />
<strong>and</strong> hypothesized that the iron content corresponds to mean annual<br />
precipitation values (Fe TOT as a whole number % value, i.e., 20, not 0.2):<br />
<br />
P mm yr − 1<br />
= 654:4 + 31:5 Fe TOT ð26Þ<br />
where R 2 =0.92 for the empirical relationship (Stiles et al., 2001).<br />
They then applied the relationship to Fe–Mn nodules in Paleozoic<br />
paleosols, yielding inferred moisture regime results that correspond<br />
well with field characteristics of the paleosols <strong>and</strong> with qualitative<br />
observations based on comparisons to modern analogues. Stiles et al.<br />
(2001) did not find that their results correspond well to estimates<br />
based on depth to the Bk horizon (see Section 5.5.2) <strong>and</strong> found the Bk<br />
depth generally underestimated the modern known precipitation<br />
values. This method seems to be viable for paleo-Vertisols, however, it<br />
is unclear how common authigenic Fe–Mn nodules are given that<br />
there are relatively few reported occurrences (see references in Stiles<br />
et al., 2001), so its applicability may be somewhat limited.<br />
5.5.2. Depth to Bk horizon<br />
CaCO 3 is highly soluble <strong>and</strong> both Ca 2+ <strong>and</strong> CO 3 2− /HCO 3 − are readily<br />
mobilizedbothingroundwater<strong>and</strong>insoilsolutions,sothepresenceof<br />
CaCO 3 in a soil or paleosol indicates at least some degree of aridity<br />
(perhaps just seasonally), because under wetter conditions carbonate<br />
would not be stable or form authigenically. Jenny <strong>and</strong> Leonard (1935) <strong>and</strong><br />
Jenny (1941) first recognized that there was a relationship between the<br />
depth below the surface of modern soils to their Bk horizon (carbonatebearing)<br />
<strong>and</strong> MAP in Great Plains soils. Arkley (1963) further exp<strong>and</strong>ed<br />
observations of the relationship by considering more arid Mojave Desert<br />
settings <strong>and</strong> found the same relationship. Retallack (1994) combined<br />
Jenny's (1941) <strong>and</strong> Arkley's (1963) data <strong>and</strong> other literature data (n=317<br />
in total) <strong>and</strong> fit a regression line to it that related depth to the Bk horizon to<br />
MAP. That relationship was widely applied to paleosols ranging in age<br />
from Paleozoic to the Quaternary (e.g., examples in Retallack et al., 2000;<br />
Retallack, 2001b). Factors to consider before applying the relationship to<br />
paleosols include erosion of the paleosols prior to burial, post-burial<br />
compaction, <strong>and</strong> the effect of elevated atmospheric CO 2 levels (models of<br />
Bk horizon formation suggest that they will form deeper in the profile at<br />
significantly elevated CO 2 levels; McFadden et al., 1991). Erosion may be<br />
dealt with through careful stratigraphy <strong>and</strong> consistent application of the<br />
proxy (e.g., tops of soils are always measured from the surface that the<br />
highest root traces emanate down from). Compaction may be dealt with<br />
as described above (see Section 2.2.1). There are many means of<br />
reconstructing past CO 2 levels including using isotopic data from paleosols<br />
(see Section 7.4.3.1). In general though, this is only a concern for<br />
Ordovician–Silurian <strong>and</strong> Jurassic–Cretaceous paleosols (e.g., Berner <strong>and</strong><br />
Kothavala, 2001), <strong>and</strong> for some Precambrian paleosols (Sheldon, 2006b).<br />
Royer (1999) questioned whether the proxy worked by looking at<br />
1168 Bk-bearing soils from the NRCS database <strong>and</strong> finding only a weak<br />
relationship between Bk depth <strong>and</strong> MAP. He proposed a simpler test,<br />
namely that soils receiving less than 760 mm yr− 1 would be Bk-bearing<br />
<strong>and</strong> those receiving more than 760 mm yr −1 would not have Bk horizons.<br />
Retallack (2000) pointed out a number of issues in Royer (1999) that<br />
merit reconsideration of those findings. The soils used in Retallack's<br />
(1994) study were tightly constrained to have similar characteristics (e.g.,<br />
horizonation, age, degree of development), a factor ignored by Royer<br />
(1999), who simply used presence/absence of a Bk horizon as his sole<br />
criterion. For example, according to Retallack (1994), the relationship<br />
only applies to moderately developed soils (i.e., with carbonate nodules,<br />
not wisps or caliche layers) formed on unconsolidated parent material<br />
(e.g., alluvium or loess) in lowl<strong>and</strong> settings, <strong>and</strong> which were undisturbed<br />
by human activity. Hundreds of Royer's (1999) soils did not conform to<br />
one or more of these criteria, so it is unsurprising that he did not find the<br />
same relationship. Royer's (1999) second result (a Bk-horizon isohyet at<br />
760 mm yr −1 ) probably also gives only weak guidance because the Bkbearing/Bk-free<br />
isohyet is at different precipitation values in many<br />
modern settings on different continents (Retallack, 2000). Nonetheless,<br />
in part due to that criticism, Retallack (2005b) substantially exp<strong>and</strong>ed his<br />
database to include 807 soils with a slightly revised relationship:<br />
<br />
P mm yr − 1 = − 0:013D 2 +6:45D + 137:2 ð27Þ<br />
Please cite this article as: Sheldon, N.D., Tabor, N.J., <strong>Quantitative</strong> <strong>paleoenvironmental</strong> <strong>and</strong> <strong>paleoclimatic</strong> <strong>reconstruction</strong> using paleosols, Earth-<br />
Science Reviews (2009), doi:10.1016/j.earscirev.2009.03.004
ARTICLE IN PRESS<br />
N.D. Sheldon, N.J. Tabor / Earth-Science Reviews xxx (2009) xxx–xxx<br />
17<br />
where the SE is ±147 mm yr − 1 , <strong>and</strong> R 2 =0.52 for the empirical<br />
relationship. Using a subset (n=675) of the newly compiled database,<br />
Retallack (2005b) also defined the following relationship for mean<br />
annual range of precipitation (MARP):<br />
MARP = 0:79T +13:7<br />
ð28Þ<br />
where the SE is ±22 mm yr − 1 , R 2 =0.58 for the empirical relationship,<br />
<strong>and</strong> where T is the thickness the paleosol with carbonate nodules<br />
(i.e., Bk horizon thickness; in cm). Application of this new MAP<br />
relationship gives results comparable to estimates from B horizon<br />
geochemistry (see Section 5.5.3) <strong>and</strong> paleobotanical results where the<br />
paleosols conform to all of the criterial listed above (Retallack, 2007;<br />
Sheldon, 2009). However, it should be noted that there are some<br />
modern soil orders that are still not represented within the modern<br />
soil proxy data set. For example, Nordt et al. (2006) point out that<br />
there are essentially no Vertisols in the dataset <strong>and</strong> that no data exists<br />
to quantify the differences in Bk depth between micro-highs <strong>and</strong><br />
micro-lows in Vertisols, an important consideration given cm- to dmscale<br />
micro-relief in most Vertisols. Furthermore, Vertisols (which<br />
often form in strongly seasonal or monsoonal climates) often preserve<br />
dispersed carbonate throughout the profile. Nordt et al. (2006) found<br />
that equation of Retallack (1994) was poor at predicting MAP in a<br />
modern Vertisol climosequence when microhighs were used <strong>and</strong><br />
somewhat effective when microlows were used (though only to Bk<br />
depths of 117 cm or less), but that a different equation fit their data<br />
better <strong>and</strong> that Retallack's (1994) equation systematically underestimated<br />
MAP. For a given soil/paleosol, the predicted MAP using<br />
Eq. (27) is not substantially different than Retallack's (1994) earlier fit<br />
to the data, which suggests that Eq. (27) is not useful for paleo-<br />
Vertisols either. Thus, though Eq. (27) is potentially very broadly<br />
applicable, care must be taken to use it only with appropriate paleosols<br />
types (i.e., not Vertisols), parent material textures (alluvium or loess),<br />
<strong>and</strong> with an underst<strong>and</strong>ing of the geologic age, setting (lowl<strong>and</strong>s), <strong>and</strong><br />
burial history (i.e., decompacted values) of the paleosols.<br />
5.5.3. Bw/Bt horizon geochemistry<br />
During weathering of silicate rocks, minerals such as feldspars are<br />
broken down to form clay minerals by hydrolysis <strong>and</strong> acid attack<br />
reactions (see Section 5.2.2). Water availability is one of the key<br />
controls on the rate of these reactions, so given the same amount of<br />
time, more clay should be formed under a wetter climatic regime than<br />
a dry one (Birkel<strong>and</strong>, 1999; Retallack, 2001b). Thus, Sheldon et al.<br />
(2002) used the soil database of Marbut (1935) <strong>and</strong> modern measurements<br />
of MAP to propose the following relationship between CIA-<br />
K of Bw <strong>and</strong> Bt horizons (Eq. (6); Maynard, 1992) <strong>and</strong> MAP:<br />
<br />
P mm yr − 1<br />
0:0197 CIA−K<br />
= 221:1e ð Þ ð29Þ<br />
where the SE is ±181 mm yr −1 , <strong>and</strong> R 2 =0.72 for the empirical fit.<br />
They also proposed two other proxies for MAP, one based on ΣBases/<br />
Al for the Bw or Bt horizons (Table 3):<br />
<br />
<br />
P mm yr − 1 = − 259:3Ln ΣBases <br />
+ 759 ð30Þ<br />
Al<br />
where the SE ±235 mm yr − 1 , <strong>and</strong> R 2 =0.66 for the empirical relationship.<br />
The other is a Mollisol-specific MAP relationship where:<br />
<br />
P mm yr − 1 = − 130:9LnðCÞ + 467<br />
ð31Þ<br />
where the SE is ±156 mm yr − 1 , C is the molar ratio Ca/Al of the B<br />
horizon, <strong>and</strong> R 2 =0.59 for the empirical relationship.<br />
Bw <strong>and</strong> Bt horizons are used because: 1) they form over long<br />
periods of time, making their chemical composition a function of<br />
equilibrium processes rather than kinetic ones; 2) long formation<br />
times also ensure that short-term climatic volatility (e.g., El Niño)<br />
does not overprint the long-term conditions; 3) there should be a<br />
clear difference between the parent material weathering ratio value<br />
<strong>and</strong> the B horizon value if the proxy is applicable (e.g., for CIA-K, there<br />
should be at least a 5–8 unit difference), <strong>and</strong> if the values are very<br />
close, then the proxy is not applicable. Though the original database of<br />
Marbut (1935) had a wide range of soil types in it, the relationships<br />
are not considered applicable for paleosols with near surface<br />
carbonates or evaporite minerals, for hillslope or montane settings,<br />
or for laterites (Sheldon et al., 2002). Eqs. (29) <strong>and</strong> (30) are both<br />
useful over a range of precipitation values between 200 <strong>and</strong> 1600 mm<br />
yr − 1 . For example, a CIA-K value of 100 (e.g., pure kaolinite) gives a<br />
MAP estimate of 1585 mm yr − 1 , <strong>and</strong> a CIA-K value of 0 (i.e., no<br />
Al present at all) gives a MAP estimate of 221 mm yr −1 . For paleosols<br />
with very well-developed Bk horizons, Eq. (30) is favoured over Eq. (30)<br />
because it gives more consistent results when applied to modern soils;<br />
for other types of paleosols Eq. (29) is preferred both because it is more<br />
precise <strong>and</strong> more accurate.<br />
Eq. (29) has been widely applied to paleosols of a wide range of<br />
ages including Paleozoic (e.g., Driese <strong>and</strong> Ober, 2005; Driese et al.,<br />
2005; Sheldon, 2005) <strong>and</strong> Mesozoic (e.g., Prochnow et al., 2006)<br />
paleosols, <strong>and</strong> has proven particularly useful for Cenozoic (e.g., Hamer<br />
et al., 2007a,b; Kraus <strong>and</strong> Riggins, 2007; Retallack, 2007; Sheldon,<br />
2009; Sheldon et al., 2009) paleosols where diagenesis can be discounted<br />
more easily than for the older paleosols. Two separate lines of<br />
evidence suggest that Eq. (29) is a particularly useful proxy for MAP.<br />
The first is that it produces MAP estimates that are consistent with<br />
independent paleobotanical estimates based on leaf-margin analysis<br />
(Sheldon et al., 2002; Sheldon <strong>and</strong> Retallack, 2004; Retallack et al.,<br />
2004a; Retallack, 2007; Sheldon, 2009) <strong>and</strong> nearest-living relatives<br />
(Retallack et al., 2004a,b; Hamer et al., 2007a,b; Sheldon et al., 2009).<br />
The second is that it generally successfully predicts modern,<br />
measurable MAP in soil climosequences (Driese et al., 2005; Nordt<br />
et al., 2006), even for soil types (i.e., Vertisols) that are not represented<br />
by many soils in the original Marbut (1935) database. For arid<br />
<strong>and</strong> semi-arid settings, it also gives results that are consistent within<br />
error of estimates based on Bk horizon depths (e.g., Sheldon<br />
<strong>and</strong> Retallack, 2004), though typically gives systematically slightly<br />
“wetter” results.<br />
In general, Eq. (29) is the most well-supported proxy for MAP<br />
based on paleosols, however, it must be carefully applied according to<br />
the criteria listed above <strong>and</strong> wherever possible, multiple proxies (e.g.,<br />
Bk depth or paleobotanical estimates) should also be used to confirm<br />
the results. Another important consideration is to be sure that high<br />
CIA-K values are not simply due to inheritance from chemically<br />
mature parent materials. Thus, a useful guideline based on observations<br />
from the original Marbut (1935) database is that there should be<br />
at least a 5–8 unit difference in CIA-K values between the paleosol's<br />
parent material value <strong>and</strong> its B horizon value depending on the field<br />
taxonomic description of the paleosol (at least 5 units for weakly to<br />
moderately developed Orders, N5 units for moderately to strongly<br />
developed Orders). One final consideration is the role that topography<br />
may play in limiting the applicability of Eq. (29). Rasmussen <strong>and</strong> Tabor<br />
(2007) show a generally poor correspondence between CIA-K <strong>and</strong><br />
MAP for some parent materials (though good for others) along<br />
transects of increasing elevation in the Sierra Nevadas. Sheldon et al.<br />
(2002) specifically limited the applicability of Eq. (29) to lowl<strong>and</strong><br />
settings. The results of Rasmussen <strong>and</strong> Tabor (2007) confirm this <strong>and</strong><br />
serve as a good reminder that proxies should be applied carefully in<br />
settings for which they were not defined.<br />
5.6. Long-term chemical weathering<br />
Another potential application of whole rock geochemistry is to<br />
quantify long-term change in chemical weathering. In many continental<br />
basins, long sequences of paleosols spanning many millions of<br />
Please cite this article as: Sheldon, N.D., Tabor, N.J., <strong>Quantitative</strong> <strong>paleoenvironmental</strong> <strong>and</strong> <strong>paleoclimatic</strong> <strong>reconstruction</strong> using paleosols, Earth-<br />
Science Reviews (2009), doi:10.1016/j.earscirev.2009.03.004
ARTICLE IN PRESS<br />
18 N.D. Sheldon, N.J. Tabor / Earth-Science Reviews xxx (2009) xxx–xxx<br />
Fig. 11. Quantifying long-term chemical weathering. The values of ΔW shown are based<br />
on the 3-pt. running average of 54 chemical analyses collected from a ~250 m section.<br />
The level of the Eocene–Oligocene transition is known from mammalian<br />
biostratigraphy.<br />
years are preserved (e.g., Sheldon <strong>and</strong> Retallack, 2004; Prochnow<br />
et al., 2006; Retallack, 2007; Sheldon, 2009). By using the same<br />
weathering ratio, measured from the same horizon in comparably<br />
developed paleosols (e.g., all Alfisol-like paleosols), it is possible to<br />
characterize changes in the chemical weathering environment. A new<br />
parameter ΔW can be derived as follows using CIA (Eq. (5)) as the<br />
weathering index:<br />
ΔW = CIA x − μ CIA<br />
ð32Þ<br />
where ΔW is the deviation in weathering for a given paleosol (CIA x )<br />
relative to the mean degree of weathering for the whole sequence<br />
(μ CIA ). Fig. 11 shows how ΔW changed across the Eocene–Oligocene<br />
transition for a relatively poorly dated section in the Ebro Basin<br />
(Spain). Ongoing work by L. Cabrera, M. Garces, <strong>and</strong> E. Diaz will refine<br />
the chronology using magnetostratigraphy, but the level of the<br />
Eocene–Oligocene transition is already know from mammalian biostratigraphy<br />
(L. Cabrera, pers. comm.). Though the record is variable<br />
through time, it is nonetheless clear that there was a significant<br />
decline in chemical weathering across the Eocene–Oligocene transition<br />
(Sheldon, 2009). The mean Eocene value of ΔW is +2.82 for<br />
Eocene, whereas it is –3.60 for the Oligocene. Given that μ CIA is 14.2 for<br />
that whole section, those ΔW changes represent a shift from about<br />
20% enhanced weathering to –25% reduced weathering across the<br />
boundary; a very substantial change in chemical weathering. Similar<br />
results obtained using the same method on North American Eocene–<br />
Oligocene transition paleosols were reported by Sheldon <strong>and</strong> Retallack<br />
(2007). Thus, this approach may be a very powerful tool for evaluating<br />
changes in pedogenesis, weathering, <strong>and</strong> climate in Earth's past. By<br />
using ΔW rather than CIA x values, it is possible to obviate over-reliance<br />
on single data points <strong>and</strong> also to determine which CIA x values represent<br />
outliers to the pedogenic history of an area, <strong>and</strong> also removes<br />
one of the potential weaknesses of the approach, namely uncertainties<br />
about which pedogenic processes were responsible for changes to<br />
single elements.<br />
6. Thermodynamic approaches<br />
6.1. Simple versus complex systems<br />
Reconstruction of <strong>paleoenvironmental</strong> <strong>and</strong> <strong>paleoclimatic</strong> conditions<br />
using thermodynamic modeling is a relatively recently developed<br />
quantitative tool for studying paleosols with approaches ranging<br />
from simple single equation models (e.g., Rye et al., 1995; Hessler<br />
et al., 2004) to complicated multi-equation models designed to<br />
simulate as many pedogenic processes as possible (Sheldon, 2006d).<br />
The primary weakness of all of the thermodynamic models employed<br />
to date is that they have not considered reaction kinetics, instead<br />
relying on simplifying assumptions to account for kinetic effects. For<br />
example, Sheldon (2006d) used a computer model to suppress quartz<br />
formation during his model runs of paleosol formation because at low<br />
temperatures (e.g., Earth's surface conditions), quartz formation is<br />
very slow <strong>and</strong> most silica instead is present as amorphous silica or<br />
chalcedony (Pal<strong>and</strong>ri <strong>and</strong> Reed, 2001). Including kinetics is the next<br />
logical step, but represents a fairly substantial increase in model<br />
complexity.<br />
So far, thermodynamic models have been used primarily to try to<br />
reconstruct paleo-atmospheric conditions. Specifically, they have<br />
been used to try to model Precambrian atmospheric conditions (Rye<br />
et al., 1995; Hessler et al., 2004; Ohmoto et al., 2004) at the time that a<br />
given sedimentary deposit or paleosol was formed. Though the<br />
limitations of the existing models will form the primary basis of<br />
this review, the general approach has merit <strong>and</strong> has been relatively<br />
underutilized. In particular, the multiple equation approach, when<br />
coupled with other proxy data, could yield significant results.<br />
6.2. Single-equation approaches<br />
6.2.1. Precambrian atmospheric CO 2<br />
The first single-equation approach was proposed by Rye et al.<br />
(1995), who were studying the ~2.2 Ga old Waterval Onder paleosols,<br />
preserved on top of the Hekpoort Basalt of South Africa (Retallack,<br />
1986). Rye et al. (1995) suggested that the equilibrium relationship<br />
between siderite <strong>and</strong> reduced iron-silicates (SIS herein) in paleosols<br />
could be used to constrain Precambrian atmospheric pCO 2 . They<br />
argued that reduced iron-silicates should form rather than siderite if<br />
pCO 2 is low, so the absence of siderite is taken as evidence of low pCO 2<br />
levels. As a model iron-silicate, greenalite was selected by Rye et al.<br />
(1995) because it is a low-temperature metamorphic iron-silicate<br />
suitable to Precambrian paleosols, many of which have been altered by<br />
greenschist facies metamorphism at T ≥300 °C (Rye <strong>and</strong> Holl<strong>and</strong>,<br />
2000). Greenschist metamorphism would not remove siderite, because<br />
it is not decarbonated under common conditions of metamorphism<br />
up to, <strong>and</strong> including, greenschist facies metamorphism<br />
(Rye et al., 1995). The governing equation used by Rye et al. (1995) is<br />
as follows:<br />
Fe 3 Si 2 O 5 ðOHÞ 4ðgreen<br />
Þþ3CO 2ðgÞ ¼ 3FeCO 3ðsidÞ þ 2SiO 2ðaqÞ þ 2H 2 O:<br />
ð33Þ<br />
They used thermodynamic data from Eugster <strong>and</strong> Chou (1973) to<br />
calculate the phase boundary shown in Fig. 12. In their paper, Rye et al.<br />
(1995) allowed that Eugster <strong>and</strong> Chou's (1973) data for greenalite<br />
were poorly constrained. Their original SIS CO 2 paleobarometer gives<br />
an upper limit of ~100 times present atmospheric CO 2 levels based on<br />
equilibrium between siderite <strong>and</strong> greenalite.<br />
There are a number of theoretical <strong>and</strong> geological issues (see a<br />
thorough discussion in Sheldon, 2006b) with the simple model of<br />
Rye et al. (1995) for determining Archean atmospheric pCO 2 from<br />
paleosols. To summarize: 1) using a single equilibrium relationship<br />
for all Archean <strong>and</strong> Proterozoic paleosols is misleading because the<br />
mineral assemblage present is not the same in all Precambrian<br />
paleosols; 2) greenalite does not form authigenically in soils <strong>and</strong> so<br />
represents the metamorphic rather than pedogenic assemblage; a<br />
better iron-silicate mineral choice would be berthierine, which<br />
did form as part of the pedogenic assemblage at Waterval Onder<br />
(Retallack, 1986); 3) Rye et al. (1995) measured in situ carbon dioxide<br />
in b<strong>and</strong>ed iron formations (BIFs) as a check on their thermodynamic<br />
model results, but that provides only weak guidance<br />
because the chemistry of a soil formed at the Earth's surface bears<br />
little resemblance to the chemistry of a BIF formed in the ocean, in<br />
part because decomposition of organic matter leaves the effective<br />
Please cite this article as: Sheldon, N.D., Tabor, N.J., <strong>Quantitative</strong> <strong>paleoenvironmental</strong> <strong>and</strong> <strong>paleoclimatic</strong> <strong>reconstruction</strong> using paleosols, Earth-<br />
Science Reviews (2009), doi:10.1016/j.earscirev.2009.03.004
ARTICLE IN PRESS<br />
N.D. Sheldon, N.J. Tabor / Earth-Science Reviews xxx (2009) xxx–xxx<br />
19<br />
Fig. 12. Single-equation phase diagram for Fe-bearing mineral authigenesis in the ~2.2 Ga Hekpoort paleosol.<br />
pCO 2 of the deep ocean about three times that of the surface ocean<br />
(Kasting, 2004); 4) Even when a pedogenically realistic mineral<br />
assemblage is used (substituting berthierine for greenalite, see<br />
below), estimated carbon dioxide levels are inconsistent with geologic<br />
evidence; 5) the oldest occurrence of siderite in a paleosol,<br />
which the SIS paleobarometer would indicate formed under conditions<br />
of atmospheric CO 2 greater than 60–100 times present levels, is<br />
~0.98 Ga, a time for which there is no independent evidence of CO 2<br />
levels that high (e.g., Retallack <strong>and</strong> Mindszenty, 1994); 6) anoxic<br />
weathering experiments involving the dissolution of Fe-biotite<br />
yielded no siderite even at very high pCO 2 levels (=1 atm;<br />
N2000 PAL) where Rye et al.'s (1995) model would predict siderite<br />
stability (Murakami et al., 2004).<br />
Fig. 12 (modified after Sheldon, 2006b) is a phase diagram that<br />
shows Rye et al.'s (1995) result along with a recalculated phase<br />
boundary for their SIS paleobarometer using more up to date thermodynamic<br />
data for greenalite drawn from the computer program<br />
SUPCRT92 (Johnson et al., 1992; with data from E. Shock as compiled<br />
in Soltherm by M. Reed). The up-to-date phase boundary gives a<br />
significantly different result including Precambrian pCO 2 levels<br />
estimated to be only significantly lower than present atmospheric<br />
pCO 2 levels (PAL) over a reasonable range of aSiO 2 (aq) , rather than<br />
higher as would be expected based on other geological criteria<br />
(Sheldon, 2006b). At quartz saturation (aSiO 2 (aq) =10 − 4.047 ), a<br />
condition common in most modern surface waters, an atmospheric<br />
pCO 2 of just 10 − 5.72 , or 0.006 PAL is predicted (Fig. 12). Greenalite<br />
does not form pedogenically <strong>and</strong> is instead a common greenschist<br />
facies metamorphic mineral (which is not present in the mineral<br />
assemblage at Waterval Onder; Retallack <strong>and</strong> Krinsley, 1993), so<br />
perhaps a similar SIS paleobarometer using the pedogenic mineral<br />
assemblage would be more effective. Berthierine (thermodynamic<br />
data from Fritz <strong>and</strong> Toth (1997)) is a serpentine group ferrous iron<br />
silicate that forms in chemically reducing conditions but rarely as a<br />
soil mineral (e.g., Sheldon <strong>and</strong> Retallack, 2002), <strong>and</strong> which is part<br />
of the mineral assemblage of the ~2.2 Ga old Waterval Onder paleosols<br />
(Retallack <strong>and</strong> Krinsley, 1993). An expression for equilibrium<br />
between berthierine <strong>and</strong> siderite <strong>and</strong> kaolinite can be written as<br />
follows:<br />
Fe 2 Al 2 SiO 5 ðOHÞ 4ðbert<br />
ÞþSiO 2ðaqÞ þ 2CO 2ðgÞ<br />
¼ 2FeCO 3ðsidÞ þ Al 2 Si 2 O 5 ðOHÞ 4ðkaolÞ<br />
ð34Þ<br />
where kaolinite is inferred to have been part of the pre-metamorphic<br />
mineral assemblage (Retallack <strong>and</strong> Krinsley, 1993; Rye <strong>and</strong> Holl<strong>and</strong>,<br />
2000). Calculated pCO 2 levels are higher than for the recalculated SIS<br />
paleobarometer of Rye et al. (1995), <strong>and</strong> close to present day values<br />
at a range of temperatures (Fig. 15). That value represents a maximum<br />
pCO 2 value because the berthierine at Waterval Onder is not a<br />
pure end member. Thus it would have an activity of less than one,<br />
further lowering the calculated pCO 2 level. The choice of Al-mineral<br />
is relatively unimportant as calculations based on gibbsite instead of<br />
kaolinite (not shown) also result in pCO 2 values below present day<br />
conditions (Sheldon, 2006b).<br />
Equilibrium modeling using greenalite or berthierine SIS paleobarometers<br />
suggests one of two conclusions, either Precambrian pCO 2<br />
levels were much lower than expected <strong>and</strong> comparable to present<br />
atmospheric levels, or the whole approach is oversimplified <strong>and</strong><br />
unreliable. Given the “faint young Sun” paradox (Kasting, 1993), such<br />
low levels are difficult to reconcile with the need for a much stronger<br />
than present Precambrian greenhouse. Furthermore, by simplifying<br />
atmospheric composition down to a single chemical reaction there is a<br />
risk of over-interpreting the absence of evidence of a single mineral<br />
phase, in this case siderite.<br />
A similar model based on massive siderite beds in BIFs prior to<br />
~1.8 Ga (i.e., Ohmoto et al., 2004) inverts the logic of Rye et al. (1995)<br />
to suggest that the presence siderite in the BIFs implies pCO 2 values in<br />
excess of 100 PAL <strong>and</strong> that the inhibiting factor in siderite formation<br />
after 1.8 Ga was near modern pO 2 . However, Ohmoto et al. (2004)<br />
assert that siderite stability requires pO 2 =10 − 60 ± 5 , a value well<br />
below any existing estimate for the Precambrian, but as Sleep (2004)<br />
correctly points out, even at the naturally maintained pO 2 minima<br />
(pO 2 =10 − 13 ) reaction kinetics dictate that oxidation processes are<br />
unlikely to inhibit siderite formation. Furthermore, even at the<br />
present day pO 2 value of 0.21, siderite formation in near-modern<br />
soils is not restricted (e.g., Achyuthan, 2003) to poorly aerated settings<br />
as Ohmoto et al. (2004) asserted. Thus, even if pO 2 levels were<br />
relatively high (a minority viewpoint held by Ohmoto et al., 2004),<br />
siderite should form at the Earth's surface when pCO 2 is significantly<br />
elevated. In addition, BIFs can only provide weak guidance for Earth<br />
surface <strong>and</strong> atmospheric conditions because they formed below storm<br />
wave base under conditions of enhanced pCO 2 relative to the surface<br />
as a result of the decomposition of organic matter (Kasting, 2004).<br />
A final thermodynamic approach to reconstructing Precambrian<br />
atmospheric pCO 2 levels is based on equilibrium modeling of the<br />
formation of mineral rinds on sub-aerially deposited pebbles (Hessler<br />
et al., 2004). Hessler et al. (2004) considered three possible equilibrium<br />
relationships that might apply to the formation of the carbonate rinds,<br />
which, in contrast to the other SIS paleobarometers, involve no iron<br />
silicate rather than no siderite. They calculated a minimum pCO 2 of<br />
2.51×10 −3 bars (~6.8 PAL). That scenario requires an unusual geologic<br />
setting in which iron silicates are very unstable at the Earth's surface<br />
(Sheldon, 2006b). If iron silicates were instead stable, the estimated<br />
pCO 2 minimum is significantly higher, though still insufficient to account<br />
for the “faint young Sun” (Kasting, 1993). Without more investigation<br />
into iron silicate stability <strong>and</strong> Archean weathering conditions it is not<br />
clear which of the two scenarios is most likely. Furthermore, it is also<br />
unclear how common siderite coated pebbles (sans iron silicates) are in<br />
the geologic record, <strong>and</strong> thus how often they may provide a useful pCO 2<br />
constraint. However, where appropriate, the Hessler et al. (2004)<br />
thermodynamic model appears to provide a useful constraint.<br />
Thus, results from attempts to reconstruct Precambrian pCO 2<br />
levels using single-equation thermodynamic models are at best<br />
Please cite this article as: Sheldon, N.D., Tabor, N.J., <strong>Quantitative</strong> <strong>paleoenvironmental</strong> <strong>and</strong> <strong>paleoclimatic</strong> <strong>reconstruction</strong> using paleosols, Earth-<br />
Science Reviews (2009), doi:10.1016/j.earscirev.2009.03.004
ARTICLE IN PRESS<br />
20 N.D. Sheldon, N.J. Tabor / Earth-Science Reviews xxx (2009) xxx–xxx<br />
equivocal at this point. Thermodynamic models in general oversimplify<br />
the problem of estimating Precambrian pCO 2 levels, <strong>and</strong> by<br />
slightly changing starting assumptions (e.g., SIS paleobarometers of<br />
Rye et al., 1995; Ohmoto et al., 2004; Sheldon, 2006b) or thermodynamic<br />
data (e.g., Sheldon, 2006b) vastly different conclusions may<br />
be drawn. Extreme caution is thus advocated in their application,<br />
because the mostly widely cited one (Rye et al., 1995) has a number of<br />
fundamental flaws, <strong>and</strong> other approaches (Hessler et al., 2004) may<br />
have only limited application to relatively rare sedimentary occurrences.<br />
Instead, as discussed in Section 5.3.2, a mass-balance model for<br />
reconstructing Precambrian pCO 2 levels is favored because it gives<br />
reproducible results consistent with geologic evidence, is independent<br />
of assumptions about pO 2 values, <strong>and</strong> takes into account both<br />
pedogenic <strong>and</strong> diagenetic processes (Sheldon, 2006b).<br />
6.2.2. Earliest Triassic soil formation<br />
One of the primary weaknesses of the single-equation approach to<br />
Precambrian conditions is the amount of uncertainty about the<br />
original pedogenic mineral assemblage. Given that model interpretations<br />
were based on the presence/absence of a single mineral at a<br />
single site, it is unsurprising that inconsistent results were obtained.<br />
Those uncertainties decrease with younger rocks, with settings that<br />
are better understood, <strong>and</strong> with model approaches that rely on the<br />
mineral assemblage that is actually present rather than on some<br />
theoretical assemblage. The key with any model is the ability to<br />
evaluate it successfully against “real” data. Thus, a single-equation<br />
approach applied to a well-characterized geologic setting has a greater<br />
chance of success. Sheldon <strong>and</strong> Retallack (2002, 2003) have used a<br />
single-equation equilibrium model to examine pedogenic processes in<br />
well-studied (Retallack <strong>and</strong> Krull, 1999; Krull <strong>and</strong> Retallack, 2000;<br />
Retallack et al., 2005; Sheldon, 2006a) earliest Triassic paleosols in<br />
Antarctica. Krull <strong>and</strong> Retallack (2000; see also Sarkar et al., 2003)<br />
presented organic matter δ 13 C data that was interpreted to represent a<br />
significant methane release event coincident with the Permian–<br />
Triassic extinction, possibly due to destabilization of seafloor clathrates<br />
or to diking of permafrost fields (Retallack <strong>and</strong> Jahren, 2008).<br />
C cycle modeling by Berner (2002) suggests that large isotopic<br />
excursions can only be caused by introduction of methane (i.e.,<br />
Siberian Traps volcanism was ruled out). Because methane oxidizes on<br />
very short time scales (7–24 years in the present atmosphere), local<br />
reduction may occur in relatively confined settings such as soils. The<br />
earliest Triassic of Antarctica was characterized by waterlogged soils<br />
(Sheldon, 2006a) that were essentially coal swamp environments<br />
without peat accumulation (Retallack et al., 1996) that could be<br />
termed “clastic swamps.” The unusual serpentine group mineral<br />
berthierine was also present (Sheldon <strong>and</strong> Retallack, 2002, 2003), a<br />
strong indicator of chemically reducing conditions (see references in<br />
Sheldon <strong>and</strong> Retallack, 2002). Thus, Sheldon <strong>and</strong> Retallack (2002,<br />
2003) used an equilibrium model based on the following equation to<br />
examine if the presence of berthierine gives a useful constraint on<br />
<strong>paleoenvironmental</strong> conditions at the time of its formation:<br />
Al 2 S 2 i 2 O 5 ðOHÞ 4ðKaolÞ<br />
+Fe 2 O 3ðHemÞ<br />
+ 1 4 CH 4 =Fe 2 Al 2 SiO 5 ðOHÞ 4ðbertÞ<br />
+ SiO 2aq ð Þ + 1 2 H 2O ðaqÞ<br />
+ 1 4 CO 2aq ð Þ ð35Þ<br />
Assuming pure minerals <strong>and</strong> a dilute solution (i.e., aH 2 O≈1), the<br />
following equilibrium relationship was developed (using data from the<br />
SOLTHERM database; see Pal<strong>and</strong>ri <strong>and</strong> Reed, 2001) that allowed them to<br />
model the conditions that would result from elevated methane levels:<br />
a SiO2ðaqÞ<br />
p 1 4 CO2<br />
p 1 4 CH4<br />
= K =10 − 1:673 ð25 ○ CÞ ð36Þ<br />
Over a realistic temperature range (10–25 °C), a variety of methane<br />
scenarios (2–100× present levels) were examined (see Fig. 1 of Sheldon<br />
<strong>and</strong> Retallack, 2003). At aSiO 2(aq) values comparable to modern surface<br />
waters (10 −4.047 ), very high soil gas pCO 2 values (N1000 PAL; modern<br />
tropical soils often exceed 100 PAL, Brook et al.,1983) are indicated for all<br />
of the methane scenarios. This result provides an explanation for the<br />
“post-apocalyptic greenhouse” paleosols observed in Antarctica (Retallack<br />
<strong>and</strong> Krull, 1999), which included paleo-Ultisols forming at N65°S<br />
even though modern Ultisols are limited to ±45° N or S today by giving<br />
evidence for short-term exceptionally high soil gas pCO 2 levels (Sheldon<br />
<strong>and</strong> Retallack, 2002, 2003; Sheldon, 2006a). Evidence for these shortterm<br />
chemically reducing but highly acidic soil gas conditions at high<br />
paleo-latitudes is now widespread for the earliest Triassic, with nine<br />
berthierine-bearing localities in Antarctica <strong>and</strong> Australia, including all of<br />
the paleosol-bearing Antarctic sequences that have been widely studied<br />
(Sheldon, 2006a).<br />
This type of application of thermodynamic modeling (i.e., in<br />
concert with whole rock geochemical <strong>and</strong> isotopic data), where there<br />
is geological evidence to “aim at”, is much more effective than the<br />
more theoretical approaches that have been applied to Precambrian<br />
paleosols. Thermodynamic modeling of soil <strong>and</strong> paleosol formation<br />
does represent a potentially powerful tool, but less so when used<br />
exclusively <strong>and</strong> in scenarios where there is relatively little additional<br />
proxy data to work with. For Phanerozoic paleosols, this is less likely<br />
to be a problem than for Precambrian ones, <strong>and</strong> in places where the<br />
diagenetic setting is well understood, single-equation thermodynamic<br />
modeling is likely to give additional insight into unusual mineral<br />
assemblages observed in paleosols, but probably should not be used as<br />
a “st<strong>and</strong>alone” proxy any more than for the Precambrian.<br />
6.3. Multiple-equation approaches<br />
Soils are potentially excellent proxy records of environmental<br />
conditions because they form in direct contact with the atmosphere.<br />
As a result, gas contents in soils equilibrate with atmospheric gases.<br />
However, due to soil respiration, soil pCO 2 may be up to 100–200<br />
times higher than that of the atmosphere (Brook et al., 1983; Volk,<br />
1987) in tropical settings, with generally lower concentrations in<br />
temperate settings. The minimum soil pCO 2 level expected is that of<br />
atmospheric pCO 2 , which corresponds to no biological productivity.<br />
Elevated soil pCO 2 values are associated with high-biomass systems or<br />
with waterlogged settings where diffusive loss of soil pCO 2 to the<br />
atmosphere (if soil pCO 2 Natmospheric pCO 2 ) is inhibited. Thus, welldrained<br />
soils with low to moderate productivity will generally have<br />
low soil pCO 2 , but still somewhat greater than atmospheric pCO 2 .<br />
Because atmospheric pCO 2 level cannot be lower than the soil<br />
pCO 2 levels under open-system exchange, equilibrium modelling of<br />
abiotic weathering reactions can constrain minimum atmospheric<br />
pCO 2 levels (Sheldon, 2006d) if the weathering environment is wellunderstood.<br />
To illustrate this, we will summarize Sheldon's (2006d)<br />
efforts to model the formation of intra-basaltic paleosols preserved<br />
between middle Miocene Columbia River Flood Basalt Province flows.<br />
In other words, if present levels of pCO 2 are sufficient to create the<br />
observed degree of weathering in these paleosols, then it is likely that<br />
paleo-atmospheric pCO 2 levels were also at near-modern levels<br />
because biota can only serve to enhance the degree of weathering.<br />
This approach is somewhat indirect, but the thermodynamics of<br />
microbial <strong>and</strong> plant interactions during weathering are still poorly<br />
understood.<br />
The computer program CHILLER (e.g., Pal<strong>and</strong>ri <strong>and</strong> Reed, 2001)<br />
allows users to calculate heterogeneous equilibrium of gas–mineral–<br />
water systems. CHILLER forces equilibrium with different water <strong>and</strong><br />
gas mixtures by treating gases as homogeneous minerals. Each of the<br />
different gas compositions is thus a separate “mineral”, with separate<br />
thermodynamic behaviour. In other words, a water-rock system in<br />
equilibrium with present atmospheric conditions is in equilibrium<br />
with the “minerals” called “fCO 2 –3.5” (CO 2 fugacity=10 − 3.5 ) <strong>and</strong><br />
“fO 2 –0.7” (O 2 fugacity=10 − 0.7 ). To look at a range of possible pCO 2<br />
Please cite this article as: Sheldon, N.D., Tabor, N.J., <strong>Quantitative</strong> <strong>paleoenvironmental</strong> <strong>and</strong> <strong>paleoclimatic</strong> <strong>reconstruction</strong> using paleosols, Earth-<br />
Science Reviews (2009), doi:10.1016/j.earscirev.2009.03.004
ARTICLE IN PRESS<br />
N.D. Sheldon, N.J. Tabor / Earth-Science Reviews xxx (2009) xxx–xxx<br />
21<br />
levels, new CO 2 “minerals” were created for 0.1, 1, 3, 5, 10, 15, <strong>and</strong> 20<br />
times present atmospheric levels (PAL) assuming a present day<br />
atmospheric pCO 2 of 10 − 3.5 (for dilute mixtures, e.g., CO 2 in the<br />
atmosphere, f≈p). All equilibrium K values are from the SOLTHERM<br />
database (construction of the database is outlined in Pal<strong>and</strong>ri <strong>and</strong><br />
Reed, 2001). The basic equation that controls the availability of CO 2 is:<br />
H 2 O ðaq ÞþCO 2 ðgÞ ¼HCO − 3 ðaqÞþH þ ðaqÞ:<br />
ð37Þ<br />
From here, a K value may be calculated from the following (where<br />
a represents activity):<br />
a H +<br />
K = a HCO − 3<br />
f CO2 a H2 O<br />
ð38Þ<br />
Rearranging that expression (Eq. (39)) <strong>and</strong> taking the Log 10 of both<br />
sides (Eq. (40)) permits calculation of a new K value (here called K⁎) that<br />
can be used to force equilibrium with a given atmospheric CO 2 value.<br />
<br />
f CO2 K = a HCO − 3<br />
a H2 O<br />
a H +<br />
<br />
Log K4 =Log f CO2 +LogK =Log a HCO − 3<br />
a H2 O<br />
a H +<br />
ð39Þ<br />
ð40Þ<br />
For example, to create a new CO 2 gas “mineral” that corresponds to<br />
present-day atmospheric conditions (i.e., pCO 2 =10 − 3.5 bars), the<br />
following expression would be used:<br />
Log K4 = 10 − 7:818 +10 − 3:5<br />
ð41Þ<br />
For the modeling, O 2 fugacity/pressure was kept constant at present<br />
levels, which is reasonable because oxygen levels are thought to have<br />
been roughly constant throughout the Cenozoic. CHILLER may be used<br />
to examine different water-rock ratios by “titrating” rock into a water of a<br />
given composition (i.e., rainwater) <strong>and</strong> by outputting how that water<br />
changes composition in response to the addition of rock. If precipitation<br />
is approximately constant through time, then there should be a<br />
systematic decrease in the amount of water that reacted with the<br />
parental basalt with increasing depth in the profile (Sheldon, 2006d).<br />
Thus, by graphing results depicting ascending water-rock ratios from the<br />
top down, an artificial soil profile may be modeled (Sheldon, 2006d).<br />
These artificial profiles obtained for equilibriumwith different CO 2 levels<br />
(0.1–20 PAL) can then be compared with actual geochemical data on<br />
mass balance <strong>and</strong> the mineral assemblage from Sheldon (2003).<br />
The rainwater composition used in the modeling may be found in<br />
Sheldon (2006d). Because rainwater is very fresh (i.e., has low salinity<br />
<strong>and</strong> low total-dissolved solids), most of the cations available for<br />
reactions come from the rock(s) being weathered. Pedogenesis is<br />
dominated by the breakdown of base-bearing minerals either by<br />
hydrolysis (e.g., potassium feldspar being weathered to illite) or by<br />
acid attack that liberates cations for use by plants <strong>and</strong> microbes. An<br />
example of the latter type of reaction would be the dissolution of the<br />
plagioclase feldspars albite or anorthite:<br />
NaAlSi 3 O 8 albite þ 4H þ ¼ Na þ þ Al 3þ þ 3SiO 2ðaqÞ þ 2H 2 O<br />
CaAl 2 Si 2 O 8 anorthite þ 8H þ ¼ Ca 2þ þ 2Al 3þ þ 2SiO 2ðaqÞ þ 4H 2 O<br />
ð42Þ<br />
ð43Þ<br />
where the resulting species are all aqueous. Acid attack reactions<br />
consume H + ions, thereby raising the pH of the system, <strong>and</strong> providing<br />
a long-term control on atmospheric pCO 2 (e.g., Berner, 2004). While<br />
HCO 3 − is the most stable carbon-bearing species at near neutral pH<br />
values (5.5–8), CO 3 2− becomes the most stable species at higher pH<br />
values (N8). This change leads to the precipitation of carbonate minerals<br />
such as calcite, siderite, <strong>and</strong> ankerite. However, all of the<br />
interflow paleosols of the Picture Gorge Subgroup are carbonate-free,<br />
so the first appearance of carbonate minerals can be taken to represent<br />
the end point of the realistic weathering reaction (Sheldon,<br />
2006b).<br />
Atmospheric pCO 2 values of 0.1, 1, 3, 5, 10, 15, <strong>and</strong> 20 PAL were used<br />
in model calculations, where 0.1 PAL is an extreme case used to<br />
represent the sub-modern pCO 2 levels suggested by Pagani et al.<br />
(1999) <strong>and</strong> Royer et al. (2001a,b). All model calculations were for<br />
25 °C temperature conditions, which is within 10 °C of paleotemperature<br />
estimates from the paleosols themselves (Sheldon, 2003,<br />
2006d) <strong>and</strong> paleobotanical estimates (Graham, 1999). Using a reaction<br />
temperature of 25 °C has the additional advantage of being the<br />
temperature at which most thermodynamic data are best-constrained.<br />
All model calculations were run over the range of 0.001–<br />
10 g of rock added to a kilogram of water, or 10 − 3 to 10 1 g of rock<br />
titrated. In all cases, calcite precipitated before the end of the titration<br />
run. Taking into account both kinetic factors <strong>and</strong> the temperature, a<br />
number of zeolite <strong>and</strong> high-temperature minerals were suppressed<br />
from forming in the calculations.<br />
A thorough description of the model results (including mineralogical<br />
data) may be found in Sheldon (2006d), but to illustrate<br />
what the model outputs look like <strong>and</strong> how they are comparable to<br />
other tools for assessing pedogenesis, Fig. 13 compares model results<br />
for Ca 2+ <strong>and</strong> Na + in the soil water solution with mass balance results<br />
(see Section 5.3 for the method) obtained from the type section of<br />
middle Miocene Ilukas pedotype, which is found throughout the<br />
Picture Gorge Subgroup (Sheldon, 2006d). Weathering is typically<br />
most intense near the surface of a soil <strong>and</strong> declines rapidly with<br />
increasing depth <strong>and</strong> decreasing permeability (both initial <strong>and</strong> as a<br />
direct result of plant-rock interactions). Therefore, with the titration<br />
of progressively more rock into solution we would expect an increase<br />
in the activity (<strong>and</strong> by extension, molality) of a given cation. This<br />
pattern is observed in the model calculations for Na + <strong>and</strong> Ca 2+<br />
(though the same result was found for other common base cations;<br />
Sheldon, 2006d). In addition, to reproducing the expected cation<br />
distributions indicated by mass-balance calculations, the model also<br />
produced reasonable pH values for Alfisol-like (Argillisols) paleosols,<br />
<strong>and</strong> produced reasonable water-rock ratios during pedogenesis<br />
relative to a calculated “real” water-rock ratio based on estimates of<br />
MAP (Sheldon, 2006d).<br />
The 10 PAL model run was also favored as the most likely scenario<br />
because only the 10 PAL case produced a significant amount of Mg 2+ .<br />
That value represents an upper limit to pCO 2 though, because higher<br />
pCO 2 values result in dolomite precipitation <strong>and</strong> dolomite is not<br />
observed in the paleosols <strong>and</strong> is unlikely to form in any soils for kinetic<br />
reasons (Capo et al., 2000). That the 10 PAL case best matches the<br />
geologic evidence raises the question of how much of that total pCO 2<br />
is due to atmospheric pCO 2 <strong>and</strong> how much is due to soil productivity.<br />
Using the world soil pCO 2 map of Brook et al. (1983), modern soils like<br />
the Picture Gorge Subgroup paleosols have 3–8 PAL soil pCO 2 . If one<br />
assumes that 10 PAL is the total soil pCO 2 , from both atmospheric <strong>and</strong><br />
soil respiration sources necessary to produce the Picture Gorge<br />
Subgroup paleosols, then atmospheric pCO 2 likely ranged from 2 to<br />
7 PAL for the transient middle Miocene climatic optimum (Sheldon,<br />
2006d). Even at the low end of that range, it is likely that sub-pre-<br />
Industrial atmospheric pCO 2 levels, as suggested by Pagani et al.<br />
(1999), are too low. Furthermore, a value of 2–4 PAL is consistent with<br />
estimates from stomatal index (Retallack 2002; Kürschner et al.,<br />
2008) <strong>and</strong> mass-balance modelling (Berner <strong>and</strong> Kothavala 2001;<br />
though cf. Berner, 2005). The model results do not preclude the<br />
possibility of very low atmospheric pCO 2 coupled with non-analogous<br />
biotic productivity in the Ilukas paleosols (i.e., unusually high productivity<br />
forests). However, that scenario is unlikely because the flora<br />
<strong>and</strong> fauna of the middle Miocene was not substantially different from<br />
a modern one (e.g., Janis et al., 2002), so it is more likely that modernanalogue<br />
forests have comparable productivity to their Miocene<br />
Please cite this article as: Sheldon, N.D., Tabor, N.J., <strong>Quantitative</strong> <strong>paleoenvironmental</strong> <strong>and</strong> <strong>paleoclimatic</strong> <strong>reconstruction</strong> using paleosols, Earth-<br />
Science Reviews (2009), doi:10.1016/j.earscirev.2009.03.004
ARTICLE IN PRESS<br />
22 N.D. Sheldon, N.J. Tabor / Earth-Science Reviews xxx (2009) xxx–xxx<br />
Fig. 13. Multi-equation thermodynamically-derived profile versus mass-balance calculations.<br />
counterparts. Therefore, these results are suggestive that the middle<br />
Miocene warm event was due, at least in part, to elevated atmospheric<br />
pCO 2 (Sheldon, 2006b).<br />
The multi-equation thermodynamic approach thus potentially<br />
gives a wide range of information about both pedogenic environment<br />
<strong>and</strong> the climatic conditions under which the modeled paleosol(s)<br />
formed. Potential limitations include poorly constrained parent<br />
material chemistry <strong>and</strong> poorly constrained vegetative covering.<br />
However, in areas where both are known (e.g., paleosols formed on<br />
volcanic units or at unconformities with associated floras or clear<br />
taxonomic identifications), this approach is viable. Furthermore, for<br />
pre-vascular l<strong>and</strong> plant paleosols, it presents an excellent potential<br />
research tool because one of the two primary limitations is removed.<br />
7. Stable isotope approaches<br />
7.1. Stable isotopic composition of pedogenic minerals as <strong>paleoenvironmental</strong><br />
proxies<br />
The stable isotope values of pedogenically-formed minerals have the<br />
potential to provide <strong>paleoenvironmental</strong> information such as the<br />
isotope composition of soil waters (e.g., Vitali et al., 2002; Tabor <strong>and</strong><br />
Montañez, 2002, 2005; Tabor et al., 2002, 2004a,b), paleotemperature<br />
(Yapp, 1993a, 2000; Delgado <strong>and</strong> Reyes, 1996; Savin <strong>and</strong> Hsieh, 1998;<br />
Vitali et al., 2002; Tabor <strong>and</strong> Montañez, 2005; Gilg, 2003; Tabor, 2007),<br />
the isotope values of gases in the soil (Cerling <strong>and</strong> Quade, 1993; Cerling<br />
et al., 1991; Koch et al., 1995; Yapp, 2001a,b; Fox <strong>and</strong> Koch, 2003;<br />
Behrensmeyer et al., 2007), <strong>and</strong> the partial pressure of soil <strong>and</strong><br />
tropospheric gases (Cerling, 1984; Quade et al., 1989; Cerling, 1991;<br />
Yapp <strong>and</strong> Poths, 1996; Mora et al., 1996; Ekart et al., 1999; Tabor et al.,<br />
2004a,b). The utility of soil authigenic minerals as proxies of<br />
<strong>paleoenvironmental</strong> conditions requires: (1) relatively well-known<br />
temperature-dependent stable-isotope mineral-water fractionation<br />
factors, (2) isotopic equilibrium, or near equilibrium, at the time of<br />
mineral crystallization, (3) closed-system conditions for structurallybound<br />
elements since the time of mineral formation, (4) waterdominated<br />
environments of crystallization, <strong>and</strong> (5) knowledge of the<br />
relationship between the isotope of interest in the mineral <strong>and</strong> the<br />
medium (e.g., H 2 O, CO 2 ) from which it was derived. Considering that the<br />
vast majority of waters on the continents have a meteoric origin, that<br />
processes that govern the global meteoric water line <strong>and</strong> mixing of gases<br />
between the soil <strong>and</strong> atmosphere are similar, <strong>and</strong> the low solubility of<br />
most paleosol minerals, conditions (4) <strong>and</strong> (5) have been likely fulfilled<br />
<strong>and</strong> constant for minerals that form in well-developed soils since at least<br />
the advent of vascular plants during Silurian time (Gregory, 1991; Yapp<br />
<strong>and</strong> Poths, 1991, 1992; Yapp, 2001a,b; Came et al., 2007). Requirements<br />
(1) through (3) are specific to the mineral of interest <strong>and</strong> its paragenesis.<br />
In particular, requirement 1 is critical to drawing <strong>paleoenvironmental</strong><br />
inferences from the stable isotope value of soil minerals.<br />
7.1.1. Mineral-water isotope fractionation <strong>and</strong> the jargon of stable<br />
isotope geochemistry<br />
In this work, we consider variation among stable isotopes of<br />
oxygen, hydrogen <strong>and</strong> carbon in soil media, <strong>and</strong> in solid materials that<br />
occur in paleosol profiles. Herein, we consider the two most abundant<br />
isotopes of oxygen, hydrogen, <strong>and</strong> carbon: 16 O <strong>and</strong> 18 O, 1 H <strong>and</strong> 2 H, 12 C<br />
<strong>and</strong> 13 C. Isotopes of these elements may be partitioned, or fractionate,<br />
differently among the reactants <strong>and</strong> products of chemical reactions. In<br />
general, reactions involving these isotopes are mass-dependent (i.e.,<br />
the process in question discriminates against the higher mass isotope<br />
to some degree). Isotope fractionation is depicted by the chemical<br />
equilibrium constant of a chemical reaction that includes isotope<br />
exchange:<br />
Mineral− 16 O+H 18<br />
2 O X Mineral− 18 O+H 16<br />
2 O: ð44Þ<br />
Please cite this article as: Sheldon, N.D., Tabor, N.J., <strong>Quantitative</strong> <strong>paleoenvironmental</strong> <strong>and</strong> <strong>paleoclimatic</strong> <strong>reconstruction</strong> using paleosols, Earth-<br />
Science Reviews (2009), doi:10.1016/j.earscirev.2009.03.004
ARTICLE IN PRESS<br />
N.D. Sheldon, N.J. Tabor / Earth-Science Reviews xxx (2009) xxx–xxx<br />
23<br />
The fractionation of 16 O <strong>and</strong> 18 O among the reactants <strong>and</strong> products<br />
is described by the alpha value (α):<br />
18 α mineral =<br />
18 O mineral<br />
16 O mineral<br />
18 O H2 O<br />
16 O H2 O<br />
ð45Þ<br />
where 18 α is the oxygen isotope fractionation factor. The hydrogen <strong>and</strong><br />
carbon isotope fractionation factors are noted by D α <strong>and</strong> 18 α, respectively.<br />
α values for isotope exchange reactions are very small,<br />
which indicates that, in the absence of a more energetic reaction such<br />
as dissolution <strong>and</strong> precipitation, isotope exchange will not occur. That<br />
is, the isotope composition of a mineral is stable, <strong>and</strong> will remain<br />
unchanged, after it has formed. Fractionation of 18 O <strong>and</strong> 16 O between a<br />
mineral <strong>and</strong> water can vary, but changes in α are principally related to<br />
the temperature of reaction such that:<br />
10 3 lnα mineral−H2 O = A T 2 + B T + C ð46Þ<br />
where A, B, <strong>and</strong> C are constants which describe the behavior of an<br />
isotope for a specific mineral-water system, <strong>and</strong> T is temperature in K.<br />
Note, however, that the quantity B/T does not appear in many isotope<br />
fractionation equations. A list of fractionation equations for common<br />
pedogenic minerals is given in Table 5.<br />
Measurement of the isotope composition is usually reported with<br />
respect to the difference between the measured 18 O/ 16 O value of the<br />
sample with respect to the measured 18 O/ 16 O value of a st<strong>and</strong>ard.<br />
These reported values, called δ (“delta”) values, are calculated as:<br />
ð heavy X sample<br />
δX = light X sample<br />
× 1000 ð47Þ<br />
1Þ<br />
− heavy X st<strong>and</strong>ard<br />
light X st<strong>and</strong>ard<br />
where X is the element under consideration (C or O for example), heavy<br />
<strong>and</strong> light refer to the concentration of heavy <strong>and</strong> light isotopes, respectively,<br />
of element X in the sample <strong>and</strong> st<strong>and</strong>ard. δ values are<br />
reported in per-mil units (parts per thous<strong>and</strong>), which is denoted by<br />
the symbol, “‰”. Conventional presentation of δ values are δD for<br />
hydrogen, δ 13 C for carbon <strong>and</strong> δ 18 O for oxygen. The st<strong>and</strong>ard that is<br />
used for reporting δD <strong>and</strong> δ 18 O values is St<strong>and</strong>ard Mean Ocean Water<br />
(SMOW), whereas the st<strong>and</strong>ard used for reporting δ 13 C values is<br />
PeeDee Belemnite. Therefore both SMOW <strong>and</strong> PDB have δ values that<br />
are defined as 0‰ when referenced with respect to themselves.<br />
7.1.2. Stable isotope fractionation factors of common pedogenic minerals<br />
Asignificant amount of research has focused upon measurement <strong>and</strong><br />
determination of stable isotope fractionation factors (see reviews by<br />
Hoefs, 1997; Valley et al., 1986; Savin <strong>and</strong> Lee, 1988; Chacko et al., 2001;<br />
Sharp, 2007). Table 5 presents the stable isotope fractionation factors<br />
(values of 10 3 lnα) of common soil-forming minerals, as determined<br />
from laboratory syntheses, isotope exchange reactions <strong>and</strong> natural<br />
experiments. At temperatures that reflect soil formation in the presence<br />
of liquid water (~0–30 °C; Yapp, 2001a,b; Tabor <strong>and</strong> Montañez, 2005),<br />
the majority of mineral-water oxygen isotope fractionation factors<br />
(10 3 ln 18 α) have positive values, which indicates that 18 O is enriched in<br />
the mineral product (Table 5; Fig.14A). Carbonates <strong>and</strong> silicates have the<br />
largest (~25–35) <strong>and</strong> Fe(III)-oxides the smallest (~0–15) 10 3 ln 18 α<br />
values, <strong>and</strong> Al- <strong>and</strong> Mn-oxides have intermediate values. In addition,<br />
10 3 ln 18 α values decrease with higher temperatures for all minerals<br />
considered herein. Minerals with little or no ionic substitution, such as<br />
low-Mg calcite <strong>and</strong> kaolinite (Al 2 Si 2 O 5 (OH) 4 ) have relatively invariant<br />
10 3 ln 18 α values under isothermal conditions. Mineral groups that<br />
permit a great deal of metal-cation substitution, such as 2:1 phyllosilicate<br />
minerals, result in variable 10 3 ln 18 α values under isothermal<br />
conditions (Savin <strong>and</strong> Lee, 1988). For example, Tabor <strong>and</strong> Montañez<br />
(2005) reported the chemistry of smectites from Permian–Pennsylvanian-age<br />
paleosol profiles that correspond to differences in isothermal<br />
10 3 ln 18 α values N1‰ among samples, whereas Koster <strong>and</strong> others (1999)<br />
determined that nontronite (Na 0.3 Fe 3+ 2(Si,Al) 4 O 10 (OH) 2 ) 10 3 ln 18 α<br />
values are ~4‰ lower than Fe-rich 10 3 ln 18 α values. This highlights the<br />
importance of accurate mineralogical <strong>and</strong> chemical characterization of<br />
pedogenic minerals in order to interpret appropriately the meaning of<br />
their δ 18 Ovalues.<br />
All mineral-H 2 O hydrogen isotope fractionation factors (10 3 ln D α;<br />
Table 5; Fig. 14B) considered herein have negative values, indicating<br />
that 1 H is enriched in the mineral product. Goethite has the most<br />
negative (~−100), whereas gibbsite has the most positive (~− 5),<br />
10 3 ln D α values, <strong>and</strong> phyllosilicates have intermediate values. Within<br />
analytical uncertainty, goethite <strong>and</strong> gibbsite 10 3 ln D α values do not<br />
Table 5<br />
Light stable isotope fractionation equations for common soil-formed minerals.<br />
Reaction 10 3 ln 18 α 10 3 ln D α 10 3 ln 13 α Reference<br />
H 2 O(l)–H 2 O(v) 1.137⁎10 6 / T 2 −0.4156 ⁎ 28.844⁎10 6 /T 2 −76.248⁎<br />
Majoube, 1971<br />
10 3 /T−2.0667<br />
10 3 /T+52.612<br />
Calcite-H 2 O 2.78 ⁎10 6 /T 2 −2.89 –2.988⁎10 6 /T 2 +7.6663⁎10 3 /T−2.4612 (O'Neil et al., 1969; Kim <strong>and</strong><br />
O'Neil, 1997)<br />
Calcite-CO 2 18.03 ⁎103 / T−32.42<br />
Siderite-H 2 O 3.13⁎10 6 /T 2 − 3.50 Carothers et al. (1988)<br />
Siderite-CO 2 See Fig. 17<br />
Goethite-H 2 O 1.63⁎10 6 /T 2 −12.3 (Yapp, 1990; Yapp, 1987a,b; Bao <strong>and</strong><br />
Koch, 1999; Muller, 1995)<br />
1.907⁎10 3 /T−8.004 −99.8<br />
2.76⁎10 6 / T 2 −23.7<br />
Hematite-H 2 O 1.63⁎10 6 /T 2 −12.3 (Yapp, 1990; Clayton <strong>and</strong> Epstein, 1961;<br />
Bao <strong>and</strong> Koch, 1999)<br />
0.413⁎10 6 /T 2 −2.56<br />
0.542⁎10 6 /T 2 −5.221<br />
0.733⁎10 6 /T 2 − 6.194<br />
Gibbsite-H 2 O 2.04⁎10 6 /T 2 − (Vitali et al., 2000, 2001)<br />
3.61⁎10 3 /T+3.65 − 5.1<br />
Boehmite-H 2 O 2.11⁎10 6 /T 2 −4.4 XXX Bird et al. (1992)<br />
Kaolinite-H 2 O 2.76⁎10 6 / T 2 −6.75 − 2.2⁎10 6 / T 2 −7.7 Sheppard <strong>and</strong> Gilg (1996)<br />
Smectite-H 2 O 2.60 ⁎10 6 /T 2 −4.28<br />
Sum of metal-oxygen<br />
bonds<br />
−2.2⁎10 6 /T 2 − 7.7 +<br />
(2⁎Al− 4⁎Mg− 68 ⁎Fe)<br />
(Delgado <strong>and</strong> Reyes, 1996; Savin <strong>and</strong> Lee, 1988;<br />
Sheppard <strong>and</strong> Gilg, 1996)<br />
Illite/smectite-H 2 O<br />
−19.6⁎10 3 /T+25 (0–120 °C)<br />
−45.3 ⁎10 3 /T+94.7 (0–150 °C)<br />
(Yeh, 1980; Capuano, 1992; Hyeong <strong>and</strong><br />
Capuano, 2004)<br />
Please cite this article as: Sheldon, N.D., Tabor, N.J., <strong>Quantitative</strong> <strong>paleoenvironmental</strong> <strong>and</strong> <strong>paleoclimatic</strong> <strong>reconstruction</strong> using paleosols, Earth-<br />
Science Reviews (2009), doi:10.1016/j.earscirev.2009.03.004
ARTICLE IN PRESS<br />
24 N.D. Sheldon, N.J. Tabor / Earth-Science Reviews xxx (2009) xxx–xxx<br />
Fig. 14. (A) Cross plot of 10 3 ln 18 α values versus temperature (°C) for common pedogenic minerals. 0 °C is shown as the lower limit, because it assumed that liquid water is required for<br />
chemical reaction <strong>and</strong> formation of pedogenic minerals. Thin black vertical line at 30 °C is the approximate upper limit of soil temperatures based on mean annual surface air<br />
temperatures from weather stations in the International Atomic Energy Association (IAEA) global network for isotopes in precipitation database (Rozanski et al., 1993). Arabic<br />
numbers within graph indicate studies which reported the 10 3 ln 18 α value: 1=calcite, Kim <strong>and</strong> O'Neil (1997); 2=calcite, O'Neil et al. (1969); 3= goethite, Yapp (1990); 4=geothite,<br />
Bao <strong>and</strong> Koch (1999); 5=goethite, Muller (1995); 6=hematite @ pH=1–2, Yapp (1990); 7=hematite, Clayton <strong>and</strong> Epstein (1961); 8=hematite @ pH =1–2, Bao <strong>and</strong> Koch (1999);<br />
9=hematite @ pH =8–9, Bao <strong>and</strong> Koch (1999); 10=Gibbsite, Bird et al. (1994a); 11=boehmite, Bird et al. (1992); 12=Kaolinite, Sheppard <strong>and</strong> Gilg (1996); 13=smectite, Delgado<br />
<strong>and</strong> Reyes (1996); 14=siderite, Carothers et al. (1988). See Text for discussion. (B) Cross plot of 10 3 ln D α values versus temperature (°C) for common hydroxylated pedogenic<br />
minerals. See text for discussion. (C) Cross plot of 10 3 ln 13 α values versus temperature (°C) for common pedogenic minerals. See text for discussion.<br />
vary with temperature, although goethite 10 3 ln D α values do vary<br />
according to Al substitution for Fe in the crystal lattice (Feng <strong>and</strong> Yapp,<br />
2008). Phyllosilicates exhibit temperature dependence, where 10 3 ln D α<br />
values decrease with higher temperatures (Fig. 14B). In addition, 2:1<br />
phyllosilicate10 3 ln D α values vary according the concentration of<br />
octahedrally-coordinated metal cations, where 10 3 ln D α=− 2.2⁎10 6 /<br />
T 2 −7.7 + (2 ⁎Al−4⁎Mg−68⁎Fe) (Suzuoki <strong>and</strong> Epstein, 1976; Gilg<br />
<strong>and</strong> Sheppard,1996; Tabor <strong>and</strong> Montañez, 2005). This effect could result<br />
in isothermal 10 3 ln D α smectite-H2O values that differ by ~70‰, although<br />
Tabor <strong>and</strong> Montañez (2005) found that the chemistry among 14<br />
different Permian–Pennsylvanian paleosol smectites accounted for<br />
isothermal 10 3 ln D α smectite-H2O variability no greater than ~5‰.<br />
Please cite this article as: Sheldon, N.D., Tabor, N.J., <strong>Quantitative</strong> <strong>paleoenvironmental</strong> <strong>and</strong> <strong>paleoclimatic</strong> <strong>reconstruction</strong> using paleosols, Earth-<br />
Science Reviews (2009), doi:10.1016/j.earscirev.2009.03.004
ARTICLE IN PRESS<br />
N.D. Sheldon, N.J. Tabor / Earth-Science Reviews xxx (2009) xxx–xxx<br />
25<br />
Mineral-CO 2 carbon isotope fractionation values (10 3 ln 13 α; Table 5;<br />
Fig. 21) forcalcite(Bottinga, 1968) <strong>and</strong>theFe(CO 3 )OH group in solid<br />
solution with goethite (Yapp <strong>and</strong> Poths,1993) are positive, indicating that<br />
13 C is enriched in the mineral product, whereas mineral-bound C that is<br />
apparently in solid solution with gibbsite (Tabor <strong>and</strong> Yapp, 2005a,b)<br />
shows no fractionation with respect to gaseous CO 2 (i.e., gibbsite <strong>and</strong> CO 2<br />
δ 13 C values are equivalent; Schroeder <strong>and</strong> Melear, 1999). Calcite-CO 2<br />
10 3 ln 13 α values decrease with increasing temperature (Fig. 14A),<br />
whereas goethite-CO 2 <strong>and</strong> gibbsite-CO 2 10 3 ln 13 α values do not exhibit<br />
temperature dependence (Yapp, 2001a,b). Although siderite-CO 2<br />
10 3 ln 13 α values appear to follow closely those for calcite-CO 2 , siderite-<br />
CO 2 10 3 ln 13 α values are too poorly studied at this time to be expressed as<br />
a temperature-dependent fractionation equation (see Fig. 14C).<br />
7.1.3. Relationship between hydrogen <strong>and</strong> oxygen isotopes in continental<br />
waters<br />
The vast majority of continental surface waters are meteoric in<br />
origin (Dansgaard, 1964; Gat <strong>and</strong> Bowser, 1991). That is, surface<br />
waters are derived from the atmosphere as precipitation (rainfall <strong>and</strong><br />
snow). The main source of meteoric water is vapor derived from<br />
evaporation of ocean water, which has maintained mean δ 18 O values<br />
near 0‰ (±2‰) for most of the Phanerozoic (Gregory, 1991; Yapp <strong>and</strong><br />
Poths, 1992; Tabor, 2007; Eiler, 2007). Over the continents, the oxygen<br />
<strong>and</strong> hydrogen isotope values of rainfall follow a Rayleigh-type<br />
distillation, whereby subsequent rain-out events have progressively<br />
more negative oxygen <strong>and</strong> hydrogen isotope values. The rain-out<br />
process is driven principally by cooling of the air-mass (Dansgaard,<br />
1964; Fig. 15), which may arise from vertical thermal uplift, physical<br />
transport over high-altitude sites (e.g., mountains), or latitudinal<br />
transport to cooler sites (e.g., Rozanski et al., 1993; Clark <strong>and</strong> Fritz,<br />
1997). The oxygen <strong>and</strong> hydrogen isotope values of rainfall are strongly<br />
correlated, <strong>and</strong> may be approximated by the equation for the meteoric<br />
water line (Craig, 1961): δD=8⁎δ 18 O+10. While there is abundant<br />
evidence for short-term departures from the meteoric water line (e.g.,<br />
Gat <strong>and</strong> Bowser, 1991; Krishnamurthy <strong>and</strong> Bhattacharya, 1991;<br />
Lawrence <strong>and</strong> White, 1991), the long-term weighted mean of<br />
precipitation δ 18 O <strong>and</strong> δD values indicates that the aforementioned<br />
equation for meteoric water is an accurate representation of isotopes<br />
in the meteoric water cycle. Considering that timescales for significant<br />
accumulation of authigenic minerals in soil profiles range from 10 3 –<br />
10 5 years, it is generally assumed that Craig's (1961) meteoric water<br />
line equation is an accurate representation of precipitation that rained<br />
upon, <strong>and</strong> percolated through, the soil profile (e.g., Yapp, 1993a,<br />
2001a,b; Delgado <strong>and</strong> Reyes, 1996; Ferguson et al., 1999; Savin <strong>and</strong><br />
Hsieh, 1998; Vitali et al., 2001; Tabor <strong>and</strong> Montañez, 2002, 2005; Tabor<br />
et al., 2002; Tabor, 2007; Gilg, 2003).<br />
In fact, both the δ 18 O<strong>and</strong>δD values of rainfall are correlated with<br />
surface air temperature (e.g., Fig. 15 — IAEA Database from Rozanski<br />
et al., 1993). Based upon previous studies of meteoric precipitation δ 18 O<br />
<strong>and</strong> δD values, Criss (1999; see also Dansgaard, 1964) arrived at the<br />
following correlation: δ 18 O MAP ≈0.695 MAT(°C) — 13.6, where MAP is the<br />
weighted mean annual precipitation <strong>and</strong> MAT is the mean annual<br />
surface atmospheric temperature. This general correlation indicates that<br />
precipitation δ 18 O values will decrease by ~0.7‰ with each °C fall in<br />
temperature. Given the relation between altitude, latitude, <strong>and</strong> temperature,<br />
Criss (1999) also presented empirical relationships between<br />
precipitation δ 18 O values <strong>and</strong> altitude, Δδ 18 O≈2±1‰ km −1 ,aswellas<br />
latitude, Δδ 18 O≈0.2±0.1‰ 100 km − 1 . Criss (1999) emphasizes,<br />
however, that these relationships are only rough approximations, <strong>and</strong><br />
as will be discussed in subsequent sections, application of these observed<br />
relations to the isotope composition of paleosol minerals<br />
(paleosol calcite, for example) as a means of <strong>paleoclimatic</strong> <strong>reconstruction</strong><br />
should be avoided or used with extreme caution.<br />
7.2. Carbon in soils<br />
The δ 13 C value of pedogenic minerals may be directly related to the<br />
δ 13 C value of CO 2 in the local soil environment (Cerling, 1984; Quade<br />
et al., 1989; Schroeder <strong>and</strong> Melear, 1999; Schroeder et al., 2006).<br />
However, soils may be characterized by mixing of one, two, or three<br />
components of soil CO 2 , which can result in significantly different δ 13 C<br />
values of soil CO 2 <strong>and</strong> the resulting soil mineral. The three CO 2 components<br />
are derived from (1) oxidation of in situ organic matter, (2)<br />
tropospheric CO 2 , <strong>and</strong> (3) dissolution of pre-existing carbon-bearing<br />
minerals such as carbonate in the soil (Yapp, 2001a,b, 2002). Based<br />
upon geological <strong>and</strong> chemical arguments, the conditions of soil CO 2<br />
mixing in the paleosol at the time of mineral crystallization must be<br />
assessed in order to interpret appropriately the environmental significance<br />
of mineral δ 13 C values (e.g., Quade et al., 1989; Hsieh <strong>and</strong><br />
Yapp, 1999; Tabor et al., 2004a,b; Tabor <strong>and</strong> Yapp 2005b; Tabor et al.,<br />
2007), <strong>and</strong> to determine whether the minerals formed in the presence<br />
of one, two, or three components of soil CO 2 .<br />
7.2.1. One-component soil CO 2<br />
In a strict sense, soils with only one component of CO 2 form under<br />
a chemically closed-system, but it is also useful to include in this<br />
category soils which form under semi-closed systems (e.g., Gluyas,<br />
1984; Tabor et al., 2007). Chemically closed or semi-closed conditions<br />
arise in settings where gaseous diffusion between the soil <strong>and</strong> the<br />
troposphere is limited, usually as a result of poorly drained, waterlogged<br />
conditions within the soil profile. Diffusion from the troposphere<br />
(including CO 2 ) to the soil is limited, <strong>and</strong> aqueous O 2 in the soil<br />
is quickly consumed by oxidation of organic matter (Feng <strong>and</strong> Hsieh,<br />
1998). Yet, oxidized carbon species (CO 2(aq) , HCO 3 − ,CO 3 2− ) may still be<br />
liberated from closed system soils at pH levels permissive of carbonate<br />
precipitation (~pH=5.5–8.5; Irwin et al., 1977; Gluyas, 1984) in the<br />
following types of reactions:<br />
SO 2−<br />
4 þ 2CH 2 O→H 2 S þ 2HCO − 3 ð48Þ<br />
SO 2−<br />
4 þ 2CH 2 O→HCO − 3 þ HS − þ H 2 O þ CO 2 : ð49Þ<br />
Fig. 15. Cross plot of weighted mean annual δ 18 O values versus mean annual surface air<br />
temperature for 209 weather stations from the International Atomic Energy Association<br />
(IAEA) global network for isotopes in precipitation database (Rozanski et al., 1993). The<br />
points upon the polygon that surround data points above 0 °C are used to construct a<br />
modern surface domain for hydroxylated minerals. See text for discussion.<br />
Under these conditions, both bicarbonate <strong>and</strong> resulting carbonbearing<br />
minerals will have δ 13 C values that are equivalent to that of the<br />
oxidizing organic matter in the closed-system soil. For example, given<br />
that C 3 plant organic matter has δ 13 C values ranging from approximately<br />
− 20 to − 33‰ (mean=− 27‰; see Section 7.6), carbon-bearingmineral<br />
δ 13 C values in a closed system soil profile will have δ 13 C values<br />
ranging from − 20 to − 33‰. Soilprofiles forming under semi-closed<br />
conditions will result in more positive calcite δ 13 C values (because<br />
Please cite this article as: Sheldon, N.D., Tabor, N.J., <strong>Quantitative</strong> <strong>paleoenvironmental</strong> <strong>and</strong> <strong>paleoclimatic</strong> <strong>reconstruction</strong> using paleosols, Earth-<br />
Science Reviews (2009), doi:10.1016/j.earscirev.2009.03.004
ARTICLE IN PRESS<br />
26 N.D. Sheldon, N.J. Tabor / Earth-Science Reviews xxx (2009) xxx–xxx<br />
tropospheric CO 2 is isotopically heavier; ~− 6.5 to − 8.0‰ during the<br />
Holocene), but will be isotopically more negative than δ 13 Cvaluesofthe<br />
same mineral that forms in a 2- or 3-CO 2 component soil. Minerals that<br />
may result from one-component soil CO 2 mixing include calcite (Tabor<br />
et al., 2007) <strong>and</strong> siderite (Mozley <strong>and</strong> Carothers, 1992; Mozley <strong>and</strong><br />
Wersin,1992; McMillan <strong>and</strong> Schwertmann,1988; Ludvigson et al.,1998;<br />
White et al., 2005). It is less likely that carbon-bearing minerals that<br />
require oxidizing conditions (e.g., Fe(CO 3 )OH in goethite; Yapp, 2001b)<br />
or free drainage (e.g., occluded CO 2 in gibbsite; Bárdossy <strong>and</strong> White,<br />
1979; Schroeder <strong>and</strong> Melear, 1999) will form in soils characterized by<br />
one component of soil CO 2 .<br />
7.2.2. Two-component soil CO 2<br />
Two-component soil CO 2 mixing assumes that the only two sources<br />
contributing to soil CO 2 are CO 2 from the open atmosphere (tropospheric<br />
CO 2 ) <strong>and</strong> CO 2 from in situ oxidation of biological carbon in the<br />
soil. Steady-state solutions to the one-dimensional Fickian diffusion<br />
equation yield reasonable representations of δ 13 C values of soil CO 2<br />
with depth in modern soils characterized by mixing of two sources of<br />
CO 2 (Cerling, 1984). In these models, the pCO 2 <strong>and</strong> δ 13 C value of Earth's<br />
atmosphere is the upper boundary condition, <strong>and</strong> there is a depthdependent<br />
CO 2 production term that describes the oxidation of organic<br />
carbon in the soil. Above a characteristic CO 2 production depth within<br />
the soil, both the concentration <strong>and</strong> δ 13 C of soil CO 2 will progressively<br />
approach values of the Earth's atmosphere. Thus, CO 2 in soil gas can be<br />
generally regarded as a mixture of two isotopically distinct endmembers<br />
in these soils: atmospheric CO 2 <strong>and</strong> CO 2 derived from in situ<br />
oxidation of soil organic matter (Fig. 16). As mentioned earlier, soil<br />
organic matter δ 13 C values are principally determined by (1) the δ 13 C<br />
of CO 2 in the global troposphere <strong>and</strong> (2) the photosynthetic pathway<br />
employed by primary producers within the soil profile. Therefore, for<br />
times in the geological past when C 3 photosynthesis was the dominant<br />
floral metabolism (pre-Miocene time; see 8.6) <strong>and</strong> soil organic matter<br />
δ 13 C exhibited minimal temporal or spatial variation (e.g., Tabor et al.,<br />
2004a,b; Peters-Kottig et al., 2006; Montañez et al., 2007), stratigraphic<br />
changes in mineral δ 13 C values among paleosol profiles may<br />
indicate either (1) variations in soil productivity (i.e., the concentration<br />
of CO 2 derived from in situ oxidation of organic matter) or (2)<br />
changes in atmospheric pCO 2 . In this regard, δ 13 C values of carbonbearing<br />
pedogenic minerals which formed in the presence of twocomponent<br />
soil CO 2 mixing have the potential to provide information<br />
about (1) paleoecology <strong>and</strong> (2) the concentration of CO 2 in ancient<br />
atmospheres. Pedogenic minerals which provide geochemical records<br />
of two-component soil CO 2 mixing include calcite (Cerling,1991; Mora<br />
et al., 1996; Yapp <strong>and</strong> Poths, 1996; Ekart et al., 1999; Tabor et al., 2004a,<br />
b), goethite (Yapp, 1987a,b; Yapp <strong>and</strong> Poths, 1992, 1993, 1996; Yapp,<br />
2004; Tabor et al., 2004a,b; Tabor <strong>and</strong> Yapp, 2005a), <strong>and</strong> gibbsite<br />
(Schroeder <strong>and</strong> Melear, 1999; Tabor <strong>and</strong> Yapp, 2005a,b; Schroeder<br />
et al., 2006). Of these minerals, only the geochemistry of calcite <strong>and</strong><br />
goethite are sufficiently understood to permit estimates of atmospheric<br />
pCO 2 . Both pedogenic calcite <strong>and</strong> goethite are relatively<br />
abundant in the terrestrial stratigraphic record, <strong>and</strong> thus have the<br />
potential to provide a relatively continuous Phanerozoic record of<br />
paleoatmospheric pCO 2 (see Section 7.4.3.1; Ekart et al., 1999) that<br />
may be cross-checked by independent proxy methods (Yapp <strong>and</strong><br />
Poths, 1996; Tabor et al., 2004a,b).<br />
Fig. 16. Steady-state model plot of soil depth in meters versus (A) soil CO 2 concentration <strong>and</strong> (B) δ 13 C values of soil CO 2 <strong>and</strong> pedogenic calcite. Solution to the soil CO 2 concentrations<br />
assumes Fickian, one-dimensional diffusion, of the form<br />
0 1<br />
ð/ = D s Þ × 1− e − z = Z<br />
pCO 2 = @<br />
410 6 A + 300<br />
22<br />
where ϕ is the production rate of CO 2 in the soil in gC cm − 3 h − 1 ,D s is the diffusion coefficient for gas through the soil, z is depth in meters in the soil, <strong>and</strong> Z is a scaling depth in meters,<br />
also called the characteristic production depth of CO 2 (Cerling, 1991) in the soil. This model soil is calculated with ϕ=0.00002 gC cm − 3 h − 1 , D s =0.0001, <strong>and</strong> Z=0.2, <strong>and</strong> 300 ppmV<br />
as the upper boundary limit of the soil (i.e., a tropospheric pCO 2 of 300 ppmV). Soil CO 2 δ 13 C values were calculated as a mass balance of tropospheric CO 2 (300 ppmV through<br />
profile) with δ 13 C value of − 6.5‰ (a reasonable pre-industrial age value; Schlesinger, 1997) <strong>and</strong> CO 2 from oxidation of organic matter (variable concentrations) with δ 13 C value of −<br />
6.5‰ (i.e., organic matter δ 13 C=− 26.4‰). Soil calcite δ 13 C values were calculated using the CO 2 -calcite carbon isotope fractionation equation of Bottinga (1968) with assumed<br />
calcite crystallization temperatures of 25 °C <strong>and</strong> mildly alkaline soil solution. See Text for discussion.<br />
Please cite this article as: Sheldon, N.D., Tabor, N.J., <strong>Quantitative</strong> <strong>paleoenvironmental</strong> <strong>and</strong> <strong>paleoclimatic</strong> <strong>reconstruction</strong> using paleosols, Earth-<br />
Science Reviews (2009), doi:10.1016/j.earscirev.2009.03.004
ARTICLE IN PRESS<br />
N.D. Sheldon, N.J. Tabor / Earth-Science Reviews xxx (2009) xxx–xxx<br />
27<br />
7.2.3. Three-component soil CO 2<br />
On the basis of geological <strong>and</strong> chemical arguments, several studies<br />
have concluded that three-component CO 2 mixing relations can exist<br />
in various soils (Hsieh <strong>and</strong> Yapp, 1999; Yapp, 2001a,b; 2002; Tabor<br />
et al., 2004a,b; Tabor <strong>and</strong> Yapp, 2005b,c). As in 2-component CO 2<br />
mixing, 3-component mixing assumes soil CO 2 is represented by<br />
sources contributed from oxidation of organic matter <strong>and</strong> the global<br />
troposphere, but includes also a third component of CO 2 contributed<br />
from dissolution of pre-existing carbonate in the soil profile. Although<br />
carbonate may have very negative δ 13 C values in rare<br />
instances (e.g., one-component CO 2 mixing; Yemane et al., 1989;<br />
Tabor et al., 2007; Coney et al., 2007), CO 2 that is produced from<br />
dissolution of carbonate generally is enriched in 13 C relative to atmospheric<br />
CO 2 or CO 2 derived from oxidation of organic matter (e.g.,<br />
Hoefs, 1997; Criss, 1999; Sharp, 2007). As a result of these mixing<br />
relationships, pedogenic minerals that form in 3-component soil CO 2<br />
mixing systems are characterized (<strong>and</strong> for the most part recognized)<br />
by δ 13 C values more positive than 1- or 2-component soil CO 2<br />
mixing. Pedogenic minerals which may form in the presence of<br />
mixing of 3 soil CO 2 components include goethite (Hsieh <strong>and</strong> Yapp,<br />
1999; Yapp, 2001a, 2002; Tabor et al., 2004a,b; Tabor <strong>and</strong> Yapp,<br />
2005b,c), gibbsite (Tabor <strong>and</strong> Yapp, 2005a,b), <strong>and</strong> possibly calcite.<br />
7.3. Soil <strong>and</strong> paleosol carbonate<br />
Precipitation of carbonate in soil profiles is related to evapotranspiration,<br />
acidity of soil solution, temperature, <strong>and</strong> availability of<br />
metal cations (Ca 2+ ,Fe 2+ ,Mg 2+ ). Carbonates may form in virtually<br />
any climate <strong>and</strong> soil drainage class (e.g., Whelan <strong>and</strong> Roberts, 1973;<br />
Soil Survey Staff, 1975, 2003; Semeniuk <strong>and</strong> Meagher, 1981;<br />
Franzmeier et al., 1985; Buol et al., 2003; Aslan <strong>and</strong> Autin, 1998;<br />
Retallack, 2001a,b; Schaetzl <strong>and</strong> Anderson, 2005). In poorly drained,<br />
swampy <strong>and</strong> anoxic environments, pedogenic siderite (FeCO 3 ) is<br />
common (McMillan <strong>and</strong> Schwertmann, 1988; Ludvigson et al., 1998)<br />
<strong>and</strong> calcite may also form (Whelan <strong>and</strong> Roberts,1973; Aslan <strong>and</strong> Autin,<br />
1998; Tabor et al., 2007). However, pedogenic calcite is typically<br />
associated with well-drained soil profiles in sub-humid, semi-arid,<br />
<strong>and</strong> arid climates (e.g., Soil Survey Staff, 1975; Machette, 1985;<br />
McFadden <strong>and</strong> Tinsley, 1985; Buol et al., 2003; Schaetzl <strong>and</strong> Anderson,<br />
2005; Srivastava et al., 2002) characterized by relatively low rainfall<br />
(~b800 mm/yr; Jenny, 1941; Arkley, 1963; Gile et al., 1966; Retallack,<br />
1994; Royer, 1999) <strong>and</strong> high evapotranspiration (Thornthwaite, 1948;<br />
Srivastava et al., 2002). In these well-drained, dry-climate soils,<br />
aqueous Ca 2+ ions derived from dissolution of minerals are<br />
transported downward into the soil profile until precipitated as<br />
carbonate or removed from the soil through the groundwater system<br />
(Ekart et al., 1999; Tabor et al., 2006).<br />
Macroscopic forms of pedogenic carbonate-accumulation occur as<br />
filamentous, nodular, tubular, <strong>and</strong> completely indurated <strong>and</strong> massive<br />
or laminated horizons (Gile et al., 1966; Machette, 1985). Petrographic<br />
studies indicate that pedogenic carbonate crystal fabrics are dominantly<br />
micrite, with lesser amounts of microspar, sparite, needle fiber,<br />
radial-fibrous <strong>and</strong> radiaxial textures (Deutz et al., 2002, 2001; Brewer,<br />
1976; Loisy et al., 1999; Fig. 17). Although it is apparent that many<br />
different crystal morphologies may form in modern soils, non-micrite<br />
crystal textures in paleosol profiles are frequently suspected of postpedogenic<br />
(i.e., diagenetic) alteration (e.g., Cerling, 1991; Ekart et al.,<br />
1999; Deutz et al., 2001, 2002).<br />
Pedogenic carbonate mineralogy is overwhelmingly dominated by<br />
low-magnesium calcite (Jenny, 1941; Brewer, 1976; Freytet <strong>and</strong><br />
Verrecchia, 2002; Sparks, 2003). Therefore, the majority of stableisotope<br />
based <strong>paleoenvironmental</strong> <strong>and</strong> paleoclimatological <strong>reconstruction</strong>s<br />
from paleosol carbonate focus upon low-magnesium calcite<br />
(e.g., Cerling, 1991; Ekart et al., 1999). However, other pedogenic<br />
carbonate minerals have been reported in rare cases. Mineralogical<br />
studies of soil <strong>and</strong> paleosol carbonates have also identified dolomite,<br />
trona, ankerite, <strong>and</strong> siderite (Postma, 1983; McMillan <strong>and</strong> Schwertmann,<br />
1988).<br />
Kohur et al. (1995) identified microcrystalline dolomite from a soil<br />
profile within a saltpan soil in Alberta, Canada. Dolomite has also been<br />
identified in weakly developed soils forming upon basaltic parent<br />
materials in Hawaii, U.S.A. (Capo et al., 2000; Whipkey et al., 2002).<br />
Ankerite nodules have also been identified in paleosol profiles that<br />
underwent marine flooding (Mack et al., in revision). Trona (Na 2 CO 3·<br />
NaHCO 3·2H 2 O) has also been reported from shallow subsurface<br />
horizons of floodplain soils of Uttar Pradesh, India (Datta et al., 2002).<br />
The origins of pedogenic dolomite, ankerite <strong>and</strong> trona are not entirely<br />
clear, but they are likely related to high chemical activity of aqueous<br />
Mg 2+ , Fe 2+ , <strong>and</strong> Na + in soil solution in conjunction with rapid<br />
evapotranspiration of soil water, <strong>and</strong> they are considered to represent<br />
exceedingly rare phenomena. As a result, the occurrence of dolomite<br />
<strong>and</strong> ankerite in paleosol profiles is usually attributed to diagenetic<br />
processes exclusive of pedogenesis.<br />
Pedogenic siderite has been identified in modern soil-forming<br />
environments (Postma,1981,1982; Stoops,1983; L<strong>and</strong>uyt,1990; Brewer,<br />
1964) <strong>and</strong> paleosol profiles (Matsumoto <strong>and</strong> Iijima, 1981; Leckie et al.,<br />
1989; Mozley <strong>and</strong> Carothers, 1992; Brown <strong>and</strong> Kingston, 1993; Baker et<br />
al., 1996; Ludvigson et al., 1998; Jacobs et al., 2005; White et al., 2005).<br />
The presence of siderite in a soil or paleosol profile indicates formation<br />
in a reducing environment, low concentrations of aqueous sulfate,<br />
circum-neutral pH, <strong>and</strong> soil pCO 2 greater than 100,000 ppmV (Pearson,<br />
1979; Postma 1982; Bahrig, 1989; Pye et al., 1990). Although siderite is a<br />
common diagenetic alteration product (e.g., Mozley, 1988; Mozley <strong>and</strong><br />
Carothers, 1992), microspherulitic siderite (Spencer, 1925; seeFig. 17)<br />
appears to be strongly associated with pedogenesis in poorly drained,<br />
waterlogged soils (Stoops, 1983; L<strong>and</strong>uyt, 1990; Browne <strong>and</strong> Kingston,<br />
1993; Ludvigson et al., 1998; Ufnar et al., 2002, 2004; White et al., 2001,<br />
2005; Jacobs et al., 2005).<br />
7.3.1. Pedogenic calcite δ 18 O values<br />
The δ 18 O value of calcite is related to the δ 18 O value of the water<br />
from which it is derived, <strong>and</strong> the temperature of mineral crystallization<br />
(see equation of O'Neil et al., 1969 in Table 5). The potential of<br />
calcite oxygen isotope ratios as a paleotemperature proxy has been<br />
recognized for a very long time (McCrea, 1950; Epstein et al., 1953).<br />
Early studies acknowledged that δ 18 O values of soil (Salomons et al.,<br />
1978; Magaritz <strong>and</strong> Amiel, 1980; Magaritz et al., 1981; Rabenhorst<br />
et al., 1984; Cerling, 1984; Quade et al., 1989; Cerling <strong>and</strong> Quade, 1993)<br />
<strong>and</strong> paleosol (Quade et al., 1989; Mack et al., 1991; Yapp <strong>and</strong> Poths,<br />
1996) calcite are probably related to temperature of crystallization,<br />
but that its utility as a temperature proxy might be confounded by the<br />
effects of variable rainfall δ 18 O values at isothermal sites (e.g., Fig. 15;<br />
Cerling <strong>and</strong> Quade, 1993; Stern et al., 1997; Tabor <strong>and</strong> Montañez,<br />
2002) <strong>and</strong> modification of soil water δ 18 O values by evapotranspiration<br />
(Cerling, 1984; Mack et al., 1991; Stern et al., 1997; Tabor et al.,<br />
2002; Mack <strong>and</strong> Cole, 2005; Tabor <strong>and</strong> Montañez, 2005; Behrensmeyer<br />
et al., 2007; Tabor, 2007). In spite of these complicating factors,<br />
paleosol calcite δ 18 O values are still perceived as a useful indication of<br />
soil moisture δ 18 O values (Cerling, 1984; Quade et al., 1989; Cerling<br />
<strong>and</strong> Quade, 1993; Stern et al., 1997).<br />
7.3.1.1. Pedogenic calcite as a proxy for soil moisture δ 18 Ovalues. Several<br />
important studies have used the δ 18 O values of paleosol calcite as a<br />
monitor of rainfall δ 18 Ovalues.Quade et al. (1989) observed a large<br />
shift toward more positive paleosol calcite δ 18 O values in Miocene<br />
strata from Northern Pakistan that were deposited ~7 Myr before<br />
present. This positive oxygen isotope shift was subsequently<br />
identified in other areas around Asia (Stern et al., 1997; Sanyal et<br />
al., 2004; Behrensmeyer et al., 2007), <strong>and</strong> is interpreted to represent<br />
changing atmospheric circulation conditions (<strong>and</strong> precipitation δ 18 O<br />
values) over the Indian subcontinent, <strong>and</strong> intensification to the modern<br />
Asian monsoon system. In a large study of Miocene–Pleistocene<br />
Please cite this article as: Sheldon, N.D., Tabor, N.J., <strong>Quantitative</strong> <strong>paleoenvironmental</strong> <strong>and</strong> <strong>paleoclimatic</strong> <strong>reconstruction</strong> using paleosols, Earth-<br />
Science Reviews (2009), doi:10.1016/j.earscirev.2009.03.004
ARTICLE IN PRESS<br />
28 N.D. Sheldon, N.J. Tabor / Earth-Science Reviews xxx (2009) xxx–xxx<br />
Fig. 17. Photomicrographs of paleosol carbonates. Mi=micrite, Sp=Sparite, MS =microspar (A) Nearly pure microcrystalline calcite (micrite; gray areas) that occludes mudstone<br />
from the matrix (red areas) in an Upper Triassic (Carnian) paleosol carbonate nodule of the Ischigualasto fm., Argentina. The area shown is appropriate for sampling, <strong>and</strong><br />
determination of δ 18 O <strong>and</strong> δ 13 C values, in order to approximate environmental conditions during pedogenesis. Field of view is 2 mm. (B) Nearly pure micrite from a cross-section of a<br />
vertically oriented rhizolith in a paleosol from the Middle Permian Quanzijie fm, Xinjiang Province, Northwest China. The area shown is appropriate for sampling, <strong>and</strong> determination<br />
of δ 18 O <strong>and</strong> δ 13 C values, in order to approximate environmental conditions during pedogenesis. The red areas are colored by stain from potassium ferricyanide, which indicates lowmagnesium<br />
calcite. The light gray areas are gypsum. Scale bar is 1 mm. (C) Domains of (1) micrite, (2) veins of sparry calcite, <strong>and</strong> (3) mixed micrite, microspar <strong>and</strong> Fe-oxide in a<br />
paleosol nodule from the Late Triassic (Carnian) Ischigualasto fm., Argentina. δ 18 O <strong>and</strong> δ 13 C values from domains of sparry calcite <strong>and</strong> mixed microspar <strong>and</strong> micrite are inappropriate,<br />
whereas δ 18 O <strong>and</strong> δ 13 C values from domains of micrite are appropriate, for sampling <strong>and</strong> measurement of oxygen isotope values in order to approximate environmental conditions<br />
during pedogenesis. Field of view is 4 mm. (D) Clotted micrite (dark areas) that is finely intergrown with microspar (light areas) from a paleosol nodule in Cretaceous<br />
(Kimmeridgian) strata of the Democratic Republic of Congo. Dark areas are stained by Fe-oxides. Field of view is 0.5 mm. While the areas of clotted micrite are appropriate for oxygen<br />
<strong>and</strong> carbon isotope analysis in order to approximate pedogenic conditions, very fine intergrowth of microspar <strong>and</strong> micrite makes sampling of the appropriate phase very challenging,<br />
<strong>and</strong> likely only feasible via a computer-assisted drill system. (E) Lamellar micrite intercalated with sparry calcite from a horizontal rhizolith in the Middle Permian Moradi fm., Niger.<br />
Field of view is 2 mm. While areas of micritic calcite are appropriate for sampling <strong>and</strong> oxygen <strong>and</strong> carbon isotope analysis in order to interpret environmental conditions during<br />
pedogenesis, domains of micrite are relatively narrow, <strong>and</strong> divided by complex networks of sparry <strong>and</strong> microspar cements. Samples such as this should be avoided for isotopic<br />
analysis, or employ a computer-assisted drill system. Sampling. (F) Sphaerosiderites in claystone matrix from an Upper Oligocene paleosol in Chilga Woreda, northwestern Ethiopia.<br />
Siderite spherules such as these are appropriate for carbon <strong>and</strong> oxygen isotope analysis in order to interpret environemtnal conditions during pedogenesis. (For interpretation of the<br />
references to colour in this figure legend, the reader is referred to the web version of this article.)<br />
paleosols from the mid-continent, U.S.A., Fox <strong>and</strong> Koch (2004)<br />
suggested that long-term trends in calcite δ 18 O values appear to track<br />
changes in rainfall δ 18 O values related global-scale paleoclimate<br />
factors, where the most positive δ 18 O values occur in strata from the<br />
mid-Miocene climatic optimum, <strong>and</strong> a stepped trend toward more<br />
negative δ 18 O values occurs in post mid-Miocene samples during the<br />
interval of Late Cenozoic cooling, <strong>and</strong> northern hemisphere glaciation.<br />
Levin <strong>and</strong> others (2004) observed a positive ~5.5‰ shift in δ 18 O<br />
values of paleosol calcite occurring in ~4.5 Ma strata of southern<br />
Ethiopia which they attributed to climatic change possibly including<br />
closure of the Indonesian seaway, long-term uplift of the East African<br />
highl<strong>and</strong>s, <strong>and</strong> aridification of eastern Africa. Koch et al. (2003) noted<br />
a small positive δ 18 O shift of approximately 1‰ in the Bighorn Basin,<br />
Wyoming, U.S.A., that is synchronous with the Paleocene–Eocene<br />
Please cite this article as: Sheldon, N.D., Tabor, N.J., <strong>Quantitative</strong> <strong>paleoenvironmental</strong> <strong>and</strong> <strong>paleoclimatic</strong> <strong>reconstruction</strong> using paleosols, Earth-<br />
Science Reviews (2009), doi:10.1016/j.earscirev.2009.03.004
ARTICLE IN PRESS<br />
N.D. Sheldon, N.J. Tabor / Earth-Science Reviews xxx (2009) xxx–xxx<br />
29<br />
Thermal Maximum. This positive oxygen isotope shift was attributed<br />
to increased evapotranspiration, changing δ 18 O value of meteoric<br />
water from the airmasses over that site, or changes in the seasonality<br />
of rainfall.<br />
In a regional study of uppermost-Pennsylvanian <strong>and</strong> lowermost-<br />
Permian paleosols spanning ~10° of tropical paleolatitude in western<br />
Pangea, Tabor <strong>and</strong> Montañez (2002) noted a northward trend toward<br />
more negative δ 18 O values, from ~− 0.5‰ at the paleoequator to ~− 8‰<br />
at 10°N paleolatitude. A similar, but smaller, pattern of northward 18 O<br />
depletion was observed in co-occuring pedogenic phyllosilicates <strong>and</strong> Feoxides.<br />
The collective pattern of pedogenic mineral δ 18 O values was<br />
interpreted to represent reverse equatorial flow, <strong>and</strong> occurrence of<br />
monsoonal atmospheric circulation patterns over western equatorial<br />
Pangea. The stratigraphic pattern of paleosol calcite δ 18 O values in Texas,<br />
U.S.A. preserves a 5‰ shift toward more positive values through the<br />
Lower Permian, which was interpreted to represent decreasing rainfall,<br />
onset of aridity, <strong>and</strong> increased evaporative enrichment of 18 Oinsoil<br />
waters (Tabor et al., 2002). Subsequent paleotemperature estimates<br />
derived from independent proxies suggest that most of the temporal<br />
pattern of 18 O enrichment in calcite was related to evapotranspiration<br />
(Tabor <strong>and</strong> Montañez, 2005; Tabor, 2007).<br />
Given the observed correspondence among rainfall δ 18 O values,<br />
temperatures <strong>and</strong> elevations, many studies have used paleosol calcite<br />
δ 18 O values as a proxy of paleoelevation (Garzione et al., 2000, 2004;<br />
Currie et al., 2005; Rowley <strong>and</strong> Currie, 2006; DeCelles et al., 2007; see<br />
recent review by Rowley <strong>and</strong> Garzione, 2007; Quade et al., 2007). In<br />
these studies, paleoelevation estimates are based typically upon<br />
measurements of rainfall δ 18 O values <strong>and</strong> surface air temperatures<br />
along modern elevation transects. These modern data permit estimates<br />
of calcite δ 18 O values that would result along the modern elevation<br />
transect, <strong>and</strong> the δ 18 O value of paleosol calcite is compared directly with<br />
the modern calcite δ 18 O “lapse-rate” curve to arrive at an estimate of<br />
paleoelevation. Isotope-based proxies of paleoelevation have been<br />
reviewed extensively in recent years (Rowley <strong>and</strong> Garzione, 2007;<br />
Quade et al., 2007), <strong>and</strong> the reader is referred to those studies for a more<br />
thorough treatment of paleoelevation <strong>reconstruction</strong>s.<br />
In general, paleoelevations derived from paleosol calcite δ 18 O values<br />
are seemingly robust (i.e., reproducible <strong>and</strong> consistent within a<br />
given setting) <strong>and</strong> consistent with other structural <strong>and</strong> geodynamical<br />
data, but the choice of lapse-rate model greatly affects the absolute<br />
paleoelevation values that are reconstructed <strong>and</strong> the amount of<br />
uncertainty in the estimates. In particular, the authors note that<br />
studies that reconstruct paleoelevations using pedogenic carbonates<br />
typically contain little other information about the paleosols in question<br />
because they are generally focused instead on the tectonic<br />
implications of the calculated paleoelevation values. Collection <strong>and</strong><br />
inclusion in papers of additional photographic documentation, taxonomic<br />
classification, <strong>and</strong> documentation of the suitability of the<br />
pedogenic nodules should be goals of future paleoelevation studies,<br />
even if the information is presented primarily as Data Repository<br />
items. Those types of information <strong>and</strong> application of additional <strong>paleoclimatic</strong><br />
proxies for MAT <strong>and</strong> MAP could only strengthen the<br />
interpretations of paleoelevation <strong>and</strong> could also serve as an important<br />
additional test of how reasonable the reconstructed paleoelevation<br />
estimates are. For example, if a paleo-Ultisol (Argillisol; typically free<br />
of any pedogenic carbonate) is identified as having been formed at a<br />
paleo-elevation of 5500 m, then either the taxonomic description or<br />
the lapse rate model must be incorrect based on the present-day<br />
distribution of soil types (Soil Survey Staff, 2006).<br />
7.3.1.2. Pedogenic calcite δ 18 O values as a proxy of paleotemperature.<br />
Dworkin et al. (2005) was the first study that attempted to formalize<br />
paleosol calcite δ 18 O values as a quantitative indicator of soil paleotemperature.<br />
Dworkin et al. (2005) presented two different equations<br />
to relate the δ 18 O value of pedogenic calcite to temperature of<br />
crystallization from Cretaceous-age paleosol profiles in western Texas,<br />
U.S.A. The first equation (Eq. (50) below) is a third-order polynomial<br />
that relates the observed parametric correlation between air temperature<br />
from the entire International Atomic Energy Association<br />
(IAEA) data set (Rozanski et al., 1993) to pedogenic calcite via the<br />
oxygen isotope fractionation equation between water <strong>and</strong> calcite<br />
(O'Neil et al., 1969; see Table 5). The second equation (Eq. (51) below)<br />
is derived from the empirical relationship that was measured between<br />
pedogenic calcite δ 18 O values (δ 18 O cc ) <strong>and</strong> measured mean annual<br />
surface air temperature from soils located in interior continental sites<br />
(Cerling <strong>and</strong> Quade, 1993):<br />
0 ¼ −0:50T 3 þðδ 18 O cc ð‰; SMOWÞþ152:04ÞT 2 −2:78 10 6 ð50Þ<br />
<strong>and</strong><br />
ð2Þδ 18 O cc ð‰; PDBÞ ¼0:49T−12:65:<br />
ð51Þ<br />
This method of paleotemperature estimation has also been applied<br />
to calcite δ 18 O values from Upper Triassic (Prochnow et al., 2006) <strong>and</strong><br />
Cretaceous (Nordt et al., 2003) paleosols.<br />
The analytical uncertainty of the temperature estimates reported<br />
by Dworkin et al. (2005) is ~±0.5 °C (1σ), which reflects only the<br />
analytical uncertainty of the δ 18 O measurement for calcite (~0.1 to<br />
0.2‰) <strong>and</strong> no other potential sources of error. Considering an analytical<br />
uncertainty equivalent to ±0.5 °C, Eqs. (50) <strong>and</strong> (51) indicate<br />
that paleotemperature estimates based on paleosol calcite δ 18 O values<br />
are indistinguishable from one another between ~12° <strong>and</strong> 20 °C,<br />
corresponding to δ 18 O cc-PDB values ranging from − 2.9‰ to − 6.7‰.<br />
Pedogenic carbonate δ 18 O values above or below these values will<br />
result in significantly different temperature estimates from Eqs. (50)<br />
<strong>and</strong> (51). However, the method of Dworkin et al. (2005) does not take<br />
into account two potentially important effects (1) variable rainfall<br />
δ 18 O values among isothermal sites (see Fig. 15) <strong>and</strong> (2) change of soil<br />
water δ 18 O values (<strong>and</strong> resultant calcite δ 18 O values) from meteoric<br />
water via evaporation.<br />
Fig. 15 shows the δ 18 O value of meteoric precipitation versus the<br />
corresponding mean annual surface air temperature for 222 stations<br />
from the IAEA global precipitation database (Rozanski et al., 1993).<br />
Precipitation δ 18 O varies among isothermal sites by ~10‰ to 5‰,<br />
which would be approximately the same range of δ 18 O values of<br />
calcite that results from those waters among those sites. These results<br />
indicate that temperature estimates based on soil calcite δ 18 O values<br />
should have an uncertainty no better than ±5 °C (Ferguson et al.,<br />
1999). Note that this uncertainty does not consider additional<br />
complications, such as modification of meteoric water δ 18 O values in<br />
the soil by evaporation.<br />
The effect of evaporation on soil moisture δ 18 O values is related to<br />
relative humidity (h) as water molecules move from the liquid to vapor<br />
phase (Gonfiantini, 1986). No change in soil moisture δ 18 O values will<br />
result at h=100%, <strong>and</strong> the greatest enrichment of 18 O (more positive<br />
δ 18 O values) in soil water will occur at h=0%. During calcite crystallization<br />
in the soil, relative humidity during evaporation is somewhere<br />
between these two extremes (Sparks, 2003). The practical consequence<br />
of evaporation from the soil is that soil water is driven toward heavier<br />
δ 18 O values than the δ 18 O values of rains that originally percolated into<br />
the soil. The evaporation effect, <strong>and</strong> 18 O enrichment of soil moisture, is<br />
enhanced in the shallowest parts of the soil <strong>and</strong> during the driest time of<br />
year (e.g., Fig. 18); where <strong>and</strong> when soil carbonate is most likely to form<br />
(McFadden <strong>and</strong> Tinsley, 1985). However, 18 O enrichment of soil water is<br />
attenuated at depth, <strong>and</strong> closely approximates the mean δ 18 O value of<br />
meteoric precipitation (Fig. 18). Considering these spatial relationships,<br />
only those calcite samples from the lowest parts of soil <strong>and</strong> paleosol<br />
profiles should be used to estimate meteoric water δ 18 Ovalues(Quade<br />
et al., 1995). Nevertheless, for instances where paleotemperature <strong>and</strong><br />
paleoprecipitation δ 18 O values have been determined by independent<br />
proxies, paleosol calcite δ 18 O values indicate that soil moisture δ 18 O<br />
values may have been altered by evaportion by as much as +5 to +7‰<br />
Please cite this article as: Sheldon, N.D., Tabor, N.J., <strong>Quantitative</strong> <strong>paleoenvironmental</strong> <strong>and</strong> <strong>paleoclimatic</strong> <strong>reconstruction</strong> using paleosols, Earth-<br />
Science Reviews (2009), doi:10.1016/j.earscirev.2009.03.004
ARTICLE IN PRESS<br />
30 N.D. Sheldon, N.J. Tabor / Earth-Science Reviews xxx (2009) xxx–xxx<br />
Fig. 18. δ 18 O values of meteoric precipitation (black line), soil moisture at 10 cm, <strong>and</strong> soil moisture at 60 cm depth in a modern soil profile in Ellensburg, Washington U.S.A., versus progressive<br />
days of analysis (Robertson <strong>and</strong> Gazis, 2005). The shallowest sample level (10 cm) of the profile has soil water δ 18 Ovaluessignificantly more positive (~9‰) δ 18 O values than that of mean<br />
annual precipitation values, whereas the deepest sample level (60 cm) of the profile has δ 18 O values very near that that of the mean δ 18 O value of precipitation. See text for discussion.<br />
(Tabor <strong>and</strong> Montañez, 2005; Tabor 2007). Because of all of these factors,<br />
paleosol calcite δ 18 O values should probably be avoided as a proxy of<br />
paleotemperature.<br />
7.3.2. Pedogenic siderite as a proxy for soil moisture δ 18 O values<br />
Pedogenic sphaerosiderites exhibit δ 18 O values ranging from ~0‰ to<br />
−18‰ (PDB; Baker et al.,1996; Ludvigson et al.,1998; White et al., 2001;<br />
Ufnar et al., 2002, 2004). However, siderite δ 18 O values typically exhibit<br />
a narrow range of intra-profile values (b2‰), which is interpreted to<br />
reflect relatively stable (invariant) temperatures <strong>and</strong> mean δ 18 Ovalueof<br />
local groundwater that flood the soil profile (Ludvigson et al., 1988;<br />
White et al., 2001; Ufnar, 2002, 2004). Nevertheless, because the δ 18 O<br />
value of siderite is related to two variables (T <strong>and</strong> δ 18 OofH 2 O), one<br />
variable must be assumed, or determined by an independent means, in<br />
order to determine the other (as is the case with pedogenic calcite). In<br />
their treatment of sphaerosiderite δ 18 O values from paleosols that<br />
defined a mid-Cretaceous paleolatitudinal transect from ~35° to 55°N,<br />
White et al. (2001; Ludvigson et al., 1998; Ufnar et al., 2002, 2004)used<br />
the predicted mean annual surface air temperatures from General<br />
Circulation Models (GCM) for Middle Cretaceous time (Barron, 1989;<br />
Barron et al., 1989; Poulsen,1999) in order to estimate groundwater <strong>and</strong><br />
meteoric precipitation δ 18 O values. Sphaerosiderite δ 18 O values indicate<br />
significantly more negative δ 18 O values (4.0–4.3‰) of mid-Cretaceous<br />
meteoric precipitation than modern isolatitudinal sites. Based upon the<br />
well-known relationship in the modern hydrological cycle, that coastal<br />
precipitation shows ~− 2‰ shift for every additional 100 mm of<br />
precipitation per month, White et al. (2001) hypothesized that these<br />
sphaerosiderite-producing soils formed in the presence of ~2400 to<br />
~2600 mm of precipitation per yr along the coastlines of the North<br />
American Cretaceous interior seaway.<br />
Other examples of sphaerosiderite in paleosol profiles have been<br />
described from high-latitude Permo-Carboniferous (Brown <strong>and</strong> Kingston,<br />
1993; Faure et al., 1995) <strong>and</strong> Triassic strata (Retallack, 1976) as<br />
well as tropical Paleogene strata (Jacobs et al., 2005; Fig. 17). They<br />
typically occur in clastic strata that are associated with coal measures.<br />
In this regard, sphaerosiderite may be an abundant paleopedogenic<br />
mineral in both time <strong>and</strong> space, which is limited to poorly drained<br />
environments, <strong>and</strong> that has gone largely unnoticed as a useful proxy of<br />
paleoclimate. If so, δ 18 O values of paleopedogenic sphaerosiderites<br />
have the potential to become an important paloeclimate proxy which<br />
represents pedogenic environments that are generally exclusive of<br />
pedogenic calcite.<br />
7.4. δ 13 C values of soil carbonate<br />
7.4.1. Calcite from one-component of soil CO 2<br />
The closed-system, one-component soil CO 2 model of calcite<br />
crystallization is not normally considered in soil systems, but is<br />
frequently associated with early diagenetic marine <strong>and</strong> lacustrine<br />
calcites that are characterized by very negative δ 13 C values (e.g., Irwin<br />
et al., 1977; Gluyas, 1984; Scotchman, 1991). Calcites that precipitate<br />
via one component, chemically closed or semi-closed, conditions will<br />
have δ 13 C values no more than 14.8‰ heavier than in situ soil organic<br />
matter. This reflects that open-system oxidation of soil organic matter,<br />
in the absence of contribution of isotopically heavier CO 2 from the<br />
global troposphere, results in (at least) 4.4‰ diffusive enrichment,<br />
<strong>and</strong> an additional ~10.4‰ carbon isotope enrichment from gaseous<br />
CO 2 to calcite due to carbon isotope fractionation between carbonate<br />
species (at mildly alkaline pH; Bottinga, 1968).<br />
Evidence for calcite formation in the presence of one soil CO 2<br />
component is sparse. However, a study of waterlogged soils in the<br />
Atchafalaya Swamp, Louisiana, U.S.A. demonstrated that calcite δ 13 C<br />
values can be less than − 20‰, <strong>and</strong> therefore did not crystallize under<br />
open-system exchange with tropospheric CO 2 (Whelan <strong>and</strong> Roberts,<br />
1973). In this regard, calcite precipitation in the presence of one soil<br />
CO 2 component may be a reasonably common occurrence in swampy,<br />
waterlogged soil <strong>and</strong> paleosol profiles. Given the sedimentary bias<br />
toward preservation of low-lying <strong>and</strong> poorly-drained l<strong>and</strong>scapes,<br />
there may be also a bias toward preservation of paleosol calcite that<br />
forms via one component of soil CO 2 .<br />
As mentioned above, calcite crystallization in the presence of one<br />
CO 2 component is related to dysoxic or anoxic conditions in poorly<br />
drained soil profiles. Therefore, at field scale, one-component soil<br />
calcites may be associated with profiles that exhibit drab or redoximorphic<br />
soil matrix colors <strong>and</strong> weak or no development of soil structure<br />
(Vepraskas, 1992). However, soil <strong>and</strong> paleosol colors are strongly<br />
susceptible to change after burial (e.g., Retallack, 1991), therefore very<br />
negative calcite δ 13 C values may be the most diagnostic characteristic of<br />
a one-component soil CO 2 system. Examples of paleosol calcite that have<br />
been interpreted to form in the presence of one component of soil CO 2<br />
Please cite this article as: Sheldon, N.D., Tabor, N.J., <strong>Quantitative</strong> <strong>paleoenvironmental</strong> <strong>and</strong> <strong>paleoclimatic</strong> <strong>reconstruction</strong> using paleosols, Earth-<br />
Science Reviews (2009), doi:10.1016/j.earscirev.2009.03.004
ARTICLE IN PRESS<br />
N.D. Sheldon, N.J. Tabor / Earth-Science Reviews xxx (2009) xxx–xxx<br />
31<br />
are also rare. However, paleosol calcite δ 13 C values from Upper Permian<br />
<strong>and</strong> Lower Triassic strata of the Karoo Supergroup are characterized by<br />
drab colors, poor soil structural development, <strong>and</strong> calcite δ 13 C values as<br />
low as − 24‰ (Yemane et al., 1989; Macleod et al., 2000; Retallack et al.,<br />
2003; Smith <strong>and</strong> Botha, 2005; Tabor et al., 2007; Melezhik et al., 2007;<br />
Coney et al., 2007). Although the meaning of the very negative δ 13 C<br />
calcite values in the Karoo basin has been interpreted to represent<br />
different processes (e.g., Oceanic links, marine-derived methane;<br />
Macleod et al., 2000), they may possibly represent crystallization in<br />
the presence of one soil CO 2 component (Tabor et al., 2007).<br />
7.4.2. δ 13 C of pedogenic siderite<br />
Pedogenic sphaerosiderite is characterized by a large range of δ 13 C<br />
values, from ~+8‰ to − 45‰, <strong>and</strong> intraprofile sphaerosiderite δ 13 C<br />
values preserve a range of δ 13 C values that vary by as much as 30‰. As<br />
mentioned above, formation of sphaerosiderite in soils is associated<br />
with saturated, anoxic soil profiles that are conducive to methanogenic<br />
bacteria (Faure et al., 1995; Ludvigson et al., 1998; White et al., 2001).<br />
Kinetic carbon isotope fractioantion between CO 2 <strong>and</strong> CH 4 that is<br />
generated by methanogenesis (10 3 ln 13 αCO 2 –CH 4 )rangesfrom~40‰ to<br />
60‰, <strong>and</strong> may produce CO 2 with δ 13 C values as positive as 7‰ (Whiticar<br />
et al.,1986; Faure et al.,1995). Therefore, sphaerosiderites with the most<br />
positive δ 13 C values (N−5‰; Irwin et al., 1977) may represent CO 2 that<br />
was generated directly from methanogenesis, whereas more negative<br />
δ 13 C values may result from (1) closed-system, one-component CO 2<br />
mixing as described above (see Section 7.2.1) <strong>and</strong>/or (2) possible<br />
additional contributions of CO 2 derived from oxidation of methanogenic<br />
CH 4 (Irwin et al.,1977; Faure et al.,1995; Ludvigson et al.,1998). Because<br />
of its complex behaviour, no significant contributions to paleoclimate<br />
<strong>reconstruction</strong> have been made from sphaerosiderite δ 13 Cvalues.<br />
7.4.3. Calcite derived from 2-component soil CO 2 mixing<br />
Two-component models assume that the only sources contributing<br />
to soil CO 2 are CO 2 from the troposphere <strong>and</strong> CO 2 derived from in<br />
situ oxidation of biological carbon in the soil. Under steady-state<br />
conditions of Fickian diffusion, calcite δ 13 C values are expected to<br />
exhibit progressively more positive values upward through the soil or<br />
paleosol profile (see discussion of 2-component soil CO 2 mixing in<br />
Section 7.2.2). The vast majority of studies of soil <strong>and</strong> paleosol calcite<br />
carbon isotopes have sought to interpret δ 13 C values within the<br />
context of a 2-component soil CO 2 mixing model. This reflects, in large<br />
part, that 2-component soil calcite δ 13 C values may permit estimation<br />
of paleoatmospheric pCO 2 .<br />
Two-component soil CO 2 mixing requires free drainage for<br />
oxidation of organic matter <strong>and</strong> open-system exchange with the<br />
global troposphere. As a result, paleosol calcite samples associated<br />
with profiles that lack gley colors, redoximorphic accumulations such<br />
as hematite or manganese nodules, <strong>and</strong> that exhibit well-developed<br />
soil structure are generally regarded as appropriate paleosols for<br />
estimation of paleoatmospheric pCO 2 from calcite δ 13 C values (Ekart<br />
et al., 1999). Furthermore, paleosol matrix should be non-calcareous<br />
in order to avoid possible inheritance of detrital carbonate δ 13 C values,<br />
<strong>and</strong> carbonate texture <strong>and</strong> mineralogy other than microcrystalline<br />
calcite (micrite) should be avoided, as they are possibly diagenetic<br />
alteration products not reflective of conditions during soil formation.<br />
Any inferences about paleoatmospheric pCO 2 values from inappropriate<br />
samples should be disregarded.<br />
7.4.3.1. Estimates of paleoatmospheric pCO 2 . The δ 13 C values of<br />
pedogenic calcite <strong>and</strong> coexisting organic matter may be used to<br />
estimate atmospheric pCO 2 via the following two-component CO 2<br />
mixing equation (Yapp <strong>and</strong> Poths, 1996):<br />
<br />
<br />
δ 13 C mðccÞ = δ 13 C AðccÞ − δ 13 C OðccÞ ðC A =C S Þ cc<br />
+ δ 13 C OðccÞ ð52Þ<br />
Other equations for the solution of paleoatmospheric pCO 2 from<br />
pedogenic mineral δ 13 C values have been presented (Cerling, 1991,<br />
1999; Mora et al., 1996; Ekart et al., 1999; Montañez et al., 2007), but<br />
they all consider the same variables, <strong>and</strong> result in similar pCO 2<br />
estimates. δ 13 C mðccÞ is the measured δ 13 C value of pedogenic calcite.<br />
The δ 13 C values subscripted with “A” <strong>and</strong> “O” are the δ 13 C values of<br />
calcite formed solely in equilibrium with CO 2 derived from the<br />
atmosphere <strong>and</strong> from oxidation of soil organic matter, respectively.<br />
The subscript “(cc)” indicates calcite. C A refers to the concentration of<br />
CO 2 gas in the soil if the only contribution to soil CO 2 were from the<br />
atmosphere. C S is the actual concentration of CO 2 that was present in<br />
the soil. The value for (δ 13 C AðccÞ −δ 13 C OðccÞ ) is assumed to be +16‰<br />
(Yapp <strong>and</strong> Poths, 1991, 1992, 1993, 1996), because it represents the<br />
approximate difference between the estimated δ 13 C values of preindustrial<br />
atmospheric CO 2 (− 6.5‰) <strong>and</strong> recent C 3 continental biota<br />
(−27‰), after the latter value is adjusted for the diffusive 4.4‰<br />
enrichment in δ 13 C in the biologically-derived CO 2 of the soil (Cerling<br />
et al., 1991). Note that other (δ 13 C AðccÞ −δ 13 C OðccÞ ) values have been<br />
suggested (e.g., ~13.7‰, Arens et al., 2000), but differences in this<br />
quantity result in relatively minor differences in estimated pCO 2<br />
values (Yapp <strong>and</strong> Poths, 1991; Tabor et al., 2004a,b).<br />
δ 13 C O(cc) values may be estimated from measured δ 13 C values of<br />
co-existing organic matter within the paleosol profiles (Tabor et al.,<br />
2004a,b; Montañez et al., 2007). δ 13 C O(cc) values should be at least<br />
14.8‰ heavier than the δ 13 C value of oxidizing organic matter in opensystem<br />
soils characterized by mixing of two components of CO 2 (Tabor<br />
et al., 2007). This reflects the diffusive 4.4‰ enrichment in δ 13 C in the<br />
biologically-derived CO 2 (Cerling et al., 1991), as well as an additional<br />
10.4‰ carbon isotope enrichment from gaseous CO 2 to calcite due to<br />
carbon isotope fractionation between carbonate species (at mildly<br />
alkaline pH; Bottinga, 1968). However, Bowen <strong>and</strong> Beerling (2004)<br />
suggest that δ 13 C values of organic matter remaining in paleosol<br />
profiles may result in an overestimate of respired soil CO 2 δ 13 C (<strong>and</strong><br />
δ 13 C O(cc) ), <strong>and</strong> a significant underestimate of atmospheric pCO 2 .If<br />
Bowen <strong>and</strong> Beerling (2004) are correct, then use of fossil organic<br />
matter δ 13 C values for δ 13 C O(cc) provides minimum estimates of<br />
atmospheric pCO 2 rather than absolute estimates.<br />
Because the activity of CO 2− 3 in calcite is fixed at unity, pedogenic<br />
calcite does not, by itself, contain a proxy record of the partial pressure<br />
of soil CO 2 (however, pedogenic goethite does, see Section 7.4.3.3).<br />
Therefore, at this time, the concentration of soil CO 2 (C S ) must be<br />
assumed in order to estimate paleoatmospheric pCO 2 values from<br />
paleosol calcite. These assumptions are constrained by available in situ<br />
measurements of soil CO 2 in modern calcite-producing soils.<br />
The concentration of soil CO 2 is a function of soil depth, soil<br />
respiration rate (or biological productivity), <strong>and</strong> diffusivity of the soil<br />
medium (Boynton <strong>and</strong> Reuther, 1938; Boynton <strong>and</strong> Compton, 1944;<br />
Wood <strong>and</strong> Petraitis, 1984; Quade et al., 1989; Soloman <strong>and</strong> Cerling,<br />
1987). Soil CO 2 concentrations vary from near atmospheric pCO 2<br />
concentrations (a modern value of ~350 ppmV; Keeling et al., 1995)at<br />
the interface with the overlying troposphere to higher, nearly<br />
constant, values beneath a characteristic production (z) depth in the<br />
soil. The location of the characteristic production depth in the soil is<br />
determined by soil respiration rate (or soil productivity) <strong>and</strong> the<br />
diffusivity of the soil medium. Soil diffusivities typically range from 2%<br />
to 50% of that for free air (Glinski <strong>and</strong> Stepniewski, 1985). In general,<br />
more moist <strong>and</strong> clay-rich soils have lower diffusivities, whereas drier<br />
<strong>and</strong> s<strong>and</strong>ier soils have higher diffusivities (Rolston, 1986).<br />
Soil respiration rates, which represent production of CO 2 from<br />
oxidation of organic matter in the soil, appear to (1) primarily reflect a<br />
logarithmic correlation with ambient atmospheric <strong>and</strong> soil temperatures<br />
up to at least 32 °C (Anderson, 1973; Knapp et al., 1998; Fang<br />
et al., 1998; Fang <strong>and</strong> Moncrief, 2001), <strong>and</strong> (2) secondarily respond to<br />
soil moisture availability, although this appears to only be applicable<br />
when soil biota are at or near drought conditions (Brook et al., 1983).<br />
Therefore, characteristic production depths for highly productive soils<br />
Please cite this article as: Sheldon, N.D., Tabor, N.J., <strong>Quantitative</strong> <strong>paleoenvironmental</strong> <strong>and</strong> <strong>paleoclimatic</strong> <strong>reconstruction</strong> using paleosols, Earth-<br />
Science Reviews (2009), doi:10.1016/j.earscirev.2009.03.004
ARTICLE IN PRESS<br />
32 N.D. Sheldon, N.J. Tabor / Earth-Science Reviews xxx (2009) xxx–xxx<br />
with low diffusivity occur only a few centimeters below the soil<br />
surface, whereas low productivity soils with high diffusivity have<br />
much deeper characteristic production depths, possibly as deep as 30–<br />
50 cm below the soil surface (Wood <strong>and</strong> Petraitis, 1984; Quade et al.,<br />
1989; Cerling <strong>and</strong> Quade, 1993; Yapp <strong>and</strong> Poths, 1992 Schroeder <strong>and</strong><br />
Melear, 1999). Furthermore, soil media with lower diffusivity will be<br />
characterized by higher S(z) values than low diffusivity counterparts.<br />
Moreover, due to variations in productivity of soil biota, soils from<br />
warm climates will have higher S(z) values than cool climate counterparts,<br />
<strong>and</strong> soils with abundant soil moisture will have higher S(z)<br />
values than their drought-phase counterparts. For example, Breecker<br />
et al. (2009) have recently monitored S(z) values for modern semiarid<br />
soils in New Mexico <strong>and</strong> found that there was significant seasonal<br />
variation between about 500 <strong>and</strong> 2000 ppmv, which was in turn<br />
reflected by seasonal variations in δ 13 C <strong>and</strong> δ 18 O. Pedogenic carbonate<br />
formation occurred simultaneously with S(z), δ 13 C, <strong>and</strong> δ 18 O minima,<br />
which suggests that the carbonate is not recording mean growing<br />
season conditions <strong>and</strong> that there is therefore a seasonal bias in the<br />
formation of pedogenic carbonates.<br />
Although modern 2-component soil CO 2 concentrations range from<br />
little more than ambient tropospheric concentrations (~500 ppmV;<br />
Wood <strong>and</strong> Petraitis, 1984) to as much as 21% of the soil atmosphere<br />
(210,000 ppmV; Yamaguchi et al., 1967; Brook et al., 1983), soils that<br />
are characterized by mixing of two soil CO 2 components, <strong>and</strong> which<br />
contain in situ accumulations of calcite, appear to be limited to a range<br />
of soil CO 2 concentrations from about 1000–8000 ppmV (de Jong <strong>and</strong><br />
Schappert, 1972; Brook et al., 1983; Wood <strong>and</strong> Petraitis, 1984; Soloman<br />
<strong>and</strong> Cerling, 1987; Quade et al., 1989). This range of soil CO 2 concentrations<br />
reflects the relatively low productivity of soils characterized<br />
by calcite crystallization (Schlesinger, 1997). Note however, that<br />
this very low range of soil pCO 2 also reflects that modern tropospheric<br />
pCO 2 is low, <strong>and</strong> contributes very little (~300 ppmV) to total soil pCO 2 .<br />
For times when tropospheric pCO 2 was significantly higher than<br />
modern (e.g., 2000–3000 ppmV; Eocene, Paleocene, Cretaceous; Yapp<br />
<strong>and</strong> Poths, 1996; Yapp, 2004; Tabor <strong>and</strong> Yapp, 2005a), soil CO 2 in<br />
calcareous soils likely had a correspondingly higher concentration<br />
(3000–11,000 ppmV).<br />
Ekart et al. (1999) assumed soil CO 2 concentrations of 5000 ppmV<br />
for 758 paleosol calcite samples representing ~400 million years time.<br />
Nordt et al. (2002) assumed a range of soil CO 2 concentrations from<br />
4000 to 6000 ppmV for paleosols from Upper Cretaceous <strong>and</strong> Lower<br />
Paleogene strata in Alberta, Canada. Prochnow et al. (2006) assumed<br />
soil CO 2 concentration to be 4000 ppmv for “arid to semiarid” paleosol<br />
calcite <strong>and</strong> 5000 ppmv for “subhumid” paleosol calcite samples from<br />
Triassic profiles in Utah, U.S.A. However, if the lower overall S(z)<br />
values <strong>and</strong> seasonal bias recorded in modern semi-arid soils in terms<br />
of S(z) was comparable in the geologic past, then it is likely that many<br />
of the paleoatmospheric pCO 2 estimates in the literature are overestimates<br />
(Breecker et al. (2009), so care is needed in considering<br />
records from arid to semi-arid settings.<br />
In their treatment of Permo-Carboniferous paleosols from the<br />
southwestern United States, Montañez et al. (2007) assumed that<br />
calcite samples taken from morphologies indicative of long-term net<br />
soil moisture deficiency, such as Calcisols (Mack et al., 1993), were<br />
characterized by generally low <strong>and</strong> invariant S(z) values, whereas<br />
calcites from paleosol morphologies consistent with less soil moisture<br />
deficiency, such as calcic Argillisols, were characterized by relatively<br />
high <strong>and</strong> invariant S(z) values, <strong>and</strong> calcite samples collected from<br />
paleosol morphologies that are indicative of significant variability in<br />
soil moisture availability, such as calcic Vertisols, were characterized<br />
by a larger range of S(z) values. Finally, the lithology of the paleosol<br />
profiles (s<strong>and</strong>stone, siltstone, mudstone <strong>and</strong> claystone) was assumed<br />
to have affected the soil pCO 2 . Montañez et al. (2007) used the<br />
following ranges of S(z) values for paleoatmospheric pCO 2 estimates:<br />
(1) s<strong>and</strong>stone-dominated Calcisols are lowest, ranging from 1000–<br />
3000 ppmV, (2) siltstone-dominated Calcisols range from 1500 to<br />
4000 ppmV, (3) mudstone-dominated Calcisols range from 2000 to<br />
5000 ppmV, (4) mudstone-dominated Vertisols range from 3200 to<br />
7500 ppmV, (5) claystone-dominated calcic Vertisols range from 4000<br />
to 8000 ppmV, <strong>and</strong> (6) mudstone-dominated calcic Argillisols are<br />
highest, ranging from 6000 to 9000 ppmV.<br />
The importance of the assumed soil pCO 2 values (C S values) cannot<br />
be overstated, as the resulting atmospheric pCO 2 estimates vary proportionately<br />
with them (Cerling, 1991; Ekart et al., 1999; Royer et al.,<br />
2001a,b; Tabor et al., 2004a,b). Therefore, until an independent means<br />
of estimating soil CO 2 concentration (see Section 8.1 for a possible<br />
method for this) at the time of calcite crystallization in a paleosol<br />
profile becomes available, this parameter will remain an effectively<br />
unknown value, <strong>and</strong> will continue to limit the utility of paleosol calcite<br />
δ 13 C values as proxy of atmospheric pCO 2 .<br />
Cerling (1991, 1992) were the first studies to demonstrate the<br />
potential of paleosol calcite δ 13 C values as a proxy of atmospheric<br />
pCO 2 , in which it was suggested that Cretaceous atmospheric pCO 2<br />
was significantly higher than modern values. This was followed by<br />
several important studies of Paleozoic paleosol calcites, which<br />
appeared to delineate a first-order trend of decreasing atmospheric<br />
pCO 2 from ~15–20 PAL in the Early Paleozoic to near PAL in the Late<br />
Carboniferous (Mora <strong>and</strong> Driese, 1993; Mora et al., 1996). These<br />
Paleozoic studies were especially important at the time of publication,<br />
because they were among the first geochemically-based pCO 2 proxy<br />
data for comparison with carbon mass flux model pCO 2 estimates<br />
(Berner, 1991; Berner <strong>and</strong> Kothavala, 2001), <strong>and</strong> the two different<br />
model estimates appeared to agree with one another.<br />
Ekart et al. (1999) compiled the first temporally extensive dataset<br />
of two-component paleosol calcite δ 13 C values. Ekart et al. (1999)<br />
presented results for 758 δ 13 C analyses that represented each time<br />
period since the advent of vascular plants (~400 million years BP;<br />
Fig. 19). The results of that study largely agreed with estimated<br />
paleoatmospheric pCO 2 from carbon mass flux models, but Ekart<br />
et al. (1999) also noted a significant disparity between pCO 2<br />
estimates from the two proxy methods for the Permian. There have<br />
been dozens of additional studies of paleosol calcite δ 13 Cvaluessince<br />
the compilation provided by Ekart et al. (1999). Fig. 19 presents 2615<br />
pedogenic calcite δ 13 C values (black crosses), ranging in age from<br />
Devonian to Recent (~415–0 My), which were compiled from the<br />
literature. This compilation includes results only from those studies<br />
that presented paleosol micrite δ 13 C values in a Table or Appendix<br />
(see caption in Fig. 19 for sources). Also shown in Fig. 19 are the best<br />
fit <strong>and</strong> 95% confidence interval for terrestrial vascular plant organic<br />
matter δ 13 C values that is based upon analysis of 2148 different<br />
samples, which range from Devonian to Late Cretaceous (Strauss <strong>and</strong><br />
Peters-Kottig, 2003). Because of complications related to the<br />
evolution <strong>and</strong> prominence of C 4 photosynthesizers in l<strong>and</strong>scapes<br />
characterized by soils that accumulate calcite, the following discussion<br />
is limited to pre-Cenozoic data. Furthermore, the authors<br />
emphasize that the following discussion is intended only as a<br />
demonstration of how models of 2-component soil CO 2 mixing can<br />
be applied to paleosol calcite data, <strong>and</strong> it is not intended for any<br />
specific inferences to be drawn about variations in paleoatmospheric<br />
pCO 2 .<br />
Assuming that organic matter δ 13 C values in Fig. 19 accurately<br />
represent the δ 13 C values of organic matter in the soils from which<br />
calcite δ 13 C values are derived, they can be used to define an effective<br />
lower limit for calcite δ 13 C values that are permissive of twocomponent<br />
soil CO 2 mixing. This lower limit calcite δ 13 C value (thick<br />
red line marked by 0 PAL) is 14.8‰ more positive than contemporaneous<br />
paleosol organic matter, which reflects 4.4‰ diffusive enrichment<br />
of CO 2 δ 13 C values derived from oxidation of organic matter, as<br />
well as an additional 10.4‰ carbon isotope enrichment from gaseous<br />
CO 2 to calcite due to carbon isotope fractionation between carbonate<br />
species (at mildly alkaline pH; Bottinga, 1968). Calcite δ 13 C values that<br />
are more negative than this lower limit provide negative estimates of<br />
Please cite this article as: Sheldon, N.D., Tabor, N.J., <strong>Quantitative</strong> <strong>paleoenvironmental</strong> <strong>and</strong> <strong>paleoclimatic</strong> <strong>reconstruction</strong> using paleosols, Earth-<br />
Science Reviews (2009), doi:10.1016/j.earscirev.2009.03.004
ARTICLE IN PRESS<br />
N.D. Sheldon, N.J. Tabor / Earth-Science Reviews xxx (2009) xxx–xxx<br />
33<br />
Fig. 19. Cross plot of δ 13 C values of paleosol calcite samples (crosses <strong>and</strong> blue open circles) <strong>and</strong> vascular plant total organic matter versus age (in years). This dataset consists of 2615<br />
calcite <strong>and</strong> 2148 organic matter data points compiled from peer-reviewed, published literature. Although many more pedogenic calcite <strong>and</strong> organic matter data points have been<br />
reported in the literature, only samples that (1) have radiometric, paleomagnetic or biostratigraphic age constraints <strong>and</strong> (2) are tabulated are included herein. Calcite d13C values are<br />
divided into open blue circles that represent the review data of Ekart <strong>and</strong> others (1999) <strong>and</strong> black crosses, which represent calcite d13C values from various studies (Srivastava, 2001;<br />
Magaritz et al., 1981; Deutz et al., 2001; Schlesinger, 1985; Quade et al., 2004; Quade <strong>and</strong> Cerling, 1995; Fox <strong>and</strong> Koch, 2003; Dever et al., 1988; Sinha et al., 2006; Cerling, 1992; Clyde<br />
et al., 2001; Behrensmeyer et al., 2007; Koch et al., 1995; Nordt et al., 2002; Alonso-Zarza <strong>and</strong> Tanner, 2006; Robinson et al., 2002; Quade et al., 1994; Ekart et al., 1999; Cerling et al.,<br />
1991; Sinha <strong>and</strong> Stott, 1994; Andrews et al., 1995; Ghosh et al., 1995; Ghosh et al., 2001; Suchecki et al., 1988; Purvis <strong>and</strong> Wright, 1991; Kenny <strong>and</strong> Neet,1993; Mora et al., 1996; Muchez<br />
et al., 1993; Prochnow et al., 2006; Tabor et al., 2004a,b; Mack et al., 1991; T<strong>and</strong>on et al., 1995; Retallack et al., 2004a,b; Bowen et al., 2001; Bowen et al., 2005). Numerical age data<br />
were taken directly from ages that were reported in the literature. Vertical drop lines on graph depict time boundaries for geological Epochs, Periods <strong>and</strong> Eras according to the<br />
timescale of Gradstein et al. (2004). Some numerical age dates for the calcite δ 13 C data that are based upon biostratigraphic- <strong>and</strong> magnetostraphic- correlation to out-of-date time<br />
scales may differ slightly from numerical correlations to the timescale of Gradstein et al. (2004).<br />
paleoatmospheric pCO 2 . Negative values of pCO 2 have no physical<br />
meaning, <strong>and</strong> could be interpreted to represent calcite that formed<br />
under closed (or semi-closed) system, 1-component soil CO 2 mixing,<br />
or formation in the presence of oxidizing organic matter that is<br />
isotopically more negative than those shown in Fig. 19. Calcite δ 13 C<br />
values that are more positive than this lower limit may be interpreted<br />
as having formed in the presence of open-system, 2-component<br />
mixing of CO 2 derived from in situ oxidation of organic matter <strong>and</strong> CO 2<br />
from the global troposphere. The resulting atmospheric pCO 2<br />
estimates are determined by the assumed concentration of soil CO 2 .<br />
The thin red lines depict calcite δ 13 C values for 2-component soils with<br />
a total soil CO 2 concentration of 5000 ppmV <strong>and</strong> atmospheric pCO 2<br />
values of 1, 5, <strong>and</strong> 10 PAL. Within the context of the assumed variables<br />
in this model of 2-component soil CO 2 mixing, paleosol calcite δ 13 C<br />
values suggest that atmospheric pCO 2 has ranged from modern to no<br />
greater than ~7 PAL. However, in order to highlight the importance of<br />
the assumed soil pCO 2 that is input to the model, the black stippled<br />
line depicts calcite δ 13 C values that form in soil profiles with a total soil<br />
CO 2 of 900 ppmV, <strong>and</strong> atmospheric pCO 2 of 300 ppmV. These assumed<br />
parameters would suggest that Paleozoic <strong>and</strong> Mesozoic atmospheric<br />
pCO 2 has not been much greater than ~1 PAL. Furthermore, due to<br />
uncertainties in the values of assumed parameters, estimates of<br />
atmospheric pCO 2 from soil calcite are certainly no better than ±<br />
300 ppmV, <strong>and</strong> probably closer to ±500 ppmV to ±1000 ppmV in<br />
most instances (Yapp <strong>and</strong> Poths, 1996; Ekart et al., 1999; Tabor et al.,<br />
2004a,b; Montañez et al., 2007).<br />
The authors reiterate that Fig. 19 is provided only as an example of<br />
how atmospheric pCO 2 is related to calcite δ 13 C values in soils<br />
characterized by mixing of 2 components of soil CO 2 . In practice,<br />
atmospheric pCO 2 estimates from paleosol calcite δ 13 C values should<br />
include organic matter δ 13 C values from the same paleosol or a deposit<br />
in close stratigraphic proximity (e.g., Tabor et al., 2004a,b; Montañez<br />
et al., 2007), <strong>and</strong> not use summary data sets or inferred values of soil<br />
organic matter δ 13 C values such as here.<br />
7.4.3.2. Soil calcite δ 13 C as a means of assessing soil pCO 2 <strong>and</strong><br />
productivity. Although its potential has been largely ignored to<br />
date (however, see Yapp <strong>and</strong> Poths, 1996), soil <strong>and</strong> paleosol calcite<br />
δ 13 C values may be tremendously useful as a proxy of soil pCO 2 ,<br />
biological productivity, <strong>and</strong> evapotranspiration in calcareous paleosols<br />
which formed prior to evolution <strong>and</strong> dominance of C 4 photosynthesizers<br />
(see Section 7.6; pre-Miocene). Recombination of Eq. (52)<br />
relates measured calcite <strong>and</strong> organic matter δ 13 C values to soil pCO 2 :<br />
C Sðcc<br />
Þ = C AðccÞ<br />
4 δ13 C AðccÞ<br />
− δ 13 C OðccÞ<br />
ð53Þ<br />
δ 13 C mðccÞ<br />
− δ 13 C OðccÞ<br />
All definitions for Eq. (53) are as in Eq. (52). Considering that, in<br />
certain situations, atmospheric pCO 2 is known by independent means<br />
such as the δ 13 C <strong>and</strong> concentration of Fe(CO 3 )OH in goethite (see<br />
below; Table 6), <strong>and</strong> that organic matter δ 13 C values are available,<br />
Please cite this article as: Sheldon, N.D., Tabor, N.J., <strong>Quantitative</strong> <strong>paleoenvironmental</strong> <strong>and</strong> <strong>paleoclimatic</strong> <strong>reconstruction</strong> using paleosols, Earth-<br />
Science Reviews (2009), doi:10.1016/j.earscirev.2009.03.004
ARTICLE IN PRESS<br />
34 N.D. Sheldon, N.J. Tabor / Earth-Science Reviews xxx (2009) xxx–xxx<br />
Table 6<br />
Age, δ 13 C <strong>and</strong> concentration (X m ) of Fe(CO 3 )OH in solid solution in goethite, <strong>and</strong><br />
estimated atmospheric pCO 2 (PAL; PAL =300 ppmV).<br />
Epoch<br />
~Age<br />
(Ma)<br />
δ 13 C<br />
(‰)<br />
X m<br />
Atm.<br />
pCO 2<br />
Source<br />
Late Ordovician 440 −17.6 0.00645 16 Yapp <strong>and</strong> Poths (1993)<br />
Late Devonian 360 −21.5 0.0175 1 Yapp <strong>and</strong> Poths (1996)<br />
Early Permian 283 −13.5 0.0090 1 Tabor et al. (2004a,b)<br />
Early Permian 270 −13.9 0.0083 1 Tabor et al. (2004a,b)<br />
Early Jurassic 195 −15.3 0.0097 18 Yapp <strong>and</strong> Poths (1996)<br />
Early Middle 185 −15.0 0.0088 18 Yapp <strong>and</strong> Poths (1996)<br />
Jurassic<br />
Late Middle 165 −17.2 0.0120 1 Yapp <strong>and</strong> Poths (1996)<br />
Jurassic<br />
Late Middle 165 −17.3 0.0099 1 Yapp <strong>and</strong> Poths (1996)<br />
Jurassic<br />
Late Cretaceous 80 −19.7 0.0103 4 Yapp <strong>and</strong> Poths (1996)<br />
Paleocene 60 −20.1 0.0067 8±4 Tabor <strong>and</strong> Yapp (2005a)<br />
Early Eocene 52 −20.1 to 0.0014–0.0064 7 Tabor <strong>and</strong> Yapp (2005a)<br />
−15.4<br />
Late Tertiary 5 −21.7 0.0108 1 Yapp <strong>and</strong> Poths (1996)<br />
then paleosol calcite δ 13 C values may prove an important source of<br />
information about the concentration of total soil pCO 2 , which is<br />
known to be strongly correlated with evapotranspiration <strong>and</strong> soil<br />
productivity (e.g., Brook et al., 1983). As mentioned earlier, modern<br />
soil-forming environments that are characterized by precipitation of<br />
calcite are generally low-productivity soils, with total soil pCO 2<br />
usually no greater than ~10,000 ppmV. Note however, that this very<br />
low range of soil pCO 2 also reflects that modern tropospheric pCO 2 is<br />
low, <strong>and</strong> contributes very little (~300 ppmV) to total soil pCO 2 .For<br />
times when tropospheric pCO 2 was significantly higher than modern<br />
(e.g., ~2000–3000 ppmV; Eocene, Paleocene, Cretaceous; Yapp <strong>and</strong><br />
Poths, 1996; Yapp, 2004; Tabor <strong>and</strong> Yapp, 2005a), soil pCO 2 in calcareous<br />
soils likely had a correspondingly higher concentration. In this<br />
regard, subtraction of atmospheric pCO 2 values yields the concentration<br />
of CO 2 in the soil that is derived only from oxidation of biological<br />
materials (C B ; Yapp <strong>and</strong> Poths, 1996). Brook et al. (1983) reported a<br />
least squares variance (R 2 =0.81) between soil productivity (as<br />
specified by soil pCO 2 ) <strong>and</strong> actual evapotranspiration, where actual<br />
evapotranspiration is the quantity of soil water that is released from<br />
the soil as water vapor through evaporation <strong>and</strong> transpiration. In this<br />
regard, paleosol calcite δ 13 C values may prove useful as a quantitative<br />
proxy to assess aridity among populations of calcite-bearing paleosols;<br />
this includes soils that are ambiguously assigned to subhumid, semiarid,<br />
<strong>and</strong> arid climates.<br />
7.4.3.3. Pedogenic goethite. The common low-temperature mineral<br />
goethite (α-FeOOH) occurs in solid solution with small amounts of a<br />
ferric carbonate component (Fe(CO 3 )OH). The molar concentration<br />
<strong>and</strong> δ 13 C composition of the Fe(CO 3 )OH component in goethite are<br />
measured with an incremental vacuum dehydration–decarbonation<br />
technique that requires vacuum extraction lines with extremely low<br />
background CO 2 values (see description of high-vacuum extraction<br />
system by Yapp <strong>and</strong> Pedley, 1985). The molar fraction of Fe(CO 3 )OH is<br />
very low, <strong>and</strong> therefore highly susceptible to contamination from<br />
carbon sources that might be added to the goethite. Therefore,<br />
goethites undergo a strict series of chemical pre-treatments prior to<br />
incremental dehydration–decarbonation analysis. Goethites are<br />
ground in reagent-grade acetone. The b63 μm fraction is then treated<br />
with 0.5–1.0 N HCl solution in order to remove calcite <strong>and</strong> thoroughly<br />
rinsed before several treatments with 30% H 2 O 2 are made in order to<br />
remove naturally occurring organics that may be sorbed to the surface<br />
of the goethite. Goethite samples that have undergone the preceding<br />
set of treatments are then analyzed in a set of incremental vacuum<br />
dehydration–decarbonation experiments, ranging from ~190 to<br />
240 °C, <strong>and</strong> CO 2 <strong>and</strong> H 2 O dehydroxylation-decarbonation products<br />
of goethite <strong>and</strong> Fe(CO 3 )OH are measured manometrically for their<br />
molar ratios <strong>and</strong> δ 13 C compositions. During the dehydration process,<br />
“plateau” values of incremental H 2 O:CO 2 ratios (called “F” ratios,<br />
which are twice that of “X” ratios) <strong>and</strong> δ 13 C values emerge (Yapp <strong>and</strong><br />
Poths, 1991, 1992, 1993; Hsieh <strong>and</strong> Yapp, 1999; Yapp, 2001a,b, 2004;<br />
Tabor et al., 2004b; Tabor <strong>and</strong> Yapp, 2005a). These plateau δ 13 C <strong>and</strong> F<br />
values correspond to the δ 13 C G <strong>and</strong> twice the X G values (described<br />
below), respectively.<br />
The molar concentration (X G ) <strong>and</strong> carbon isotope value (δ 13 C G )of<br />
the ferric carbonate component is a function of the concentration <strong>and</strong><br />
δ 13 C, respectively, of the CO 2 present during crystallization of goethite<br />
(Yapp, 1987a,b, 2001a,b, 2004; Yapp <strong>and</strong> Poths, 1991, 1992, 1993, 1996;<br />
Tabor et al., 2004a,b). Two-component CO 2 mixing in the presence of<br />
soil goethite crystallization involves CO 2 from the atmosphere <strong>and</strong> CO 2<br />
from oxidation of organic matter in the soil. Thus, the Fe(CO 3 )OH<br />
component in goethites that form in such environments may preserve<br />
information on the partial pressure of CO 2 in the Earth's atmosphere<br />
as well as the ambient pCO 2 of soil gas. Yapp <strong>and</strong> Poths (1992) presented<br />
the following Henry's law equation that relates the molar<br />
concentration of Fe(CO 3 )OH in solid solution in goethite to the<br />
concentration of ambient CO 2 in the soil:<br />
Log pCO 2 =LogX G +6:04 − 1570<br />
T<br />
ð54Þ<br />
where X G is the mole fraction of Fe(CO 3 )OH in solid solution in goethite<br />
<strong>and</strong> T is temperature in K. If X G <strong>and</strong> T are known, then atmospheric<br />
pCO 2 may be determined from Eq. (54). X G may be determined from<br />
direct measurement of the Fe(CO 3 )OH in goethite, whereas temperature<br />
of goethite crystallization may be estimated from other proxies<br />
(see below). To date, reported X G values of 2-component goethites<br />
range from 0.0014 to 0.0175 (Table 6), which corresponds to soil pCO 2<br />
values ranging from ~20,000 to ~105,000 ppmV. Such high pCO 2<br />
values indicate humid, biologically productive soils consistent with<br />
intense chemical weathering <strong>and</strong> development of recalcitrant pedogenic<br />
minerals such Fe-Oxides (Tardy et al., 1990a,b).<br />
The equation that relates X G <strong>and</strong> δ 13 C G values of Fe(CO 3 )OH in solid<br />
solution in goethites that form in the presence of two soil CO 2<br />
components to atmospheric pCO 2 is similar to that of pedogenic<br />
calcite (Yapp <strong>and</strong> Poths, 1992, 1993, 1996):<br />
h<br />
i<br />
<br />
δ 13 C G = δ 13 C GA − δ 13 1<br />
C GO X GA + δ 13 C<br />
X GO ð55Þ<br />
G<br />
The subscript “G” indicates goethite. δ 13 C G is the measured δ 13 C<br />
value of Fe(CO 3 )OH in goethite, the δ 13 C values subscripted with “A”<br />
<strong>and</strong> “O” are defined in the manner for Eq. (52). X G is the measured mol<br />
fraction of the Fe(CO 3 )OH component, in the goethite, whereas the<br />
values X GA would be the molar fraction of Fe(CO 3 )OH if atmospheric<br />
CO 2 were the only CO 2 in the soil profile.<br />
Eq. (55) indicates that, in a plot of δ 13 C G vs. 1/X G , the Fe(CO 3 )OH<br />
component in goethite samples from the shallower portions of any<br />
particular soil yield a linear array with a positive slope from which an<br />
apparent pCO 2 for Earth's ancient atmosphere can be calculated (Yapp<br />
<strong>and</strong> Poths, 1992, 1993, 1996, Yapp, 2004; see Fig. 20).<br />
To date, Fe(CO 3 )OH in solid solution in paleosol goethites has<br />
provided estimates of paleoatmospheric pCO 2 from 12 different<br />
paleosol profiles ranging in age from Ordovician to Miocene<br />
(Table 6). This contrasts with several hundred estimates of paleoatmospheric<br />
pCO 2 from paleosol calcite (see, for example, Fig. 19). The<br />
relative paucity of paleoatmospheric pCO 2 estimates from Fe(CO 3 )OH<br />
in solid solution in paleosol goethites reflects that only a few research<br />
groups have focused on this proxy method, difficulty of analysis<br />
compared to paleosol calcite, <strong>and</strong> that paleosols with 2-component Fe<br />
Please cite this article as: Sheldon, N.D., Tabor, N.J., <strong>Quantitative</strong> <strong>paleoenvironmental</strong> <strong>and</strong> <strong>paleoclimatic</strong> <strong>reconstruction</strong> using paleosols, Earth-<br />
Science Reviews (2009), doi:10.1016/j.earscirev.2009.03.004
ARTICLE IN PRESS<br />
N.D. Sheldon, N.J. Tabor / Earth-Science Reviews xxx (2009) xxx–xxx<br />
35<br />
Fig. 20. δ 13 C vs. 1/X G of Fe(CO 3 )H component in solid solution in goethites from two different soils (Yapp <strong>and</strong> Poths, 1993; Yapp, 2004). The slope of the data array from the pedogenic<br />
goethites is related to atmospheric pCO 2 during the time of soil formation, <strong>and</strong> goethite crystallization. These data indicate atmospheric pCO 2 of 16×PAL during formation of a Late<br />
Ordovician paleosol from the Neda fm. in Wisconsin, U.S.A, <strong>and</strong> 9×PAL for a middle Eocene paleosol profile from the Ione fm. in California, U.S.A. See text for discussion.<br />
(CO 3 )OH in solid solution in goethite appear to be less abundant than<br />
paleosol profiles with calcite. In spite of these limitations, estimates of<br />
paleoatmospheric pCO 2 from Fe(CO 3 )OH in solid solution in paleosol<br />
goethites are tremendously important because they represent the<br />
only soil mineral that provides an internal proxy of soil pCO 2 , which<br />
greatly reduces the uncertainty of atmospheric pCO 2 estimates to<br />
about ±300 ppmV. It is likely significant, however, that paleoatmospheric<br />
pCO 2 estimates from paleosol goethites <strong>and</strong> calcites show the<br />
same general trends through time (Yapp <strong>and</strong> Poths, 1996; Tabor et al.,<br />
2004a,b).<br />
7.4.4. Soil carbonates formed by mixing of three-components of soil CO 2<br />
7.4.4.1. Calcite. As mentioned, 3-component CO 2 mixing includes<br />
CO 2 derived from (1) in situ oxidation of soil organic matter, (2)<br />
tropospheric CO 2 <strong>and</strong> (3) CO 2 derived from dissolution pre-existing<br />
carbonate. Soil calcite derived from 3-component soil CO 2 mixing is<br />
more likely to occur in soils <strong>and</strong> paleosols developed upon marine<br />
carbonate, because these environments have high concentrations of<br />
pre-existing carbonate. Furthermore, soil calcite formed upon marine<br />
carbonates is expected to have more positive δ 13 C values than coexisting<br />
soils characterized by 2-component <strong>and</strong> 1-component CO 2<br />
mixing, because marine carbonate is generally quite positive, usually<br />
greater than ~− 2‰. To date, the existence of soil calcite that records<br />
the effect of mixing of 3-components of soil CO 2 has not been<br />
demonstrated. Quade et al. (1989) isotope study of soil carbonate<br />
along an elevation <strong>and</strong> climate transect in the Great Basin, Nevada, U.S.<br />
A., included examples of pedogenic calcite from soils formed upon<br />
both siliciclastic <strong>and</strong> carbonate parent materials. That work observed<br />
a12‰ δ 13 C variation over a 2440 meter elevation change. Yet, the<br />
slope of calcite δ 13 C values versus elevation was similar for samples<br />
taken from soils on carbonate <strong>and</strong> siliciclastic parent materials. The<br />
similarity of calcite δ 13 C values among carbonate- <strong>and</strong> siliciclastichosted<br />
soils strongly suggests that there is complete exchange between<br />
HCO − 3 derived from dissolution of pre-existing marine calcite<br />
<strong>and</strong> CO 2 in the soil that is derived from oxidation of organic matter <strong>and</strong><br />
tropospheric CO 2 . The large variation in soil calcite δ 13 C values that<br />
was observed in Quade et al. (1989) is interpreted to reflect principally<br />
changes in the ratio of C 3 <strong>and</strong> C 4 photosynthesizers along the elevation<br />
transect. Nevertheless, we suspect that soil calcite that is formed by<br />
mixing of three-components of soil CO 2 exists, <strong>and</strong> will likely be found<br />
in soil profiles that are (1) developed upon marine carbonate, <strong>and</strong> (2)<br />
characterized by relatively low biological productivity. The former<br />
condition reflects that marine carbonate values have positive δ 13 C<br />
values, whereas the latter condition reflects that lower biological<br />
productivity will limit exchange with HCO 3 − derived from dissolution<br />
of pre-existing marine calcite <strong>and</strong> maintain a relatively positive δ 13 C<br />
value of micrite. In this regard, karst surfaces developed upon marine<br />
strata in times prior to evolution of vascular plants (pre-Silurian) may<br />
be a good c<strong>and</strong>idate for paleosol calcite that formed by mixing of 3<br />
components of soil CO 2 .<br />
7.4.4.2. Goethite. Hsieh <strong>and</strong> Yapp (1999) determined that Fe(CO 3 )OH<br />
in solid solution in goethite from a Rhodic Paleudult in east Texas,<br />
U.S.A., preserves δ 13 C values that range from −13‰ to −14‰ toward<br />
the surface of the soil (31–64 cm) to − 6‰ to − 4‰ at depths of<br />
122 cm beneath the surface. This depth-dependent trend of δ 13 C values<br />
is different from that expected in soils characterized by mixing of two<br />
components of soil CO 2 (Fig. 16), <strong>and</strong> was interpreted to be a result of<br />
incorporation of a fraction of dissolved carbonate that originated from<br />
dissolution of marine calcite fossils in the parent material (Eocene<br />
Weches Formation). More negative δ 13 C values of Fe(CO 3 )OH towards<br />
the surface of the soil were also interpreted to represent (1) more<br />
intense <strong>and</strong> longer-duration weathering toward the top of the profile,<br />
<strong>and</strong> (2) partial to nearly complete dissolution <strong>and</strong> re-precipitation of<br />
goethite after carbonate had been removed from that portion of the<br />
soil profile. Yapp (2001a, 2002) presented the following equation to<br />
explain the δ 13 C values of Fe(CO 3 )OH in solid solution in goethite from<br />
acidic soils characterized by three-component soil CO 2 mixtures:<br />
h <br />
<br />
δ 13 C G = X GA δ 13 C GA − δ 13 C GO<br />
<br />
+ X GS δ 13 C GO − δ 13 C GCC<br />
i<br />
<br />
1<br />
+ δ 13 C GCC<br />
X G<br />
ð56Þ<br />
With the exception of δ 13 C GCC <strong>and</strong> X GS , all variables <strong>and</strong> subscripts<br />
are defined in the manner for Eqs. (52) <strong>and</strong> (55). δ 13 C GCC is the δ 13 C<br />
value of Fe(CO 3 )OH in goethite if it were in equilibrium with aqueous<br />
CO 2 derived only from dissolution of pre-existing carbonate in the soil,<br />
whereas X GS is the mole fraction of Fe(CO 3 )OH in goethite if it formed<br />
only from CO 2 gas in a soil with mixing of two-components of CO 2 .<br />
Eq. (56) indicates that, in a plot of δ 13 C G vs. 1/X G , the Fe(CO 3 )OH<br />
component in goethite samples from the soil will yield a linear array<br />
with a negative slope (Yapp, 2001a,b; 2002; Tabor et al., 2004a,b;<br />
Tabor <strong>and</strong> Yapp, 2005b). Although it is not possible at this time to<br />
estimate paleoatmospheric pCO 2 concentrations from the δ 13 C<br />
<strong>and</strong> molar concentration of Fe(CO 3 )OH in goethites that formed in<br />
the presence three-component soil CO 2 mixtures, they do provide<br />
estimates of soil pCO 2 .<br />
Please cite this article as: Sheldon, N.D., Tabor, N.J., <strong>Quantitative</strong> <strong>paleoenvironmental</strong> <strong>and</strong> <strong>paleoclimatic</strong> <strong>reconstruction</strong> using paleosols, Earth-<br />
Science Reviews (2009), doi:10.1016/j.earscirev.2009.03.004
ARTICLE IN PRESS<br />
36 N.D. Sheldon, N.J. Tabor / Earth-Science Reviews xxx (2009) xxx–xxx<br />
From the perspectives of field-based morphological observations<br />
<strong>and</strong> laboratory-based mineralogical inspection, goethites that form in<br />
the presence of either 2- or 3-component soil CO 2 mixing are indistinguishable,<br />
<strong>and</strong> they are only discerned from one another by<br />
determination of Fe(CO 3 )OH δ 13 C values. That is, goethites with Fe<br />
(CO 3 )OH δ 13 C values that are too positive to be explained by twocomponent<br />
soil CO 2 mixing are interpreted to have formed by three<br />
component soil CO 2 mixing which included dissolution of pre-existing<br />
carbonate with very positive δ 13 C values (Hsieh <strong>and</strong> Yapp, 1999; Tabor<br />
et al., 2004a,b; Tabor <strong>and</strong> Yapp, 2005a,c).<br />
7.5. δ 18 O <strong>and</strong> δD of hydroxylated minerals<br />
Pedogenic chemical weathering products are dominantly clay-size<br />
(b2 μm), of which a large proportion are hydroxylated (e.g., Wilson,<br />
1999). The most common hydroxylated pedogenic minerals include<br />
mica-like minerals, vermiculites, smectites, chlorites <strong>and</strong> interlayered<br />
minerals, kaolinite, halloysite, iron oxyhydroxides, aluminum oxyhydroxides,<br />
<strong>and</strong> manganese oxyhydroxides (Dixon <strong>and</strong> Weed, 1989;<br />
Wilson, 1999). If these hydroxylated minerals form in chemical equilibrium<br />
with ambient soil waters, <strong>and</strong> the oxygen <strong>and</strong> hydrogen<br />
isotope fractionation factors of these minerals are known (see Table 5<br />
for examples pertinent to this work), then oxygen <strong>and</strong> hydrogen<br />
isotope analysis of both soil <strong>and</strong> paleosol hydroxylated minerals may<br />
provide insights into environmental <strong>and</strong> climatic conditions at the<br />
time of mineral crystallization.<br />
The earliest isotope geochemical studies of soils focused upon the<br />
δ 18 O <strong>and</strong> δD values of silicates <strong>and</strong> oxyhydroxides in weathering<br />
profiles that developed upon igneous <strong>and</strong> metamorphic protolith<br />
(Taylor <strong>and</strong> Epstein, 1964; Savin <strong>and</strong> Epstein, 1970a; Lawrence <strong>and</strong><br />
Taylor, 1971, 1972). These early studies recognized an upwards<br />
enrichment of bulk silicate 18 O through the soil, as concentrations of<br />
clay-size alteration products become greater (Taylor <strong>and</strong> Epstein,<br />
1964). These results were interpreted to reflect an increasing contribution<br />
of oxygen from low-temperature, pedogenically formed,<br />
minerals, <strong>and</strong> destruction of pre-existing igneous <strong>and</strong> metamorphic<br />
minerals, toward the soil surface. Lawrence <strong>and</strong> Taylor (1971, 1972)<br />
noted that although the concentration of hydroxylated minerals<br />
increases upwards through the soil profiles, there is little or no profilescale<br />
variation in silicate δD values because the protolith from which<br />
the soils are derived contained little or no primary hydroxylated<br />
minerals (i.e., soil alteration products dominate the δD value). Furthermore,<br />
the δ 18 O <strong>and</strong> δD values of the soil alteration products<br />
defined an array that roughly paralleled the meteoric water line<br />
(Fig. 21); clay minerals exhibited offset from the meteoric water line,<br />
in order from greatest to smallest: kaolinite, goethite, gibbsite <strong>and</strong><br />
amorphous aluminosilicates (Savin <strong>and</strong> Epstein, 1970a,b; Lawrence<br />
<strong>and</strong> Taylor, 1971; Yapp, 1987a,b; note that this agrees with the isotope<br />
fractionation equations in Table 5). Based upon the observed relationships,<br />
those early studies hypothesized that δ 18 O <strong>and</strong> δD values<br />
of soil-formed hydroxylated minerals approach isotope<br />
equilibrium with local meteoric waters at temperatures very near<br />
that of the mean annual surface atmosphere. Subsequent studies<br />
of soil-formed, hydroxylated- mineral δ 18 O <strong>and</strong> δD values have utilized<br />
the basic observations outlined in those earlier studies in order<br />
to (1) differentiate supergene (low-temperature) from hypogene<br />
Fig. 21. Cross plot of δD versus δ 18 O values. The blue line (upper left) represents the isotope composition of waters that lie upon the meteoric water line as defined by Craig (1961).<br />
Black lines depict 5 °C isotherms between 0 °C (right-most black line) <strong>and</strong> 35 °C (left-most black line) that represent isotope equilibrium between kaolinite <strong>and</strong> meteoric water. The<br />
red line is the 40 °C isotherm that depicts isotope equilibrium between kaolinite <strong>and</strong> meteoric water, <strong>and</strong> is the “supergene/hypogene” reference line (Sheppard et al., 1969). Hightemperature<br />
hypogene processes result in kaolinite δD versus δ 18 O values that lie to the left, whereas low-temperature supergene processes result in kaolinite δD versus δ 18 O values<br />
that lie to the right, of the supergene/hypogene line. The gray polygon represents the modern surface domain (MSD) for kaolinite (Tabor <strong>and</strong> Montañez, 2005; see also Yapp, 1993a,<br />
2001a,b; Savin <strong>and</strong> Hsieh, 1998), which is calculated using oxygen <strong>and</strong> hydrogen isotope fractionation equations for kaolinite (Table 5) in conjunction with the δD <strong>and</strong> δ 18 O values of<br />
meteoric precipitation <strong>and</strong> temperature data from the IAEA data base (Rozanski et al., 1993). The orange polygon represents the Warm Earth Surface Domain (WESD) which<br />
considers global temperatures that are 5 °C warmer-than modern, <strong>and</strong> an ice-free, Earth. Open circles represent δD <strong>and</strong> δ 18 O values for kaolinite samples that have been interpreted<br />
to originate from hydrothermal <strong>and</strong> deep-burial diagenetic processes (Sheppard et al., 1969; Sheppard <strong>and</strong> Taylor, 1974; Marumo, 1989; Macaulay et al., 1993; Stewart et al., 1994;<br />
Osborne et al., 1994; Decher et al., 1996; Hedenquist et al., 1998; Whelan et al., 1998; Matthews et al., 1999; Harris et al., 2000; Bethke et al., 2000; Parnell et al., 2000, 2004; Uysal<br />
et al., 2000; Marfil et al., 2005; Simeone et al., 2005). Open squares represent δD <strong>and</strong> δ 18 O values for kaolinite samples that were collected from soil <strong>and</strong> paleosol profiles (Sheppard,<br />
1977; Hassanipak <strong>and</strong> Eslinger, 1985; Bird <strong>and</strong> Chivas, 1989 [Cenozoic samples only]; Lawrence <strong>and</strong> Rashkes Meaux, 1993; Mizota <strong>and</strong> Longstaffe, 1996; Boulvais et al., 2000; Girard<br />
et al., 2000, Tabor <strong>and</strong> Montañez, 2005). For pure kaolinite samples, analytical uncertainty for δD <strong>and</strong> δ 18 O values are ±3‰ <strong>and</strong> ±0.2‰, respectively, which corresponds to<br />
uncertainties in paleotemperature estimates of ±3 °C. Several kaolinite δ 18 O values, however, are calculated end-member values from mixtures of kaolinite <strong>and</strong> some other silicate<br />
(e.g., quartz; Bird <strong>and</strong> Chivas, 1989; Lawrence <strong>and</strong> Rashkes Meaux, 1993), <strong>and</strong> have larger uncertainties (b±1.1‰). With the exception of a single kaolinite from the Oligocene of<br />
Australia (Bird <strong>and</strong> Chivas, 1989), all pedogenic <strong>and</strong> paleopedogenic kaolinite samples reside within the MSD or WESD. (For interpretation of the references to colour in this figure<br />
legend, the reader is referred to the web version of this article.)<br />
Please cite this article as: Sheldon, N.D., Tabor, N.J., <strong>Quantitative</strong> <strong>paleoenvironmental</strong> <strong>and</strong> <strong>paleoclimatic</strong> <strong>reconstruction</strong> using paleosols, Earth-<br />
Science Reviews (2009), doi:10.1016/j.earscirev.2009.03.004
ARTICLE IN PRESS<br />
N.D. Sheldon, N.J. Tabor / Earth-Science Reviews xxx (2009) xxx–xxx<br />
37<br />
(hydrothermal) deposits, (2) delineate the paragenesis of mineralformation<br />
in soils <strong>and</strong> paleosols, (3) determine the extent of chemical<br />
weathering in soil <strong>and</strong> paleosol profiles, (4) determine variations in<br />
the composition of soil moisture δ 18 O <strong>and</strong> δD values, <strong>and</strong> (5) estimate<br />
the temperature of mineral crystallization.<br />
7.5.1. Origin of residual deposits<br />
In their study of economic copper deposits, Sheppard et al. (1969)<br />
analyzed δ 18 O <strong>and</strong> δD values of phyllosilicates from the Idaho batholith.<br />
These workers arbitrarily selected an isotherm near 40 °C that<br />
represents equilibrium with meteoric water in order to separate<br />
minerals that formed by hypogene (δ 18 O <strong>and</strong> δD values that correspond<br />
to N40 °C) processes from minerals that formed by supergene<br />
(δ 18 O <strong>and</strong> δD values that correspond to b40 °C) processes (Fig. 21).<br />
This supergene/hypogene reference isotherm continues to be used<br />
with all sorts of hydroxylated minerals in order to differentiate lowtemperature,<br />
from high-temperature, weathering deposits (Sheppard<br />
<strong>and</strong> Taylor, 1974; Sheppard <strong>and</strong> Gustafson, 1976; Hassanipak <strong>and</strong><br />
Eslinger, 1985; Marumo, 1989; Cravero <strong>and</strong> Dominguez, 1992; Cravero<br />
et al., 1991, 2001; Yiu <strong>and</strong> Chang, 1999; Matthews et al., 1999; Tabor<br />
et al., 2004a,b). Fig. 21 shows the supergene/hypogene line for<br />
kaolinite. Also shown are previously reported δ 18 O <strong>and</strong> δD values of<br />
kaolinite from hydrothermal, diagenetic <strong>and</strong> pedogenic weathering<br />
environments (see figure caption for appropriate citations). The range<br />
of kaolinite δ 18 O <strong>and</strong> δD values indicates that many of the world's<br />
kaolinite deposits are likely derived from low-temperature, supergene<br />
weathering (e.g., Hassanipak <strong>and</strong> Eslinger, 1985; Bird <strong>and</strong> Chivas, 1989,<br />
1993, 1995; Cravero et al., 1991; Lawrence <strong>and</strong> Rashkes Meaux, 1993;<br />
Mizota <strong>and</strong> Longstaffe, 1996; Delgado <strong>and</strong> Reyes, 1996; Harris et al.,<br />
2000; Matthews et al., 1999; Boulvais et al., 2000; Fig. 21).<br />
In consideration of the possible origin(s) for goethite δD <strong>and</strong> δ 18 O<br />
values, Yapp (1993a, 2001a,b) further refined the meaning of supergene<br />
processes with the concept of surface domains in order to differentiate<br />
goethite samples that formed by earth-surface processes<br />
from goethites that formed by higher-temperature processes. This<br />
concept was subsequently exp<strong>and</strong>ed to surface domain arrays for<br />
kaolinite (Savin <strong>and</strong> Hsieh, 1998), smectite (Tabor <strong>and</strong> Montañez,<br />
2005) <strong>and</strong> complex mixtures of kaolinite <strong>and</strong> 2:1 phyllosilicates<br />
(Tabor <strong>and</strong> Montañez, 2005). While it is difficult, <strong>and</strong> probably impossible,<br />
to demonstrate with absolute certainty that a hydroxylated<br />
mineral formed within a soil (<strong>and</strong> remained unaltered within the<br />
paleosol) profile, surface domains are constrained by a global dataset<br />
of mean annual rainfall δ 18 O <strong>and</strong> surface air temperatures, <strong>and</strong> thus<br />
provide a quantitative means to assess whether a mineral's δ 18 O <strong>and</strong><br />
δD values are consistent with environmental conditions that are<br />
expected during pedogenesis.<br />
Specifically, the modern surface domain uses the weighted mean<br />
δ 18 O value of precipitation (δ 18 O precip ) from each site in the IAEA<br />
database in order to calculate the corresponding δD of meteoric<br />
precipitation (Rozanski et al., 1993). This assumes that the meteoric<br />
water line (MWL) of Craig (1961) correctly represents the relationship<br />
between the δD <strong>and</strong> δ 18 O of meteoric waters through time. In addition,<br />
only waters from IAEA sites with a mean annual temperature N0 °C are<br />
used to construct the MSD, as it is expected that liquid water is a<br />
requirement for crystallization of hydroxylated minerals. This treatment<br />
of the IAEA database yields 184 data points, ranging from 0 °C to<br />
~30 °C (Fig. 15). When considering these modern IAEA data in<br />
conjunction with oxygen <strong>and</strong> hydrogen isotope fractionation factors<br />
for a given mineralogy, there is a resulting array of estimated mineral<br />
δD <strong>and</strong> δ 18 O values that define a MSD. Fig. 21 shows the calculated<br />
MSD for kaolinite. Also shown are published kaolinite δD <strong>and</strong> δ 18 O<br />
values (see Fig. 21 caption for references). Of the 79 different kaolinite<br />
samples taken from soil <strong>and</strong> paleosol profiles, 75 samples reside within<br />
the MSD (data points labeled “pedogenic” in Fig. 20).<br />
The Warm Earth Surface Domain (WESD) model assumes global<br />
temperatures 5 °C warmer-than modern, <strong>and</strong> no significant continental<br />
ice sheets (Yapp, 2001a,b). This concept of the WESD array<br />
may be appropriate for “greenhouse world” intervals (Early Paleozoic,<br />
most of the Mesozoic, Early Cenozoic; e.g., Frakes et al., 1992).<br />
Using kaolinite as an example, the resultant WESD is plotted along<br />
with the MSD (Fig. 21). The WESD is somewhat more inclusive of<br />
kaolinite samples with lower δ 18 O <strong>and</strong> δD compositions than its<br />
corresponding MSD. All but one of the 4 pedogenic kaolinites that<br />
reside outside the MSD in Fig. 21 fall within the limits of the WESD.<br />
Therefore, ~99% of paleosol kaolinite sample δ 18 O <strong>and</strong> δD values can<br />
be adequately explained within the contexts of the MSD <strong>and</strong> WESD,<br />
<strong>and</strong> thus may provide some insights to low-temperature earthsurface<br />
processes. δ 18 O <strong>and</strong> δD values of samples that fall outside of<br />
the surface domain arrays must be explained by other processes,<br />
such as a non-pedogenic origin, or diagenetic alteration of pedogenic<br />
minerals.<br />
7.5.2. Variations in soil moisture δ 18 O <strong>and</strong> δD values<br />
Numerous studies have demonstrated that δ 18 O <strong>and</strong> δD values of<br />
hydroxylated soil minerals reflect the isotope composition of soil water<br />
(Savin <strong>and</strong> Epstein, 1970a; Lawrence <strong>and</strong> Taylor, 1971, 1972; Yapp,<br />
1993a, 2001a,b; 2002; Hsieh, 1997; Vitali et al., 2000, 2001).<br />
Hydroxylated soil minerals form by (1) transformation of pre-existing<br />
framework minerals in the soil by rapidly downward percolating soil<br />
waters (Beauvais <strong>and</strong> Tardy, 1991; Wilson, 1999; Bird et al., 1994b) or<br />
(2) direct precipitation from soil solutions with high Si, Al <strong>and</strong> Fe<br />
activities in poorly drained parts of soil profiles (Keller,1963; Bourange<br />
et al., 1975; Wilson, 1999). As a result, soil waters that react to form<br />
hydroxylated soil minerals tend to have δ 18 O <strong>and</strong> δD values which very<br />
closely reflect regional meteoric precipitation (Bird et al., 1992, 1994b;<br />
Giral-Kacmarcík et al., 1998). While the resulting δ 18 O <strong>and</strong> δD values of<br />
the hydroxylated minerals may be offset from the true δ 18 O <strong>and</strong> δD<br />
values of meteoric precipitation due to isotope fractionation (see<br />
Table 5), numerous studies have used the δ 18 O <strong>and</strong> δD values of soil <strong>and</strong><br />
paleosol hydroxylated minerals as temporal <strong>and</strong> spatial proxies for<br />
relative changes in the oxygen <strong>and</strong> hydrogen isotope composition of<br />
soil moisture <strong>and</strong> meteoric precipitation.<br />
Lawrence <strong>and</strong> Taylor (1972) initially demonstrated that δ 18 O<br />
<strong>and</strong> δD values of pedogenic phyllosilicate, gibbsite <strong>and</strong> amorphous<br />
aluminosilicates track regional meteoric precipitation δ 18 O <strong>and</strong> δD<br />
values. Dutta <strong>and</strong> Suttner (1986) noted that δ 18 O values of early<br />
diagenetic-silicate cements (kaolinite, smectite, <strong>and</strong> quartz) from<br />
arkosic s<strong>and</strong>stones of the Gondwana Supergroup in India become<br />
more positive in younger strata, a pattern which they attributed to<br />
northward migration of the subcontinent through warmer climates<br />
characterized by more positive meteoric water δ 18 O values (e.g., see<br />
global rainfall δ 18 O values in Fig. 15).<br />
Bird <strong>and</strong> Chivas (1988a,b, 1989, 1993; Chivas <strong>and</strong> Bird, 1995; See<br />
also Botz et al., 1986) focused upon kaolinite δ 18 O <strong>and</strong> δD values from<br />
Upper Paleozoic through Neogene strata of the Australian regolith.<br />
Australian kaolinites record more positive δ 18 O values through time,<br />
from ~+6‰ in Permian strata to +18‰ in Miocene strata, which was<br />
also attributed to northward tectonic drift of the Australian continent.<br />
Collectively, these studies demonstrate the utility of hydroxylated<br />
soil-formed minerals as monitors of long-term (10 6 –10 8 yr) climatic<br />
change on the time-scales of tectonic processes. Bird <strong>and</strong> Chivas<br />
(1988b) also noted that Paleozoic <strong>and</strong> Lower Mesozoic kaolinites<br />
appear to have δD values that are too positive for pedogenesis (see<br />
black squares in Fig. 21). They interpreted these results to indicate that<br />
kaolinite samples have retained their Paleozoic <strong>and</strong> Mesozoic<br />
pedogenic δ 18 O values, but that these samples also have undergone<br />
post-formational (i.e., diagenetic) exchange of hydrogen isotopes,<br />
which has resulted in δD values that appear too positive for crystallization<br />
with meteoric water at soil temperatures (Fig. 21). Note<br />
that most of these suspect kaolinite samples have δ 18 O values that are<br />
too negative for either the modern surface domain (MSD) or warm<br />
earth suface domain (WESD; Fig. 21). In this regard, post-formational<br />
Please cite this article as: Sheldon, N.D., Tabor, N.J., <strong>Quantitative</strong> <strong>paleoenvironmental</strong> <strong>and</strong> <strong>paleoclimatic</strong> <strong>reconstruction</strong> using paleosols, Earth-<br />
Science Reviews (2009), doi:10.1016/j.earscirev.2009.03.004
ARTICLE IN PRESS<br />
38 N.D. Sheldon, N.J. Tabor / Earth-Science Reviews xxx (2009) xxx–xxx<br />
hydrogen isotope exchange does not seem to adequately explain the<br />
origin <strong>and</strong> isotope composition of these kaolinites. Uysal et al. (2000)<br />
suggested that the δ 18 O <strong>and</strong> δD values of phyllosilicate from<br />
the Permian coal measures in Australia result from hydrothermal<br />
(~235 °C), rock-dominated, alteration during Late Triassic tectonic<br />
extension, <strong>and</strong> are not related to pedogenesis. The conclusions of<br />
Uysal et al. (2000) are significant because, if correct, post-formational<br />
change of hydrogen isotopes, in the absence of dissolution (<strong>and</strong> a<br />
corresponding change in δ 18 O values), has yet to be demonstrated as<br />
an important process in hydroxylated pedogenic minerals (Yeh <strong>and</strong><br />
Savin, 1977; Yeh <strong>and</strong> Epstein, 1978; Elsinger <strong>and</strong> Ye, 1981; Yapp, 1993a,<br />
2000; Sheppard <strong>and</strong> Gilg, 1996; Gilg, 2000; Tabor <strong>and</strong> Montañez,<br />
2005; Tabor, 2007; cf. O'Neil <strong>and</strong> Kharaka, 1976; Keyser <strong>and</strong> Kerrich,<br />
1991).<br />
At higher-resolution scales, Stern <strong>and</strong> others (1997) noted a 3–4‰<br />
increase in δ 18 O values of mixed smectite <strong>and</strong> kaolinite samples from<br />
Miocene paleosol profiles, over a 1–2 My interval (~8.5–6.5 Ma), in<br />
the Himalayan Molasse of Pakistan. These workers attributed the shift<br />
in phyllosilicate δ 18 O values to be mechanistically linked to the onset<br />
of Indian Monsoon atmospheric circulation, <strong>and</strong> to diversion of<br />
isotopically heavier moisture over the Indian Ocean to interior<br />
continental sites (see also Quade et al., 1989, 1995; DeCelles et al.,<br />
2007). In their study of mixed 2:1 <strong>and</strong> 1:1 phyllosilicates from Permo-<br />
Carboniferous paleosols of the southwestern U.S.A., Tabor et al. (2002)<br />
noted that paleosol phyllosilicates record δ 18 O values similar to those<br />
found in modern low-latitude, coastal <strong>and</strong> maritime sites. Tabor <strong>and</strong><br />
Montañez (2002) interpreted these results to indicate a western<br />
source of meteoric precipitation, <strong>and</strong> low-latitude, reverse equatorial<br />
flow over western equatorial Pangea.<br />
Several studies have used both δD <strong>and</strong> δ 18 O values of hydroxylated<br />
minerals as monitors of paleo-elevation (Chamberlain <strong>and</strong> Poage,<br />
2000; Horton et al., 2004). Chamberlain <strong>and</strong> Poage (2000) noted an<br />
~6‰ decrease in Early Pliocene smectites from altered ashes in New<br />
Zeal<strong>and</strong>, which they attributed to an ~2 km uplift of the Southern Alps.<br />
δD values of Eocene-age kaolinites that formed by alteration of<br />
auriferous gravels in California, U.S.A., indicate that the Sierra Nevada<br />
Range has remained high (N2200 m) over the past 40 to 50 million<br />
years (Mulch <strong>and</strong> Chamberlain, 2006). These studies are based upon<br />
the assumption that hydroxylated mineral δ 18 O <strong>and</strong> δD values change<br />
with elevation. In their survey of 68 studies of meteoric waters in<br />
mountain belts, Poage <strong>and</strong> Chamberlain (2001) found that meteoric<br />
water δ 18 O values decrease by 2.8‰ for every kilometer of elevation<br />
rise (R 2 =0.79). As with other paleoelevation methods (e.g., Quade<br />
et al., 2007; Rowley <strong>and</strong> Garzione, 2007), the choice of lapse rate<br />
model greatly affects the absolute elevations predicted using pedogenic<br />
δ 18 O values.<br />
7.5.3. Single-mineral paleotemperature estimates<br />
The potential of pedogenically-formed hydroxylated minerals as<br />
single-mineral geothermometers has been realized since pioneering<br />
studies of phyllosilicate δ 18 O <strong>and</strong> δD values in soils <strong>and</strong> sediments in<br />
the early 1970 s (Savin <strong>and</strong> Epstein, 1970a,b; Lawrence <strong>and</strong> Taylor,<br />
1971; Lawrence <strong>and</strong> Taylor, 1972). These early studies determined that<br />
δ 18 O <strong>and</strong> δD values of soil-formed <strong>and</strong> other “supergene” hydroxylated<br />
minerals define an array that is roughly parallel with the meteoric<br />
water line. Savin <strong>and</strong> Epstein (1970a) suggested that, under conditions<br />
of chemical equilibrium with meteoric water, hydroxylated mineral<br />
δ 18 O <strong>and</strong> δD values exhibit the following general relation:<br />
" #<br />
"" #<br />
#<br />
D α<br />
δD m =8 m−w<br />
δ 18 D α<br />
O m + 1000 8 × m−w<br />
− 6:99 D α m−w − 1<br />
18 α m−w<br />
18 α m−w<br />
ð57Þ<br />
Subscript “m” denotes the mineral of interest, <strong>and</strong> the terms D α m-w<br />
<strong>and</strong> 18 α m-w denote the hydrogen <strong>and</strong> oxygen isotope fractionation<br />
values (α-values), respectively, between the mineral of interest <strong>and</strong><br />
water. Given that values for D α m-w <strong>and</strong> 18 α m-w are temperature<br />
dependent (Table 5), <strong>and</strong> provided that temperature-dependent fractionation<br />
factors are known, these early studies speculated that measurements<br />
of δD m <strong>and</strong> δ 18 O m in soil-formed hydroxylated minerals<br />
might provide information about the temperature of crystallization.<br />
7.5.3.1. Goethite. Yapp (1987a,b, 1993a, 2000) suggested that<br />
measured δ 18 O <strong>and</strong> δD values of ancient goethites might be useful as<br />
single-mineral paleothermometers. This paleotemperature proxy<br />
assumes chemical equilibrium with waters that lie upon Craig's<br />
(1961) Meteoric Water Line:<br />
○<br />
T<br />
ð KÞ = 1:63×10 6 !1<br />
2<br />
Δ 18 O g−w +12:3<br />
where,<br />
Δ 18 O g−w = δ 18 O g − δ 18 O w ≈10 3 ln 18 α g−w<br />
<strong>and</strong><br />
2<br />
ð<br />
δ 18 6<br />
O w = 4<br />
1000 + δD g<br />
D α<br />
ð58Þ<br />
ð59Þ<br />
3<br />
Þ<br />
− 1010<br />
7<br />
5 ð60Þ<br />
8<br />
δD g <strong>and</strong> δ 18 O g are the measured hydrogen <strong>and</strong> oxygen isotope<br />
composition, respectively, of goethite, <strong>and</strong> D α g-w is the stable<br />
hydrogen isotope fractionation factor between goethite <strong>and</strong> water<br />
(0.905; see Table 5). The analytical uncertainty of paletemperature<br />
estimates using this method is no better than ±3 °C. Using this<br />
approach, Yapp (2000) presented δD g <strong>and</strong> δ 18 O g values of 31 different<br />
natural goethite samples. The goethite δD g <strong>and</strong> δ 18 O g values<br />
corresponded to a range of crystallization temperatures from 6° to<br />
69 °C, of which 16 goethites plotted within the goethite Modern<br />
Surface Domain, 8 goethites plotted within the limits of the goethite<br />
Warm Earth Surface Domain, <strong>and</strong> 7 goethites occurred outside the<br />
limits of either goethite surface domain. Tabor <strong>and</strong> others (2004a)<br />
measured δD g <strong>and</strong> δ 18 O g values of −132 ± 4‰ <strong>and</strong> 2.7±0.2‰,<br />
respectively, for goethite from a paleosol in Argentina that formed<br />
during the Late Triassic, at ~35–40° S paleolatitude. These values<br />
correspond to a crystallization temperature of 6±3 °C; relatively cool<br />
temperatures for an interval of time that is generally associated with a<br />
Greenhouse (warm) global climate. Pleistocene-age goethites from<br />
Oklahoma, U.S.A., preserve δD g <strong>and</strong> δ 18 O g values of ~−123 ± 3‰ <strong>and</strong><br />
~2.9±0.2‰, values which correspond to crystallization temperatures<br />
of ~9±3 °C (Tabor <strong>and</strong> Yapp, 2005c). Such inferred paleotemperatures<br />
are 7 °C lower than modern mean annual temperatures in<br />
Oklahoma, U.S.A., <strong>and</strong> correspond well with independent studies that<br />
propose temperatures were ~6 °C cooler in this region during intervals<br />
of Pleistocene time (Stute et al., 1992; Stute <strong>and</strong> Schlosser, 1993).<br />
7.5.3.2. Smectite <strong>and</strong> mixed phyllosilicates. Delgado <strong>and</strong> Reyes (1996)<br />
used oxygen (Savin <strong>and</strong> Lee, 1988) <strong>and</strong> hydrogen (Capuano, 1992)<br />
isotope fractionation equations for smectite, in conjunction with<br />
Craig's (1961) equation for the Meteoric Water Line in order to relate<br />
the δ 18 O <strong>and</strong> δD values of smectite in paleosols to temperature of<br />
crystallization:<br />
○<br />
T<br />
ð KÞ = 3:54×10 6 !1<br />
2<br />
δ 18 O sm −0:125δD sm +8:95<br />
ð0 − 150 ○ CÞ ð61Þ<br />
where δ 18 O sm <strong>and</strong> δD sm are the measured smectite δ 18 O <strong>and</strong> δD values.<br />
The analytical uncertainty of paleotemperature estimates using<br />
this method is no better than ±3 °C. Delgado <strong>and</strong> Reyes observed that<br />
Please cite this article as: Sheldon, N.D., Tabor, N.J., <strong>Quantitative</strong> <strong>paleoenvironmental</strong> <strong>and</strong> <strong>paleoclimatic</strong> <strong>reconstruction</strong> using paleosols, Earth-<br />
Science Reviews (2009), doi:10.1016/j.earscirev.2009.03.004
ARTICLE IN PRESS<br />
N.D. Sheldon, N.J. Tabor / Earth-Science Reviews xxx (2009) xxx–xxx<br />
39<br />
δ 18 O <strong>and</strong> δD values of altered bentonites from Cortijo de Archidona<br />
(Southeastern Spain) ranged from 21.0 to 23.0‰ <strong>and</strong> − 87 to −102‰,<br />
respectively, which corresponds to temperatures of crystallization<br />
ranging from 9±3 °C to 21±3 °C. In their assessment of clay minerals<br />
in an Upper Triassic paleosol profile derived from basalt, Tabor <strong>and</strong><br />
others (2004a) measured smectite δ 18 O <strong>and</strong> δD values ranging from<br />
14.5 to 15.6‰ <strong>and</strong> −78 to −71‰, respectively. This range of smectite<br />
δ 18 O <strong>and</strong> δD values corresponds to temperatures of crystallization<br />
ranging from 49 to 57 °C. Such temperatures are far too high for<br />
soil formation, <strong>and</strong> were interpreted to result from hydrothermal<br />
alteration.<br />
Tabor <strong>and</strong> Montañez (2005) adopted a similar approach to that of<br />
Delgado <strong>and</strong> Reyes (1996) in order to estimate temperature of smectite<br />
crystallization for smectite <strong>and</strong> kaolinite mixtures in Upper Pennsylvanian<br />
<strong>and</strong> Lower Permian paleosols from Texas, U.S.A. Notable<br />
differences between the approach of Tabor <strong>and</strong> Montañez (2005)<br />
<strong>and</strong> Delgado <strong>and</strong> Reyes (1996) are (1) analysis of only the b0.2 μm<br />
fraction of phyllosilicate <strong>and</strong> (2) consideration of the variability of<br />
oxygen <strong>and</strong> hydrogen isotope fractionation between smectite <strong>and</strong><br />
water that is related to differences in the chemical composition of<br />
smectite. The range of δ 18 O <strong>and</strong> δD values corresponds to temperatures<br />
of phyllosilicate crystallization ranging from 22±3 °C to 35±3 °C,<br />
where phyllosilicate δ 18 O <strong>and</strong> δD values from Upper Pennsylvanian<br />
paleosol profiles indicated significantly lower temperatures than δ 18 O<br />
<strong>and</strong> δD values from Lower Permian paleosol profiles.<br />
Vitali et al. (2002) analyzed the b0.2 μm of mixed-mineral<br />
phyllosilicate fraction from a middle Cenomanian paleosol profile in the<br />
Dunvegan fm., British Columbia, Canada. Measured δ 18 O<strong>and</strong>δD values<br />
ranged from −12.9‰ to −11.6‰ <strong>and</strong> −93‰ to −81‰, respectively, <strong>and</strong><br />
were interpreted to correspond to paleotemperatures of phyllosilicate<br />
crystallization ranging from 9 to 16 °C. To date, very few studies have<br />
focused upon the δ 18 O<strong>and</strong>δD values of soil <strong>and</strong> paleosol smectites <strong>and</strong><br />
other common pedogenic minerals such as gibbsite <strong>and</strong> related<br />
aluminum hydroxides (Bird <strong>and</strong> Chivas, 1989; Vitali et al., 2000, 2001)<br />
<strong>and</strong> illite (Yeh, 1980; Capuano, 1992; Gilg, 2003; Hyeong <strong>and</strong> Capuano,<br />
2004). Nevertheless, these hydroxylated pedogenic minerals are very<br />
common mineral products of pedogenic weathering, <strong>and</strong> these minerals<br />
have the potential to become important proxies of paleotemperature<br />
throughout much of the terrestrial Phanerozoic stratigraphic record.<br />
7.5.3.3. Kaolinite. Much work has been done with the oxygen <strong>and</strong><br />
hydrogen isotope compositions of soil-formed kaolinites (Sheppard,<br />
1977; Hassanipak <strong>and</strong> Eslinger, 1985; Bird <strong>and</strong> Chivas, 1988a,b, 1989;<br />
Lawrence <strong>and</strong> Rashkes Meaux, 1993; Savin <strong>and</strong> Hsieh, 1998; Girard<br />
<strong>and</strong> Savin, 1996; Giral-Kacmarcík et al., 1989; Girard et al., 2000). The<br />
oxygen <strong>and</strong> hydrogen isotope kaolinite-water fractionation equations<br />
(Sheppard <strong>and</strong> Gilg, 1996) in conjunction with the equation for the<br />
meteoric water line of Craig (1961) relates the measured δ 18 O <strong>and</strong> δD<br />
of kaolinite to temperature of crystallization:<br />
○<br />
T<br />
ð KÞ = 3:04×10 6 !1<br />
2<br />
δ 18 O k −0:125×δD k +7:04<br />
ð62Þ<br />
As discussed earlier, only kaolinite samples from paleosol profiles<br />
with δ 18 O <strong>and</strong> δD values that plot within the WESD <strong>and</strong> MSD should<br />
be considered viable paleotemperature proxies. For the following<br />
discussion, we also limit the dataset of kaolinite δ 18 O <strong>and</strong> δD values to<br />
only those samples that are known to have formed within the timeframe<br />
of an individual Epoch or less in the Cenozoic. Cretaceous<br />
samples are limited to Campanian or younger kaolinites. This culling<br />
of the literature data leaves 78 kaolinite samples, which are plotted<br />
with respect to their corresponding paleolatitude of soil formation in<br />
Fig. 22.<br />
Several observations may be made from this dataset (Fig. 22).<br />
(1) The mid-latitudes, from ~35 to 50° N <strong>and</strong> ~30 to 62° S, are the<br />
only locations with published, pre-Pliocene kaolinite δ 18 O <strong>and</strong> δD<br />
values. However, pedogenic kaolinite formation surely formed at<br />
lower latitude tropical sites (e.g., Wilson, 1999; Jacobs et al., 2005).<br />
Therefore, more attention should be given to determination of kaolinite<br />
δ 18 O <strong>and</strong> δD values, as well as other potential geochemical proxy<br />
data of paleotemperature, from low-latitude sites in the future.<br />
(2) Kaolinite δ 18 O <strong>and</strong> δD values indicate their warmest mean<br />
temperatures (24 °C) during Cretaceous <strong>and</strong> Eocene time, followed by<br />
Paleocene (22 °C), <strong>and</strong> their lowest mean temperatures (20 °C) during<br />
Oligocene <strong>and</strong> Miocene time.<br />
(3) Kaolinite δ 18 O <strong>and</strong> δD values correspond to crystallization<br />
temperatures that are significantly (N3 °C) higher than mean annual<br />
surface-air temperatures at modern isolatitudinal sites. Because of the<br />
large thermal-mass of soil compared to atmosphere, subsurface<br />
temperatures are generally assumed to be approximately equivalent to<br />
that of mean annual temperature (+1 to 2 °C) with little or no seasonal<br />
change in temperature (e.g., Cerling <strong>and</strong> Quade, 1993; Buol et al., 2003).<br />
Therefore, isotope values of pedogenic isotope compositions are<br />
assumed to approximately record mean annual surface air temperatures<br />
in most studies (Yapp, 2000; Tabor, 2007; Tabor <strong>and</strong> Montañez, 2005;<br />
Tabor <strong>and</strong> Yapp, 2005c). Yet, long-term monitoring of ground <strong>and</strong> air<br />
temperatures from mid-latitude sites indicates that subsurface soil<br />
temperatures are strongly correlated with surface air temperatures, <strong>and</strong><br />
vary seasonally, from ~0° to 22 °C, at 1.0 m depth (Bartlett et al., 2006).<br />
The rate of chemical weathering, <strong>and</strong> of crystallization of pedogenic<br />
minerals, is strongly temperature dependent. Furthermore, crystallization<br />
of soil minerals likely will not occur at 0 °C, as liquid water is<br />
necessary for chemical reaction. Therefore, it is possible that strikingly<br />
warm temperatures indicated by kaolinite δ 18 O<strong>and</strong>δD values in Fig. 22<br />
more accurately reflect surface-air temperatures during warm-months<br />
<strong>and</strong> growing seasons, <strong>and</strong> thus should not be compared with modern<br />
mean annual surface air-temperatures.<br />
Note that mean annual surface air temperatures in low-latitude<br />
tropical sites do not vary annually by more than 1 or 2 °C. Therefore<br />
soil subsurface temperatures do not vary by more than 1 or 2 °C, <strong>and</strong><br />
pedogenic mineral δ 18 O <strong>and</strong> δD values from those sites likely provide<br />
a reasonable approximation of surface air temperatures. However, it is<br />
possible that perennially warm conditions, similar to those in the<br />
modern tropics, existed at higher mid-latitude sites during early<br />
Neogene, Paleogene <strong>and</strong> Late Cretaceous. This reflects both that<br />
paleosol profiles (Van Houten, 1961, 1982; Dury, 1971; Tardy et al.,<br />
1990a,b) <strong>and</strong> fossil floras (e.g., Dorf, 1964) that are indicative of<br />
modern, low-latitude tropical, sites (~15° N <strong>and</strong> S) occurred at<br />
paleolatitudes as high as 60°N. Furthermore, marine paleotemperature<br />
indicators suggest that mid-latitude surface oceans were significantly<br />
warmer, as high as 30 °C, during intervals of the Paleogene<br />
<strong>and</strong> Late Cretaceous (e.g., Takashima et al., 2006). In this regard,<br />
paleosol kaolinite δ 18 O <strong>and</strong> δD values, <strong>and</strong> paleotemperature estimates<br />
shown in Fig. 22, may provide reasonable estimates of mean<br />
annual surface air paleotemperatures.<br />
Future work of this sort should seek to (1) collect kaolinite δ 18 O<br />
<strong>and</strong> δD values for paleotemperature estimates from places <strong>and</strong> times<br />
that are poorly represented in Fig. 22, (2) produce similar databases<br />
of δ 18 O <strong>and</strong> δD value with other common hydroxylated pedogenic<br />
minerals, <strong>and</strong> (3) if these paleotemperatures are correct, evaluate<br />
what mechanisms (such as atmospheric pCO 2 , ocean <strong>and</strong> atmospheric<br />
circulation, etc.) might contribute to such high temperatures in the<br />
mid-latitudes.<br />
A major limitation to the application of single-mineral paleothermometers<br />
from soils <strong>and</strong> paleosols is the requisite assumption of<br />
chemical equilibrium with water δ 18 O <strong>and</strong> δD values that lie upon the<br />
meteoric water line of Craig (1961). Changes in the position of the<br />
MWL (in hydrogen vs. oxygen isotope space) might have occurred at<br />
times during the geological past. The slope of the meteoric water line<br />
Please cite this article as: Sheldon, N.D., Tabor, N.J., <strong>Quantitative</strong> <strong>paleoenvironmental</strong> <strong>and</strong> <strong>paleoclimatic</strong> <strong>reconstruction</strong> using paleosols, Earth-<br />
Science Reviews (2009), doi:10.1016/j.earscirev.2009.03.004
ARTICLE IN PRESS<br />
40 N.D. Sheldon, N.J. Tabor / Earth-Science Reviews xxx (2009) xxx–xxx<br />
Fig. 22. Cross plot of estimated temperatures of kaolinite crystallization versus paleolatitudes of the paleosol profiles from which kaolinte samples were taken. Negative <strong>and</strong> positive<br />
values of latitude indicate positions in the southern <strong>and</strong> northern hemisphere, respectively. Paleolatitudes were determined using the “Point Tracker (v. 4) for Window” software<br />
package (developed by C.R. Scotese). Thick black line is the best-fit curve for mean annual surface air temperatures for weather station below 100 m above sea level in the<br />
International Atomic Energy Association database (Rozanski et al., 1993). Thin dashed lines represent the ±1s among the mean values for surface air temperatures. Temperature<br />
estimates for kaolinite crystallization are based upon published δ 18 O <strong>and</strong> δD values (Sheppard, 1977; Hassanipak <strong>and</strong> Eslinger, 1985; Bird <strong>and</strong> Chivas, 1989; Lawrence <strong>and</strong> Rashkes<br />
Meaux, 1993; Mizota <strong>and</strong> Longstaffe, 1996; Boulvais et al., 2000) <strong>and</strong> are depicted as follows: green dots=Cretaceous, blue dots=Paleocene, red dots=Eocene, orange<br />
dots=Oligocene, yellow dots=Miocene. Ages for kaolinite samples are generally poorly known, <strong>and</strong> only kaolinite samples that are known to be limited to an Epoch are shown for<br />
Cenozoic data points. All Cretaceous samples are Campian or Maastrichtian. Temperature estimates are no better than ±3 °C. See text. (For interpretation of the references to colour<br />
in this figure legend, the reader is referred to the web version of this article.)<br />
has not likely changed by more than 0.1‰ (e.g., Yurtsever <strong>and</strong> Gat,<br />
1981) <strong>and</strong>, while the intercept of the meteoric water line is susceptible<br />
to variation that is principally related to humidity of air masses over<br />
the low-latitude tropics, it is unlikely that such changes will result in<br />
paleotemperature estimates that differ by more than ±2 °C (Delgado<br />
<strong>and</strong> Reyes,1996). In addition, evaporation of water from the soil profile<br />
will drive soil water δ 18 O <strong>and</strong> δD values to the right of the meteoric<br />
water line (Rozanski et al., 1993). Therefore, kaolinite which forms in<br />
equilibrium with soil waters that are offset from the meteoric water<br />
line through evaporation can result in significant overestimates of<br />
paleotemperature.<br />
7.5.4. Mineral-pair δ 18 O values<br />
If two (or more) co-existing soil minerals form in chemical equilibrium,<br />
then differences in the δ 18 O values of those two (or more)<br />
minerals may provide an estimate of temperature at the time of<br />
mineral co-precipitation. Paleotemperature estimates that are based<br />
on mineral-pair δ 18 O values have a significant advantage over paleotemperature<br />
estimates that are based upon single-mineral δ 18 O <strong>and</strong><br />
δD values, in that the isotopic composition of soil water from which<br />
the minerals are derived is not important, <strong>and</strong> it is unnecessary to<br />
assume that soil water δ 18 O <strong>and</strong> δD values lie upon the meteoric water<br />
line of Craig (1961).<br />
There are only a few examples of paleotemperature estimates<br />
based on oxygen-isotope mineral pairs from pedogenic minerals. Yapp<br />
(1993b) estimated a paleotemperature of 23±4 °C from a phosphate–<br />
goethite pair in Late Ordivician oolitic ironstone from the Neda fm.,<br />
Wisconsin, USA. Yapp (1998) estimated a paleotemperature of 32±<br />
4 °C from a kaolinite–goethite pair in Early Jurassic oolitic ironstone<br />
from Israel. Tabor (2007) estimated paleotemperatures from hematite–phyllosilicate<br />
pairs at five different stratigraphic horizons in<br />
Upper Pennsylvanian <strong>and</strong> Lower Permian paleosol profiles from Texas,<br />
USA. These hematite–phyllosilicate oxygen-isotope pairs indicate<br />
warming from relatively cool (24±3 °C) soil temperatures in the<br />
Late Pennsylvanian to warmer soil temperatures (25 to 37±3 °C) in<br />
the Early Permian. To date, all mineral-pair estimates of paleotemperature<br />
come from analysis of paleosol minerals that formed at lowlatitude,<br />
tropical sites. Therefore, it is likely that these paleotemperature<br />
estimates reflect mean annual surface-air temperatures, rather<br />
than warm-season averages (see discussion of this in Section 7.5.3.3).<br />
As mentioned above, oxygen isotope mineral-pair paleotemperature<br />
estimates are not sensitive to the isotopic composition of soil<br />
water from which the minerals co-precipitate. The temperature estimate<br />
provided by this proxy, however, does permit estimation of soil<br />
water δ 18 O values. In the instances for the Late Ordovician <strong>and</strong> Early<br />
Jurassic examples provided in Yapp (1993b, 1998), estimated soil<br />
water δ 18 O values are ~−7.0‰. For the Late Carboniferous <strong>and</strong> Early<br />
Permian examples, estimated soil water δ 18 O values range from<br />
−3.8‰ to −4.9‰. In addition, within analytical uncertainty, paleotemperature<br />
estimates from Upper Carboniferous <strong>and</strong> Lower Permian<br />
hematite-phyllosilicate mineral pairs are indistinguishable from<br />
single mineral paleotemperature estimates that are based upon δ 18 O<br />
<strong>and</strong> δD values from paleopedogenic phyllosilicates. This represents a<br />
rare instance in which a persuasive case can be made for (1) lowtemperature<br />
chemical equilibrium <strong>and</strong> (2) demonstration that very<br />
ancient soil water δ 18 O <strong>and</strong> δD values lie upon, or very near, those<br />
defined by the modern meteoric water line (Craig, 1961).<br />
7.6. Paleo-vegetation/paleo-photosynthesis<br />
An additional application of isotope geochemistry in paleosols is to<br />
reconstruct past vegetative cover by estimation of the ratio of plants<br />
using C 3 <strong>and</strong> C 4 photosynthetic pathways (e.g., Quade et al., 1989,<br />
1994; Cerling, 1992; Cerling <strong>and</strong> Quade, 1993; Cerling et al., 1993;<br />
Kingston et al., 1994; Latorre et al., 1997; Fox <strong>and</strong> Koch, 2003, 2004).<br />
The topic was recently reviewed by Tipple <strong>and</strong> Pagani (2007), so<br />
readers seeking a comprehensive review of this subject are directed<br />
there. However, a short review of the approach is appropriate here<br />
before we discuss some of the applications <strong>and</strong> results.<br />
C 3 photosynthesis (Calvin–Benson) is the earliest developed photosynthetic<br />
pathway that is used by terrestrial plants. CO 2 diffuses into<br />
the plant <strong>and</strong> after a number of intermediate steps involving ribulose<br />
Please cite this article as: Sheldon, N.D., Tabor, N.J., <strong>Quantitative</strong> <strong>paleoenvironmental</strong> <strong>and</strong> <strong>paleoclimatic</strong> <strong>reconstruction</strong> using paleosols, Earth-<br />
Science Reviews (2009), doi:10.1016/j.earscirev.2009.03.004
ARTICLE IN PRESS<br />
N.D. Sheldon, N.J. Tabor / Earth-Science Reviews xxx (2009) xxx–xxx<br />
41<br />
1,5-biphosphate (RuBP) <strong>and</strong> the enzyme Rubisco, the 3-carbon sugar<br />
glyceraldhydes-3-phosphate (G3P) is produced (Tipple <strong>and</strong> Pagani,<br />
2007). For each six G3P molecules produced, one molecule is converted<br />
to a simple sugar for cell use <strong>and</strong> the remaining five are<br />
recycled to generate more RuBP (Tipple <strong>and</strong> Pagani, 2007). Under<br />
environmentally stressful conditions such as high temperature,<br />
aridity, or high-light intensity, leaves close their stomatal openings<br />
<strong>and</strong> consequently, have lower internal CO 2 concentrations, which<br />
reduces the efficiency of C 3 photosynthesis. Two other photosynthetic<br />
pathways have evolved in terrestrial vascular plants: 1) Crassulacean<br />
acid metabolism (CAM), which is used primarily by succulents <strong>and</strong><br />
2) C 4 photosynthesis, which is used primarily by dry- <strong>and</strong> cold-climate<br />
grasses. Ultimately, C 4 photosynthesis uses the Calvin–Benson cycle to<br />
fix C, but a series of intermediate storage reactions increase the overall<br />
photosynthetic efficiency under environmentally stressed conditions<br />
by storing CO 2 as HCO 3 − that can be re-converted to CO 2 for use at the<br />
optimally efficient time (Tipple <strong>and</strong> Pagani, 2007).<br />
This difference between photosynthetic pathways is recorded by<br />
paleosol carbonates <strong>and</strong> organic matter because of differences in how<br />
strongly the two pathways discriminate against 13 C. C 3 photosynthesis<br />
discriminates more strongly, which results in typical biomass δ 13 C<br />
values of − 20‰ to − 33‰ (mean − 27‰), whereas C 4 photosynthesis<br />
does not discriminate strongly, which results in typical biomass<br />
δ 13 C values of −10‰ to −14‰ (mean −13‰) (e.g., Koch, 1998;<br />
Cerling <strong>and</strong> Harris, 1999). The δ 13 C value of soil biomass is directly<br />
related to δ 13 C values of soil-respired CO 2 <strong>and</strong> pedogenic calcite (see<br />
Sections 7.1–7.4). Owing to a variety of factors (reviewed in Koch, 1998<br />
<strong>and</strong> discussed above) soil calcite is typically 14‰–17‰ more positive<br />
(i.e., 13 C-enriched) relative to soil-respired CO 2 . CAM plants are relatively<br />
rare, so most soil organic matter is derived either from C 3 or C 4<br />
photosynthesis. Thus, using either δ 13 C org or δ 13 C cc values, it is possible<br />
to derive a simple two-component mixing line between C 3 <strong>and</strong> C 4<br />
photosynthetic pathways, <strong>and</strong> consequently, vegetation types since C 4<br />
plants are typically grasses (though it should be noted that there are<br />
also a number of C 3 grasses).<br />
For pedogenic carbonates (<strong>and</strong> assuming an enrichment factor<br />
[Δ 13 C] of 15.5‰ (e.g., Fox <strong>and</strong> Koch, 2003), the proposed mixing line is<br />
between −11.5‰ (100% C 3 ) <strong>and</strong> +2.5‰ (100% C 4 ). Using this equation,<br />
or a similar one, various authors have reconstructed the balance<br />
between C 3 <strong>and</strong> C 4 plants during the Cenozoic in areas including East<br />
Africa, Pakistan, Greece, <strong>and</strong> North <strong>and</strong> South America (Quade et al.,<br />
1989, 1994; Cerling <strong>and</strong> Quade, 1993; Cerling, 1992; Cerling et al.,<br />
1993; Kingston et al., 1994; Latorre et al., 1997; Fox <strong>and</strong> Koch, 2003,<br />
2004) <strong>and</strong> have concluded that there was a significant expansion of<br />
the amount <strong>and</strong> range of C 4 plants in the late Miocene (e.g., Fig. 19).<br />
Those results are further supported by analyses of mammal diets in<br />
many of the same areas, <strong>and</strong> which indicate a similar shift toward C 4<br />
plants (e.g., Passey et al., 2002; Cerling et al., 1997). Though all of the<br />
studies indicated a late Miocene age for the spread of C 4 plants (at the<br />
expense of C 3 plants), the timing of the spread is regionally dependent<br />
(see Fig. 5 of Tipple <strong>and</strong> Pagani, 2007), <strong>and</strong> in North America, some<br />
component of C 4 plants was probably present much earlier in the<br />
Miocene (Fox <strong>and</strong> Koch, 2003, 2004; Sheldon, 2008).<br />
The limitations to this approach have been discussed in various<br />
places (e.g., Koch, 1998; Fox <strong>and</strong> Koch, 2003), but there are three<br />
principle factors to consider when reconstructing the C 3 –C 4 plant<br />
balance using paleosols. The first is aridity, which could potentially<br />
shift the δ 13 C composition of C 3 biomass toward heavier values, which<br />
would give a false-positive C 4 plant result. As discussed in Section 5.5,<br />
there are various methods for reconstructing past precipitation<br />
regimes using paleosols, so it should be possible to account for this<br />
effect. Secondly, high levels of atmospheric CO 2 would result in higher<br />
concentrations of atmospheric CO 2 in the soil, a corresponding shift<br />
toward more positive δ 13 C cc values, <strong>and</strong> an overestimate of C 4<br />
photosynthesizers. However, various marine <strong>and</strong> non-marine proxies<br />
(e.g., Royer et al., 2004) indicate at most slight elevated CO 2 levels<br />
through the Neogene above pre-industrial levels, so unless evidence<br />
for earlier C 4 plants is discovered, the entire period of time in which<br />
the C 3 –C 4 balance is a viable research avenue is characterized by “low”<br />
CO 2 levels. The final potential issue is with low productivity soils,<br />
which would also have heavier δ 13 C values, low concentrations of CO 2<br />
derived from oxidation of soil organic matter, <strong>and</strong> a relatively greater<br />
contribution of CO 2 derived from the atmosphere owing to the<br />
influence of atmospheric CO 2 diffusion (i.e., incomplete respiration of<br />
the CO 2 that diffused into the profile). This potential problem may be<br />
examined by looking at the off-set between δ 13 C org or δ 13 C carb values<br />
for coexisting pedogenic carbonates <strong>and</strong> organic matter. If Δ 13 Cis<br />
significantly greater than 15.5‰, then low productivity may be<br />
inferred, <strong>and</strong> in that case, the δ 13 C org value is a reliable indicator of<br />
C 3 –C 4 balance <strong>and</strong> the δ 13 C carb value is not (Sheldon, 2008).<br />
8. Future approaches <strong>and</strong> challenges<br />
8.1. Boron isotopes<br />
There is not currently a good proxy for paleo-pH from paleosol<br />
profiles. One possible means to address this would be to look at the<br />
boron isotopic composition (δ 11 B) of paleosol carbonate nodules.<br />
Boron has two stable, non-redox dependent, isotopes: 10 B <strong>and</strong> 11 B.<br />
Boron isotopic fractionation in carbonate minerals is a pH-dependent<br />
conversion of planar boric acid, H 3 BO 3 , to tetrahedral borate, B(OH) 4<br />
−<br />
(Hemming <strong>and</strong> Hanson, 1992, Sanyal et al., 1996). Observations of<br />
marine carbonates have shown that borate is preferentially taken up<br />
in carbonates, preserving the isotopic fractionation of borate in the<br />
carbonate with little additional fractionation. Since borate production<br />
is pH-dependent, the final δ 11 B isotopic composition in the carbonates<br />
ultimately depends on pH. The equilibrium expression for the<br />
conversion of boric acid to borate is:<br />
K B =<br />
h i<br />
ðXÞ H +<br />
ð1 − XÞ<br />
ð63Þ<br />
where K B is the equilibrium constant <strong>and</strong> X is mole fraction of borate<br />
(relatively to the total B). The mass balance expression relating the<br />
isotopic composition of borate (δ − BA ), boric acid (δ B ), <strong>and</strong> total boron<br />
(δ ΣB ) is:<br />
δ ΣB = δ BA − X + δ B ð1 − XÞ ð64Þ<br />
If Eqs. (63) <strong>and</strong> (64) are combined, the following expression<br />
relates the measured δ 11 B composition of carbonate nodules to aH +<br />
(pH=−Log[aH + ]):<br />
<br />
K<br />
a H + =<br />
B δ ΣB − δ BA −<br />
= K <br />
B δ ΣB − δ BA −<br />
ð65Þ<br />
ðδ B − δ BA − Þ− δ ΣB − δ BA − Δ B − δ ΣB − δ BA −<br />
Assuming that fractionation of boron in soils is only dependent on<br />
pH, then δ ΣB is measured directly by measuring the δ 11 B composition<br />
of the parent material for the soil, δ −<br />
BA is the measured δ 11 B composition<br />
of paleosol carbonate nodules, <strong>and</strong> δ B is 19.4 at 25 °C<br />
(Kakihana et al., 1977). K for the addition of OH − to boric acid to form<br />
borate is 10 5.27 (Kakihana et al., 1977); K B also needs to take into<br />
account the dissociation of H 2 O to provide OH − (10 − 13.995 ), so the<br />
overall K B at 25 °C is 10 − 8.725 . In marine settings, the need to estimate<br />
δ ΣB is one of the primary difficulties in applying δ 11 B compositions of<br />
fossils. This weakness is precisely the strength of applying this<br />
approach to paleosols, because it is possible to measure directly values<br />
for δ ΣB if the paleosol's parent material has been preserved. In particular,<br />
this method is likely to be useful for paleosols with igneous<br />
parent materials, which typically have a more homogeneous chemical<br />
composition than alluvial parent materials.<br />
Please cite this article as: Sheldon, N.D., Tabor, N.J., <strong>Quantitative</strong> <strong>paleoenvironmental</strong> <strong>and</strong> <strong>paleoclimatic</strong> <strong>reconstruction</strong> using paleosols, Earth-<br />
Science Reviews (2009), doi:10.1016/j.earscirev.2009.03.004
ARTICLE IN PRESS<br />
42 N.D. Sheldon, N.J. Tabor / Earth-Science Reviews xxx (2009) xxx–xxx<br />
Fig. 23 depicts the predicted pH values for a wide range of fractional<br />
values between a hypothetical paleosol <strong>and</strong> its parent material.<br />
Larger fractionations of δ 11 B between a paleosol <strong>and</strong> its parent<br />
material correspond to more acidic pHs. It should be noted that at<br />
lower temperatures, more typical of soil formation, more acidic pH<br />
values would be predicted for the same magnitude fraction of δ 11 B.<br />
25 °C was used primarily because it represents st<strong>and</strong>ard temperature<br />
for thermodynamic data, but it is possible to solve for values appropriate<br />
for lower temperatures, so this does not represent an impediment<br />
to applying this method.<br />
One potentially exciting application of pH values calculated from<br />
δ 11 B values of pedogenic carbonates is to address the question of what<br />
a reasonable value for S(z) is in calculations of paleoatmospheric CO 2<br />
levels (see Section 7.4.3.1), because the pH at the time of formation<br />
of the pedogenic carbonate nodules should be related to soil gas<br />
composition. For the purposes of illustration, we will consider the<br />
simplest possible case (again at 25 °C) for the formation of pedogenic<br />
carbonate:<br />
CO 2ðgÞ þ H 2 O þ Ca 2þ ¼ 2H þ þ CaCO 3 LogK calcite ¼ −9:634 ð66Þ<br />
Assuming pure calcite <strong>and</strong> water (i.e., a=1), the equilibrium<br />
relationship may be defined as follows:<br />
h i<br />
H + 2<br />
h i<br />
H + 2<br />
=KZ = pCO<br />
½pCO 2 Š Ca 2+ K 3 Ca 2+<br />
2 ð67Þ<br />
Because there is a 1:1 relationship between the number of moles<br />
of Ca 2+ <strong>and</strong> CO 2 , the expression may be further simplified to the<br />
following:<br />
Sz ðÞ= pCO 2 =<br />
sffiffiffiffiffiffiffiffiffiffiffiffiffi<br />
½a H + Š 2<br />
K calcite<br />
ð68Þ<br />
Using pH values derived from Fig. 23 for (δ ΣB −δ BA − ) values<br />
ranging from 16 to 19 gives a range of pH from 8.05 to 7.04 (aH +<br />
8.86×10 − 9 to 8.94×10 −8 ). Applying those values to Eq. (68) gives a<br />
range of S(z) values of 581–5867 ppm, with the largest δ 11 B (<strong>and</strong><br />
lowest pH) values indicating the highest S(z) as would be expected.<br />
For most calculations of paleatmospheric CO 2 levels, the predicted S(z)<br />
using this method is similar to what is already being used, though<br />
somewhat lower, as only relatively acidic pH conditions would predict<br />
high S(z). Using lower S(z) values would predict lower atmospheric<br />
CO 2 values (Section 7.4.3.1), so this is potentially important as an<br />
additional check on those calculations.<br />
Thus, there is considerable scope for development of new paleoproxies<br />
for pH <strong>and</strong> potentially for S(z) using δ 11 B analyses obtained<br />
from pedogenic carbonates. The main difficulties lie with δ 11 B analysis<br />
Fig. 23. Boron isotope fractionation versus pH for 25 °C. At lower temperatures,<br />
fractionation factors are smaller when boric acid is converted to borate (Kakihana et al.,<br />
1977), which shifts the curve to the left.<br />
itself, potentially poorly constrained parent material compositions,<br />
<strong>and</strong> uncertainties about paleotemperature at the time that the carbonate<br />
formed. Nonetheless, we feel that this is an area of research with<br />
considerable scope for future growth.<br />
8.2. Energy balance models<br />
Another recent development is a model that relates energy input<br />
into the soil system during weathering to mean annual precipitation<br />
(MAP) <strong>and</strong> temperature (MAT). Rasmussen et al. (2005) defined a<br />
new term for the energy input into a soil during pedogenesis (E in );<br />
Rasmussen <strong>and</strong> Tabor (2007) refined the early framework, renaming<br />
E in as effective energy <strong>and</strong> mass transfer (EEMT) <strong>and</strong> put forward a<br />
quantitative pedogenic energy model (QPEM) that relates EEMT to<br />
various quantitative measures of pedogenic properties including<br />
pedon depth, clay content, CIA-K (Eq. (5)), <strong>and</strong> the ratio of free Feoxides<br />
to total Fe (Fe d /Fe T ). EEMT represents the total amount of solar<br />
energy that is available for pedogenesis <strong>and</strong> is represented by two<br />
quantities: 1) heat available to warm soil material <strong>and</strong> water <strong>and</strong><br />
2) reduction of C due to photosynthesis (Rasmussen <strong>and</strong> Tabor, 2007).<br />
Full derivation of the model may be found in Rasmussen et al. (2005)<br />
<strong>and</strong> Rasmusen <strong>and</strong> Tabor (2007); at least one of the relationships<br />
in the paper is potentially applicable to paleosols. Using empirical<br />
data collected for soils with igneous parent materials in the Sierra<br />
Nevadas, southern Cascades, <strong>and</strong> Sierra San Pedro Martir ranges,<br />
EEMT (kJ m −2 yr −1 ) may be related to MAT <strong>and</strong> MAP as follows:<br />
EEMT = 347; 134 exp − 0:5 MAT − 21:5<br />
ð − 10:5 Þ 2 +<br />
MAP − 4412<br />
ð 1704 Þ 2 ð69Þ<br />
Rasmussen <strong>and</strong> Tabor (2007) also found significant differences<br />
in EEMT among different soil orders (UltisolsNAlfisols≈AndisolsN<br />
MollisolsNInceptisolsNEntisols). In the form of Eq. (69), the relationship<br />
is somewhat cumbersome to apply, because while calculation of<br />
EEMT for a paleosol where MAT <strong>and</strong> MAP are known could be used to<br />
confirm a taxonomic designation, those <strong>paleoclimatic</strong> values (in particular<br />
MAT) are not that well-constrained typically. Alternatively,<br />
Rasmussen <strong>and</strong> Tabor's (2007) relationship may be re-arranged to<br />
solve for either MAT or MAP. As an example, here is the re-arranged<br />
expression for MAT:<br />
MAT = 21:5 +<br />
qffiffiffiffiffiffiffiffiffiffiffiffiffiffiffiffiffiffiffiffiffiffiffiffiffiffiffiffiffiffiffiffiffiffiffiffiffiffiffiffiffiffiffiffiffiffiffiffiffiffiffiffiffiffiffiffiffiffiffiffiffiffiffi<br />
<br />
½ − 2Ln EEMT MAP − 4412 2<br />
347;134<br />
+<br />
1704<br />
−10:1<br />
ð70Þ<br />
To give a concrete example, we will apply Eq. (70) to a series of<br />
Miocene Alfisol-like paleosols (Argillisols; Sheldon, 2006d) used elsewhere<br />
in this review. EEMT for Alfisols is 25,875±1781 kJ m −2 yr − 1<br />
(Rasmussen <strong>and</strong> Tabor, 2007) <strong>and</strong> the reconstructed MAP using<br />
Eq. (30) ranges from 540 to 854 mm/yr. Assuming a constant EEMT<br />
<strong>and</strong> using the MAP figures published by Sheldon (2006d),MATfigures<br />
ranging from ~12 to 20 °C are obtained (Fig. 24) <strong>and</strong> are plotted<br />
against previously obtained MAT estimates using Eq. (25). Obviously,<br />
the MAT estimates obtained using EEMT are very different than those<br />
obtained using Eq. (25), so which estimate is more reasonable?<br />
Both equations have upper limits to the temperatures that they can<br />
predict, (17.3 °C for Eq. (25) <strong>and</strong> 21.5 °C for Eq. (70)), so Eq. (70) is<br />
potentially viable over a larger range of paleotemperatures than<br />
Eq. (25). The paleosols all correspond to the middle Miocene climatic<br />
optimum, which lead Sheldon (2006d) to question the paleotemperature<br />
results in his original study that used Eq. (25), because while<br />
the MAP estimates that he obtained matched paleobotanical results,<br />
the MAT values were only semi-consistent with estimates based<br />
on paleobotanical proxies for MAT (i.e., the highest MAT values<br />
with the full SE). Thus, based on independent lines of evidence the<br />
values obtained using Eq. (70) are perhaps more in line with expected<br />
middle Miocene MAT.<br />
Please cite this article as: Sheldon, N.D., Tabor, N.J., <strong>Quantitative</strong> <strong>paleoenvironmental</strong> <strong>and</strong> <strong>paleoclimatic</strong> <strong>reconstruction</strong> using paleosols, Earth-<br />
Science Reviews (2009), doi:10.1016/j.earscirev.2009.03.004
ARTICLE IN PRESS<br />
N.D. Sheldon, N.J. Tabor / Earth-Science Reviews xxx (2009) xxx–xxx<br />
43<br />
Fig. 24. Comparison of MAT derived from EEMT <strong>and</strong> Salinization. A) MAT estimates based on Salinization (y-axis) <strong>and</strong> EEMT (x-axis) are generally negatively correlated. B) MAT<br />
estimates from Salinization (filled diamonds) <strong>and</strong> EEMT (open squares) as a function of time show considerable overlap when errors are included, but EEMT generally predicts<br />
warmer conditions than Salinization.<br />
However, the uncertainty on the MAT estimates using Eq. (70) are<br />
fairly large <strong>and</strong> non-linear owing to the form of Eq. (69). On average for<br />
these samples the error in MAT is +4 °C <strong>and</strong> − 4.7 °C (Fig. 24),<br />
comparable to the error on Eq. (25). Breaking it down further, the<br />
component of error due to uncertainty in EEMT is only 0.76 °C (±1σ),<br />
whereas the component of the error due to the uncertainty of the MAP<br />
estimate is 3.2–3.9 °C, thus a more precise estimate for MAP would<br />
increase the precision of Eq. (70) considerably. One additional<br />
consideration is that if a fixed EEMT is assumed, then MAT <strong>and</strong> MAP<br />
are inversely related. However, the MAP <strong>and</strong> MAT data compiled by<br />
Sheldon et al. (2002) for 126 modern soils had an R 2 =0.54, which<br />
though far from definitive, suggests at least some relationship between<br />
MAP <strong>and</strong> MAT, so the fixed EEMT assumption is not strictly correct. On<br />
the other h<strong>and</strong>, if one assumes that the MAT <strong>and</strong> MAP values reported<br />
by Sheldon (2006d) are correct, then applying Eq. (69) gives a mean<br />
EEMT values of 19,286 (±1σ of 4482) kJ m − 2 yr − 1 , which is<br />
substantially lower than the mean Alfisol EEMT value obtained by<br />
Rasmussen <strong>and</strong> Tabor (2007), but not beyond the range of error. The<br />
most likely explanation for this difference is that paleosols are all<br />
basalt-parented, whereas the equation was derived from soils with<br />
various igneous parent materials, though a secondary consideration<br />
may be the elevation variations among the soils analyzed by<br />
Rasmussen <strong>and</strong> Tabor (2007) whereas the Miocene paleosols all<br />
formed in the same relatively low elevation setting.<br />
Thus, the QPEM model offers a lot of promise for applications<br />
ranging from taxonomy to <strong>paleoclimatic</strong> <strong>reconstruction</strong>. However,<br />
care is needed in applying it thoughtfully to paleosols given different<br />
potential sources of uncertainty. Further development may also be<br />
needed for other types of parent materials, but we think that in the<br />
long-run, these potential issues will be possible to deal with <strong>and</strong> that a<br />
QPEM that integrates both MAP <strong>and</strong> MAT (which are not really<br />
independent of one another) will be a powerful tool for paleosols<br />
research.<br />
8.3. “Clumped isotope” paleothermometry<br />
A recent innovation in stable isotope geochemistry that is relevant<br />
for the study of paleosols is the analysis of doubly rather than<br />
singly substituted isotopologues (Eiler, 2007). The term isotopologue<br />
refers to each possible isotopic configuration for a given compound.<br />
For example, conventional gas-source δ 13 C analyses are measuring<br />
13 C 16 O 2 (z=45), which is one of 12 possible isotopologues for CO 2 .<br />
Traditional mass-spectrometer configuration allows for measurements<br />
of z=44, 45, or 46. Addition of a extra faraday cup makes the<br />
measurement of masses 47–49 possible, which in turn makes it<br />
possible to measure more isotopologues than were previously<br />
available. The abundance of the doubly substituted CO 2 isotopologue<br />
( 13 C 18 O 16 O) produced by phosphoric acid digestion of carbonate<br />
minerals is proportional to the concentration of 13 C\ 18 O bonds in the<br />
reacted carbonate; that concentration is a function of the formation<br />
temperature of the carbonate minerals (Ghosh et al., 2006a,b; Eiler,<br />
2007) <strong>and</strong> can be used as a paleothermometer (Ghosh et al., 2006a,b).<br />
13 C 18 O 16 O abundance in the evolved CO 2 is measured in “per mil”<br />
relative to the expected amount of all CO 2 isotopologues in a<br />
r<strong>and</strong>omized gas sample. The proportionality of the 13 C\ 18 O bonds is<br />
described as follows:<br />
Δ 47 = 0:0592 × 10 6 × T − 2 − 0:02 ð71Þ<br />
where Δ 47 isotopic enrichment relative to the r<strong>and</strong>omized gas sample<br />
<strong>and</strong> T is the temperature (K), <strong>and</strong> where the precision due to the<br />
analytical uncertainty is ~2 °C (Ghosh et al., 2006a,b). Unlike<br />
traditional oxygen isotope-based water-carbonate paleothermometers,<br />
there is no dependence in this relationship on either the<br />
δ 18 O of the water nor on the δ 13 C of the dissolved inorganic carbon<br />
from which the carbonate formed (Ghosh et al., 2006a,b), therefore<br />
obviating the need for any unconstrained assumptions of either air or<br />
soil water isotopic compositions. This method has been applied successfully<br />
to pedogenic carbonates (Ghosh et al., 2006b) as a means of<br />
calculating uplift rates in the Altiplano by putting the values derived<br />
from Eq. (8) into a lapse-rate model. A thorough review of the<br />
potential applications of “clumped-isotope” paleothermometry to<br />
paleoaltimetry may be found in Quade et al. (2007).<br />
Paleoaltimetry is just the tip of the proverbial iceberg in terms of<br />
the potential <strong>paleoclimatic</strong> <strong>and</strong> <strong>paleoenvironmental</strong> applications of<br />
this technique (e.g., Eiler, 2007) because there is no dependence on<br />
the initial δ 18 Oorδ 13 C values of the system (which hampers many<br />
existing proxies), only on the temperature at which the doubly<br />
substituted 13 C 18 O 16 O isotopologue was formed. However, to reach the<br />
full potential of the technique, there is at least one outst<strong>and</strong>ing issue<br />
that needs to be considered, namely the relationship between the soil<br />
temperature <strong>and</strong> the air temperature. It is not clear that these two<br />
values are necessarily the same because the soil temperature can<br />
easily exceed the air temperature in areas either with very warm<br />
temperatures (or warm seasons of the year) or where the albedo of<br />
the ground surface is low. To illustrate this, consider the difference<br />
between digging up your garden early in the spring or at the height of<br />
summer. In early spring (e.g., April in the Northern Hemisphere), the<br />
soil temperature essentially matches the air temperature, whereas in<br />
summer (e.g., August in the Northern Hemisphere) the soil temperature<br />
may be many degrees warmer than air above it. Given that<br />
pedogenic carbonates form only during certain warm times of the year<br />
(Breecker et al., 2009), un-corrected isotopologue paleotemperatures<br />
are potentially biased towards recording summer temperatures<br />
rather than mean annual temperatures. Nonetheless, the problem is<br />
likely tractable with further consideration of the timing of pedogenic<br />
carbonate formation <strong>and</strong> of the relationship between soil <strong>and</strong> air<br />
temperatures.<br />
Please cite this article as: Sheldon, N.D., Tabor, N.J., <strong>Quantitative</strong> <strong>paleoenvironmental</strong> <strong>and</strong> <strong>paleoclimatic</strong> <strong>reconstruction</strong> using paleosols, Earth-<br />
Science Reviews (2009), doi:10.1016/j.earscirev.2009.03.004
ARTICLE IN PRESS<br />
44 N.D. Sheldon, N.J. Tabor / Earth-Science Reviews xxx (2009) xxx–xxx<br />
9. Summary<br />
Paleopedology is still a relatively immature field, with many<br />
fundamental discoveries about processes <strong>and</strong> proxies left to be made.<br />
The shift in recent years from a largely qualitative type of analysis to a<br />
largely quantitative one has important implications both for the field<br />
itself, but also more broadly, for the <strong>reconstruction</strong> of past environmental<br />
<strong>and</strong> climatic conditions. Given that one of our best means of<br />
projecting how ongoing anthropogenic greenhouse gas additions will<br />
affect future climate is to look at how the Earth's climate has reacted<br />
during previous high CO 2 times, these new tools <strong>and</strong> proxies for<br />
making quantitative <strong>reconstruction</strong>s are an important new means of<br />
addressing those effects. More specifically, though many marine<br />
proxies give broad “global” climatic information, they are indirect<br />
proxies because they are typically recording changes to a much more<br />
slowly reacting entity (i.e., ocean temperature <strong>and</strong> composition) <strong>and</strong><br />
in the case of records derived from benthic foraminifera, one divorced<br />
from direct contact with the Earth's climate <strong>and</strong> atmosphere. Underst<strong>and</strong>ing<br />
how the Earth's surficial environments have changed is<br />
ultimately equally if not more important in projecting the impacts of<br />
anthropogenically-driven climate change on our lives. Paleopedology<br />
promises to be increasingly important in this endeavor. However, we<br />
would like to reiterate that, ideally, none of these proxies should st<strong>and</strong><br />
alone as indications of paleoclimate <strong>and</strong> that our inferences about<br />
paleoclimate are only strengthened by applying multiple proxies to<br />
many paleosol profiles. Ultimately, all of these geochemical proxies<br />
should agree with other observations of the geological record <strong>and</strong> if<br />
they do not, it is the proxies that should be considered suspect.<br />
Paleoclimatic <strong>and</strong> environmental properties that may be reconstructed<br />
using the new geochemical proxies include protolith provenance,<br />
weathering intensity, mean annual precipitation <strong>and</strong><br />
temperature during pedogenesis, nutrient fluxes into <strong>and</strong> out of the<br />
paleosols, the atmospheric composition of important gases including<br />
CO 2 <strong>and</strong> O 2 , paleosol soil gas composition <strong>and</strong> mixing relationships,<br />
soil moisture, crystallization temperature of pedogenic minerals,<br />
reconstructed vegetative covering, <strong>and</strong> paleo-altitude. Future work<br />
promises yield to other proxies for pedogenic processes, including<br />
perhaps paleo-pH <strong>and</strong> paleo-energy usage. A firm underst<strong>and</strong>ing of<br />
pedogenic processes <strong>and</strong> the limits of the proxies need to form the<br />
basis for applications of paleosol geochemistry, because, with all of the<br />
proxies, our applications are only as good as our underst<strong>and</strong>ing of the<br />
whole system.<br />
Acknowledgements<br />
NDS would like to acknowledge the previous support for this work<br />
from GSA, NSF, <strong>and</strong> NERC, <strong>and</strong> his very underst<strong>and</strong>ing fiancé Selena.<br />
NJT is supported by NSF-EAR 0617250, NSF-EAR 0545654, <strong>and</strong> NSF-<br />
EAR 0447381. This manuscript benefited from the thoughtful reviews<br />
by Greg Retallack <strong>and</strong> Carmala Garzione. In addition, the authors<br />
would like to acknowledge numerous colleagues who, through<br />
various interactions, have had an immense influence on this work:<br />
Isabel Montañez, Crayton Yapp, Doug Ekart, Greg Retallack, Jonathan<br />
Wynn, Steve Driese, <strong>and</strong> Lee Nordt.<br />
Appendix A. Supplementary data<br />
Supplementary data associated with this article can be found, in<br />
the online version, at doi:10.1016/j.earscirev.2009.03.004.<br />
References<br />
Achyuthan, H., 2003. Petrologic analysis <strong>and</strong> geochemistry of the late Neogene–early<br />
Quaternary hardpan calcretes of western Rajasthan, India. Quaternary International<br />
106/107, 3–10.<br />
Alonso-Zarza, A.M., Tanner, L.H., 2006. Paleoenvironmental Record <strong>and</strong> Applications of<br />
Calcretes <strong>and</strong> Palustrine Carbonates. Geological Society of America Special Paper,<br />
vol. 416. 239 pp.<br />
Anderson, J.M., 1973. Carbon dioxide evolution from two temperate, deciduous<br />
woodl<strong>and</strong> soil. Journal of Applied Ecology 10, 361–378.<br />
Andrews, J.E., T<strong>and</strong>on, S.K., Dennis, P.F., 1995. Concentration of carbon-dioxide in the<br />
Late Cretaceous atmosphere. Journal of the Geological Society 152, 1–3.<br />
Arens, N.C., Jahren, A.H., Amundson, R., 2000. Can C3 plants faithfully record the carbon<br />
isotopic composition of atmospheric carbon dioxide? Paleobiology 26, 134–164.<br />
Arkley, R.J., 1963. Calculation of carbonate <strong>and</strong> water movement in soil from climate<br />
data. Soil Science 96, 239–248.<br />
Aslan, A., Autin, W.J., 1998. Holocene floodplain soil formation in the southern lower<br />
Mississippi Valley: implications for interpreting alluvial paleosols. Geological<br />
Society of America Bulletin 110, 433–449.<br />
Atchley, S.C., Nordt, L.C., Dworkin, S.I., 2004. Eustatic control on alluvial sequence<br />
stratigraphy: a possible example from the K/T transition of the Tornillo Basin, Big<br />
Bend National Park, west Texas. Journal of Sedimentary Research 74, 391–404.<br />
Bahrig, B., 1989. Stable isotope composition of siderite as an indicatory of the<br />
palaeoenvironmental history of oil shale lakes. Palaeogeography Palaeoclimatology<br />
Palaeoecology 70, 139–151.<br />
Baker, J.C., Kassan, J., Hamilton, P.J., 1996. Early diagenetic siderite as an indicator of<br />
depositional environment in the Triassic Rewan Group, southern Syndey basin,<br />
eastern Australia. Sedimentology 43, 77–88.<br />
Bao, H.M., Koch, P.L., 1999. Oxygen isotope fraction in ferric oxide-water systems: low<br />
temperature synthesis.<br />
Bárdossy, G., White, J.L., 1979. Carbonate inhibits the crystallization of aluminum<br />
hydroxide in Bauxite. Science 203, 355–356.<br />
Bárdossy, G., Jonas, K., Imre, A., Solymar, K., 1977. Interrelations of bauxite texture,<br />
micromorphology, mineral individualism, <strong>and</strong> heteromorphism. Economic Geology<br />
72, 573–581.<br />
Barron, E.J., 1989. Studies of Cretaceous climate. In: Berger, A., Dickinson, R.E., Kidson, J.<br />
W. (Eds.), Underst<strong>and</strong>ing climate change. American Geophysical Union Geophysical<br />
Monograph, vol. 52, pp. 149–157.<br />
Barron, E.J., Hay, W.W., Thompson, S.L., 1989. The hydrologic cycle: a major variable<br />
during Earth history. Global Planetary Change 1, 157–174.<br />
Bartlett, M.G., Chapman, D.S., Harris, R.N., 2006. A decade of ground-air temperature<br />
tracking at Emigrant Pass Observatory, Utah. Journal of Climate 19, 3722–3731.<br />
Beauvais, A., Tardy, Y., 1991. Formation et degradation des cuirasses ferrugineuses sous<br />
climat tropical humide, a la lisiere de la foret equatoriale. Comptes Rendus Serie 2,<br />
313, 1539–1545.<br />
Behrensmeyer, A.K., Quade, J., Cerling, T.E., Kappelman, J., Khan, I.A., Copel<strong>and</strong>, P., Roe, L.,<br />
Hicks, J., Stubblefield, P., Willis, B.J., Latorre, C., 2007. The structure <strong>and</strong> rate of late<br />
Miocene expansion of C4 plants; evidence from laterial variation in stable isotopes<br />
in paleosols of the Siwalik Group, northern Pakistan. Geological Society of America<br />
Bulletin 119, 1486–1505.<br />
Bekker, A., Holl<strong>and</strong>, H.D., Wang, P.L., Rumble, D., Stein, H.J., Hannah, J.L., Coetzee, L.L.,<br />
Beukes, N.J., 2004. Dating the rise of atmospheric oxygen. Nature 427, 117–120.<br />
Berner, R.A., 1991. A model for atmospheric CO 2 over Phanerozoic time. American<br />
Journal of Science 291, 339–376.<br />
Berner, R.A., 2002. Examination of hypotheses for the Permo-Triassic boundary<br />
extinction by carbon cycle modeling. Proceedings of the National Academy of<br />
Science 99, 4172–4177.<br />
Berner, R.A., 2004. The Phanerozoic Carbon Cycle. Oxford University Press, New York.<br />
150 pp.<br />
Berner, R.A., 2005. GEOCARBSULF: a combined model for phanerozoic atmospheric O 2 .<br />
Geochimica et Cosmochimica Acta 70, 5653–5664.<br />
Berner, R.A., Kothavala, X., 2001. GEOCARBIII: a revised model of atmospheric CO 2 over<br />
Phanerozoic time. American Journal of Science 301, 182–204.<br />
Bestl<strong>and</strong>, E.A., 2000. Weathering flux <strong>and</strong> CO 2 consumption determined from palaeosol<br />
sequences across the Eocene–Oligocene transition. Palaeogeography, Palaeoclimatology,<br />
Palaeoecology 156, 301–326.<br />
Bestl<strong>and</strong>, E.A., 2002. Fossil Andisols identified with mass-balance geochemistry<br />
(Oligocene John Day Formation, Oregon, U.S.A.). Journal of Sedimentary Research<br />
72, 673–686.<br />
Bethke, P.M., Rye, R.O., Finkelstein, D.B., 2000. Isotopic studies of authigenic sulfides,<br />
silicates, <strong>and</strong> carbonates, <strong>and</strong> calcite <strong>and</strong> pyrite veinlets in the Creede Formation,<br />
San Juan Mountains, Southwest Colorado. In: Bethke, P.M., Hay, R.L. (Eds.), Ancient<br />
Lake Creede; Its Volcano-Tectonic Setting, History of Sedimentation, <strong>and</strong> Relation to<br />
Mineralization in the Creede Mining District. Geological Society of America Special<br />
Paper, vol. 346, pp. 267–286.<br />
Bird, M.I., Chivas, A.R., 1988a. Oxygen-isotope dating of the Australian regolith. Nature<br />
331, 513–516.<br />
Bird, M.I., Chivas, A.R., 1988b. Stable isotope evidence for low-temperature weathering<br />
<strong>and</strong> post-formation hydrogen-isotope exchange in Permian kaolinites. Chemical<br />
Geology (Isotope Geoscience Section) 72, 249–265.<br />
Bird, M.I., Chivas, A.R., 1989. Stable isotope geochronology of the Australian regolith.<br />
Geochimica et Cosmochimica Acta 53, 3239–3256.<br />
Bird, M.I., Chivas, A.R., 1993. Geomorphic <strong>and</strong> palaeoclimatic implications of an oxygenisotope<br />
geochronology for Australian deeply weathered profiles. Australian Journal<br />
of Earth Sciences 40, 345–358.<br />
Bird, M.I., Longstaffe, F.J., Fyfe, W.S., Bildgen, P., 1992. Oxygen-isotope systematics in a<br />
multiphase weathering system in Haiti. Geochimica et Cosmochimica Acta 56,<br />
2831–2838.<br />
Bird, M.I., Longstaffe, F.J., Fyfe, W.S., Tazaki, K., Chivas, A.R., 1994a. Oxygen-isotope<br />
fractionation in gibbsite – synthesis experiments versus natural samples.<br />
Geochimica et Cosmochimica Acta 58, 5267–5277.<br />
Please cite this article as: Sheldon, N.D., Tabor, N.J., <strong>Quantitative</strong> <strong>paleoenvironmental</strong> <strong>and</strong> <strong>paleoclimatic</strong> <strong>reconstruction</strong> using paleosols, Earth-<br />
Science Reviews (2009), doi:10.1016/j.earscirev.2009.03.004
ARTICLE IN PRESS<br />
N.D. Sheldon, N.J. Tabor / Earth-Science Reviews xxx (2009) xxx–xxx<br />
45<br />
Bird, M.I., Quade, J., Chivas, A.R., Fifield, L.K., Allan, G.L., Head, M.J., 1994b. The carbonisotope<br />
composition of organic-matter occuled in iron nodules. Chemical Geology<br />
114, 269–279.<br />
Birkel<strong>and</strong>, P.W., 1999. Soils <strong>and</strong> Geomorphology, (3rd Ed.). Oxford University Press, New<br />
York. 448 pp.<br />
Bockheim, J.G., Gennadiyev, A.N., 2000. The role of soil-forming processes in the<br />
definition of taxa in Soil Taxonomy <strong>and</strong> the World Soil Reference base. Geoderma<br />
95, 53–72.<br />
Borchardt, G., 1989. Smectites. In: Dixon, J.B., Weed, S.B. (Eds.), Soil Science Society of<br />
America, pp. 675–727. Madison, Wisconsin U.S.A.<br />
Bottinga, Y., 1968. Calculation of fractionation factors for carbon <strong>and</strong> oxygen in the system<br />
calcite–carbon dioxide–water. Journal of Physical Chemistry 72, 800–808.<br />
Botz, R.W., Hunt, J.W., Smith, J.W., 1986. Isotope geochemistry of minerals in Australian<br />
bituminous coal. Journal of Sedimentary Petrology 56, 99–111.<br />
Boulvais, P., Vallet, J.M., Esteoule-Choux, J., Fourcade, S., Martineau, F., 2000. Origin of<br />
kaolinization in Brittany (NW France) with emphasis on deposits over granite;<br />
stable isotopes (O, H) constraints. Chemical Geology 168, 211–223.<br />
Bourange, B., Paquet, H., Bocquier, G., 1975. The role of clay in the migration <strong>and</strong><br />
accumulation of the alumina of certain tropical bauxites. Comptes Rendus, Serie D,<br />
280, 2783–2786.<br />
Bowen, G.J., Beerling, D.J., 2004. An integrated model for soil organic carbon <strong>and</strong> CO 2 :<br />
implications for paleosol carbonate pCO 2 paleobarometry. Global Biogeochemical<br />
Cycles 18, GB1026.<br />
Bowen, G.J., Koch, P.K., Gingerich, P.D., Norris, R.D., Bains, S., Corfield, R.M., 2001. Refined<br />
isotope stratigraphy across the continental Paleocene-Eocene boundary on Polecat<br />
Bench in the Northern Bighorn Basin. In: Gingerich, P.D. (Ed.), Paleocene-Eocene<br />
Stratigraphy <strong>and</strong> Biotic Change in the Bighorn <strong>and</strong> Clarks Fork Basins, Wyoming.<br />
University of Michigan Papers on Paleontology, vol. 33, pp. 73–88.<br />
Bowen, G.J., Koch, P.L., Meng, J., Ye, J., Ting, S., 2005. Stratigraphy <strong>and</strong> correlation of<br />
fossiliferous late Paleocene-early Eocene strata of the Erlian Basin, Inner Mongolia,<br />
China. American Museum Novitates 3474, 1–26.<br />
Bown, T.A., Kraus, M., 1987. Integration of channel <strong>and</strong> floodplain suites: I. Developmental<br />
sequence <strong>and</strong> lateral relations of alluvial paleosols. Journal of Sedimentary<br />
Petrology 57, 587–601.<br />
Boynton, D., Compton, O.C., 1944. Normal seasonal changes of oxygen <strong>and</strong> carbon<br />
dioxide percentages in gas from the larger pores of three orchard subsoils. Soil<br />
Science 57, 107–117.<br />
Boynton, D., Reuther, W., 1938. A way of sampling gases in dense subsoils <strong>and</strong> some of<br />
its advantages <strong>and</strong> limitations. Proceedings of the Soil Science Society of America 3,<br />
37–42.<br />
Braun, J.J., Viers, J., Dupre, B., Polve, M., Ndam, J., Muller, J.P., 1998. Solid/liquid REE<br />
fractionation in the lateritic system of Goyoum, East Cameroon: the implication for<br />
the present dynamics of the soil covers of the humid tropical regions. Geochimica et<br />
Cosmochimica Acta 62, 273–299.<br />
Breecker, D.O., Sharp, Z.D., McFadden, L.D., 2009. Seasonal bias in the formation <strong>and</strong><br />
stable isotopic composition of pedogenic carbonate in modern soils from central<br />
New Mexico, USA. Geological Society of America Bulletin 121, 630–640.<br />
Brewer, R., 1976. Fabric <strong>and</strong> Mineral Analysis of Soils. Krieger, New York.<br />
Brewer, R.C., 1964. Fabric <strong>and</strong> Mineral Analysis of Soils. Wiley, New York.<br />
Brimhall, G.H., Dietrich, W.E., 1987. Constitutive mass balance relations between<br />
chemical composition, volume, density, porosity, <strong>and</strong> strain in metasomatic<br />
hydrochemical systems: results on weathering <strong>and</strong> pedogenesis. Geochimica et<br />
Cosmochimica Acta 51, 567–587.<br />
Brook, G.A., Folkoff, M.E., Box, E.O., 1983. A world model of soil carbon dioxide. Earth<br />
Surface Processes <strong>and</strong> L<strong>and</strong>forms 8, 79–88.<br />
Brown, G.H., Kingston, D.M., 1993. Early Diagenetic spherulitic siderites from<br />
Pennsylvanian palaeosols in the Boss Point Formation, Maritime Canada.<br />
Sedimentology 40, 467–474.<br />
Buck, B.J., Mack, G.H., 1995. Latest Cretaceous (Maastrichtian) aridity indicated by<br />
paleosols in the McRae Formation, south-central New Mexico. Cretaceous Research<br />
16, 559–572.<br />
Buck, B.J., Wolff, K., Merkler, D., McMillan, N., 2006. Salt mineralogy of Las Vegas Wash,<br />
Nevada: morphology <strong>and</strong> subsurface evaporation. Soil Science Society of America<br />
Journal 70, 1639–1651.<br />
Buol, S.W., Southard, R.J., Graham, R.C., McDaniel, P.A., 2003. Soil Genesis <strong>and</strong><br />
Classification. Iowa State Press, Ames, Iowa, USA.<br />
Calvert, C.S., 1984. Simpilified, complete CsCl-hydrazin-dimethylsulfoxide intercalation<br />
of kaolinte. Clays <strong>and</strong> Clay Minerals 323, 125–130.<br />
Came, R.E., Eiler, J.M., Veizer, J., Azmy, K., Br<strong>and</strong>, U., Weidman, C.R., 2007. Coupling of<br />
surface temperatures <strong>and</strong> atmospheric CO 2 concentrations during the Palaeozoic<br />
era. Nature 449, 198–202.<br />
Capo, R.C., Whipkey, C.E., Blachere, J.R., Chadwick, O.A., 2000. Pedogenic origin of dolomite<br />
in a basaltic weathering profile, Kohala peninsula, Hawaii. Geology 28, 271–274.<br />
Capuano, R.M., 1992. The temperature-dependence of hydrogen isotope fractionation<br />
between clay-minerals <strong>and</strong> water-evidence from a geopressured system. Geochimica<br />
et Cosmochimica Acta 56, 2547–2554.<br />
Carothers, W.C., Adami, L.H., Roenbauer, R.J., 1988. Experimental oxygen isotope<br />
fractioantion between siderite-water <strong>and</strong> phosphoric acid liberated CO 2 -Siderite.<br />
Geochimica et Cosmochimica Acta 52, 2445–2450.<br />
Caudill, M.R., Driese, S.G., Mora, C.I., 1997. Physical compaction of vertic paleosols:<br />
implications for burial diagenesis <strong>and</strong> palaeo-precipitation estimates. Sedimentology<br />
44, 673–685.<br />
Cerling, T.E., 1984. The stable isotopic composition of modern soil carbonate <strong>and</strong> its<br />
relationship to climate. Earth <strong>and</strong> Planetary Science Letters 71, 229–240.<br />
Cerling, T.E., 1991. Carbon dioxide in the atmosphere: evidence from Cenozoic <strong>and</strong><br />
Mesozoic paleosols. American Journal of Science 291, 377–400.<br />
Cerling, T.E., 1992. Development of grassl<strong>and</strong>s <strong>and</strong> savannas in East Africa during the<br />
Neogene. Palaeogeography, Palaeoclimatology, Palaeoecology 97, 241–247.<br />
Cerling, T.E., 1999. Stable carbon isotopes in paleosol carbonates. In: Thirty, M., Coincon,<br />
R. (Eds.), Palaeoweathering, Palaeosurfaces, <strong>and</strong> Related Continental Deposits.<br />
International Association of Sedimentologist Special Publication, vol. 27, pp. 43–60.<br />
Oxford.<br />
Cerling, T.E., Harris, J.M., 1999. Carbon isotope fractionation between diet <strong>and</strong> bioapatite<br />
in ungulate mammals <strong>and</strong> implications for ecological <strong>and</strong> paleoecological studies.<br />
Oecologia 120, 347–363.<br />
Cerling, T.E., Quade, J., 1993. Stable carbon <strong>and</strong> oxygen isotopes in soil carbonates. In:<br />
McKenzie, J.A., Savin, S. (Eds.), Climate Change in Continental Isotopic Records.<br />
Geophysics Monograph, vol. 78. American Geophysical Union, Washington (DC),<br />
pp. 217–231.<br />
Cerling, T.E., Solomon, D.K., Quade, J., Bowman, J.R., 1991. On the isotopic composition of<br />
carbon in soil carbon dioxide. Geochimica et Cosmochimica Acta 55, 3403–3405.<br />
Cerling, T.E., Wang, Y., Quade, J., 1993. Expansion of C4 ecosystems as an indicator of<br />
global ecological change in the late Miocene. Nature 361, 344–345.<br />
Cerling, T.E., Harris, J.M., MacFadden, B.J., Leakey, M.G., Quade, J., Eisenmann, J.,<br />
Ehleringer, J.R., 1997. Global vegetation change through the Miocene <strong>and</strong> Pliocene.<br />
Nature 389, 153–158.<br />
Chacko, T., Cole, D.R., Horita, J., 2001. Equilibrium oxygen, hydrogen <strong>and</strong> carbon isotope<br />
fractionation factors applicable to geologic systems. Reviews in Mineralogy <strong>and</strong><br />
Geochemistry 43, 1–81.<br />
Chadwick, O.A., Brimhall, G.H., Hendricks, D.M., 1990. From a black to a gray box — a<br />
mass balance interpretation of pedogenesis. Geomorphology 3, 369–390.<br />
Chadwick, O.A., Derry, L.A., Vitousek, P.M., Huebert, B.J., Hedin, L.O., 1999. Changing<br />
sources of nutrients during four million years of ecosystem development. Nature<br />
397, 491–497.<br />
Chamberlain, C.P., Poage, M.A., 2000. Reconstructing the paleotopography of mountain<br />
belts from the isotopic composition of authigenic minerals. Geology 28, 115–118.<br />
Chivas, A.R., Bird, M.I., 1995. Palaeoclimate from Gondwanal<strong>and</strong> clays. In: Churchman, G.<br />
J., Fitzpatrick, R.W., Eggleton, R.A. (Eds.), Clays controlling the Environment:<br />
Proceedings of the 10th International Clay Conference, pp. 333–338.<br />
Clark, I., Fritz, 1997. Environmental Isotopes in Hydrogeology. Lewis Publishers, New<br />
York. 328 pp.<br />
Clayton, R.N., Epstein, S., 1961. The use of oxygen isotopes in high temperature<br />
geological thermometry. Journal of Geology 69, 447–452.<br />
Clechenko, E.R., Kelly, D.C., Harrington, G.J., Stiles, C.A., 2007. Terrestrial records of a<br />
regional weathering profile at the Paleocene–Eocene boundary in the Williston<br />
Basin of North Dakota. Geological Society of America Bulletin 119, 428–442.<br />
Clevel<strong>and</strong>, D.M., Atchley, S.C., Nordt, L.C., 2007. Continental sequence stratigraphy of the<br />
Upper Triassic (Norian–Rhaetian) Chinle strata, northern New Mexico, USA:<br />
Allocyclic <strong>and</strong> autocyclic origins of paleosol-bearing alluvial successions. Journal<br />
of Sedimentary Research 77, 909–924.<br />
Clyde, W.C., Sheldon, N.D., Koch, P.L., Gunnell, G.F., Bartels, W.S., 2001. Linking the<br />
Wasatchian/Bridgerian boundary to the Cenozoic Global Climate Optimum: new<br />
magnetostratigraphic <strong>and</strong> isotopic results from South Pass, Wyoming. Palaeogeography,<br />
Palaeoclimatology, Palaeoecology 167, 175–199.<br />
Colman, S.M., 1982. Chemical weathering of basalts <strong>and</strong> <strong>and</strong>esites:evidence from the<br />
weathering rinds. United States Geological Survey Paper, vol. 1246. Washington.<br />
Condie, K.C., Dengate, J., Cullers, R.L., 1995. Behavior of rare earth elements in a<br />
paleoweathering profile on granodiorite in the Front Range, Colorado, USA.<br />
Geochimica et Cosmochimica Acta 59, 279–294.<br />
Coney, L., Reimold, W.U., Hancox, P.J., Mader, D., Koeberl, C., McDonald, I., Struck, U.,<br />
Vajda, V., Kamo, S.L., 2007. Geochemical <strong>and</strong> mineralogical investigation of the<br />
Permian–Triassic boundary in the continental realm of the southern Karoo basin,<br />
South Africa. Palaeoworld 16, 67–104.<br />
Craig, H., 1961. Isotopic variations in meteoric waters. Science 133, 1702–1708.<br />
Cravero, M.F., Dominguez, E.A., 1992. Kaolin deposits in the Lower Cretaceous Baquero<br />
Formation (Santa Cruz Province, Patagonia, Argentina). Journal of South American<br />
Earth Sciences 6, 223–235.<br />
Cravero, M.F., Dominguez, E., Murray, H.H., 1991. Valores δO 18 y δD en Caolinitas,<br />
indicadores de un clima templado moderado durante el Jurasico Superior-Certacico<br />
Inferior de la Patagonia, Argentina. Rev. Assoc. Geol. Argent. (RAGA) XLVI, 1–2, pp.<br />
20–25.<br />
Cravero, F., Dominguez, E., Iglesias, C., 2001. Genesis <strong>and</strong> applications of the Cerro Bubio<br />
kaolin deposit, Patagonia (Argentina). Applied Clay Science 18, 157–172.<br />
Criss, R.E., 1999. Principles of Stable Isotope Distribution. Oxford University Press, New<br />
York. 264 pp.<br />
Currie, B.S., Rowley, D.B., Tabor, N.J., 2005. Middle Miocene paleoaltimetry of southern<br />
Tibet: implications for the role of mantle thickening <strong>and</strong> delamination in the<br />
Himalayan orogen. Geology 33, 181–184.<br />
Dansgaard, W., 1964. Stable isotopes in precipitation. Tellus 16, 436–468.<br />
Darmody, R.G., Thorn, C.E., Allen, C.E., 2005. Chemical weather <strong>and</strong> boulder mantles,<br />
Kärkevagge, Swedish Lapl<strong>and</strong>. Geomorphology 67, 159–170.<br />
Datta, S., Thibault, Y., Fyfe, W.S., Powerll, M.A., Hart, B.R., Martin, R.R., Tripthy, S., 2002.<br />
Occurrence of trona in alkaline soils of the Indo-Gangetic Plains of Uttar Pradesh<br />
(UP), India. Episods 25, 236–239.<br />
de Jong, E., Schappert, H.J.V., 1972. Calculation of soil respiration <strong>and</strong> activity from CO 2<br />
profiles in the soil. Soil Science 113, 28–33.<br />
DeCelles, P.G., Quade, J., Kapp, P., Fan, M., Dettman, D.L., Ding, L., 2007. High <strong>and</strong> dry in<br />
central Tibet during the Oligocene. Earth <strong>and</strong> Planetary Science Letters 253,<br />
389–401.<br />
Decher, A., Bechtel, A., Echle, W., Friedrich, G., Hoernes, S., 1996. Stable isotope<br />
geochemistry of bentonites from the isl<strong>and</strong> of Milos (Greece). Chemical Geology<br />
129, 101–113.<br />
Please cite this article as: Sheldon, N.D., Tabor, N.J., <strong>Quantitative</strong> <strong>paleoenvironmental</strong> <strong>and</strong> <strong>paleoclimatic</strong> <strong>reconstruction</strong> using paleosols, Earth-<br />
Science Reviews (2009), doi:10.1016/j.earscirev.2009.03.004
ARTICLE IN PRESS<br />
46 N.D. Sheldon, N.J. Tabor / Earth-Science Reviews xxx (2009) xxx–xxx<br />
Delgado, A., Reyes, E., 1996. Oxygen <strong>and</strong> hydrogen isotope compositions in clay<br />
minerals: a potential single-mineral geothermometer. Geochimica et Cosmochimica<br />
Acta 60, 4285–4289.<br />
Deutz, P., Montanez, I.P., Monger, H.C., Morrison, J., 2001. Morphology <strong>and</strong> isotope<br />
heterogeneity of late Quaternary pedogenic carbonates; implications for paleosols<br />
carbonates as Paleoenvironmental proxies. Palaeogeography Palaeoclimatology<br />
Palaeoecology 166, 293–317.<br />
Deutz, P., Montanez, I.P., Monger, H.C., 2002. Morphology <strong>and</strong> stable <strong>and</strong> radiogenic<br />
isotope composition of pedogenic carbonates in late Quaternary relict soils, New<br />
Mexico, U.S.A.; an integrated record of pedogenic overprinting. Journal of<br />
Sedimentary Research 72, 809–822.<br />
Dever, L., Dur<strong>and</strong>, R., Fontes, J.Ch., 1988. The isotopic <strong>and</strong> chemical composition of<br />
secondary calcite in saturated zone as palaeoclimatic indicators. Chemical Geology<br />
70, 114–121.<br />
Dixon, J.B., 1989. Kaolin <strong>and</strong> serpentine group minerals, In: Dixon, J.B., Weed, S.B. (Eds.),<br />
Minerals in Soil Environments, 2nd Ed. Soil Science Society of America Book Series,<br />
vol. 1, pp. 467–526.<br />
Dixon, J.B., Weed, S.B., 1989. Minerals in soil environments. Soil Science Society of<br />
America. Madison, Wisconsin, U.S.A.<br />
Dorf, E., 1964. The use of fossil plants in <strong>paleoclimatic</strong> interpretations. In: Nairn, A.E.M.<br />
(Ed.), Problems in palaeoclimatology. Interscience Publishers, pp. 13–31.<br />
Driese, S.J., 2004. Pedogenic translocation of Fe in modern <strong>and</strong> ancient Vertisols <strong>and</strong><br />
implications for interpretations of the Hekpoort paleosol (2.25 Ga). Journal of<br />
Geology 112, 543–560.<br />
Driese, S.G., Ober, E.G., 2005. Paleopedologic <strong>and</strong> paleohydrologic records Precipitation<br />
Seasonality from Early Pennsylvanian “Underclay” paleosols, U.S.A. Journal of<br />
Sedimentary Research 75, 997–1010.<br />
Driese, S.G., Mora, C.I., Stiles, C.A., Joeckel, R.M., Nordt, L.C., 2000. Mass-balance<br />
<strong>reconstruction</strong> of a modern Vertisol: implications for interpreting the geochemistry<br />
<strong>and</strong> burial alteration of paleo-Vertisols. Geoderma 95, 179–204.<br />
Driese, S.G., Jacobs, J.R., Nordt, L.C., 2003. Comparison of modern <strong>and</strong> ancient Vertisols<br />
developed on limestone in terms of their geochemistry <strong>and</strong> parent material.<br />
Sedimentary Geology 157, 49–69.<br />
Driese, S.G., Nordt, L.C., Lynn, W., Stiles, C.A., Mora, C.I., Wilding, L.P., 2005.<br />
Distinguishing climate in the soil record using chemical trends in a Vertisol<br />
climosequence from the Texas Coastal Prairie, <strong>and</strong> application to interpreting<br />
Paleozoic paleosols in the Appalachian basin. Journal of Sedimentary Research 75,<br />
340–353.<br />
Driese, S.G., Medaris Jr., G., Ren, M., Runkel, A.C., Langford, R.P., 2007. Differentiating<br />
pedogenesis from diagenesis in early terrestrial paleoweathering surfaces formed<br />
on granitic composition parent materials. Journal of Geology 115, 387–406.<br />
Droser, M.L., Bottjer, D.J., 1986. A semiquantitative field classification of ichnofabric.<br />
Journal of Sedimentary Petrology 56, 558–559.<br />
Dury, G.H., 1971. Relict deep weathering <strong>and</strong> duricrusting in relation to palaeoenvironments<br />
of middle latitudes. Geographic Journal 137, 511–522.<br />
Dutta, P.K., Suttner, L.J., 1986. Alluvial s<strong>and</strong>stone composition <strong>and</strong> paleoclimate; II,<br />
Authigenic mineralogy. Journal of Sedimentary Petrology 56, 346–358.<br />
Dworkin, S.I., Nordt, L., Atchley, S., 2005. Determining terrestrial paleotemperatures<br />
using the oxygen isotopic composition of pedogenic carbonate. Earth <strong>and</strong> Planetary<br />
Science Letters 237, 56–68.<br />
Eiler, J.M., 2007. “Clumped-isotope” geochemistry — the study of naturally-occurring<br />
multiply-substituted isotopologues. Earth <strong>and</strong> Planetary Science Letters 262,<br />
309–327.<br />
Ekart, D.D., Cerling, T.E., Montanez, I.P., Tabor, N.J., 1999. A 400 million year carbon<br />
isotope record of pedogenic carbonate: implications for paleoatmospheric carbon<br />
dioxide. American Journal of Science 299, 805–827.<br />
Elsinger, E.V., Ye, H., 1981. Mineralogy, 18 O/ 16 O <strong>and</strong> D/H ratios of clay rich sediments<br />
from Deep Sea Drilling Project site 180, Aleutian Trench. Clays <strong>and</strong> Clay Minerals 29,<br />
309–315.<br />
Epstein, S., Buchsbaum, R., Lowenstam, H.A., Urey, H.C., 1953. Revised carbonate-water<br />
isotopic temperature scale. Geology Society of America Bulletin 64, 1315–1326.<br />
Eugster, H.P., Chou, I.M., 1973. The depositional environments of precambrian b<strong>and</strong>ed<br />
iron-formations. Economic Geology <strong>and</strong> the Bulletin of the Society of Economic<br />
Geologists 68, 1144–1168.<br />
Fang, C., Moncrief, J.B., 2001. The dependence of soil CO 2 efflux on temperature. Soil<br />
Biology <strong>and</strong> biogeochemistry 33, 155–165.<br />
Faure, K., Harris, C., Willis, J.P., 1995. A profound meteoric water influence on Genesis in<br />
the Permian Waterberg coalfield, South Africa: evidence from stable isotopes.<br />
Journal of Sedimentary Research A65, 605–613.<br />
Fang, C., Moncrieff, J.B., Gholz, H.L., Clark, K.L., 1998. Soil CO 2 efflux <strong>and</strong> its spatial<br />
variation in a Florida Slash pin plantation. Plant <strong>and</strong> Soil 205, 135–146.<br />
Feakes, C.R., Holl<strong>and</strong>, H.D., Zbinden, E.A., 1989. Ordovician paleosols at Arisaig, Nova<br />
Scotia, <strong>and</strong> evolution of the atmosphere. In: Bronger, A., Catt, J.A. (Eds.),<br />
Paleopedology: Nature <strong>and</strong> Application of Paleosols. Catena Supplement, vol. 16,<br />
pp. 207–232.<br />
Fedo, C.M., Nesbitt, H.W., Young, G.M., 1995. Unraveling the effects of potassium<br />
metasomatism in sedimentary rocks <strong>and</strong> paleosols, with implications for<br />
paleoweathering conditions <strong>and</strong> provenance. Geology 23, 921–924.<br />
Feng, J., Hsieh, Y.P., 1998. wetl<strong>and</strong>s <strong>and</strong> aquatic processes; sulfate reduction in<br />
freshwater wetl<strong>and</strong> soils <strong>and</strong> the effects of sulfate <strong>and</strong> substrate loading. Journal<br />
Environmental Quality 27, 968–972.<br />
Feng, W., Yapp, C.J., 2008. Experimental tests of the effects of Al substitution on the<br />
goethite-water D/H fractionation factor. Geochimica et Cosmochimica Acta 72,<br />
1295–1311.<br />
Ferguson, K.M., Gregory, R.T., Constantine, A., 1999. Lower Cretaceous (Aptian–Albian)<br />
secular changes in the oxygen <strong>and</strong> carbon isotope record from high paleolatitude,<br />
fluvial sediments, southeast Australia: comparisons to the marine record. In:<br />
Barrera, E., Jonson, C.C. (Eds.), Evolution of the Cretaceous Ocean-Climate System.<br />
Geological Society of America Special Paper, vol. 332, pp. 59–72.<br />
Fox, D.L., Koch, P.L., 2003. Tertiary history of C4 biomass in the Great Plains, U.S.A.<br />
Geology 31, 809–812.<br />
Fox, D.L., Koch, P.L., 2004. Carbon <strong>and</strong> oxygen isotopic variability in Neogene paleosol<br />
carbonates: constraints on the evolution of C 4 -grassl<strong>and</strong>s of the Great Plains, USA.<br />
Palaeogeography, Palaeoclimatology, Palaeoecology 207, 305–329.<br />
Frakes, L.A., Francis, J.E., Syktus, J.I., 1992. Climate Modes of the Phanerozoic. University<br />
Press, Cambridge, UK.<br />
Franzmeier, F.P., Bryant, R.B., Steinhardt, G., 1985. Characteristics of Wisconsinan glacial<br />
tills in Indiana <strong>and</strong> their influence on Argillic horizon development. Soil Science<br />
Society of America Journal 49, 1481–1486.<br />
Freytet, P., Verrecchia, E.P., 2002. Lacustrine <strong>and</strong> palustrine carbonate petrography: an<br />
overview. Journal of Paleolimnology 27, 221–237.<br />
Fritz, S.J., Toth, T.A., 1997. An Fe-berthierine from a Cretaceous laterite: Part II, estimation<br />
of Eh, pH <strong>and</strong> pCO 2 conditions of formation. Clays <strong>and</strong> Clay Minerals 45, 580–586.<br />
Garzione, C.N., Dettman, D.L., Quade, J., DeCelles, P.G., Butler, R.F., 2000. High times on<br />
the Tibetan Plateau: paleoelevation of the Thakkhola graben, Nepal. Geology 28,<br />
339–342.<br />
Garzione, C.N., Dettman, D.L., Horton, B.K., 2004. Carbonate oxygen isotope<br />
paleoaltimetry: evaluating the effect of diagenesis on paleoelevation estimates<br />
for the Tibetan plateau. Palaeogeography, Palaeoclimatology, Palaeoecology 212,<br />
119–140.<br />
Gat, J.R., Bowser, C.J., 1991. The heavy isotope enrichment of water in coupled<br />
evaporative systems. Geochemical Society Special Publication 3, 159–168.<br />
Genise, J.F., Bellosi, E.S., Gonzalez, M.G., 2004. An approach to the description <strong>and</strong><br />
interpretation of ichnofabrics in palaeosols. Geological Society Special Publications<br />
228, 355–382.<br />
Ghosh, P., Bhattacharya, S.K., Jani, R.A., 1995. Paleoclimate <strong>and</strong> palaeovegetation in<br />
central India during the Upper Cretaceous based on stable-isotope composition of<br />
paleosol carbonates. Palaeogeography, Palaeoclimatology, Palaeoecology 114,<br />
285–296.<br />
Ghosh, P., Ghosh, P., Bhattacharya, S.K., 2001. CO 2 levels in the Late Palaeozoic <strong>and</strong><br />
Mesozoic atmosphere from soil carbonate <strong>and</strong> organic matter, Satpura Basin,<br />
central India. Palaeogeography, Palaeoclimatology, Palaeoecology 170, 219–236.<br />
Ghosh, P., Adkins, J., Affek, H., Balta, B., Guo, W.F., Schauble, E.A., Schrag, D., Eiler, J.M.,<br />
2006a. C-13-O-18 bonds in carbonate minerals: a new kind of paleothermometer.<br />
Geochimica et Cosmochimica Acta 70, 1439–1456.<br />
Ghosh, P., Garzione, C.N., Eiler, J.M., 2006b. Rapid uplift of the Altiplano revealed<br />
through C-13-O-18 bonds in paleosol carbonates. Science 311, 511–515.<br />
Gile, L.H., Peterson, F.F., Grossman, R.B., 1966. Morphological <strong>and</strong> genetic sequences of<br />
carbonate accumulation in desert soils. Soil Science 101, 347–360.<br />
Gilg, H.A., 2000. D–H evidence for the timing of kaolinitization in Northeast Bavaria,<br />
Germany. Chemical Geology 170, 5–18.<br />
Gilg, H.A., 2003. Isotope geochemistry <strong>and</strong> origin of illite–smectite <strong>and</strong> kaolinite from<br />
the Seilitz <strong>and</strong> Kemmlitz kaolin deposits, Saxony, Germany. Clay Minerals 38,<br />
95–112.<br />
Gilg, G.A., Sheppard, S.M.F., 1996. Hydrogen isotope fractionation between kaolinite <strong>and</strong><br />
water revisited. Geochimica et Cosmochimica Acta 60, 529–533.<br />
Gill, S., Yemane, K., 1996. Implications of a Lower Pennsylvanian Ultisol for equatorial<br />
Pangean climates <strong>and</strong> early, oligotropic, forest ecosystems. Geology 24, 905–908.<br />
Giral-Kacmarcík, S., Savin, S.M., Nahon, D.B., Girard, J.P., Lucas, Y., Abel, L.J., 1998. Oxygen<br />
isotope geochemistry of kaolinite in laterite-forming processes, Manaus, Amozonas,<br />
Brazil. Geochimica et Cosmochimica Acta 62, 1865–1879.<br />
Girard, J.P., Savin, S.M., 1996. Intracrystalline fractionation of oxygen isotopes between<br />
hydroxyl <strong>and</strong> non-hydroxyl sites in kaolinite measured by thermal dehydroxylation<br />
<strong>and</strong> partial fluorination. Geochimica et Cosmochimica Acta 60, 469–487.<br />
Girard, J.P., Fryssinet, P., Gilles, C., 2000. Unraveling climatic changes from intraprofile<br />
variation in oxygen <strong>and</strong> hydrogen isotopic composition of goethite <strong>and</strong> kaolinite in<br />
laterites; an integrated study from Yaou, French Guiana. Geochimica et Cosmochimica<br />
Acta 64, 409–426.<br />
Glinski, J., Stepniewski, W., 1985. Soil aeration <strong>and</strong> its role for plants. CRC, Boca Raton,<br />
Florida, USA.<br />
Gluyas, J.G., 1984. Early carbonate diagenesis within Phanerozoic shales <strong>and</strong> s<strong>and</strong>stones<br />
of the NW European shelf. Clay Minerals 19, 309–321.<br />
Gonfiantini, R., 1986. Environmental isotopes in lake studies. In: Fritz, P., Fontes, J.C.<br />
(Eds.), H<strong>and</strong>book of Environmental Geochemistry, v. 2, The terrestrial Environment.<br />
B. Elsevier, Amsterdam, pp. 113–168.<br />
Gradstein, F.M., Ogg, J.G., Smith, A.G., Bleeker, W., Lourens, L.J., 2004. A new geologic<br />
time scale, with special reference to the Precambrian <strong>and</strong> Neogene. Episodes 27,<br />
83–100.<br />
Graham, A., 1999. Late Cretaceous <strong>and</strong> Cenozoic history of North American vegetation.<br />
Oxford University Press, New York.<br />
Gregory, R.T., 1991. Oxygen isotope history of seawater revisited: time scales for<br />
boundary event changes in the oxygen isotope composition of seawater. In: Taylor,<br />
H.P., O'Neil, J.R., Kaplan, I.R., I.R. (Eds.), Stable Isotope Geochemistry: A Tribute to<br />
Samuel Epstein. The Geochemical Society, San Antonio, U.S.A., pp. 65–76.<br />
Hamer, J.M.M., Sheldon, N.D., Nichols, G.J., 2007a. Global aridity during the Early<br />
Miocene? A terrestrial paleoclimate record from the Ebro Basin, Spain. Journal of<br />
Geology 115, 601–608.<br />
Hamer, J.M.M., Sheldon, N.D., Nichols, G.J., Collinson, M.E., 2007b. Late Oligocene–Early<br />
Miocene palaeosols of distal fluvial systems, Ebro Basin, Spain. Palaeogeography,<br />
Palaeoclimatology, Palaeoecology 247, 220–235.<br />
Harnois, L., 1988. The CIW index: a new chemical index of weathering. Sedimentary<br />
Geology 55, 319–322.<br />
Please cite this article as: Sheldon, N.D., Tabor, N.J., <strong>Quantitative</strong> <strong>paleoenvironmental</strong> <strong>and</strong> <strong>paleoclimatic</strong> <strong>reconstruction</strong> using paleosols, Earth-<br />
Science Reviews (2009), doi:10.1016/j.earscirev.2009.03.004
ARTICLE IN PRESS<br />
N.D. Sheldon, N.J. Tabor / Earth-Science Reviews xxx (2009) xxx–xxx<br />
47<br />
Harris, C., Compton, J.S., Bevington, S.A., 2000. Oxygen <strong>and</strong> H isotopes composition of<br />
kaolinite deposits, Cape Peninsula, South Africa; low temperature, meteoric origin.<br />
Journal of African Earth Sciences 94, 1353–1366.<br />
Hartley, A.J., May, G., 1998. Miocene gypcretes in the Calama Basin, northern Chile.<br />
Sedimentology 45, 351–364.<br />
Hasiotis, S.T., 2004. Reconnaissance of Upper Jurassic Morrison Formation ichnofossils,<br />
Rocky Mountain Region, USA; <strong>paleoenvironmental</strong>, stratigraphic, <strong>and</strong> <strong>paleoclimatic</strong><br />
significance of terrestrial <strong>and</strong> freshwater ichnocoenoses. Sedimentary Geology 167,<br />
177–268.<br />
Hassanipak, A.A., Eslinger, E., 1985. Mineralogy, crystallinity, O 18 /O 16 , <strong>and</strong> D/H of<br />
Georgia kaolins. Clays <strong>and</strong> Clay Minerals 33, 99–106.<br />
Hedenquist, J.W., Arribas, A., Reynolds, T.J., 1998. Evolution of an intrusion-centered<br />
hydrothermal system; far southeast-Lepanto porphyry <strong>and</strong> epithermal Cu–Au<br />
deposits, Philippines. Economic Geology <strong>and</strong> the Bulletin of the Society of Economic<br />
Geology 93, 373–404.<br />
Hemming, N.G., Hanson, G.N., 1992. Boron isotopic composition <strong>and</strong> concentration in<br />
modern marine carbonates. Geochimica et Cosmochimica Acta 56, 537–543.<br />
Herbillon, A.J., Mestdagh, M.M., Vielvoye, L., Derouane, E.G., 1976. Iron in kaolinites with<br />
special reference to kaolinites from tropical soils. Clay Minerals 16, 195–220.<br />
Hessler, A.M., Lowe, D.R., Jones, R.L., Bird, D.K., 2004. A lower limit for atmospheric<br />
carbon dioxide levels 3.2 billion years ago. Nature 428, 736–738.<br />
Hill, I.G., Worden, R.H., Meighan, I.G., 2000. Geochemical evolution of a paleolaterite:<br />
the Interbasaltic Formation, Northern Irel<strong>and</strong>. Chemical Geology 166, 65–84.<br />
Hoefs, J., 1997. Stable isotope geochemistry. Springer, Berlin. 201 pp.<br />
Holl<strong>and</strong>, H.D., Zbinden, E.A., 1988. Paleosols <strong>and</strong> the evolution of the atmosphere: part I.<br />
In: Lerman, A., Meybeck, M. (Eds.), Physical <strong>and</strong> Chemical Weathering in<br />
Geochemical Cycles. New York, Kluwer Academic Publishers.<br />
Horton, T.W., Sjostrom, D.J., Abruzzese, M.J., Poage, M.A., Waldbauer, J.R., Hren, M.T.,<br />
Wooden, J.L., Chamberlain, C.P., 2004. Spatial <strong>and</strong> temporal variation of Cenozoic<br />
surface elevation in the Great Basin <strong>and</strong> Sierra Nevada. American Journal of Science<br />
304, 862–888.<br />
Hsieh, J.C.C., 1997. An oxygen isotopic study of soil water <strong>and</strong> pedogenic clays in Hawaii.<br />
California Institute of Technology, unpublished Ph.D. Dissertation, 181 pp.<br />
Hsieh, J.C.C., Yapp, C.J., 1999. Stable carbon isotope budget of CO 2 in a wet, modern soil as<br />
inferred from Fe(CO 3 )OH in pedogenic goethite: possible role of calcite dissolution.<br />
Geochimica et Cosmochimica Acta 63, 767–783.<br />
Hyeong, K., Capuano, R.M., 2004. Hydrogen isotope fractionation factor for mixed-layer<br />
illite-smectite at 60 degree C to 150 degrees C: new data from the northeast Texas<br />
Gulf Coast. Geochimica et Cosmochimica Acta 68, 1529–1543.<br />
Irwin, H., Curtis, C., Coleman, M., 1977. Isotopic evidence for source of diagenetic<br />
carbonates fromed during burial of organic-rich sediments. Nature 269, 209–213.<br />
Jackson, M.L., 1964. Chemical composition of soil. In: Bear, F.E. (Ed.), Chemistry of the<br />
soil. Reinhold Publishing Corporation, New York, U.S.A., pp. 71–141.<br />
Jackson, M.L., Abdel-Kader, F.H., 1978. Kaolinite intercalation procedure for all sizes <strong>and</strong><br />
types with X-ray diffraction spacing distinctive from other phyllosilicates. Clays <strong>and</strong><br />
Clay Minerals 26, 81–87.<br />
Jacobs, B.F., Tabor, N., Feseha, M., Pan, A., Kappelman, J., Rasmussen, T., S<strong>and</strong>ers, W.,<br />
Wiemann, M., Crabaugh, J., Massini, J.L.G., 2005. Oligocene terrestrial strata of<br />
northwestern Ethiopia: a preliminary report on paleoenvironments <strong>and</strong> paleontology.<br />
Palaeotologia Electronica 8, 25A.<br />
Janis, C.M., Damuth, J., Theodor, J.M., 2002. The origins <strong>and</strong> evolution of the North<br />
American grassl<strong>and</strong> biome: the story from the hoofed mammals. Palaeogeography,<br />
Palaeoclimatology, Palaeoecology 177, 183–198.<br />
Jenny, H.J., 1941. Factors of Soil Formation. McGraw-Hill, New York. 281 pp.<br />
Jenny, H.J., Leonard, C.D., 1935. Functional relationships between soil properties <strong>and</strong><br />
rainfall. Soil Science 38, 363–381.<br />
Johnson, J.W., Oelkers, E.H., Helgeson, H.C., 1992. SUPCRT92: a software package for<br />
calculating the st<strong>and</strong>ard molal thermodynamic properties of minerals, gases,<br />
aqueous species, <strong>and</strong> reactions from 1 to 5000 bar <strong>and</strong> 0 to 1000 °C. Computers <strong>and</strong><br />
Geosciences 18, 899–947.<br />
Kah, L.C., Riding, R., 2007. Mesoproterozoic carbon dioxide levels inferred from calcified<br />
cyanobacteria. Geology 35, 799–802.<br />
Kahmann, J.A., Seaman III, J., Driese, S.G., 2008. Evaluating trace elements as<br />
paleoclimate indicators: multivariate statistical analysis of late Mississippian<br />
Pennington Formation Paleosols, Kentucky, USA. Journal of Geology 116, 254–268.<br />
Kakihana, H., Kotaka, M., Satoh, S., Nomura, M., Okamoto, M., 1977. Fundamental studies<br />
on the ion-exchange separation of boron isotopes. Bulletin of the Chemical Society<br />
of Japan 50, 158–163.<br />
Kasting, J.F., 1993. Earth's early atmosphere. Science 259, 920–926.<br />
Kasting, J.F., 2004. Archaean atmosphere <strong>and</strong> climate. Nature 432. doi:10.1038/<br />
nature03166.<br />
Keeling, C.D., Whorf, T.P., Wahlen, M., Plikcht, J., 1995. Interannual extremes in the rate<br />
of rise of atmospheric carbon dioxide since 1980. Nature 375, 666–670.<br />
Keller, W.D., 1963. Diagenesis in clay minerals; a review. Clays <strong>and</strong> Clay Minerals 13,<br />
136–157.<br />
Kemp, R.A., Zarate, M., Toms, P., King, M., Sanabria, J., Arguello, G., 2006. Late Quaternary<br />
paleosols, stratigraphy <strong>and</strong> l<strong>and</strong>scape evolution in the Northern Pampa, Argentina.<br />
Quaternary Research 66, 119–132.<br />
Kenny, R., Neet, K.E., 1993. Upper Pennsylvanian-Permian (Naco Group) paleosols<br />
(north-Central Arizona): field <strong>and</strong> isotopic evidence. Geoderma 58, 131–148.<br />
Keyser, T.K., Kerrich, R., 1991. Retrograde exchange of hydrogen isotopes between<br />
hydrous minerals <strong>and</strong> water at low temperatures. In: Taylor, H.P., O'Neil, J.R., Kaplan,<br />
I.R. (Eds.), Stable Isotope Geochemistry: A Tribute to Samuel Epstein. The<br />
Geochemical Society, San Antonio, U.S.A., pp. 409–422.<br />
Kim, S.-T., O'Neil, J.R., 1997. Equilibrium <strong>and</strong> nonequilibrium oxygen isotope effects in<br />
synthetic carbonates. Geochimica et Cosmochimica Acta 61, 3461–3475.<br />
Kingston, J.D., Marino, B.D., Hill, A., 1994. Isotopic evidence for Neogene hominid<br />
paleoenvironments in the Kenya Rift Valley. Science 264, 955–959.<br />
Kirkl<strong>and</strong>, J.I., 2006. Fruita paleontological area (Upper Jurassic, Morrison Formation),<br />
western Colorado: an example of terrestrial taphofacies analysis. In: Foster, J.R.,<br />
Lucas, S.G. (Eds.), Paleontology <strong>and</strong> Geology of the Upper Jurassic Morrison<br />
Formation. New Mexico Museum of Natural History, vol. 36, pp. 67–95.<br />
Kisakürek, B., Widdowson, M., Jame, R.H., 2004. Behaviour of Li isotopes during<br />
continental weathering: the Bidar laterite profile, India. Chemical Geology 212,<br />
27–44.<br />
Knapp, A.K., Conrad, S.L., Blair, J.M., 1998. Determinants of soil CO 2 flux from a subhumid<br />
grassl<strong>and</strong>: effect of fire <strong>and</strong> fire history. Ecological Applications 8, 760–770.<br />
Koch, P.L., 1998. Isotopic <strong>reconstruction</strong> of past continental environments. Annual<br />
Reviews of Earth Planetary Sciences 26, 573–612.<br />
Koch, P.L., Zachos, J.C., Dettman, D.L., 1995. Stable isotope stratigraphy <strong>and</strong> paleoclimatology<br />
of the Paleogene Bighorn Basin (Wyoming, USA). Palaeogeography<br />
Palaeoclimatology Palaeoecology 115, 61–89.<br />
Koch,P.L.,Clyde,W.C.,Hepple,R.P.,Fogel,M.L.,Wing,S.L.,Zachos,J.C.,2003.Carbon<br />
<strong>and</strong> oxygen isotope records from paleosols spanning the Paleocene–Eocene<br />
boundary, Bighorn Basin, Wyoming. In: Wing, S.L., Ginerich, P.D., Schmitz, B.,<br />
Thomas, E. (Eds.), Causes <strong>and</strong> Consequences of Globally Warm Climates in the<br />
Early Paleogene. Geological Society of America Special Paper, vol. 369, pp. 49–64.<br />
Boulder, Colorado.<br />
Kohur, C., Muehlenbachs, K., Dudas, M.J., 1995. Authigenic dolomite in a saline soil in<br />
Alberta, Canada. Soil Science Society of America Journal 59, 1499–1504.<br />
Koppi, A.J., Edis, R., Field, D.J., Geering, H.R., Klessa, D.A., Cockayne, D.J.H., 1996. Rare<br />
earth element trends <strong>and</strong> cerium–uranium–manganese associations in weathered<br />
rock from koongarra, Northern Territory, Australia. Geochimica et Cosmochimica<br />
Acta 60, 1695–1707.<br />
Koster, H.M., Ehricher, U., Gilg, H.A., Jordan, R., Murad, E., Onnich, K., 1999. Mineralogical<br />
<strong>and</strong> chemical characteristic of five nontronites <strong>and</strong> Fe-rich smectites. Clay Minerals<br />
34, 579–599.<br />
Kraus, M.J., 1987. Integration of channel <strong>and</strong> floodplain suites: II. Lateral relations of<br />
alluvial paleosols. Journal of Sedimentary Petrology 57, 602–612.<br />
Kraus, M.J., 1997. Lower Eocene alluvial paleosols; pedogenic development, stratigraphic<br />
relationships, <strong>and</strong> paleosol/l<strong>and</strong>scape associations. Palaeogeography,<br />
Palaeoclimatology, Palaeogeography 129, 387–406.<br />
Kraus, M.J., 1999. Paleosols in clastic sedimentary rocks: their geologic applications.<br />
Earth-Science Reviews 47, 41–70.<br />
Kraus, M.J., Aslan, A., 1993. Eocene hydromorphic paleosols: significance for interpreting<br />
ancient floodplain processes. Journal of Sedimentary Petrology 63, 453–463.<br />
Kraus, M.J., Hasiotis, S.J., 2006. Significance of different modes of rhizolith preservation<br />
to interpreting <strong>paleoenvironmental</strong> <strong>and</strong> paleohydrologic settings: examples from<br />
Paleogene paleosols, Bighore Basin, Wyoming, U.S.A. Journal of Sedimentary<br />
Research 76, 633–646.<br />
Kraus, M.J., Riggins, S., 2007. Transient drying during the Paleocene–Eocene Thermal<br />
Maximum (PETM): analysis of paleosols in the Bighorn Basin, Wyoming.<br />
Palaeogeography, Palaeoclimatology, Palaeoecology 245, 444–461.<br />
Krishnamurthy, R.V., Bhattacharya, S.K., 1991. Stable oxygen <strong>and</strong> hydrogen isotope ratios<br />
in shallow ground waters from India <strong>and</strong> a study of the role of evapotranspiration in<br />
the Indian monsoon. In: Taylor, H.P., O'Neil, J.R., Kaplan, I.R. (Eds.), Stable Isotope<br />
Geochemistry: A Tribute to Samuel Epstein. The Geochemical Society, San Antonio,<br />
U.S.A., pp. 187–193.<br />
Krull, E.S., Retallack, G.J., 2000. δ 13 C depth profiles from paleosols across the Permian–<br />
Triassic boundary: evidence for methane release. Geological Society of America<br />
Bulletin 112, 1459–1472.<br />
Kürschner, W.M., Kvacek, Z., Dilcher, D.L., 2008. The impact of Miocene atmospheric<br />
carbon dioxide fluctuations on climate <strong>and</strong> the evolution of terrestrial ecosystems.<br />
Proceedings of the National Academy of Sciences 105, 449–453.<br />
Kurtz, A.C., Derry, L.A., Chadwick, O.A., Alfano, M.J., 2000. Refractory element mobility in<br />
volcanic soils. Geology 28, 683–686.<br />
L<strong>and</strong>uyt, C.J., 1990. Micromorphology of iron minerals from bog ores of the Belgian<br />
Campine area. In: Douglas, L.A. (Ed.), Soil Micromorphology: A basic <strong>and</strong> applied<br />
science. Developments in Soil Science, vol. 19. Elsevier, Amsterdam, pp. 289–294.<br />
Latorre, C., Quade, J., McIntosh, W.C., 1997. The expansion of C 4 grasses <strong>and</strong> global<br />
climate change in the late Miocene: stable isotope evidence from the Americas.<br />
Earth <strong>and</strong> Planetary Science Letters 146, 83–96.<br />
Lawrence, J.R., Taylor, H.P., 1971. Deuterium <strong>and</strong> 18 O correlation: clay minerals <strong>and</strong><br />
hydroxides in Quaternary soils compared to meteoric waters. Geochimica et<br />
Cosmochimica Acta 34, 25–42.<br />
Lawrence, J.R., Rashkes Meaux, J., 1993. The stable isotopic composition of ancient<br />
kaolinites of North America. In: Swart, P.K., Lohmann, K.C., McKenzie, J., Savin, S.<br />
(Eds.), In Climate Change in Continental Isotopic Records. Geophysical Monograph,<br />
vol. 78, pp. 249–262.<br />
Lawrence, J.R., Taylor, H.P., 1972. Hydrogen <strong>and</strong> oxygen isotope systematics in<br />
weathering profiles. Geochimica et Cosmochimica Acta 36, 1377–1393.<br />
Lawrence, J.R., White, J.W.C., 1991. The elusive climate signal in the isotopic composition<br />
of precipitation. In: Taylor, H.P., O'Neil, J.R., Kaplan, I.R. (Eds.), Stable Isotope<br />
Geochemistry: A Tribute to Samuel Epstein. The Geochemical Society, San Antonio,<br />
U.S.A., pp. 169–185.<br />
Lawton, T., Buck, B.J., 2006. Implications of diapir-derived detritus <strong>and</strong> gypsic paleosols<br />
in Lower Triassic strata near the Castle Valley salt wall, Paradox basin, Utah.<br />
Geology 34, 885–888.<br />
Laza, J.H., 2006. Termiteros del Plioceno y Pleistoceno de la provincial de Buenos Aires,<br />
Rupublica Argentina: significacion paleoambiental y paleozoogeographica (Pliocene–Pleistocene<br />
termite mounds of Buenos Aires Province, Argentina: <strong>paleoenvironmental</strong><br />
<strong>and</strong> paleozoogeographical significance. Ameghiniana 43, 641–648.<br />
Please cite this article as: Sheldon, N.D., Tabor, N.J., <strong>Quantitative</strong> <strong>paleoenvironmental</strong> <strong>and</strong> <strong>paleoclimatic</strong> <strong>reconstruction</strong> using paleosols, Earth-<br />
Science Reviews (2009), doi:10.1016/j.earscirev.2009.03.004
ARTICLE IN PRESS<br />
48 N.D. Sheldon, N.J. Tabor / Earth-Science Reviews xxx (2009) xxx–xxx<br />
Leckie, D.A., Fox, C., Tarocai, C., 1989. Multiple paleosols of the Late Albian Boulder Creek<br />
Formation, British Columbia, Canada. Sedimentology 36, 307–323.<br />
Leopold, E.B., Clay-Poole, S.T., 2001. Florissant leaf <strong>and</strong> pollen floras of Colorado<br />
compared: climatic implications. Proceedings of the Denver Museum of Natural<br />
History 4, 17–69.<br />
Levin, N.E., Quade, J., Simpson, S.W., Semaw, S., Rogers, M., 2004. Isotopic evidence for<br />
Plio-Pleistocene environmental change at Gona, Ethiopia. Earth <strong>and</strong> Planetary<br />
Science Letters 219, 92–110.<br />
Li, Y.-H., 2000. A Compendium of Geochemistry. Princeton University Press, Princeton.<br />
475 pp.<br />
Loisy, C., Verrecchia, E.P., Dufour, P., 1999. Microbial origin for pedogenic micrite<br />
associated with a carbonate paleosol (Champagne, France). Sedimentary Geology<br />
126, 193–204.<br />
Ludvigson, G.A., Gonzalez, L.A., Metzger, R.A., Witzke, B.J., Brenner, R.L., Murillo, A.P.,<br />
White, T.S., 1998. Meteoric sphaerosiderite lines <strong>and</strong> their use for paleohydrology<br />
<strong>and</strong> paleoclimatology. Geology 26, 1039–1042.<br />
Macaulay, C.I., Fallick, A.E., Haszeldine, R.S., 1993. Textural <strong>and</strong> isotopic variations in<br />
diagenetic kaolinite from the Magnus oilfield s<strong>and</strong>stones. Clay Minerals 28, 625–639.<br />
Machette, M.N., 1985. Calcic soils the southwestern United States. Geological Society of<br />
America Special Paper 203, 1–22.<br />
Mack, G.H., Cole, D.R., 2005. Geochemical model of δ 18 O of pedogenic calcite versus<br />
latitude <strong>and</strong> its application to Cretaceous palaeoclimate. Sedimentary Geology 174,<br />
115–122.<br />
Mack, G.H., Cole, D.R., Giordano, T.H., Schaal, W.C., Barcelos, J.H., 1991. Paleoclimatic<br />
controls on stable oxygen <strong>and</strong> carbon isotopes in caliche of the Abo Formation<br />
(Permian), south-central New Mexico, U.S.A. Journal of Sedimentary Petrology 61,<br />
458–472.<br />
Mack, G.H., James, W.C., Monger, H.C., 1993. Classification of paleosols. Geological<br />
Society of America Bulletin 105, 129–136.<br />
Mack, G.H., Tabor, N.J., Zollinger, H.J., in revision. Paleosols <strong>and</strong> sequence stratigraphy of<br />
the lower Permian Abo member, south-central New Mexico. Journal of Sedimentary<br />
Research.<br />
Macleod, K.G., Smith, R.M.H., Koch, P.L., Ward, P.D., 2000. Timing of mammal-like reptile<br />
extinctions across the Permian–Triassic boundary in South Africa. Geology 28,<br />
227–230.<br />
Magaritz, M., Amiel, A.J., 1980. Calcium carbonate in a calcareous soil from the Jordan<br />
Valley, Israel; its origin as revealed by the stable carbon isotope method. Soil<br />
Science Society of America Proceedings 44, 1059–1062.<br />
Magaritz, M., Kaufman, A., Yaalon, D.H., 1981. Calcium carbonate nodules in soil; 18 O/<br />
16 O <strong>and</strong> 13 C/ 12 C ratios <strong>and</strong> 14 C contents. Geoderma 25, 157–172.<br />
Majoube, M., 1971. Oxygen-18 <strong>and</strong> deuterium fractionation between water <strong>and</strong> steam.<br />
Journal de Chimie Physique et de Physico-Chimie Biologique 68, 1423.<br />
Marbut, C.F., 1935. Atlas of American Agriculture, Part III, Soils of the United States.<br />
United States Department of Agriculture Advance Sheets 8. Washington (D.C.), US<br />
Government Printing Office.<br />
Marfil, S.A., Maiza, P.J., Cardellach, E., Corbella, M., 2005. Origin of kaolin deposits in the<br />
‘Los Menucos” area, Rio Negro Province, Argentina. Clay Minerals 40, 283–293.<br />
Markewich, H.W., Pavich, M.J., Buell, G.R., 1990. Contrasting soils <strong>and</strong> l<strong>and</strong>scapes of the<br />
Piedmont <strong>and</strong> Coastal Plain, eastern United States. Geomorphology 3, 417–447.<br />
Marumo, K., 1989. Genesis of kaolin minerals <strong>and</strong> pyrophyllite in Kuroko deposits<br />
of Japan: Implications for the origins of the hydrothermal fluids from<br />
mineralogical <strong>and</strong> stable isotope data. Geochimica et Cosmochimica Acta 53,<br />
2915–2924.<br />
Matsumoto, R., Iijima, A., 1981. Origin <strong>and</strong> diagenetic evolution of Ca–Mg–Fe carbonates<br />
in some coalfields of Japan. Sedimentology 28, 239–259.<br />
Matthews, A., Ayalon, A., Ziz, A., Shaked, J., 1999. Hydrogen <strong>and</strong> oxygen isotope studies<br />
of alteration in the Timna Igneous Complex. Israel Journal of Earth Science 48,<br />
121–131.<br />
Maynard, J.B., 1992. Chemistry of modern soils as a guide to interpreting Precambrian<br />
paleosols. Journal of Geology 100, 279–289.<br />
McCarthy, P.J., Plint, A.G., 2003. Spatial variability of paleosols across Cretaceous<br />
interfluves in the Dunvegan Formation, NE British Columbia, Canada: palaeohydrological<br />
<strong>and</strong> stratigraphic implications. Sedimentology 50, 1187–1220.<br />
McCrea, J.M., 1950. On the isotope chemistry of carbonates <strong>and</strong> paleotemperature scale.<br />
Journal of Chemical Physics 18, 849–857.<br />
McFadden, L.D., Tinsley, J.C., 1985. Rate <strong>and</strong> depth of pedognic-carbonate accumulation<br />
in soils: Formulation <strong>and</strong> testing of a compartment model. In: Wiede, D.L. (Ed.),<br />
Soils <strong>and</strong> Quaternary geology of the southwestern United States. Geological Society<br />
of America Special Paper, vol. 203, pp. 23–41.<br />
McFadden, I.D., Amundson, R.G., Chadwick, O.A., 1991. Numerical modeling, chemical<br />
<strong>and</strong> isotopic studies of carbonate accumulation in arid regions. In: Nettleton, W.D.<br />
(Ed.), Occurrence, Characteristics <strong>and</strong> Genesis of Carbonate, Gypsum, <strong>and</strong> Silica<br />
Accumulation in Soils. Soil Science Society of America Special Publication, vol. 26,<br />
pp. 17–35.<br />
McMillan, M., Schwertmann, U., 1988. Morphological <strong>and</strong> genetic relations between<br />
siderite, calcite <strong>and</strong> goethite in a low moor peat from southern Germany. European<br />
Journal of Soil Science 49, 283–293.<br />
Melezhik, V.A., Fallick, A.E., Smith, R.A., Rosse, D.M., 2007. Spherical <strong>and</strong> columnar,<br />
spetarian, 18 O depleted, calcite concretions from Middle–Upper Permian lacustrine<br />
siltstones in northern Mozambique; evidence for very early diagenesis <strong>and</strong> multiple<br />
fluids. Sedimentology 54, 1389–1416.<br />
Metzger, C.A., Terry III, D.O., Gr<strong>and</strong>staff, D.E., 2004. Effect of paleosol formation on rare<br />
earth element signatures in fossil bone. Geology 32, 497–500.<br />
Mizota, C., Longstaffe, F.J., 1996. Origin of Cretaceous <strong>and</strong> Oligocene Kaolinites from the<br />
Iwaizumi clay deposit, Iwate, northeastern Japan. Clays <strong>and</strong> Clay Minerals 44,<br />
408–416.<br />
Montañez, I.P., Tabor, N.J., Niemeier, D., DiMichele, W.A., Frank, T.D., Fielding, C.R., Isbell,<br />
J.L., 2007. CO 2 -forced climate <strong>and</strong> vegetation instability during late Paleozoic<br />
deglaciation. Science 315, 87–91.<br />
Moore, D.M., Reynolds Jr., R.C., 1996. X-ray diffraction <strong>and</strong> the identification of clay<br />
minerals. Oxford University of Press, New York, U.S.A.<br />
Mora, C.I., Driese, S.G., 1993. A steep mid Paleozoic to late Paleozoic decline in<br />
atmospheric CO 2 – evidence from the soil carbonate CO 2 palebarometer. Chemical<br />
Geology 107, 217–219.<br />
Mora, C.I., Driese, S.G., Colarusso, L.A., 1996. Middle to late Paleozoic atmospheric CO 2<br />
levels from soil carbonate <strong>and</strong> organic matter. Science 271, 1105–1107.<br />
Mozley, P.S., 1988. Relation between depositional environment <strong>and</strong> elemental<br />
composition of early diagenetic siderite. Geology 17, 704–706.<br />
Mozley, P.S., Carothers, W.W., 1992. Elemental <strong>and</strong> isotopic composition of siderite in<br />
the Daruk Formation, Alaska: effect of microbial activity <strong>and</strong> water-sediment<br />
interaction on early pore-water chemistry. Journal of Sedimentary Petrology 62,<br />
681–692.<br />
Mozley, P.S., Wersin, P., 1992. Isotopic composition of siderite as an indicator of<br />
depositional environment. Geology 20, 817–820.<br />
Muchez, P., Peeters, C., Keppens, E., Viaene, W.A., 1993. Stable isotopic composition of<br />
paleosols in the Lower Visean of eastern Belgium – evidence of evaporation <strong>and</strong><br />
soil-gas CO 2 . Chemical Geology 106, 389–396.<br />
Mulch, A., Chamberlain, C.P., 2006. Stable isotope paleoaltimetry in orogenic belts; the<br />
silicate record in surface <strong>and</strong> crustal geological archives. In: Kohn, M.J. (Ed.),<br />
Paleoaltimetry; geochemical <strong>and</strong> thermodynamic approaches. Reviews in Mineralogy<br />
<strong>and</strong> Geochemistry, vol. 66, pp. 89–118.<br />
Muller, J., 1995. Oxygen isotopes in iron (III) oxides: a new preparation line; mineralwater<br />
fractionation factors <strong>and</strong> <strong>paleoenvironmental</strong> considerations. Isotopes <strong>and</strong><br />
Environmental Health Studies 31, 301–302.<br />
Munsterman, D., Kerstholt, S., 1996. Sodium polytungstate, a new non-toxic alternative<br />
to bromoform in heavy liquid separation. Review of Paleobotany <strong>and</strong> Palynology 91,<br />
417–422.<br />
Murakami, T., Ito, J.-I., Utsunomiya, S., Kasama, T., Kozai, N., Ohnuki, T., 2004. Anoxic<br />
dissolution processes of biotite: implications for Fe behavior during Archean<br />
weathering. Earth <strong>and</strong> Planetary Science Letters 224, 117–129.<br />
Nadon, G.C., Issler, D.R., 1997. The compaction of floodplain sediments: timing,<br />
magnitude <strong>and</strong> implications. Geoscience Canada 24, 37–43.<br />
Nakamura, N., 1974. Determination of REE, Ba, Fe, Mg, Na <strong>and</strong> K in carbonaceous <strong>and</strong><br />
ordinary chondrites. Geochimica et Cosmochimica Acta 38, 757–775.<br />
Nash, V.E., Pettry, D.E., Mohd Noor Sudin, 1988. Mineralogy <strong>and</strong> chemical properties of<br />
two Ultisols formed in glauconitic sediments. Soil Science 145, 270–277.<br />
Nesbitt, H.W., Markovics, G., 1997. Weathering of granodioritic crust, long term storage<br />
of elements in weathering profiles, <strong>and</strong> petrogenesis of siliclastic sediments.<br />
Geochimica et Cosmochimica Acta 61, 1653–1670.<br />
Nesbitt, H.W., Young, G.M., 1982. Early Proterozoic climates <strong>and</strong> plate motions inferred<br />
from major element chemistry of lutites. Nature 299, 715–717.<br />
Nordt, L., Atchley, S., Dworkin, S.I., 2002. Paleosol barometer indicates extreme<br />
fluctuations in atmospheric CO 2 across the Cretaceous-Tertiary boundary. Geology<br />
30, 703–706.<br />
Nordt, L., Atchley, S., Dworkin, S., 2003. Terrestrial evidence for two greenhouse events<br />
in the latest Cretaceous. Geological Society of America Today 13, 11, 4–9.<br />
Nordt, L., Orosz, M., Driese, S., Tubbs, J., 2006. Vertisol carbonate properties in relation to<br />
mean annual precipitation: implications for paleoprecipitation estimates. Journal of<br />
Geology 114, 501–510.<br />
O'Geen, A.T., Busacca, A.J., 2001. Faunal burrows as indicators of paleo-vegetation in<br />
eastern Washington, USA. Palaeogeogeography, Palaeoclimatology, Palaeoecology<br />
169, 23–37.<br />
O'Neil, J.R., Kharaka, Y.K., 1976. Hydrogen <strong>and</strong> oxygen isotope exchange reactions<br />
between clay minerals <strong>and</strong> water. Geochimica et Cosmochimica Acta 40, 241–246.<br />
O'Neil, J.R., Clayton, R.N., Mayeda, T.K., 1969. Oxygen isotope fractionation in divalent<br />
metal carbonates. Journal of Chemical Physics 51, 5547–5558.<br />
Ohmoto, H., Watanabe, Y., Kumazawa, K., 2004. Evidence from massive siderite beds for<br />
aCO 2 -rich atmosphere before ~1.8 billion years ago. Nature 429, 395–399.<br />
Osborne, M., Haszeldine, R.S., Fallick, A.E., 1994. Variation in kaolinite morphology with<br />
growth temperature in isotopically mixed pore fluids, Brent Group, UK North Sea.<br />
Clay Minerals 29, 591–608.<br />
Pagani, M., Freeman, K.H., Arthur, M.A., 1999. Late Miocene atmospheric CO 2<br />
concentration <strong>and</strong> the expansion of C 4 grasses. Science 285, 876–878.<br />
Pal<strong>and</strong>ri, J.L., Reed, M.H., 2001. Reconstruction of in situ composition of sedimentary<br />
formation waters. Geochimica et Cosmochimica Acta 65, 1741–1767.<br />
Parnell, J., Baron, M., Boyce, A., 2000. Controls on kaolinite <strong>and</strong> dickite distribution;<br />
Highl<strong>and</strong> boundary fault zone; Scotl<strong>and</strong> <strong>and</strong> Northern Irel<strong>and</strong>. Journal of the<br />
Geological Society 157, 635–640.<br />
Parnell, J., Watt, G., Chen, H., Wycherley, H., Boyce, A., Elmore, D., Blumstein, R., Engel,<br />
M., Green, P., 2004. Kaolin polytype evidence for a hot-fluid pulse along Caledonian<br />
thrusts during rifting of the European margin. Mineralogical Magazine 68, 419–432.<br />
Passey, B.H., Cerling, T.E., Perkins, M.E., Voorhies, M.R., Harris, J.M., Tucker, S.T., 2002.<br />
Environmental change in the Great Plains: an isotopic record from fossil horses.<br />
Journal of Geology 110, 123–140.<br />
Pavlov, A.A., Hurtgen, M.T., Kasting, J.F., Arthur, M.A., 2003. Methane-rich Proterozoic<br />
atmosphere? Geology 31, 87–90.<br />
Pavlov, A.A., Kasting, J.F., Brown, L.L., Rages, K.A., Freedman, R., 2000. Greenhouse<br />
warming by CH 4 in the atmosphere of early Earth. Journal of Geophysical Research<br />
105, 11,981–119,990.<br />
Pearson, M.J., 1979. Geochemistry of the Hepworth Carboniferous sediment sequence<br />
<strong>and</strong> origin of the diagenetic iron minerals <strong>and</strong> concretions. Geochimica et<br />
Cosmochimica Acta 43, 927–941.<br />
Please cite this article as: Sheldon, N.D., Tabor, N.J., <strong>Quantitative</strong> <strong>paleoenvironmental</strong> <strong>and</strong> <strong>paleoclimatic</strong> <strong>reconstruction</strong> using paleosols, Earth-<br />
Science Reviews (2009), doi:10.1016/j.earscirev.2009.03.004
ARTICLE IN PRESS<br />
N.D. Sheldon, N.J. Tabor / Earth-Science Reviews xxx (2009) xxx–xxx<br />
49<br />
Pedro, G., 1982. The conditions of formation of secondary constituents. In: Bonneau, M.,<br />
Souchier, B. (Eds.), Constituents <strong>and</strong> properties of soils. Academic Press, London, pp.<br />
63–81.<br />
Perez-Huerta, A., Sheldon, N.D., 2006. Pennsylvanian sea level cycles, nutrient<br />
availability, <strong>and</strong> brachiopod community structure. Palaeogeography, Palaeoclimatology,<br />
Palaeoecology 230, 264–279.<br />
Peters-Kottig, W., Strauss, H., Kerp, H., 2006. The l<strong>and</strong> plant δ 13 C record <strong>and</strong> plant<br />
evolution in the Late Palaeozoic. Palaeogeography, Palaeoclimatology, Palaeoecology<br />
240, 237–252.<br />
Pett-Ridge, J.C., Monastra, V.M., Derry, L.A., Chadwick, O.A., 2007. Importance of<br />
atmospheric inputs <strong>and</strong> Fe-oxides in controlling soil uranium budgets <strong>and</strong> behavior<br />
along a Hawaiian chronosequences. Chemical Geology 244, 691–707.<br />
Poage, M.A., Chamberlain, C.P., 2001. Empirical relationships between elevation <strong>and</strong> the<br />
stable isotope composition of precipitation <strong>and</strong> surface waters: considerations for<br />
studies of paleoelevation change. American Journal of Science 301, 1–15.<br />
Postma, D., 1981. Formation of siderite <strong>and</strong> vivianite <strong>and</strong> the pore-water composition of<br />
a recent bog sediment in Denmark. Chemical Geology 31, 225–244.<br />
Postma, D., 1982. Pyrite <strong>and</strong> siderite formation in brackish <strong>and</strong> freshwater swamp<br />
sediments. American Journal of Science 282, 1151–1183.<br />
Postma, D., 1983. Pyrite <strong>and</strong> siderite oxidation in swamp sediments. European Journal of<br />
Soil Science 34, 163–182.<br />
Poulsen, C.J., 1999. The mid-Cretaceous ocean circulation <strong>and</strong> its impact on greenhouse<br />
climate dynamics (Ph.D. thesis): University Park, Pennsylvania State University, 219<br />
p.<br />
Prochnow, S.J., Nordt, L.C., Atchley, S.C., Hudec, M.R., 2006. Multi-proxy paleosol<br />
evidence for middle <strong>and</strong> late Triassic climate trends in eastern Utah. Palaeogeography,<br />
Palaeoclimatology, Palaeoecology 232, 53–72.<br />
Purvis, K., Wright, V.P., 1991. Calcretes related to phreatic vegetation from the Middle<br />
Triassic Otter S<strong>and</strong>stone of south west Engl<strong>and</strong>. Sedimentology 38, 539–551.<br />
Pye, K., Dickson, J.A.D., Schiavon, N., Coleman, M.L., Cox, M., 1990. Formation of Siderite-<br />
Mg-Calcite-iron sulphide concretions in intertidal marsh <strong>and</strong> s<strong>and</strong>flat sediments,<br />
north Norfolk, Engl<strong>and</strong>. Sedimentology 37, 325–343.<br />
Quade, J., Cerling, T.E., 1995. Expansion of C4 grasses in the late Miocene of northern<br />
Pakistan: evidence from stable isotopes in paleosols. Palaeogeography, Palaeoclimatology,<br />
Palaeoecology 115, 91–116.<br />
Quade, J., Cerling, T.E., Bowman, J.R., 1989. Development of Asian monsoon revealed by<br />
marked ecological shift during the latest Miocene in northern Pakistan. Nature 342,<br />
162–166.<br />
Quade, J., Solounias, N., Cerling, T.E., 1994. Stable isotopic evidence from paleosol<br />
carbonates <strong>and</strong> fossil teeth in Greece for forest or woodl<strong>and</strong>s over the past 11 Ma.<br />
Palaeogeography, Palaeoclimatology, Palaeoecology 108, 41–53.<br />
Quade, J., Cater, J.M.L., Ojha, T.P., Adam, J., Harrison, T.M., 1995. Late Miocene<br />
environmental change in Nepal <strong>and</strong> the northern Indian sub-continent: Stable<br />
isotopic evidence from paleosols. Geology Society of America Bulletin 107,<br />
1381–1397.<br />
Quade, J., Levin, N., Semaw, S., Stout, D., Renne, R., Rogers, M., Simpson, S., 2004.<br />
Paleoenvironments of the earliest stone toolmakers, Gona, Ethiopia. Geological<br />
Society of America Bulletin 116, 1529–1544.<br />
Quade, J., Garzione, C., Eiler, J., 2007. Paleoelevation <strong>reconstruction</strong> using pedogenic<br />
carbonates. Reviews in Mineralogy <strong>and</strong> Geochemistry 66, 53–87.<br />
Rabenhorst, M.C., Wilding, L.P., West, L.T., 1984. Identification of pedogenic carbonates<br />
using stable carbon isotope microfabric analysis. Soil Science Society of America<br />
Journal 48, 125–132.<br />
Rasmussen, C., Tabor, N.J., 2007. Applying a quantitative pedogenic energy model across<br />
a range of environmental gradients. Soil Science Society of America Journal 71,<br />
1719–1729.<br />
Rasmussen, C., Southard, R.J., Horwath, W.R., 2005. Modeling energy inputs to predict<br />
pedogenic environments using regional environmental databases. Soil Science<br />
Society of America Journal 69, 1266–1274.<br />
Retallack, G.J., 1976. Triassic palaeosols in the Upper Narrabeen Group of New South<br />
Wales. Part I: features of the palaeosols. Journal of the Geological Society of<br />
Australia 23, 383–399.<br />
Retallack, G.J., 1983. Late Eocene <strong>and</strong> Oligocene paleosols from Badl<strong>and</strong>s National Park,<br />
South Dakota. Geological Society of America Special Paper 193 82 pp.<br />
Retallack, G.J., 1986. Reappraisal of a 2200 Ma-old paleosol from near Waterval Onder,<br />
South Africa. Precambrian Research 2, 195–232.<br />
Retallack, G.J., 1991. Untangling the effects of burial alteration <strong>and</strong> ancient soil<br />
formation. Annual Review of Earth Planetary Sciences 19, 183–206.<br />
Retallack, G.J., 1994. The environmental factor approach to the interpretation of<br />
paleosols. In: Amundson, R., et al. (Ed.), Factors in soils formation: A fiftieth<br />
anniversary retrospective. Soil Science Society of America Special Publication, vol.<br />
33, pp. 31–64.<br />
Retallack, G.J., 1997a. Early forest soils <strong>and</strong> their role in Devonian global change. Science<br />
276, 583–585.<br />
Retallack, G.J., 1997b. Neogene expansion of the North American prairie. Palaios 12,<br />
380–390.<br />
Retallack, G.J., 1997c. Palaeosols in the upper Narrabeen Group of New South Wales as<br />
evidence of Early Triassic palaeoenvironments without modern analogues.<br />
Australian Journal of Earth Sciences 44, 185–201.<br />
Retallack, G.J., 1999. Post-apocalyptic greenhouse paleoclimate revealed by earliest<br />
Triassic paleosols in the Sydney Basin, Australia. Geological Society of America<br />
Bulletin 111, 52–70.<br />
Retallack, G.J., 2000. Depth to pedogenic carbonate horizon as a paleoprecipitation<br />
indicator? comment <strong>and</strong> reply. Geology 28, 572–573.<br />
Retallack, G.J., 2001a. Cenozoic expansion of grassl<strong>and</strong>s <strong>and</strong> climatic cooling. The<br />
Journal of Geology 109, 407–426.<br />
Retallack, G.J., 2001b. Soils of the past. Blackwell, Oxford. 600 pp.<br />
Retallack, G.J., 2002. Carbon dioxide <strong>and</strong> climate over the past 300 million years.<br />
Philosophical Transations of the Royal Society of London 360, 659–673.<br />
Retallack, G.J., 2005a. Earliest Triassic claystone breccias <strong>and</strong> soil-erosion crisis. Journal<br />
of Sedimentary Research 75, 679–695.<br />
Retallack, G.J., 2005b. Pedogenic carbonate proxies for amount <strong>and</strong> seasonality of<br />
precipitation in paleosols. Geology 33, 333–336.<br />
Retallack, G.J., 2007. Cenozoic paleoclimate on l<strong>and</strong> in North America. Journal of<br />
Geology 115, 271–294.<br />
Retallack, G.J., Feakes, C.R., 1987. Trace fossil evidence for Late Ordovician animals on<br />
l<strong>and</strong>. Science 235, 499–502.<br />
Retallack, G.J., Germán-Heins, J., 1994. Paleosol evidence for the geological antiquity of<br />
rain forests. Science 265, 499–502.<br />
Retallack, G.J., Jahren, H., 2008. Methane release from igneous intrusion of coal during<br />
late Permian extinction events. Journal of Geology 116, 1–20.<br />
Retallack, G.J., Krinsley, D.H., 1993. Metamorphic alteration of a Precambrian (2.2 Ga)<br />
paleosol from South Africa revealed by backscattered electron imaging. Precambrian<br />
Research 63, 27–41.<br />
Retallack, G.J., Krull, E.S., 1999. L<strong>and</strong>scape ecological shift at the Permian–Triassic<br />
boundary in Antarctica. Australian Journal of Earth Sciences 46, 785–812.<br />
Retallack, G.J., Mindszenty, A., 1994. Well preserved Late Precambrian paleosols from<br />
northwest Scotl<strong>and</strong>. Journal of Sedimentary Research A64, 264–281.<br />
Retallack, G.J., Veevers, J.J., Morante, R., 1996. Global coal gap between Permian-Triassic<br />
extinction <strong>and</strong> Middle Triassic recovery of peat-forming plants. Geological Society<br />
of America Bulletin 108, 195–207.<br />
Retallack, G.J., Bestl<strong>and</strong>, E.A., Fremd, T., 2000. Eocene <strong>and</strong> Oligocene paleosols <strong>and</strong><br />
environmental change in central Oregon. Geological Society of America Special<br />
Paper 344 192 pp.<br />
Retallack, G.J., Jahren, H., Sheldon, N.D., Chakrabarti, R., Metzger, C.A., Smith, R.M.H.,<br />
2005. The Permian–Triassic boundary in Antarctica. Antarctic Science 17, 241–258.<br />
Retallack, G.J., Smith, R.M.H., Ward, P.D., 2003. Vertebrate extinction across Permian–<br />
Triassic boundary in Karoo basin, South Africa. Geological Society of American<br />
Bulletin 115, 1133–1152.<br />
Retallack, G.J., Orr, W.N., Prothero, D.R., Duncan, R.A., Kester, P.R., Ambers, C.P., 2004a.<br />
Eocene–Oligocene extinction <strong>and</strong> climate change near Eugene, Oregon. Geological<br />
Society of America Bulletin 116, 817–839.<br />
Retallack, G.J., Wynn, J.G., Fremd, T.J., 2004b. Glacial–interglacial scale <strong>paleoclimatic</strong> change<br />
without large ice sheets in the Oligocene of central Oregon. Geology 32, 297–300.<br />
Robertson, J.A., Gazis, C.A., 2005. An oxygen isotope study of seasonal trends in soil<br />
water fluxes at two sites along a climate gradient in Washington State (USA).<br />
Journal of Hydrology 328, 375–387.<br />
Robinson, S.A., Andrews, J.E., Hesselbo, S.P., Radley, J.D., Denni, P.F., Harding, I.C., Allen, P.,<br />
2002. Atmospheric pCO 2 <strong>and</strong> depositional environment from stable-isotope<br />
geochemistry of calcrete nodules (Barremian, Lower Cretaceous, Wealden Beds,<br />
Engl<strong>and</strong>). Journal of the Geological Society 159, 215–224.<br />
Rolston, D.E., 1986. Gas diffusivity. In methods of soil analysis, Part 1. Physical <strong>and</strong><br />
mineralogical methods, second edition. In: Klute, A. (Ed.), American Society of<br />
Agronomy <strong>and</strong> Soil Science Society of America, Madison, Wisconsin, USA.<br />
Agricultural Monograph, vol. 9, pp. 1089–1102.<br />
Rowley, D.B., Currie, B.S., 2006. Palaeo-altimetry of the late Eocene to Miocene Lunpola<br />
Basin, central Tibet. Nature 439, 677–681.<br />
Rowley, D.B., Garzione, C.N., 2007. Stable isotope-based paleoaltimetry. Annual Review<br />
of Earth <strong>and</strong> Planetary Sciences 35, 463–508.<br />
Royer, D.L., 1999. Depth to pedogenic carbonate horizon as a paleoprecipitation<br />
indicator? Geology 27, 1123–1126.<br />
Royer, D.L., Berner, R.A., Beerling, D.J., 2001a. Phanerozoic atmospheric CO 2 change;<br />
evaluating geochemical <strong>and</strong> paleobiological approaches. Earth Science Reviews 54,<br />
349–392.<br />
Royer, D.L., Wing, S.L., Beerling, D.J., Jolley, D.W., Koch, P.L., Hickey, L.H., Berner, R.A.,<br />
2001b. Paleobotanical evidence for near present day levels of atmospheric CO 2<br />
during part of the Tertiary. Science 292, 2310–2313.<br />
Royer, D.L., Berner, R.A., Montañez, I.P., Tabor, N.J., Beerling, D.J., 2004. CO 2 as a primary<br />
driver of Phanerozoic climate change. GSA Today 14 (3), 4–10.<br />
Rozanski, K., Araguas-Araguas, L., Gonfiantini, R., 1993. Isotopic patterns in modern<br />
global precipitation. In: Swart, P.K., Lohmann, K.C., McKenzie, J., Savin, S. (Eds.),<br />
Climate Change in Continental Isotopic Records. Geophysical Monograph, vol. 78,<br />
pp. 1–36.<br />
Ruskin, B.G., Jordan, T.E., 2007. Climate change across continental sequence boundaries:<br />
paleopedology <strong>and</strong> lithofaces of the Iglesia Basin, northwestern Argentina. Journal<br />
of Sedimentary Research 77, 661–679.<br />
Ruxton, B.P., 1968. Measures of the degree of chemical weathering of rocks. Journal of<br />
Geology 76, 518–527.<br />
Rye, R., Holl<strong>and</strong>, H.D., 1998. Paleosols <strong>and</strong> the evolution of atmospheric oxygen: a<br />
critical review. American Journal of Science 298, 621–672.<br />
Rye, R., Holl<strong>and</strong>, H.D., 2000. Geology <strong>and</strong> geochemistry of paleosols developed on the<br />
Hekpoort Basalt, Pretoria Group, South Africa. American Journal of Science 300,<br />
85–141.<br />
Rye, R., Kuo, P.H., Holl<strong>and</strong>, H.D., 1995. Atmospheric carbon dioxide concentrations<br />
before 2.2 billion years ago. Nature 378, 603–605.<br />
Salomons, W., Goudie, A.S., Mook, W.G., 1978. Isotopic composition of calcrete deposits<br />
from Europe, Africa <strong>and</strong> India. Earth Surface Processes 3, 43–47.<br />
Sanyal, A., Hemming, N.G., Broecker, W.S., Lea, D.W., Spero, H.J., Hanson, G.N., 1996.<br />
Oceanic pH control on the boron isotopic composition of foraminifera: evidence<br />
from culture experiments. Paleoceanography 11, 513–517.<br />
Sanyal, P., Bhattacharya, S.K., Kumar, R., Ghosh, S.K., Sangode, S.J., 2004. Mio-Pliocene<br />
monsoonal record from Himalayan forel<strong>and</strong> basin (Indian Siwalik) <strong>and</strong> its relation<br />
Please cite this article as: Sheldon, N.D., Tabor, N.J., <strong>Quantitative</strong> <strong>paleoenvironmental</strong> <strong>and</strong> <strong>paleoclimatic</strong> <strong>reconstruction</strong> using paleosols, Earth-<br />
Science Reviews (2009), doi:10.1016/j.earscirev.2009.03.004
ARTICLE IN PRESS<br />
50 N.D. Sheldon, N.J. Tabor / Earth-Science Reviews xxx (2009) xxx–xxx<br />
to vegetational change. Palaeogeography, Palaeoclimatology, Palaeoecology 205,<br />
23–41.<br />
Sarkar, A., Sarangi, S., Bhattacharya, S.K., Ray, A.K., 2003. Carbon isotopes across the<br />
Eocene-Oligocene boundary sequence of Kutch, western India: implications from<br />
oceanic productivity <strong>and</strong> pCO2 change. Geophysical Research Letters 30, 42-1–42-4.<br />
Savin, S.M., Epstein, S., 1970a. The oxygen <strong>and</strong> hydrogen geochemistry of clay mineral.<br />
Geochimica et Cosmochimica Acta 34, 25–42.<br />
Savin, S.M., Epstein, S., 1970b. The oxygen <strong>and</strong> hydrogen isotope geochemistry of ocean<br />
sediments <strong>and</strong> shales. Geochimica et Cosmochimica Acta 34, 43–63.<br />
Savin, S.M., Hsieh, J.C.C., 1998. The hydrogen <strong>and</strong> oxygen isotope geochemistry of<br />
pedogenic lay minerals; principles <strong>and</strong> theoretical background. Geoderma 82,<br />
227–253.<br />
Savin, S.M., Lee, M., 1988. Isotopic studies of phyllosilicates. Reviews in Mineralogy 19,<br />
189–223.<br />
Sayyed, M.R., Hundekari, S.M., 2006. Preliminary comparison of ancient bole beds <strong>and</strong><br />
modern soils developed upon the Deccan volcanic basalts around Pune (India):<br />
potential for <strong>paleoenvironmental</strong> <strong>reconstruction</strong>. Quaternary International 156–<br />
157, 189–199.<br />
Schaetzl, R.J., Anderson, S., 2005. Soils; genesis <strong>and</strong> geomorphology. Cambridge<br />
University Press, New York. 817 pp.<br />
Schlesinger, W.H., 1985. The formation of caliche soils in the Mojave Desert, California.<br />
Geochimica et Cosmochimica Acta 49, 57–66.<br />
Schlesinger, W.H., 1997. Biogeochemistry: an analysis of global change. Academic Press,<br />
San Diego. 588 pp.<br />
Schroeder, P.A., Melear, N.D., 1999. Stable carbon isotope signatures preserved in<br />
authigenic gibbsite from a forested granitic-regolith: Panola Mt., Georgia, USA.<br />
Geoderma 91, 261–279.<br />
Schroeder, P.A., Austin, J.C., Dowd, J.F., 2006. Estimating long-term soil respiration rates<br />
from carbon isotopes occluded in gibbsite. Geochimica et Cosmochimica Acta 70,<br />
5692–5697.<br />
Sclater, J.G., Christie, P.A.F., 1980. Continental stretching: an explanation of post-mid-<br />
Cretaceous subsidence of the central North Sea basin. Journal of Geophysical<br />
Research 85, 3711–3939.<br />
Scotchman, I.C., 1991. The geochemistry of concretions from the Kimmeridge Clay<br />
Formation of southern <strong>and</strong> eastern Engl<strong>and</strong>. Sedimentology 38, 79–106.<br />
Semeniuk, V., Meagher, T.D., 1981. Calcrete in Quaternary coastal dunes in southwestern<br />
Australia; a capillary-rise phenomenon associated with plants. Journal of<br />
Sedimentary Research 51, 47–68.<br />
Sharp, Z., 2007. Principles of Stable isotope Geochemistry. Prentice Hall, New York. 360<br />
pp.<br />
Sheldon, N.D., 2003. Pedogenesis <strong>and</strong> geochemical alteration of the picture gorge<br />
subgroup, Columbia River Basalt, Oregon. Geological Society of America Bulletin<br />
115, 1377–1387.<br />
Sheldon, N.D., 2005. Do red beds indicate <strong>paleoclimatic</strong> conditions? a Permian case<br />
study. Palaeogeography, Palaeoclimatology, Palaeoecology 228, 305–319.<br />
Sheldon, N.D., 2006a. Abrupt chemical weathering increase across the Permian–Triassic<br />
boundary. Palaeogeography, Palaeoclimatology, Palaeoecology 231, 315–321.<br />
Sheldon, N.D., 2006b. Precambrian paleosols <strong>and</strong> atmospheric CO 2 levels. Precambrian<br />
Research 147, 148–155.<br />
Sheldon, N.D., 2006c. Quaternary glacial–interglacial climate cycles in Hawaii. Journal of<br />
Geology 114, 367–376.<br />
Sheldon, N.D., 2006d. Using paleosols of the picture Gorge Basalt to reconstruct the<br />
middle Miocene climatic optimum. Paleobios 26, 27–36.<br />
Sheldon, N.D., 2008. C 4 ecosystems in Montana throughout the Neogene. Geological<br />
Society of America Abstracts with Programs 40 (7), 126–127.<br />
Sheldon, N.D., 2009. Non-marine records of climatic change across the Eocene-<br />
Oligocene transition. In: Koeberl, C., Montanari, A. (Eds.), The Late Eocene Earth -<br />
Hothouse, Icehouse, <strong>and</strong> Impacts: Geological Society of America Special Paper,<br />
vol. 452, pp. 241–248.<br />
Sheldon, N.D., Retallack, G.J., 2001. Equation for compaction of paleosols due to burial.<br />
Geology 29, 247–250.<br />
Sheldon, N.D., Retallack, G.J., 2002. Low oxygen levels in earliest Triassic soils. Geology<br />
30, 919–922.<br />
Sheldon, N.D., Retallack, G.J., 2003. Low oxygen levels in earliest Triassic soils: Comment<br />
<strong>and</strong> Reply. Geology 31, e20–21.<br />
Sheldon, N.D., Retallack, G.J., 2004. Regional Paleoprecipitation Records from the Late<br />
Eocene <strong>and</strong> Oligocene of North America. Journal of Geology 112, 487–494.<br />
Sheldon, N.D., Retallack, G.J., 2007. Non-marine records of climatic change across the<br />
Eocene–Oligocene transition. Geological Society of America Penrose Conference:<br />
The Late Eocene Earth, pp. 66–68.<br />
Sheldon, N.D., Retallack, G.J., Tanaka, S., 2002. Geochemical climofunctions from North<br />
America soils <strong>and</strong> application to paleosols across the Eocene–Oligocene boundary<br />
in Oregon. Journal of Geology 110, 687–696.<br />
Sheldon, N.D., Mitchell, R.L., Collinson, M.E., Hooker, J.J., 2009. Eocene-Oligocene<br />
transition paleoclimate record from paleosols, Isle of Wight (UK). In: Koeberl, C.,<br />
Montanari, A. (Eds.), The Late Eocene Earth - Hothouse, Icehouse, <strong>and</strong> Impacts:<br />
Geological Society of America Special Paper, vol. 452, pp. 241–248.<br />
Sheppard, S.M.F., 1977. The Conubian Bathoith, SW Engl<strong>and</strong>; D/H <strong>and</strong> 18 O/ 16 O studies of<br />
kaolinite <strong>and</strong> other alteration minerals. Journal of the Geological Society London<br />
133, 573–591.<br />
Sheppard, S.M.F., Gilg, H.A., 1996. Stable isotope geochemistry of clay minerals; the story<br />
of sloppy, sticky, lumpy <strong>and</strong> tough, Cairns–Smith (1971). Clay Min. 31, 1–24.<br />
Sheppard, S.M.F., Gustafson, L.B., 1976. Oxygen <strong>and</strong> hydrogen isotopes in porphyry<br />
copper-deposit at El Salvador, Chile. Economic Geology 71, 1549–1559.<br />
Sheppard, S.M.F., Taylor, H.P., 1974. Hydrogen <strong>and</strong> oxygen isotope evidence for<br />
the origins of water in the Boulder batholith <strong>and</strong> the Butte Ore deposits,<br />
Montana. Economic Geology <strong>and</strong> Bulletin of the Society of Economic Geology<br />
69, 926–946.<br />
Sheppard, S.M.F., Nielsen, R.L., Taylor Jr., H.P., 1969. Oxygen <strong>and</strong> hydrogen isotope ratios<br />
of clay minerals fro porphyry copper deposits. Economic Geology 64, 755–777.<br />
Simeone, R., Dilles, J.H., Padalino, G., Palomba, M., 2005. Mineralogical <strong>and</strong> stable isotope<br />
studies of kaolin deposits; shallow epithermal systems of western Sardinia, Italy.<br />
Economic Geology <strong>and</strong> Bulletin of the Society of Economic Geology 100, 115–130.<br />
Sinha, A., Stott, L.D., 1994. New atmospheric pCO 2 estimates from paleosols during the<br />
late Paleocene early Eocene global warming interval. Global <strong>and</strong> Planetary Change<br />
9, 297–307.<br />
Sinha, R., T<strong>and</strong>on, S.K., Sanyal, P., Gibling, M.R., Stuben, D., Berner, Z., Ghazanfari, P.,<br />
2006. Calcretes from a Late Quaternary interfluve in the Ganga Plains, India:<br />
carbonate types <strong>and</strong> isotopic systems in a monsoonal setting. Palaeogeography,<br />
Palaeoclimatology, Palaeoecology 242, 214–239.<br />
Sleep, N.H., 2004. Archaean palaeosols <strong>and</strong> Archaean air. Nature 432. doi:10.1038/<br />
nature03167.<br />
Smith, R., Botha, J., 2005. The recovery of terrestrial vertebrate diversity in the South<br />
African Karoo Basin after the end-Permian extinction. Comptes Rendus Paleovol 4,<br />
623–636.<br />
Soil Survey Staff, 1975. Soil Taxonomy: United States Department of Agriculture<br />
H<strong>and</strong>book no. 436. Washington D.C., 754 pp.<br />
Soil Survey Staff, 2003. Keys to Soil Taxonomy, 9th ed. USDA-ARS, Washington, DC.<br />
Soil Survey Staff, 2006. Keys to Soil Taxonomy, 10th ed. USDA-Natural Resources<br />
Conservation Service, Washington, D.C. 341 pp.<br />
Soloman, D.K., Cerling, T.E., 1987. The annual carbon dioxide cycle in a montane soil:<br />
observations, modeling, <strong>and</strong> implications for weathering. Water Resources<br />
Research 23, 2257–2265.<br />
Sparks, D.L., 2003. Environmental Soil Chemistry. Academic Press, San Diego. 352 pp.<br />
Spencer, E., 1925. On some occurrences of spherulitic siderite <strong>and</strong> other carbonates in<br />
sediments. Journal of the Geological Society London 81, 667–705.<br />
Srivastava, P., 2001. Paleoclimatic implications of pedogenic carbonate in Holocene soils<br />
of the Gangetic Plains. Palaeogeography Palaeoclimatology Palaeoecology 172,<br />
207–259.<br />
Srivastava, P., Bhattacharyya, T., Pal, D.K., 2002. Significance of the formation of calcium<br />
carbonate minerals in the pedogenesis <strong>and</strong> management of cracking clay soils<br />
(Vertisols) of India. Clays <strong>and</strong> Clay Research 50, 111–126.<br />
Srodon, J., 1999. Use of clay minerals in reconstructing geological processes; recent<br />
advances <strong>and</strong> some perspectives. Clay Minerals 34, 27–37.<br />
Stern, L.A., Chamberlain, C.P., Reynolds, R.C., Johnson, G.D., 1997. Oxygen isotope<br />
evidence of climate change from pedogenic clay minerals in the Himalayan<br />
molasses. Geochimica et Cosmochimica Acta 61, 731–744.<br />
Stewart, R.N.T., Fallick, A.E., Haszeldine, R.S., 1994. Kaolinite growth during pore-water<br />
mixing – isotopic data from Paleocene s<strong>and</strong>s, North-Sea, UK. Clay Minerals 29,<br />
627–636.<br />
Stiles, C.A., Stensvold, K.A., 2008. Loess contribution to soils forming on dolostone in the<br />
Driftless Area of Wisconsin. Soil Science Survey of America Journal 72, 650–659.<br />
Stiles, C.A., Mora, C.I., Driese, S.G., 2001. Pedogenic iron-manganese nodules in Vertisols:<br />
a new proxy for paleoprecipitation? Geology 29, 943–946.<br />
Stiles, C.A., Mora, C.I., Driese, S.G., 2003. Pedogenic processes <strong>and</strong> domain boundaries in<br />
a Vertisol climosequence: evidence from titanium <strong>and</strong> zirconium distribution <strong>and</strong><br />
morphology. Geoderma 116, 279–299.<br />
Stoops, G., 1983. SEM <strong>and</strong> light microscopic observations of minerals in bog-ores of the<br />
Belgian Campine. Geoderma 30, 179–186.<br />
Strauss, H., Peters-Kottig, W., 2003. The Paleozoic to Mesozoic carbon cycle revisited:<br />
the carbon isotopic composition of terrestrial organic matter. Geochemistry,<br />
Geophysics, Geosystems 4, 1–12. doi:10.1029/2003GC000555.<br />
Strömberg, C.A.E., 2002. The origin <strong>and</strong> spread of grass-dominated ecosystems in the<br />
Late Tertiary of North America: preliminary results concerning the evolution of<br />
hypsodonty. Palaeogeography Palaeoclimatology Palaeoecology 177, 59–75.<br />
Stute, M., Schlosser, P., 1993. Principles <strong>and</strong> applications of the nobel gas paleothermometer.<br />
In: Swart, P.K., Lohmann, K.C., McKenzie, J., Savin, S. (Eds.), Climate Change<br />
in Continental Isotopic Records. Geophysical Monograph, vol. 78, pp. 89–100.<br />
Stute, M., Schlosser, P., Clark, J.F., Broecker, W.S., 1992. Paleotemperatures in the<br />
southwestern United States derived from noble gas measurements in groundwater.<br />
Science 256, 1000–1003.<br />
Suchecki, R.K., Hubert, J.F., Dewet, C.C.B., 1988. Isotopic imprint of climate <strong>and</strong><br />
hydrogeochemistry on terrestrial strata of the Triassic-Jurassic Hartford <strong>and</strong><br />
Fundy Rift Basins. Journal of Sedimentary Petrology 58, 801–811.<br />
Suzuoki, T., Epstein, S., 1976. Hydrogen isotope fractionation between OH-bearing<br />
minerals <strong>and</strong> water. Geochimica et Cosmochimica Acta 40, 1229–1240.<br />
Tabor, N.J., 2007. Permo-Pennsylvanian palaeotemperatures from Fe-Oxide <strong>and</strong><br />
phyllosilicate δ 18 O values. Earth Planetary Science Letters 253, 159–171.<br />
Tabor, N.J., Montañez, I.P., 2002. Shifts in late Paleozoic atmospheric circulation over<br />
western equatorial Pangea: insights from pedogenic mineral δ 18 O compositions.<br />
Geology 30, 1127–1130.<br />
Tabor, N.J., Montañez, I.P., 2004. Morphology <strong>and</strong> distribution of fossil soils in the<br />
Permo-Pennsylvanian Wichita <strong>and</strong> Bowie Groups, north-central Texa, USA:<br />
implications for western equatorial Pangean palaeoclimate during the icehousegreenhouse<br />
transition. Sedimentology 51, 851–884.<br />
Tabor, N.J., Montañez, I.P., 2005. Oxygen <strong>and</strong> hydrogen isotope compositions of Permian<br />
pedogenic phyllosilicates: development of modern surface domain arrays <strong>and</strong><br />
implications for paleotemperature <strong>reconstruction</strong>s. Palaeogeography, Palaeoclimatology,<br />
Palaeoecology 223, 127–146.<br />
Tabor, N.J., Yapp, C.J., 2005a. Coexisting goethite <strong>and</strong> gibbsite from a high-paleolatitude<br />
(55°N) Late Paleocene laterite: concentration <strong>and</strong> 13 C/ 12 C ratios of occluded CO 2<br />
<strong>and</strong> associated organic matter. Geochimica et Cosmochimica Acta 69, 5495–5510.<br />
Please cite this article as: Sheldon, N.D., Tabor, N.J., <strong>Quantitative</strong> <strong>paleoenvironmental</strong> <strong>and</strong> <strong>paleoclimatic</strong> <strong>reconstruction</strong> using paleosols, Earth-<br />
Science Reviews (2009), doi:10.1016/j.earscirev.2009.03.004
ARTICLE IN PRESS<br />
N.D. Sheldon, N.J. Tabor / Earth-Science Reviews xxx (2009) xxx–xxx<br />
51<br />
Tabor, N.J., Yapp, C.J., 2005b. Incremental vacuum dehydration–decarbonation experiments<br />
on a natural gibbsite (α-Al(OH) 3 ): CO 2 abundance <strong>and</strong> δ 13 C values.<br />
Geochimica et Cosmochimica Acta 69, 519–527.<br />
Tabor, N.J., Yapp, C.J., 2005c. Juxtaposed Permian <strong>and</strong> Pleistocene isotopic archives:<br />
Surficial environments recorded in calcite <strong>and</strong> goethite from the Wichita<br />
Mountains, Oklahoma. Geological Society of America Special Paper 395, 55–70.<br />
Tabor, N.J., Montañez, I.P., Southard, R.J., 2002. Mineralogical <strong>and</strong> stable isotopic analysis<br />
of pedogenic proxies in Permo-Pennsylvanian paleosols: Implications for paleoclimate<br />
<strong>and</strong> paleoatmospheric circulation. Geochimica et Cosmochimica Acta 66,<br />
3093–3107.<br />
Tabor, N.J., Montañez, I.P., Zierenberg, R., Currie, B.S., 2004a. Mineralogical <strong>and</strong><br />
geochemical evolution of a basalt-hosted fossil soil (Late Triassic, Ischigualasto<br />
Formation, northwest Argentina); Potential for <strong>paleoenvironmental</strong> <strong>reconstruction</strong>.<br />
Geological Society of America Bulletin 116, 1280–1293.<br />
Tabor, N.J., Yapp, C.J., Montañez, I.P., 2004b. Goethite, calcite, <strong>and</strong> organic matter from<br />
Permian <strong>and</strong> Triassic soils: carbon isotopes <strong>and</strong> CO 2 concentrations. Geochimica et<br />
Cosmochimica Acta 68, 1503–1517.<br />
Tabor, N.J., Montanez, I.P., Kelso, K.A., Currie, B.S., Shippman, T.A., 2006. A late Triassic<br />
soil catena: l<strong>and</strong>scape controls on paleosol morphology across the Carnian–Age<br />
Ischigualasto–Villa Union Basin, Northwestern Argentina. In: Alonso-Zarza, A.M.,<br />
Tanner, L.H. (Eds.), Paleoenvironmental Record <strong>and</strong> Applications of Calcretes <strong>and</strong><br />
Palustrine Carbonates. Geological Society of America Special Paper, vol. 416, pp.<br />
17–41.<br />
Tabor, N.J., Montanez, I.P., Steiner, M., Schwindt, D., 2007. The δ 13 C values of Permo-<br />
Triassic carbonates from South Africa reflect a stinking, sulfurous swamp, not<br />
atmospheric conditions. Palaeogeography, Palaeoclimatology, Palaeoecology 225,<br />
370–381.<br />
Takashima, R., Nishi, H., Huber, B.T., Leckie, R.M., 2006. Greenhouse world <strong>and</strong> the<br />
Mesozoic Ocean. Oceanography 19, 82–93.<br />
Takeuchi, A., Larson, P.B., Suzuki, K., 2007. Influence of paleorelief on the Mid-Miocene<br />
climate variation in southeastern Washington, northeastern Oregon <strong>and</strong> western<br />
Idaho, USA. Palaeogeography, Palaeoclimatology, Palaeoecology 254, 462–476.<br />
T<strong>and</strong>on, S.K., Sood, A., Andrews, J.E., Dennis, P.F., 1995. Paleoenvironments of the<br />
dinosaur-bearing Lameta Beds (Maastrichtian), Narmada Valley, central India.<br />
Palaeogeography, Palaeoclimatology, Palaeoecology 117, 153–184.<br />
Tardy, Y., Kobilsek, B., Roquin, C., Paquet, H., 1990a. Influence of Periatlantic climates <strong>and</strong><br />
paleoclimates on the distribution <strong>and</strong> mineralogical composition of bauxites <strong>and</strong><br />
ferricretes. Chemical Geology 84, 179–182.<br />
Tardy, Y., Koilsek, B., Roquin, C., Paquet, H., 1990b. Influence of Periatlantic climates <strong>and</strong><br />
paleoclimates on the distribution <strong>and</strong> mineralogical composition of bauxites <strong>and</strong><br />
ferricretes. Geochemistry of the Earth's Surface <strong>and</strong> of Mineral Formation 2,<br />
179–181.<br />
Taylor Jr., H.P., Epstein, S., 1964. Comparison of Oxygen Isotope Analysies of Tektites,<br />
Soils, <strong>and</strong> Impactite Glasses, Chapter 14. North-Holl<strong>and</strong> Publishing, Amsterdam, pp.<br />
181–199.<br />
Terry, D.O., 2001. Paleopedology of the Chadron Formation of northwestern Nebraska:<br />
implications for <strong>paleoclimatic</strong> change in the North American mid-continent across<br />
the Eocene–Oligocene boundary. Palaeogeography, Palaeoclimatology, Palaeoecology<br />
168, 1–38.<br />
Thornthwaite, C., 1948. An approach toward a rational classification of climate.<br />
Geographical Reviews 38, 55–94.<br />
Tipple, B.J., Pagani, M., 2007. The early origins of terrestrial C 4 photosynthesis. Annual<br />
Reviews of Earth <strong>and</strong> Planetary Sciences 35, 435–461.<br />
Trueman, C.N., 1999. Rare earth element geochemistry <strong>and</strong> taphonomy of terrestrial<br />
vertebrate assemblages. Palaios 14, 555–568.<br />
Tyler, G., 2004. Rare earth elements in soil <strong>and</strong> plant systems – a review. Plant <strong>and</strong> Soil<br />
267, 191–206.<br />
Ufnar, D.F., Gonzalez, L.A., Ludvigson, G.A., Brenner, R.L., Witzke, B.J., 2002. The mid-<br />
Cretaceous water bearer: isotope mass balance quantification of the Albian<br />
hydrologic cycle. Palaeogeography, Palaeoclimatology, Palaeoecology 188, 51–71.<br />
Ufnar, D.F., Ludvigson, G.A., Gonzalez, L.A., Brenner, R.L., Witzke, B.J., 2004. High latitude<br />
meteoric 18 O compositions: Paleosol siderite in the Middle Cretaceous Nanushuk<br />
Formation, North Slope, Alaska. Geological Society of America Bulletin 16, 463–473.<br />
Uhl, D., Klotz, S., Traiser, C., Thiel, C., Utescher, T., Kowalski, E., Dilcher, D., 2007. Cenozoic<br />
paleotemperatures <strong>and</strong> leaf physiognomy: a European perspective. Palaeogeography,<br />
Palaeoclimatology, Palaeoecology 248, 24–31.<br />
Utescher, T., Mosbrugger, V., 2007. Eocene vegetation patterns reconstructed from plant<br />
diversity: a global perspective. Palaeogeography, Palaeoclimatology, Palaeoecology<br />
247, 243–271.<br />
Uysal, I.T., Golding, S.D., Baublys, K., 2000. Stable isotope geochemistry of authigenic<br />
clay minerals from Late Permian coal measures, Queensl<strong>and</strong>, Australia; implications<br />
for the evolution of the Bowen Basin. Earth Planetary Science Letters 180, 149–162.<br />
Valley, J.W., Taylor Jr., H.P., O'Neil, J.R., 1986. Stable isotopes in high temperature<br />
geological processes. Reviews in Mineralogy 16 570 pp.<br />
van der Weijden, C.H., van der Weijden, R.D., 1995. Mobility of major, minor <strong>and</strong> some<br />
redox-sensitive trace elements <strong>and</strong> rare-earth elements during weathering of four<br />
granitoids in central Portugal. Chemical Geology 125, 149–167.<br />
Van Houten, F.B., 1961. Climatic significance of red beds. In: Nairn, A.E.M. (Ed.),<br />
Descriptive paleoclimatology. Interscience Publishers, pp. 89–139.<br />
Van Houten, F.B., 1982. Ancient soils <strong>and</strong> ancient climates. Climate in Earth History, U.S.<br />
National Research Council, Geophysics Study Committee, pp. 112–117.<br />
Vepraskas, M.J., 1992. Redoximorphic features for identifying aquic conditions:North<br />
Carolina Agricultural Research Service, Raleigh, North Carolina. Technical Bulletin,<br />
vol. 301. 33 pp.<br />
Vinogradov, A.P., 1959. Geochemistry of Core <strong>and</strong> Dispersed Chemical Elements in Soils.<br />
Translated by Consultants Bureau, New York. 209 pp.<br />
Vitali, F., Longstaffe, F.J., Bird, M.I., Caldwell, W.G.E., 2000. Oxygen-isotope fraction<br />
between aluminum-hydroxide phases <strong>and</strong> water at b 60 degree C: results of<br />
decade-long synthesis experiments. Clay <strong>and</strong> Clay Minerals 48, 230–237.<br />
Vitali, F., Longstaffe, F.J., Bird, M.I., Gage, K.L., Caldwell, W., Glen, E., 2001. Hydrogenisotope<br />
fractionation in aluminum hydroxides; synthesis products versus natural<br />
samples from bauxites. Geochimica et Cosmochimica Acta 65, 1391–1398.<br />
Vitali, F., Longstaffe, F.J., McCarthy, Plint, P.J., Guy, A., Caldwell, W., Glen, E., 2002. Stable<br />
isotopic investigation of clay minerals <strong>and</strong> pedogenesis in an interfluve paleosol<br />
from the Ceonomanian Dunvegan Formation, N.E. British Columbia, Canada.<br />
Chemical Geology 192, 269–287.<br />
Volk, T., 1987. Feedbacks between weathering <strong>and</strong> atmospheric CO 2 over the last<br />
100 million years. American Journal of Science 287, 263–279.<br />
Walter, A.V., Nahon, D., Flicoteaux, R., Girard, J.P., Melfi, A., 1995. Behaviour of major <strong>and</strong><br />
trace elements <strong>and</strong> fractionation of REE under tropical weathering of typical<br />
apatite-rich carbonatite from Brazil. Earth <strong>and</strong> Planetary Science Letters 136,<br />
591–601.<br />
Whelan III, T., Roberts, H.H., 1973. Carbon isotope composition of diagenetic carbonate<br />
nodules from freshwater swamp deposits. Journal of Sedimentary Petrology 43,<br />
54–58.<br />
Whelan, J.F., Cobb, J.C., Rye, R.O., 1998. Stable isotope geochemistry of sphalerite <strong>and</strong><br />
other mineral matter in coal beds from the Illinois <strong>and</strong> Forest City basins. Economic<br />
Geology <strong>and</strong> the Bulletin of the Society of Economic Geology 83, 990–1007.<br />
Whipkey, C.E., Capo, R.C., Hsieh, J.C.C., Chadwick, O.A., 2002. Development of magnesian<br />
carbonates in Quaternary soils on the Isl<strong>and</strong> of Hawaii. Journal of Sedimentary<br />
Research 72, 138–165.<br />
White, T., Gonzalez, L., Ludvigson, G., Poulsen, C., 2001. Middle Cretaceous greenhouse<br />
hydrologic cycle of North America. Geology 29, 363–366.<br />
White, T., Witzke, B., Ludvigson, G., Brenner, R., 2005. Distinguishing base-level change<br />
<strong>and</strong> climate signals in a Cretaceous alluvial sequence. Geology 33, 13–16.<br />
Whiticar, M.J., Faber, E., Schoell, M., 1986. Biogenic methane formation in marine <strong>and</strong><br />
freshwater environments: CO 2 reductions vs. acetate fermentation — isotope<br />
evidence. Geochimica et Cosmochimica Acta 50, 693–709.<br />
Wilson, J.J., 1999. The origin <strong>and</strong> formation of clay minerals in soil; past, present <strong>and</strong><br />
future perspectives. Clay Mineralogy 34, 7–25.<br />
Wimpenny, J., Gannoun, A., Burton, K.W., Widdowson, M., James, R.H., Gíslason, S.R.,<br />
2007. Rhenium <strong>and</strong> osmium isotope <strong>and</strong> elemental behaviour accompanying<br />
latering formation in the Deccan region of India. Earth <strong>and</strong> Planetary Science Letters<br />
261, 239–258.<br />
Wolfe, J.A., 1994. Tertiary climatic changes at middle latitudes of western North<br />
America. Palaeogeography, Palaeoclimatology, Palaeoecology 108, 195–205.<br />
Wood, W.W., Petraitis, M.J., 1984. Origin <strong>and</strong> distribution of carbon dioxide in the<br />
unsaturated zone of the southern high plains of Texas. Water Resources 20,<br />
1193–1208.<br />
Yamaguchi, M., Flocker, W.J., Howard, F.D., 1967. Soil atmosphere as influenced by<br />
Temperature <strong>and</strong> Moisture. Soil Science Society of America Proceedings 31,164–167.<br />
Yapp, C.J., 1987a. Oxygen <strong>and</strong> hydrogen isotope variations among goethites (α-FeOOH)<br />
<strong>and</strong> the determination of paleotemperatures. Geochimica et Cosmochimica Acta 51,<br />
945–957.<br />
Yapp, C.J., 1987b. A possible goethite-iron (III) carbonate solid solution <strong>and</strong> the<br />
determination of CO 2 partial pressures in low temperature geologic systems.<br />
Chemical Geology 64, 259–268.<br />
Yapp, C.J., 1990. Oxygen isotopes in iron (III) oxides 1. mineral-water fractionation<br />
factors. Chemical Geology 85, 329–355.<br />
Yapp, C.J., 1993a. The stable isotope geochemistry of low temperature Fe(III) <strong>and</strong> Al<br />
“Oxides” with implications for continental paleoclimates. In: Swart, P.K., Lohmann,<br />
K.C., McKenzie, J., Savin, S. (Eds.), Climate Change in Continental Isotopic Records.<br />
Geophysical Monograph, vol. 78, pp. 285–294.<br />
Yapp, C.J., 1993b. Paleoenvironment <strong>and</strong> oxygen isotope geochemistry of ironstone of<br />
the Upper Orovician Neda Formation, Wisconsin, USA. Geochimica et Cosmochimica<br />
Acta 57, 2319–2327.<br />
Yapp, C.J., 1998. Paleoenvironmental interpretations of oxygen isotope ratios in oolitic<br />
ironstones. Geochimica et Cosmochimica Acta 62, 2409–2420.<br />
Yapp, C.J., 2000. Climatic implications of surface domains in arrays of δD <strong>and</strong> δ 18 O from<br />
hydroxyl minerals: Geothite as an example. Geochimica et Cosmochimica Acta 64,<br />
2009–2025.<br />
Yapp, C.J., 2001a. Mixing of CO 2 in surficial environments as recorded by the<br />
concentration <strong>and</strong> δ 13 C values of the Fe(CO 3 )OH component in goethite.<br />
Geochimica et Cosmochimica Acta 65, 4115–4130.<br />
Yapp, C.J., 2001b. Rusty relics of earth history: Iron (III) oxides, isotopes, <strong>and</strong> surficial<br />
environments. Annual Review of Earth <strong>and</strong> Planetary Sciences 29, 165–199.<br />
Yapp, C.J., 2002. ERRATUM. Geochim. Cosmochim. Acta 66, 1497.<br />
Yapp, C.J., 2004. Fe(CO)OH in goethite from a mid-latitude North American Oxisol:<br />
estimate of atmospheric CO 2 concentration in the Early Eocene “climatic optimum”.<br />
Geochim. Cosmochim. Acta 68, 935–947.<br />
Yapp, C.J., Pedley, M.D., 1985. Stable hydrogen isotopes in iron oxides. II. D/H variations<br />
among natural goethites. Geochimica et Cosmochimica Acta 49, 487–495.<br />
Yapp, C.J., Poths, H., 1991. 13 C/ 12 C ratios of the Fe(III) carbonate component in natural<br />
goethites. In: Taylor, H.P., O'Neil, J.R., Kaplan, I.R., I.R. (Eds.), Stable Isotope<br />
Geochemistry: A Tribute to Samuel Epstein. The Geochemical Society, San Antonio,<br />
U.S.A., pp. 257–270.<br />
Yapp, C.J., Poths, H., 1992. Ancient atmospheric CO 2 pressures inferred from natural<br />
goethites. Nature, 355, 342–344.<br />
Yapp, C.J., Poths, H., 1993. The carbon isotope geochemistry of gtoethite (α-FeOOH) in<br />
ironstone of the Upper Ordovician Neda Formation, Wisconsin, USA: implications<br />
for early Paleozoic continental environments. Geochimica et Cosmochimica Acta,<br />
57, 2599–2611.<br />
Please cite this article as: Sheldon, N.D., Tabor, N.J., <strong>Quantitative</strong> <strong>paleoenvironmental</strong> <strong>and</strong> <strong>paleoclimatic</strong> <strong>reconstruction</strong> using paleosols, Earth-<br />
Science Reviews (2009), doi:10.1016/j.earscirev.2009.03.004
ARTICLE IN PRESS<br />
52 N.D. Sheldon, N.J. Tabor / Earth-Science Reviews xxx (2009) xxx–xxx<br />
Yapp, C.J., Poths, H., 1996. Carbon isotopes in continental weathering environments <strong>and</strong><br />
variations in ancient atmospheric CO 2 pressure. Earth Planetary Science Letters 137,<br />
71–82.<br />
Yeh, H.W., 1980. D/H ratios <strong>and</strong> late-stage dehydration of shale during burial.<br />
Geochimica et Cosmochimica Acta 44, 341–352.<br />
Yeh, H.-W., Epstein, S., 1978. Hydrogen isotope exchange between clay minerals <strong>and</strong> sea<br />
water. Geochimica et Cosmochimica Acta 42, 140–143.<br />
Yeh, H.-W., Savin, S.M., 1977. Mechanism of burial metamorphism on argillaceous<br />
sediments, 3. Oxygen isotope evidence. Geological Society of America Bulletin 88,<br />
1321–1330.<br />
Yemane, K., Siegenthaler, C., Kelts, K., 1989. Lacustrine environment during Lower<br />
Beaufort (Upper Permian) Karoo deposition in northern Malawi. Palaeogeography<br />
Palaeoclimatology Palaeoecology 70, 165–178.<br />
Yiu, T.F., Chang, S.S., 1999. Formation conditions of vesicle/fissure-filling smectites in<br />
Penghu basalts; a stable isotope assessment. Clay Minerals 34, 381–393.<br />
Yurtsever, Y., Gat, J.R., 1981. Atmospheric waters. In: Gat, J.R., Gonfiantini, R. (Eds.),<br />
Stable Isotope Hydrology: Deuterium <strong>and</strong> Oxygen-18 in the Water Cycle. IAEA<br />
Technical Reprint Series, vol. 210, pp. 103–142.<br />
Zbinden, E.A., Holl<strong>and</strong>, H.D., Feakes, C.R., 1988. The Sturgeon Falls paleosol <strong>and</strong> the<br />
composition of the atmosphere 1.1 Ga BP. Precambrian Research 42, 141–163.<br />
Zhang, G.-L., Pan, J.-H., Huang, C.-M., Gong, Z.-T., 2007. Geochemical features of a soil<br />
chronosequence developed on basalt in Hainan Isl<strong>and</strong>, China. Revista Mexicana de<br />
Ciencias Geológicos 24, 261–269.<br />
Ziegler, C.L., Murray, R.W., Hovan, S.A., Rea, D.K., 2007. Resolving eolian, volcanogenic,<br />
<strong>and</strong> authigenic components in pelagic sediment from the Pacific Ocean. Earth <strong>and</strong><br />
Planetary Science Letters 254, 416–432.<br />
Please cite this article as: Sheldon, N.D., Tabor, N.J., <strong>Quantitative</strong> <strong>paleoenvironmental</strong> <strong>and</strong> <strong>paleoclimatic</strong> <strong>reconstruction</strong> using paleosols, Earth-<br />
Science Reviews (2009), doi:10.1016/j.earscirev.2009.03.004