Iowa Core K-12 Mathematics (PDF) - Green Hills AEA
Iowa Core K-12 Mathematics (PDF) - Green Hills AEA
Iowa Core K-12 Mathematics (PDF) - Green Hills AEA
Create successful ePaper yourself
Turn your PDF publications into a flip-book with our unique Google optimized e-Paper software.
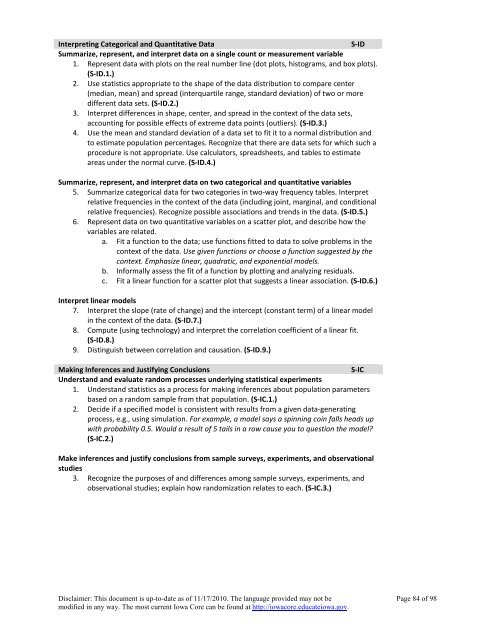
Interpreting Categorical and Quantitative Data<br />
S-ID<br />
Summarize, represent, and interpret data on a single count or measurement variable<br />
1. Represent data with plots on the real number line (dot plots, histograms, and box plots).<br />
(S-ID.1.)<br />
2. Use statistics appropriate to the shape of the data distribution to compare center<br />
(median, mean) and spread (interquartile range, standard deviation) of two or more<br />
different data sets. (S-ID.2.)<br />
3. Interpret differences in shape, center, and spread in the context of the data sets,<br />
accounting for possible effects of extreme data points (outliers). (S-ID.3.)<br />
4. Use the mean and standard deviation of a data set to fit it to a normal distribution and<br />
to estimate population percentages. Recognize that there are data sets for which such a<br />
procedure is not appropriate. Use calculators, spreadsheets, and tables to estimate<br />
areas under the normal curve. (S-ID.4.)<br />
Summarize, represent, and interpret data on two categorical and quantitative variables<br />
5. Summarize categorical data for two categories in two-way frequency tables. Interpret<br />
relative frequencies in the context of the data (including joint, marginal, and conditional<br />
relative frequencies). Recognize possible associations and trends in the data. (S-ID.5.)<br />
6. Represent data on two quantitative variables on a scatter plot, and describe how the<br />
variables are related.<br />
a. Fit a function to the data; use functions fitted to data to solve problems in the<br />
context of the data. Use given functions or choose a function suggested by the<br />
context. Emphasize linear, quadratic, and exponential models.<br />
b. Informally assess the fit of a function by plotting and analyzing residuals.<br />
c. Fit a linear function for a scatter plot that suggests a linear association. (S-ID.6.)<br />
Interpret linear models<br />
7. Interpret the slope (rate of change) and the intercept (constant term) of a linear model<br />
in the context of the data. (S-ID.7.)<br />
8. Compute (using technology) and interpret the correlation coefficient of a linear fit.<br />
(S-ID.8.)<br />
9. Distinguish between correlation and causation. (S-ID.9.)<br />
Making Inferences and Justifying Conclusions<br />
S-IC<br />
Understand and evaluate random processes underlying statistical experiments<br />
1. Understand statistics as a process for making inferences about population parameters<br />
based on a random sample from that population. (S-IC.1.)<br />
2. Decide if a specified model is consistent with results from a given data-generating<br />
process, e.g., using simulation. For example, a model says a spinning coin falls heads up<br />
with probability 0.5. Would a result of 5 tails in a row cause you to question the model?<br />
(S-IC.2.)<br />
Make inferences and justify conclusions from sample surveys, experiments, and observational<br />
studies<br />
3. Recognize the purposes of and differences among sample surveys, experiments, and<br />
observational studies; explain how randomization relates to each. (S-IC.3.)<br />
Disclaimer: This document is up-to-date as of 11/17/2010. The language provided may not be Page 84 of 98<br />
modified in any way. The most current <strong>Iowa</strong> <strong>Core</strong> can be found at http://iowacore.educateiowa.gov.


