Iowa Core K-12 Mathematics (PDF) - Green Hills AEA
Iowa Core K-12 Mathematics (PDF) - Green Hills AEA
Iowa Core K-12 Mathematics (PDF) - Green Hills AEA

Create successful ePaper yourself
Turn your PDF publications into a flip-book with our unique Google optimized e-Paper software.
<strong>Mathematics</strong> | High School—Modeling<br />
Modeling links classroom mathematics and statistics to everyday life, work, and decision-making. Modeling is the<br />
process of choosing and using appropriate mathematics and statistics to analyze empirical situations, to<br />
understand them better, and to improve decisions. Quantities and their relationships in physical, economic, public<br />
policy, social, and everyday situations can be modeled using mathematical and statistical methods. When making<br />
mathematical models, technology is valuable for varying assumptions, exploring consequences, and comparing<br />
predictions with data.<br />
A model can be very simple, such as writing total cost as a product of unit price and number bought, or using a<br />
geometric shape to describe a physical object like a coin. Even such simple models involve making choices. It is up<br />
to us whether to model a coin as a three-dimensional cylinder, or whether a two-dimensional disk works well<br />
enough for our purposes. Other situations—modeling a delivery route, a production schedule, or a comparison of<br />
loan amortizations—need more elaborate models that use other tools from the mathematical sciences. Real-world<br />
situations are not organized and labeled for analysis; formulating tractable models, representing such models, and<br />
analyzing them is appropriately a creative process. Like every such process, this depends on acquired expertise as<br />
well as creativity.<br />
Some examples of such situations might include:<br />
• Estimating how much water and food is needed for emergency relief in a devastated city of 3 million<br />
people, and how it might be distributed.<br />
• Planning a table tennis tournament for 7 players at a club with 4 tables, where each player plays against<br />
each other player.<br />
• Designing the layout of the stalls in a school fair so as to raise as much money as possible.<br />
• Analyzing stopping distance for a car.<br />
• Modeling savings account balance, bacterial colony growth, or investment growth.<br />
• Engaging in critical path analysis, e.g., applied to turnaround of an aircraft at an airport.<br />
• Analyzing risk in situations such as extreme sports, pandemics, and terrorism.<br />
• Relating population statistics to individual predictions.<br />
In situations like these, the models devised depend on a number of factors: How precise an answer do we want or<br />
need? What aspects of the situation do we most need to understand, control, or optimize? What resources of time<br />
and tools do we have? The range of models that we can create and analyze is also constrained by the limitations of<br />
our mathematical, statistical, and technical skills, and our ability to recognize significant variables and relationships<br />
among them. Diagrams of various kinds, spreadsheets and other technology, and algebra are powerful tools for<br />
understanding and solving problems drawn from different types of real-world situations.<br />
One of the insights provided by<br />
mathematical modeling is that<br />
essentially the same mathematical or<br />
statistical structure can sometimes<br />
model seemingly different situations.<br />
Models can also shed light on the<br />
mathematical structures themselves,<br />
for example, as when a model of<br />
bacterial growth makes more vivid<br />
the explosive growth of the exponential function.<br />
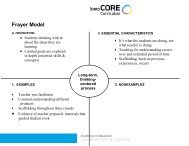
The basic modeling cycle is summarized in the diagram. It involves (1) identifying variables in the situation and<br />
selecting those that represent essential features, (2) formulating a model by creating and selecting geometric,<br />
graphical, tabular, algebraic, or statistical representations that describe relationships between the variables, (3)<br />
analyzing and performing operations on these relationships to draw conclusions, (4) interpreting the results of the<br />
mathematics in terms of the original situation, (5) validating the conclusions by comparing them with the situation,<br />
and then either improving the model or, if it is acceptable, (6) reporting on the conclusions and the reasoning<br />
behind them. Choices, assumptions, and approximations are present throughout this cycle.<br />
Disclaimer: This document is up-to-date as of 11/17/2010. The language provided may not be Page 73 of 98<br />
modified in any way. The most current <strong>Iowa</strong> <strong>Core</strong> can be found at http://iowacore.educateiowa.gov.