Iowa Core K-12 Mathematics (PDF) - Green Hills AEA
Iowa Core K-12 Mathematics (PDF) - Green Hills AEA
Iowa Core K-12 Mathematics (PDF) - Green Hills AEA

You also want an ePaper? Increase the reach of your titles
YUMPU automatically turns print PDFs into web optimized ePapers that Google loves.
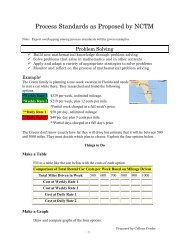
Investigate chance processes and develop, use, and evaluate probability models.<br />
5. Understand that the probability of a chance event is a number between 0 and 1 that<br />
expresses the likelihood of the event occurring. Larger numbers indicate greater<br />
likelihood. A probability near 0 indicates an unlikely event, a probability around 1/2<br />
indicates an event that is neither unlikely nor likely, and a probability near 1 indicates a<br />
likely event. (7.SP.5.)<br />
6. Approximate the probability of a chance event by collecting data on the chance process<br />
that produces it and observing its long-run relative frequency, and predict the<br />
approximate relative frequency given the probability. For example, when rolling a<br />
number cube 600 times, predict that a 3 or 6 would be rolled roughly 200 times, but<br />
probably not exactly 200 times. (7.SP.6.)<br />
7. Develop a probability model and use it to find probabilities of events. Compare<br />
probabilities from a model to observed frequencies; if the agreement is not good,<br />
explain possible sources of the discrepancy.<br />
a. Develop a uniform probability model by assigning equal probability to all<br />
outcomes, and use the model to determine probabilities of events. For<br />
example, if a student is selected at random from a class, find the probability<br />
that Jane will be selected and the probability that a girl will be selected.<br />
b. Develop a probability model (which may not be uniform) by observing<br />
frequencies in data generated from a chance process. For example, find the<br />
approximate probability that a spinning penny will land heads up or that a<br />
tossed paper cup will land open-end down. Do the outcomes for the spinning<br />
penny appear to be equally likely based on the observed frequencies? (7.SP.7.)<br />
8. Find probabilities of compound events using organized lists, tables, tree diagrams, and<br />
simulation.<br />
a. Understand that, just as with simple events, the probability of a compound<br />
event is the fraction of outcomes in the sample space for which the compound<br />
event occurs.<br />
b. Represent sample spaces for compound events using methods such as<br />
organized lists, tables and tree diagrams. For an event described in everyday<br />
language (e.g., "rolling double sixes"), identify the outcomes in the sample<br />
space which compose the event.<br />
c. Design and use a simulation to generate frequencies for compound events. For<br />
example, use random digits as a simulation tool to approximate the answer to<br />
the question: If 40% of donors have type A blood, what is the probability that it<br />
will take at least 4 donors to find one with type A blood? (7.SP.8.)<br />
Disclaimer: This document is up-to-date as of 11/17/2010. The language provided may not be Page 52 of 98<br />
modified in any way. The most current <strong>Iowa</strong> <strong>Core</strong> can be found at http://iowacore.educateiowa.gov.