Iowa Core K-12 Mathematics (PDF) - Green Hills AEA
Iowa Core K-12 Mathematics (PDF) - Green Hills AEA
Iowa Core K-12 Mathematics (PDF) - Green Hills AEA

You also want an ePaper? Increase the reach of your titles
YUMPU automatically turns print PDFs into web optimized ePapers that Google loves.
<strong>Mathematics</strong><br />
November 17, 2010
Table of Contents<br />
Introduction ....................................................................................................................... 3<br />
<strong>Mathematics</strong> | Standards for Mathematical Practice .......................................................... 8<br />
<strong>Mathematics</strong> | Kindergarten .............................................................................................................. 11<br />
<strong>Mathematics</strong> | Grade 1 ....................................................................................................................... 15<br />
<strong>Mathematics</strong> | Grade 2 ....................................................................................................................... 19<br />
<strong>Mathematics</strong> | Grade 3 ....................................................................................................................... 23<br />
<strong>Mathematics</strong> | Grade 4 ....................................................................................................................... 29<br />
<strong>Mathematics</strong> | Grade 5 ....................................................................................................................... 35<br />
<strong>Mathematics</strong> | Grade 6 ....................................................................................................................... 41<br />
<strong>Mathematics</strong> | Grade 7 ....................................................................................................................... 47<br />
<strong>Mathematics</strong> | Grade 8 ....................................................................................................................... 53<br />
<strong>Mathematics</strong> Standards for High School ............................................................................................ 58<br />
<strong>Mathematics</strong> | High School—Number and Quantity ......................................................................... 59<br />
<strong>Mathematics</strong> | High School—Algebra ................................................................................................ 63<br />
<strong>Mathematics</strong> | High School—Functions ............................................................................................. 68<br />
<strong>Mathematics</strong> | High School—Modeling ............................................................................................. 73<br />
<strong>Mathematics</strong> | High School—Geometry ............................................................................................ 75<br />
<strong>Mathematics</strong> | High School— Statistics and Probability ★ .................................................................. 82<br />
Glossary ........................................................................................................................... 88<br />
Sample of Works Consulted .............................................................................................. 95<br />
Disclaimer: This document is up-to-date as of 11/17/2010. The language provided may not be Page 2 of 98<br />
modified in any way. The most current <strong>Iowa</strong> <strong>Core</strong> can be found at http://iowacore.educateiowa.gov.
Introduction<br />
<strong>Iowa</strong> <strong>Core</strong> <strong>Mathematics</strong> includes recommendations for curriculum, instruction, and assessment, as well as<br />
standards for mathematical content and mathematical practices. In particular, <strong>Iowa</strong> <strong>Core</strong> <strong>Mathematics</strong> is built<br />
upon:<br />
• <strong>Iowa</strong> <strong>Core</strong>’s Characteristics of Effective Instruction<br />
o Teaching for Understanding<br />
o Student-Centered Classrooms<br />
o Teaching for Student Differences<br />
o Rigor and Relevance<br />
o Assessment for Learning<br />
• Common <strong>Core</strong> State Standards for <strong>Mathematics</strong><br />
o Standards for Mathematical Practice<br />
o Standards for Mathematical Content<br />
To faithfully implement <strong>Iowa</strong> <strong>Core</strong> <strong>Mathematics</strong> requires teaching with rich mathematical tasks.<br />
Rich Mathematical Tasks<br />
As stated in Common <strong>Core</strong> <strong>Mathematics</strong>, “Mathematical understanding and procedural skill are equally important,<br />
and both are assessable using mathematical tasks of sufficient richness.” (p. 6). By teaching through rich<br />
mathematical tasks, students develop deep conceptual understanding and skill proficiency. Rich mathematical<br />
tasks involve both:<br />
• Teaching through Problem Solving with Problem-Based Instructional Tasks<br />
• Using Distributed Practice that is Meaningful and Purposeful<br />
Problem-Based Instructional Tasks<br />
Problem-based instructional tasks are at the heart of teaching for understanding. A world-class mathematics<br />
curriculum should be built around rich instructional tasks focused on important mathematics.<br />
Problem-based instructional tasks:<br />
• Help students develop a deep understanding of important mathematics<br />
• Emphasize connections, across mathematical content areas, to other disciplines, and especially to the real<br />
world<br />
• Are accessible yet challenging to all<br />
• Can be solved in several ways<br />
• Encourage student engagement and communication<br />
• Encourage the use of connected multiple representations<br />
• Encourage appropriate use of intellectual, physical, and technological tools<br />
Distributed Practice that is Meaningful and Purposeful<br />
Practice is essential to learn mathematics. However, to be effective in improving student achievement, practice<br />
must be meaningful, purposeful, and distributed.<br />
Meaningful Purposeful Distributed Practice:<br />
• Meaningful: Builds on and extends understanding<br />
• Purposeful: Links to curriculum goals and targets an identified need based on multiple data sources<br />
• Distributed: Consists of short periods of systematic practice distributed over a long period of time<br />
Disclaimer: This document is up-to-date as of 11/17/2010. The language provided may not be Page 3 of 98<br />
modified in any way. The most current <strong>Iowa</strong> <strong>Core</strong> can be found at http://iowacore.educateiowa.gov.
Toward greater focus and coherence<br />
<strong>Mathematics</strong> experiences in early childhood settings should concentrate on (1) number<br />
(which includes whole number, operations, and relations) and (2) geometry, spatial<br />
relations, and measurement, with more mathematics learning time devoted to number<br />
than to other topics. Mathematical process goals should be integrated in these content<br />
areas.<br />
- <strong>Mathematics</strong> Learning in Early Childhood, National Research Council, 2009<br />
The composite standards [of Hong Kong, Korea and Singapore] have a number of<br />
features that can inform an international benchmarking process for the development of<br />
K–6 mathematics standards in the U.S. First, the composite standards concentrate the<br />
early learning of mathematics on the number, measurement, and geometry strands with<br />
less emphasis on data analysis and little exposure to algebra. The Hong Kong standards<br />
for grades 1–3 devote approximately half the targeted time to numbers and almost all<br />
the time remaining to geometry and measurement.<br />
- Ginsburg, Leinwand and Decker, 2009<br />
Because the mathematics concepts in [U.S.] textbooks are often weak, the presentation<br />
becomes more mechanical than is ideal. We looked at both traditional and nontraditional<br />
textbooks used in the US and found this conceptual weakness in both.<br />
- Ginsburg, et al., 2005<br />
There are many ways to organize curricula. The challenge, now rarely met, is to avoid<br />
those that distort mathematics and turn off students.<br />
- Steen., 2007<br />
For over a decade, research studies of mathematics education in high-performing countries have pointed to the<br />
conclusion that the mathematics curriculum in the United States must become substantially more focused and<br />
coherent in order to improve mathematics achievement in this country. To deliver on the promise of common<br />
standards, the standards must address the problem of a curriculum that is "a mile wide and an inch deep." These<br />
Standards are a substantial answer to that challenge.<br />
It is important to recognize that “fewer standards” are no substitute for focused standards. Achieving "fewer<br />
standards" would be easy to do by resorting to broad, general statements. Instead, these Standards aim for clarity<br />
and specificity.<br />
Assessing the coherence of a set of standards is more difficult than assessing their focus. William Schmidt and<br />
Richard Houang (2002) have said that content standards and curricula are coherent if they are:<br />
articulated over time as a sequence of topics and performances that are logical and<br />
reflect, where appropriate, the sequential or hierarchical nature of the disciplinary<br />
content from which the subject matter derives. That is, what and how students are<br />
taught should reflect not only the topics that fall within a certain academic discipline,<br />
but also the key ideas that determine how knowledge is organized and generated within<br />
that discipline. This implies that to be coherent, a set of content standards must evolve<br />
from particulars (e.g., the meaning and operations of whole numbers, including simple<br />
math facts and routine computational procedures associated with whole numbers and<br />
fractions) to deeper structures inherent in the discipline. These deeper structures then<br />
serve as a means for connecting the particulars (such as an understanding of the rational<br />
number system and its properties). (emphasis added)<br />
Disclaimer: This document is up-to-date as of 11/17/2010. The language provided may not be Page 4 of 98<br />
modified in any way. The most current <strong>Iowa</strong> <strong>Core</strong> can be found at http://iowacore.educateiowa.gov.
These Standards endeavor to follow such a design, not only by stressing conceptual understanding of key ideas,<br />
but also by continually returning to organizing principles such as place value or the properties of operations to<br />
structure those ideas.<br />
In addition, the "sequence of topics and performances" that is outlined in a body of mathematics standards must<br />
also respect what is known about how students learn. As Confrey (2007) points out, developing "sequenced<br />
obstacles and challenges for student...absent the insights about meaning that derive from careful study of<br />
learning, would be unfortunate and unwise." In recognition of this, the development of these Standards began<br />
with research-based learning progressions detailing what is known today about how students’ mathematical<br />
knowledge, skill, and understanding develop over time.<br />
Disclaimer: This document is up-to-date as of 11/17/2010. The language provided may not be Page 5 of 98<br />
modified in any way. The most current <strong>Iowa</strong> <strong>Core</strong> can be found at http://iowacore.educateiowa.gov.
Understanding mathematics<br />
These Standards define what students should understand and be able to do in their study of mathematics. Asking a<br />
student to understand something means asking a teacher to assess whether the student has understood it. But<br />
what does mathematical understanding look like? One hallmark of mathematical understanding is the ability to<br />
justify, in a way appropriate to the student’s mathematical maturity, why a particular mathematical statement is<br />
true or where a mathematical rule comes from. There is a world of difference between a student who can summon<br />
a mnemonic device to expand a product such as (a + b)(x + y) and a student who can explain where the mnemonic<br />
comes from. The student who can explain the rule understands the mathematics, and may have a better chance to<br />
succeed at a less familiar task such as expanding (a + b + c)(x + y). Mathematical understanding and procedural skill<br />
are equally important, and both are assessable using mathematical tasks of sufficient richness.<br />
The Standards set grade-specific standards but do not define the intervention methods or materials necessary to<br />
support students who are well below or well above grade-level expectations. It is also beyond the scope of the<br />
Standards to define the full range of supports appropriate for English language learners and for students with<br />
special needs. At the same time, all students must have the opportunity to learn and meet the same high<br />
standards if they are to access the knowledge and skills necessary in their post-school lives. The Standards should<br />
be read as allowing for the widest possible range of students to participate fully from the outset, along with<br />
appropriate accommodations to ensure maximum participation of students with special education needs. For<br />
example, for students with disabilities reading should allow for use of Braille, screen reader technology, or other<br />
assistive devices, while writing should include the use of a scribe, computer, or speech-to-text technology. In a<br />
similar vein, speaking and listening should be interpreted broadly to include sign language. No set of grade-specific<br />
standards can fully reflect the great variety in abilities, needs, learning rates, and achievement levels of students in<br />
any given classroom. However, the Standards do provide clear signposts along the way to the goal of college and<br />
career readiness for all students.<br />
The Standards begin on page 8 with eight Standards for Mathematical Practice.<br />
Disclaimer: This document is up-to-date as of 11/17/2010. The language provided may not be Page 6 of 98<br />
modified in any way. The most current <strong>Iowa</strong> <strong>Core</strong> can be found at http://iowacore.educateiowa.gov.
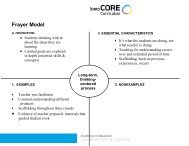
How to read the grade level standards<br />
Standards define what students should understand and be able to do.<br />
Clusters are groups of related standards. Note that standards from different clusters may sometimes be closely<br />
related, because mathematics is a connected subject.<br />
Domains are larger groups of related standards. Standards from different domains may sometimes be closely<br />
related.<br />
Domain<br />
Number and Operations in Base Ten<br />
3.NBT<br />
Use place value understanding and properties of operations to perform multi-digit arithmetic.<br />
1. Use place value understanding to round whole numbers to the nearest 10 or 100.<br />
2. Fluently add and subtract within 1000 using strategies and algorithms based on place<br />
value, properties of operations, and/or the relationship between addition and<br />
Standard subtraction.<br />
3. Multiply one-digit whole numbers by multiples of 10 in the range 10-90 (e.g., 9 × 80, 5 ×<br />
60) using strategies based on place value and properties of operations.<br />
Cluster<br />
These Standards do not dictate curriculum or teaching methods. For example, just because topic A appears before<br />
topic B in the standards for a given grade, it does not necessarily mean that topic A must be taught before topic B.<br />
A teacher might<br />
prefer to teach topic B before topic A, or might choose to highlight connections by teaching topic A and topic B at<br />
the same time. Or, a teacher might prefer to teach a topic of his or her own choosing that leads, as a byproduct, to<br />
students reaching the standards for topics A and B.<br />
What students can learn at any particular grade level depends upon what they have learned before. Ideally then,<br />
each standard in this document might have been phrased in the form, "Students who already know ... should next<br />
come to learn ...." But at present this approach is unrealistic—not least because existing education research cannot<br />
specify all such learning pathways. Of necessity therefore, grade placements for specific topics have been made on<br />
the basis of state and international comparisons and the collective experience and collective professional<br />
judgment of educators, researchers and mathematicians. One promise of common state standards is that over<br />
time they will allow research on learning progressions to inform and improve the design of standards to a much<br />
greater extent than is possible today. Learning opportunities will continue to vary across schools and school<br />
systems, and educators should make every effort to meet the needs of individual students based on their current<br />
understanding.<br />
These Standards are not intended to be new names for old ways of doing business. They are a call to take the next<br />
step. It is time for states to work together to build on lessons learned from two decades of standards based<br />
reforms. It is time to recognize that standards are not just promises to our children, but promises we intend to<br />
keep.<br />
Disclaimer: This document is up-to-date as of 11/17/2010. The language provided may not be Page 7 of 98<br />
modified in any way. The most current <strong>Iowa</strong> <strong>Core</strong> can be found at http://iowacore.educateiowa.gov.
<strong>Mathematics</strong> | Standards for Mathematical Practice<br />
The Standards for Mathematical Practice describe varieties of expertise that mathematics educators at all levels<br />
should seek to develop in their students. These practices rest on important "processes and proficiencies" with<br />
longstanding importance in mathematics education. The first of these are the NCTM process standards of problem<br />
solving, reasoning and proof, communication, representation, and connections. The second are the strands of<br />
mathematical proficiency specified in the National Research Council’s report Adding It Up: adaptive reasoning,<br />
strategic competence, conceptual understanding (comprehension of mathematical concepts, operations and<br />
relations), procedural fluency (skill in carrying out procedures flexibly, accurately, efficiently and appropriately),<br />
and productive disposition (habitual inclination to see mathematics as sensible, useful, and worthwhile, coupled<br />
with a belief in diligence and one’s own efficacy).<br />
1. Make sense of problems and persevere in solving them.<br />
Mathematically proficient students start by explaining to themselves the meaning of a problem and<br />
looking for entry points to its solution. They analyze givens, constraints, relationships, and goals. They<br />
make conjectures about the form and meaning of the solution and plan a solution pathway rather than<br />
simply jumping into a solution attempt. They consider analogous problems, and try special cases and<br />
simpler forms of the original problem in order to gain insight into its solution. They monitor and evaluate<br />
their progress and change course if necessary. Older students might, depending on the context of the<br />
problem, transform algebraic expressions or change the viewing window on their graphing calculator to<br />
get the information they need. Mathematically proficient students can explain correspondences between<br />
equations, verbal descriptions, tables, and graphs or draw diagrams of important features and<br />
relationships, graph data, and search for regularity or trends. Younger students might rely on using<br />
concrete objects or pictures to help conceptualize and solve a problem. Mathematically proficient<br />
students check their answers to problems using a different method, and they continually ask themselves,<br />
"Does this make sense?" They can understand the approaches of others to solving complex problems and<br />
identify correspondences between different approaches.<br />
2. Reason abstractly and quantitatively.<br />
Mathematically proficient students make sense of quantities and their relationships in problem situations.<br />
They bring two complementary abilities to bear on problems involving quantitative relationships: the<br />
ability to decontextualize—to abstract a given situation and represent it symbolically and manipulate the<br />
representing symbols as if they have a life of their own, without necessarily attending to their referents—<br />
and the ability to contextualize, to pause as needed during the manipulation process in order to probe<br />
into the referents for the symbols involved. Quantitative reasoning entails habits of creating a coherent<br />
representation of the problem at hand; considering the units involved; attending to the meaning of<br />
quantities, not just how to compute them; and knowing and flexibly using different properties of<br />
operations and objects.<br />
3. Construct viable arguments and critique the reasoning of others.<br />
Mathematically proficient students understand and use stated assumptions, definitions, and previously<br />
established results in constructing arguments. They make conjectures and build a logical progression of<br />
statements to explore the truth of their conjectures. They are able to analyze situations by breaking them<br />
into cases, and can recognize and use counterexamples. They justify their conclusions, communicate them<br />
to others, and respond to the arguments of others. They reason inductively about data, making plausible<br />
arguments that take into account the context from which the data arose. Mathematically proficient<br />
students are also able to compare the effectiveness of two plausible arguments, distinguish correct logic<br />
or reasoning from that which is flawed, and—if there is a flaw in an argument—explain what it is.<br />
Elementary students can construct arguments using concrete referents such as objects, drawings,<br />
diagrams, and actions. Such arguments can make sense and be correct, even though they are not<br />
generalized or made formal until later grades. Later, students learn to determine domains to which an<br />
argument applies. Students at all grades can listen or read the arguments of others, decide whether they<br />
make sense, and ask useful questions to clarify or improve the arguments.<br />
Disclaimer: This document is up-to-date as of 11/17/2010. The language provided may not be Page 8 of 98<br />
modified in any way. The most current <strong>Iowa</strong> <strong>Core</strong> can be found at http://iowacore.educateiowa.gov.
4. Model with mathematics.<br />
Mathematically proficient students can apply the mathematics they know to solve problems arising in<br />
everyday life, society, and the workplace. In early grades, this might be as simple as writing an addition<br />
equation to describe a situation. In middle grades, a student might apply proportional reasoning to plan a<br />
school event or analyze a problem in the community. By high school, a student might use geometry to<br />
solve a design problem or use a function to describe how one quantity of interest depends on another.<br />
Mathematically proficient students who can apply what they know are comfortable making assumptions<br />
and approximations to simplify a complicated situation, realizing that these may need revision later. They<br />
are able to identify important quantities in a practical situation and map their relationships using such<br />
tools as diagrams, two-way tables, graphs, flowcharts and formulas. They can analyze those relationships<br />
mathematically to draw conclusions. They routinely interpret their mathematical results in the context of<br />
the situation and reflect on whether the results make sense, possibly improving the model if it has not<br />
served its purpose.<br />
5. Use appropriate tools strategically.<br />
Mathematically proficient students consider the available tools when solving a mathematical problem.<br />
These tools might include pencil and paper, concrete models, a ruler, a protractor, a calculator, a<br />
spreadsheet, a computer algebra system, a statistical package, or dynamic geometry software. Proficient<br />
students are sufficiently familiar with tools appropriate for their grade or course to make sound decisions<br />
about when each of these tools might be helpful, recognizing both the insight to be gained and their<br />
limitations. For example, mathematically proficient high school students analyze graphs of functions and<br />
solutions generated using a graphing calculator. They detect possible errors by strategically using<br />
estimation and other mathematical knowledge. When making mathematical models, they know that<br />
technology can enable them to visualize the results of varying assumptions, explore consequences, and<br />
compare predictions with data. Mathematically proficient students at various grade levels are able to<br />
identify relevant external mathematical resources, such as digital content located on a website, and use<br />
them to pose or solve problems. They are able to use technological tools to explore and deepen their<br />
understanding of concepts.<br />
6. Attend to precision.<br />
Mathematically proficient students try to communicate precisely to others. They try to use clear<br />
definitions in discussion with others and in their own reasoning. They state the meaning of the symbols<br />
they choose, including using the equal sign consistently and appropriately. They are careful about<br />
specifying units of measure, and labeling axes to clarify the correspondence with quantities in a problem.<br />
They calculate accurately and efficiently, express numerical answers with a degree of precision<br />
appropriate for the problem context. In the elementary grades, students give carefully formulated<br />
explanations to each other. By the time they reach high school they have learned to examine claims and<br />
make explicit use of definitions.<br />
7. Look for and make use of structure.<br />
Mathematically proficient students look closely to discern a pattern or structure. Young students, for<br />
example, might notice that three and seven more is the same amount as seven and three more, or they<br />
may sort a collection of shapes according to how many sides the shapes have. Later, students will see 7 ×<br />
8 equals the well remembered 7 × 5 + 7 × 3, in preparation for learning about the distributive property. In<br />
the expression x 2 + 9x + 14, older students can see the 14 as 2 × 7 and the 9 as 2 + 7. They recognize the<br />
significance of an existing line in a geometric figure and can use the strategy of drawing an auxiliary line<br />
for solving problems. They also can step back for an overview and shift perspective. They can see<br />
complicated things, such as some algebraic expressions, as single objects or as being composed of several<br />
objects. For example, they can see 5 – 3(x – y) 2 as 5 minus a positive number times a square and use that<br />
to realize that its value cannot be more than 5 for any real numbers x and y.<br />
Students who look for patterns in their environment expect things to make sense and develop a habit of<br />
finding relationships and making predictions. Students should investigate patterns in number, shape,<br />
data, change, and chance. They should be given opportunities to learn how to represent those patterns<br />
numerically, geometrically and/or algebraically.<br />
Disclaimer: This document is up-to-date as of 11/17/2010. The language provided may not be Page 9 of 98<br />
modified in any way. The most current <strong>Iowa</strong> <strong>Core</strong> can be found at http://iowacore.educateiowa.gov.
8. Look for and express regularity in repeated reasoning.<br />
Mathematically proficient students notice if calculations are repeated, and look both for general methods<br />
and for shortcuts. Upper elementary students might notice when dividing 25 by 11 that they are repeating<br />
the same calculations over and over again, and conclude they have a repeating decimal. By paying<br />
attention to the calculation of slope as they repeatedly check whether points are on the line through (1,<br />
2) with slope 3, middle school students might abstract the equation (y – 2)/(x – 1) = 3. Noticing the<br />
regularity in the way terms cancel when expanding (x – 1)(x + 1), (x – 1)(x 2 + x + 1), and (x – 1)(x 3 + x 2 + x +<br />
1) might lead them to the general formula for the sum of a geometric series. As they work to solve a<br />
problem, mathematically proficient students maintain oversight of the process, while attending to the<br />
details. They continually evaluate the reasonableness of their intermediate results.<br />
Connecting the Standards for Mathematical Practice to the Standards for Mathematical Content<br />
The Standards for Mathematical Practice describe ways in which developing student practitioners of the discipline<br />
of mathematics increasingly ought to engage with the subject matter as they grow in mathematical maturity and<br />
expertise throughout the elementary, middle and high school years. Designers of curricula, assessments, and<br />
professional development should all attend to the need to connect the mathematical practices to mathematical<br />
content in mathematics instruction.<br />
The Standards for Mathematical Content are a balanced combination of procedure and understanding.<br />
Expectations that begin with the word "understand" are often especially good opportunities to connect the<br />
practices to the content. Students who lack understanding of a topic may rely on procedures too heavily. Without<br />
a flexible base from which to work, they may be less likely to consider analogous problems, represent problems<br />
coherently, justify conclusions, apply the mathematics to practical situations, use technology mindfully to work<br />
with the mathematics, explain the mathematics accurately to other students, step back for an overview, or deviate<br />
from a known procedure to find a shortcut. In short, a lack of understanding effectively prevents a student from<br />
engaging in the mathematical practices.<br />
In this respect, those content standards which set an expectation of understanding are potential "points of<br />
intersection" between the Standards for Mathematical Content and the Standards for Mathematical Practice.<br />
These points of intersection are intended to be weighted toward central and generative concepts in the school<br />
mathematics curriculum that most merit the time, resources, innovative energies, and focus necessary to<br />
qualitatively improve the curriculum, instruction, assessment, professional development, and student achievement<br />
in mathematics.<br />
Disclaimer: This document is up-to-date as of 11/17/2010. The language provided may not be Page 10 of 98<br />
modified in any way. The most current <strong>Iowa</strong> <strong>Core</strong> can be found at http://iowacore.educateiowa.gov.
<strong>Mathematics</strong> | Kindergarten<br />
In Kindergarten, instructional time should focus on two critical areas: (1) representing, relating,<br />
and operating on whole numbers, initially with sets of objects; (2) describing shapes and space.<br />
More learning time in Kindergarten should be devoted to number than to other topics.<br />
(1) Students use numbers, including written numerals, to represent quantities and to solve quantitative<br />
problems, such as counting objects in a set; counting out a given number of objects; comparing sets or<br />
numerals; and modeling simple joining and separating situations with sets of objects, or eventually with<br />
equations such as 5 + 2 = 7 and 7 – 2 = 5. (Kindergarten students should see addition and subtraction<br />
equations, and student writing of equations in kindergarten is encouraged, but it is not required.)<br />
Students choose, combine, and apply effective strategies for answering quantitative questions, including<br />
quickly recognizing the cardinalities of small sets of objects, counting and producing sets of given sizes,<br />
counting the number of objects in combined sets, or counting the number of objects that remain in a set<br />
after some are taken away.<br />
(2) Students describe their physical world using geometric ideas (e.g., shape, orientation, spatial relations)<br />
and vocabulary. They identify, name, and describe basic two-dimensional shapes, such as squares,<br />
triangles, circles, rectangles, and hexagons, presented in a variety of ways (e.g., with different sizes and<br />
orientations), as well as three-dimensional shapes such as cubes, cones, cylinders, and spheres. They use<br />
basic shapes and spatial reasoning to model objects in their environment and to construct more complex<br />
shapes.<br />
Disclaimer: This document is up-to-date as of 11/17/2010. The language provided may not be Page 11 of 98<br />
modified in any way. The most current <strong>Iowa</strong> <strong>Core</strong> can be found at http://iowacore.educateiowa.gov.
Grade K Overview<br />
Counting and Cardinality<br />
• Know number names and the count sequence.<br />
• Count to tell the number of objects.<br />
• Compare numbers.<br />
Operations and Algebraic Thinking<br />
• Understand addition as putting together and adding to,<br />
and understand subtraction as taking apart and taking<br />
from.<br />
Number and Operations in Base Ten<br />
• Work with numbers 11–19 to gain foundations for place<br />
value.<br />
Mathematical Practices<br />
1. Make sense of problems and<br />
persevere in solving them.<br />
2. Reason abstractly and quantitatively.<br />
3. Construct viable arguments and<br />
critique the reasoning of others.<br />
4. Model with mathematics.<br />
5. Use appropriate tools strategically.<br />
6. Attend to precision.<br />
7. Look for and make use of structure.<br />
8. Look for and express regularity in<br />
repeated reasoning.<br />
Measurement and Data<br />
• Describe and compare measurable attributes.<br />
• Classify objects and count the number of objects in categories.<br />
Geometry<br />
• Identify and describe shapes.<br />
• Analyze, compare, create, and compose shapes.<br />
Disclaimer: This document is up-to-date as of 11/17/2010. The language provided may not be Page <strong>12</strong> of 98<br />
modified in any way. The most current <strong>Iowa</strong> <strong>Core</strong> can be found at http://iowacore.educateiowa.gov.
Counting and Cardinality<br />
K.CC<br />
Know number names and the count sequence.<br />
1. Count to 100 by ones and by tens. (K.CC.1.)<br />
2. Count forward beginning from a given number within the known sequence (instead of<br />
having to begin at 1). (K.CC.2.)<br />
3. Write numbers from 0 to 20. Represent a number of objects with a written numeral 0-<br />
20 (with 0 representing a count of no objects). (K.CC.3.)<br />
Count to tell the number of object.<br />
4. Understand the relationship between numbers and quantities; connect counting to<br />
cardinality.<br />
a. When counting objects, say the number names in the standard order, pairing<br />
each object with one and only one number name and each number name with<br />
one and only one object.<br />
b. Understand that the last number name said tells the number of objects<br />
counted. The number of objects is the same regardless of their arrangement or<br />
the order in which they were counted.<br />
c. Understand that each successive number name refers to a quantity that is one<br />
larger. (K.CC.4.)<br />
5. Count to answer "how many?" questions about as many as 20 things arranged in a line,<br />
a rectangular array, or a circle, or as many as 10 things in a scattered configuration;<br />
given a number from 1–20, count out that many objects. (K.CC.5.)<br />
Compare numbers<br />
6. Identify whether the number of objects in one group is greater than, less than, or equal<br />
to the number of objects in another group, e.g., by using matching and counting<br />
strategies. 1 (K.CC.6.)<br />
7. Compare two numbers between 1 and 10 presented as written numerals. (K.CC.7.)<br />
Operations and Algebraic Thinking<br />
K.OA<br />
Understand addition as putting together and adding to, and understand subtraction as taking<br />
apart and taking from.<br />
1. Represent addition and subtraction with objects, fingers, mental images, drawings 2 ,<br />
sounds (e.g., claps), acting out situations, verbal explanations, expressions, or<br />
equations. (K.OA.1.)<br />
2. Solve addition and subtraction word problems, and add and subtract within 10, e.g., by<br />
using objects or drawings to represent the problem. (K.OA.2.)<br />
3. Decompose numbers less than or equal to 10 into pairs in more than one way, e.g., by<br />
using objects or drawings, and record each decomposition by a drawing or equation<br />
(e.g., 5 = 2 + 3 and 5 = 4 + 1). (K.OA.3.)<br />
4. For any number from 1 to 9, find the number that makes 10 when added to the given<br />
number, e.g., by using objects or drawings, and record the answer with a drawing or<br />
equation. (K.OA.4.)<br />
5. Fluently add and subtract within 5. (K.OA.5.)<br />
1 Include groups with up to ten objects.<br />
2 Drawings need not show details, but should show the mathematics in the problem. (This applies wherever<br />
drawings are mentioned in the Standards.)<br />
Disclaimer: This document is up-to-date as of 11/17/2010. The language provided may not be Page 13 of 98<br />
modified in any way. The most current <strong>Iowa</strong> <strong>Core</strong> can be found at http://iowacore.educateiowa.gov.
Number and Operations in Base Ten<br />
K.NBT<br />
Work with numbers 11–19 to gain foundations for place value.<br />
1. Compose and decompose numbers from 11 to 19 into ten ones and some further ones,<br />
e.g., by using objects or drawings, and record each composition or decomposition by a<br />
drawing or equation (e.g., 18 = 10 + 8); understand that these numbers are composed<br />
of ten ones and one, two, three, four, five, six, seven, eight, or nine ones. (K.NBT.1)<br />
Measurement and Data<br />
K.MD<br />
Describe and compare measurable attributes.<br />
1. Describe measurable attributes of objects, such as length or weight. Describe several<br />
measurable attributes of a single object. (K.MD.1.)<br />
2. Directly compare two objects with a measurable attribute in common, to see which<br />
object has "more of"/"less of" the attribute, and describe the difference. For example,<br />
directly compare the heights of two children and describe one child as taller/shorter.<br />
(K.MD.2.)<br />
Classify objects and count the number of objects in each category.<br />
3. Classify objects into given categories; count the numbers of objects in each category<br />
and sort the categories by count. 3 (K.MD.3.)<br />
Geometry<br />
K.G<br />
Identify and describe shapes (squares, circles, triangles, rectangles, hexagons, cubes, cones,<br />
cylinders, and spheres).<br />
1. Describe objects in the environment using names of shapes, and describe the relative<br />
positions of these objects using terms such as above, below, beside, in front of, behind,<br />
and next to. (K.G.1.)<br />
2. Correctly name shapes regardless of their orientations or overall size. (K.G.2.)<br />
3. Identify shapes as two-dimensional (lying in a plane, "flat") or three-dimensional<br />
("solid"). (K.G.3.)<br />
Analyze, compare, create, and compose shapes.<br />
4. Analyze and compare two- and three-dimensional shapes, in different sizes and<br />
orientations, using informal language to describe their similarities, differences, parts<br />
(e.g., number of sides and vertices/"corners") and other attributes (e.g., having sides of<br />
equal length). (K.G.4.)<br />
5. Model shapes in the world by building shapes from components (e.g., sticks and clay<br />
balls) and drawing shapes. (K.G.5.)<br />
6. Compose simple shapes to form larger shapes. For example, "Can you join these two<br />
triangles with full sides touching to make a rectangle?" (K.G.6.)<br />
3 Limit category counts to be less than or equal to 10.<br />
Disclaimer: This document is up-to-date as of 11/17/2010. The language provided may not be Page 14 of 98<br />
modified in any way. The most current <strong>Iowa</strong> <strong>Core</strong> can be found at http://iowacore.educateiowa.gov.
<strong>Mathematics</strong> | Grade 1<br />
In Grade 1, instructional time should focus on four critical areas: (1) developing understanding<br />
of addition, subtraction, and strategies for addition and subtraction within 20; (2) developing<br />
understanding of whole number relationships and place value, including grouping in tens and<br />
ones; (3) developing understanding of linear measurement and measuring lengths as iterating<br />
length units; and (4) reasoning about attributes of, and composing and decomposing geometric<br />
shapes.<br />
(1) Students develop strategies for adding and subtracting whole numbers based on their prior work with<br />
small numbers. They use a variety of models, including discrete objects and length-based models (e.g.,<br />
cubes connected to form lengths), to model add-to, take-from, put-together, take-apart, and compare<br />
situations to develop meaning for the operations of addition and subtraction, and to develop strategies to<br />
solve arithmetic problems with these operations. Students understand connections between counting<br />
and addition and subtraction (e.g., adding two is the same as counting on two). They use properties of<br />
addition to add whole numbers and to create and use increasingly sophisticated strategies based on these<br />
properties (e.g., "making tens") to solve addition and subtraction problems within 20. By comparing a<br />
variety of solution strategies, children build their understanding of the relationship between addition and<br />
subtraction.<br />
(2) Students develop, discuss, and use efficient, accurate, and generalizable methods to add within 100<br />
and subtract multiples of 10. They compare whole numbers (at least to 100) to develop understanding of<br />
and solve problems involving their relative sizes. They think of whole numbers between 10 and 100 in<br />
terms of tens and ones (especially recognizing the numbers 11 to 19 as composed of a ten and some<br />
ones). Through activities that build number sense, they understand the order of the counting numbers<br />
and their relative magnitudes.<br />
(3) Students develop an understanding of the meaning and processes of measurement, including<br />
underlying concepts such as iterating (the mental activity of building up the length of an object with<br />
equal-sized units) and the transitivity principle for indirect measurement. 1<br />
(4) Students compose and decompose plane or solid figures (e.g., put two triangles together to make a<br />
quadrilateral) and build understanding of part-whole relationships as well as the properties of the original<br />
and composite shapes. As they combine shapes, they recognize them from different perspectives and<br />
orientations, describe their geometric attributes, and determine how they are alike and different, to<br />
develop the background for measurement and for initial understandings of properties such as congruence<br />
and symmetry.<br />
1 Students should apply the principle of transitivity of measurement to make indirect comparisons, but they need<br />
not use this technical term.<br />
Disclaimer: This document is up-to-date as of 11/17/2010. The language provided may not be Page 15 of 98<br />
modified in any way. The most current <strong>Iowa</strong> <strong>Core</strong> can be found at http://iowacore.educateiowa.gov.
Grade 1 Overview<br />
Operations and Algebraic Thinking<br />
• Represent and solve problems involving addition and<br />
subtraction.<br />
• Understand and apply properties of operations and the<br />
relationship between addition and subtraction.<br />
• Add and subtract within 20.<br />
• Work with addition and subtraction equations.<br />
Number and Operations in Base Ten<br />
• Extend the counting sequence.<br />
• Understand place value.<br />
• Use place value understanding and properties of<br />
operations to add and subtract.<br />
Mathematical Practices<br />
1. Make sense of problems and<br />
persevere in solving them.<br />
2. Reason abstractly and quantitatively.<br />
3. Construct viable arguments and<br />
critique the reasoning of others.<br />
4. Model with mathematics.<br />
5. Use appropriate tools strategically.<br />
6. Attend to precision.<br />
7. Look for and make use of structure.<br />
8. Look for and express regularity in<br />
repeated reasoning.<br />
Measurement and Data<br />
• Measure lengths indirectly and by iterating length units.<br />
• Tell and write time.<br />
• Represent and interpret data.<br />
Geometry<br />
• Reason with shapes and their attributes.<br />
Disclaimer: This document is up-to-date as of 11/17/2010. The language provided may not be Page 16 of 98<br />
modified in any way. The most current <strong>Iowa</strong> <strong>Core</strong> can be found at http://iowacore.educateiowa.gov.
Operations and Algebraic Thinking<br />
1.OA<br />
Represent and solve problems involving addition and subtraction.<br />
1. Use addition and subtraction within 20 to solve word problems involving situations of<br />
adding to, taking from, putting together, taking apart, and comparing, with unknowns in<br />
all positions, e.g., by using objects, drawings, and equations with a symbol for the<br />
unknown number to represent the problem. 2 (1.OA.1.)<br />
2. Solve word problems that call for addition of three whole numbers whose sum is less<br />
than or equal to 20, e.g., by using objects, drawings, and equations with a symbol for<br />
the unknown number to represent the problem. (1.OA.2.)<br />
Understand and apply properties of operations and the relationship between addition and<br />
subtraction.<br />
3. Apply properties of operations as strategies to add and subtract. 3 Examples: If 8 + 3 = 11<br />
is known, then 3 + 8 = 11 is also known. (Commutative property of addition.) To add 2 +<br />
6 + 4, the second two numbers can be added to make a ten, so 2 + 6 + 4 = 2 + 10 = <strong>12</strong>.<br />
(Associative property of addition.) (1.OA.3.)<br />
4. Understand subtraction as an unknown-addend problem. For example, subtract 10 – 8<br />
by finding the number that makes 10 when added to 8. (1.OA.4.)<br />
Add and subtract within 20.<br />
5. Relate counting to addition and subtraction (e.g., by counting on 2 to add 2). (1.OA.5.)<br />
6. Add and subtract within 20, demonstrating fluency for addition and subtraction within<br />
10. Use strategies such as counting on; making ten (e.g., 8 + 6 = 8 + 2 + 4 = 10 + 4 = 14);<br />
decomposing a number leading to a ten (e.g., 13 – 4 = 13 – 3 – 1 = 10 – 1 = 9); using the<br />
relationship between addition and subtraction (e.g., knowing that 8 + 4 = <strong>12</strong>, one knows<br />
<strong>12</strong> – 8 = 4); and creating equivalent but easier or known sums (e.g., adding 6 + 7 by<br />
creating the known equivalent 6 + 6 + 1 = <strong>12</strong> + 1 = 13). (1.OA.6.)<br />
Work with addition and subtraction equations.<br />
7. Understand the meaning of the equal sign, and determine if equations involving<br />
addition and subtraction are true or false. For example, which of the following equations<br />
are true and which are false? 6 = 6, 7 = 8 – 1, 5 + 2 = 2 + 5, 4 + 1 = 5 + 2. (1.OA.7.)<br />
8. Determine the unknown whole number in an addition or subtraction equation relating<br />
three whole numbers. For example, determine the unknown number that makes the<br />
equation true in each of the equations 8 + ? = 11, 5 = – 3, 6 + 6 = . (1.OA.8.)<br />
Number and Operations in Base Ten<br />
1.NBT<br />
Extend the counting sequence.<br />
1. Count to <strong>12</strong>0, starting at any number less than <strong>12</strong>0. In this range, read and write<br />
numerals and represent a number of objects with a written numeral. (1.NBT.1.)<br />
Understand place value.<br />
2. Understand that the two digits of a two-digit number represent amounts of tens and<br />
ones. Understand the following as special cases:<br />
a. 10 can be thought of as a bundle of ten ones — called a "ten."<br />
b. The numbers from 11 to 19 are composed of a ten and one, two, three, four,<br />
five, six, seven, eight, or nine ones.<br />
c. The numbers 10, 20, 30, 40, 50, 60, 70, 80, 90 refer to one, two, three, four,<br />
five, six, seven, eight, or nine tens (and 0 ones). (1.NBT.2.)<br />
2 See Glossary, Table 1.<br />
3 Students need not use formal terms for these properties.<br />
Disclaimer: This document is up-to-date as of 11/17/2010. The language provided may not be Page 17 of 98<br />
modified in any way. The most current <strong>Iowa</strong> <strong>Core</strong> can be found at http://iowacore.educateiowa.gov.
3. Compare two two-digit numbers based on meanings of the tens and ones digits,<br />
recording the results of comparisons with the symbols >, =, and
<strong>Mathematics</strong> | Grade 2<br />
In Grade 2, instructional time should focus on four critical areas: (1) extending understanding of<br />
base-ten notation; (2) building fluency with addition and subtraction; (3) using standard units of<br />
measure; and (4) describing and analyzing shapes.<br />
(1) Students extend their understanding of the base-ten system. This includes ideas of counting<br />
in fives, tens, and multiples of hundreds, tens, and ones, as well as number relationships<br />
involving these units, including comparing. Students understand multi-digit numbers (up to 1000)<br />
written in base-ten notation, recognizing that the digits in each place represent amounts of<br />
thousands, hundreds, tens, or ones (e.g., 853 is 8 hundreds + 5tens + 3 ones).<br />
(2) Students use their understanding of addition to develop fluency with addition and subtraction within<br />
100. They solve problems within 1000 by applying their understanding of models for addition and<br />
subtraction, and they develop, discuss, and use efficient, accurate, and generalizable methods to compute<br />
sums and differences of whole numbers in base-ten notation, using their understanding of place value<br />
and the properties of operations. They select and accurately apply methods that are appropriate for the<br />
context and the numbers involved to mentally calculate sums and differences for numbers with only tens<br />
or only hundreds.<br />
(3) Students recognize the need for standard units of measure (centimeter and inch) and they use rulers<br />
and other measurement tools with the understanding that linear measure involves an iteration of units.<br />
They recognize that the smaller the unit, the more iterations they need to cover a given length.<br />
(4) Students describe and analyze shapes by examining their sides and angles. Students investigate,<br />
describe, and reason about decomposing and combining shapes to make other shapes. Through building,<br />
drawing, and analyzing two- and three-dimensional shapes, students develop a foundation for<br />
understanding area, volume, congruence, similarity, and symmetry in later grades.<br />
Disclaimer: This document is up-to-date as of 11/17/2010. The language provided may not be Page 19 of 98<br />
modified in any way. The most current <strong>Iowa</strong> <strong>Core</strong> can be found at http://iowacore.educateiowa.gov.
Grade 2 Overview<br />
Operations and Algebraic Thinking<br />
• Represent and solve problems involving addition<br />
and subtraction.<br />
• Add and subtract within 20.<br />
• Work with equal groups of objects to gain<br />
foundations for multiplication.<br />
Number and Operations in Base Ten<br />
• Understand place value.<br />
• Use place value understanding and properties of<br />
operations to add and subtract.<br />
Measurement and Data<br />
• Measure and estimate lengths in standard units.<br />
• Relate addition and subtraction to length.<br />
• Work with time and money.<br />
• Represent and interpret data.<br />
Mathematical Practices<br />
1. Make sense of problems and<br />
persevere in solving them.<br />
2. Reason abstractly and quantitatively.<br />
3. Construct viable arguments and<br />
critique the reasoning of others.<br />
4. Model with mathematics.<br />
5. Use appropriate tools strategically.<br />
6. Attend to precision.<br />
7. Look for and make use of structure.<br />
8. Look for and express regularity in<br />
repeated reasoning.<br />
Geometry<br />
• Reason with shapes and their attributes.<br />
Disclaimer: This document is up-to-date as of 11/17/2010. The language provided may not be Page 20 of 98<br />
modified in any way. The most current <strong>Iowa</strong> <strong>Core</strong> can be found at http://iowacore.educateiowa.gov.
Operations and Algebraic Thinking<br />
2.OA<br />
Represent and solve problems involving addition and subtraction.<br />
1. Use addition and subtraction within 100 to solve one- and two-step word problems<br />
involving situations of adding to, taking from, putting together, taking apart, and<br />
comparing, with unknowns in all positions, e.g., by using drawings and equations with a<br />
symbol for the unknown number to represent the problem. 1 (2.OA.1.)<br />
Add and subtract within 20.<br />
2. Fluently add and subtract within 20 using mental strategies. 2 By end of Grade 2, know<br />
from memory all sums of two one-digit numbers. (2.OA.2.)<br />
Work with equal groups of objects to gain foundations for multiplication.<br />
3. Determine whether a group of objects (up to 20) has an odd or even number of<br />
members, e.g., by pairing objects or counting them by 2s; write an equation to express<br />
an even number as a sum of two equal addends. (2.OA.3.)<br />
4. Use addition to find the total number of objects arranged in rectangular arrays with up<br />
to 5 rows and up to 5 columns; write an equation to express the total as a sum of equal<br />
addends. (2.OA.4.)<br />
Number and Operations in Base Ten<br />
2.NBT<br />
Understand place value.<br />
1. Understand that the three digits of a three-digit number represent amounts of<br />
hundreds, tens, and ones; e.g., 706 equals 7 hundreds, 0 tens, and 6 ones. Understand<br />
the following as special cases:<br />
a. 100 can be thought of as a bundle of ten tens — called a "hundred."<br />
b. The numbers 100, 200, 300, 400, 500, 600, 700, 800, 900 refer to one, two,<br />
three, four, five, six, seven, eight, or nine hundreds (and 0 tens and 0 ones).<br />
(2.NBT.1.)<br />
2. Count within 1000; skip-count by 5s, 10s, and 100s. (2.NBT.2.)<br />
3. Read and write numbers to 1000 using base-ten numerals, number names, and<br />
expanded form. (2.NBT.3.)<br />
4. Compare two three-digit numbers based on meanings of the hundreds, tens, and ones<br />
digits, using >, =, and < symbols to record the results of comparisons. (2.NBT.4.)<br />
Use place value understanding and properties of operations to add and subtract.<br />
5. Fluently add and subtract within 100 using strategies based on place value, properties<br />
of operations, and/or the relationship between addition and subtraction. (2.NBT.5.)<br />
6. Add up to four two-digit numbers using strategies based on place value and properties<br />
of operations. (2.NBT.6.)<br />
7. Add and subtract within 1000, using concrete models or drawings and strategies based<br />
on place value, properties of operations, and/or the relationship between addition and<br />
subtraction; relate the strategy to a written method. Understand that in adding or<br />
subtracting three-digit numbers, one adds or subtracts hundreds and hundreds, tens<br />
and tens, ones and ones; and sometimes it is necessary to compose or decompose tens<br />
or hundreds. (2.NBT.7.)<br />
8. Mentally add 10 or 100 to a given number 100–900, and mentally subtract 10 or 100<br />
from a given number 100–900. (2.NBT.8.)<br />
9. Explain why addition and subtraction strategies work, using place value and the<br />
properties of operations. 3 (2.NBT.9.)<br />
1 See Glossary, Table 1.<br />
2 See standard 1.OA.6 for a list of mental strategies.<br />
3 Explanations may be supported by drawings or objects.<br />
Disclaimer: This document is up-to-date as of 11/17/2010. The language provided may not be Page 21 of 98<br />
modified in any way. The most current <strong>Iowa</strong> <strong>Core</strong> can be found at http://iowacore.educateiowa.gov.
Measurement and Data<br />
2.MD<br />
Measure and estimate lengths in standard units.<br />
1. Measure the length of an object by selecting and using appropriate tools such as rulers,<br />
yardsticks, meter sticks, and measuring tapes. (2.MD.1.)<br />
2. Measure the length of an object twice, using length units of different lengths for the<br />
two measurements; describe how the two measurements relate to the size of the unit<br />
chosen. (2.MD.2.)<br />
3. Estimate lengths using units of inches, feet, centimeters, and meters. (2.MD.3.)<br />
4. Measure to determine how much longer one object is than another, expressing the<br />
length difference in terms of a standard length unit. (2.MD.4.)<br />
Relate addition and subtraction to length.<br />
5. Use addition and subtraction within 100 to solve word problems involving lengths that<br />
are given in the same units, e.g., by using drawings (such as drawings of rulers) and<br />
equations with a symbol for the unknown number to represent the problem. (2.MD.5.)<br />
6. Represent whole numbers as lengths from 0 on a number line diagram with equally<br />
spaced points corresponding to the numbers 0, 1, 2, ..., and represent whole-number<br />
sums and differences within 100 on a number line diagram. (2.MD.6.)<br />
Work with time and money.<br />
7. Tell and write time from analog and digital clocks to the nearest five minutes, using a.m.<br />
and p.m. (2.MD.7.)<br />
IA.1.Describe the relationship among standard units of time: minutes, hours, days, weeks,<br />
months and years.<br />
8. Solve word problems involving dollar bills, quarters, dimes, nickels, and pennies, using $<br />
and ¢ symbols appropriately. Example: If you have 2 dimes and 3 pennies, how many<br />
cents do you have? (2.MD.8.)<br />
Represent and interpret data.<br />
9. Generate measurement data by measuring lengths of several objects to the nearest<br />
whole unit, or by making repeated measurements of the same object. Show the<br />
measurements by making a line plot, where the horizontal scale is marked off in wholenumber<br />
units. (2.MD.9.)<br />
IA.2Use interviews, surveys, and observations to collect data that answer questions about<br />
students' interests and/or their environment.<br />
10. Draw a picture graph and a bar graph (with single-unit scale) to represent a data set<br />
with up to four categories. Solve simple put-together, take-apart, and compare<br />
problems 4 using information presented in a bar graph. (2.MD.10.)<br />
Geometry 2.G<br />
Reason with shapes and their attributes.<br />
1. Recognize and draw shapes having specified attributes, such as a given number of<br />
angles or a given number of equal faces. 5 Identify triangles, quadrilaterals, pentagons,<br />
hexagons, and cubes. (2.G.1.)<br />
2. Partition a rectangle into rows and columns of same-size squares and count to find the<br />
total number of them. (2.G.2.)<br />
3. Partition circles and rectangles into two, three, or four equal shares, describe the shares<br />
using the words halves, thirds, half of, a third of, etc., and describe the whole as two<br />
halves, three thirds, four fourths. Recognize that equal shares of identical wholes need<br />
not have the same shape. (2.G.3.)<br />
4 See Glossary, Table 1.<br />
5 Sizes are compared directly or visually, not compared by measuring.<br />
Disclaimer: This document is up-to-date as of 11/17/2010. The language provided may not be Page 22 of 98<br />
modified in any way. The most current <strong>Iowa</strong> <strong>Core</strong> can be found at http://iowacore.educateiowa.gov.
<strong>Mathematics</strong> | Grade 3<br />
In Grade 3, instructional time should focus on four critical areas: (1) developing understanding<br />
of multiplication and division and strategies for multiplication and division within 100; (2)<br />
developing understanding of fractions, especially unit fractions (fractions with numerator 1); (3)<br />
developing understanding of the structure of rectangular arrays and of area; and (4) describing<br />
and analyzing two-dimensional shapes.<br />
(1) Students develop an understanding of the meanings of multiplication and division of whole numbers<br />
through activities and problems involving equal-sized groups, arrays, and area models; multiplication is<br />
finding an unknown product, and division is finding an unknown factor in these situations. For equal-sized<br />
group situations, division can require finding the unknown number of groups or the unknown group size.<br />
Students use properties of operations to calculate products of whole numbers, using increasingly<br />
sophisticated strategies based on these properties to solve multiplication and division problems involving<br />
single-digit factors. By comparing a variety of solution strategies, students learn the relationship between<br />
multiplication and division.<br />
(2) Students develop an understanding of fractions, beginning with unit fractions. Students view fractions<br />
in general as being built out of unit fractions, and they use fractions along with visual fraction models to<br />
represent parts of a whole. Students understand that the size of a fractional part is relative to the size of<br />
the whole. For example, 1/2 of the paint in a small bucket could be less paint than 1/3 of the paint in a<br />
larger bucket, but 1/3 of a ribbon is longer than 1/5 of the same ribbon because when the ribbon is<br />
divided into 3 equal parts, the parts are longer than when the ribbon is divided into 5 equal parts.<br />
Students are able to use fractions to represent numbers equal to, less than, and greater than one. They<br />
solve problems that involve comparing fractions by using visual fraction models and strategies based on<br />
noticing equal numerators or denominators.<br />
(3) Students recognize area as an attribute of two-dimensional regions. They measure the area of a shape<br />
by finding the total number of same-size units of area required to cover the shape without gaps or<br />
overlaps, a square with sides of unit length being the standard unit for measuring area. Students<br />
understand that rectangular arrays can be decomposed into identical rows or into identical columns. By<br />
decomposing rectangles into rectangular arrays of squares, students connect area to multiplication, and<br />
justify using multiplication to determine the area of a rectangle.<br />
(4) Students describe, analyze, and compare properties of two-dimensional shapes. They compare and<br />
classify shapes by their sides and angles, and connect these with definitions of shapes. Students also<br />
relate their fraction work to geometry by expressing the area of part of a shape as a unit fraction of the<br />
whole.<br />
Disclaimer: This document is up-to-date as of 11/17/2010. The language provided may not be Page 23 of 98<br />
modified in any way. The most current <strong>Iowa</strong> <strong>Core</strong> can be found at http://iowacore.educateiowa.gov.
Grade 3 Overview<br />
Operations and Algebraic Thinking<br />
• Represent and solve problems involving<br />
multiplication and division.<br />
• Understand properties of multiplication and the<br />
relationship between multiplication and division.<br />
• Multiply and divide within 100.<br />
• Solve problems involving the four operations, and<br />
identify and explain patterns in arithmetic.<br />
Number and Operations in Base Ten<br />
• Use place value understanding and properties of<br />
operations to perform multi-digit arithmetic.<br />
Number and Operations—Fractions<br />
• Develop understanding of fractions as numbers.<br />
Mathematical Practices<br />
1. Make sense of problems and<br />
persevere in solving them.<br />
2. Reason abstractly and quantitatively.<br />
3. Construct viable arguments and<br />
critique the reasoning of others.<br />
4. Model with mathematics.<br />
5. Use appropriate tools strategically.<br />
6. Attend to precision.<br />
7. Look for and make use of structure.<br />
8. Look for and express regularity in<br />
repeated reasoning.<br />
Measurement and Data<br />
• Solve problems involving measurement and<br />
estimation of intervals of time, liquid volumes,<br />
and masses of objects.<br />
• Represent and interpret data.<br />
• Geometric measurement: understand concepts<br />
of area and relate area to multiplication and to addition.<br />
• Geometric measurement: recognize perimeter<br />
as an attribute of plane figures and distinguish<br />
between linear and area measures.<br />
Geometry<br />
• Reason with shapes and their attributes.<br />
Disclaimer: This document is up-to-date as of 11/17/2010. The language provided may not be Page 24 of 98<br />
modified in any way. The most current <strong>Iowa</strong> <strong>Core</strong> can be found at http://iowacore.educateiowa.gov.
Operations and Algebraic Thinking<br />
3.OA<br />
Represent and solve problems involving multiplication and division.<br />
1. Interpret products of whole numbers, e.g., interpret 5 × 7 as the total number of objects<br />
in 5 groups of 7 objects each. For example, describe a context in which a total number of<br />
objects can be expressed as 5 × 7. (3.OA.1.)<br />
2. Interpret whole-number quotients of whole numbers, e.g., interpret 56 ÷ 8 as the<br />
number of objects in each share when 56 objects are partitioned equally into 8 shares,<br />
or as a number of shares when 56 objects are partitioned into equal shares of 8 objects<br />
each. For example, describe a context in which a number of shares or a number of<br />
groups can be expressed as 56 ÷ 8. (3.OA.2.)<br />
3. Use multiplication and division within 100 to solve word problems in situations involving<br />
equal groups, arrays, and measurement quantities, e.g., by using drawings and<br />
equations with a symbol for the unknown number to represent the problem. 1 (3.OA.3.)<br />
4. Determine the unknown whole number in a multiplication or division equation relating<br />
three whole numbers. For example, determine the unknown number that makes the<br />
equation true in each of the equations 8 × ? = 48, 5 = ÷ 3, 6 × 6 = ?. (3.OA.4.)<br />
Understand properties of multiplication and the relationship between multiplication and<br />
division.<br />
5. Apply properties of operations as strategies to multiply and divide. 2 Examples: If 6 × 4 =<br />
24 is known, then 4 × 6 = 24 is also known. (Commutative property of multiplication.) 3 ×<br />
5 × 2 can be found by 3 × 5 = 15, then 15 × 2 = 30, or by 5 × 2 = 10, then 3 × 10 = 30.<br />
(Associative property of multiplication.) Knowing that 8 × 5 = 40 and 8 × 2 = 16, one can<br />
find 8 × 7 as 8 × (5 + 2) = (8 × 5) + (8 × 2) = 40 + 16 = 56. (Distributive property.) (3.OA.5.)<br />
6. Understand division as an unknown-factor problem. For example, find 32 ÷ 8 by finding<br />
the number that makes 32 when multiplied by 8. (3.OA.6.)<br />
Multiply and divide within 100<br />
7. Fluently multiply and divide within 100, using strategies such as the relationship<br />
between multiplication and division (e.g., knowing that 8 × 5 = 40, one knows 40 ÷ 5 = 8)<br />
or properties of operations. By the end of Grade 3, know from memory all products of<br />
two one-digit numbers. (3.OA.7.)<br />
Solve problems involving the four operations, and identify and explain patterns in arithmetic.<br />
8. Solve two-step word problems using the four operations. Represent these problems<br />
using equations with a letter standing for the unknown quantity. Assess the<br />
reasonableness of answers using mental computation and estimation strategies<br />
including rounding. 3 (3.OA.8.)<br />
9. Identify arithmetic patterns (including patterns in the addition table or multiplication<br />
table), and explain them using properties of operations. For example, observe that 4<br />
times a number is always even, and explain why 4 times a number can be decomposed<br />
into two equal addends. (3.OA.9.)<br />
1 See Glossary, Table 2.<br />
2 Students need not use formal terms for these properties.<br />
3 This standard is limited to problems posed with whole numbers and having whole-number answers; students<br />
should know how to perform operations in the conventional order when there are no parentheses to specify a<br />
particular order (Order of Operations).<br />
Disclaimer: This document is up-to-date as of 11/17/2010. The language provided may not be Page 25 of 98<br />
modified in any way. The most current <strong>Iowa</strong> <strong>Core</strong> can be found at http://iowacore.educateiowa.gov.
Number and Operations in Base Ten<br />
3.NBT<br />
Use place value understanding and properties of operations to perform multi-digit arithmetic. 4<br />
1. Use place value understanding to round whole numbers to the nearest 10 or 100.<br />
(3.NBT.1.)<br />
2. Fluently add and subtract within 1000 using strategies and algorithms based on place<br />
value, properties of operations, and/or the relationship between addition and<br />
subtraction. (3.NBT.2.)<br />
3. Multiply one-digit whole numbers by multiples of 10 in the range 10–90 (e.g., 9 × 80, 5 ×<br />
60) using strategies based on place value and properties of operations. (3.NBT.3.)<br />
Number and Operations—Fractions 5<br />
3.NF<br />
Develop understanding of fractions as numbers.<br />
1. Understand a fraction 1/b as the quantity formed by 1 part when a whole is partitioned<br />
into b equal parts; understand a fraction a/b as the quantity formed by a parts of size<br />
1/b. (3.NF.1.)<br />
2. Understand a fraction as a number on the number line; represent fractions on a number<br />
line diagram.<br />
a. Represent a fraction 1/b on a number line diagram by defining the interval<br />
from 0 to 1 as the whole and partitioning it into b equal parts. Recognize that<br />
each part has size 1/b and that the endpoint of the part based at 0 locates the<br />
number 1/b on the number line.<br />
b. Represent a fraction a/b on a number line diagram by marking off a lengths 1/b<br />
from 0. Recognize that the resulting interval has size a/b and that its endpoint<br />
locates the number a/b on the number line. (3.NF.2.)<br />
3. Explain equivalence of fractions in special cases, and compare fractions by reasoning<br />
about their size.<br />
a. Understand two fractions as equivalent (equal) if they are the same size, or the<br />
same point on a number line.<br />
b. Recognize and generate simple equivalent fractions, e.g., 1/2 = 2/4, 4/6 = 2/3).<br />
Explain why the fractions are equivalent, e.g., by using a visual fraction model.<br />
c. Express whole numbers as fractions, and recognize fractions that are<br />
equivalent to whole numbers. Examples: Express 3 in the form 3 = 3/1;<br />
recognize that 6/1 = 6; locate 4/4 and 1 at the same point of a number line<br />
diagram.<br />
d. Compare two fractions with the same numerator or the same denominator by<br />
reasoning about their size. Recognize that comparisons are valid only when the<br />
two fractions refer to the same whole. Record the results of comparisons with<br />
the symbols >, =, or
2. Measure and estimate liquid volumes and masses of objects using standard units of<br />
grams (g), kilograms (kg), and liters (l). 6 Add, subtract, multiply, or divide to solve onestep<br />
word problems involving masses or volumes that are given in the same units, e.g.,<br />
by using drawings (such as a beaker with a measurement scale) to represent the<br />
problem. 7 (3.MD.2.)<br />
Represent and interpret data.<br />
3. Draw a scaled picture graph and a scaled bar graph to represent a data set with several<br />
categories. Solve one- and two-step "how many more" and "how many less" problems<br />
using information presented in scaled bar graphs. For example, draw a bar graph in<br />
which each square in the bar graph might represent 5 pets. (3.MD.3.)<br />
4. Generate measurement data by measuring lengths using rulers marked with halves and<br />
fourths of an inch. Show the data by making a line plot, where the horizontal scale is<br />
marked off in appropriate units—whole numbers, halves, or quarters. (3.MD.4.)<br />
Geometric measurement: understand concepts of area and relate area to multiplication and to<br />
addition.<br />
5. Recognize area as an attribute of plane figures and understand concepts of area<br />
measurement.<br />
a. A square with side length 1 unit, called "a unit square," is said to have "one<br />
square unit" of area, and can be used to measure area.<br />
b. A plane figure which can be covered without gaps or overlaps by n unit squares<br />
is said to have an area of n square units. (3.MD.5.)<br />
6. Measure areas by counting unit squares (square cm, square m, square in, square ft, and<br />
improvised units). (3.MD.6.)<br />
7. Relate area to the operations of multiplication and addition.<br />
a. Find the area of a rectangle with whole-number side lengths by tiling it, and<br />
show that the area is the same as would be found by multiplying the side<br />
lengths.<br />
b. Multiply side lengths to find areas of rectangles with whole-number side<br />
lengths in the context of solving real world and mathematical problems, and<br />
represent whole-number products as rectangular areas in mathematical<br />
reasoning.<br />
c. Use tiling to show in a concrete case that the area of a rectangle with wholenumber<br />
side lengths a and b + c is the sum of a × b and a × c. Use area models<br />
to represent the distributive property in mathematical reasoning.<br />
d. Recognize area as additive. Find areas of rectilinear figures by decomposing<br />
them into non-overlapping rectangles and adding the areas of the nonoverlapping<br />
parts, applying this technique to solve real world problems.<br />
(3.MD.7.)<br />
Geometric measurement: recognize perimeter as an attribute of plane figures and distinguish<br />
between linear and area measures.<br />
8. Solve real world and mathematical problems involving perimeters of polygons, including<br />
finding the perimeter given the side lengths, finding an unknown side length, and<br />
exhibiting rectangles with the same perimeter and different areas or with the same area<br />
and different perimeters. (3.MD.8.)<br />
6 Excludes compound units such as cm 3 and finding the geometric volume of a container.<br />
7 Excludes multiplicative comparison problems (problems involving notions of "times as much"; see Glossary, Table<br />
2).<br />
Disclaimer: This document is up-to-date as of 11/17/2010. The language provided may not be Page 27 of 98<br />
modified in any way. The most current <strong>Iowa</strong> <strong>Core</strong> can be found at http://iowacore.educateiowa.gov.
Geometry 3.G<br />
Reason with shapes and their attributes.<br />
1. Understand that shapes in different categories (e.g., rhombuses, rectangles, and others)<br />
may share attributes (e.g., having four sides), and that the shared attributes can define<br />
a larger category (e.g., quadrilaterals). Recognize rhombuses, rectangles, and squares as<br />
examples of quadrilaterals, and draw examples of quadrilaterals that do not belong to<br />
any of these subcategories. (3.G.1.)<br />
2. Partition shapes into parts with equal areas. Express the area of each part as a unit<br />
fraction of the whole. For example, partition a shape into 4 parts with equal area, and<br />
describe the area of each part as 1/4 of the area of the shape. (3.G.2.)<br />
Disclaimer: This document is up-to-date as of 11/17/2010. The language provided may not be Page 28 of 98<br />
modified in any way. The most current <strong>Iowa</strong> <strong>Core</strong> can be found at http://iowacore.educateiowa.gov.
<strong>Mathematics</strong> | Grade 4<br />
In Grade 4, instructional time should focus on three critical areas: (1) developing understanding<br />
and fluency with multi-digit multiplication, and developing understanding of dividing to find<br />
quotients involving multi-digit dividends; (2) developing an understanding of fraction<br />
equivalence, addition and subtraction of fractions with like denominators, and multiplication of<br />
fractions by whole numbers; (3) understanding that geometric figures can be analyzed and<br />
classified based on their properties, such as having parallel sides, perpendicular sides, particular<br />
angle measures, and symmetry.<br />
(1) Students generalize their understanding of place value to 1,000,000, understanding the relative sizes<br />
of numbers in each place. They apply their understanding of models for multiplication (equal-sized<br />
groups, arrays, area models), place value, and properties of operations, in particular the distributive<br />
property, as they develop, discuss, and use efficient, accurate, and generalizable methods to compute<br />
products of multi-digit whole numbers. Depending on the numbers and the context, they select and<br />
accurately apply appropriate methods to estimate or mentally calculate products. They develop fluency<br />
with efficient procedures for multiplying whole numbers; understand and explain why the procedures<br />
work based on place value and properties of operations; and use them to solve problems. Students apply<br />
their understanding of models for division, place value, properties of operations, and the relationship of<br />
division to multiplication as they develop, discuss, and use efficient, accurate, and generalizable<br />
procedures to find quotients involving multi-digit dividends. They select and accurately apply appropriate<br />
methods to estimate and mentally calculate quotients, and interpret remainders based upon the context.<br />
(2) Students develop understanding of fraction equivalence and operations with fractions. They recognize<br />
that two different fractions can be equal (e.g., 15/9 = 5/3), and they develop methods for generating and<br />
recognizing equivalent fractions. Students extend previous understandings about how fractions are built<br />
from unit fractions, composing fractions from unit fractions, decomposing fractions into unit fractions,<br />
and using the meaning of fractions and the meaning of multiplication to multiply a fraction by a whole<br />
number.<br />
(3) Students describe, analyze, compare, and classify two-dimensional shapes. Through building, drawing,<br />
and analyzing two-dimensional shapes, students deepen their understanding of properties of twodimensional<br />
objects and the use of them to solve problems involving symmetry.<br />
Disclaimer: This document is up-to-date as of 11/17/2010. The language provided may not be Page 29 of 98<br />
modified in any way. The most current <strong>Iowa</strong> <strong>Core</strong> can be found at http://iowacore.educateiowa.gov.
Grade 4 Overview<br />
Operations and Algebraic Thinking<br />
• Use the four operations with whole numbers to<br />
solve problems.<br />
• Gain familiarity with factors and multiples.<br />
• Generate and analyze patterns.<br />
Number and Operations in Base Ten<br />
• Generalize place value understanding for multi-digit<br />
whole numbers.<br />
• Use place value understanding and properties of<br />
operations to perform multi-digit arithmetic.<br />
Number and Operations—Fractions<br />
• Extend understanding of fraction equivalence<br />
and ordering.<br />
• Build fractions from unit fractions by applying<br />
and extending previous understandings of<br />
operations on whole numbers.<br />
• Understand decimal notation for fractions, and<br />
compare decimal fractions.<br />
Mathematical Practices<br />
1. Make sense of problems and<br />
persevere in solving them.<br />
2. Reason abstractly and quantitatively.<br />
3. Construct viable arguments and<br />
critique the reasoning of others.<br />
4. Model with mathematics.<br />
5. Use appropriate tools strategically.<br />
6. Attend to precision.<br />
7. Look for and make use of structure.<br />
8. Look for and express regularity in<br />
repeated reasoning.<br />
Measurement and Data<br />
• Solve problems involving measurement and<br />
conversion of measurements from a larger unit to<br />
a smaller unit.<br />
• Represent and interpret data.<br />
• Geometric measurement: understand concepts of<br />
angle and measure angles.<br />
Geometry<br />
• Draw and identify lines and angles, and classify<br />
shapes by properties of their lines and angles.<br />
Disclaimer: This document is up-to-date as of 11/17/2010. The language provided may not be Page 30 of 98<br />
modified in any way. The most current <strong>Iowa</strong> <strong>Core</strong> can be found at http://iowacore.educateiowa.gov.
Operations and Algebraic Thinking<br />
4.OA<br />
Use the four operations with whole numbers to solve problems.<br />
1. Interpret a multiplication equation as a comparison, e.g., interpret 35 = 5 × 7 as a<br />
statement that 35 is 5 times as many as 7 and 7 times as many as 5. Represent verbal<br />
statements of multiplicative comparisons as multiplication equations. (4.OA.1.)<br />
2. Multiply or divide to solve word problems involving multiplicative comparison, e.g., by<br />
using drawings and equations with a symbol for the unknown number to represent the<br />
problem, distinguishing multiplicative comparison from additive comparison. 1 (4.OA.2.)<br />
3. Solve multistep word problems posed with whole numbers and having whole-number<br />
answers using the four operations, including problems in which remainders must be<br />
interpreted. Represent these problems using equations with a letter standing for the<br />
unknown quantity. Assess the reasonableness of answers using mental computation<br />
and estimation strategies including rounding. (4.OA.3.)<br />
Gain familiarity with factors and multiples.<br />
4. Find all factor pairs for a whole number in the range 1–100. Recognize that a whole<br />
number is a multiple of each of its factors. Determine whether a given whole number in<br />
the range 1–100 is a multiple of a given one-digit number. Determine whether a given<br />
whole number in the range 1–100 is prime or composite. (4.OA.4.)<br />
Generate and analyze patterns.<br />
5. Generate a number or shape pattern that follows a given rule. Identify apparent<br />
features of the pattern that were not explicit in the rule itself. For example, given the<br />
rule "Add 3" and the starting number 1, generate terms in the resulting sequence and<br />
observe that the terms appear to alternate between odd and even numbers. Explain<br />
informally why the numbers will continue to alternate in this way. (4.OA.5.)<br />
Number and Operations in Base Ten 2<br />
4.NBT<br />
Generalize place value understanding for multi-digit whole numbers.<br />
1. Recognize that in a multi-digit whole number, a digit in one place represents ten times<br />
what it represents in the place to its right. For example, recognize that 700 ÷ 70 = 10 by<br />
applying concepts of place value and division. (4.NBT.1.)<br />
2. Read and write multi-digit whole numbers using base-ten numerals, number names,<br />
and expanded form. Compare two multi-digit numbers based on meanings of the digits<br />
in each place, using >, =, and < symbols to record the results of comparisons. (4.NBT.2.)<br />
3. Use place value understanding to round multi-digit whole numbers to any place.<br />
(4.NBT.3.)<br />
Use place value understanding and properties of operations to perform multi-digit arithmetic.<br />
4. Fluently add and subtract multi-digit whole numbers using the standard algorithm.<br />
(4.NBT.4.)<br />
5. Multiply a whole number of up to four digits by a one-digit whole number, and multiply<br />
two two-digit numbers, using strategies based on place value and the properties of<br />
operations. Illustrate and explain the calculation by using equations, rectangular arrays,<br />
and/or area models. (4.NBT.5.)<br />
1 See Glossary, Table 2.<br />
2 Grade 4 expectations in this domain are limited to whole numbers less than or equal to 1,000,000.<br />
Disclaimer: This document is up-to-date as of 11/17/2010. The language provided may not be Page 31 of 98<br />
modified in any way. The most current <strong>Iowa</strong> <strong>Core</strong> can be found at http://iowacore.educateiowa.gov.
6. Find whole-number quotients and remainders with up to four-digit dividends and onedigit<br />
divisors, using strategies based on place value, the properties of operations, and/or<br />
the relationship between multiplication and division. Illustrate and explain the<br />
calculation by using equations, rectangular arrays, and/or area models. (4.NBT.6.)<br />
Number and Operations—Fractions 3<br />
4.NF<br />
Extend understanding of fraction equivalence and ordering.<br />
1. Explain why a fraction a/b is equivalent to a fraction (n × a)/(n × b) by using visual<br />
fraction models, with attention to how the number and size of the parts differ even<br />
though the two fractions themselves are the same size. Use this principle to recognize<br />
and generate equivalent fractions. (4.NF.1.)<br />
2. Compare two fractions with different numerators and different denominators, e.g., by<br />
creating common denominators or numerators, or by comparing to a benchmark<br />
fraction such as 1/2. Recognize that comparisons are valid only when the two fractions<br />
refer to the same whole. Record the results of comparisons with symbols >, =, or 1 as a sum of fractions 1/b.<br />
a. Understand addition and subtraction of fractions as joining and separating<br />
parts referring to the same whole.<br />
b. Decompose a fraction into a sum of fractions with the same denominator in<br />
more than one way, recording each decomposition by an equation. Justify<br />
decompositions, e.g., by using a visual fraction model. Examples: 3/8 = 1/8 +<br />
1/8 + 1/8 ; 3/8 = 1/8 + 2/8 ; 2 1/8 = 1 + 1 + 1/8 = 8/8 + 8/8 + 1/8.<br />
c. Add and subtract mixed numbers with like denominators, e.g., by replacing<br />
each mixed number with an equivalent fraction, and/or by using properties of<br />
operations and the relationship between addition and subtraction.<br />
d. Solve word problems involving addition and subtraction of fractions referring<br />
to the same whole and having like denominators, e.g., by using visual fraction<br />
models and equations to represent the problem. (4.NF.3.)<br />
4. Apply and extend previous understandings of multiplication to multiply a fraction by a<br />
whole number.<br />
a. Understand a fraction a/b as a multiple of 1/b. For example, use a visual<br />
fraction model to represent 5/4 as the product 5 × (1/4), recording the<br />
conclusion by the equation 5/4 = 5 × (1/4).<br />
b. Understand a multiple of a/b as a multiple of 1/b, and use this understanding<br />
to multiply a fraction by a whole number. For example, use a visual fraction<br />
model to express 3 × (2/5) as 6 × (1/5), recognizing this product as 6/5. (In<br />
general, n × (a/b) = (n × a)/b.)<br />
c. Solve word problems involving multiplication of a fraction by a whole number,<br />
e.g., by using visual fraction models and equations to represent the problem.<br />
For example, if each person at a party will eat 3/8 of a pound of roast beef, and<br />
there will be 5 people at the party, how many pounds of roast beef will be<br />
needed? Between what two whole numbers does your answer lie? (4.NF.4.)<br />
3 Grade 4 expectations in this domain are limited to fractions with denominators 2, 3, 4, 5, 6, 8, 10, <strong>12</strong>, and 100.<br />
Disclaimer: This document is up-to-date as of 11/17/2010. The language provided may not be Page 32 of 98<br />
modified in any way. The most current <strong>Iowa</strong> <strong>Core</strong> can be found at http://iowacore.educateiowa.gov.
Understand decimal notation for fractions, and compare decimal fractions.<br />
5. Express a fraction with denominator 10 as an equivalent fraction with denominator 100,<br />
and use this technique to add two fractions with respective denominators 10 and 100. 4<br />
For example, express 3/10 as 30/100, and add 3/10 + 4/100 = 34/100. (4.NF.5.)<br />
6. Use decimal notation for fractions with denominators 10 or 100. For example, rewrite<br />
0.62 as 62/100; describe a length as 0.62 meters; locate 0.62 on a number line diagram.<br />
(4.NF.6.)<br />
7. Compare two decimals to hundredths by reasoning about their size. Recognize that<br />
comparisons are valid only when the two decimals refer to the same whole. Record the<br />
results of comparisons with the symbols >, =, or
6. Measure angles in whole-number degrees using a protractor. Sketch angles of specified<br />
measure. (4.MD.6.)<br />
7. Recognize angle measure as additive. When an angle is decomposed into nonoverlapping<br />
parts, the angle measure of the whole is the sum of the angle measures of<br />
the parts. Solve addition and subtraction problems to find unknown angles on a diagram<br />
in real world and mathematical problems, e.g., by using an equation with a symbol for<br />
the unknown angle measure. (4.MD.7.)<br />
Geometry 4.G<br />
Draw and identify lines and angles, and classify shapes by properties of their lines and angles.<br />
1. Draw points, lines, line segments, rays, angles (right, acute, obtuse), and perpendicular<br />
and parallel lines. Identify these in two-dimensional figures. (4.G.1.)<br />
2. Classify two-dimensional figures based on the presence or absence of parallel or<br />
perpendicular lines, or the presence or absence of angles of a specified size. Recognize<br />
right triangles as a category, and identify right triangles. (4.G.2.)<br />
3. Recognize a line of symmetry for a two-dimensional figure as a line across the figure<br />
such that the figure can be folded along the line into matching parts. Identify linesymmetric<br />
figures and draw lines of symmetry. (4.G.3.)<br />
Disclaimer: This document is up-to-date as of 11/17/2010. The language provided may not be Page 34 of 98<br />
modified in any way. The most current <strong>Iowa</strong> <strong>Core</strong> can be found at http://iowacore.educateiowa.gov.
<strong>Mathematics</strong> | Grade 5<br />
In Grade 5, instructional time should focus on three critical areas: (1) developing fluency with<br />
addition and subtraction of fractions, and developing understanding of the multiplication of<br />
fractions and of division of fractions in limited cases (unit fractions divided by whole numbers<br />
and whole numbers divided by unit fractions); (2) extending division to 2-digit divisors,<br />
integrating decimal fractions into the place value system and developing understanding of<br />
operations with decimals to hundredths, and developing fluency with whole number and<br />
decimal operations; and (3) developing understanding of volume.<br />
(1) Students apply their understanding of fractions and fraction models to represent the addition and<br />
subtraction of fractions with unlike denominators as equivalent calculations with like denominators. They<br />
develop fluency in calculating sums and differences of fractions, and make reasonable estimates of them.<br />
Students also use the meaning of fractions, of multiplication and division, and the relationship between<br />
multiplication and division to understand and explain why the procedures for multiplying and dividing<br />
fractions make sense. (Note: this is limited to the case of dividing unit fractions by whole numbers and<br />
whole numbers by unit fractions.)<br />
(2) Students develop understanding of why division procedures work based on the meaning of base-ten<br />
numerals and properties of operations. They finalize fluency with multi-digit addition, subtraction,<br />
multiplication, and division. They apply their understandings of models for decimals, decimal notation,<br />
and properties of operations to add and subtract decimals to hundredths. They develop fluency in these<br />
computations, and make reasonable estimates of their results. Students use the relationship between<br />
decimals and fractions, as well as the relationship between finite decimals and whole numbers (i.e., a<br />
finite decimal multiplied by an appropriate power of 10 is a whole number), to understand and explain<br />
why the procedures for multiplying and dividing finite decimals make sense. They compute products and<br />
quotients of decimals to hundredths efficiently and accurately.<br />
(3) Students recognize volume as an attribute of three-dimensional space. They understand that volume<br />
can be measured by finding the total number of same-size units of volume required to fill the space<br />
without gaps or overlaps. They understand that a 1-unit by 1-unit by 1-unit cube is the standard unit for<br />
measuring volume. They select appropriate units, strategies, and tools for solving problems that involve<br />
estimating and measuring volume. They decompose three-dimensional shapes and find volumes of right<br />
rectangular prisms by viewing them as decomposed into layers of arrays of cubes. They measure<br />
necessary attributes of shapes in order to determine volumes to solve real world and mathematical<br />
problems.<br />
Disclaimer: This document is up-to-date as of 11/17/2010. The language provided may not be Page 35 of 98<br />
modified in any way. The most current <strong>Iowa</strong> <strong>Core</strong> can be found at http://iowacore.educateiowa.gov.
Grade 5 Overview<br />
Operations and Algebraic Thinking<br />
• Write and interpret numerical expressions.<br />
• Analyze patterns and relationships.<br />
Number and Operations in Base Ten<br />
• Understand the place value system.<br />
• Perform operations with multi-digit whole<br />
numbers and with decimals to hundredths.<br />
Number and Operations—Fractions<br />
• Use equivalent fractions as a strategy to add and<br />
subtract fractions.<br />
• Apply and extend previous understandings of<br />
multiplication and division to multiply and divide<br />
fractions.<br />
Mathematical Practices<br />
1. Make sense of problems and<br />
persevere in solving them.<br />
2. Reason abstractly and quantitatively.<br />
3. Construct viable arguments and<br />
critique the reasoning of others.<br />
4. Model with mathematics.<br />
5. Use appropriate tools strategically.<br />
6. Attend to precision.<br />
7. Look for and make use of structure.<br />
8. Look for and express regularity in<br />
repeated reasoning.<br />
Measurement and Data<br />
• Convert like measurement units within a given<br />
measurement system.<br />
• Represent and interpret data.<br />
• Geometric measurement: understand concepts<br />
of volume and relate volume to multiplication<br />
and to addition.<br />
Geometry<br />
• Graph points on the coordinate plane to solve<br />
real-world and mathematical problems.<br />
• Classify two-dimensional figures into categories<br />
based on their properties.<br />
Disclaimer: This document is up-to-date as of 11/17/2010. The language provided may not be Page 36 of 98<br />
modified in any way. The most current <strong>Iowa</strong> <strong>Core</strong> can be found at http://iowacore.educateiowa.gov.
Operations and Algebraic Thinking<br />
5.OA<br />
Write and interpret numerical expressions.<br />
1. Use parentheses, brackets, or braces in numerical expressions, and evaluate expressions<br />
with these symbols. (5.OA.1.)<br />
2. Write simple expressions that record calculations with numbers, and interpret<br />
numerical expressions without evaluating them. For example, express the calculation<br />
"add 8 and 7, then multiply by 2" as 2 × (8 + 7). Recognize that 3 × (18932 + 921) is three<br />
times as large as 18932 + 921, without having to calculate the indicated sum or product.<br />
(5.OA.2.)<br />
Analyze patterns and relationships.<br />
3. Generate two numerical patterns using two given rules. Identify apparent relationships<br />
between corresponding terms. Form ordered pairs consisting of corresponding terms<br />
from the two patterns, and graph the ordered pairs on a coordinate plane. For example,<br />
given the rule "Add 3" and the starting number 0, and given the rule "Add 6" and the<br />
starting number 0, generate terms in the resulting sequences, and observe that the<br />
terms in one sequence are twice the corresponding terms in the other sequence. Explain<br />
informally why this is so. (5.OA.3.)<br />
Number and Operations in Base Ten<br />
5.NBT<br />
Understand the place value system.<br />
1. Recognize that in a multi-digit number, a digit in one place represents 10 times as much<br />
as it represents in the place to its right and 1/10 of what it represents in the place to its<br />
left. (5.NBT.1.)<br />
2. Explain patterns in the number of zeros of the product when multiplying a number by<br />
powers of 10, and explain patterns in the placement of the decimal point when a<br />
decimal is multiplied or divided by a power of 10. Use whole-number exponents to<br />
denote powers of 10. (5.NBT.2.)<br />
3. Read, write, and compare decimals to thousandths.<br />
a. Read and write decimals to thousandths using base-ten numerals, number<br />
names, and expanded form, e.g., 347.392 = 3 × 100 + 4 × 10 + 7 × 1 + 3 × (1/10)<br />
+ 9 × (1/100) + 2 × (1/1000).<br />
b. Compare two decimals to thousandths based on meanings of the digits in each<br />
place, using >, =, and < symbols to record the results of comparisons.<br />
(5.NBT.3.)<br />
4. Use place value understanding to round decimals to any place. (5.NBT.4.)<br />
Perform operations with multi-digit whole numbers and with decimals to hundredths.<br />
5. Fluently multiply multi-digit whole numbers using the standard algorithm. (5.NBT.5.)<br />
6. Find whole-number quotients of whole numbers with up to four-digit dividends and<br />
two-digit divisors, using strategies based on place value, the properties of operations,<br />
and/or the relationship between multiplication and division. Illustrate and explain the<br />
calculation by using equations, rectangular arrays, and/or area models. (5.NBT.6.)<br />
7. Add, subtract, multiply, and divide decimals to hundredths, using concrete models or<br />
drawings and strategies based on place value, properties of operations, and/or the<br />
relationship between addition and subtraction; relate the strategy to a written method<br />
and explain the reasoning used. (5.NBT.7.)<br />
Disclaimer: This document is up-to-date as of 11/17/2010. The language provided may not be Page 37 of 98<br />
modified in any way. The most current <strong>Iowa</strong> <strong>Core</strong> can be found at http://iowacore.educateiowa.gov.
Number and Operations—Fractions<br />
5.NF<br />
Use equivalent fractions as a strategy to add and subtract fractions.<br />
1. Add and subtract fractions with unlike denominators (including mixed numbers) by<br />
replacing given fractions with equivalent fractions in such a way as to produce an<br />
equivalent sum or difference of fractions with like denominators. For example, 2/3 + 5/4<br />
= 8/<strong>12</strong> + 15/<strong>12</strong> = 23/<strong>12</strong>. (In general, a/b + c/d = (ad + bc)/bd.) (5.NF.1.)<br />
2. Solve word problems involving addition and subtraction of fractions referring to the<br />
same whole, including cases of unlike denominators, e.g., by using visual fraction<br />
models or equations to represent the problem. Use benchmark fractions and number<br />
sense of fractions to estimate mentally and assess the reasonableness of answers. For<br />
example, recognize an incorrect result 2/5 + 1/2 = 3/7, by observing that 3/7 < 1/2.<br />
(5.NF.2.)<br />
Apply and extend previous understandings of multiplication and division to multiply and divide<br />
fractions.<br />
3. Interpret a fraction as division of the numerator by the denominator (a/b = a ÷ b). Solve<br />
word problems involving division of whole numbers leading to answers in the form of<br />
fractions or mixed numbers, e.g., by using visual fraction models or equations to<br />
represent the problem. For example, interpret 3/4 as the result of dividing 3 by 4, noting<br />
that 3/4 multiplied by 4 equals 3, and that when 3 wholes are shared equally among 4<br />
people each person has a share of size 3/4. If 9 people want to share a 50-pound sack of<br />
rice equally by weight, how many pounds of rice should each person get? Between what<br />
two whole numbers does your answer lie? (5.NF.3.)<br />
4. Apply and extend previous understandings of multiplication to multiply a fraction or<br />
whole number by a fraction.<br />
a. Interpret the product (a/b) × q as a parts of a partition of q into b equal parts;<br />
equivalently, as the result of a sequence of operations a × q ÷ b. For example,<br />
use a visual fraction model to show (2/3) × 4 = 8/3, and create a story context<br />
for this equation. Do the same with (2/3) × (4/5) = 8/15. (In general, (a/b) ×<br />
(c/d) = ac/bd.)<br />
b. Find the area of a rectangle with fractional side lengths by tiling it with unit<br />
squares of the appropriate unit fraction side lengths, and show that the area is<br />
the same as would be found by multiplying the side lengths. Multiply fractional<br />
side lengths to find areas of rectangles, and represent fraction products as<br />
rectangular areas. (5.NF.4.)<br />
5. Interpret multiplication as scaling (resizing), by:<br />
a. Comparing the size of a product to the size of one factor on the basis of the<br />
size of the other factor, without performing the indicated multiplication.<br />
b. Explaining why multiplying a given number by a fraction greater than 1 results<br />
in a product greater than the given number (recognizing multiplication by<br />
whole numbers greater than 1 as a familiar case); explaining why multiplying a<br />
given number by a fraction less than 1 results in a product smaller than the<br />
given number; and relating the principle of fraction equivalence a/b =<br />
(n×a)/(n×b) to the effect of multiplying a/b by 1. (5.NF.5.)<br />
6. Solve real world problems involving multiplication of fractions and mixed numbers, e.g.,<br />
by using visual fraction models or equations to represent the problem. (5.NF.6.)<br />
Disclaimer: This document is up-to-date as of 11/17/2010. The language provided may not be Page 38 of 98<br />
modified in any way. The most current <strong>Iowa</strong> <strong>Core</strong> can be found at http://iowacore.educateiowa.gov.
7. Apply and extend previous understandings of division to divide unit fractions by whole<br />
numbers and whole numbers by unit fractions. 1<br />
a. Interpret division of a unit fraction by a non-zero whole number, and compute<br />
such quotients. For example, create a story context for (1/3) ÷ 4, and use a visual<br />
fraction model to show the quotient. Use the relationship between multiplication<br />
and division to explain that (1/3) ÷ 4 = 1/<strong>12</strong> because (1/<strong>12</strong>) × 4 = 1/3.<br />
b. Interpret division of a whole number by a unit fraction, and compute such<br />
quotients. For example, create a story context for 4 ÷ (1/5), and use a visual<br />
fraction model to show the quotient. Use the relationship between multiplication<br />
and division to explain that 4 ÷ (1/5) = 20 because 20 × (1/5) = 4.<br />
c. Solve real world problems involving division of unit fractions by non-zero whole<br />
numbers and division of whole numbers by unit fractions, e.g., by using visual<br />
fraction models and equations to represent the problem. For example, how much<br />
chocolate will each person get if 3 people share 1/2 lb of chocolate equally? How<br />
many 1/3-cup servings are in 2 cups of raisins? (5.NF.7.)<br />
Measurement and Data<br />
5.MD<br />
Convert like measurement units within a given measurement system.<br />
1. Convert among different-sized standard measurement units within a given measurement<br />
system (e.g., convert 5 cm to 0.05 m), and use these conversions in solving multi-step, real<br />
world problems. (5.MD.1.)<br />
Represent and interpret data.<br />
2. Make a line plot to display a data set of measurements in fractions of a unit (1/2, 1/4, 1/8).<br />
Use operations on fractions for this grade to solve problems involving information<br />
presented in line plots. For example, given different measurements of liquid in identical<br />
beakers, find the amount of liquid each beaker would contain if the total amount in all the<br />
beakers were redistributed equally. (5.MD.2.)<br />
Geometric measurement: understand concepts of volume and relate volume to multiplication and<br />
to addition.<br />
3. Recognize volume as an attribute of solid figures and understand concepts of volume<br />
measurement.<br />
a. A cube with side length 1 unit, called a "unit cube," is said to have "one cubic unit"<br />
of volume, and can be used to measure volume.<br />
b. A solid figure which can be packed without gaps or overlaps using n unit cubes is<br />
said to have a volume of n cubic units. (5.MD.3.)<br />
4. Measure volumes by counting unit cubes, using cubic cm, cubic in, cubic ft, and improvised<br />
units. (5.MD.4.)<br />
5. Relate volume to the operations of multiplication and addition and solve real world and<br />
mathematical problems involving volume.<br />
a. Find the volume of a right rectangular prism with whole-number side lengths by<br />
packing it with unit cubes, and show that the volume is the same as would be<br />
found by multiplying the edge lengths, equivalently by multiplying the height by<br />
the area of the base. Represent threefold whole-number products as volumes,<br />
e.g., to represent the associative property of multiplication.<br />
b. Apply the formulas V = l × w × h and V = b × h for rectangular prisms to find<br />
volumes of right rectangular prisms with whole-number edge lengths in the<br />
context of solving real world and mathematical problems.<br />
c. Recognize volume as additive. Find volumes of solid figures composed of two nonoverlapping<br />
right rectangular prisms by adding the volumes of the nonoverlapping<br />
parts, applying this technique to solve real world problems. (5.MD.5.)<br />
1 Students able to multiply fractions in general can develop strategies to divide fractions in general, by reasoning<br />
about the relationship between multiplication and division. But division of a fraction by a fraction is not a<br />
requirement at this grade.<br />
Disclaimer: This document is up-to-date as of 11/17/2010. The language provided may not be Page 39 of 98<br />
modified in any way. The most current <strong>Iowa</strong> <strong>Core</strong> can be found at http://iowacore.educateiowa.gov.
Geometry 5.G<br />
Graph points on the coordinate plane to solve real-world and mathematical problems.<br />
1. Use a pair of perpendicular number lines, called axes, to define a coordinate system,<br />
with the intersection of the lines (the origin) arranged to coincide with the 0 on each<br />
line and a given point in the plane located by using an ordered pair of numbers, called<br />
its coordinates. Understand that the first number indicates how far to travel from the<br />
origin in the direction of one axis, and the second number indicates how far to travel in<br />
the direction of the second axis, with the convention that the names of the two axes<br />
and the coordinates correspond (e.g., x-axis and x-coordinate, y-axis and y-coordinate).<br />
(5.G.1.)<br />
2. Represent real world and mathematical problems by graphing points in the first<br />
quadrant of the coordinate plane, and interpret coordinate values of points in the<br />
context of the situation. (5.G.1.)<br />
Classify two-dimensional figures into categories based on their properties.<br />
3. Understand that attributes belonging to a category of two-dimensional figures also<br />
belong to all subcategories of that category. For example, all rectangles have four right<br />
angles and squares are rectangles, so all squares have four right angles. (5.G.1.)<br />
4. Classify two-dimensional figures in a hierarchy based on properties. (5.G.1.)<br />
Disclaimer: This document is up-to-date as of 11/17/2010. The language provided may not be Page 40 of 98<br />
modified in any way. The most current <strong>Iowa</strong> <strong>Core</strong> can be found at http://iowacore.educateiowa.gov.
<strong>Mathematics</strong> | Grade 6<br />
In Grade 6, instructional time should focus on four critical areas: (1) connecting ratio and rate to<br />
whole number multiplication and division and using concepts of ratio and rate to solve<br />
problems; (2) completing understanding of division of fractions and extending the notion of<br />
number to the system of rational numbers, which includes negative numbers; (3) writing,<br />
interpreting, and using expressions and equations; and (4) developing understanding of<br />
statistical thinking.<br />
(1) Students use reasoning about multiplication and division to solve ratio and rate problems about<br />
quantities. By viewing equivalent ratios and rates as deriving from, and extending, pairs of rows (or<br />
columns) in the multiplication table, and by analyzing simple drawings that indicate the relative size of<br />
quantities, students connect their understanding of multiplication and division with ratios and rates. Thus<br />
students expand the scope of problems for which they can use multiplication and division to solve<br />
problems, and they connect ratios and fractions. Students solve a wide variety of problems involving<br />
ratios and rates.<br />
(2) Students use the meaning of fractions, the meanings of multiplication and division, and the<br />
relationship between multiplication and division to understand and explain why the procedures for<br />
dividing fractions make sense. Students use these operations to solve problems. Students extend their<br />
previous understandings of number and the ordering of numbers to the full system of rational numbers,<br />
which includes negative rational numbers, and in particular negative integers. They reason about the<br />
order and absolute value of rational numbers and about the location of points in all four quadrants of the<br />
coordinate plane.<br />
(3) Students understand the use of variables in mathematical expressions. They write expressions and<br />
equations that correspond to given situations, evaluate expressions, and use expressions and formulas to<br />
solve problems. Students understand that expressions in different forms can be equivalent, and they use<br />
the properties of operations to rewrite expressions in equivalent forms. Students know that the solutions<br />
of an equation are the values of the variables that make the equation true. Students use properties of<br />
operations and the idea of maintaining the equality of both sides of an equation to solve simple one-step<br />
equations. Students construct and analyze tables, such as tables of quantities that are in equivalent ratios,<br />
and they use equations (such as 3x = y) to describe relationships between quantities.<br />
(4) Building on and reinforcing their understanding of number, students begin to develop their ability to<br />
think statistically. Students recognize that a data distribution may not have a definite center and that<br />
different ways to measure center yield different values. The median measures center in the sense that it<br />
is roughly the middle value. The mean measures center in the sense that it is the value that each data<br />
point would take on if the total of the data values were redistributed equally, and also in the sense that it<br />
is a balance point. Students recognize that a measure of variability (interquartile range or mean absolute<br />
deviation) can also be useful for summarizing data because two very different sets of data can have the<br />
same mean and median yet be distinguished by their variability. Students learn to describe and<br />
summarize numerical data sets, identifying clusters, peaks, gaps, and symmetry, considering the context<br />
in which the data were collected.<br />
Students in Grade 6 also build on their work with area in elementary school by reasoning about<br />
relationships among shapes to determine area, surface area, and volume. They find areas of right<br />
triangles, other triangles, and special quadrilaterals by decomposing these shapes, rearranging or<br />
removing pieces, and relating the shapes to rectangles. Using these methods, students discuss, develop,<br />
and justify formulas for areas of triangles and parallelograms. Students find areas of polygons and surface<br />
areas of prisms and pyramids by decomposing them into pieces whose area they can determine. They<br />
reason about right rectangular prisms with fractional side lengths to extend formulas for the volume of a<br />
right rectangular prism to fractional side lengths. They prepare for work on scale drawings and<br />
constructions in Grade 7 by drawing polygons in the coordinate plane.<br />
Disclaimer: This document is up-to-date as of 11/17/2010. The language provided may not be Page 41 of 98<br />
modified in any way. The most current <strong>Iowa</strong> <strong>Core</strong> can be found at http://iowacore.educateiowa.gov.
Grade 6 Overview<br />
Ratios and Proportional Relationships<br />
• Understand ratio concepts and use ratio reasoning to<br />
solve problems.<br />
The Number System<br />
• Apply and extend previous understandings of<br />
multiplication and division to divide fractions by<br />
fractions.<br />
• Compute fluently with multi-digit numbers and find<br />
common factors and multiples.<br />
• Apply and extend previous understandings of numbers<br />
to the system of rational numbers.<br />
Expressions and Equations<br />
• Apply and extend previous understandings of<br />
arithmetic to algebraic expressions.<br />
• Reason about and solve one-variable equations<br />
and inequalities.<br />
• Represent and analyze quantitative relationships<br />
between dependent and independent variables.<br />
Mathematical Practices<br />
1. Make sense of problems and<br />
persevere in solving them.<br />
2. Reason abstractly and quantitatively.<br />
3. Construct viable arguments and<br />
critique the reasoning of others.<br />
4. Model with mathematics.<br />
5. Use appropriate tools strategically.<br />
6. Attend to precision.<br />
7. Look for and make use of structure.<br />
8. Look for and express regularity in<br />
repeated reasoning.<br />
Geometry<br />
• Solve real-world and mathematical problems<br />
involving area, surface area, and volume.<br />
Statistics and Probability<br />
• Develop understanding of statistical variability.<br />
• Summarize and describe distributions.<br />
Disclaimer: This document is up-to-date as of 11/17/2010. The language provided may not be Page 42 of 98<br />
modified in any way. The most current <strong>Iowa</strong> <strong>Core</strong> can be found at http://iowacore.educateiowa.gov.
Ratios and Proportional Relationships<br />
6.RP<br />
Understand ratio concepts and use ratio reasoning to solve problems.<br />
1. Understand the concept of a ratio and use ratio language to describe a ratio relationship<br />
between two quantities. For example, "The ratio of wings to beaks in the bird house at<br />
the zoo was 2:1, because for every 2 wings there was 1 beak." "For every vote candidate<br />
A received, candidate C received nearly three votes." (6.RP.1.)<br />
2. Understand the concept of a unit rate a/b associated with a ratio a:b with b ≠ 0, and use<br />
rate language in the context of a ratio relationship. For example, "This recipe has a ratio<br />
of 3 cups of flour to 4 cups of sugar, so there is 3/4 cup of flour for each cup of sugar."<br />
"We paid $75 for 15 hamburgers, which is a rate of $5 per hamburger." 1 (6.RP.2.)<br />
3. Use ratio and rate reasoning to solve real-world and mathematical problems, e.g., by<br />
reasoning about tables of equivalent ratios, tape diagrams, double number line<br />
diagrams, or equations.<br />
a. Make tables of equivalent ratios relating quantities with whole-number<br />
measurements, find missing values in the tables, and plot the pairs of values on<br />
the coordinate plane. Use tables to compare ratios.<br />
b. Solve unit rate problems including those involving unit pricing and constant<br />
speed. For example, if it took 7 hours to mow 4 lawns, then at that rate, how<br />
many lawns could be mowed in 35 hours? At what rate were lawns being<br />
mowed?<br />
c. Find a percent of a quantity as a rate per 100 (e.g., 30% of a quantity means<br />
30/100 times the quantity); solve problems involving finding the whole, given a<br />
part and the percent.<br />
d. Use ratio reasoning to convert measurement units; manipulate and transform<br />
units appropriately when multiplying or dividing quantities. (6.RP.3.)<br />
The Number System<br />
6.NS<br />
Apply and extend previous understandings of multiplication and division to divide fractions by<br />
fractions.<br />
1. Interpret and compute quotients of fractions, and solve word problems involving<br />
division of fractions by fractions, e.g., by using visual fraction models and equations to<br />
represent the problem. For example, create a story context for (2/3) ÷ (3/4) and use a<br />
visual fraction model to show the quotient; use the relationship between multiplication<br />
and division to explain that (2/3) ÷ (3/4) = 8/9 because 3/4 of 8/9 is 2/3. (In general,<br />
(a/b) ÷ (c/d) = ad/bc.) How much chocolate will each person get if 3 people share 1/2 lb<br />
of chocolate equally? How many 3/4-cup servings are in 2/3 of a cup of yogurt? How<br />
wide is a rectangular strip of land with length 3/4 mi and area 1/2 square mi? (6.NS.1.)<br />
Compute fluently with multi-digit numbers and find common factors and multiples.<br />
2. Fluently divide multi-digit numbers using the standard algorithm. (6.NS.2.)<br />
3. Fluently add, subtract, multiply, and divide multi-digit decimals using the standard<br />
algorithm for each operation. (6.NS.3.)<br />
4. Find the greatest common factor of two whole numbers less than or equal to 100 and<br />
the least common multiple of two whole numbers less than or equal to <strong>12</strong>. Use the<br />
distributive property to express a sum of two whole numbers 1–100 with a common<br />
factor as a multiple of a sum of two whole numbers with no common factor. For<br />
example, express 36 + 8 as 4 (9 + 2). (6.NS.4.)<br />
1 Expectations for unit rates in this grade are limited to non-complex fractions.<br />
Disclaimer: This document is up-to-date as of 11/17/2010. The language provided may not be Page 43 of 98<br />
modified in any way. The most current <strong>Iowa</strong> <strong>Core</strong> can be found at http://iowacore.educateiowa.gov.
Apply and extend previous understandings of numbers to the system of rational numbers.<br />
5. Understand that positive and negative numbers are used together to describe<br />
quantities having opposite directions or values (e.g., temperature above/below zero,<br />
elevation above/below sea level, credits/debits, positive/negative electric charge); use<br />
positive and negative numbers to represent quantities in real-world contexts, explaining<br />
the meaning of 0 in each situation. (6.NS.5.)<br />
6. Understand a rational number as a point on the number line. Extend number line<br />
diagrams and coordinate axes familiar from previous grades to represent points on the<br />
line and in the plane with negative number coordinates.<br />
a. Recognize opposite signs of numbers as indicating locations on opposite sides<br />
of 0 on the number line; recognize that the opposite of the opposite of a<br />
number is the number itself, e.g., –(–3) = 3, and that 0 is its own opposite.<br />
b. Understand signs of numbers in ordered pairs as indicating locations in<br />
quadrants of the coordinate plane; recognize that when two ordered pairs<br />
differ only by signs, the locations of the points are related by reflections across<br />
one or both axes.<br />
c. Find and position integers and other rational numbers on a horizontal or<br />
vertical number line diagram; find and position pairs of integers and other<br />
rational numbers on a coordinate plane. (6.NS.6.)<br />
7. Understand ordering and absolute value of rational numbers.<br />
a. Interpret statements of inequality as statements about the relative position of<br />
two numbers on a number line diagram. For example, interpret –3 > –7 as a<br />
statement that –3 is located to the right of –7 on a number line oriented from<br />
left to right.<br />
b. Write, interpret, and explain statements of order for rational numbers in realworld<br />
contexts. For example, write –3 o C > –7 o C to express the fact that –3 o C is<br />
warmer than –7 o C.<br />
c. Understand the absolute value of a rational number as its distance from 0 on<br />
the number line; interpret absolute value as magnitude for a positive or<br />
negative quantity in a real-world situation. For example, for an account balance<br />
of –30 dollars, write |–30| = 30 to describe the size of the debt in dollars.<br />
d. Distinguish comparisons of absolute value from statements about order. For<br />
example, recognize that an account balance less than –30 dollars represents a<br />
debt greater than 30 dollars. (6.NS.7.)<br />
8. Solve real-world and mathematical problems by graphing points in all four quadrants of<br />
the coordinate plane. Include use of coordinates and absolute value to find distances<br />
between points with the same first coordinate or the same second coordinate. (6.NS.8.)<br />
Disclaimer: This document is up-to-date as of 11/17/2010. The language provided may not be Page 44 of 98<br />
modified in any way. The most current <strong>Iowa</strong> <strong>Core</strong> can be found at http://iowacore.educateiowa.gov.
Expressions and Equations<br />
6.EE<br />
Apply and extend previous understandings of arithmetic to algebraic expressions.<br />
1. Write and evaluate numerical expressions involving whole-number exponents. (6.EE.1.)<br />
2. Write, read, and evaluate expressions in which letters stand for numbers.<br />
a. Write expressions that record operations with numbers and with letters<br />
standing for numbers. For example, express the calculation "Subtract y from 5"<br />
as 5 – y.<br />
b. Identify parts of an expression using mathematical terms (sum, term, product,<br />
factor, quotient, coefficient); view one or more parts of an expression as a<br />
single entity. For example, describe the expression 2 (8 + 7) as a product of two<br />
factors; view (8 + 7) as both a single entity and a sum of two terms.<br />
c. Evaluate expressions at specific values of their variables. Include expressions<br />
that arise from formulas used in real-world problems. Perform arithmetic<br />
operations, including those involving whole-number exponents, in the<br />
conventional order when there are no parentheses to specify a particular order<br />
(Order of Operations). For example, use the formulas V = s 3 and A = 6 s 2 to find<br />
the volume and surface area of a cube with sides of length s = 1/2. (6.EE.2.)<br />
3. Apply the properties of operations to generate equivalent expressions. For example,<br />
apply the distributive property to the expression 3 (2 + x) to produce the equivalent<br />
expression 6 + 3x; apply the distributive property to the expression 24x + 18y to produce<br />
the equivalent expression 6 (4x + 3y); apply properties of operations to y + y + y to<br />
produce the equivalent expression 3y. (6.EE.3.)<br />
4. Identify when two expressions are equivalent (i.e., when the two expressions name the<br />
same number regardless of which value is substituted into them). For example, the<br />
expressions y + y + y and 3y are equivalent because they name the same number<br />
regardless of which number y stands for. (6.EE.4.)<br />
Reason about and solve one-variable equations and inequalities.<br />
5. Understand solving an equation or inequality as a process of answering a question:<br />
which values from a specified set, if any, make the equation or inequality true? Use<br />
substitution to determine whether a given number in a specified set makes an equation<br />
or inequality true. (6.EE.5.)<br />
6. Use variables to represent numbers and write expressions when solving a real-world or<br />
mathematical problem; understand that a variable can represent an unknown number,<br />
or, depending on the purpose at hand, any number in a specified set. (6.EE.6.)<br />
7. Solve real-world and mathematical problems by writing and solving equations of the<br />
form x + p = q and px = q for cases in which p, q and x are all nonnegative rational<br />
numbers. (6.EE.7.)<br />
8. Write an inequality of the form x > c or x < c to represent a constraint or condition in a<br />
real-world or mathematical problem. Recognize that inequalities of the form x > c or x <<br />
c have infinitely many solutions; represent solutions of such inequalities on number line<br />
diagrams. (6.EE.8.)<br />
Represent and analyze quantitative relationships between dependent and independent<br />
variables.<br />
9. Use variables to represent two quantities in a real-world problem that change in<br />
relationship to one another; write an equation to express one quantity, thought of as<br />
the dependent variable, in terms of the other quantity, thought of as the independent<br />
variable. Analyze the relationship between the dependent and independent variables<br />
using graphs and tables, and relate these to the equation. For example, in a problem<br />
involving motion at constant speed, list and graph ordered pairs of distances and times,<br />
and write the equation d = 65t to represent the relationship between distance and time.<br />
(6.EE.9.)<br />
Disclaimer: This document is up-to-date as of 11/17/2010. The language provided may not be Page 45 of 98<br />
modified in any way. The most current <strong>Iowa</strong> <strong>Core</strong> can be found at http://iowacore.educateiowa.gov.
Geometry 6.G<br />
Solve real-world and mathematical problems involving area, surface area, and volume.<br />
1. Find the area of right triangles, other triangles, special quadrilaterals, and polygons by<br />
composing into rectangles or decomposing into triangles and other shapes; apply these<br />
techniques in the context of solving real-world and mathematical problems. (6.G.1.)<br />
2. Find the volume of a right rectangular prism with fractional edge lengths by packing it<br />
with unit cubes of the appropriate unit fraction edge lengths, and show that the volume<br />
is the same as would be found by multiplying the edge lengths of the prism. Apply the<br />
formulas V = l w h and V = b h to find volumes of right rectangular prisms with fractional<br />
edge lengths in the context of solving real-world and mathematical problems. (6.G.2.)<br />
3. Draw polygons in the coordinate plane given coordinates for the vertices; use<br />
coordinates to find the length of a side joining points with the same first coordinate or<br />
the same second coordinate. Apply these techniques in the context of solving real-world<br />
and mathematical problems. (6.G.3.)<br />
4. Represent three-dimensional figures using nets made up of rectangles and triangles,<br />
and use the nets to find the surface area of these figures. Apply these techniques in the<br />
context of solving real-world and mathematical problems. (6.G.4.)<br />
Statistics and Probability<br />
6.SP<br />
Develop understanding of statistical variability.<br />
1. Recognize a statistical question as one that anticipates variability in the data related to<br />
the question and accounts for it in the answers. For example, "How old am I?" is not a<br />
statistical question, but "How old are the students in my school?" is a statistical question<br />
because one anticipates variability in students’ ages. (6.SP.1.)<br />
2. Understand that a set of data collected to answer a statistical question has a<br />
distribution which can be described by its center, spread, and overall shape. (6.SP.2.)<br />
3. Recognize that a measure of center for a numerical data set summarizes all of its values<br />
with a single number, while a measure of variation describes how its values vary with a<br />
single number. (6.SP.3.)<br />
Summarize and describe distributions.<br />
4. Display numerical data in plots on a number line, including dot plots, histograms, and<br />
box plots. (6.SP.4.)<br />
5. Summarize numerical data sets in relation to their context, such as by:<br />
a. Reporting the number of observations.<br />
b. Describing the nature of the attribute under investigation, including how it was<br />
measured and its units of measurement.<br />
c. Giving quantitative measures of center (median and/or mean) and variability<br />
(interquartile range and/or mean absolute deviation), as well as describing any<br />
overall pattern and any striking deviations from the overall pattern with<br />
reference to the context in which the data were gathered.<br />
d. Relating the choice of measures of center and variability to the shape of the<br />
data distribution and the context in which the data were gathered. (6.SP.5.)<br />
Disclaimer: This document is up-to-date as of 11/17/2010. The language provided may not be Page 46 of 98<br />
modified in any way. The most current <strong>Iowa</strong> <strong>Core</strong> can be found at http://iowacore.educateiowa.gov.
<strong>Mathematics</strong> | Grade 7<br />
In Grade 7, instructional time should focus on four critical areas: (1) developing understanding<br />
of and applying proportional relationships; (2) developing understanding of operations with<br />
rational numbers and working with expressions and linear equations; (3) solving problems<br />
involving scale drawings and informal geometric constructions, and working with two- and<br />
three-dimensional shapes to solve problems involving area, surface area, and volume; and (4)<br />
drawing inferences about populations based on samples.<br />
(1) Students extend their understanding of ratios and develop understanding of proportionality to solve<br />
single- and multi-step problems. Students use their understanding of ratios and proportionality to solve a<br />
wide variety of percent problems, including those involving discounts, interest, taxes, tips, and percent<br />
increase or decrease. Students solve problems about scale drawings by relating corresponding lengths<br />
between the objects or by using the fact that relationships of lengths within an object are preserved in<br />
similar objects. Students graph proportional relationships and understand the unit rate informally as a<br />
measure of the steepness of the related line, called the slope. They distinguish proportional relationships<br />
from other relationships.<br />
(2) Students develop a unified understanding of number, recognizing fractions, decimals (that have a<br />
finite or a repeating decimal representation), and percents as different representations of rational<br />
numbers. Students extend addition, subtraction, multiplication, and division to all rational numbers,<br />
maintaining the properties of operations and the relationships between addition and subtraction, and<br />
multiplication and division. By applying these properties, and by viewing negative numbers in terms of<br />
everyday contexts (e.g., amounts owed or temperatures below zero), students explain and interpret the<br />
rules for adding, subtracting, multiplying, and dividing with negative numbers. They use the arithmetic of<br />
rational numbers as they formulate expressions and equations in one variable and use these equations to<br />
solve problems.<br />
(3) Students continue their work with area from Grade 6, solving problems involving the area and<br />
circumference of a circle and surface area of three-dimensional objects. In preparation for work on<br />
congruence and similarity in Grade 8 they reason about relationships among two-dimensional figures<br />
using scale drawings and informal geometric constructions, and they gain familiarity with the<br />
relationships between angles formed by intersecting lines. Students work with three-dimensional figures,<br />
relating them to two-dimensional figures by examining cross-sections. They solve real-world and<br />
mathematical problems involving area, surface area, and volume of two- and three-dimensional objects<br />
composed of triangles, quadrilaterals, polygons, cubes and right prisms.<br />
(4) Students build on their previous work with single data distributions to compare two data distributions<br />
and address questions about differences between populations. They begin informal work with random<br />
sampling to generate data sets and learn about the importance of representative samples for drawing<br />
inferences.<br />
Disclaimer: This document is up-to-date as of 11/17/2010. The language provided may not be Page 47 of 98<br />
modified in any way. The most current <strong>Iowa</strong> <strong>Core</strong> can be found at http://iowacore.educateiowa.gov.
Grade 7 Overview<br />
Ratios and Proportional Relationships<br />
• Analyze proportional relationships and use them to<br />
solve real-world and mathematical problems.<br />
The Number System<br />
• Apply and extend previous understandings of<br />
operations with fractions to add, subtract, multiply,<br />
and divide rational numbers.<br />
Expressions and Equations<br />
• Use properties of operations to generate equivalent<br />
expressions.<br />
• Solve real-life and mathematical problems using<br />
numerical and algebraic expressions and equations.<br />
Mathematical Practices<br />
1. Make sense of problems and<br />
persevere in solving them.<br />
2. Reason abstractly and quantitatively.<br />
3. Construct viable arguments and<br />
critique the reasoning of others.<br />
4. Model with mathematics.<br />
5. Use appropriate tools strategically.<br />
6. Attend to precision.<br />
7. Look for and make use of structure.<br />
8. Look for and express regularity in<br />
repeated reasoning.<br />
Geometry<br />
• Draw, construct and describe geometrical<br />
figures and describe the relationships between them.<br />
• Solve real-life and mathematical problems<br />
involving angle measure, area, surface area, and volume.<br />
Statistics and Probability<br />
• Use random sampling to draw inferences about<br />
a population.<br />
• Draw informal comparative inferences about<br />
two populations.<br />
• Investigate chance processes and develop, use,<br />
and evaluate probability models.<br />
Disclaimer: This document is up-to-date as of 11/17/2010. The language provided may not be Page 48 of 98<br />
modified in any way. The most current <strong>Iowa</strong> <strong>Core</strong> can be found at http://iowacore.educateiowa.gov.
Ratios and Proportional Relationships<br />
7.RP<br />
Analyze proportional relationships and use them to solve real-world and mathematical<br />
problems.<br />
1. Compute unit rates associated with ratios of fractions, including ratios of lengths, areas<br />
and other quantities measured in like or different units. For example, if a person walks<br />
1/2 mile in each 1/4 hour, compute the unit rate as the complex fraction 1/2 / 1/4 miles per<br />
hour, equivalently 2 miles per hour. (7.RP.1.)<br />
2. Recognize and represent proportional relationships between quantities.<br />
a. Decide whether two quantities are in a proportional relationship, e.g., by<br />
testing for equivalent ratios in a table or graphing on a coordinate plane and<br />
observing whether the graph is a straight line through the origin.<br />
b. Identify the constant of proportionality (unit rate) in tables, graphs, equations,<br />
diagrams, and verbal descriptions of proportional relationships.<br />
c. Represent proportional relationships by equations. For example, if total cost t<br />
is proportional to the number n of items purchased at a constant price p, the<br />
relationship between the total cost and the number of items can be expressed<br />
as t = pn.<br />
d. Explain what a point (x, y) on the graph of a proportional relationship means in<br />
terms of the situation, with special attention to the points (0, 0) and (1, r)<br />
where r is the unit rate. (7.RP.2.)<br />
3. Use proportional relationships to solve multistep ratio and percent problems. Examples:<br />
simple interest, tax, markups and markdowns, gratuities and commissions, fees, percent<br />
increase and decrease, percent error. (7.RP.3.)<br />
The Number System<br />
7.NS<br />
Apply and extend previous understandings of operations with fractions to add, subtract,<br />
multiply, and divide rational numbers.<br />
1. Apply and extend previous understandings of addition and subtraction to add and<br />
subtract rational numbers; represent addition and subtraction on a horizontal or<br />
vertical number line diagram.<br />
a. Describe situations in which opposite quantities combine to make 0. For<br />
example, a hydrogen atom has 0 charge because its two constituents are<br />
oppositely charged.<br />
b. Understand p + q as the number located a distance |q| from p, in the positive<br />
or negative direction depending on whether q is positive or negative. Show<br />
that a number and its opposite have a sum of 0 (are additive inverses).<br />
Interpret sums of rational numbers by describing real-world contexts.<br />
c. Understand subtraction of rational numbers as adding the additive inverse, p –<br />
q = p + (–q). Show that the distance between two rational numbers on the<br />
number line is the absolute value of their difference, and apply this principle in<br />
real-world contexts.<br />
d. Apply properties of operations as strategies to add and subtract rational<br />
numbers. (7.NS.1.)<br />
Disclaimer: This document is up-to-date as of 11/17/2010. The language provided may not be Page 49 of 98<br />
modified in any way. The most current <strong>Iowa</strong> <strong>Core</strong> can be found at http://iowacore.educateiowa.gov.
2. Apply and extend previous understandings of multiplication and division and of fractions to<br />
multiply and divide rational numbers.<br />
a. Understand that multiplication is extended from fractions to rational numbers by<br />
requiring that operations continue to satisfy the properties of operations,<br />
particularly the distributive property, leading to products such as (–1)(–1) = 1 and<br />
the rules for multiplying signed numbers. Interpret products of rational numbers<br />
by describing real-world contexts.<br />
b. Understand that integers can be divided, provided that the divisor is not zero, and<br />
every quotient of integers (with non-zero divisor) is a rational number. If p and q<br />
are integers, then –(p/q) = (–p)/q = p/(–q). Interpret quotients of rational numbers<br />
by describing real-world contexts.<br />
c. Apply properties of operations as strategies to multiply and divide rational<br />
numbers.<br />
d. Convert a rational number to a decimal using long division; know that the decimal<br />
form of a rational number terminates in 0s or eventually repeats. (7.NS.1.)<br />
3. Solve real-world and mathematical problems involving the four operations with rational<br />
numbers. 1 (7.NS.3.)<br />
Expressions and Equations<br />
7.EE<br />
Use properties of operations to generate equivalent expressions.<br />
1. Apply properties of operations as strategies to add, subtract, factor, and expand linear<br />
expressions with rational coefficients. (7.EE.1.)<br />
2. Understand that rewriting an expression in different forms in a problem context can shed<br />
light on the problem and how the quantities in it are related. For example, a + 0.05a =<br />
1.05a means that "increase by 5%" is the same as "multiply by 1.05." (7.EE.2.)<br />
Solve real-life and mathematical problems using numerical and algebraic expressions and<br />
equations.<br />
3. Solve multi-step real-life and mathematical problems posed with positive and negative<br />
rational numbers in any form (whole numbers, fractions, and decimals), using tools<br />
strategically. Apply properties of operations to calculate with numbers in any form; convert<br />
between forms as appropriate; and assess the reasonableness of answers using mental<br />
computation and estimation strategies. For example: If a woman making $25 an hour gets<br />
a 10% raise, she will make an additional 1/10 of her salary an hour, or $2.50, for a new<br />
salary of $27.50. If you want to place a towel bar 9 3/4 inches long in the center of a door<br />
that is 27 1/2 inches wide, you will need to place the bar about 9 inches from each edge;<br />
this estimate can be used as a check on the exact computation. (7.EE.3.)<br />
4. Use variables to represent quantities in a real-world or mathematical problem, and<br />
construct simple equations and inequalities to solve problems by reasoning about the<br />
quantities.<br />
a. Solve word problems leading to equations of the form px + q = r and p(x + q) = r,<br />
where p, q, and r are specific rational numbers. Solve equations of these forms<br />
fluently. Compare an algebraic solution to an arithmetic solution, identifying the<br />
sequence of the operations used in each approach. For example, the perimeter of<br />
a rectangle is 54 cm. Its length is 6 cm. What is its width?<br />
b. Solve word problems leading to inequalities of the form px + q > r or px + q < r,<br />
where p, q, and r are specific rational numbers. Graph the solution set of the<br />
inequality and interpret it in the context of the problem. For example: As a<br />
salesperson, you are paid $50 per week plus $3 per sale. This week you want your<br />
pay to be at least $100. Write an inequality for the number of sales you need to<br />
make, and describe the solutions. (7.EE.4.)<br />
1 Computations with rational numbers extend the rules for manipulating fractions to complex fractions.<br />
Disclaimer: This document is up-to-date as of 11/17/2010. The language provided may not be Page 50 of 98<br />
modified in any way. The most current <strong>Iowa</strong> <strong>Core</strong> can be found at http://iowacore.educateiowa.gov.
Geometry 7.G<br />
Draw, construct, and describe geometrical figures and describe the relationships between<br />
them.<br />
1. Solve problems involving scale drawings of geometric figures, including computing<br />
actual lengths and areas from a scale drawing and reproducing a scale drawing at a<br />
different scale. (7.G.1.)<br />
2. Draw (freehand, with ruler and protractor, and with technology) geometric shapes with<br />
given conditions. Focus on constructing triangles from three measures of angles or<br />
sides, noticing when the conditions determine a unique triangle, more than one<br />
triangle, or no triangle. (7.G.2.)<br />
3. Describe the two-dimensional figures that result from slicing three-dimensional figures,<br />
as in plane sections of right rectangular prisms and right rectangular pyramids. (7.G.3.)<br />
Solve real-life and mathematical problems involving angle measure, area, surface area, and<br />
volume.<br />
4. Know the formulas for the area and circumference of a circle and use them to solve<br />
problems; give an informal derivation of the relationship between the circumference<br />
and area of a circle. (7.G.4.)<br />
5. Use facts about supplementary, complementary, vertical, and adjacent angles in a<br />
multi-step problem to write and solve simple equations for an unknown angle in a<br />
figure. (7.G.5.)<br />
6. Solve real-world and mathematical problems involving area, volume and surface area of<br />
two- and three-dimensional objects composed of triangles, quadrilaterals, polygons,<br />
cubes, and right prisms. (7.G.6.)<br />
Statistics and Probability<br />
7.SP<br />
Use random sampling to draw inferences about a population.<br />
1. Understand that statistics can be used to gain information about a population by<br />
examining a sample of the population; generalizations about a population from a<br />
sample are valid only if the sample is representative of that population. Understand that<br />
random sampling tends to produce representative samples and support valid<br />
inferences. (7.SP.1.)<br />
2. Use data from a random sample to draw inferences about a population with an<br />
unknown characteristic of interest. Generate multiple samples (or simulated samples) of<br />
the same size to gauge the variation in estimates or predictions. For example, estimate<br />
the mean word length in a book by randomly sampling words from the book; predict the<br />
winner of a school election based on randomly sampled survey data. Gauge how far off<br />
the estimate or prediction might be. (7.SP.2.)<br />
Draw informal comparative inferences about two populations.<br />
3. Informally assess the degree of visual overlap of two numerical data distributions with<br />
similar variability’s, measuring the difference between the centers by expressing it as a<br />
multiple of a measure of variability. For example, the mean height of players on the<br />
basketball team is 10 cm greater than the mean height of players on the soccer team,<br />
about twice the variability (mean absolute deviation) on either team; on a dot plot, the<br />
separation between the two distributions of heights is noticeable. (7.SP.3.)<br />
4. Use measures of center and measures of variability for numerical data from random<br />
samples to draw informal comparative inferences about two populations. For example,<br />
decide whether the words in a chapter of a seventh-grade science book are generally<br />
longer than the words in a chapter of a fourth-grade science book. (7.SP.4.)<br />
Disclaimer: This document is up-to-date as of 11/17/2010. The language provided may not be Page 51 of 98<br />
modified in any way. The most current <strong>Iowa</strong> <strong>Core</strong> can be found at http://iowacore.educateiowa.gov.
Investigate chance processes and develop, use, and evaluate probability models.<br />
5. Understand that the probability of a chance event is a number between 0 and 1 that<br />
expresses the likelihood of the event occurring. Larger numbers indicate greater<br />
likelihood. A probability near 0 indicates an unlikely event, a probability around 1/2<br />
indicates an event that is neither unlikely nor likely, and a probability near 1 indicates a<br />
likely event. (7.SP.5.)<br />
6. Approximate the probability of a chance event by collecting data on the chance process<br />
that produces it and observing its long-run relative frequency, and predict the<br />
approximate relative frequency given the probability. For example, when rolling a<br />
number cube 600 times, predict that a 3 or 6 would be rolled roughly 200 times, but<br />
probably not exactly 200 times. (7.SP.6.)<br />
7. Develop a probability model and use it to find probabilities of events. Compare<br />
probabilities from a model to observed frequencies; if the agreement is not good,<br />
explain possible sources of the discrepancy.<br />
a. Develop a uniform probability model by assigning equal probability to all<br />
outcomes, and use the model to determine probabilities of events. For<br />
example, if a student is selected at random from a class, find the probability<br />
that Jane will be selected and the probability that a girl will be selected.<br />
b. Develop a probability model (which may not be uniform) by observing<br />
frequencies in data generated from a chance process. For example, find the<br />
approximate probability that a spinning penny will land heads up or that a<br />
tossed paper cup will land open-end down. Do the outcomes for the spinning<br />
penny appear to be equally likely based on the observed frequencies? (7.SP.7.)<br />
8. Find probabilities of compound events using organized lists, tables, tree diagrams, and<br />
simulation.<br />
a. Understand that, just as with simple events, the probability of a compound<br />
event is the fraction of outcomes in the sample space for which the compound<br />
event occurs.<br />
b. Represent sample spaces for compound events using methods such as<br />
organized lists, tables and tree diagrams. For an event described in everyday<br />
language (e.g., "rolling double sixes"), identify the outcomes in the sample<br />
space which compose the event.<br />
c. Design and use a simulation to generate frequencies for compound events. For<br />
example, use random digits as a simulation tool to approximate the answer to<br />
the question: If 40% of donors have type A blood, what is the probability that it<br />
will take at least 4 donors to find one with type A blood? (7.SP.8.)<br />
Disclaimer: This document is up-to-date as of 11/17/2010. The language provided may not be Page 52 of 98<br />
modified in any way. The most current <strong>Iowa</strong> <strong>Core</strong> can be found at http://iowacore.educateiowa.gov.
<strong>Mathematics</strong> | Grade 8<br />
In Grade 8, instructional time should focus on three critical areas: (1) formulating and reasoning<br />
about expressions and equations, including modeling an association in bivariate data with a<br />
linear equation, and solving linear equations and systems of linear equations; (2) grasping the<br />
concept of a function and using functions to describe quantitative relationships; (3) analyzing<br />
two- and three-dimensional space and figures using distance, angle, similarity, and congruence,<br />
and understanding and applying the Pythagorean Theorem.<br />
(1) Students use linear equations and systems of linear equations to represent, analyze, and solve a<br />
variety of problems. Students recognize equations for proportions (y/x = m or y = mx) as special linear<br />
equations (y = mx + b), understanding that the constant of proportionality (m) is the slope, and the graphs<br />
are lines through the origin. They understand that the slope (m) of a line is a constant rate of change, so<br />
that if the input or x-coordinate changes by an amount A, the output or y-coordinate changes by the<br />
amount m·A. Students also use a linear equation to describe the association between two quantities in<br />
bivariate data (such as arm span vs. height for students in a classroom). At this grade, fitting the model,<br />
and assessing its fit to the data are done informally. Interpreting the model in the context of the data<br />
requires students to express a relationship between the two quantities in question and to interpret<br />
components of the relationship (such as slope and y-intercept) in terms of the situation.<br />
Students strategically choose and efficiently implement procedures to solve linear equations in one<br />
variable, understanding that when they use the properties of equality and the concept of logical<br />
equivalence, they maintain the solutions of the original equation. Students solve systems of two linear<br />
equations in two variables and relate the systems to pairs of lines in the plane; these intersect, are<br />
parallel, or are the same line. Students use linear equations, systems of linear equations, linear functions,<br />
and their understanding of slope of a line to analyze situations and solve problems.<br />
(2) Students grasp the concept of a function as a rule that assigns to each input exactly one output. They<br />
understand that functions describe situations where one quantity determines another. They can translate<br />
among representations and partial representations of functions (noting that tabular and graphical<br />
representations may be partial representations), and they describe how aspects of the function are<br />
reflected in the different representations.<br />
(3) Students use ideas about distance and angles, how they behave under translations, rotations,<br />
reflections, and dilations, and ideas about congruence and similarity to describe and analyze twodimensional<br />
figures and to solve problems. Students show that the sum of the angles in a triangle is the<br />
angle formed by a straight line, and that various configurations of lines give rise to similar triangles<br />
because of the angles created when a transversal cuts parallel lines. Students understand the statement<br />
of the Pythagorean Theorem and its converse, and can explain why the Pythagorean Theorem holds, for<br />
example, by decomposing a square in two different ways. They apply the Pythagorean Theorem to find<br />
distances between points on the coordinate plane, to find lengths, and to analyze polygons. Students<br />
complete their work on volume by solving problems involving cones, cylinders, and spheres.<br />
Disclaimer: This document is up-to-date as of 11/17/2010. The language provided may not be Page 53 of 98<br />
modified in any way. The most current <strong>Iowa</strong> <strong>Core</strong> can be found at http://iowacore.educateiowa.gov.
Grade 8 Overview<br />
The Number System<br />
• Know that there are numbers that are not rational,<br />
and approximate them by rational numbers.<br />
Expressions and Equations<br />
• Work with radicals and integer exponents.<br />
• Understand the connections between proportional<br />
relationships, lines, and linear equations.<br />
• Analyze and solve linear equations and pairs of<br />
simultaneous linear equations.<br />
Functions<br />
• Define, evaluate, and compare functions.<br />
• Use functions to model relationships between<br />
quantities.<br />
Mathematical Practices<br />
1. Make sense of problems and<br />
persevere in solving them.<br />
2. Reason abstractly and quantitatively.<br />
3. Construct viable arguments and<br />
critique the reasoning of others.<br />
4. Model with mathematics.<br />
5. Use appropriate tools strategically.<br />
6. Attend to precision.<br />
7. Look for and make use of structure.<br />
8. Look for and express regularity in<br />
repeated reasoning.<br />
Geometry<br />
• Understand congruence and similarity using<br />
physical models, transparencies, or geometry<br />
software.<br />
• Understand and apply the Pythagorean Theorem.<br />
• Solve real-world and mathematical problems<br />
involving volume of cylinders, cones and spheres.<br />
Statistics and Probability<br />
• Investigate patterns of association in bivariate data.<br />
Disclaimer: This document is up-to-date as of 11/17/2010. The language provided may not be Page 54 of 98<br />
modified in any way. The most current <strong>Iowa</strong> <strong>Core</strong> can be found at http://iowacore.educateiowa.gov.
The Number System<br />
8.NS<br />
Know that there are numbers that are not rational, and approximate them by rational<br />
numbers.<br />
1. Know that numbers that are not rational are called irrational. Understand informally<br />
that every number has a decimal expansion; for rational numbers show that the decimal<br />
expansion repeats eventually, and convert a decimal expansion which repeats<br />
eventually into a rational number. (8.NS.1.)<br />
2. Use rational approximations of irrational numbers to compare the size of irrational<br />
numbers, locate them approximately on a number line diagram, and estimate the value<br />
of expressions (e.g., π 2 ). For example, by truncating the decimal expansion of √2, show<br />
that √2 is between 1 and 2, then between 1.4 and 1.5, and explain how to continue on to<br />
get better approximations. (8.NS.2.)<br />
Expressions and Equations<br />
8.EE<br />
Work with radicals and integer exponents.<br />
1. Know and apply the properties of integer exponents to generate equivalent numerical<br />
expressions. For example, 3 2 × 3 –5 = 3 –3 = 1/3 3 = 1/27. (8.EE.1.)<br />
2. Use square root and cube root symbols to represent solutions to equations of the form<br />
x 2 = p and x 3 = p, where p is a positive rational number. Evaluate square roots of small<br />
perfect squares and cube roots of small perfect cubes. Know that √2 is irrational.<br />
(8.EE.2.)<br />
3. Use numbers expressed in the form of a single digit times an integer power of 10 to<br />
estimate very large or very small quantities, and to express how many times as much<br />
one is than the other. For example, estimate the population of the United States as 3 ×<br />
10 8 and the population of the world as 7 × 10 9 , and determine that the world population<br />
is more than 20 times larger. (8.EE.3.)<br />
4. Perform operations with numbers expressed in scientific notation, including problems<br />
where both decimal and scientific notation are used. Use scientific notation and choose<br />
units of appropriate size for measurements of very large or very small quantities (e.g.,<br />
use millimeters per year for seafloor spreading). Interpret scientific notation that has<br />
been generated by technology. (8.EE.4.)<br />
Understand the connections between proportional relationships, lines, and linear equations.<br />
5. Graph proportional relationships, interpreting the unit rate as the slope of the graph.<br />
Compare two different proportional relationships represented in different ways. For<br />
example, compare a distance-time graph to a distance-time equation to determine<br />
which of two moving objects has greater speed. (8.EE.5.)<br />
6. Use similar triangles to explain why the slope m is the same between any two distinct<br />
points on a non-vertical line in the coordinate plane; derive the equation y = mx for a<br />
line through the origin and the equation y = mx + b for a line intercepting the vertical<br />
axis at b. (8.EE.6.)<br />
Analyze and solve linear equations and pairs of simultaneous linear equations.<br />
7. Solve linear equations in one variable.<br />
a. Give examples of linear equations in one variable with one solution, infinitely<br />
many solutions, or no solutions. Show which of these possibilities is the case by<br />
successively transforming the given equation into simpler forms, until an<br />
equivalent equation of the form x = a, a = a, or a = b results (where a and b are<br />
different numbers).<br />
b. Solve linear equations with rational number coefficients, including equations<br />
whose solutions require expanding expressions using the distributive property<br />
and collecting like terms. (8.EE.7.)<br />
Disclaimer: This document is up-to-date as of 11/17/2010. The language provided may not be Page 55 of 98<br />
modified in any way. The most current <strong>Iowa</strong> <strong>Core</strong> can be found at http://iowacore.educateiowa.gov.
8. Analyze and solve pairs of simultaneous linear equations.<br />
a. Understand that solutions to a system of two linear equations in two variables<br />
correspond to points of intersection of their graphs, because points of<br />
intersection satisfy both equations simultaneously.<br />
b. Solve systems of two linear equations in two variables algebraically, and<br />
estimate solutions by graphing the equations. Solve simple cases by inspection.<br />
For example, 3x + 2y = 5 and 3x + 2y = 6 have no solution because 3x + 2y<br />
cannot simultaneously be 5 and 6.<br />
c. Solve real-world and mathematical problems leading to two linear equations in<br />
two variables. For example, given coordinates for two pairs of points,<br />
determine whether the line through the first pair of points intersects the line<br />
through the second pair. (8.EE.8.)<br />
Functions 8.F<br />
Define, evaluate, and compare functions.<br />
1. Understand that a function is a rule that assigns to each input exactly one output. The<br />
graph of a function is the set of ordered pairs consisting of an input and the<br />
corresponding output. 1 (8.F.1.)<br />
2. Compare properties of two functions each represented in a different way (algebraically,<br />
graphically, numerically in tables, or by verbal descriptions). For example, given a linear<br />
function represented by a table of values and a linear function represented by an<br />
algebraic expression, determine which function has the greater rate of change. (8.F.2.)<br />
3. Interpret the equation y = mx + b as defining a linear function, whose graph is a straight<br />
line; give examples of functions that are not linear. For example, the function A = s 2<br />
giving the area of a square as a function of its side length is not linear because its graph<br />
contains the points (1,1), (2,4) and (3,9), which are not on a straight line. (8.F.3.)<br />
Use functions to model relationships between quantities.<br />
4. Construct a function to model a linear relationship between two quantities. Determine<br />
the rate of change and initial value of the function from a description of a relationship<br />
or from two (x, y) values, including reading these from a table or from a graph. Interpret<br />
the rate of change and initial value of a linear function in terms of the situation it<br />
models, and in terms of its graph or a table of values. (8.F.4.)<br />
5. Describe qualitatively the functional relationship between two quantities by analyzing a<br />
graph (e.g., where the function is increasing or decreasing, linear or nonlinear). Sketch a<br />
graph that exhibits the qualitative features of a function that has been described<br />
verbally. (8.F.5.)<br />
Geometry 8.G<br />
Understand congruence and similarity using physical models, transparencies, or geometry<br />
software.<br />
1. Verify experimentally the properties of rotations, reflections, and translations:<br />
a. Lines are taken to lines, and line segments to line segments of the same length.<br />
b. Angles are taken to angles of the same measure.<br />
c. Parallel lines are taken to parallel lines. (8.G.1.)<br />
2. Understand that a two-dimensional figure is congruent to another if the second can be<br />
obtained from the first by a sequence of rotations, reflections, and translations; given<br />
two congruent figures, describe a sequence that exhibits the congruence between<br />
them. (8.G.2.)<br />
1 Function notation is not required in Grade 8.<br />
Disclaimer: This document is up-to-date as of 11/17/2010. The language provided may not be Page 56 of 98<br />
modified in any way. The most current <strong>Iowa</strong> <strong>Core</strong> can be found at http://iowacore.educateiowa.gov.
3. Describe the effect of dilations, translations, rotations, and reflections on twodimensional<br />
figures using coordinates. (8.G.3.)<br />
4. Understand that a two-dimensional figure is similar to another if the second can be<br />
obtained from the first by a sequence of rotations, reflections, translations, and<br />
dilations; given two similar two-dimensional figures, describe a sequence that exhibits<br />
the similarity between them. (8.G.4.)<br />
5. Use informal arguments to establish facts about the angle sum and exterior angle of<br />
triangles, about the angles created when parallel lines are cut by a transversal, and the<br />
angle-angle criterion for similarity of triangles. For example, arrange three copies of the<br />
same triangle so that the sum of the three angles appears to form a line, and give an<br />
argument in terms of transversals why this is so. (8.G.5.)<br />
Understand and apply the Pythagorean Theorem.<br />
6. Explain a proof of the Pythagorean Theorem and its converse. (8.G.6.)<br />
7. Apply the Pythagorean Theorem to determine unknown side lengths in right triangles in<br />
real-world and mathematical problems in two and three dimensions. (8.G.7.)<br />
8. Apply the Pythagorean Theorem to find the distance between two points in a<br />
coordinate system. (8.G.8.)<br />
Solve real-world and mathematical problems involving volume of cylinders, cones, and<br />
spheres.<br />
9. Know the formulas for the volumes of cones, cylinders, and spheres and use them to<br />
solve real-world and mathematical problems. (8.G.9.)<br />
Statistics and Probability<br />
8.SP<br />
Investigate patterns of association in bivariate data.<br />
1. Construct and interpret scatter plots for bivariate measurement data to investigate<br />
patterns of association between two quantities. Describe patterns such as clustering,<br />
outliers, positive or negative association, linear association, and nonlinear association.<br />
(8.SP.1.)<br />
2. Know that straight lines are widely used to model relationships between two<br />
quantitative variables. For scatter plots that suggest a linear association, informally fit a<br />
straight line, and informally assess the model fit by judging the closeness of the data<br />
points to the line. (8.SP.2.)<br />
3. Use the equation of a linear model to solve problems in the context of bivariate<br />
measurement data, interpreting the slope and intercept. For example, in a linear model<br />
for a biology experiment, interpret a slope of 1.5 cm/hr as meaning that an additional<br />
hour of sunlight each day is associated with an additional 1.5 cm in mature plant height.<br />
(8.SP.3.)<br />
4. Understand that patterns of association can also be seen in bivariate categorical data by<br />
displaying frequencies and relative frequencies in a two-way table. Construct and<br />
interpret a two-way table summarizing data on two categorical variables collected from<br />
the same subjects. Use relative frequencies calculated for rows or columns to describe<br />
possible association between the two variables. For example, collect data from students<br />
in your class on whether or not they have a curfew on school nights and whether or not<br />
they have assigned chores at home. Is there evidence that those who have a curfew also<br />
tend to have chores? (8.SP.4.)<br />
Disclaimer: This document is up-to-date as of 11/17/2010. The language provided may not be Page 57 of 98<br />
modified in any way. The most current <strong>Iowa</strong> <strong>Core</strong> can be found at http://iowacore.educateiowa.gov.
<strong>Mathematics</strong> Standards for High School<br />
The high school standards specify the mathematics that all students should study in order to be college and career<br />
ready. Additional mathematics that students should learn in order to take advanced courses such as calculus,<br />
advanced statistics, or discrete mathematics is indicated by (+), as in this example:<br />
(+) Represent complex numbers on the complex plane in rectangular and polar form<br />
(including real and imaginary numbers).<br />
All standards without a (+) symbol should be in the common mathematics curriculum for all college and career<br />
ready students. Standards with a (+) symbol may also appear in courses intended for all students.<br />
The high school standards are listed in conceptual categories:<br />
• Number and Quantity<br />
• Algebra<br />
• Functions<br />
• Modeling<br />
• Geometry<br />
• Statistics and Probability<br />
Conceptual categories portray a coherent view of high school mathematics; a student’s work with functions, for<br />
example, crosses a number of traditional course boundaries, potentially up through and including calculus.<br />
Modeling is best interpreted not as a collection of isolated topics but in relation to other standards. Making<br />
mathematical models is a Standard for Mathematical Practice, and specific modeling standards appear throughout<br />
the high school standards indicated by a star symbol ( ★ ). The star symbol sometimes appears on the heading for a<br />
group of standards; in that case, it should be understood to apply to all standards in that group.<br />
Disclaimer: This document is up-to-date as of 11/17/2010. The language provided may not be Page 58 of 98<br />
modified in any way. The most current <strong>Iowa</strong> <strong>Core</strong> can be found at http://iowacore.educateiowa.gov.
<strong>Mathematics</strong> | High School—Number and Quantity<br />
Numbers and Number Systems. During the years from kindergarten to eighth grade, students must repeatedly<br />
extend their conception of number. At first, "number" means "counting number": 1, 2, 3... Soon after that, 0 is<br />
used to represent "none" and the whole numbers are formed by the counting numbers together with zero. The<br />
next extension is fractions. At first, fractions are barely numbers and tied strongly to pictorial representations. Yet<br />
by the time students understand division of fractions, they have a strong concept of fractions as numbers and have<br />
connected them, via their decimal representations, with the base-ten system used to represent the whole<br />
numbers. During middle school, fractions are augmented by negative fractions to form the rational numbers. In<br />
Grade 8, students extend this system once more, augmenting the rational numbers with the irrational numbers to<br />
form the real numbers. In high school, students will be exposed to yet another extension of number, when the real<br />
numbers are augmented by the imaginary numbers to form the complex numbers.<br />
With each extension of number, the meanings of addition, subtraction, multiplication, and division are extended.<br />
In each new number system—integers, rational numbers, real numbers, and complex numbers—the four<br />
operations stay the same in two important ways: They have the commutative, associative, and distributive<br />
properties and their new meanings are consistent with their previous meanings.<br />
Extending the properties of whole-number exponents leads to new and productive notation. For example,<br />
properties of whole-number exponents suggest that (5 1/3 ) 3 should be 5 (1/3)3 = 5 1 = 5 and that 5 1/3 should be the<br />
cube root of 5.<br />
Calculators, spreadsheets, and computer algebra systems can provide ways for students to become better<br />
acquainted with these new number systems and their notation. They can be used to generate data for numerical<br />
experiments, to help understand the workings of matrix, vector, and complex number algebra, and to experiment<br />
with non-integer exponents.<br />
Quantities. In real world problems, the answers are usually not numbers but quantities: numbers with units, which<br />
involves measurement. In their work in measurement up through Grade 8, students primarily measure commonly<br />
used attributes such as length, area, and volume. In high school, students encounter a wider variety of units in<br />
modeling, e.g., acceleration, currency conversions, derived quantities such as person-hours and heating degree<br />
days, social science rates such as per-capita income, and rates in everyday life such as points scored per game or<br />
batting averages. They also encounter novel situations in which they themselves must conceive the attributes of<br />
interest. For example, to find a good measure of overall highway safety, they might propose measures such as<br />
fatalities per year, fatalities per year per driver, or fatalities per vehicle-mile traveled. Such a conceptual process is<br />
sometimes called quantification. Quantification is important for science, as when surface area suddenly “stands<br />
out” as an important variable in evaporation. Quantification is also important for companies, which must<br />
conceptualize relevant attributes and create or choose suitable measures for them.<br />
Disclaimer: This document is up-to-date as of 11/17/2010. The language provided may not be Page 59 of 98<br />
modified in any way. The most current <strong>Iowa</strong> <strong>Core</strong> can be found at http://iowacore.educateiowa.gov.
Number and Quantity Overview<br />
The Real Number System<br />
• Extend the properties of exponents to rational exponents<br />
• Use properties of rational and irrational numbers.<br />
Quantities<br />
• Reason quantitatively and use units to solve problems<br />
• (IA) Understand and apply the mathematics of voting.<br />
• (IA) Understand and apply some basic mathematics of<br />
information processing and the Internet.<br />
The Complex Number System<br />
• Perform arithmetic operations with complex numbers<br />
• Represent complex numbers and their operations on<br />
the complex plane<br />
• Use complex numbers in polynomial identities and<br />
equations<br />
Mathematical Practices<br />
1. Make sense of problems and<br />
persevere in solving them.<br />
2. Reason abstractly and quantitatively.<br />
3. Construct viable arguments and<br />
critique the reasoning of others.<br />
4. Model with mathematics.<br />
5. Use appropriate tools strategically.<br />
6. Attend to precision.<br />
7. Look for and make use of structure.<br />
8. Look for and express regularity in<br />
repeated reasoning.<br />
Vector and Matrix Quantities<br />
• Represent and model with vector quantities.<br />
• Perform operations on vectors.<br />
• Perform operations on matrices and use<br />
matrices in applications.<br />
Disclaimer: This document is up-to-date as of 11/17/2010. The language provided may not be Page 60 of 98<br />
modified in any way. The most current <strong>Iowa</strong> <strong>Core</strong> can be found at http://iowacore.educateiowa.gov.
The Real Number System<br />
N-RN<br />
Extend the properties of exponents to rational exponents.<br />
1. Explain how the definition of the meaning of rational exponents follows from extending<br />
the properties of integer exponents to those values, allowing for a notation for radicals in<br />
terms of rational exponents. For example, we define 5 1/3 to be the cube root of 5 because<br />
we want (5 1/3 ) 3 = 5 (1/3)3 to hold, so (5 1/3 ) 3 must equal 5. (N-RN.1.)<br />
2. Rewrite expressions involving radicals and rational exponents using the properties of<br />
exponents. (N-RN.2.)<br />
Use properties of rational and irrational numbers.<br />
3. Explain why the sum or product of two rational numbers is rational; that the sum of a<br />
rational number and an irrational number is irrational; and that the product of a nonzero<br />
rational number and an irrational number is irrational. (N-RN.3.)<br />
Quantities ★<br />
N-Q<br />
Reason quantitatively and use units to solve problems.<br />
1. Use units as a way to understand problems and to guide the solution of multi-step<br />
problems; choose and interpret units consistently in formulas; choose and interpret the<br />
scale and the origin in graphs and data displays. (N-Q.1.)<br />
2. Define appropriate quantities for the purpose of descriptive modeling. (N-Q.2.)<br />
3. Choose a level of accuracy appropriate to limitations on measurement when reporting<br />
quantities. (N-Q.3.)<br />
(IA) Understand and apply the mathematics of voting.<br />
IA.3.Understand, analyze, apply, and evaluate some common voting and analysis methods in<br />
addition to majority and plurality, such as runoff, approval, the so-called instant-runoff<br />
voting (IRV) method, the Borda method and the Condorcet method.<br />
(IA) Understand and apply some basic mathematics of information processing and the Internet.<br />
IA.4.(+) Describe the role of mathematics in information processing, particularly with respect<br />
to the Internet.<br />
IA.5.(+) Understand and apply elementary set theory and logic as used in simple Internet<br />
searches.<br />
IA. 6.(+) Understand and apply basic number theory, including modular arithmetic, for<br />
example, as used in keeping information secure through public-key cryptography.<br />
The Complex Number System<br />
N-CN<br />
Perform arithmetic operations with complex numbers.<br />
1. Know there is a complex number i such that i 2 = –1, and every complex number has the<br />
form a + bi with a and b real. (N-CN.1.)<br />
2. Use the relation i 2 = –1 and the commutative, associative, and distributive properties to<br />
add, subtract, and multiply complex numbers. (N-CN.2.)<br />
3. (+) Find the conjugate of a complex number; use conjugates to find moduli and quotients<br />
of complex numbers. (N-CN.3.)<br />
Represent complex numbers and their operations on the complex plane.<br />
4. (+) Represent complex numbers on the complex plane in rectangular and polar form<br />
(including real and imaginary numbers), and explain why the rectangular and polar forms<br />
of a given complex number represent the same number. (N-CN.4.)<br />
5. (+) Represent addition, subtraction, multiplication, and conjugation of complex numbers<br />
geometrically on the complex plane; use properties of this representation for<br />
computation. For example, (–1 + √3 i) 3 = 8 because (–1 + √3 i) has modulus 2 and<br />
argument <strong>12</strong>0°. (N-CN.5.)<br />
6. (+) Calculate the distance between numbers in the complex plane as the modulus of the<br />
difference, and the midpoint of a segment as the average of the numbers at its endpoints.<br />
(N-CN.6.)<br />
Disclaimer: This document is up-to-date as of 11/17/2010. The language provided may not be Page 61 of 98<br />
modified in any way. The most current <strong>Iowa</strong> <strong>Core</strong> can be found at http://iowacore.educateiowa.gov.
Use complex numbers in polynomial identities and equations.<br />
7. Solve quadratic equations with real coefficients that have complex solutions. (N-CN.7.)<br />
8. (+) Extend polynomial identities to the complex numbers. For example, rewrite x 2 + 4 as (x<br />
+ 2i)(x – 2i). (N-CN.8.)<br />
9. (+) Know the Fundamental Theorem of Algebra; show that it is true for quadratic<br />
polynomials. (N-CN.9.)<br />
Vector and Matrix Quantities<br />
N-VM<br />
Represent and model with vector quantities.<br />
1. (+) Recognize vector quantities as having both magnitude and direction. Represent vector<br />
quantities by directed line segments, and use appropriate symbols for vectors and their<br />
magnitudes (e.g., v, |v|, ||v||, v). (N-VM.1.)<br />
2. (+) Find the components of a vector by subtracting the coordinates of an initial point from<br />
the coordinates of a terminal point. (N-VM.2.)<br />
3. (+) Solve problems involving velocity and other quantities that can be represented by<br />
vectors. (N-VM.3.)<br />
Perform operations on vectors.<br />
4. (+) Add and subtract vectors.<br />
a. a. Add vectors end-to-end, component-wise, and by the parallelogram rule.<br />
Understand that the magnitude of a sum of two vectors is typically not the sum<br />
of the magnitudes.<br />
b. b. Given two vectors in magnitude and direction form, determine the magnitude<br />
and direction of their sum.<br />
c. c. Understand vector subtraction v – w as v + (–w), where –w is the additive<br />
inverse of w, with the same magnitude as w and pointing in the opposite<br />
direction. Represent vector subtraction graphically by connecting the tips in the<br />
appropriate order, and perform vector subtraction component-wise. (N-VM.4.)<br />
5. (+) Multiply a vector by a scalar.<br />
a. Represent scalar multiplication graphically by scaling vectors and possibly<br />
reversing their direction; perform scalar multiplication component-wise, e.g., as<br />
c(v x , v y ) = (cv x , cv y ).<br />
b. Compute the magnitude of a scalar multiple cv using ||cv|| = |c|v. Compute the<br />
direction of cv knowing that when |c|v ≠ 0, the direction of cv is either along v<br />
(for c > 0) or against v (for c < 0). (N-VM.5.)<br />
Perform operations on matrices and use matrices in applications.<br />
6. (+) Use matrices to represent and manipulate data, e.g., to represent payoffs or incidence<br />
relationships in a network. (N-VM.6.)<br />
7. (+) Multiply matrices by scalars to produce new matrices, e.g., as when all of the payoffs in<br />
a game are doubled. (N-VM.7.)<br />
8. (+) Add, subtract, and multiply matrices of appropriate dimensions. (N-VM.8.)<br />
9. (+) Understand that, unlike multiplication of numbers, matrix multiplication for square<br />
matrices is not a commutative operation, but still satisfies the associative and distributive<br />
properties. (N-VM.9.)<br />
10. (+) Understand that the zero and identity matrices play a role in matrix addition and<br />
multiplication similar to the role of 0 and 1 in the real numbers. The determinant of a<br />
square matrix is nonzero if and only if the matrix has a multiplicative inverse. (N-VM.10.)<br />
11. (+) Multiply a vector (regarded as a matrix with one column) by a matrix of suitable<br />
dimensions to produce another vector. Work with matrices as transformations of vectors.<br />
(N-VM.11.)<br />
<strong>12</strong>. (+) Work with 2 × 2 matrices as transformations of the plane, and interpret the absolute<br />
value of the determinant in terms of area. (N-VM.<strong>12</strong>.)<br />
Disclaimer: This document is up-to-date as of 11/17/2010. The language provided may not be Page 62 of 98<br />
modified in any way. The most current <strong>Iowa</strong> <strong>Core</strong> can be found at http://iowacore.educateiowa.gov.
<strong>Mathematics</strong> | High School—Algebra<br />
Expressions. An expression is a record of a computation with numbers, symbols that represent numbers,<br />
arithmetic operations, exponentiation, and, at more advanced levels, the operation of evaluating a function.<br />
Conventions about the use of parentheses and the order of operations assure that each expression is<br />
unambiguous. Creating an expression that describes a computation involving a general quantity requires the ability<br />
to express the computation in general terms, abstracting from specific instances.<br />
Reading an expression with comprehension involves analysis of its underlying structure. This may suggest a<br />
different but equivalent way of writing the expression that exhibits some different aspect of its meaning. For<br />
example, p + 0.05p can be interpreted as the addition of a 5% tax to a price p. Rewriting p + 0.05p as 1.05p shows<br />
that adding a tax is the same as multiplying the price by a constant factor.<br />
Algebraic manipulations are governed by the properties of operations and exponents, and the conventions of<br />
algebraic notation. At times, an expression is the result of applying operations to simpler expressions. For example,<br />
p + 0.05p is the sum of the simpler expressions p and 0.05p. Viewing an expression as the result of operation on<br />
simpler expressions can sometimes clarify its underlying structure.<br />
A spreadsheet or a computer algebra system (CAS) can be used to experiment with algebraic expressions, perform<br />
complicated algebraic manipulations, and understand how algebraic manipulations behave.<br />
Equations and inequalities. An equation is a statement of equality between two expressions, often viewed as a<br />
question asking for which values of the variables the expressions on either side are in fact equal. These values are<br />
the solutions to the equation. An identity, in contrast, is true for all values of the variables; identities are often<br />
developed by rewriting an expression in an equivalent form.<br />
The solutions of an equation in one variable form a set of numbers; the solutions of an equation in two variables<br />
form a set of ordered pairs of numbers, which can be plotted in the coordinate plane. Two or more equations<br />
and/or inequalities form a system. A solution for such a system must satisfy every equation and inequality in the<br />
system.<br />
An equation can often be solved by successively deducing from it one or more simpler equations. For example, one<br />
can add the same constant to both sides without changing the solutions, but squaring both sides might lead to<br />
extraneous solutions. Strategic competence in solving includes looking ahead for productive manipulations and<br />
anticipating the nature and number of solutions.<br />
Some equations have no solutions in a given number system, but have a solution in a larger system. For example,<br />
the solution of x + 1 = 0 is an integer, not a whole number; the solution of 2x + 1 = 0 is a rational number, not an<br />
integer; the solutions of x 2 – 2 = 0 are real numbers, not rational numbers; and the solutions of x 2 + 2 = 0 are<br />
complex numbers, not real numbers.<br />
The same solution techniques used to solve equations can be used to rearrange formulas. For example, the<br />
formula for the area of a trapezoid, A = ((b 1 +b 2 )/2)h, can be solved for h using the same deductive process.<br />
Inequalities can be solved by reasoning about the properties of inequality. Many, but not all, of the properties of<br />
equality continue to hold for inequalities and can be useful in solving them.<br />
Connections to Functions and Modeling. Expressions can define functions, and equivalent expressions define the<br />
same function. Asking when two functions have the same value for the same input leads to an equation; graphing<br />
the two functions allows for finding approximate solutions of the equation. Converting a verbal description to an<br />
equation, inequality, or system of these is an essential skill in modeling.<br />
Disclaimer: This document is up-to-date as of 11/17/2010. The language provided may not be Page 63 of 98<br />
modified in any way. The most current <strong>Iowa</strong> <strong>Core</strong> can be found at http://iowacore.educateiowa.gov.
Algebra Overview<br />
Seeing Structure in Expressions<br />
• Interpret the structure of expressions<br />
• Write expressions in equivalent forms to<br />
solve problems<br />
Arithmetic with Polynomials and Rational<br />
Expressions<br />
• Perform arithmetic operations on polynomials<br />
• Understand the relationship between zeros and<br />
factors of polynomials<br />
• Use polynomial identities to solve problems<br />
• Rewrite rational expressions<br />
Creating Equations<br />
• Create equations that describe numbers or<br />
relationships<br />
Mathematical Practices<br />
1. Make sense of problems and<br />
persevere in solving them.<br />
2. Reason abstractly and quantitatively.<br />
3. Construct viable arguments and<br />
critique the reasoning of others.<br />
4. Model with mathematics.<br />
5. Use appropriate tools strategically.<br />
6. Attend to precision.<br />
7. Look for and make use of structure.<br />
8. Look for and express regularity in<br />
repeated reasoning.<br />
Reasoning with Equations and Inequalities<br />
• Understand solving equations as a process of<br />
reasoning and explain the reasoning<br />
• Solve equations and inequalities in one variable<br />
• Solve systems of equations<br />
• Represent and solve equations and inequalities graphically<br />
Disclaimer: This document is up-to-date as of 11/17/2010. The language provided may not be Page 64 of 98<br />
modified in any way. The most current <strong>Iowa</strong> <strong>Core</strong> can be found at http://iowacore.educateiowa.gov.
Seeing Structure in Expressions<br />
A-SSE<br />
Interpret the structure of expressions<br />
1. Interpret expressions that represent a quantity in terms of its context. ★<br />
a. Interpret parts of an expression, such as terms, factors, and coefficients.<br />
b. Interpret complicated expressions by viewing one or more of their parts as a<br />
single entity. For example, interpret P(1+r) n as the product of P and a factor not<br />
depending on P. (A-SSE.1.)<br />
2. Use the structure of an expression to identify ways to rewrite it. For example, see x 4 – y 4<br />
as (x 2 ) 2 – (y 2 ) 2 , thus recognizing it as a difference of squares that can be factored as (x 2 –<br />
y 2 )(x 2 + y 2 ). (A-SSE.2.)<br />
Write expressions in equivalent forms to solve problems<br />
3. Choose and produce an equivalent form of an expression to reveal and explain<br />
properties of the quantity represented by the expression. ★<br />
a. Factor a quadratic expression to reveal the zeros of the function it defines.<br />
b. Complete the square in a quadratic expression to reveal the maximum or<br />
minimum value of the function it defines.<br />
c. Use the properties of exponents to transform expressions for exponential<br />
functions. For example the expression 1.15 t can be rewritten as (1.15 1/<strong>12</strong> ) <strong>12</strong>t ≈<br />
1.0<strong>12</strong> <strong>12</strong>t to reveal the approximate equivalent monthly interest rate if the<br />
annual rate is 15%. (A-SSE.3.)<br />
4. Derive the formula for the sum of a finite geometric series (when the common ratio is<br />
not 1), and use the formula to solve problems. For example, calculate mortgage<br />
payments. ★ (A-SSE.4.)<br />
Arithmetic with Polynomials and Rational Expressions<br />
A-APR<br />
Perform arithmetic operations on polynomials<br />
1. Understand that polynomials form a system analogous to the integers, namely, they are<br />
closed under the operations of addition, subtraction, and multiplication; add, subtract,<br />
and multiply polynomials. (A-APR.1.)<br />
Understand the relationship between zeros and factors of polynomials<br />
2. Know and apply the Remainder Theorem: For a polynomial p(x) and a number a, the<br />
remainder on division by x – a is p(a), so p(a) = 0 if and only if (x – a) is a factor of p(x).<br />
(A-APR.2.)<br />
3. Identify zeros of polynomials when suitable factorizations are available, and use the<br />
zeros to construct a rough graph of the function defined by the polynomial. (A-APR.3.)<br />
Use polynomial identities to solve problems<br />
4. Prove polynomial identities and use them to describe numerical relationships. For<br />
example, the polynomial identity (x 2 + y 2 ) 2 = (x 2 – y 2 ) 2 + (2xy) 2 can be used to generate<br />
Pythagorean triples. (A-APR.4.)<br />
5. (+) Know and apply the Binomial Theorem for the expansion of (x + y) n in powers of x<br />
and y for a positive integer n, where x and y are any numbers, with coefficients<br />
determined for example by Pascal’s Triangle. 1 (A-APR.5.)<br />
1 The Binomial Theorem can be proved by mathematical induction or by a combinatorial argument.<br />
Disclaimer: This document is up-to-date as of 11/17/2010. The language provided may not be Page 65 of 98<br />
modified in any way. The most current <strong>Iowa</strong> <strong>Core</strong> can be found at http://iowacore.educateiowa.gov.
Rewrite rational expressions<br />
6. Rewrite simple rational expressions in different forms; write a(x)/b(x) in the form q(x) +<br />
r(x)/b(x), where a(x), b(x), q(x), and r(x) are polynomials with the degree of r(x) less than<br />
the degree of b(x), using inspection, long division, or, for the more complicated<br />
examples, a computer algebra system. (A-APR.6.)<br />
7. (+) Understand that rational expressions form a system analogous to the rational<br />
numbers, closed under addition, subtraction, multiplication, and division by a nonzero<br />
rational expression; add, subtract, multiply, and divide rational expressions. (A-APR.7.)<br />
Creating Equations ★<br />
A-CED<br />
Create equations that describe numbers or relationships<br />
1. Create equations and inequalities in one variable and use them to solve problems.<br />
Include equations arising from linear and quadratic functions, and simple rational and<br />
exponential functions. (A-CED.1.)<br />
2. Create equations in two or more variables to represent relationships between quantities;<br />
graph equations on coordinate axes with labels and scales. (A-CED.2.)<br />
3. Represent constraints by equations or inequalities, and by systems of equations and/or<br />
inequalities, and interpret solutions as viable or nonviable options in a modeling context.<br />
For example, represent inequalities describing nutritional and cost constraints on<br />
combinations of different foods. (A-CED.3.)<br />
4. Rearrange formulas to highlight a quantity of interest, using the same reasoning as in<br />
solving equations. For example, rearrange Ohm’s law V = IR to highlight resistance R.<br />
(A-CED.4.)<br />
Reasoning with Equations and Inequalities<br />
A-REI<br />
Understand solving equations as a process of reasoning and explain the reasoning<br />
1. Explain each step in solving a simple equation as following from the equality of numbers<br />
asserted at the previous step, starting from the assumption that the original equation<br />
has a solution. Construct a viable argument to justify a solution method. (A-REI.1.)<br />
2. Solve simple rational and radical equations in one variable, and give examples showing<br />
how extraneous solutions may arise. (A-REI.2.)<br />
Solve equations and inequalities in one variable<br />
3. S<br />
olve linear equations and inequalities in one variable, including equations with<br />
coefficients represented by letters. (A-REI.3.)<br />
4. Solve quadratic equations in one variable.<br />
a. Use the method of completing the square to transform any quadratic equation<br />
in x into an equation of the form (x – p) 2 = q that has the same solutions. Derive<br />
the quadratic formula from this form.<br />
b. Solve quadratic equations by inspection (e.g., for x 2 = 49), taking square roots,<br />
completing the square, the quadratic formula and factoring, as appropriate to<br />
the initial form of the equation. Recognize when the quadratic formula gives<br />
complex solutions and write them as a ± bi for real numbers a and b. (A-REI.4.)<br />
Solve systems of equations<br />
5. Prove that, given a system of two equations in two variables, replacing one equation by<br />
the sum of that equation and a multiple of the other produces a system with the same<br />
solutions. (A-REI.5.)<br />
Disclaimer: This document is up-to-date as of 11/17/2010. The language provided may not be Page 66 of 98<br />
modified in any way. The most current <strong>Iowa</strong> <strong>Core</strong> can be found at http://iowacore.educateiowa.gov.
6. Solve systems of linear equations exactly and approximately (e.g., with graphs), focusing<br />
on pairs of linear equations in two variables. (A-REI.6.)<br />
7. Solve a simple system consisting of a linear equation and a quadratic equation in two<br />
variables algebraically and graphically. For example, find the points of intersection<br />
between the line y = –3x and the circle x 2 + y 2 = 3. (A-REI.7.)<br />
8. (+) Represent a system of linear equations as a single matrix equation in a vector<br />
variable. (A-REI.8.)<br />
9. (+) Find the inverse of a matrix if it exists and use it to solve systems of linear equations<br />
(using technology for matrices of dimension 3 × 3 or greater). (A-REI.9.)<br />
Represent and solve equations and inequalities graphically<br />
10. Understand that the graph of an equation in two variables is the set of all its solutions<br />
plotted in the coordinate plane, often forming a curve (which could be a line).<br />
(A-REI.10.)<br />
11. Explain why the x-coordinates of the points where the graphs of the equations y = f(x)<br />
and y = g(x) intersect are the solutions of the equation f(x) = g(x); find the solutions<br />
approximately, e.g., using technology to graph the functions, make tables of values, or<br />
find successive approximations. Include cases where f(x) and/or g(x) are linear,<br />
polynomial, rational, absolute value, exponential, and logarithmic functions. ★<br />
(A-REI.11.)<br />
<strong>12</strong>. Graph the solutions to a linear inequality in two variables as a half-plane (excluding the<br />
boundary in the case of a strict inequality), and graph the solution set to a system of<br />
linear inequalities in two variables as the intersection of the corresponding half-planes.<br />
(A-REI.<strong>12</strong>.)<br />
Disclaimer: This document is up-to-date as of 11/17/2010. The language provided may not be Page 67 of 98<br />
modified in any way. The most current <strong>Iowa</strong> <strong>Core</strong> can be found at http://iowacore.educateiowa.gov.
<strong>Mathematics</strong> | High School—Functions<br />
Functions describe situations where one quantity determines another. For example, the return on $10,000<br />
invested at an annualized percentage rate of 4.25% is a function of the length of time the money is invested.<br />
Because we continually make theories about dependencies between quantities in nature and society, functions are<br />
important tools in the construction of mathematical models.<br />
In school mathematics, functions usually have numerical inputs and outputs and are often defined by an algebraic<br />
expression. For example, the time in hours it takes for a car to drive 100 miles is a function of the car’s speed in<br />
miles per hour, v; the rule T(v) = 100/v expresses this relationship algebraically and defines a function whose name<br />
is T.<br />
The set of inputs to a function is called its domain. We often infer the domain to be all inputs for which the<br />
expression defining a function has a value, or for which the function makes sense in a given context.<br />
A function can be described in various ways, such as by a graph (e.g., the trace of a seismograph); by a verbal rule,<br />
as in, "I'll give you a state, you give me the capital city;" by an algebraic expression like f(x) = a + bx; or by a<br />
recursive rule. The graph of a function is often a useful way of visualizing the relationship of the function models,<br />
and manipulating a mathematical expression for a function can throw light on the function's properties.<br />
Functions presented as expressions can model many important phenomena. Two important families of functions<br />
characterized by laws of growth are linear functions, which grow at a constant rate, and exponential functions,<br />
which grow at a constant percent rate. Linear functions with a constant term of zero describe proportional<br />
relationships.<br />
A graphing utility or a computer algebra system can be used to experiment with properties of these functions and<br />
their graphs and to build computational models of functions, including recursively defined functions.<br />
Connections to Expressions, Equations, Modeling, and Coordinates.<br />
Determining an output value for a particular input involves evaluating an expression; finding inputs that yield a<br />
given output involves solving an equation. Questions about when two functions have the same value for the same<br />
input lead to equations, whose solutions can be visualized from the intersection of their graphs. Because functions<br />
describe relationships between quantities, they are frequently used in modeling. Sometimes functions are defined<br />
by a recursive process, which can be displayed effectively using a spreadsheet or other technology.<br />
Disclaimer: This document is up-to-date as of 11/17/2010. The language provided may not be Page 68 of 98<br />
modified in any way. The most current <strong>Iowa</strong> <strong>Core</strong> can be found at http://iowacore.educateiowa.gov.
Functions Overview<br />
Interpreting Functions<br />
• Understand the concept of a function and use<br />
function notation<br />
• Interpret functions that arise in applications in<br />
terms<br />
of the context<br />
• Analyze functions using different representations<br />
Building Functions<br />
• Build a function that models a relationship between<br />
two quantities<br />
• Build new functions from existing functions<br />
Linear, Quadratic, and Exponential Models<br />
• Construct and compare linear, quadratic, and<br />
exponential models and solve problems<br />
• Interpret expressions for functions in terms of<br />
the situation they model<br />
Mathematical Practices<br />
1. Make sense of problems and<br />
persevere in solving them.<br />
2. Reason abstractly and quantitatively.<br />
3. Construct viable arguments and<br />
critique the reasoning of others.<br />
4. Model with mathematics.<br />
5. Use appropriate tools strategically.<br />
6. Attend to precision.<br />
7. Look for and make use of structure.<br />
8. Look for and express regularity in<br />
repeated reasoning.<br />
Trigonometric Functions<br />
• Extend the domain of trigonometric<br />
functions using the unit circle<br />
• Model periodic phenomena with<br />
trigonometric functions<br />
• Prove and apply trigonometric identities<br />
Disclaimer: This document is up-to-date as of 11/17/2010. The language provided may not be Page 69 of 98<br />
modified in any way. The most current <strong>Iowa</strong> <strong>Core</strong> can be found at http://iowacore.educateiowa.gov.
Interpreting Functions<br />
F-IF<br />
Understand the concept of a function and use function notation<br />
1. Understand that a function from one set (called the domain) to another set (called the<br />
range) assigns to each element of the domain exactly one element of the range. If f is a<br />
function and x is an element of its domain, then f(x) denotes the output of f<br />
corresponding to the input x. The graph of f is the graph of the equation y = f(x). (F-IF.1.)<br />
2. Use function notation, evaluate functions for inputs in their domains, and interpret<br />
statements that use function notation in terms of a context. (F-IF.2.)<br />
3. Recognize that sequences are functions, sometimes defined recursively, whose domain<br />
is a subset of the integers. For example, the Fibonacci sequence is defined recursively by<br />
f(0) = f(1) = 1, f(n+1) = f(n) + f(n-1) for n ≥ 1. (F-IF.3.)<br />
Interpret functions that arise in applications in terms of the context<br />
4. For a function that models a relationship between two quantities, interpret key features<br />
of graphs and tables in terms of the quantities, and sketch graphs showing key features<br />
given a verbal description of the relationship. Key features include: intercepts; intervals<br />
where the function is increasing, decreasing, positive, or negative; relative maximums<br />
and minimums; symmetries; end behavior; and periodicity. ★ (F-IF. 4.)<br />
5. Relate the domain of a function to its graph and, where applicable, to the quantitative<br />
relationship it describes. For example, if the function h(n) gives the number of personhours<br />
it takes to assemble n engines in a factory, then the positive integers would be an<br />
appropriate domain for the function. ★ (F-IF.5.)<br />
6. Calculate and interpret the average rate of change of a function (presented symbolically<br />
or as a table) over a specified interval. Estimate the rate of change from a graph. ★<br />
(F-IF.6.)<br />
Analyze functions using different representations<br />
7. Graph functions expressed symbolically and show key features of the graph, by hand in<br />
simple cases and using technology for more complicated cases. ★<br />
a. Graph linear and quadratic functions and show intercepts, maxima, and<br />
minima.<br />
b. Graph square root, cube root, and piecewise-defined functions, including step<br />
functions and absolute value functions.<br />
c. Graph polynomial functions, identifying zeros when suitable factorizations are<br />
available, and showing end behavior.<br />
d. (+) Graph rational functions, identifying zeros and asymptotes when suitable<br />
factorizations are available, and showing end behavior.<br />
e. Graph exponential and logarithmic functions, showing intercepts and end<br />
behavior, and trigonometric functions, showing period, midline, and amplitude.<br />
(F-IF.7.)<br />
8. Write a function defined by an expression in different but equivalent forms to reveal<br />
and explain different properties of the function.<br />
a. Use the process of factoring and completing the square in a quadratic function<br />
to show zeros, extreme values, and symmetry of the graph, and interpret these<br />
in terms of a context.<br />
b. Use the properties of exponents to interpret expressions for exponential<br />
functions. For example, identify percent rate of change in functions such as y =<br />
(1.02) t , y = (0.97) t , y = (1.01) <strong>12</strong>t , y = (1.2) t/10 , and classify them as representing<br />
exponential growth or decay. (F-IF.8.)<br />
Disclaimer: This document is up-to-date as of 11/17/2010. The language provided may not be Page 70 of 98<br />
modified in any way. The most current <strong>Iowa</strong> <strong>Core</strong> can be found at http://iowacore.educateiowa.gov.
9. Compare properties of two functions each represented in a different way (algebraically,<br />
graphically, numerically in tables, or by verbal descriptions). For example, given a graph<br />
of one quadratic function and an algebraic expression for another, say which has the<br />
larger maximum. (F-IF.9.)<br />
Building Functions<br />
F-BF<br />
Build a function that models a relationship between two quantities<br />
1. Write a function that describes a relationship between two quantities. ★<br />
a. Determine an explicit expression, a recursive process, or steps for calculation<br />
from a context.<br />
b. Combine standard function types using arithmetic operations. For example,<br />
build a function that models the temperature of a cooling body by adding a<br />
constant function to a decaying exponential, and relate these functions to the<br />
model.<br />
c. (+) Compose functions. For example, if T(y) is the temperature in the<br />
atmosphere as a function of height, and h(t) is the height of a weather balloon<br />
as a function of time, then T(h(t)) is the temperature at the location of the<br />
weather balloon as a function of time. (F-BF.1.)<br />
2. Write arithmetic and geometric sequences both recursively and with an explicit<br />
formula, use them to model situations, and translate between the two forms. ★ (F-BF.2.)<br />
Build new functions from existing functions<br />
3. Identify the effect on the graph of replacing f(x) by f(x) + k, k f(x), f(kx), and f(x + k) for<br />
specific values of k (both positive and negative); find the value of k given the graphs.<br />
Experiment with cases and illustrate an explanation of the effects on the graph using<br />
technology. Include recognizing even and odd functions from their graphs and algebraic<br />
expressions for them. (F-BF.3.)<br />
4. Find inverse functions.<br />
a. Solve an equation of the form f(x) = c for a simple function f that has an inverse<br />
and write an expression for the inverse. For example, f(x) =2 x 3 or f(x) =<br />
(x+1)/(x–1) for x ≠ 1.<br />
b. (+) Verify by composition that one function is the inverse of another.<br />
c. (+) Read values of an inverse function from a graph or a table, given that the<br />
function has an inverse.<br />
d. (+) Produce an invertible function from a non-invertible function by restricting<br />
the domain. (F-BF.4.)<br />
5. (+) Understand the inverse relationship between exponents and logarithms and use this<br />
relationship to solve problems involving logarithms and exponents. (F-BF.5.)<br />
Linear, Quadratic, and Exponential Models ★<br />
F-LE<br />
Construct and compare linear, quadratic, and exponential models and solve problems<br />
1. Distinguish between situations that can be modeled with linear functions and with<br />
exponential functions.<br />
a. Prove that linear functions grow by equal differences over equal intervals, and<br />
that exponential functions grow by equal factors over equal intervals.<br />
b. Recognize situations in which one quantity changes at a constant rate per unit<br />
interval relative to another.<br />
c. Recognize situations in which a quantity grows or decays by a constant percent<br />
rate per unit interval relative to another. (F-LE.1.)<br />
Disclaimer: This document is up-to-date as of 11/17/2010. The language provided may not be Page 71 of 98<br />
modified in any way. The most current <strong>Iowa</strong> <strong>Core</strong> can be found at http://iowacore.educateiowa.gov.
2. Construct linear and exponential functions, including arithmetic and geometric<br />
sequences, given a graph, a description of a relationship, or two input-output pairs<br />
(include reading these from a table). (F-LE.2.)<br />
3. Observe using graphs and tables that a quantity increasing exponentially eventually<br />
exceeds a quantity increasing linearly, quadratically, or (more generally) as a polynomial<br />
function. (F-LE.3.)<br />
4. For exponential models, express as a logarithm the solution to ab ct = d where a, c, and d<br />
are numbers and the base b is 2, 10, or e; evaluate the logarithm using technology.<br />
(F-LE.4.)<br />
Interpret expressions for functions in terms of the situation they model<br />
5. Interpret the parameters in a linear or exponential function in terms of a context.<br />
(F-LE.5.)<br />
Trigonometric Functions<br />
F-TF<br />
Extend the domain of trigonometric functions using the unit circle<br />
1. Understand radian measure of an angle as the length of the arc on the unit circle<br />
subtended by the angle. (F-TF.1.)<br />
2. Explain how the unit circle in the coordinate plane enables the extension of<br />
trigonometric functions to all real numbers, interpreted as radian measures of angles<br />
traversed counterclockwise around the unit circle. (F-TF.2.)<br />
3. (+) Use special triangles to determine geometrically the values of sine, cosine, tangent<br />
for π/3, π/4 and π/6, and use the unit circle to express the values of sine, cosine, and<br />
tangent for π–x, π+x, and 2π–x in terms of their values for x, where x is any real number.<br />
(F-TF.3.)<br />
4. (+) Use the unit circle to explain symmetry (odd and even) and periodicity of<br />
trigonometric functions. (F-TF.4.)<br />
Model periodic phenomena with trigonometric functions<br />
5. Choose trigonometric functions to model periodic phenomena with specified amplitude,<br />
frequency, and midline. ★ (F-TF.5.)<br />
6. (+) Understand that restricting a trigonometric function to a domain on which it is<br />
always increasing or always decreasing allows its inverse to be constructed. (F-TF.6.)<br />
7. (+) Use inverse functions to solve trigonometric equations that arise in modeling<br />
contexts; evaluate the solutions using technology, and interpret them in terms of the<br />
context. ★ (F-TF.7.)<br />
Prove and apply trigonometric identities<br />
8. Prove the Pythagorean identity sin 2 (θ) + cos 2 (θ) = 1 and use it to find sin(θ), cos(θ), or<br />
tan(θ) given sin(θ), cos(θ), or tan(θ) and the quadrant of the angle. (F-TF.8.)<br />
9. (+) Prove the addition and subtraction formulas for sine, cosine, and tangent and use<br />
them to solve problems. (F-TF.9.)<br />
Disclaimer: This document is up-to-date as of 11/17/2010. The language provided may not be Page 72 of 98<br />
modified in any way. The most current <strong>Iowa</strong> <strong>Core</strong> can be found at http://iowacore.educateiowa.gov.
<strong>Mathematics</strong> | High School—Modeling<br />
Modeling links classroom mathematics and statistics to everyday life, work, and decision-making. Modeling is the<br />
process of choosing and using appropriate mathematics and statistics to analyze empirical situations, to<br />
understand them better, and to improve decisions. Quantities and their relationships in physical, economic, public<br />
policy, social, and everyday situations can be modeled using mathematical and statistical methods. When making<br />
mathematical models, technology is valuable for varying assumptions, exploring consequences, and comparing<br />
predictions with data.<br />
A model can be very simple, such as writing total cost as a product of unit price and number bought, or using a<br />
geometric shape to describe a physical object like a coin. Even such simple models involve making choices. It is up<br />
to us whether to model a coin as a three-dimensional cylinder, or whether a two-dimensional disk works well<br />
enough for our purposes. Other situations—modeling a delivery route, a production schedule, or a comparison of<br />
loan amortizations—need more elaborate models that use other tools from the mathematical sciences. Real-world<br />
situations are not organized and labeled for analysis; formulating tractable models, representing such models, and<br />
analyzing them is appropriately a creative process. Like every such process, this depends on acquired expertise as<br />
well as creativity.<br />
Some examples of such situations might include:<br />
• Estimating how much water and food is needed for emergency relief in a devastated city of 3 million<br />
people, and how it might be distributed.<br />
• Planning a table tennis tournament for 7 players at a club with 4 tables, where each player plays against<br />
each other player.<br />
• Designing the layout of the stalls in a school fair so as to raise as much money as possible.<br />
• Analyzing stopping distance for a car.<br />
• Modeling savings account balance, bacterial colony growth, or investment growth.<br />
• Engaging in critical path analysis, e.g., applied to turnaround of an aircraft at an airport.<br />
• Analyzing risk in situations such as extreme sports, pandemics, and terrorism.<br />
• Relating population statistics to individual predictions.<br />
In situations like these, the models devised depend on a number of factors: How precise an answer do we want or<br />
need? What aspects of the situation do we most need to understand, control, or optimize? What resources of time<br />
and tools do we have? The range of models that we can create and analyze is also constrained by the limitations of<br />
our mathematical, statistical, and technical skills, and our ability to recognize significant variables and relationships<br />
among them. Diagrams of various kinds, spreadsheets and other technology, and algebra are powerful tools for<br />
understanding and solving problems drawn from different types of real-world situations.<br />
One of the insights provided by<br />
mathematical modeling is that<br />
essentially the same mathematical or<br />
statistical structure can sometimes<br />
model seemingly different situations.<br />
Models can also shed light on the<br />
mathematical structures themselves,<br />
for example, as when a model of<br />
bacterial growth makes more vivid<br />
the explosive growth of the exponential function.<br />
The basic modeling cycle is summarized in the diagram. It involves (1) identifying variables in the situation and<br />
selecting those that represent essential features, (2) formulating a model by creating and selecting geometric,<br />
graphical, tabular, algebraic, or statistical representations that describe relationships between the variables, (3)<br />
analyzing and performing operations on these relationships to draw conclusions, (4) interpreting the results of the<br />
mathematics in terms of the original situation, (5) validating the conclusions by comparing them with the situation,<br />
and then either improving the model or, if it is acceptable, (6) reporting on the conclusions and the reasoning<br />
behind them. Choices, assumptions, and approximations are present throughout this cycle.<br />
Disclaimer: This document is up-to-date as of 11/17/2010. The language provided may not be Page 73 of 98<br />
modified in any way. The most current <strong>Iowa</strong> <strong>Core</strong> can be found at http://iowacore.educateiowa.gov.
In descriptive modeling, a model simply describes the phenomena or summarizes them in a compact form. Graphs<br />
of observations are a familiar descriptive model— for example, graphs of global temperature and atmospheric CO 2<br />
over time.<br />
Analytic modeling seeks to explain data on the basis of deeper theoretical ideas, albeit with parameters that are<br />
empirically based; for example, exponential growth of bacterial colonies (until cut-off mechanisms such as<br />
pollution or starvation intervene) follows from a constant reproduction rate. Functions are an important tool for<br />
analyzing such problems.<br />
Graphing utilities, spreadsheets, computer algebra systems, and dynamic geometry software are powerful tools<br />
that can be used to model purely mathematical phenomena (e.g., the behavior of polynomials) as well as physical<br />
phenomena.<br />
Modeling Standards Modeling is best interpreted not as a collection of isolated topics but rather in relation to<br />
other standards. Making mathematical models is a Standard for Mathematical Practice, and specific modeling<br />
standards appear throughout the high school standards indicated by a star symbol ( ★ ).<br />
Disclaimer: This document is up-to-date as of 11/17/2010. The language provided may not be Page 74 of 98<br />
modified in any way. The most current <strong>Iowa</strong> <strong>Core</strong> can be found at http://iowacore.educateiowa.gov.
<strong>Mathematics</strong> | High School—Geometry<br />
An understanding of the attributes and relationships of geometric objects can be applied in diverse contexts—<br />
interpreting a schematic drawing, estimating the amount of wood needed to frame a sloping roof, rendering<br />
computer graphics, or designing a sewing pattern for the most efficient use of material.<br />
Although there are many types of geometry, school mathematics is devoted primarily to plane Euclidean<br />
geometry, studied both synthetically (without coordinates) and analytically (with coordinates). Euclidean geometry<br />
is characterized most importantly by the Parallel Postulate, that through a point not on a given line there is exactly<br />
one parallel line. (Spherical geometry, in contrast, has no parallel lines.)<br />
During high school, students begin to formalize their geometry experiences from elementary and middle school,<br />
using more precise definitions and developing careful proofs. Later in college some students develop Euclidean and<br />
other geometries carefully from a small set of axioms.<br />
The concepts of congruence, similarity, and symmetry can be understood from the perspective of geometric<br />
transformation. Fundamental are the rigid motions: translations, rotations, reflections, and combinations of these,<br />
all of which are here assumed to preserve distance and angles (and therefore shapes generally). Reflections and<br />
rotations each explain a particular type of symmetry, and the symmetries of an object offer insight into its<br />
attributes—as when the reflective symmetry of an isosceles triangle assures that its base angles are congruent.<br />
In the approach taken here, two geometric figures are defined to be congruent if there is a sequence of rigid<br />
motions that carries one onto the other. This is the principle of superposition. For triangles, congruence means the<br />
equality of all corresponding pairs of sides and all corresponding pairs of angles. During the middle grades, through<br />
experiences drawing triangles from given conditions, students notice ways to specify enough measures in a<br />
triangle to ensure that all triangles drawn with those measures are congruent. Once these triangle congruence<br />
criteria (ASA, SAS, and SSS) are established using rigid motions, they can be used to prove theorems about<br />
triangles, quadrilaterals, and other geometric figures.<br />
Similarity transformations (rigid motions followed by dilations) define similarity in the same way that rigid motions<br />
define congruence, thereby formalizing the similarity ideas of "same shape" and "scale factor" developed in the<br />
middle grades. These transformations lead to the criterion for triangle similarity that two pairs of corresponding<br />
angles are congruent.<br />
The definitions of sine, cosine, and tangent for acute angles are founded on right triangles and similarity, and, with<br />
the Pythagorean Theorem, are fundamental in many real-world and theoretical situations. The Pythagorean<br />
Theorem is generalized to non-right triangles by the Law of Cosines. Together, the Laws of Sines and Cosines<br />
embody the triangle congruence criteria for the cases where three pieces of information suffice to completely<br />
solve a triangle. Furthermore, these laws yield two possible solutions in the ambiguous case, illustrating that Side-<br />
Side-Angle is not a congruence criterion.<br />
Analytic geometry connects algebra and geometry, resulting in powerful methods of analysis and problem solving.<br />
Just as the number line associates numbers with locations in one dimension, a pair of perpendicular axes<br />
associates pairs of numbers with locations in two dimensions. This correspondence between numerical<br />
coordinates and geometric points allows methods from algebra to be applied to geometry and vice versa. The<br />
solution set of an equation becomes a geometric curve, making visualization a tool for doing and understanding<br />
algebra. Geometric shapes can be described by equations, making algebraic manipulation into a tool for geometric<br />
understanding, modeling, and proof. Geometric transformations of the graphs of equations correspond to<br />
algebraic changes in their equations.<br />
Dynamic geometry environments provide students with experimental and modeling tools that allow them to<br />
investigate geometric phenomena in much the same way as computer algebra systems allow them to experiment<br />
with algebraic phenomena.<br />
Disclaimer: This document is up-to-date as of 11/17/2010. The language provided may not be Page 75 of 98<br />
modified in any way. The most current <strong>Iowa</strong> <strong>Core</strong> can be found at http://iowacore.educateiowa.gov.
Connections to Equations. The correspondence between numerical coordinates and geometric points allows<br />
methods from algebra to be applied to geometry and vice versa. The solution set of an equation becomes a<br />
geometric curve, making visualization a tool for doing and understanding algebra. Geometric shapes can be<br />
described by equations, making algebraic manipulation into a tool for geometric understanding, modeling, and<br />
proof.<br />
Disclaimer: This document is up-to-date as of 11/17/2010. The language provided may not be Page 76 of 98<br />
modified in any way. The most current <strong>Iowa</strong> <strong>Core</strong> can be found at http://iowacore.educateiowa.gov.
Geometry Overview<br />
Congruence<br />
• Experiment with transformations in the plane<br />
• Understand congruence in terms of rigid motions<br />
• Prove geometric theorems<br />
• Make geometric constructions<br />
Similarity, Right Triangles, and Trigonometry<br />
• Understand similarity in terms of similarity<br />
transformations<br />
• Prove theorems involving similarity<br />
• Define trigonometric ratios and solve problems<br />
involving right triangles<br />
• Apply trigonometry to general triangles<br />
Circles<br />
• Understand and apply theorems about circles<br />
• Find arc lengths and areas of sectors of circles<br />
Mathematical Practices<br />
1. Make sense of problems and<br />
persevere in solving them.<br />
2. Reason abstractly and quantitatively.<br />
3. Construct viable arguments and<br />
critique the reasoning of others.<br />
4. Model with mathematics.<br />
5. Use appropriate tools strategically.<br />
6. Attend to precision.<br />
7. Look for and make use of structure.<br />
8. Look for and express regularity in<br />
repeated reasoning.<br />
Expressing Geometric Properties with Equations<br />
• Translate between the geometric description and<br />
the equation for a conic section<br />
• Use coordinates to prove simple geometric theorems<br />
algebraically<br />
Geometric Measurement and Dimension<br />
• Explain volume formulas and use them to<br />
solve problems<br />
• Visualize relationships between two-dimensional<br />
and three-dimensional objects<br />
Modeling with Geometry<br />
• Apply geometric concepts in modeling situations<br />
• (IA) Use diagrams consisting of vertices and edges (vertex-edge graphs) to model and solve problems<br />
related to networks.<br />
Disclaimer: This document is up-to-date as of 11/17/2010. The language provided may not be Page 77 of 98<br />
modified in any way. The most current <strong>Iowa</strong> <strong>Core</strong> can be found at http://iowacore.educateiowa.gov.
Congruence<br />
G-CO<br />
Experiment with transformations in the plane<br />
1. Know precise definitions of angle, circle, perpendicular line, parallel line, and line<br />
segment, based on the undefined notions of point, line, distance along a line, and<br />
distance around a circular arc. (G-CO.1.)<br />
2. Represent transformations in the plane using, e.g., transparencies and geometry<br />
software; describe transformations as functions that take points in the plane as inputs<br />
and give other points as outputs. Compare transformations that preserve distance and<br />
angle to those that do not (e.g., translation versus horizontal stretch). (G-CO.2.)<br />
3. Given a rectangle, parallelogram, trapezoid, or regular polygon, describe the rotations<br />
and reflections that carry it onto itself. (G-CO.3.)<br />
4. Develop definitions of rotations, reflections, and translations in terms of angles, circles,<br />
perpendicular lines, parallel lines, and line segments. (G-CO.4.)<br />
5. Given a geometric figure and a rotation, reflection, or translation, draw the transformed<br />
figure using, e.g., graph paper, tracing paper, or geometry software. Specify a sequence<br />
of transformations that will carry a given figure onto another. (G-CO.5.)<br />
Understand congruence in terms of rigid motions<br />
6. Use geometric descriptions of rigid motions to transform figures and to predict the<br />
effect of a given rigid motion on a given figure; given two figures, use the definition of<br />
congruence in terms of rigid motions to decide if they are congruent. (G-CO.6.)<br />
7. Use the definition of congruence in terms of rigid motions to show that two triangles<br />
are congruent if and only if corresponding pairs of sides and corresponding pairs of<br />
angles are congruent. (G-CO.7.)<br />
8. Explain how the criteria for triangle congruence (ASA, SAS, and SSS) follow from the<br />
definition of congruence in terms of rigid motions. (G-CO.8.)<br />
Prove geometric theorems<br />
9. Prove theorems about lines and angles. Theorems include: vertical angles are<br />
congruent; when a transversal crosses parallel lines, alternate interior angles are<br />
congruent and corresponding angles are congruent; points on a perpendicular bisector<br />
of a line segment are exactly those equidistant from the segment’s endpoints. (G-CO.9.)<br />
10. Prove theorems about triangles. Theorems include: measures of interior angles of a<br />
triangle sum to 180°; base angles of isosceles triangles are congruent; the segment<br />
joining midpoints of two sides of a triangle is parallel to the third side and half the<br />
length; the medians of a triangle meet at a point. (G-CO.10.)<br />
11. Prove theorems about parallelograms. Theorems include: opposite sides are congruent,<br />
opposite angles are congruent, the diagonals of a parallelogram bisect each other, and<br />
conversely, rectangles are parallelograms with congruent diagonals. (G-CO.11.)<br />
Make geometric constructions<br />
<strong>12</strong>. Make formal geometric constructions with a variety of tools and methods (compass and<br />
straightedge, string, reflective devices, paper folding, dynamic geometric software,<br />
etc.). Copying a segment; copying an angle; bisecting a segment; bisecting an angle;<br />
constructing perpendicular lines, including the perpendicular bisector of a line segment;<br />
and constructing a line parallel to a given line through a point not on the line. (G-CO.<strong>12</strong>.)<br />
13. Construct an equilateral triangle, a square, and a regular hexagon inscribed in a circle.<br />
(G-CO.13.)<br />
Disclaimer: This document is up-to-date as of 11/17/2010. The language provided may not be Page 78 of 98<br />
modified in any way. The most current <strong>Iowa</strong> <strong>Core</strong> can be found at http://iowacore.educateiowa.gov.
Similarity, Right Triangles, and Trigonometry<br />
G-SRT<br />
Understand similarity in terms of similarity transformations<br />
1. Verify experimentally the properties of dilations given by a center and a scale factor:<br />
a. A dilation takes a line not passing through the center of the dilation to a<br />
parallel line, and leaves a line passing through the center unchanged.<br />
b. The dilation of a line segment is longer or shorter in the ratio given by the scale<br />
factor. (G-SRT.1.)<br />
2. Given two figures, use the definition of similarity in terms of similarity transformations<br />
to decide if they are similar; explain using similarity transformations the meaning of<br />
similarity for triangles as the equality of all corresponding pairs of angles and the<br />
proportionality of all corresponding pairs of sides. (G-SRT.2.)<br />
3. Use the properties of similarity transformations to establish the AA criterion for two<br />
triangles to be similar. (G-SRT.3.)<br />
Prove theorems involving similarity<br />
4. Prove theorems about triangles. Theorems include: a line parallel to one side of a<br />
triangle divides the other two proportionally, and conversely; the Pythagorean Theorem<br />
proved using triangle similarity. (G-SRT.4.)<br />
5. Use congruence and similarity criteria for triangles to solve problems and to prove<br />
relationships in geometric figures. (G-SRT.5.)<br />
Define trigonometric ratios and solve problems involving right triangles<br />
6. Understand that by similarity, side ratios in right triangles are properties of the angles in<br />
the triangle, leading to definitions of trigonometric ratios for acute angles. (G-SRT.6.)<br />
7. Explain and use the relationship between the sine and cosine of complementary angles.<br />
(G-SRT.7.)<br />
8. Use trigonometric ratios and the Pythagorean Theorem to solve right triangles in<br />
applied problems. ★ (G-SRT.8.)<br />
Apply trigonometry to general triangles<br />
9. (+) Derive the formula A = 1/2 ab sin(C) for the area of a triangle by drawing an auxiliary<br />
line from a vertex perpendicular to the opposite side. (G-SRT.9.)<br />
10. (+) Prove the Laws of Sines and Cosines and use them to solve problems. (G-SRT.10.)<br />
11. (+) Understand and apply the Law of Sines and the Law of Cosines to find unknown<br />
measurements in right and non-right triangles (e.g., surveying problems, resultant<br />
forces). (G-SRT.11.)<br />
Circles<br />
G-C<br />
Understand and apply theorems about circles<br />
1. Prove that all circles are similar. (G-C.1.)<br />
2. Identify and describe relationships among inscribed angles, radii, and chords. Include<br />
the relationship between central, inscribed, and circumscribed angles; inscribed angles<br />
on a diameter are right angles; the radius of a circle is perpendicular to the tangent<br />
where the radius intersects the circle. (G-C.2.)<br />
3. Construct the inscribed and circumscribed circles of a triangle, and prove properties of<br />
angles for a quadrilateral inscribed in a circle. (G-C.3.)<br />
4. (+) Construct a tangent line from a point outside a given circle to the circle. (G-C.4.)<br />
Disclaimer: This document is up-to-date as of 11/17/2010. The language provided may not be Page 79 of 98<br />
modified in any way. The most current <strong>Iowa</strong> <strong>Core</strong> can be found at http://iowacore.educateiowa.gov.
Find arc lengths and areas of sectors of circles<br />
5. Derive using similarity the fact that the length of the arc intercepted by an angle is<br />
proportional to the radius, and define the radian measure of the angle as the constant<br />
of proportionality; derive the formula for the area of a sector. (G-C.5.)<br />
Expressing Geometric Properties with Equations<br />
G-GPE<br />
Translate between the geometric description and the equation for a conic section<br />
1. Derive the equation of a circle of given center and radius using the Pythagorean<br />
Theorem; complete the square to find the center and radius of a circle given by an<br />
equation. (G-GPE.1.)<br />
2. Derive the equation of a parabola given a focus and directrix. (G-GPE.2.)<br />
3. (+) Derive the equations of ellipses and hyperbolas given the foci, using the fact that the<br />
sum or difference of distances from the foci is constant. (G-GPE.3.)<br />
Use coordinates to prove simple geometric theorems algebraically<br />
4. Use coordinates to prove simple geometric theorems algebraically. For example, prove<br />
or disprove that a figure defined by four given points in the coordinate plane is a<br />
rectangle; prove or disprove that the point (1, √3) lies on the circle centered at the origin<br />
and containing the point (0, 2). (G-GPE.4.)<br />
5. Prove the slope criteria for parallel and perpendicular lines and use them to solve<br />
geometric problems (e.g., find the equation of a line parallel or perpendicular to a given<br />
line that passes through a given point). (G-GPE.5.)<br />
6. Find the point on a directed line segment between two given points that partitions the<br />
segment in a given ratio. (G-GPE.6.)<br />
7. Use coordinates to compute perimeters of polygons and areas of triangles and<br />
rectangles, e.g., using the distance formula. ★ (G-GPE.7.)<br />
Geometric Measurement and Dimension<br />
G-GMD<br />
Explain volume formulas and use them to solve problems<br />
1. Give an informal argument for the formulas for the circumference of a circle, area of a<br />
circle, volume of a cylinder, pyramid, and cone. Use dissection arguments, Cavalieri’s<br />
principle, and informal limit arguments. (G-GMD.1.)<br />
2. (+) Give an informal argument using Cavalieri’s principle for the formulas for the volume<br />
of a sphere and other solid figures. (G-GMD.2.)<br />
3. Use volume formulas for cylinders, pyramids, cones, and spheres to solve problems. ★<br />
(G-GMD.3.)<br />
Visualize relationships between two-dimensional and three-dimensional objects<br />
IA.7.Plot points in three-dimensions.<br />
4. Identify the shapes of two-dimensional cross-sections of three-dimensional objects, and<br />
identify three-dimensional objects generated by rotations of two-dimensional objects.<br />
(G-GMD.4.)<br />
Modeling with Geometry<br />
G-MG<br />
Apply geometric concepts in modeling situations<br />
1. Use geometric shapes, their measures, and their properties to describe objects (e.g.,<br />
modeling a tree trunk or a human torso as a cylinder). ★ (G-MG.1.)<br />
2. Apply concepts of density based on area and volume in modeling situations (e.g.,<br />
persons per square mile, BTUs per cubic foot). ★ (G-MG.2.)<br />
3. Apply geometric methods to solve design problems (e.g., designing an object or<br />
structure to satisfy physical constraints or minimize cost; working with typographic grid<br />
systems based on ratios). ★ (G-MG.3.)<br />
Disclaimer: This document is up-to-date as of 11/17/2010. The language provided may not be Page 80 of 98<br />
modified in any way. The most current <strong>Iowa</strong> <strong>Core</strong> can be found at http://iowacore.educateiowa.gov.
(IA) Use diagrams consisting of vertices and edges (vertex-edge graphs) to model and solve<br />
problems related to networks.<br />
IA.8.Understand, analyze, evaluate, and apply vertex-edge graphs to model and solve<br />
problems related to paths, circuits, networks, and relationships among a finite number<br />
of elements, in real-world and abstract settings. ★<br />
IA.9.Model and solve problems using at least two of the following fundamental graph topics<br />
and models: Euler paths and circuits, Hamilton paths and circuits, the traveling<br />
salesman problem (TSP), minimum spanning trees, critical paths, vertex coloring. ★<br />
IA.10.Compare and contrast vertex-edge graph topics and models in terms of: ★<br />
• properties<br />
• algorithms<br />
• optimization<br />
• types of problems that can be solved<br />
Disclaimer: This document is up-to-date as of 11/17/2010. The language provided may not be Page 81 of 98<br />
modified in any way. The most current <strong>Iowa</strong> <strong>Core</strong> can be found at http://iowacore.educateiowa.gov.
<strong>Mathematics</strong> | High School— Statistics and Probability ★<br />
Decisions or predictions are often based on data—numbers in context. These decisions or predictions would be<br />
easy if the data always sent a clear message, but the message is often obscured by variability. Statistics provides<br />
tools for describing variability in data and for making informed decisions that take it into account.<br />
Data are gathered, displayed, summarized, examined, and interpreted to discover patterns and deviations from<br />
patterns. Quantitative data can be described in terms of key characteristics: measures of shape, center, and<br />
spread. The shape of a data distribution might be described as symmetric, skewed, flat, or bell shaped, and it might<br />
be summarized by a statistic measuring center (such as mean or median) and a statistic measuring spread (such as<br />
standard deviation or interquartile range). Different distributions can be compared numerically using these<br />
statistics or compared visually using plots. Knowledge of center and spread are not enough to describe a<br />
distribution. Which statistics to compare, which plots to use, and what the results of a comparison might mean,<br />
depend on the question to be investigated and the real-life actions to be taken.<br />
Randomization has two important uses in drawing statistical conclusions. First, collecting data from a random<br />
sample of a population makes it possible to draw valid conclusions about the whole population, taking variability<br />
into account. Second, randomly assigning individuals to different treatments allows a fair comparison of the<br />
effectiveness of those treatments. A statistically significant outcome is one that is unlikely to be due to chance<br />
alone, and this can be evaluated only under the condition of randomness. The conditions under which data are<br />
collected are important in drawing conclusions from the data; in critically reviewing uses of statistics in public<br />
media and other reports, it is important to consider the study design, how the data were gathered, and the<br />
analyses employed as well as the data summaries and the conclusions drawn.<br />
Random processes can be described mathematically by using a probability model: a list or description of the<br />
possible outcomes (the sample space), each of which is assigned a probability. In situations such as flipping a coin,<br />
rolling a number cube, or drawing a card, it might be reasonable to assume various outcomes are equally likely. In<br />
a probability model, sample points represent outcomes and combine to make up events; probabilities of events<br />
can be computed by applying the Addition and Multiplication Rules. Interpreting these probabilities relies on an<br />
understanding of independence and conditional probability, which can be approached through the analysis of twoway<br />
tables.<br />
Technology plays an important role in statistics and probability by making it possible to generate plots, regression<br />
functions, and correlation coefficients, and to simulate many possible outcomes in a short amount of time.<br />
Connections to Functions and Modeling. Functions may be used to describe data; if the data suggest a linear<br />
relationship, the relationship can be modeled with a regression line, and its strength and direction can be<br />
expressed through a correlation coefficient.<br />
Disclaimer: This document is up-to-date as of 11/17/2010. The language provided may not be Page 82 of 98<br />
modified in any way. The most current <strong>Iowa</strong> <strong>Core</strong> can be found at http://iowacore.educateiowa.gov.
Statistics and Probability Overview<br />
Interpreting Categorical and Quantitative Data<br />
• Summarize, represent, and interpret data on a single<br />
count or measurement variable<br />
• Summarize, represent, and interpret data on two<br />
categorical and quantitative variables<br />
• Interpret linear models<br />
Making Inferences and Justifying Conclusions<br />
• Understand and evaluate random processes underlying<br />
statistical experiments<br />
• Make inferences and justify conclusions from sample<br />
surveys, experiments and observational studies<br />
Conditional Probability and the Rules of Probability<br />
• Understand independence and conditional probability<br />
and use them to interpret data<br />
• Use the rules of probability to compute probabilities of<br />
compound events in a uniform probability model<br />
Mathematical Practices<br />
1. Make sense of problems and<br />
persevere in solving them.<br />
2. Reason abstractly and quantitatively.<br />
3. Construct viable arguments and<br />
critique the reasoning of others.<br />
4. Model with mathematics.<br />
5. Use appropriate tools strategically.<br />
6. Attend to precision.<br />
7. Look for and make use of structure.<br />
8. Look for and express regularity in<br />
repeated reasoning.<br />
Using Probability to Make Decisions<br />
• Calculate expected values and use them to solve<br />
problems<br />
• Use probability to evaluate outcomes of decisions<br />
Disclaimer: This document is up-to-date as of 11/17/2010. The language provided may not be Page 83 of 98<br />
modified in any way. The most current <strong>Iowa</strong> <strong>Core</strong> can be found at http://iowacore.educateiowa.gov.
Interpreting Categorical and Quantitative Data<br />
S-ID<br />
Summarize, represent, and interpret data on a single count or measurement variable<br />
1. Represent data with plots on the real number line (dot plots, histograms, and box plots).<br />
(S-ID.1.)<br />
2. Use statistics appropriate to the shape of the data distribution to compare center<br />
(median, mean) and spread (interquartile range, standard deviation) of two or more<br />
different data sets. (S-ID.2.)<br />
3. Interpret differences in shape, center, and spread in the context of the data sets,<br />
accounting for possible effects of extreme data points (outliers). (S-ID.3.)<br />
4. Use the mean and standard deviation of a data set to fit it to a normal distribution and<br />
to estimate population percentages. Recognize that there are data sets for which such a<br />
procedure is not appropriate. Use calculators, spreadsheets, and tables to estimate<br />
areas under the normal curve. (S-ID.4.)<br />
Summarize, represent, and interpret data on two categorical and quantitative variables<br />
5. Summarize categorical data for two categories in two-way frequency tables. Interpret<br />
relative frequencies in the context of the data (including joint, marginal, and conditional<br />
relative frequencies). Recognize possible associations and trends in the data. (S-ID.5.)<br />
6. Represent data on two quantitative variables on a scatter plot, and describe how the<br />
variables are related.<br />
a. Fit a function to the data; use functions fitted to data to solve problems in the<br />
context of the data. Use given functions or choose a function suggested by the<br />
context. Emphasize linear, quadratic, and exponential models.<br />
b. Informally assess the fit of a function by plotting and analyzing residuals.<br />
c. Fit a linear function for a scatter plot that suggests a linear association. (S-ID.6.)<br />
Interpret linear models<br />
7. Interpret the slope (rate of change) and the intercept (constant term) of a linear model<br />
in the context of the data. (S-ID.7.)<br />
8. Compute (using technology) and interpret the correlation coefficient of a linear fit.<br />
(S-ID.8.)<br />
9. Distinguish between correlation and causation. (S-ID.9.)<br />
Making Inferences and Justifying Conclusions<br />
S-IC<br />
Understand and evaluate random processes underlying statistical experiments<br />
1. Understand statistics as a process for making inferences about population parameters<br />
based on a random sample from that population. (S-IC.1.)<br />
2. Decide if a specified model is consistent with results from a given data-generating<br />
process, e.g., using simulation. For example, a model says a spinning coin falls heads up<br />
with probability 0.5. Would a result of 5 tails in a row cause you to question the model?<br />
(S-IC.2.)<br />
Make inferences and justify conclusions from sample surveys, experiments, and observational<br />
studies<br />
3. Recognize the purposes of and differences among sample surveys, experiments, and<br />
observational studies; explain how randomization relates to each. (S-IC.3.)<br />
Disclaimer: This document is up-to-date as of 11/17/2010. The language provided may not be Page 84 of 98<br />
modified in any way. The most current <strong>Iowa</strong> <strong>Core</strong> can be found at http://iowacore.educateiowa.gov.
4. Use data from a sample survey to estimate a population mean or proportion; develop a<br />
margin of error through the use of simulation models for random sampling. (S-IC.4.)<br />
5. Use data from a randomized experiment to compare two treatments; use simulations to<br />
decide if differences between parameters are significant. (S-IC.5.)<br />
6. Evaluate reports based on data. (S-IC.6.)<br />
Conditional Probability and the Rules of Probability<br />
S-CP<br />
Understand independence and conditional probability and use them to interpret data<br />
1. Describe events as subsets of a sample space (the set of outcomes) using characteristics<br />
(or categories) of the outcomes, or as unions, intersections, or complements of other<br />
events ("or," "and," "not") (S-CP.1.)<br />
2. Understand that two events A and B are independent if the probability of A and B<br />
occurring together is the product of their probabilities, and use this characterization to<br />
determine if they are independent. (S-CP.2.)<br />
3. Understand the conditional probability of A given B as P(A and B)/P(B), and interpret<br />
independence of A and B as saying that the conditional probability of A given B is the<br />
same as the probability of A, and the conditional probability of B given A is the same as<br />
the probability of B. (S-CP.3.)<br />
4. Construct and interpret two-way frequency tables of data when two categories are<br />
associated with each object being classified. Use the two-way table as a sample space to<br />
decide if events are independent and to approximate conditional probabilities. For<br />
example, collect data from a random sample of students in your school on their favorite<br />
subject among math, science, and English. Estimate the probability that a randomly<br />
selected student from your school will favor science given that the student is in tenth<br />
grade. Do the same for other subjects and compare the results. (S-CP.4.)<br />
5. Recognize and explain the concepts of conditional probability and independence in<br />
everyday language and everyday situations. For example, compare the chance of having<br />
lung cancer if you are a smoker with the chance of being a smoker if you have lung<br />
cancer. (S-CP.5.)<br />
Use the rules of probability to compute probabilities of compound events in a uniform<br />
probability model<br />
6. Find the conditional probability of A given B as the fraction of B's outcomes that also<br />
belong to A, and interpret the answer in terms of the model. (S-CP.6.)<br />
7. Apply the Addition Rule, P(A or B) = P(A) + P(B) – P(A and B), and interpret the answer in<br />
terms of the model. (S-CP.7.)<br />
8. (+) Apply the general Multiplication Rule in a uniform probability model, P(A and B) =<br />
P(A)P(B|A) = P(B)P(A|B), and interpret the answer in terms of the model. (S-CP.8.)<br />
9. (+) Use permutations and combinations to compute probabilities of compound events<br />
and solve problems. (S-CP.9.)<br />
Using Probability to Make Decisions<br />
S-MD<br />
Calculate expected values and use them to solve problems<br />
1. (+) Define a random variable for a quantity of interest by assigning a numerical value to<br />
each event in a sample space; graph the corresponding probability distribution using the<br />
same graphical displays as for data distributions. (S-MD.1.)<br />
2. (+) Calculate the expected value of a random variable; interpret it as the mean of the<br />
probability distribution. (S-MD.2.)<br />
Disclaimer: This document is up-to-date as of 11/17/2010. The language provided may not be Page 85 of 98<br />
modified in any way. The most current <strong>Iowa</strong> <strong>Core</strong> can be found at http://iowacore.educateiowa.gov.
3. (+) Develop a probability distribution for a random variable defined for a sample space<br />
in which theoretical probabilities can be calculated; find the expected value. For<br />
example, find the theoretical probability distribution for the number of correct answers<br />
obtained by guessing on all five questions of a multiple-choice test where each question<br />
has four choices, and find the expected grade under various grading schemes. (S-MD.3.)<br />
4. (+) Develop a probability distribution for a random variable defined for a sample space<br />
in which probabilities are assigned empirically; find the expected value. For example,<br />
find a current data distribution on the number of TV sets per household in the United<br />
States, and calculate the expected number of sets per household. How many TV sets<br />
would you expect to find in 100 randomly selected households? (S-MD.4.)<br />
Use probability to evaluate outcomes of decisions<br />
5. (+) Weigh the possible outcomes of a decision by assigning probabilities to payoff values<br />
and finding expected values.<br />
a. Find the expected payoff for a game of chance. For example, find the expected<br />
winnings from a state lottery ticket or a game at a fast-food restaurant.<br />
b. Evaluate and compare strategies on the basis of expected values. For example,<br />
compare a high-deductible versus a low-deductible automobile insurance policy<br />
using various, but reasonable, chances of having a minor or a major accident.<br />
(S-MD.5.)<br />
6. (+) Use probabilities to make fair decisions (e.g., drawing by lots, using a random<br />
number generator). (S-MD.6.)<br />
7. Analyze decisions and strategies using probability concepts (e.g., product testing,<br />
medical testing, pulling a hockey goalie at the end of a game). (S-MD.7.)<br />
Disclaimer: This document is up-to-date as of 11/17/2010. The language provided may not be Page 86 of 98<br />
modified in any way. The most current <strong>Iowa</strong> <strong>Core</strong> can be found at http://iowacore.educateiowa.gov.
Note on courses and transitions<br />
The high school portion of the Standards for Mathematical Content specifies the mathematics all students should<br />
study for college and career readiness. These standards do not mandate the sequence of high school courses.<br />
However, the organization of high school courses is a critical component to implementation of the standards. To<br />
that end, sample high school pathways for mathematics – in both a traditional course sequence (Algebra I,<br />
Geometry, and Algebra II) as well as an integrated course sequence (<strong>Mathematics</strong> 1, <strong>Mathematics</strong> 2, <strong>Mathematics</strong><br />
3) – will be made available shortly after the release of the final Common <strong>Core</strong> State Standards. It is expected that<br />
additional model pathways based on these standards will become available as well.<br />
The standards themselves do not dictate curriculum, pedagogy, or delivery of content. In particular, states may<br />
handle the transition to high school in different ways. For example, many students in the U.S. today take Algebra I<br />
in the 8th grade, and in some states this is a requirement. The K-7 standards contain the prerequisites to prepare<br />
students for Algebra I by 8th grade, and the standards are designed to permit states to continue existing policies<br />
concerning Algebra I in 8th grade.<br />
A second major transition is the transition from high school to post-secondary education for college and careers.<br />
The evidence concerning college and career readiness shows clearly that the knowledge, skills, and practices<br />
important for readiness include a great deal of mathematics prior to the boundary defined by (+) symbols in these<br />
standards. Indeed, some of the highest priority content for college and career readiness comes from Grades 6-8.<br />
This body of material includes powerfully useful proficiencies such as applying ratio reasoning in real-world and<br />
mathematical problems, computing fluently with positive and negative fractions and decimals, and solving realworld<br />
and mathematical problems involving angle measure, area, surface area, and volume. Because important<br />
standards for college and career readiness are distributed across grades and courses, systems for evaluating<br />
college and career readiness should reach as far back in the standards as Grades 6-8. It is important to note as well<br />
that cut scores or other information generated by assessment systems for college and career readiness should be<br />
developed in collaboration with representatives from higher education and workforce development programs, and<br />
should be validated by subsequent performance of students in college and the workforce.<br />
NOTE: The link listed below goes to the Appendix A: Designing High School <strong>Mathematics</strong> Courses Based on the<br />
Common <strong>Core</strong> State Standards document that is part of the Common <strong>Core</strong> State Standards for <strong>Mathematics</strong>.<br />
However, the document is not part of the Common <strong>Core</strong> <strong>Mathematics</strong> Standards that were adopted by <strong>Iowa</strong>'s<br />
State Board of Education. The pathways and courses addressed in the document are models not mandates.<br />
http://www.corestandards.org/assets/CCSSI_<strong>Mathematics</strong>_Appendix_A.pdf<br />
Disclaimer: This document is up-to-date as of 11/17/2010. The language provided may not be Page 87 of 98<br />
modified in any way. The most current <strong>Iowa</strong> <strong>Core</strong> can be found at http://iowacore.educateiowa.gov.
Glossary<br />
Addition and subtraction within 5, 10, 20, 100, or 1000. Addition or subtraction of two whole numbers with whole<br />
number answers, and with sum or minuend in the range 0-5, 0-10, 0-20, or 0-100, respectively. Example: 8 + 2 = 10<br />
is an addition within 10, 14 – 5 = 9 is a subtraction within 20, and 55 – 18 = 37 is a subtraction within 100.<br />
Additive inverses. Two numbers whose sum is 0 are additive inverses of one another. Example: 3/4 and – 3/4 are<br />
additive inverses of one another because 3/4 + (– 3/4) = (– 3/4) + 3/4 = 0.<br />
Associative property of addition. See Table 3 in this Glossary.<br />
Associative property of multiplication. See Table 3 in this Glossary.<br />
Bivariate data. Pairs of linked numerical observations. Example: a list of heights and weights for each player on a<br />
football team.<br />
Box plot. A method of visually displaying a distribution of data values by using the median, quartiles, and extremes<br />
of the data set. A box shows the middle 50% of the data. 1<br />
Commutative property. See Table 3 in this Glossary.<br />
Complex fraction. A fraction A/B where A and/or B are fractions (B nonzero).<br />
Computation algorithm. A set of predefined steps applicable to a class of problems that gives the correct result in<br />
every case when the steps are carried out correctly. See also: computation strategy.<br />
Computation strategy. Purposeful manipulations that may be chosen for specific problems, may not have a fixed<br />
order, and may be aimed at converting one problem into another. See also: computation algorithm.<br />
Congruent. Two plane or solid figures are congruent if one can be obtained from the other by rigid motion (a<br />
sequence of rotations, reflections, and translations).<br />
Counting on. A strategy for finding the number of objects in a group without having to count every member of the<br />
group. For example, if a stack of books is known to have 8 books and 3 more books are added to the top, it is not<br />
necessary to count the stack all over again. One can find the total by counting on—pointing to the top book and<br />
saying “eight,” following this with “nine, ten, eleven. There are eleven books now.”<br />
Dot plot. See: line plot.<br />
Dilation. A transformation that moves each point along the ray through the point emanating from a fixed center,<br />
and multiplies distances from the center by a common scale factor.<br />
Expanded form. A multi-digit number is expressed in expanded form when it is written as a sum of single-digit<br />
multiples of powers of ten. For example, 643 = 600 + 40 + 3.<br />
Expected value. For a random variable, the weighted average of its possible values, with weights given by their<br />
respective probabilities.<br />
1 Adapted from Wisconsin Department of Public Instruction, http://dpi.wi.gov/standards/mathglos.html, accessed<br />
March 2, 2010.<br />
Disclaimer: This document is up-to-date as of 11/17/2010. The language provided may not be Page 88 of 98<br />
modified in any way. The most current <strong>Iowa</strong> <strong>Core</strong> can be found at http://iowacore.educateiowa.gov.
First quartile. For a data set with median M, the first quartile is the median of the data values less than M.<br />
Example: For the data set {1, 3, 6, 7, 10, <strong>12</strong>, 14, 15, 22, <strong>12</strong>0}, the first quartile is 6. See also: median, third quartile,<br />
interquartile range. 2<br />
Fraction. A number expressible in the form a/b where a is a whole number and b is a positive whole number. (The<br />
word fraction in these standards always refers to a non-negative number.) See also: rational number.<br />
Identity property of 0. See Table 3 in this Glossary.<br />
Independently combined probability models. Two probability models are said to be combined independently if<br />
the probability of each ordered pair in the combined model equals the product of the original probabilities of the<br />
two individual outcomes in the ordered pair.<br />
Integer. A number expressible in the form a or –a for some whole number a.<br />
Interquartile Range. A measure of variation in a set of numerical data, the interquartile range is the distance<br />
between the first and third quartiles of the data set. Example: For the data set {1, 3, 6, 7, 10, <strong>12</strong>, 14, 15, 22, <strong>12</strong>0},<br />
the interquartile range is 15 – 6 = 9. See also: first quartile, third quartile.<br />
Line plot. A method of visually displaying a distribution of data values where each data value is shown as a dot or<br />
mark above a number line. Also known as a dot plot. 3<br />
<strong>Mathematics</strong> of Information Processing and the Internet (IA). The Internet is everywhere in modern life. To be<br />
informed consumers and citizens in the information-dense modern world permeated by the Internet, students<br />
should have a basic mathematical understanding of some of the issues of information processing on the Internet.<br />
For example, when making an online purchase, mathematics is used to help you find what you want, encrypt your<br />
credit card number so that you can safely buy it, send your order accurately to the vendor, and, if your order is<br />
immediately downloaded, as when purchasing software, music, or video, ensure that your download occurs<br />
quickly and error-free. Essential topics related to these aspects of information processing are basic set theory,<br />
logic, and modular arithmetic. These topics are not only fundamental to information processing on the Internet,<br />
but they are also important mathematical topics in their own right with applications in many other areas.<br />
<strong>Mathematics</strong> of Voting (IA). The instant-runoff voting (IRV), the Borda method (assigning points for preferences),<br />
and the Condorcet method (in which each pair of candidates is run off head to head) are all forms of preferential<br />
voting (rank according to your preferences, rather than just voting for your single favorite candidate).<br />
Mean. A measure of center in a set of numerical data, computed by adding the values in a list and then dividing by<br />
the number of values in the list. 4 Example: For the data set {1, 3, 6, 7, 10, <strong>12</strong>, 14, 15, 22, <strong>12</strong>0}, the mean is 21.<br />
Mean absolute deviation. A measure of variation in a set of numerical data, computed by adding the distances<br />
between each data value and the mean, then dividing by the number of data values. Example: For the data set {2,<br />
3, 6, 7, 10, <strong>12</strong>, 14, 15, 22, <strong>12</strong>0}, the mean absolute deviation is 20.<br />
Median. A measure of center in a set of numerical data. The median of a list of values is the value appearing at the<br />
center of a sorted version of the list—or the mean of the two central values, if the list contains an even number of<br />
values. Example: For the data set {2, 3, 6, 7, 10, <strong>12</strong>, 14, 15, 22, 90}, the median is 11.<br />
Midline. In the graph of a trigonometric function, the horizontal line halfway between its maximum and minimum<br />
values.<br />
2 Many different methods for computing quartiles are in use. The method defined here is sometimes called the<br />
Moore and McCabe method. See Langford, E., "Quartiles in Elementary Statistics," Journal of Statistics Education<br />
Volume 14, Number 3 (2006).<br />
3 Adapted from Wisconsin Department of Public Instruction, op. cit.<br />
4 To be more precise, this defines the arithmetic mean.<br />
Disclaimer: This document is up-to-date as of 11/17/2010. The language provided may not be Page 89 of 98<br />
modified in any way. The most current <strong>Iowa</strong> <strong>Core</strong> can be found at http://iowacore.educateiowa.gov.
Multiplication and division within 100. Multiplication or division of two whole numbers with whole number<br />
answers, and with product or dividend in the range 0-100. Example: 72 ÷ 8 = 9.<br />
Multiplicative inverses. Two numbers whose product is 1 are multiplicative inverses of one another. Example: 3/4<br />
and 4/3 are multiplicative inverses of one another because 3/4 × 4/3 = 4/3 × 3/4 = 1.<br />
Number line diagram. A diagram of the number line used to represent numbers and support reasoning about<br />
them. In a number line diagram for measurement quantities, the interval from 0 to 1 on the diagram represents<br />
the unit of measure for the quantity.<br />
Percent rate of change. A rate of change expressed as a percent. Example: if a population grows from 50 to 55 in a<br />
year, it grows by 5/50 = 10% per year.<br />
Probability distribution. The set of possible values of a random variable with a probability assigned to each.<br />
Properties of operations. See Table 3 in this Glossary.<br />
Properties of equality. See Table 4 in this Glossary.<br />
Properties of inequality. See Table 5 in this Glossary.<br />
Properties of operations. See Table 3 in this Glossary.<br />
Probability. A number between 0 and 1 used to quantify likelihood for processes that have uncertain outcomes<br />
(such as tossing a coin, selecting a person at random from a group of people, tossing a ball at a target, or testing<br />
for a medical condition).<br />
Probability model. A probability model is used to assign probabilities to outcomes of a chance process by<br />
examining the nature of the process. The set of all outcomes is called the sample space, and their probabilities sum<br />
to 1. See also: uniform probability model.<br />
Random variable. An assignment of a numerical value to each outcome in a sample space.<br />
Rational expression. A quotient of two polynomials with a non-zero denominator.<br />
Rational number. A number expressible in the form a/b or – a/b for some fraction a/b. The rational numbers<br />
include the integers.<br />
Rectilinear figure. A polygon all angles of which are right angles.<br />
Rigid motion. A transformation of points in space consisting of a sequence of one or more translations, reflections,<br />
and/or rotations. Rigid motions are here assumed to preserve distances and angle measures.<br />
Repeating decimal. The decimal form of a rational number. See also: terminating decimal.<br />
Sample space. In a probability model for a random process, a list of the individual outcomes that are to be<br />
considered.<br />
Scatter plot. A graph in the coordinate plane representing a set of bivariate data. For example, the heights and<br />
weights of a group of people could be displayed on a scatter plot. 5<br />
Similarity transformation. A rigid motion followed by a dilation.<br />
5 Adapted from Wisconsin Department of Public Instruction, op. cit.<br />
Disclaimer: This document is up-to-date as of 11/17/2010. The language provided may not be Page 90 of 98<br />
modified in any way. The most current <strong>Iowa</strong> <strong>Core</strong> can be found at http://iowacore.educateiowa.gov.
Tape diagram. A drawing that looks like a segment of tape, used to illustrate number relationships. Also known as<br />
a strip diagram, bar model, fraction strip, or length model.<br />
Terminating decimal. A decimal is called terminating if its repeating digit is 0.<br />
Third quartile. For a data set with median M, the third quartile is the median of the data values greater than M.<br />
Example: For the data set {2, 3, 6, 7, 10, <strong>12</strong>, 14, 15, 22, <strong>12</strong>0}, the third quartile is 15. See also: median, first quartile,<br />
interquartile range.<br />
Transitivity principle for indirect measurement. If the length of object A is greater than the length of object B, and<br />
the length of object B is greater than the length of object C, then the length of object A is greater than the length<br />
of object C. This principle applies to measurement of other quantities as well.<br />
Uniform probability model. A probability model which assigns equal probability to all outcomes. See also:<br />
probability model.<br />
Vector. A quantity with magnitude and direction in the plane or in space, defined by an ordered pair or triple of<br />
real numbers.<br />
Vertex-Edge Graphs (IA). Vertex-edge graphs are diagrams consisting of vertices (points) and edges (line segments<br />
or arcs) connecting some of the vertices. Vertex-edge graphs are also sometimes called networks, discrete graphs,<br />
or finite graphs. A vertex-edge graph shows relationships and connections among objects, such as in a road<br />
network, a telecommunications network, or a family tree. Within the context of school geometry, which is<br />
fundamentally the study of shape, vertex-edge graphs represent, in a sense, the situation of no shape. That is,<br />
vertex-edge graphs are geometric models consisting of vertices and edges in which shape is not essential, only the<br />
connections among vertices are essential. These graphs are widely used in business and industry to solve problems<br />
about networks, paths, and relationships among a finite number of objects – such as, analyzing a computer<br />
network; optimizing the route used for snowplowing, collecting garbage, or visiting business clients; scheduling<br />
committee meetings to avoid conflicts; or planning a large construction project to finish on time.<br />
Visual fraction model. A tape diagram, number line diagram, or area model.<br />
Whole numbers. The numbers 0, 1, 2, 3, ….<br />
Disclaimer: This document is up-to-date as of 11/17/2010. The language provided may not be Page 91 of 98<br />
modified in any way. The most current <strong>Iowa</strong> <strong>Core</strong> can be found at http://iowacore.educateiowa.gov.
Table 1. Common addition and subtraction situations. 6<br />
Add to<br />
Take from<br />
Put Together/<br />
Take Apart 2<br />
Compare 3<br />
Result Unknown Change Unknown Start Unknown<br />
Two bunnies sat on the Two bunnies were sitting Some bunnies were sitting<br />
grass. Three more bunnies on the grass. Some more on the grass. Three more<br />
hopped there. How many bunnies hopped there. bunnies hopped there.<br />
bunnies are on the grass Then there were five Then there were five<br />
now?<br />
bunnies. How many bunnies. How many<br />
2 + 3 = ?<br />
bunnies hopped over to bunnies were on the grass<br />
the first two?<br />
before?<br />
2 + ? = 5<br />
? + 3 = 5<br />
Five apples were on the Five apples were on the Some apples were on the<br />
table. I ate two apples. table. I ate some apples. table. I ate two apples.<br />
How many apples are on Then there were three Then there were three<br />
the table now?<br />
apples. How many apples apples. How many apples<br />
5 – 2 = ?<br />
did I eat?<br />
were on the table before?<br />
5 – ? = 3<br />
? – 2 = 3<br />
Total Unknown Addend Unknown Both Addends Unknown 1<br />
Three red apples and two Five apples are on the Grandma has five flowers.<br />
green apples are on the table. Three are red and How many can she put in<br />
table. How many apples the rest are green. How her red vase and how<br />
are on the table?<br />
many apples are green? many in her blue vase?<br />
3 + 2 = ?<br />
3 + ? = 5, 5 – 3 = ?<br />
5 = 0 + 5, 5 = 5 + 0<br />
5 = 1 + 4, 5 = 4 + 1<br />
5 = 2 + 3, 5 = 3 + 2<br />
Difference Unknown Bigger Unknown Smaller Unknown<br />
("How many more?"<br />
version): Lucy has two<br />
apples. Julie has five<br />
apples. How many more<br />
apples does Julie have<br />
than Lucy?<br />
("How many fewer?"<br />
version): Lucy has two<br />
apples. Julie has five<br />
apples. How many fewer<br />
apples does Lucy have<br />
than Julie?<br />
2 + ? = 5, 5 – 2 = ?<br />
(Version with "more"):<br />
Julie has three more<br />
apples than Lucy. Lucy has<br />
two apples. How many<br />
apples does Julie have?<br />
(Version with "fewer"):<br />
Lucy has 3 fewer apples<br />
than Julie. Lucy has two<br />
apples. How many apples<br />
does Julie have?<br />
2 + 3 = ?, 3 + 2 = ?<br />
(Version with "more"):<br />
Julie has three more<br />
apples than Lucy. Julie has<br />
five apples. How many<br />
apples does Lucy have?<br />
(Version with "fewer"):<br />
Lucy has 3 fewer apples<br />
than Julie. Julie has five<br />
apples. How many apples<br />
does Lucy have?<br />
5 – 3 = ?, ? + 3 = 5<br />
1 These take apart situations can be used to show all the decompositions of a given number. The associated<br />
equations, which have the total on the left of the equal sign, help children understand that the = sign does not<br />
always mean makes or results in but always does mean is the same number as.<br />
2 Either addend can be unknown, so there are three variations of these problem situations. Both Addends Unknown<br />
is a productive extension of this basic situation, especially for small numbers less than or equal to 10.<br />
3 For the Bigger Unknown or Smaller Unknown situations, one version directs the correct operation (the version<br />
using more for the bigger unknown and using less for the smaller unknown). The other versions are more difficult.<br />
6 Adapted from Box 2-4 of <strong>Mathematics</strong> Learning in Early Childhood, National Research Council (2009, pp. 32, 33).<br />
Disclaimer: This document is up-to-date as of 11/17/2010. The language provided may not be Page 92 of 98<br />
modified in any way. The most current <strong>Iowa</strong> <strong>Core</strong> can be found at http://iowacore.educateiowa.gov.
Table 2. Common multiplication and division situations. 7<br />
Equal<br />
Groups<br />
Arrays, 4<br />
Area 5<br />
Unknown Product<br />
Measurement example. You<br />
need 3 lengths of string,<br />
each 6 inches long. How<br />
much string will you need<br />
altogether?<br />
There are 3 rows of apples<br />
with 6 apples in each row.<br />
How many apples are there?<br />
Group Size Unknown<br />
("How many in each group?"<br />
Division)<br />
Number of Groups Unknown<br />
("How many groups?" Division)<br />
3 × 6 = ? 3 × ? = 18, and 18 ÷ 3 = ? ? × 6 = 18, and 18 ÷ 6 = ?<br />
There are 3 bags with 6 If 18 plums are shared equally If 18 plums are to be packed 6 to a<br />
plums in each bag. How into 3 bags, then how many bag, then how many bags are<br />
many plums are there in all? plums will be in each bag? needed?<br />
Area example. What is the<br />
area of a 3 cm by 6 cm<br />
rectangle?<br />
A blue hat costs $6. A red<br />
hat costs 3 times as much as<br />
the blue hat. How much<br />
does the red hat cost?<br />
Measurement example. You<br />
have 18 inches of string, which<br />
you will cut into 3 equal pieces.<br />
How long will each piece of<br />
string be?<br />
If 18 apples are arranged into 3<br />
equal rows, how many apples<br />
will be in each row?<br />
Area example. A rectangle has<br />
area 18 square centimeters. If<br />
one side is 3 cm long, how long<br />
is a side next to it?<br />
A red hat costs $18 and that is<br />
3 times as much as a blue hat<br />
costs. How much does a blue<br />
hat cost?<br />
Measurement example. You have<br />
18 inches of string, which you will<br />
cut into pieces that are 6 inches<br />
long. How many pieces of string<br />
will you have?<br />
If 18 apples are arranged into<br />
equal rows of 6 apples, how many<br />
rows will there be?<br />
Area example. A rectangle has<br />
area 18 square centimeters. If one<br />
side is 6 cm long, how long<br />
is a side next to it?<br />
A red hat costs $18 and a blue hat<br />
costs $6. How many times as much<br />
does the red hat cost as the blue<br />
hat?<br />
Compare<br />
Measurement example. A<br />
rubber band is 6 cm long.<br />
How long will the rubber<br />
band be when it is stretched<br />
to be 3 times as long?<br />
Measurement example. A<br />
rubber band is stretched to be<br />
18 cm long and that is 3 times<br />
as long as it was at first. How<br />
long was the rubber band at<br />
first?<br />
Measurement example. A rubber<br />
band was 6 cm long at first. Now it<br />
is stretched to be 18 cm long. How<br />
many times as long is the rubber<br />
band now as it was at first?<br />
General a × b = ? a × ? = p, and p ÷ a = ? ? × b = p, and p ÷ b = ?<br />
4 The language in the array examples shows the easiest form of array problems. A harder form is to use the terms<br />
rows and columns: The apples in the grocery window are in 3 rows and 6 columns. How many apples are in<br />
there? Both forms are valuable.<br />
5 Area involves arrays of squares that have been pushed together so that there are no gaps or overlaps, so array<br />
problems include these especially important measurement situations.<br />
7 The first examples in each cell are examples of discrete things. These are easier for students and should be given<br />
before the measurement examples.<br />
Disclaimer: This document is up-to-date as of 11/17/2010. The language provided may not be Page 93 of 98<br />
modified in any way. The most current <strong>Iowa</strong> <strong>Core</strong> can be found at http://iowacore.educateiowa.gov.
Table 3. The properties of operations. Here a, b and c stand for arbitrary numbers in a given number system. The<br />
properties of operations apply to the rational number system, the real number system, and the complex number<br />
system.<br />
Associative property of addition (a + b) + c = a + (b + c)<br />
Commutative property of addition<br />
a + b = b + a<br />
Additive identity property of 0<br />
a + 0 = 0 + a = a<br />
Existence of additive inverses For every a there exists –a so that a + (–a) = (–a) + a = 0.<br />
Associative property of multiplication (a × b) × c = a × (b × c)<br />
Commutative property of multiplication<br />
a × b = b × a<br />
Multiplicative identity property of 1<br />
a × 1 = 1 × a = a<br />
Existence of multiplicative inverses For every a ≠ 0 there exists 1/a so that a × 1/a = 1/a × a<br />
= 1.<br />
Distributive property of multiplication over addition<br />
a × (b + c) = a × b + a × c<br />
Table 4. The properties of equality. Here a, b and c stand for arbitrary numbers in the rational, real, or complex<br />
number systems.<br />
Reflexive property of equality<br />
a = a<br />
Symmetric property of equality If a = b, then b = a.<br />
Transitive property of equality If a = b and b = c, then a = c.<br />
Addition property of equality If a = b, then a + c = b + c.<br />
Subtraction property of equality If a = b, then a – c = b – c.<br />
Multiplication property of equality If a = b, then a × c = b × c.<br />
Division property of equality If a = b and c ≠ 0, then a ÷ c = b ÷ c.<br />
Substitution property of equality<br />
If a = b, then b may be substituted for a<br />
in any expression containing a.<br />
Table 5. The properties of inequality. Here a, b and c stand for arbitrary numbers in the rational or real number<br />
systems.<br />
Exactly one of the following is true: a < b, a = b, a > b.<br />
If a > b and b > c then a > c.<br />
If a > b, then b < a.<br />
If a > b, then –a < –b.<br />
If a > b, then a ± c > b ± c.<br />
If a > b and c > 0, then a × c > b × c.<br />
If a > b and c < 0, then a × c < b × c.<br />
If a > b and c > 0, then a ÷ c > b ÷ c.<br />
If a > b and c < 0, then a ÷ c < b ÷ c.<br />
Disclaimer: This document is up-to-date as of 11/17/2010. The language provided may not be Page 94 of 98<br />
modified in any way. The most current <strong>Iowa</strong> <strong>Core</strong> can be found at http://iowacore.educateiowa.gov.
Sample of Works Consulted<br />
Existing state standards documents.<br />
Research summaries and briefs<br />
provided to the Working Group<br />
by researchers.<br />
National Assessment Governing<br />
Board, <strong>Mathematics</strong><br />
Framework for the 2009<br />
National Assessment of<br />
Educational Progress. U.S.<br />
Department of Education, 2008.<br />
NAEP Validity Studies Panel,<br />
Validity Study of the NAEP<br />
<strong>Mathematics</strong> Assessment:<br />
Grades 4 and 8. Daro et al.,<br />
2007.<br />
<strong>Mathematics</strong> documents from:<br />
Alberta, Canada; Belgium;<br />
China; Chinese Taipei;<br />
Denmark; England; Finland;<br />
Hong Kong; India; Ireland;<br />
Japan; Korea; New Zealand;<br />
Singapore; Victoria (British<br />
Columbia).<br />
Adding it Up: Helping Children<br />
Learn <strong>Mathematics</strong>. National<br />
Research Council, <strong>Mathematics</strong><br />
Learning Study Committee,<br />
2001.<br />
Benchmarking for Success: Ensuring<br />
U.S. Students Receive a World-<br />
Class Education. National<br />
Governors Association, Council<br />
of Chief State School Officers,<br />
and Achieve, Inc., 2008.<br />
Crossroads in <strong>Mathematics</strong> (1995)<br />
and Beyond Crossroads (2006).<br />
American Mathematical<br />
Association of Two-Year<br />
Colleges (AMATYC).<br />
Curriculum Focal Points for<br />
Prekindergarten through Grade<br />
8 <strong>Mathematics</strong>: A Quest for<br />
Coherence. National Council of<br />
Teachers of <strong>Mathematics</strong>, 2006.<br />
Focus in High School <strong>Mathematics</strong>:<br />
Reasoning and Sense Making.<br />
National Council of Teachers of<br />
<strong>Mathematics</strong>. Reston, VA:<br />
NCTM.<br />
Foundations for Success: The Final<br />
Report of the National<br />
<strong>Mathematics</strong> Advisory Panel.<br />
U.S. Department of Education:<br />
Washington, DC, 2008.<br />
Guidelines for Assessment and<br />
Instruction in Statistics<br />
Education (GAISE) Report: A<br />
PreK-<strong>12</strong> Curriculum Framework.<br />
How People Learn: Brain, Mind,<br />
Experience, and School.<br />
Bransford, J.D., Brown, A.L., and<br />
Cocking, R.R., eds. Committee<br />
on Developments in the Science<br />
of Learning, Commission on<br />
Behavioral and Social Sciences<br />
and Education, National<br />
Research Council, 1999.<br />
<strong>Mathematics</strong> and Democracy, The<br />
Case for Quantitative Literacy,<br />
Steen, L.A. (ed.). National<br />
Council on Education and the<br />
Disciplines, 2001.<br />
<strong>Mathematics</strong> Learning in Early<br />
Childhood: Paths Toward<br />
Excellence and Equity. Cross,<br />
C.T., Woods, T.A., and<br />
Schweingruber, S., eds.<br />
Committee on Early Childhood<br />
<strong>Mathematics</strong>, National<br />
Research Council, 2009.<br />
The Opportunity Equation:<br />
Transforming <strong>Mathematics</strong> and<br />
Science Education for<br />
Citizenship and the Global<br />
Economy. The Carnegie<br />
Corporation of New York and<br />
the Institute for Advanced<br />
Study, 2009. Online:<br />
http://www.opportunityequati<br />
on.org/<br />
Principles and Standards for School<br />
<strong>Mathematics</strong>. National Council<br />
of Teachers of <strong>Mathematics</strong>,<br />
2000.<br />
The Proficiency Illusion. Cronin, J.,<br />
Dahlin, M., Adkins, D., and<br />
Kingsbury, G.G.; foreword by<br />
C.E. Finn, Jr., and M. J. Petrilli.<br />
Thomas B. Fordham Institute,<br />
2007.<br />
Ready or Not: Creating a High<br />
School Diploma That Counts.<br />
American Diploma Project,<br />
2004.<br />
A Research Companion to Principles<br />
and Standards for School<br />
<strong>Mathematics</strong>. National Council<br />
of Teachers of <strong>Mathematics</strong>,<br />
2003.<br />
Sizing Up State Standards 2008.<br />
American Federation of<br />
Teachers, 2008.<br />
A Splintered Vision: An Investigation<br />
of U.S. Science and<br />
<strong>Mathematics</strong> Education.<br />
Schmidt, W.H., McKnight, C.C.,<br />
Raizen, S.A., et al. U.S. National<br />
Research Center for the Third<br />
International <strong>Mathematics</strong> and<br />
Science Study, Michigan State<br />
University, 1997.<br />
Stars By Which to Navigate?<br />
Scanning National and<br />
International Education<br />
Standards in 2009. Carmichael,<br />
S.B., Wilson. W.S, Finn, Jr., C.E.,<br />
Winkler, A.M., and Palmieri, S.<br />
Thomas B. Fordham Institute,<br />
2009.<br />
Askey, R., “Knowing and Teaching<br />
Elementary <strong>Mathematics</strong>,”<br />
American Educator, Fall 1999.<br />
Aydogan, C., Plummer, C., Kang, S.<br />
J., Bilbrey, C., Farran, D. C., &<br />
Lipsey, M. W. (2005). An<br />
investigation of<br />
prekindergarten curricula:<br />
Influences on classroom<br />
characteristics and child<br />
engagement. Paper presented<br />
at the NAEYC.<br />
Blum, W., Galbraith, P. L., Henn, H-<br />
W. and Niss, M. (Eds)<br />
Applications and Modeling in<br />
<strong>Mathematics</strong> Education, ICMI<br />
Study 14. Amsterdam: Springer.<br />
Brosterman, N. (1997). Inventing<br />
kindergarten. New York: Harry<br />
N. Abrams.<br />
Disclaimer: This document is up-to-date as of 11/17/2010. The language provided may not be Page 95 of 98<br />
modified in any way. The most current <strong>Iowa</strong> <strong>Core</strong> can be found at http://iowacore.educateiowa.gov.
Clements, D. H., & Sarama, J.<br />
(2009). Learning and teaching<br />
early math: The learning<br />
trajectories approach. New<br />
York: Routledge.<br />
Clements, D. H., Sarama, J., &<br />
DiBiase, A.-M. (2004). Engaging<br />
young children in mathematics:<br />
Standards for early childhood<br />
mathematics education.<br />
Mahwah, NJ: Lawrence Erlbaum<br />
Associates.<br />
Cobb and Moore, “<strong>Mathematics</strong>,<br />
Statistics, and Teaching,” Amer.<br />
Math. Monthly 104(9), pp. 801-<br />
823, 1997.<br />
Confrey, J., “Tracing the Evolution<br />
of <strong>Mathematics</strong> Content<br />
Standards in the United States:<br />
Looking Back and Projecting<br />
Forward.” K<strong>12</strong> <strong>Mathematics</strong><br />
Curriculum Standards<br />
conference proceedings,<br />
February 5-6, 2007.<br />
Conley, D.T. Knowledge and Skills<br />
for University Success, 2008.<br />
Conley, D.T. Toward a More<br />
Comprehensive Conception of<br />
College Readiness, 2007.<br />
Cuoco, A., Goldenberg, E. P., and<br />
Mark, J., “Habits of Mind: An<br />
Organizing Principle for a<br />
<strong>Mathematics</strong> Curriculum,”<br />
Journal of Mathematical<br />
Behavior, 15(4), 375-402, 1996.<br />
Carpenter, T. P., Fennema, E.,<br />
Franke, M. L., Levi, L., &<br />
Empson, S. B. (1999). Children’s<br />
<strong>Mathematics</strong>: Cognitively<br />
Guided Instruction. Portsmouth,<br />
NH: Heinemann.<br />
Van de Walle, J. A., Karp, K., & Bay-<br />
Williams, J. M. (2010).<br />
Elementary and Middle School<br />
<strong>Mathematics</strong>: Teaching<br />
Developmentally (Seventh ed.).<br />
Boston: Allyn and Bacon.<br />
Ginsburg, A., Leinwand, S., and<br />
Decker, K., “Informing Grades<br />
1-6 Standards Development:<br />
What Can Be Learned from<br />
High-Performing Hong Kong,<br />
Korea, and Singapore?”<br />
American Institutes for<br />
Research, 2009.<br />
Ginsburg et al., “What the United<br />
States Can Learn From<br />
Singapore’s World-Class<br />
<strong>Mathematics</strong> System (and what<br />
Singapore can learn from the<br />
United States),” American<br />
Institutes for Research, 2005.<br />
Ginsburg et al., “Reassessing U.S.<br />
International <strong>Mathematics</strong><br />
Performance: New Findings<br />
from the 2003 TIMMS and<br />
PISA,” American Institutes for<br />
Research, 2005.<br />
Ginsburg, H. P., Lee, J. S., &<br />
Stevenson-Boyd, J. (2008).<br />
<strong>Mathematics</strong> education for<br />
young children: What it is and<br />
how to promote it. Social Policy<br />
Report, 22(1), 1-24.<br />
Harel, G., “What is <strong>Mathematics</strong>? A<br />
Pedagogical Answer to a<br />
Philosophical Question,” in R. B.<br />
Gold and R. Simons (eds.),<br />
Current Issues in the Philosophy<br />
of <strong>Mathematics</strong> from the<br />
Perspective of Mathematicians.<br />
Mathematical Association of<br />
America, 2008.<br />
Henry, V. J., & Brown, R. S. (2008).<br />
Firstgrade basic facts: An<br />
investigation into teaching and<br />
learning of an accelerated,<br />
high-demand memorization<br />
standard. Journal for Research<br />
in <strong>Mathematics</strong> Education, 39,<br />
153-183.<br />
Howe, R., “From Arithmetic to<br />
Algebra.”<br />
Howe, R., “Starting Off Right in<br />
Arithmetic,”<br />
http://math.arizona.edu/~ime/<br />
2008-09/MIME/BegArith.pdf.<br />
Jordan, N. C., Kaplan, D., Ramineni,<br />
C., and Locuniak, M. N., “Early<br />
math matters: kindergarten<br />
number competence and later<br />
mathematics outcomes,” Dev.<br />
Psychol. 45, 850–867, 2009.<br />
Kader, G., “Means and MADS,”<br />
<strong>Mathematics</strong> Teaching in the<br />
Middle School, 4(6), 1999, pp.<br />
398-403.<br />
Kilpatrick, J., Mesa, V., and Sloane,<br />
F., “U.S. Algebra Performance in<br />
an International Context,” in<br />
Loveless (ed.), Lessons Learned:<br />
What International<br />
Assessments Tell Us About<br />
Math Achievement.<br />
Washington, D.C.: Brookings<br />
Institution Press, 2007.<br />
Leinwand, S., and Ginsburg, A.,<br />
“Measuring Up: How the<br />
Highest Performing State<br />
(Massachusetts) Compares to<br />
the Highest Performing Country<br />
(Hong Kong) in Grade 3<br />
<strong>Mathematics</strong>,” American<br />
Institutes for Research, 2009.<br />
Niss, M., “Quantitative Literacy and<br />
Mathematical Competencies,”<br />
in Quantitative Literacy: Why<br />
Numeracy Matters for Schools<br />
and Colleges, Madison, B. L.,<br />
and Steen, L.A. (eds.), National<br />
Council on Education and the<br />
Disciplines. Proceedings of the<br />
National Forum on Quantitative<br />
Literacy held at the National<br />
Academy of Sciences in<br />
Washington, D.C., December 1-<br />
2, 2001.<br />
Pratt, C. (1948). I learn from<br />
children. New York: Simon and<br />
Schuster.<br />
Reys, B. (ed.), The Intended<br />
<strong>Mathematics</strong> Curriculum as<br />
Represented in State-Level<br />
Curriculum Standards:<br />
Consensus or Confusion? IAP-<br />
Information Age Publishing,<br />
2006.<br />
Sarama, J., & Clements, D. H.<br />
(2009). Early childhood<br />
mathematics education<br />
research: Learning trajectories<br />
for young children. New York:<br />
Routledge.<br />
Disclaimer: This document is up-to-date as of 11/17/2010. The language provided may not be Page 96 of 98<br />
modified in any way. The most current <strong>Iowa</strong> <strong>Core</strong> can be found at http://iowacore.educateiowa.gov.
Schmidt, W., Houang, R., and<br />
Cogan, L., “A Coherent<br />
Curriculum: The Case of<br />
<strong>Mathematics</strong>,” American<br />
Educator, Summer 2002, p. 4.<br />
Schmidt, W.H., and Houang, R.T.,<br />
“Lack of Focus in the Intended<br />
<strong>Mathematics</strong> Curriculum:<br />
Symptom or Cause?” in<br />
Loveless (ed.), Lessons Learned:<br />
What International<br />
Assessments Tell Us About<br />
Math Achievement.<br />
Washington, D.C.: Brookings<br />
Institution Press, 2007.<br />
Steen, L.A., “Facing Facts: Achieving<br />
Balance in High School<br />
<strong>Mathematics</strong>.” <strong>Mathematics</strong><br />
Teacher, Vol. 100. Special Issue.<br />
Wu, H., “Fractions, decimals, and<br />
rational numbers,” 2007,<br />
http://math.berkeley.edu/~wu/<br />
(March 19, 2008).<br />
Wu, H., “Lecture Notes for the 2009<br />
Pre-Algebra Institute,”<br />
September 15, 2009.<br />
Wu, H., “Preservice professional<br />
development of mathematics<br />
teachers,”<br />
http://math.berkeley.edu/~wu/<br />
pspd2.pdf.<br />
Massachusetts Department of<br />
Education. Progress Report of<br />
the <strong>Mathematics</strong> Curriculum<br />
Framework Revision Panel,<br />
Massachusetts Department of<br />
Elementary and Secondary<br />
Education, 2009.<br />
www.doe.mass.edu/boe/docs/<br />
0509/item5_report.pdf.<br />
ACT College Readiness<br />
Benchmarks<br />
ACT College Readiness Standards<br />
ACT National Curriculum Survey<br />
Adelman, C., The Toolbox Revisited:<br />
Paths to Degree Completion<br />
From High School Through<br />
College, 2006.<br />
Advanced Placement Calculus,<br />
Statistics and Computer Science<br />
Course Descriptions. May 2009,<br />
May 2010. College Board, 2008.<br />
Aligning Postsecondary<br />
Expectations and High School<br />
Practice: The Gap Defined (ACT:<br />
Policy Implications of the ACT<br />
National Curriculum Survey<br />
Results 2005-2006).<br />
Condition of Education, 2004:<br />
Indicator 30, Top 30<br />
Postsecondary Courses, U.S.<br />
Department of Education, 2004.<br />
Condition of Education, 2007: High<br />
School Course-Taking. U.S.<br />
Department of Education, 2007.<br />
Crisis at the <strong>Core</strong>: Preparing All<br />
Students for College and Work,<br />
ACT.<br />
Achieve, Inc., Florida Postsecondary<br />
Survey, 2008.<br />
Golfin, Peggy, et al. CNA<br />
Corporation. Strengthening<br />
<strong>Mathematics</strong> at the<br />
Postsecondary Level: Literature<br />
Review and Analysis, 2005.<br />
Camara, W.J., Shaw, E., and<br />
Patterson, B. (June 13, 2009).<br />
First Year English and Math<br />
College Coursework. College<br />
Board: New York, NY (Available<br />
from authors).<br />
CLEP Precalculus Curriculum<br />
Survey: Summary of Results.<br />
The College<br />
Board, 2005.<br />
College Board Standards for College<br />
Success: <strong>Mathematics</strong> and<br />
Statistics. College Board, 2006.<br />
Miller, G.E., Twing, J., and Meyers,<br />
J. “Higher Education Readiness<br />
Component (HERC) Correlation<br />
Study.” Austin, TX: Pearson.<br />
On Course for Success: A Close Look<br />
at Selected High School Courses<br />
That Prepare All Students for<br />
College and Work, ACT.<br />
Out of Many, One: Towards<br />
Rigorous Common <strong>Core</strong><br />
Standards from the Ground Up.<br />
Achieve, 2008.<br />
Ready for College and Ready for<br />
Work: Same or Different? ACT.<br />
Rigor at Risk: Reaffirming Quality in<br />
the High School <strong>Core</strong><br />
Curriculum, ACT.<br />
The Forgotten Middle: Ensuring<br />
that All Students Are on Target<br />
for College and Career<br />
Readiness before High School,<br />
ACT.<br />
Achieve, Inc., Virginia<br />
Postsecondary Survey, 2004.<br />
ACT Job Skill Comparison Charts.<br />
Achieve, <strong>Mathematics</strong> at Work,<br />
2008.<br />
The American Diploma Project<br />
Workplace Study. National<br />
Alliance of Business Study,<br />
2002.<br />
Carnevale, Anthony and<br />
Desrochers, Donna. Connecting<br />
Education Standards and<br />
Employment: Coursetaking<br />
Patterns of Young Workers,<br />
2002.<br />
Colorado Business Leaders’ Top<br />
Skills, 2006.<br />
Hawai’i Career Ready Study: access<br />
to living wage careers from high<br />
school, 2007.<br />
States’ Career Cluster Initiative.<br />
Essential Knowledge and Skill<br />
Statements, 2008.<br />
ACT WorkKeys Occupational<br />
Profiles.<br />
Program for International Student<br />
Assessment (PISA), 2006.<br />
Trends in International<br />
<strong>Mathematics</strong> and Science Study<br />
(TIMSS), 2007.<br />
International Baccalaureate,<br />
<strong>Mathematics</strong> Standard Level,<br />
2006.<br />
Disclaimer: This document is up-to-date as of 11/17/2010. The language provided may not be Page 97 of 98<br />
modified in any way. The most current <strong>Iowa</strong> <strong>Core</strong> can be found at http://iowacore.educateiowa.gov.
University of Cambridge<br />
International Examinations:<br />
General Certificate of<br />
Secondary Education in<br />
<strong>Mathematics</strong>,<br />
2009.<br />
EdExcel, General Certificate of<br />
Secondary Education,<br />
<strong>Mathematics</strong>, 2009.<br />
Blachowicz, Camille, and Fisher,<br />
Peter. “Vocabulary Instruction.”<br />
In Handbook of Reading<br />
Research, Volume III, edited by<br />
Michael Kamil, Peter<br />
Mosenthal, P. David Pearson,<br />
and Rebecca Barr, pp. 503-523.<br />
Mahwah, NJ: Lawrence Erlbaum<br />
Associates, 2000.<br />
Gándara, Patricia, and Contreras,<br />
Frances. The Latino Education<br />
Crisis: The Consequences of<br />
Failed Social Policies.<br />
Cambridge, Ma: Harvard<br />
University Press, 2009.<br />
Moschkovich, Judit N. “Supporting<br />
the Participation of English<br />
Language Learners in<br />
Mathematical Discussions.” For<br />
the Learning of <strong>Mathematics</strong> 19<br />
(March 1999): 11-19.<br />
Moschkovich, J. N. (in press).<br />
Language, culture, and equity in<br />
secondary mathematics<br />
classrooms. To appear in F.<br />
Lester & J. Lobato (ed.),<br />
Teaching and Learning<br />
<strong>Mathematics</strong>: Translating<br />
Research to the Secondary<br />
Classroom, Reston, VA: NCTM.<br />
Moschkovich, Judit N. “Examining<br />
Mathematical Discourse<br />
Practices,” For the Learning of<br />
<strong>Mathematics</strong> 27 (March 2007):<br />
24-30.<br />
Moschkovich, Judit N. “Using Two<br />
Languages when Learning<br />
<strong>Mathematics</strong>:<br />
How Can Research Help Us<br />
Understand <strong>Mathematics</strong><br />
Learners Who Use Two<br />
Languages?” Research Brief and<br />
Clip, National Council of<br />
Teachers of <strong>Mathematics</strong>, 2009<br />
http://www.nctm.org/uploaded<br />
Files/Research_News_and_Adv<br />
ocacy/Research/Clips_and_Brie<br />
fs/Research_brief_<strong>12</strong>_Using_2.<br />
pdf. (accessed November 25,<br />
2009).<br />
Moschkovich, J.N. (2007) Bilingual<br />
<strong>Mathematics</strong> Learners: How<br />
views of language, bilingual<br />
learners, and mathematical<br />
communication impact<br />
instruction. In Nasir, N. and<br />
Cobb, P. (eds.), Diversity,<br />
Equity, and Access to<br />
Mathematical Ideas. New York:<br />
Teachers College Press, 89-104.<br />
Schleppegrell, M.J. (2007). The<br />
linguistic challenges of<br />
mathematics teaching and<br />
learning: A research review.<br />
Reading & Writing Quarterly,<br />
23:139-159.<br />
Individuals with Disabilities<br />
Education Act (IDEA), 34 CFR<br />
§300.34 (a). (2004).<br />
Individuals with Disabilities<br />
Education Act (IDEA), 34 CFR<br />
§300.39 (b)(3). (2004).<br />
Office of Special Education<br />
Programs, U.S. Department of<br />
Education. “IDEA Regulations:<br />
Identification of Students with<br />
Specific Learning Disabilities,”<br />
2006.<br />
Thompson, S. J., Morse, A.B.,<br />
Sharpe, M., and Hall, S.,<br />
“Accommodations Manual:<br />
How to Select, Administer and<br />
Evaluate Use of<br />
Accommodations and<br />
Assessment for Students with<br />
Disabilities,” 2nd Edition.<br />
Council of Chief State School<br />
Officers, 2005.<br />
Disclaimer: This document is up-to-date as of 11/17/2010. The language provided may not be Page 98 of 98<br />
modified in any way. The most current <strong>Iowa</strong> <strong>Core</strong> can be found at http://iowacore.educateiowa.gov.