Process Standards definition and examples - Green Hills AEA
Process Standards definition and examples - Green Hills AEA
Process Standards definition and examples - Green Hills AEA

Create successful ePaper yourself
Turn your PDF publications into a flip-book with our unique Google optimized e-Paper software.
<strong>Process</strong> <strong>St<strong>and</strong>ards</strong> as Proposed by NCTM<br />
Note: Expect overlapping among process st<strong>and</strong>ards within given <strong>examples</strong>.<br />
Problem Solving<br />
Build new mathematical knowledge through problem solving<br />
Solve problems that arise in mathematics <strong>and</strong> in other contexts<br />
Apply <strong>and</strong> adapt a variety of appropriate strategies to solve problems<br />
Monitor <strong>and</strong> reflect on the process of mathematical problem solving<br />
Example:<br />
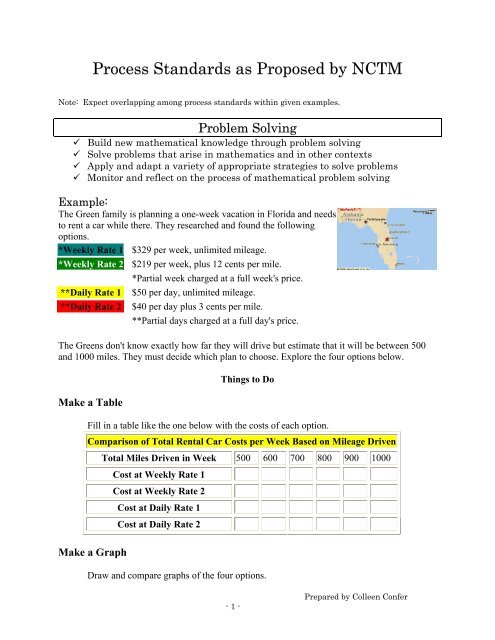
The <strong>Green</strong> family is planning a one-week vacation in Florida <strong>and</strong> needs<br />
to rent a car while there. They researched <strong>and</strong> found the following<br />
options.<br />
*Weekly Rate 1 $329 per week, unlimited mileage.<br />
*Weekly Rate 2 $219 per week, plus 12 cents per mile.<br />
**Daily Rate 1<br />
**Daily Rate 2<br />
*Partial week charged at a full week's price.<br />
$50 per day, unlimited mileage.<br />
$40 per day plus 3 cents per mile.<br />
**Partial days charged at a full day's price.<br />
The <strong>Green</strong>s don't know exactly how far they will drive but estimate that it will be between 500<br />
<strong>and</strong> 1000 miles. They must decide which plan to choose. Explore the four options below.<br />
Make a Table<br />
Things to Do<br />
Fill in a table like the one below with the costs of each option.<br />
Comparison of Total Rental Car Costs per Week Based on Mileage Driven<br />
Make a Graph<br />
Total Miles Driven in Week 500 600 700 800 900 1000<br />
Cost at Weekly Rate 1<br />
Cost at Weekly Rate 2<br />
Cost at Daily Rate 1<br />
Cost at Daily Rate 2<br />
Draw <strong>and</strong> compare graphs of the four options.<br />
- 1 -<br />
Prepared by Colleen Confer
Analyze the Graph<br />
1. Each graph should contain six points. Is it appropriate to connect<br />
the points on the graphs to make lines? Explain why or why not.<br />
2. Do all of the points of each graph lie on a straight line? What is a<br />
function called that has a graph which is a straight line?<br />
3. Which of the lines is steepest? What is the slope of that line?<br />
Which of the functions grows at the fastest rate? Which of the<br />
functions grows at the slowest rate? What is its slope ?<br />
4. If you extend the lines through the y axis, would any of the lines<br />
go through the origin? Explain why or why not.<br />
5. What is significant about the points where the graphs intersect?<br />
Write the Functions<br />
Write the Total Week's Rental Car Cost as a function of the Number of Miles Driven<br />
for each of the options.<br />
Write a Paragraph<br />
Based on the best economics, explain under what conditions the <strong>Green</strong> Family should<br />
choose each option.<br />
http://math.rice.edu/~lanius/Algebra/rentacar.html<br />
Reasoning <strong>and</strong> Proof<br />
Recognize reasoning <strong>and</strong> proof as fundamental aspects of mathematics<br />
Make <strong>and</strong> investigate mathematical conjectures<br />
Develop <strong>and</strong> evaluate mathematical arguments <strong>and</strong> proofs<br />
Select <strong>and</strong> use various types of reasoning <strong>and</strong> methods of proof<br />
Example:<br />
Students research various epidemics that have devastated the world population at<br />
various points in history. They then share <strong>and</strong> calculate statistics obtained in their<br />
research <strong>and</strong> develop graphs comparing <strong>and</strong> contrasting how different epidemics<br />
affected the global population.<br />
http://www.nytimes.com/learning/teachers/lessons/19980908tuesday.html<br />
- 2 -<br />
Prepared by Colleen Confer
Communication<br />
Organize <strong>and</strong> consolidate their mathematical thinking through<br />
communication<br />
Communicate their mathematical thinking coherently <strong>and</strong> clearly to peers<br />
Analyze <strong>and</strong> evaluate the mathematical thinking <strong>and</strong> strategies of others<br />
Use the language of mathematics to express mathematical ideas properly<br />
Example:<br />
It's the night of the big game. You're in the locker room. The coach is pumping the<br />
team up. "Now, I know you people are nervous. That's okay, in fact, that's what we<br />
want. You're going to perform better on the court if you're a little nervous".<br />
Does the graph above confirm what the coach told you?<br />
Here are some questions for you based upon the graph.<br />
1. Write a statement that describes performance as stress increases.<br />
2. Which part of the graph illustrates where stress is highest? What is<br />
performance at that point? Which part of the graph illustrates where<br />
performance is highest? Which part of the graph illustrates where<br />
performance is increasing? Which part of the graph illustrates where<br />
performance is decreasing?<br />
3. Notice that the graph is symmetric about a vertical line. What would<br />
you say this indicates about performance?<br />
4. What if this was a graph of your bank balance over a year. Describe<br />
what the graph would indicate about your saving <strong>and</strong> spending<br />
practices.<br />
http://math.rice.edu/~lanius/Algebra/stress.html<br />
- 3 -<br />
Prepared by Colleen Confer
Connections<br />
Recognize <strong>and</strong> use connections among mathematical ideas<br />
Underst<strong>and</strong> how mathematical ideas interconnect <strong>and</strong> build on one another<br />
to produce a coherent whole<br />
Recognize <strong>and</strong> apply mathematics in contexts outside of mathematics<br />
Example: Students learn about the impact of the recent J.P. Morgan/Chase<br />
Manhattan merger. By studying the recen t financial performance of the two<br />
banks, students will predict how the merger will affect the new company's<br />
financial performance. Students will then create an annual report for the new<br />
company based on their predictions.<br />
http://www.nytimes.com/learning/teachers/lessons/20000914thursday.html<br />
Representation<br />
Create <strong>and</strong> use representations to organize, record, <strong>and</strong> communicate<br />
mathematical ideas<br />
Select, apply, <strong>and</strong> translate among mathematical representations to solve<br />
problems<br />
Use representations to model <strong>and</strong> interpret physical, social, <strong>and</strong><br />
mathematical phenomena<br />
Example: A group of students has $60 to spend on dinner. They know that the<br />
total cost, after adding tax <strong>and</strong> tip, will be 25 percent more than the food prices<br />
shown on the menu. How much can they spend on the food so that the total cost<br />
will be $60?<br />
$60<br />
Tax <strong>and</strong> Tip<br />
Cost of Food<br />
- 4 -<br />
Prepared by Colleen Confer