Development of 0.5 MWe Scale DeSOX-DeNOX ... - Getreideheizung
Development of 0.5 MWe Scale DeSOX-DeNOX ... - Getreideheizung
Development of 0.5 MWe Scale DeSOX-DeNOX ... - Getreideheizung

Create successful ePaper yourself
Turn your PDF publications into a flip-book with our unique Google optimized e-Paper software.
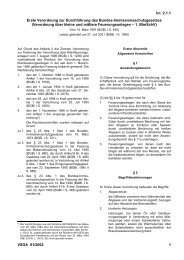
load by the pulse repetition rate. Fig. 5 shows the current and voltage waveforms versus<br />
time for 35 Ω. The pulse voltage has 70.32 kV pk , 280 ns rise time, and 640 ns duration.<br />
The current signal has 1.51 kA pk , 220 ns, and 630 ns.<br />
The impedance <strong>of</strong> discharge was computed with waveforms acquired by the<br />
oscilloscope as a function <strong>of</strong> time. All through the experiments, it is found that there is a<br />
constant impedance region and the value <strong>of</strong> impedance at the<br />
Energy / Pulse (J)<br />
60<br />
50<br />
40<br />
30<br />
20<br />
10<br />
0<br />
0 50 100 150 200<br />
Resistance (Ω)<br />
Voltage (kV)<br />
80<br />
70<br />
60<br />
50<br />
40<br />
30<br />
20<br />
1.6<br />
1.4<br />
1.2<br />
1<br />
0.8<br />
0.6<br />
0.4<br />
10<br />
0.2<br />
0<br />
0<br />
-10<br />
-0.2<br />
0 1 2 3 4 5<br />
Time (µs)<br />
Current (kA)<br />
Fig 4. The transferred energy into Fig 5. Voltage and current veforms<br />
the dummy loads. On the 35 W dummy load.<br />
Impedance (W)<br />
350<br />
300<br />
250<br />
200<br />
150<br />
100<br />
50<br />
70<br />
60<br />
50<br />
40<br />
30<br />
20<br />
10<br />
Energy efficiency (%)<br />
0<br />
55 60 65 70 75<br />
Voltage (kV)<br />
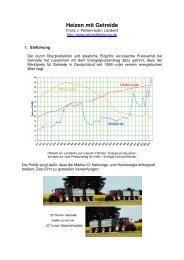
Fig 6. Impedance <strong>of</strong> the reactor (◆) and energy transfer efficiency (▲) as a<br />
function <strong>of</strong> the peak voltage applied.<br />
region implies the minimum resistance <strong>of</strong> discharge. The minimum resistance is always<br />
roughly equal to the value <strong>of</strong> peak voltage divided by the peak current.<br />
Fig. 6 shows a method to reduce impedance value <strong>of</strong> the reactor and to increase nergy<br />
efficiency. With increasing the peak voltage applied, impedance <strong>of</strong> the reactor decreases<br />
and energy efficiency also increases.<br />
0