Technical Paper by J.H. Greenwood - IGS - International ...
Technical Paper by J.H. Greenwood - IGS - International ...
Technical Paper by J.H. Greenwood - IGS - International ...

Create successful ePaper yourself
Turn your PDF publications into a flip-book with our unique Google optimized e-Paper software.
DISCUSSION AND CLOSURE D Designing to Residual Strength Instead of Stress-Rupture<br />
T R = 1 − T S t ∕ 10<br />
(7)<br />
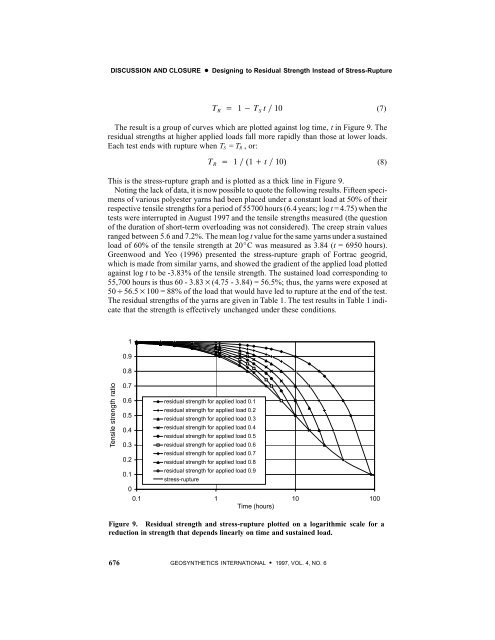
The result is a group of curves which are plotted against log time, t in Figure 9. The<br />
residual strengths at higher applied loads fall more rapidly than those at lower loads.<br />
Each test ends with rupture when T S =T R ,or:<br />
T R = 1 ∕ (1 + t ∕ 10)<br />
(8)<br />
This is the stress-rupture graph and is plotted as a thick line in Figure 9.<br />
Noting the lack of data, it is now possible to quote the following results. Fifteen specimens<br />
of various polyester yarns had been placed under a constant load at 50% of their<br />
respective tensile strengths for a period of 55700 hours (6.4 years; log t = 4.75) when the<br />
tests were interrupted in August 1997 and the tensile strengths measured (the question<br />
of the duration of short-term overloading was not considered). The creep strain values<br />
ranged between 5.6 and 7.2%. The mean log t value for the same yarns under a sustained<br />
load of 60% of the tensile strength at 20_C was measured as 3.84 (t = 6950 hours).<br />
<strong>Greenwood</strong> and Yeo (1996) presented the stress-rupture graph of Fortrac geogrid,<br />
which is made from similar yarns, and showed the gradient of the applied load plotted<br />
against log t to be -3.83% of the tensile strength. The sustained load corresponding to<br />
55,700 hours is thus 60 - 3.83×(4.75 - 3.84) = 56.5%; thus, the yarns were exposed at<br />
50÷56.5×100 = 88% of the load that would have led to rupture at the end of the test.<br />
The residual strengths of the yarns are given in Table 1. The test results in Table 1 indicate<br />
that the strength is effectively unchanged under these conditions.<br />
1<br />
0.9<br />
0.8<br />
Percent Tensile tensile strength strength ratio<br />
0.7<br />
0.6<br />
0.5<br />
0.4<br />
0.3<br />
0.2<br />
0.1<br />
0<br />
residual strength for applied load 0.1<br />
residual strength for applied load 0.2<br />
residual strength for applied load 0.3<br />
residual strength for applied load 0.4<br />
residual strength for applied load 0.5<br />
residual strength for applied load 0.6<br />
residual strength for applied load 0.7<br />
residual strength for applied load 0.8<br />
residual strength for applied load 0.9<br />
stress-rupture<br />
0.1 1 10 100<br />
Time (hours)<br />
Figure 9. Residual strength and stress-rupture plotted on a logarithmic scale for a<br />
reduction in strength that depends linearly on time and sustained load.<br />
676 GEOSYNTHETICS INTERNATIONAL S 1997, VOL. 4, NO. 6