Telecom GIS: An Integrated Approach
Telecom GIS: An Integrated Approach
Telecom GIS: An Integrated Approach

You also want an ePaper? Increase the reach of your titles
YUMPU automatically turns print PDFs into web optimized ePapers that Google loves.
Map India 2003<br />
Utility<br />
<strong>Telecom</strong> <strong>GIS</strong>: <strong>An</strong> <strong>Integrated</strong> <strong>Approach</strong><br />
Milind Deshpande<br />
General Manager<br />
Reliance Engineering Associates (P) Ltd.<br />
‘A’ Block, Ground Floor,<br />
Dhirubhai Ambani Knowledge City,<br />
Navi Mumbai, 400 709<br />
milind_m_deshpande@ril.com<br />
+91 22 2762 4885<br />
KM Jagadeesh<br />
Vice President<br />
Reliance Infocomm<br />
Jagadeesh_KM@ril.com<br />
+91 22 2762 4815<br />
1.0.0 Introduction<br />
Reliance Infocomm is implementing countrywide telecom network providing wireless and wireline<br />
services to customers. <strong>Telecom</strong> <strong>GIS</strong> is being implemented as part of this project for serving the<br />
business needs of the enterprise. This paper discusses experience gained in implementation of a<br />
telecom <strong>GIS</strong> fully integrated with the Operations Support System (OSS) / Business Support System<br />
(BSS) for countrywide network of Reliance Infocom.<br />
2.0.0 Business Requirement Assessment<br />
At the outset of the vast telecomm infrastructure project, Reliance management recognised the<br />
importance of providing high quality of uninterrupted service to the customers. Continuously evolving<br />
technology and tremendous competition has necessitated maximisation of utilization of telecom<br />
inventory and tight inventory controls.<br />
<strong>GIS</strong> platform with a dedicated telecommunication application is the optimum solution since it can<br />
store the network inventory in a geographical manner. Interfacing with network, O & M and customer<br />
facing systems enables to meet the business requirements successfully. Some of the main<br />
requirements expected to be met by the <strong>GIS</strong> / <strong>Telecom</strong> application are:<br />
• Plan, design and engineer Network and expansion<br />
• Modeling of (OutSide Plant) OSP and (InSide Plant) ISP items up to port level<br />
• Placement of Trenches, Cables, Structures and facilities in the OSP<br />
• Facility layouts, equipment placement and port-to-port connectivity<br />
• Inventory management including equipment assignment<br />
• Repository of As Built and survey data<br />
• Provide network data to OSS / BSS systems<br />
• <strong>An</strong>swer service activation / provisioning queries<br />
• Cable fault localisation<br />
• Several Sales, Marketing and Service fulfillment related functions<br />
3.0.0 Selection of <strong>GIS</strong> Platform & <strong>Telecom</strong> Application<br />
Technical evaluation of all existing out-of-box packages was done with one week hands-on<br />
experience wherein ease of learning and operation, efficiency of CAD functionalities etc. were tested<br />
by operators.<br />
Map India Conference 2003<br />
© <strong>GIS</strong>development.net, All rights reserved.
Map India 2003<br />
Utility<br />
Detailed technical discussions involving client functional capabilities, RDBMS, version management<br />
of the <strong>GIS</strong> platform were carried out.<br />
Ease of data conversion, telecom feature modeling and other functions were evaluated. Efforts in<br />
customisation, after sales support etc. were also considered.<br />
Detailed analysis of productivity expected work volume, licensing cost was made and optimum<br />
solution arrived at.<br />
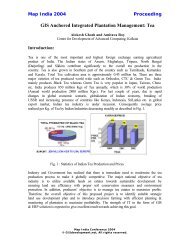
4.0.0 Data Creation<br />
4.1.1 It was necessary to create the high-resolution data of cities and inter-city roads for typical<br />
telecom operations since it is not readily available in the country. This data is categorised<br />
into (a) City (b) Survey (c) Roads. Detailed specifications were drawn for each dataset<br />
based on the business requirements.<br />
4.1.2 City data was digitised in AutoCAD Map from 1 or 6 meter resolution satellite imagery. The<br />
work involved 500,000 man-hours and was outsourced from 8 vendors. Survey data in<br />
AutoCAD format was collected by field construction team using over 30 survey contractors.<br />
Road data was procured in coverage form. Over 30,000 kM DGPS survey in navigational<br />
mode and fixed points was done to geo-reference the entire dataset. Migration of data to<br />
<strong>GIS</strong> platform is done using FME software.<br />
4.1.3 The planning of sequence of activities allowed us to carry out the mammoth task of data<br />
creation in parallel with other project activities without affecting the overall project<br />
schedule. This strategy also allows us to load large amounts of map and inventory data<br />
throughout the lifetime of the telecom operations.<br />
4.1.4 However, this method imposes major constraints on the continuous availability of the multiversioned<br />
<strong>GIS</strong> database. Although actual system time for data migration is less than a<br />
day, all preparatory work and attendant actions result in a down time of up to 4-5 days for<br />
uploading such bulk data. We are studying various options to reduce this downtime.<br />
5.0.0 Creation of Network Inventory<br />
5.1.0 Introduction<br />
Unlike the map and survey data, <strong>Telecom</strong> network inventory and connectivity involves complicated<br />
logical relationships, which are difficult to capture on CAD platform. Migration of such data to <strong>GIS</strong><br />
platform is also very complex, error prone and does not lead to cost, efforts or time reduction.<br />
Therefore, network inventory is created directly on selected <strong>GIS</strong> platform, using telecom application.<br />
5.2.0 Modeling & model libraries<br />
5.2.1 <strong>Telecom</strong> applications have specially designed data model, providing ability to build models<br />
of frequently used items like ports, cards, chassis, equipment, cables, structures etc.<br />
These models can be instantiated directly or configured into frequently repeating<br />
combinations, which in turn can be instantiated on the map.<br />
5.2.2 Building model libraries requires full understanding of the telco application and detailed<br />
subject knowledge of telecom engineering, operations and maintenance. Integration of <strong>GIS</strong><br />
/ telecom application with OSS has a major bearing on modeling. Therefore, wherever<br />
OSS-<strong>GIS</strong> integration is involved, Telco applications having application having a flexible<br />
model builder is preferable over application with built-in model libraries. Integration with<br />
OSS should ensure that all model reference data is synchronised beforehand, for smooth<br />
transfer of instance data.<br />
5.3.0 Building on migrated data: OSP<br />
Map India Conference 2003<br />
© <strong>GIS</strong>development.net, All rights reserved.
Map India 2003<br />
Utility<br />
5.3.1 Accurate geo-referenced map data is insufficient to derive maximum value from the Telco<br />
application. Accuracy of survey data is of utmost importance. Survey data with trench,<br />
man-hole & hand-hole details, number and alignment of ducts is migrated from AutoCAD<br />
platform. Correct models of span & ducts are populated. Cables are also drawn using<br />
models developed on telco application. Further, cross-sectional views of the trench are<br />
added and cables are associated with ducts. Cable splicing / connection and slack loop<br />
addition is carried out and lastly, as built data of cable optical & run length is entered.<br />
5.3.2 In case of Optical Fiber Cables (OFC), OTDR equipment is able to provide an optical<br />
distance with excellent accuracy. However, following factors affect accuracy of fault<br />
localisation:<br />
• Fiber length of cable is generally 2-3% more than the cable length.<br />
• Cable is blown in conduits, which have 'snaking', thus increasing the cable and fiber<br />
length.<br />
• Slack loops of 10-20 meters are left in each chamber, approximately every kilometer.<br />
• Line feature in the map does not consider differences in elevations, which add to the<br />
cable and fiber length.<br />
• OTDR equipment can be 100 kM away from the fault.<br />
Unless the fault localisation algorithm compensates for these factors, inaccuracies may add up to<br />
several hundred meters, defeating the whole purpose.<br />
5.4.0 ISP Data Creation<br />
5.4.1 First task in ISP data creation is drawing facilities, floor plans and rack layouts using telco<br />
application. This is a time consuming task in ISP data creation process.<br />
5.4.2 There are thousands of network elements and utility equipment that need to be placed in<br />
the ISP facilities. Although these can be instantiated one at a time using the models, large<br />
man-hour savings are possible by pre-configuring frequently repeating equipment models.<br />
During instantiation, network element codes, if followed, are entered. Equipment thus<br />
placed in the facility are then "racked-in" in the respective racks as per the designs / as<br />
built. At this stage, the ISP equipment can be seen on the telecom application as they are<br />
physically installed in the field.<br />
5.4.3 Connectivity between ISP equipment is logical in nature while connectivity between OSP or<br />
ISP and OSP features is physical. Appropriate rules should be set so that invalid<br />
connections are not allowed by the system.<br />
5.5.0 Requirements posed by Versioning<br />
5.5.1 A multi-version database provides users with an ability to manage changes to the database<br />
through multiple versions. Each user can have multiple versions of the database. Unlike<br />
multi-user database, more than one user can make changes to the same feature<br />
simultaneously. Process of reconciliation detects conflicting changes to same feature by<br />
multiple users and allows proper resolution by manual intervention. It also allows the<br />
organisation to have a workflow to reflect various stages of project from planning,<br />
designing, engineering, construction, As Built to in-service.<br />
5.5.2 In a typical network build phase, there are hundreds of sites each going through the project<br />
stages mentioned above. Multi-versioning capability of the <strong>GIS</strong> allows us to open versions<br />
for each site, which can then transition through these stages.<br />
5.5.3 Large data loads take very long time in multi-versioned database and hence require the<br />
database to be unversioned. Unversioning the database drops edits from all versions that<br />
are not transferred to base tables. To guard against this, it is required to reconcile all<br />
Map India Conference 2003<br />
© <strong>GIS</strong>development.net, All rights reserved.
Map India 2003<br />
Utility<br />
versions after resolving all conflicts, post all versions, compress the database and finally<br />
unversion the database. All these tasks are necessarily sequential in nature. Some of the<br />
tasks require exclusive access to database and stop users from editing or even reading<br />
from the database. This scenario presents major challenges in providing high availability<br />
and uptime in an environment having 24x7 hour operations. Each organisation must<br />
decide its strategy by weighing these advantages vis-à-vis the uptime requirement.<br />
5.6.0 Applications in Network Planning & Engineering<br />
5.6.1 Several applications in the area of network planning and engineering are possible using<br />
the telecom database. These include schematic representation of network, creation and<br />
comparison of different versions of network plans, automating network engineering and<br />
element codification etc. A lot of scope also exists in RF planning.<br />
6.0.0 Customised Applications<br />
6.1.0 Some important functions<br />
6.1.1 The telecom application goes beyond the functionality provided by standard <strong>GIS</strong> platform.<br />
It serves the needs of engineering, construction and projects monitoring by providing some<br />
out of the box functions. For example, ability to check continuity of cable from port to port<br />
required by network engineers is provided by the Network Trace function. Bill of Materials<br />
(BoM) required by Engineering, Projects and Construction is provided by the standard BoM<br />
functionality. However, these functionalities are generic in nature and need to be<br />
customised to suit organisational work processes. Some of the examples are described in<br />
the following sections.<br />
6.2.0 Customised Applications<br />
6.2.1 Detailed network asset naming by mnemonic codes is typical to <strong>Telecom</strong> industry. The<br />
naming conventions differ in each organisation, however, rigid parent child, 1-m or 1-1<br />
relationships are embedded in the codes themselves. The number of assets up to card<br />
and port level runs in to millions. Customised application using the telco & <strong>GIS</strong> data model<br />
is developed to reduce the data-entry work to a fraction of the total work.<br />
6.2.2 Typically, printed <strong>GIS</strong> outputs are maps. However, EPC activities require strict revision<br />
control and document control with a central document repository. Material control<br />
procedures require keeping track of BoM and prepare Material Take-Off (MTO) for<br />
procurement / delivery and issues. <strong>GIS</strong> being a dynamic database is not readily amenable<br />
to such controls. A customised application is developed to print all engineering drawings<br />
and layouts in standard formats complete with drawing numbers, revision & approval<br />
control and BoM. The drawing-wise BoM data is also stored in the <strong>GIS</strong> database to enable<br />
MTOs for procurement / construction purposes.<br />
6.2.3 Special data-entry tool is developed to ensure the sufficiency of data, particularly for<br />
accurate fault localisation. Tool also recognises and permanently stores direction of<br />
digitisation of cables required for long traces.<br />
6.2.4 Automation tool has been developed for entering a large number of facilities in OSP; floors,<br />
racks and equipment in ISP. Input in dBaseIV format is validated and features placed in<br />
the map automatically, in fraction of time required for doing it manually.<br />
6.2.5 Similar automation tool is developed for copying the migrated trench parallel to itself and<br />
converting it to a cable. The inputs are in the form of selection of connected trench<br />
features, offset distance and direction of copy. The trench features are copied as a cable,<br />
Map India Conference 2003<br />
© <strong>GIS</strong>development.net, All rights reserved.
Map India 2003<br />
Utility<br />
retaining the geometry of migrated trenches but using a model of cable. Such automation<br />
has helped in increasing the productivity manifold.<br />
6.2.6 Interactive fault localisation tool using COTS network trace capability is developed. This<br />
tool applies compensations to data errors mentioned earlier to provide extremely accurate<br />
fault location<br />
6.2.7 Web based applications are developed for viewing the network and faults over the<br />
company Intranet.<br />
7.0.0 Integration with other systems<br />
7.1.0 Business driver<br />
<strong>GIS</strong> based telecom application requires large investment, manpower and time in data creation and<br />
deployment. Full benefits of such systems can only be realised when the <strong>Telecom</strong> <strong>GIS</strong> system<br />
becomes an integral part of the OSS / BSS solution and the organisational work processes are<br />
designed with <strong>GIS</strong> as an essential part of such integrated OSS / BSS solution. Based on automatic<br />
flow-through business processes, such integration provides maximum value addition in terms of<br />
• Single point data entry and elimination of redundant databases,<br />
• Minimal human intervention in data creation,<br />
• Improved response to network events,<br />
• Improved response to customers,<br />
resulting in improved overall efficiency of the enterprise.<br />
7.2.0 Integration with OSS<br />
7.2.1 Telco application on <strong>GIS</strong> platform is the data master for all network inventory and network<br />
infrastructure data as well as network related reference data.<br />
• Network inventory data includes equipment, cards and physical ports.<br />
• Physical configuration data includes physical circuits and cross connections.<br />
• Infrastructure includes facilities & other OSP data like trenches and cables.<br />
The logical configuration is created in OSS based on information from Telco <strong>GIS</strong> and customer data<br />
entered in CRM.<br />
7.2.2 The data volume of physical network inventory, connections and facilities runs in to a few<br />
million records for a large network. Single point data creation with automatic uploading in<br />
OSS ensuring synchronising of the two databases saves several thousand man-hours.<br />
7.2.3 As a result of this, permanent link is automatically established between OSS and <strong>GIS</strong><br />
through primary keys, allowing on-the-fly spatial queries to be handled between the two<br />
systems. Questions by OSS and field staff requiring information of nearest active<br />
electronics facility or nearest manhole based on visual or textual address input are<br />
answered in seconds.<br />
7.2.4 Detailed requirement assessment and data mapping is performed jointly by OSS and Telco<br />
application team. At this stage, following details are frozen<br />
• All network element and facility naming conventions<br />
• Modeling details for both physical and logical configurations<br />
• Overall integration scheme and middleware<br />
• API signatures on either side<br />
Map India Conference 2003<br />
© <strong>GIS</strong>development.net, All rights reserved.
Map India 2003<br />
Utility<br />
• Error handling and database synchronisation issues<br />
• Test plans & test cases with expected results<br />
7.2.5 We have successfully implemented an application for uploading the network inventory and<br />
physical links data to OSS. Enclosed Figure 1 indicates Flowchart of Data Upload to<br />
OSS. Following are the important steps involved:<br />
• Inventory changed since last upload is transferred to interface tables using a<br />
difference cursor with 'ADD', 'DELETE' or 'MODIFY' flags. Middleware adapters are<br />
triggered to start transfer to OSS.<br />
• Inventory data is validated against of reference data in OSS. A 'SUCCESS' or an<br />
error code is returned to interface table.<br />
• The 'SUCCESS' is also posted to the versioned tables to avoid retransfer of the data<br />
during the next dump.<br />
7.2.6 Due to the difference in representation of links in OSS compared to <strong>GIS</strong> / Telco application,<br />
transfer of links is more complicated. The Links are populated in the interface tables as<br />
follows:<br />
• Every connected port is scanned and a network trace made.<br />
• Each complete trace is given a 'Set ID' and each piece of cable within a set is given a<br />
'Sequence Number'.<br />
• A table is populated where every 'Set ID' is mapped to the OTDR port, which monitors<br />
that link.<br />
• From the first table, OSS picks up 'FROM' port from the first record and 'TO' port from<br />
the last record of the set.<br />
• From the second table, OSS picks up information of which Link is monitored by which<br />
OTDR port.<br />
7.2.7 The task of error checking, corrections and transferring the data again to OSS is manual<br />
and tedious. <strong>GIS</strong> / Telco application operator may need to check 3,000 records after each<br />
dump. This task is facilitated by specially developed GUI, which displays the error<br />
message for each inventory item, allows user to zoom to the feature as well as select and<br />
start editing the same version, which created the inventory.<br />
7.2.8 OSS integration for Fault localisation is one of the most important and highly integrated<br />
applications that has been developed. The link to OTDR port mapping table loaded from<br />
<strong>GIS</strong> database forms a key to this automatic flow through process. Refer enclosed Figure<br />
2 indicating the Flowchart of Automatic Fault Localisation. Following are the important<br />
steps involved:<br />
• OSS commands the OTDR to provide optical distance to fault. The OTDR returns the<br />
optical distance of fault via OTDR server to OSS.<br />
• OSS passes the same along with OTDR port and a Fault ID to Telco application on<br />
<strong>GIS</strong> platform for locating the fault on map.<br />
• <strong>GIS</strong> / Telco application places the fault marker, calculates all the necessary attributes<br />
and publishes the fault location to Intranet. Simultaneously, the information is<br />
returned to OSS for further use like trouble ticketing, history etc.<br />
The entire process is completed in 10 minutes without any human intervention. The accuracy of the<br />
results is in the range of 5 to 25 meters and is governed only by the accuracy of data. Enclosed<br />
Figure 3 shows a Screen Shot of Fault Published on Intranet.<br />
Map India Conference 2003<br />
© <strong>GIS</strong>development.net, All rights reserved.
Map India 2003<br />
Utility<br />
7.2.9 Customer Relationship Management (CRM) is the crucial interface between a telecomm<br />
carrier, its prospects and acquired customers. Most of the customer queries are managed<br />
by call center operators. <strong>GIS</strong> provides a graphical view of a customer location, nearby<br />
facilities, signal quality, requests for services etc. to the call center operators.<br />
Customer Support Representatives can get quick customer profiles using geographic questions such<br />
as: Where is the customer? Which products and services are in use? What is the distance to the<br />
nearest fiber backbone? When do we plan to have coverage at this location? A <strong>GIS</strong> based web<br />
application is developed for delivering fast, integrated call center information over the corporate<br />
Intranet. Refer Figure 4 for a sample screen shot of Intranet Application for CRM.<br />
8.0.0 Conclusion<br />
A well designed and implemented <strong>Telecom</strong> Application based on <strong>GIS</strong> platform is a powerful tool<br />
available to the telecom enterprises. The application not only maintains a geo-physical inventory of<br />
ISP network elements and OSP objects but is also be used for vital activities like network planning,<br />
engineering and O & M. High value addition is observed by closely integrating the <strong>GIS</strong> / Telco<br />
application with OSS and BSS.<br />
Map India Conference 2003<br />
© <strong>GIS</strong>development.net, All rights reserved.