- Page 2 and 3:
PLAYER OR COACH TITLE WEEKLY RELEAS
- Page 4 and 5:
PLAYER OR COACH TITLE AT METLIFE ST
- Page 6 and 7:
PLAYER OR COACH TITLE HEY, ROOKIE!
- Page 8 and 9:
PLAYER OR COACH TITLE 2012 TALE OF
- Page 10 and 11:
PLAYER OR COACH TITLE BUILDING A BR
- Page 12 and 13:
PLAYER OR COACH TITLE MANNING’S 2
- Page 14 and 15:
PLAYER OR COACH TITLE IN THE RUNNIN
- Page 16 and 17:
PLAYER OR COACH TITLE JUST FOR KICK
- Page 18 and 19:
PLAYER OR COACH TITLE LAST MEETING
- Page 20 and 21:
THE LAST TIME IT HAPPENED - REG. SE
- Page 22 and 23:
ALPHABETICAL ROSTER PLAYER OR COACH
- Page 24 and 25:
PARTICIPATION CHART PLAYER OR COACH
- Page 26 and 27:
HOW THE GIANTS WERE BUILT PLAYER OR
- Page 28 and 29:
TRANSACTIONS PLAYER OR COACH TITLE
- Page 30 and 31:
TRANSACTIONS PLAYER OR COACH TITLE
- Page 32 and 33:
GIANTS 2012 REGULAR SEASON DEFENSIV
- Page 34 and 35:
20 prince amukamara cornerback Heig
- Page 36 and 37:
96 marvin austin defensive tackle H
- Page 38 and 39:
Ramses Barden 13 Wide Reciever Heig
- Page 40 and 41:
47 Tight End Height - 6-3 Weight -
- Page 42 and 43:
ennett’s GAME-BY-GAME 2012 RECEIV
- Page 44 and 45:
ernard REGULAR SEASON TACKLES GP GS
- Page 46 and 47:
REGULAR SEASON DATE OPP T A TT SKS
- Page 48 and 49:
REGULAR SEASON DATE OPP T A TT SKS
- Page 50 and 51:
AHMAD BRADSHAW 44 RUNNING BACK Heig
- Page 52 and 53:
BRADSHAW REGULAR SEASON RUSHING REC
- Page 54 and 55:
andre Brown running back Height - 6
- Page 56 and 57:
27 Safety Height - 5-11 Weight - 21
- Page 58 and 59:
99 DEFENSIVE tackle Height - 6-7 We
- Page 60 and 61:
selvish capers 60 offensive line He
- Page 62 and 63:
carr Regular Season PASSING GP GS A
- Page 64 and 65:
80 VICTOR CRUZ WIDE RECEIVER Height
- Page 66 and 67:
51 Long SNapper/LINEBACKER Height -
- Page 68 and 69:
DAVID DIEHL 66 Tackle Height - 6-5
- Page 70 and 71:
HERZLICH DEFENSE TACKLES GP GS T A
- Page 72 and 73:
REGULAR SEASON TACKLES INTERCEPTION
- Page 74 and 75:
HIXON RECEIVING REGULAR SEASON GP G
- Page 76 and 77:
REGULAR SEASON TACKLES INTERCEPTION
- Page 78 and 79:
HYNOSKI’S GAME-BY-GAME 2012 RUSHI
- Page 80 and 81:
JERNIGAN RECEIVING REG. SEASON GP G
- Page 82 and 83:
JOSEPH REGULAR SEASON TACKLES GP GS
- Page 84 and 85:
REGULAR SEASON DATE OPP T A TT SKS
- Page 86 and 87:
sean locklear Tackle Height - 6-4 W
- Page 88 and 89:
10 quarterback Height - 6-4 Weight
- Page 90 and 91:
MANNING Regular Season PASSING GP G
- Page 92 and 93:
nicks REGULAR SEASON RECEIVING GP G
- Page 94 and 95:
86 TIGHT END Height - 6-5 Weight -
- Page 96 and 97:
52 SPENCER PAYSINGER linebacker Hei
- Page 98 and 99:
KENNY PHILLIPS 21 Safety Height - 6
- Page 100 and 101:
jason Pierre-paul 90 defensive end
- Page 102 and 103:
82 RUEBEN RANDLE WIDE RECEIVER Heig
- Page 104 and 105:
55 new york football giants TRANSAC
- Page 106 and 107:
81 ADRIEN rOBINSON TIGHT END Height
- Page 108 and 109:
REGULAR SEASON TACKLES INTERCEPTION
- Page 110 and 111:
SASH REGULAR SEASON TACKLES INTERCE
- Page 112 and 113:
CHRIS SNEE 76 GUARD Height - 6-3 We
- Page 114 and 115:
new york football giants TRANSACTIO
- Page 116 and 117:
tryon REGULAR SEASON TACKLES INTERC
- Page 118 and 119:
REGULAR SEASON DATE OPP T A TT SKS
- Page 120 and 121:
(43-yarder) vs. Green Bay (11/25)..
- Page 122 and 123:
OSI UMENYIORA 72 defensive end Heig
- Page 124 and 125:
steve WEatherford 5 punter Height -
- Page 126 and 127:
COREY WEBSTER 23 cornerback Height
- Page 128 and 129:
JACQUIAN WILLIAMS 57 Linebacker Hei
- Page 130 and 131:
Pittsburgh (11/4)...Had four kickof
- Page 132 and 133:
GIANTS 2012 NEW YORK 2012 NEW GIANT
- Page 134 and 135:
3. 7 22 3:20 Punt 3. 8 35 3:40 Punt
- Page 136 and 137:
2012 BALL POSSESSION AND DRIVE CHAR
- Page 138 and 139:
2012 BIG PLAY RUNS BIG PLAY RUNS 20
- Page 140 and 141:
GIANTS POINTS FROM TURNOVERS 2012 g
- Page 142 and 143:
GIANTS 2012 DEFENSIVE TURNOVER CHAR
- Page 144 and 145:
2012 giants TEAM STATS NEW YORK GIA
- Page 146 and 147:
2012 giants INSIDE 20 EFFICIENCY IN
- Page 148 and 149:
NEW YORK GIANTS INDIVIDUAL KICKING
- Page 150 and 151:
Giants 2 2:56 L.Tynes 34 yd. Field
- Page 152 and 153:
GAME SUMMARIES 2012 new york giants
- Page 154 and 155:
National Football League Game Summa
- Page 156 and 157:
New York Giants vs Baltimore Ravens
- Page 158 and 159:
New York Giants New York Giants vs
- Page 160 and 161:
Baltimore Ravens New York Giants vs
- Page 162 and 163:
L.Tynes extra point is GOOD, Center
- Page 164 and 165:
Baltimore Ravens at 0:03 1-10-BLT 4
- Page 166 and 167:
4-19-NYG 30 (3:18) (Punt formation)
- Page 168 and 169:
END OF QUARTER Score Time Poss New
- Page 170 and 171:
Playtime Percentage Percent of play
- Page 172 and 173:
New York Giants vs Baltimore Ravens
- Page 174 and 175:
game 13 saints vs. giants december
- Page 176 and 177:
game 11 packers vs. giants NOVEMBER
- Page 178 and 179:
game 9 STEELERS VS. GIANTS NOVEMBER
- Page 180 and 181:
game 7 REDSKINS VS. GIANTS october
- Page 182 and 183:
game 5 browns vs. giants october 7,
- Page 184 and 185: game 3 GIANTS AT PANTHERS SEPTEMBER
- Page 186 and 187: game 1 COWBOYS VS. GIANTS SEPTEMBER
- Page 188 and 189: RECORD BOOK 2012 new york giants
- Page 190 and 191: GIANTS ALL-TIME TOP TEN TOP TEN SCO
- Page 192 and 193: GIANTS INDIVIDUAL RECORDS SERVICE M
- Page 194 and 195: 15 Jay Feely (2005) 15 Raul Allegre
- Page 196 and 197: GIANTS INDIVIDUAL RECORDS ALL-PURPO
- Page 198 and 199: GIANTS INDIVIDUAL RECORDS vs. Phila
- Page 200 and 201: GIANTS INDIVIDUAL RECORDS MOST YARD
- Page 202 and 203: GIANTS INDIVIDUAL RECORDS 10.1 Aman
- Page 204 and 205: GIANTS INDIVIDUAL RECORDS 2 Al De R
- Page 206 and 207: TEAM RECORDS-GAME-OFFENSE RUSHING M
- Page 208 and 209: TEAM RECORDS-GAME-DEFENSE SCORING F
- Page 210 and 211: NFL STATS 2012 new york giants •
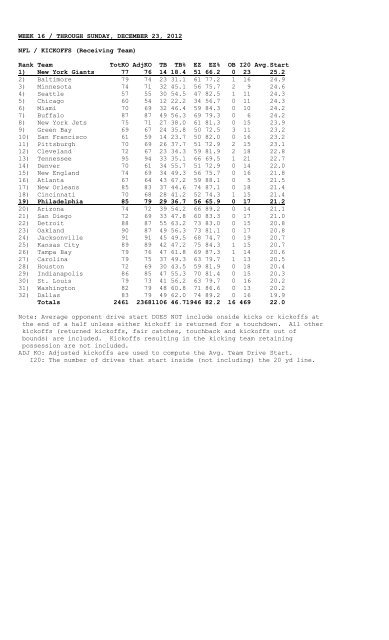
- Page 212 and 213: WEEK 16 / THROUGH SUNDAY, DECEMBER
- Page 214 and 215: WEEK 16 / THROUGH SUNDAY, DECEMBER
- Page 216 and 217: WEEK 16 / THROUGH SUNDAY, DECEMBER
- Page 218 and 219: WEEK 16 / THROUGH SUNDAY, DECEMBER
- Page 220 and 221: WEEK 16 / THROUGH SUNDAY, DECEMBER
- Page 222 and 223: WEEK 16 / THROUGH SUNDAY, DECEMBER
- Page 224 and 225: WEEK 16 / THROUGH SUNDAY, DECEMBER
- Page 226 and 227: WEEK 16 / THROUGH SUNDAY, DECEMBER
- Page 228 and 229: WEEK 16 / THROUGH SUNDAY, DECEMBER
- Page 230 and 231: WEEK 16 / THROUGH SUNDAY, DECEMBER
- Page 232 and 233: WEEK 16 / THROUGH SUNDAY, DECEMBER
- Page 236 and 237: WEEK 16 / THROUGH SUNDAY, DECEMBER
- Page 238 and 239: WEEK 16 / THROUGH SUNDAY, DECEMBER
- Page 240 and 241: WEEK 16 / THROUGH SUNDAY, DECEMBER
- Page 242 and 243: 102, D. Thomas, DEN vs. CLE 12/23 (
- Page 244 and 245: 110, McCoy, PHI at CLE 09/09 (20 at
- Page 246 and 247: WEEK 16 / THROUGH SUNDAY, DECEMBER
- Page 248 and 249: WEEK 16 / THROUGH SUNDAY, DECEMBER
- Page 250 and 251: WEEK 16 / THROUGH SUNDAY, DECEMBER
- Page 252 and 253: WEEK 16 / THROUGH SUNDAY, DECEMBER
- Page 254 and 255: WEEK 16 / THROUGH SUNDAY, DECEMBER
- Page 256 and 257: WEEK 16 / THROUGH SUNDAY, DECEMBER
- Page 258 and 259: WEEK 16 / THROUGH SUNDAY, DECEMBER
- Page 260 and 261: WEEK 16 / THROUGH SUNDAY, DECEMBER
- Page 262 and 263: WEEK 16 / THROUGH SUNDAY, DECEMBER
- Page 264 and 265: WEEK 16 / THROUGH SUNDAY, DECEMBER
- Page 266 and 267: WEEK 16 / THROUGH SUNDAY, DECEMBER
- Page 268 and 269: WEEK 16 / THROUGH SUNDAY, DECEMBER
- Page 270 and 271: WEEK 16 / THROUGH SUNDAY, DECEMBER
- Page 272 and 273: WEEK 16 / THROUGH SUNDAY, DECEMBER
- Page 274 and 275: WEEK 16 / THROUGH SUNDAY, DECEMBER
- Page 276 and 277: WEEK 16 / THROUGH SUNDAY, DECEMBER
- Page 278 and 279: WEEK 16 / THROUGH SUNDAY, DECEMBER
- Page 280 and 281: WEEK 16 / THROUGH SUNDAY, DECEMBER
- Page 282 and 283: WEEK 16 / THROUGH SUNDAY, DECEMBER
- Page 284 and 285:
WEEK 16 / THROUGH SUNDAY, DECEMBER
- Page 286 and 287:
WEEK 16 / THROUGH SUNDAY, DECEMBER
- Page 288 and 289:
WEEK 16 / THROUGH SUNDAY, DECEMBER
- Page 290 and 291:
WEEK 16 / THROUGH SUNDAY, DECEMBER
- Page 292 and 293:
WEEK 16 / THROUGH SUNDAY, DECEMBER
- Page 294 and 295:
WEEK 16 / THROUGH SUNDAY, DECEMBER
- Page 296 and 297:
2012 NEW YORK GIANTS media director
- Page 298 and 299:
TRANSCRIPTS & CLIPS 2012 new york g
- Page 300 and 301:
Burress wasn't around to try to top
- Page 302 and 303:
Another rout, and Giants’ playoff
- Page 304 and 305:
Giants searching for answers as pla
- Page 306 and 307:
Giants’ last-chance scenario to r
- Page 308 and 309:
Cruz finished with just three recep
- Page 310 and 311:
Manning ended the game with only 15
- Page 312 and 313:
punchless again, managing just 186
- Page 314 and 315:
“It seemed like they had 13 guys
- Page 316 and 317:
As it turned it, it was all just ta
- Page 318 and 319:
Eli Manning’s offense, coming off
- Page 320 and 321:
"We played some big games where we
- Page 322 and 323:
The Giants turned their season arou
- Page 324 and 325:
“Obviously there’s something mi
- Page 326 and 327:
easons maybe for that, which I’m
- Page 328 and 329:
QB Eli Manning Conference Call, Dec
- Page 330 and 331:
DE Osi Umenyiora Conference Call, D
- Page 332 and 333:
A: Of course, there’s a chance. T
- Page 334 and 335:
week, and we gained in confidence,
- Page 336 and 337:
S Antrel Rolle Postgame at Ravens,
- Page 338 and 339:
The Coughlin Corner Week 16 By Mich
- Page 340 and 341:
Coughlin: “Year in and year out.
- Page 342 and 343:
Coughlin: “Well, most of the time
- Page 344 and 345:
The Coughlin Corner Week 14 By Mich
- Page 346 and 347:
Q: Their defense is ranked last in
- Page 348 and 349:
Q: When you watch a tape, do you st
- Page 350 and 351:
The Coughlin Corner Week 12 By Mich
- Page 352 and 353:
love to unleash him and turn him lo
- Page 354 and 355:
Q: When things go well for Eli, he
- Page 356 and 357:
The Coughlin Corner Week 9 By Micha
- Page 358 and 359:
just a part of it. It’s a link in
- Page 360 and 361:
gets so hot that you’re concerned
- Page 362 and 363:
The Coughlin Corner Week 7 By Micha
- Page 364 and 365:
adaptable to any kind of scheme or
- Page 366 and 367:
Andre was scheduled to get … most
- Page 368 and 369:
The Coughlin Corner Week 5 By Micha
- Page 370 and 371:
the pass game was there.’ The onl
- Page 372 and 373:
The Coughlin Corner Week 4 By Micha
- Page 374 and 375:
personalities are very supportive o
- Page 376 and 377:
can drive yourself crazy with it, b
- Page 378 and 379:
Q: When you first became a head coa