DEVELOPMENT OF EMPIRICAL MODEL FOR PREDICTION OF SURFACE ROUGHNESS USING REGRESSION
In this present work, the important challenge is to manufacture high quality and low cost products within the stipulated time. The quality is one of the major factors of the product which depends upon the surface roughness and hence the surface roughness placed an important role in product manufacturing. Hence, an Empirical model is proposed for prediction of surface roughness in machining processes at given cutting conditions. The model considers the following working parameters spindle speed, feed, depth of cut, number of flutes and overhang of the tool. For a given work-tool combination, the range of cutting conditions are selected from different cutting condition variables. The experiments were conducted based on the principle of Factorial Design of Experiment (DOE) method with mixed level. After conducting experiments, surface roughness values are measured. Then these experimental results are used to develop an Empirical model for prediction of surface roughness by using Multiple Regression method. In this the Artificial Intelligence based neural network modelling approach is presented for the prediction of surface roughness of Aluminium Alloy products machined on CNC End Milling using High speed steel tool. Trails were made with different combinations of step size and momentum to select the best learning parameter. The best network structure with least Mean Square Error (MSE) was selected among the several networks. The multiple regression models, which are most widely used as prediction methods, are considered to be compared with the developed Artificial Neural Network (ANN) model performance.
In this present work, the important challenge is to manufacture high quality and low cost products within the stipulated time. The quality is one of the major factors of the product which depends upon the surface roughness and hence the surface roughness placed an important role in product manufacturing. Hence, an Empirical model is proposed for prediction of surface roughness in machining processes at given cutting conditions. The model considers the following working parameters spindle speed, feed, depth of cut, number of flutes and overhang of the tool. For a given work-tool combination, the range of cutting conditions are selected from different cutting condition variables. The experiments were conducted based on the principle of Factorial Design of Experiment (DOE) method with mixed level. After conducting experiments, surface roughness values are measured. Then these experimental results are used to develop an Empirical model for prediction of surface roughness by using Multiple Regression method. In this the Artificial Intelligence based neural network modelling approach is presented for the prediction of surface roughness of Aluminium Alloy products machined on CNC End Milling using High speed steel tool. Trails were made with different combinations of step size and momentum to select the best learning parameter. The best network structure with least Mean Square Error (MSE) was selected among the several networks. The multiple regression models, which are most widely used as prediction methods, are considered to be compared with the developed Artificial Neural Network (ANN) model performance.

You also want an ePaper? Increase the reach of your titles
YUMPU automatically turns print PDFs into web optimized ePapers that Google loves.
International Journal of Advances in Engineering & Technology, Nov. 2013.<br />
©IJAET ISSN: 22311963<br />
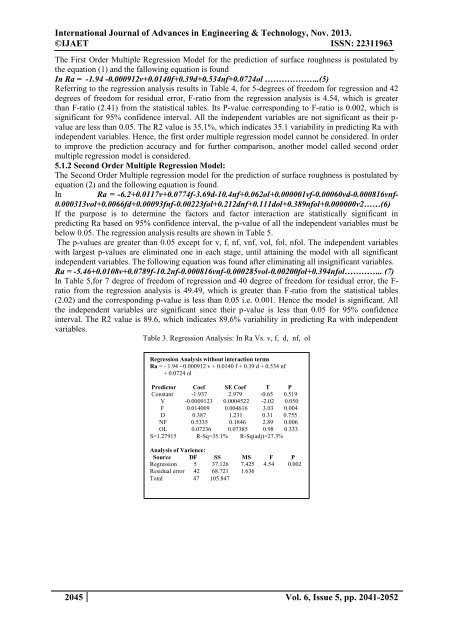
The First Order Multiple Regression Model for the prediction of surface roughness is postulated by<br />
the equation (1) and the fallowing equation is found<br />
In Ra = -1.94 -0.000912v+0.0140f+0.39d+0.534nf+0.0724ol ………………..(5)<br />
Referring to the regression analysis results in Table 4, for 5-degrees of freedom for regression and 42<br />
degrees of freedom for residual error, F-ratio from the regression analysis is 4.54, which is greater<br />
than F-ratio (2.41) from the statistical tables. Its P-value corresponding to F-ratio is 0.002, which is<br />
significant for 95% confidence interval. All the independent variables are not significant as their p-<br />
value are less than 0.05. The R2 value is 35.1%, which indicates 35.1 variability in predicting Ra with<br />
independent variables. Hence, the first order multiple regression model cannot be considered. In order<br />
to improve the prediction accuracy and for further comparison, another model called second order<br />
multiple regression model is considered.<br />
5.1.2 Second Order Multiple Regression Model:<br />
The Second Order Multiple regression model for the prediction of surface roughness is postulated by<br />
equation (2) and the following equation is found.<br />
In Ra = -6.2+0.0117v+0.0774f-3.69d-10.4nf+0.062ol+0.000001vf-0.00060vd-0.000816vnf-<br />
0.000313vol+0.0066fd+0.00093fnf-0.00223fol+0.212dnf+0.111dol+0.389nfol+0.000000v2……(6)<br />
If the purpose is to determine the factors and factor interaction are statistically significant in<br />
predicting Ra based on 95% confidence interval, the p-value of all the independent variables must be<br />
below 0.05. The regression analysis results are shown in Table 5.<br />
The p-values are greater than 0.05 except for v, f, nf, vnf, vol, fol, nfol. The independent variables<br />
with largest p-values are eliminated one in each stage, until attaining the model with all significant<br />
independent variables. The following equation was found after eliminating all insignificant variables.<br />
Ra = -5.46+0.0108v+0.0789f-10.2nf-0.000816vnf-0.000285vol-0.00200fol+0.394nfol………….. (7)<br />
In Table 5,for 7 degree of freedom of regression and 40 degree of freedom for residual error, the F-<br />
ratio from the regression analysis is 49.49, which is greater than F-ratio from the statistical tables<br />
(2.02) and the corresponding p-value is less than 0.05 i.e. 0.001. Hence the model is significant. All<br />
the independent variables are significant since their p-value is less than 0.05 for 95% confidence<br />
interval. The R2 value is 89.6, which indicates 89.6% variability in predicting Ra with independent<br />
variables.<br />
Table 3. Regression Analysis: In Ra Vs. v, f, d, nf, ol<br />
Regression Analysis without interaction terms<br />
Ra = - 1.94 - 0.000912 v + 0.0140 f + 0.39 d + 0.534 nf<br />
+ 0.0724 ol<br />
Predictor Coef SE Coef T P<br />
Constant -1.937 2.979 -0.65 0.519<br />
V -0.0009123 0.0004522 -2.02 0.050<br />
F 0.014009 0.004616 3.03 0.004<br />
D 0.387 1.231 0.31 0.755<br />
NF 0.5335 0.1846 2.89 0.006<br />
OL 0.07236 0.07385 0.98 0.333<br />
S=1.27915 R-Sq=35.1% R-Sq(adj)=27.3%<br />
Analysis of Varience:<br />
Source DF SS MS F P<br />
Regression 5 37.126 7.425 4.54 0.002<br />
Residual error 42 68.721 1.636<br />
Total 47 105.847<br />
2045 Vol. 6, Issue 5, pp. 2041-2052