2007 Annual Report - jamstec japan agency for marine-earth ...
2007 Annual Report - jamstec japan agency for marine-earth ...
2007 Annual Report - jamstec japan agency for marine-earth ...

Create successful ePaper yourself
Turn your PDF publications into a flip-book with our unique Google optimized e-Paper software.
in the equatorial Indian Ocean<br />
Since ocean currents data observed with ADCP moorings<br />
deployed on the equator in the eastern Indian Ocean by<br />
National Institute of Oceanography, India and by Pacific<br />
Marine Environment Laboratory/National Oceanic and<br />
Atmospheric Administration, U.S.A. are available through<br />
international cooperation, we can acquire zonal structure of current<br />
profile on the equator from 80E to 90E, corresponding to<br />
off the coast of south of India to that of Sumatra. Using these<br />
data we conducted comprehensive statistical analysis <strong>for</strong> upper<br />
ocean currents. Basically the mean currents indicate vertically<br />
2-layer structure; one velocity core appears around 60 m and<br />
the other appears around 120 m, corresponding to the equatorial<br />
undercurrent. 30-50 days signal in the uppermost layer and<br />
semiannual signal in the region of equatorial undercurrent are<br />
dominant <strong>for</strong> the zonal current, whereas about 14 days signal<br />
corresponding to the mixed Rossby-gravity wave is dominant<br />
<strong>for</strong> the meridional current. We also investigated wave-propagating<br />
character from phase relationship between current property<br />
off the coast of south of India and that of the coast of Sumatra.<br />
The 35-day signal, which is predominant in the uppermost<br />
layer, propagates eastward with a phase velocity of 6.4 m s -1 .<br />
We suggest that this signal is caused by atmospheric disturbances.<br />
The semiannual signal, which is predominant in the<br />
region of the equatorial undercurrent, propagates eastward with<br />
a phase velocity of 2.4 m s -1 , corresponding to the Kelvin wave<br />
of first baroclinic mode.<br />
d. Development of the new observation system<br />
In the development of a high accuracy TRITON buoy, the<br />
measurement of sea surface temperature was conducted by<br />
using the TRITON buoy at Equator 156E under the cooperation<br />
with the Tohoku University. With the parallel operation of<br />
a large number of the next generation buoys and a small number<br />
of the high accuracy reference buoys, the development of<br />
the surface buoy network in the tropical region has progressed<br />
one step <strong>for</strong>ward <strong>for</strong> the efficient operation of the buoys and to<br />
satisfy the needs of more advanced research.<br />
Argo Group<br />
As one of the leading groups in the international Argo<br />
community, Argo Group is responsible <strong>for</strong> the deployment of<br />
Argo floats mainly in the north Pacific and <strong>for</strong> the operation of<br />
the PARC (Pacific Argo Regional Center). Argo float data is<br />
released both in real-time and in delayed mode. After receiving<br />
data from the Argos satellites, Japan Meteorological Agency<br />
releases it as real-time data to the worldwide meteorological<br />
organizations via GTS (Global Telecommunication Systems)<br />
within 24 hours, and Argo Group carries out high level quality<br />
controls to the Argo float data and sends it as delayed-mode<br />
data to GDAC (Global Data Assembly Center) within a year.<br />
Both real-time and delayed-mode data are available to anyone<br />
in the world by accessing to GDAC via internet with no charge.<br />
Using Argo float data, Argo Group conducts observational<br />
researches on several themes in the north Pacific such as seasonal<br />
to inter-annual variations, the subduction process, the <strong>for</strong>mation<br />
and transport processes of several types of mode waters,<br />
temperature and salinity variations in the subtropical and tropical<br />
regions, and the oceanic structure in the subarctic region.<br />
Argo Group is also developing a next-generation float.<br />
a. Deployment of Argo floats<br />
According to the deployment plan of FY<strong>2007</strong>, Argo Group<br />
deployed 80 floats in the Pacific, Indian, and Southern Oceans.<br />
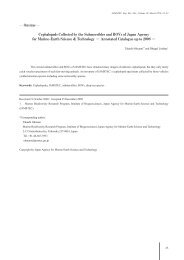
Fig. 5 (a)Time-depth section of the ocean temperature observed by the<br />
TRITON buoy at 5S, 95E. Colors (contours) denote anomalies (raw values).<br />
Contour interval is 2C. The black line indicates the mixed layer<br />
depth. (b)Terms of the mixed layer temperature balance. The black line<br />
indicates temporal change of mixed layer temperature, the red line indicates<br />
contribution of net sea surface heat fluxes, and the blue line indicates<br />
contribution of the horizontal heat advection.The unit is C/day.<br />
Terms of the mixed layer temperature balance (1) [C/day]: (a) temporal<br />
change (T/t, black) and net heat fluxes (Q net /_C p H, red); (b) T/t (black)<br />
and zonal (- UT x , red) and meridional (- VT y , blue) horizontal heat advection<br />
and their sum (-UT x -UT y , green); and (c) T/t (black) and the sum<br />
of Q net /_C p H and - UT x - VT y (gray). Also shown in (d) is the time-depth<br />
section of temporal change in ocean temperature and the MLD. In (a)-<br />
(c), light shading indicates the errors in the analysis. Details of the error<br />
estimation are presented in the Appendix.<br />
At present, 348 Argo floats owned by JAMSTEC are working<br />
well. By the great international cooperation, the global Argo<br />
float network attained the initial target of 3,000 floats at the end<br />
of October <strong>2007</strong> and maintains the same level in March 2008<br />
(Fig.1-6).<br />
b. Delayed-mode quality control of Argo float data and operation<br />
of PARC<br />
Argo Group released about 12,000 profiles as real-time<br />
data and about 16,000 profiles as delayed-mode data. PARC,<br />
which started in 2005, plays an important role to maintain the<br />
19