Presentation - Gulf of Maine Research Institute
Presentation - Gulf of Maine Research Institute
Presentation - Gulf of Maine Research Institute

Create successful ePaper yourself
Turn your PDF publications into a flip-book with our unique Google optimized e-Paper software.
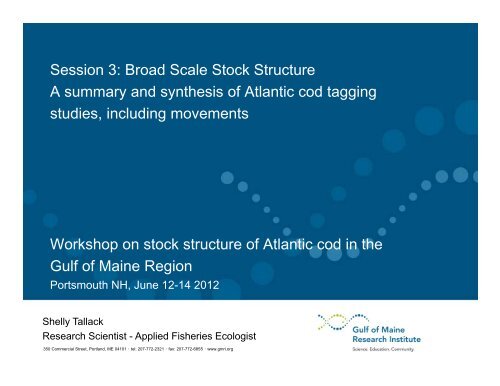
Session 3: Broad Scale Stock Structure<br />
A summary and synthesis <strong>of</strong> Atlantic cod tagging<br />
studies, including movements<br />
Workshop on stock structure <strong>of</strong> Atlantic cod in the<br />
<strong>Gulf</strong> <strong>of</strong> <strong>Maine</strong> Region<br />
Portsmouth NH, June 12-14 2012<br />
Shelly Tallack<br />
<strong>Research</strong> Scientist - Applied Fisheries Ecologist<br />
350 Commercial Street, Portland, ME 04101 ・ tel: 207-772-2321 ・ fax: 207-772-6855 ・ www.gmri.org
Overview <strong>of</strong> cod tagging studies in the region, and available data
Tagging studies and data available for Atlantic cod since 2000<br />
Primary Organization<br />
/Contact<br />
Focus Tag type No. releases No. recaptures Dates<br />
GMRI and partners,<br />
Shelly Tallack<br />
Northeast Regional Cod<br />
Tagging Program: Movement<br />
patterns <strong>of</strong> cod throughout the<br />
<strong>Gulf</strong> <strong>of</strong> <strong>Maine</strong>, Canadian<br />
Maritimes and Southern New<br />
England waters<br />
T-bar tag (yellow, orange and<br />
blue)<br />
114,467 >6,700<br />
January 2003 – July 2005<br />
(tagging trips); program<br />
overall completed in 2011<br />
SMAST,<br />
David Martins/Steve<br />
Cadrin<br />
Movement <strong>of</strong> cod tagged in:<br />
Stellwagen Bank, Western<br />
Mass. Bay, Great South<br />
Channel, Georges Bank, Cape<br />
Ann.<br />
T-bar tags (yellow); DSTs in later<br />
years (2005 onwards) to<br />
address spawning fish<br />
movements<br />
>25,000* >1,160* August 2000 to present<br />
UNH,<br />
Hunt Howell<br />
Movement <strong>of</strong> cod tagged in<br />
Inshore GOM<br />
T-bar tag (yellow and orange) 24,466* 1,835* 2001-2004<br />
UNH,<br />
Hunt Howell<br />
Vertical activity and fine-scale<br />
distribution <strong>of</strong> cod in Ipswich<br />
Bay spawning ground<br />
DSTs & acoustic tags<br />
200 DSTs and 25<br />
acoustic<br />
26 DSTs (13%),<br />
plus live tracking<br />
<strong>of</strong> acoustic tags<br />
2006/2007<br />
DFO (St. Andrews),<br />
Don Clark<br />
Movement <strong>of</strong> cod tagged in the<br />
Bay <strong>of</strong> Fundy and on the Scotia<br />
Shelf<br />
T-bar tags (orange) 16,922* 715* 2000 – 2003<br />
Stellwagen Bank<br />
Nat. Mar. Sanct.,<br />
James Lindholm<br />
Site fidelity at deep boulder<br />
reefs & Site utilization in<br />
<strong>of</strong>fshore gravel habitat<br />
Acoustic tags 65 56 2003-2005<br />
SMAST,<br />
Doug Zemeckis<br />
Movements <strong>of</strong> spawning cod in<br />
WGOM<br />
Acoustic tags 63 22 2009-2011<br />
* Tag numbers reflect those data quality controlled and standardized into the same format as the larger Northeast Regional Cod Tagging Program (additional data may<br />
be available).
Data synopsis by region
Analyses undertaken to interpret movement & migration patterns<br />
• Fish size effects (sources for recaptures, by fish size)<br />
• Circular statistics on displacement (distance/direction)<br />
• Investigation into homing patterns<br />
• Seasonal effects (animations <strong>of</strong> seasonal recaptures)<br />
Mean distance moved (km)<br />
250<br />
200<br />
150<br />
100<br />
50<br />
0<br />
73-92cm<br />
Fall Fall Fall<br />
Recapture season
New analysis - Bivariate boxplot (bagplot) analysis<br />
• Acknowledgement: David Martins<br />
(formerly SMAST, now MA DMF).<br />
• A statistical approach to interpreting<br />
the dispersal <strong>of</strong> raw release and<br />
recapture data.<br />
• A bagplot = a convex polygon plotted<br />
around a bivariate median <strong>of</strong> a<br />
distribution (Rousseeuw et al., 1999).<br />
• Identifies areas <strong>of</strong> recapture density,<br />
but also outlier recaptures.<br />
Interquartile<br />
range<br />
Median dist.<br />
‘Fence’<br />
Outliers<br />
‘Inliers’ (~1.5 times<br />
interquartile range)
Western GOM / Inshore GOM<br />
• Few recaptures came from outside <strong>of</strong> the I GOM area; <strong>of</strong>fshore movements are<br />
outliers;<br />
• North-south ‘shuffle’ along the coast is evident;<br />
• Defined as ‘sedentary and resident’ by Howell et al. (2008);<br />
• Reiterated by analysis <strong>of</strong> combined NRCTP, UNH and SMAST data sets.
Western GOM / Inshore GOM
Western GOM / Inshore GOM – Recruitment from Cape Cod
Western GOM / Inshore GOM: Fine-scale studies<br />
• Fine-scale study in Ipswich Bay (Sicel<strong>of</strong>f<br />
& Howell, 2012):<br />
UNH acoustic tracking<br />
(Courtesy Hunt Howell & Laughlin Sicel<strong>of</strong>f)<br />
– Live tracking <strong>of</strong> acoustic tags (n=26)<br />
– DSTs (n=200 releases, 26 recaptures);<br />
• Verified that the spring spawning group:<br />
– Utilizes a limited area (
Scotian Shelf / Bay <strong>of</strong> Fundy / Browns Bank
Scotian Shelf / Bay <strong>of</strong> Fundy / Browns Bank<br />
• NRCTP releases in the B <strong>of</strong> F:<br />
– Most movements confined to the bay during spring/summer;<br />
– Southward movements to Georges Bank / Georges Basin in fall.<br />
– Little exchange with GOM; contrasts with mixing estimates <strong>of</strong> 15-20% by Hunt<br />
et al. (1999).<br />
• Historic studies: report a connection between Browns Bank and<br />
the ‘north’ (Scotian Shelf) and ‘north east’ (Bay <strong>of</strong> Fundy) (Higgins,<br />
1931).
Scotian Shelf / Bay <strong>of</strong> Fundy / Browns Bank<br />
• Releases in the B <strong>of</strong> F: move within the bay, and southwards towards deeper<br />
waters <strong>of</strong> Georges Basin; movements to GB are categorized as ‘outliers’.<br />
• Releases on Browns Bank: dispersed to Bay <strong>of</strong> Fundy, Georges Bank and<br />
central GOM.
Georges Bank
Georges Bank<br />
• Based on 1,086 recaptures:<br />
– Considerable cross-bank movement;<br />
– Some dispersal evident:<br />
• North to Bay <strong>of</strong> Fundy and CA waters<br />
• West to inshore waters.<br />
– But, <strong>of</strong>f-bank movements were found to be<br />
‘outliers’;
Cape Cod, Great South Channel, Nantucket Shoals, Block Island
Cape Cod, Great South Channel, Nantucket Shoals<br />
• High tagging effort by the NRCTP<br />
(>50,000 releases); these cod<br />
tended to be smaller (
Block Island<br />
• Relatively few cod found/tagged<br />
in this area until 2005 onwards;<br />
• Movements were mostly limited;<br />
those further afield were ‘outliers’.<br />
• In contrast to historic studies:<br />
little connection with southern<br />
waters <strong>of</strong> RI and NC (Higgins,<br />
1929; Schroeder, 1930)
Mid-Atlantic Bight (recaptures only)<br />
• Very little information<br />
for this area from<br />
studies since 2000;<br />
• Historic studies:<br />
– Linkages between<br />
southern MA waters and<br />
NC (Higgins, 1929)<br />
– Fall migration from<br />
Nantucket Shoals to<br />
RI/NC region<br />
(Schroeder, 1930).
Proposed “passages” <strong>of</strong> cod travel (raw data)<br />
GOM (5Y)<br />
SS (4X)<br />
GB (5Z)<br />
Sub-legal cod:<br />
• Recruiting to 2 stocks<br />
• Currently “GB/5Z”
Revised ‘passages’ <strong>of</strong> cod travel (after bagplots)
Attempts to quantify cod movements for application to stock<br />
assessments
Quantification <strong>of</strong> exchange between areas – GARM focused<br />
GOM (5Y)<br />
? %<br />
? %<br />
SS (4X)<br />
GB (5Z)<br />
What % is<br />
significant?
Attempts to quantify movements/mixing estimates<br />
• Two attempts on NRCTP data presented at the pre-GARM<br />
workshops:<br />
1. Tallack (2007, 2012): Weighting model(s)<br />
2. Miller & Tallack (2007): Finite-state continuous-time approach (FSTA)<br />
• FSTA model shows most promise for linking with current stock<br />
assessments because it also estimates F and M;<br />
• Further refinement needed for both models before either is<br />
conclusive.<br />
Miller T. & Tallack S. (2007), Estimating instantaneous rates <strong>of</strong> regional migration and mortality from conventional tagging data. DRAFT REPORT:<br />
Submitted to National Marine Fisheries Service, Pre-GARM working group, WP3D, October 2007. Northeast Fisheries Science Center, Woods Hole, MA:<br />
10 pp.<br />
Tallack, S.M.L., (2007). A description <strong>of</strong> tagging data from the Northeast Regional Cod Tagging Program (WP3A) and preliminary applications <strong>of</strong> weighting<br />
and mixing analysis (WP3C). DRAFT REPORT: Submitted to National Marine Fisheries Service, Pre-GARM working group. Northeast Fisheries Science<br />
Center, Woods Hole, MA, Working Papers 3A & 3C, 60 pp.<br />
Tallack, S.M.L., (2012). Stock identification applications <strong>of</strong> conventional tagging data for Atlantic cod in the <strong>Gulf</strong> <strong>of</strong> <strong>Maine</strong>. Submitted to: Advances in Fish<br />
Tagging and Marking Techniques, AFS, Proceedings from the International Symposium on 'Advances in Fish Tagging and Marking Techniques', Auckland,<br />
NZ, February 24-28th, 2008.
Major conclusions from tagging data with regard stock structure
Key conclusions from tagging data<br />
1. The connection between Cape Cod fish (5Z) and the Inshore<br />
GOM stocks (5Y) appears to be unquestionable - Inshore GOM<br />
fish appear relatively resident to the area, with additional<br />
recruitment <strong>of</strong> younger fish from waters around Cape Cod.<br />
2. Georges Bank fish are a largely self-sustaining <strong>of</strong>fshore<br />
population that mixes with the Scotian Shelf and Bay <strong>of</strong> Fundy<br />
fish.<br />
3. The Bay <strong>of</strong> Fundy retains a good portion <strong>of</strong> its cod, but mixing<br />
with the <strong>of</strong>fshore banks (Georges Bank and Browns Bank) is<br />
also evident.<br />
4. From recent movement studies, little can be said about cod in<br />
the Mid-Atlantic Bight and more southern waters.
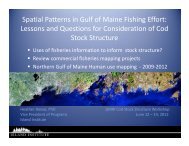
Current and alternative stock management boundaries<br />
Alternative 1<br />
Current<br />
Alternative 2
Additional research required for stock structure determination
• Many gaps remain in our understanding <strong>of</strong> GOM cod population structure:<br />
– Some answers may come from additional analyses on current tagging data.<br />
– Additional integrated spatial studies are also needed (tagging, movement, genetic,<br />
habitat, environmental…).<br />
• Top research priority:<br />
“Recent and historical cod tagging data (and genetic data) suggest<br />
substantial movements across current stock boundaries and considerable<br />
heterogeneity within current management units. Best available science<br />
indicates the need to re-visit, re-analyze and re-assess the stock<br />
management boundaries.”<br />
Tallack, S.M.L., 2009. Proceedings from a workshop to identify future research priorities for cod tagging in the <strong>Gulf</strong> <strong>of</strong> <strong>Maine</strong>. Northeast Fisheries Science<br />
Center Reference Document. US Department <strong>of</strong> Commerce, 09-09, 76 pp.
Key research needs outlined<br />
• Theme 1 – Cod Management:<br />
– Interdisciplinary assessment <strong>of</strong> cod management boundaries;<br />
– Investigate options for alternative management scales;<br />
– Expand research to earlier life-stages.<br />
• Theme 2 – Data mining, re-analysis, modeling:<br />
– Meta-analysis <strong>of</strong> historical mark-recapture datasets (particularly for the period<br />
since 2000);<br />
– Stock assessment applications <strong>of</strong> tagging data and parameters we can derive<br />
from these data, e.g. natural mortality, fishing mortality, growth, selectivity.<br />
• Theme 4 – Reporting rates/outreach efficacy – to improve our<br />
interpretation <strong>of</strong> tagging data.
Key research needs outlined (cont.)<br />
• Theme 5 – Additional deployment <strong>of</strong> tags on cod:<br />
– Juvenile cod: habitat usage, movements, dispersal from nursery grounds to<br />
adult stocks;<br />
– Spawning cod: address all major spawning grounds to investigate, natal<br />
homing, long-term spawning movements, timing <strong>of</strong> spawning, critical habitats,<br />
etc.;<br />
– Fine-scale investigations to improve our understanding <strong>of</strong> critical habitats;<br />
– Multi-year, long-term tagging with consistent tag releases over time and by<br />
area;<br />
– Advanced tagging technologies, e.g. acoustic arrays in strategic areas;<br />
– Closed-area investigations: critical habitat, size, timing, etc;<br />
– Incorporate additional ecology & biology within future tagging studies.
Acknowledgements<br />
• Analytical contributions by: Steve Cadrin (SMAST), Mark Terceiro<br />
(NEFSC), Loretta O’Brien (NEFSC), Ralph Mayo (NEFSC), Tim Miller<br />
(NEFSC), David Martins (MA DMF), and Don Clark (DFO).<br />
• Data contributions by: Northeast Regional Cod Tagging Program; Hunt<br />
Howell (UNH); Don Clark (DFO); David Martins (SMAST).<br />
• These studies would not be possible without the effort invested by various<br />
funding bodies, including NOAA’s Cooperative <strong>Research</strong> Program, and<br />
numerous scientists and members <strong>of</strong> the commercial and recreational<br />
fishing industry. See www.codresearch.org for full list.<br />
~50 scientists >106<br />
vessels