Building for a brighter future - GHA Central
Building for a brighter future - GHA Central Building for a brighter future - GHA Central
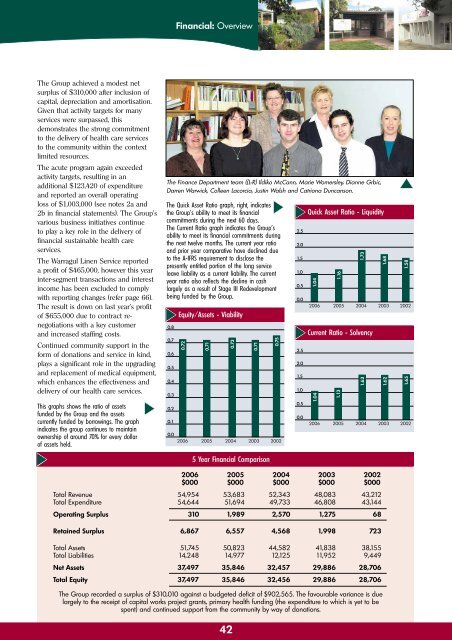
Financial: Overview The Group achieved a modest net surplus of $310,000 after inclusion of capital, depreciation and amortisation. Given that activity targets for many services were surpassed, this demonstrates the strong commitment to the delivery of health care services to the community within the context limited resources. The acute program again exceeded activity targets, resulting in an additional $123,420 of expenditure and reported an overall operating loss of $1,003,000 (see notes 2a and 2b in financial statements). The Group’s various business initiatives continue to play a key role in the delivery of financial sustainable health care services. The Warragul Linen Service reported a profit of $465,000, however this year inter-segment transactions and interest income has been excluded to comply with reporting changes (refer page 66). The result is down on last year’s profit of $655,000 due to contract renegotiations with a key customer and increased staffing costs. Continued community support in the form of donations and service in kind, plays a significant role in the upgrading and replacement of medical equipment, which enhances the effectiveness and delivery of our health care services. This graphs shows the ratio of assets funded by the Group and the assets currently funded by borrowings. The graph indicates the group continues to maintain ownership of around 70% for every dollar of assets held. The Finance Department team ((L-R) Ildiko McCann, Marie Womersley, Dianne Grbic, Darren Warwick, Colleen Lacorcia, Justin Walsh and Catriona Duncanson. The Quick Asset Ratio graph, right, indicates the Group’s ability to meet its financial commitments during the next 60 days. The Current Ratio graph indicates the Group’s ability to meet its financial commitments during the next twelve months. The current year ratio and prior year comparative have declined due to the A-IFRS requirement to disclose the presently entitled portion of the long service leave liability as a current liability. The current year ratio also reflects the decline in cash largely as a result of Stage III Redevelopment being funded by the Group. 0.8 0.7 0.6 0.5 0.4 0.3 0.2 0.1 0.0 2006 Equity/Assets - Viability 0.72 0.71 2005 0.73 2004 0.71 2003 5 Year Financial Comparison 0.75 2002 2.5 2.0 1.5 1.0 0.5 0.0 2.5 2.0 1.5 1.0 0.5 0.0 Quick Asset Ratio - Liquidity 1.04 2006 1.04 2006 1.16 2005 1.13 2005 1.73 2004 Current Ratio - Solvency 1.63 2004 1.68 2003 1.62 2003 1.58 2002 1.65 2002 2006 2005 2004 2003 2002 $000 $000 $000 $000 $000 Total Revenue 54,954 53,683 52,343 48,083 43,212 Total Expenditure 54,644 51,694 49,733 46,808 43,144 Operating Surplus 310 1,989 2,570 1,275 68 RetainedSurplus 6,867 6,557 4,568 1,998 723 Total Assets 51,745 50,823 44,582 41,838 38,155 Total Liabilities14,248 14,977 12,125 11,952 9,449 Net Assets 37,497 35,846 32,457 29,886 28,706 Total Equity 37,497 35,846 32,456 29,886 28,706 The Group recorded a surplus of $310,010 against a budgeted deficit of $902,565. The favourable variance is due largely to the receipt of capital works project grants, primary health funding (the expenditure to which is yet to be spent) and continued support from the community by way of donations. 42
Financial: Financial Results OPERATING STATEMENT FOR THE YEAR ENDED 30 JUNE 2006 Revenue from Operating Activities 2,2a 51,953 49,273 Revenue from Non-operating Activities 2,2a 1,225 1,473 53,177 50,747 Employee Benefits 2b (36,247) (33,609) Non Salary Labour Costs 2b (3,313) (3,498) Supplies and Consumables 2b (4,986) (4,633) Other Expenses from Continuing Operations 2b (7,219) (7,347) (51,764) (49,088) Net Result From Continuing Operations Before Capital & Specific Items 1,414 1,659 Capital Purpose Income 2,2a 1,777 2,921 Depreciation and Amortisation 3 (2,769) (2,607) Assets Provided Free of Charge 2,2a, 2e 16 Expenditure Using Capital Purpose Income 2b (112) NET RESULT FOR THE YEAR 310 1,989 This Statement should be read in conjunction with the accompanying notes. Notes 2006 2005 ($’000) ($’000) 43
- Page 1 and 2: Building for a brighter future West
- Page 3 and 4: Overview: Year in Brief Significant
- Page 5 and 6: Overview: At a glance INFORMATION M
- Page 7 and 8: Overview: Year in Review Human Reso
- Page 9 and 10: Overview: Our Profile What we do Ho
- Page 11 and 12: Overview: Overall Performance Expen
- Page 13 and 14: Overview: Overall Performance Debto
- Page 15 and 16: Corporate Governance: Board of Dire
- Page 17 and 18: Corporate Governance: Organisation
- Page 19 and 20: Our People: Occupational Health and
- Page 21 and 22: Review of Operations: Environment a
- Page 23 and 24: Review of Operations: Quality Repor
- Page 25 and 26: Review of Operations: Quality Repor
- Page 27 and 28: Review of Operations: Quality Repor
- Page 29 and 30: Review of Operations: Acute (Hospit
- Page 31 and 32: Review of Operations: Acute (Hospit
- Page 33 and 34: Review of Operations: Aged Care Ser
- Page 35 and 36: Review of Operations: Community Ser
- Page 37 and 38: Review of Operations: Allied Health
- Page 39 and 40: Our Community: Volunteers We enjoy
- Page 41 and 42: Our Community: Donations and Sponso
- Page 43: Staff List: Our Staff Allied Health
- Page 47 and 48: Financial: Financial Results STATEM
- Page 49 and 50: Financial: Financial Results Notes
- Page 51 and 52: Financial: Financial Results Notes
- Page 53 and 54: Financial: Financial Results Notes
- Page 55 and 56: Financial: Financial Results Notes
- Page 58 and 59: Financial: Financial Results Notes
- Page 60 and 61: Financial: Financial Results Notes
- Page 62 and 63: Financial: Financial Results Notes
- Page 64 and 65: Financial: Financial Results Notes
- Page 66 and 67: Financial: Financial Results Notes
- Page 68 and 69: Financial: Financial Results Notes
- Page 70 and 71: Financial: Financial Results Notes
- Page 72 and 73: Financial: Auditor General’s Repo
- Page 74 and 75: Appendices Statement of Fees and Ch
- Page 76 and 77: Appendices Compliance Index Financi
- Page 78 and 79: Index A Aboriginal Services 32 Acce
- Page 80: Head Office: West Gippsland Hospita
Financial: Overview<br />
The Group achieved a modest net<br />
surplus of $310,000 after inclusion of<br />
capital, depreciation and amortisation.<br />
Given that activity targets <strong>for</strong> many<br />
services were surpassed, this<br />
demonstrates the strong commitment<br />
to the delivery of health care services<br />
to the community within the context<br />
limited resources.<br />
The acute program again exceeded<br />
activity targets, resulting in an<br />
additional $123,420 of expenditure<br />
and reported an overall operating<br />
loss of $1,003,000 (see notes 2a and<br />
2b in financial statements). The Group’s<br />
various business initiatives continue<br />
to play a key role in the delivery of<br />
financial sustainable health care<br />
services.<br />
The Warragul Linen Service reported<br />
a profit of $465,000, however this year<br />
inter-segment transactions and interest<br />
income has been excluded to comply<br />
with reporting changes (refer page 66).<br />
The result is down on last year’s profit<br />
of $655,000 due to contract renegotiations<br />
with a key customer<br />
and increased staffing costs.<br />
Continued community support in the<br />
<strong>for</strong>m of donations and service in kind,<br />
plays a significant role in the upgrading<br />
and replacement of medical equipment,<br />
which enhances the effectiveness and<br />
delivery of our health care services.<br />
This graphs shows the ratio of assets<br />
funded by the Group and the assets<br />
currently funded by borrowings. The graph<br />
indicates the group continues to maintain<br />
ownership of around 70% <strong>for</strong> every dollar<br />
of assets held.<br />
The Finance Department team ((L-R) Ildiko McCann, Marie Womersley, Dianne Grbic,<br />
Darren Warwick, Colleen Lacorcia, Justin Walsh and Catriona Duncanson.<br />
The Quick Asset Ratio graph, right, indicates<br />
the Group’s ability to meet its financial<br />
commitments during the next 60 days.<br />
The Current Ratio graph indicates the Group’s<br />
ability to meet its financial commitments during<br />
the next twelve months. The current year ratio<br />
and prior year comparative have declined due<br />
to the A-IFRS requirement to disclose the<br />
presently entitled portion of the long service<br />
leave liability as a current liability. The current<br />
year ratio also reflects the decline in cash<br />
largely as a result of Stage III Redevelopment<br />
being funded by the Group.<br />
0.8<br />
0.7<br />
0.6<br />
0.5<br />
0.4<br />
0.3<br />
0.2<br />
0.1<br />
0.0<br />
2006<br />
Equity/Assets - Viability<br />
0.72<br />
0.71<br />
2005<br />
0.73<br />
2004<br />
0.71<br />
2003<br />
5 Year Financial Comparison<br />
0.75<br />
2002<br />
2.5<br />
2.0<br />
1.5<br />
1.0<br />
0.5<br />
0.0<br />
2.5<br />
2.0<br />
1.5<br />
1.0<br />
0.5<br />
0.0<br />
Quick Asset Ratio - Liquidity<br />
1.04<br />
2006<br />
1.04<br />
2006<br />
1.16<br />
2005<br />
1.13<br />
2005<br />
1.73<br />
2004<br />
Current Ratio - Solvency<br />
1.63<br />
2004<br />
1.68<br />
2003<br />
1.62<br />
2003<br />
1.58<br />
2002<br />
1.65<br />
2002<br />
2006 2005 2004 2003 2002<br />
$000 $000 $000 $000 $000<br />
Total Revenue 54,954 53,683 52,343 48,083 43,212<br />
Total Expenditure 54,644 51,694 49,733 46,808 43,144<br />
Operating Surplus 310 1,989 2,570 1,275 68<br />
RetainedSurplus 6,867 6,557 4,568 1,998 723<br />
Total Assets 51,745 50,823 44,582 41,838 38,155<br />
Total Liabilities14,248 14,977 12,125 11,952 9,449<br />
Net Assets 37,497 35,846 32,457 29,886 28,706<br />
Total Equity 37,497 35,846 32,456 29,886 28,706<br />
The Group recorded a surplus of $310,010 against a budgeted deficit of $902,565. The favourable variance is due<br />
largely to the receipt of capital works project grants, primary health funding (the expenditure to which is yet to be<br />
spent) and continued support from the community by way of donations.<br />
42


