Building for a brighter future - GHA Central
Building for a brighter future - GHA Central
Building for a brighter future - GHA Central

You also want an ePaper? Increase the reach of your titles
YUMPU automatically turns print PDFs into web optimized ePapers that Google loves.
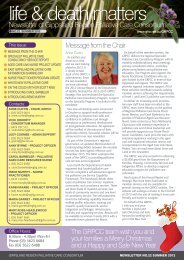
Overview: Overall Per<strong>for</strong>mance<br />
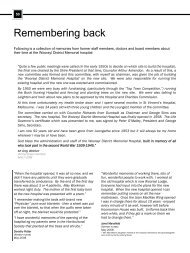
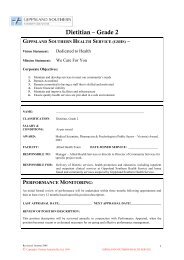
Expenditure by Category ($’000)<br />
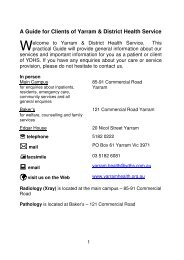
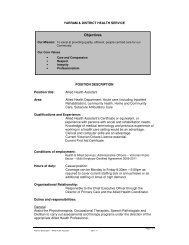
5 Year WIES Comparison<br />
6M<br />
5M<br />
4M<br />
3M<br />
2M<br />
1M<br />
0M<br />
Employee<br />
Benefits 36,247<br />
2,753<br />
Fee <strong>for</strong> Service<br />
Medical Officers<br />
5,627<br />
Administrative<br />
Expenses<br />
4,986<br />
Supplies and<br />
Consumables<br />
2,769<br />
Depreciation and<br />
Amortisation<br />
839<br />
Fuel, Light<br />
and Power<br />
843<br />
Repairs and<br />
Maintenance<br />
581<br />
Patient Transport<br />
WIES<br />
6800<br />
6600<br />
6400<br />
6200<br />
6000<br />
5800<br />
5600<br />
5400<br />
5200<br />
5000<br />
EXCESS = 55 $123,420<br />
2005/<br />
06<br />
Actual WIES<br />
EXCESS = 118 $264,792<br />
2004/<br />
05<br />
EXCESS = 135 $317,570<br />
2003/<br />
04<br />
FINANCIAL YEAR<br />
EXCESS = 285 $819,060<br />
Target WIES<br />
2002/<br />
03<br />
EXCESS = 340 $1,004,960<br />
2001/<br />
02<br />
WGHG exceeded its<br />
target public/private<br />
WIES set by the<br />
Department of<br />
Human Services by<br />
55. This represents<br />
$123,420 in lost<br />
revenue. Over the<br />
past five years,<br />
WGHG has<br />
exceeded its target<br />
by 933 WIES which<br />
at current funding<br />
rates equates to<br />
$2,529,802 in lost<br />
revenue.<br />
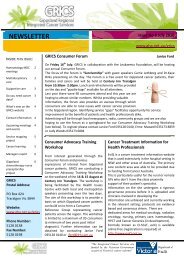
Separations by Top 10 Major Diagnostic Category 2006<br />
2000<br />
1600<br />
1,959<br />
1200<br />
800<br />
400<br />
0<br />
675<br />
Renal Dialysis<br />
585<br />
Chemotherapy<br />
424<br />
Neonatal<br />
vaginal<br />
Delivery<br />
152<br />
Dental Extractions<br />
123<br />
Red Blood cell<br />
Disorders<br />
113<br />
Skin/Subcutaneous<br />
Tissue<br />
102<br />
Lymphoma/N-A<br />
Leukaemia<br />
90<br />
Caesarean<br />
Delivery<br />
90<br />
Uterine and<br />
Adnexa Procedures<br />
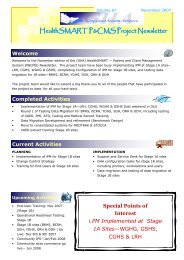
5 Year Financial Comparison<br />
55,000<br />
50,000<br />
45,000<br />
2006<br />
2005 2004 2003 2002<br />
40,000<br />
35,000<br />
30,000<br />
$000’s<br />
25,000<br />
20,000<br />
15,000<br />
10,000<br />
5,000<br />
0<br />
Total Revenue Total Expenditure Operating Surplus Total Assets Total Liabilities Net Assets<br />
Total Equity<br />
The Group recorded a surplus of $310,010 against a budgeted deficit of $902,565. The favourable variance is due largely to the receipt of capital works<br />
project grants, primary health funding (the expenditure to which is yet to be spent) and continued support from the community by way of donations.<br />
9