IEA Solar Heating and Cooling Programm - NachhaltigWirtschaften.at
IEA Solar Heating and Cooling Programm - NachhaltigWirtschaften.at IEA Solar Heating and Cooling Programm - NachhaltigWirtschaften.at
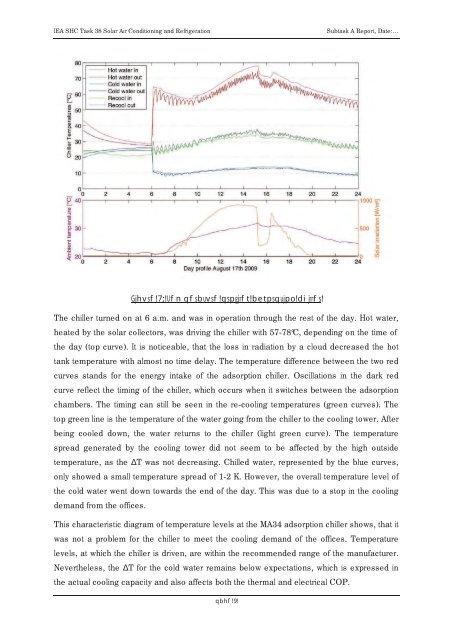
IEA SHC Task 38 Solar Air Conditioning and Refrigeration Subtask A Report, Date:… Starting from the nominal cooling capacity of the SorTech chiller, the maximum daily cooling energy can be determined. A 7.5 kW chiller can yield a maximum of 180 kWh of cooling energy per day, assuming incessant operation. The number of operation hours in a solar cooling system, however, can be limited by the heat source. An six-hour long operation would ideally still yield 45 kWh of cooling energy. Figure 5 shows daily cooling energies between 0 and 23 kWh. The values vary according to the control strategy, which indirectly reacts to the outside temperature and solar radiation. In addition, the consumer behaviour must be taken into account. Constant low values of the cooling capacity imply that the chiller is over-sized for the system. Apart from the energy output of the system, it is also very important to look at temperature levels going in and out the adsorption chiller, as the hot side and the re-cooling temperature levels can drastically influence the performance. Figure 6 shows the inlet and outlet temperatures on all three temperature levels at the chiller for a typical August day. The monitored outside temperature and solar irradiation can be found in the lower graph. The outside temperature peaked at 32°C and the solar ir radiation reached 917 W/m2. Overall, it was a bright sunny day with a cloudy passage in the afternoon.
IEA SHC Task 38 Solar Air Conditioning and Refrigeration Subtask A Report, Date:… The chiller turned on at 6 a.m. and was in operation through the rest of the day. Hot water, heated by the solar collectors, was driving the chiller with 57-78°C, depending on the time of the day (top curve). It is noticeable, that the loss in radiation by a cloud decreased the hot tank temperature with almost no time delay. The temperature difference between the two red curves stands for the energy intake of the adsorption chiller. Oscillations in the dark red curve reflect the timing of the chiller, which occurs when it switches between the adsorption chambers. The timing can still be seen in the re-cooling temperatures (green curves). The top green line is the temperature of the water going from the chiller to the cooling tower. After being cooled down, the water returns to the chiller (light green curve). The temperature spread generated by the cooling tower did not seem to be affected by the high outside temperature, as the T was not decreasing. Chilled water, represented by the blue curves, only showed a small temperature spread of 1-2 K. However, the overall temperature level of the cold water went down towards the end of the day. This was due to a stop in the cooling demand from the offices. This characteristic diagram of temperature levels at the MA34 adsorption chiller shows, that it was not a problem for the chiller to meet the cooling demand of the offices. Temperature levels, at which the chiller is driven, are within the recommended range of the manufacturer. Nevertheless, the T for the cold water remains below expectations, which is expressed in the actual cooling capacity and also affects both the thermal and electrical COP.
- Page 187 and 188: IEA SHC Task 38 Solar Air Condition
- Page 189 and 190: IEA SHC Task 38 Solar Air Condition
- Page 191 and 192: IEA SHC Task 38 Solar Air Condition
- Page 193 and 194: IEA SHC Task 38 Solar Air Condition
- Page 195 and 196: IEA SHC Task 38 Solar Air Condition
- Page 197 and 198: IEA SHC Task 38 Solar Air Condition
- Page 199 and 200: IEA SHC Task 38 Solar Air Condition
- Page 201 and 202: IEA SHC Task 38 Solar Air Condition
- Page 203 and 204: Task 38 Solar Air-Conditioning and
- Page 205 and 206: IEA SHC Task 38 Solar Air Condition
- Page 207 and 208: IEA SHC Task 38 Solar Air Condition
- Page 209 and 210: IEA SHC Task 38 Solar Air Condition
- Page 211 and 212: IEA SHC Task 38 Solar Air Condition
- Page 213 and 214: IEA SHC Task 38 Solar Air Condition
- Page 215 and 216: IEA SHC Task 38 Solar Air Condition
- Page 217 and 218: IEA SHC Task 38 Solar Air Condition
- Page 219 and 220: IEA SHC Task 38 Solar Air Condition
- Page 221 and 222: IEA SHC Task 38 Solar Air Condition
- Page 223 and 224: IEA SHC Task 38 Solar Air Condition
- Page 225 and 226: IEA SHC Task 38 Solar Air Condition
- Page 227 and 228: IEA SHC Task 38 Solar Air Condition
- Page 229 and 230: IEA SHC Task 38 Solar Air Condition
- Page 231 and 232: IEA SHC Task 38 Solar Air Condition
- Page 233 and 234: IEA SHC Task 38 Solar Air Condition
- Page 235 and 236: IEA SHC Task 38 Solar Air Condition
- Page 237: IEA SHC Task 38 Solar Air Condition
- Page 242 and 243: IEA SHC Task 38 Solar Air Condition
- Page 244 and 245: IEA SHC Task 38 Solar Air Condition
- Page 246 and 247: IEA SHC Task 38 Solar Air Condition
- Page 248 and 249: IEA SHC Task 38 Solar Air Condition
- Page 250 and 251: IEA SHC Task 38 Solar Air Condition
- Page 252 and 253: IEA SHC Task 38 Solar Air Condition
- Page 254 and 255: IEA SHC Task 38 Solar Air Condition
- Page 256 and 257: IEA SHC Task 38 Solar Air Condition
- Page 258 and 259: IEA SHC Task 38 Solar Air Condition
- Page 260 and 261: Task 38 Solar Air-Conditioning and
- Page 262 and 263: - - - - - - - - - - -
- Page 264 and 265: - - - - - - - - - - -
- Page 266 and 267: Pompe évaporateur + compteur C3 Dr
- Page 268 and 269: 80 70 Temperature (°C) 60 50 40 3
- Page 270 and 271: Power (kW) 20 19 18 17 16 15 14 13
- Page 272 and 273: Power (kW) 20 19 18 17 16 15 14 13
- Page 274 and 275: Task 38 Solar Air-Conditioning and
- Page 276 and 277: IEA SHC Task 38 Solar Air Condition
- Page 278 and 279: IEA SHC Task 38 Solar Air Condition
- Page 280 and 281: IEA SHC Task 38 Solar Air Condition
- Page 282 and 283: IEA SHC Task 38 Solar Air Condition
- Page 284 and 285: IEA SHC Task 38 Solar Air Condition
- Page 286 and 287: IEA SHC Task 38 Solar Air Condition
<strong>IEA</strong> SHC Task 38 <strong>Solar</strong> Air Conditioning <strong>and</strong> Refriger<strong>at</strong>ion<br />
Subtask A Report, D<strong>at</strong>e:…<br />
<br />
The chiller turned on <strong>at</strong> 6 a.m. <strong>and</strong> was in oper<strong>at</strong>ion through the rest of the day. Hot w<strong>at</strong>er,<br />
he<strong>at</strong>ed by the solar collectors, was driving the chiller with 57-78°C, depending on the time of<br />
the day (top curve). It is noticeable, th<strong>at</strong> the loss in radi<strong>at</strong>ion by a cloud decreased the hot<br />
tank temper<strong>at</strong>ure with almost no time delay. The temper<strong>at</strong>ure difference between the two red<br />
curves st<strong>and</strong>s for the energy intake of the adsorption chiller. Oscill<strong>at</strong>ions in the dark red<br />
curve reflect the timing of the chiller, which occurs when it switches between the adsorption<br />
chambers. The timing can still be seen in the re-cooling temper<strong>at</strong>ures (green curves). The<br />
top green line is the temper<strong>at</strong>ure of the w<strong>at</strong>er going from the chiller to the cooling tower. After<br />
being cooled down, the w<strong>at</strong>er returns to the chiller (light green curve). The temper<strong>at</strong>ure<br />
spread gener<strong>at</strong>ed by the cooling tower did not seem to be affected by the high outside<br />
temper<strong>at</strong>ure, as the T was not decreasing. Chilled w<strong>at</strong>er, represented by the blue curves,<br />
only showed a small temper<strong>at</strong>ure spread of 1-2 K. However, the overall temper<strong>at</strong>ure level of<br />
the cold w<strong>at</strong>er went down towards the end of the day. This was due to a stop in the cooling<br />
dem<strong>and</strong> from the offices.<br />
This characteristic diagram of temper<strong>at</strong>ure levels <strong>at</strong> the MA34 adsorption chiller shows, th<strong>at</strong> it<br />
was not a problem for the chiller to meet the cooling dem<strong>and</strong> of the offices. Temper<strong>at</strong>ure<br />
levels, <strong>at</strong> which the chiller is driven, are within the recommended range of the manufacturer.<br />
Nevertheless, the T for the cold w<strong>at</strong>er remains below expect<strong>at</strong>ions, which is expressed in<br />
the actual cooling capacity <strong>and</strong> also affects both the thermal <strong>and</strong> electrical COP.


