IEA Solar Heating and Cooling Programm - NachhaltigWirtschaften.at
IEA Solar Heating and Cooling Programm - NachhaltigWirtschaften.at IEA Solar Heating and Cooling Programm - NachhaltigWirtschaften.at
IEA SHC Task 38 Solar Air Conditioning and Refrigeration Subtask A Report A-D3b, Date: December 2010 Fractional primary energy savings, - 100% 80% 60% 40% 20% 0% -20% -40% -60% -80% Nov Dec Jan Feb Mar Apr Graz 09/10 Chambéry 09/10 Butzbach 2009 Gröbming 09/10 Freiburg 09/10 Figure 8: Fractional primary energy savings for the winter months for the 5 systems where sufficient monitoring data is available (assuming backup with gas boiler for all systems) 3.6 Collector Yield Another interesting figure is the reached collector yield. Only 6 systems were monitored over a whole year of operation. Figure 9 shows the annual collector yield of these 6 systems. The reached values range from 250 kWh / (m² a) to slightly over 400 kWh / (m² a). Of course the collector yield depends very much on the system concept and the energy management strategy. Monitoring shows that high values around 400 kWh / (m² a) are possible. The systems with significantly lower values very likely still have optimization potential. For example, the system in Freiburg uses solar energy only if it reaches the temperature required to drive the heat pump and not for preheating. Annual collector yield, kWh/(m 2 a) 450 400 350 300 250 200 150 100 50 0 Qcoll - Task 38 Monitoring Systems Subtask A Annual Perpignan 2009 Graz 09/10 Chambéry 09/10 Butzbach 2009 Garching 2009 Freiburg 09/10 Figure 9: Annual collector yield of the 6 systems with a complete year of monitoring data 3.7 Water Consumption Cooling Towers For 5 systems the water consumption of the wet or hybrid cooling towers was measured. A sixth system (Freiburg) had no water consumption at all because boreholes were used for rejecting heat. page 56
IEA SHC Task 38 Solar Air Conditioning and Refrigeration Subtask A Report A-D3b, Date: December 2010 The Figure 10 shows that the data scatter a lot for the different months and systems. There are some values of 0; this means that the value was not measured for this particular system and this particular month. The reasons for scattering data are on one hand different weather conditions in the different locations and months as well as the different technologies. The systems in Perpignan and Graz use dry heat rejection systems with external spraying. The other 3 systems use wet cooling towers. Water consumption, L per kWh dissipated heat 3,5 3 2,5 2 1,5 1 0,5 0 Jun Jul Aug Sep Perpignan 2009 Graz 09/10 Butzbach 2009 Gröbming 09/10 Gleisdorf 2010 Figure 10: Water consumption of cooling towers per unit of rejected heat On the other hand, the large differences between the systems also show that also in terms of water consumption, many systems can still be optimized. 4 Conclusions Within this task, 11 small-scale solar heating and cooling systems have been monitored in great detail. All of them have operated and produced heat and cold reliably during most of the monitoring period. However, the performance figures vary significantly. Some systems show very good results in terms of total electrical COPs as well as fractional primary energy savings. In some cases, this is due to the fact that during the monitoring campaign the system has been improved in a certain way. Comparison of the performance figures revealed that all or most systems still have optimization potential. Even the systems that have bad performance figure could very likely be improved to reach good values. The main optimization potential of most systems lies in the electricity consumption of certain components such as pumps or cooling tower fans. On one hand, the selection of these components is important. Energy efficient units should be chosen. On the other hand, the control strategy especially if operated in part load can reduce the electricity consumption significantly. This monitoring campaign showed that A good system design is important in order to reach good performance figures. Monitoring of this kind of system is necessary to ensure proper operation because it still is a relatively new technology. It enables the system supplier to further improve the system during operation and to maximize primary energy savings of the system. page 57
- Page 147 and 148: IEA SHC Task 38 Solar Air Condition
- Page 149 and 150: IEA SHC Task 38 Solar Air Condition
- Page 151 and 152: IEA SHC Task 38 Solar Air Condition
- Page 153 and 154: IEA SHC Task 38 Solar Air Condition
- Page 155 and 156: IEA SHC Task 38 Solar Air Condition
- Page 157 and 158: IEA SHC Task 38 Solar Air Condition
- Page 159 and 160: IEA SHC Task 38 Solar Air Condition
- Page 161 and 162: IEA SHC Task 38 Solar Air Condition
- Page 163 and 164: IEA SHC Task 38 Solar Air Condition
- Page 165 and 166: IEA SHC Task 38 Solar Air Condition
- Page 167 and 168: IEA SHC Task 38 Solar Air Condition
- Page 169 and 170: IEA SHC Task 38 Solar Air Condition
- Page 171 and 172: IEA SHC Task 38 Solar Air Condition
- Page 173 and 174: IEA SHC Task 38 Solar Air Condition
- Page 175 and 176: IEA SHC Task 38 Solar Air Condition
- Page 177 and 178: IEA SHC Task 38 Solar Air Condition
- Page 179 and 180: IEA SHC Task 38 Solar Air Condition
- Page 181 and 182: IEA SHC Task 38 Solar Air Condition
- Page 183 and 184: IEA SHC Task 38 Solar Air Condition
- Page 185 and 186: IEA SHC Task 38 Solar Air Condition
- Page 187 and 188: IEA SHC Task 38 Solar Air Condition
- Page 189 and 190: IEA SHC Task 38 Solar Air Condition
- Page 191 and 192: IEA SHC Task 38 Solar Air Condition
- Page 193 and 194: IEA SHC Task 38 Solar Air Condition
- Page 195 and 196: IEA SHC Task 38 Solar Air Condition
- Page 197: IEA SHC Task 38 Solar Air Condition
- Page 201 and 202: IEA SHC Task 38 Solar Air Condition
- Page 203 and 204: Task 38 Solar Air-Conditioning and
- Page 205 and 206: IEA SHC Task 38 Solar Air Condition
- Page 207 and 208: IEA SHC Task 38 Solar Air Condition
- Page 209 and 210: IEA SHC Task 38 Solar Air Condition
- Page 211 and 212: IEA SHC Task 38 Solar Air Condition
- Page 213 and 214: IEA SHC Task 38 Solar Air Condition
- Page 215 and 216: IEA SHC Task 38 Solar Air Condition
- Page 217 and 218: IEA SHC Task 38 Solar Air Condition
- Page 219 and 220: IEA SHC Task 38 Solar Air Condition
- Page 221 and 222: IEA SHC Task 38 Solar Air Condition
- Page 223 and 224: IEA SHC Task 38 Solar Air Condition
- Page 225 and 226: IEA SHC Task 38 Solar Air Condition
- Page 227 and 228: IEA SHC Task 38 Solar Air Condition
- Page 229 and 230: IEA SHC Task 38 Solar Air Condition
- Page 231 and 232: IEA SHC Task 38 Solar Air Condition
- Page 233 and 234: IEA SHC Task 38 Solar Air Condition
- Page 235 and 236: IEA SHC Task 38 Solar Air Condition
- Page 237 and 238: IEA SHC Task 38 Solar Air Condition
- Page 239: IEA SHC Task 38 Solar Air Condition
- Page 242 and 243: IEA SHC Task 38 Solar Air Condition
- Page 244 and 245: IEA SHC Task 38 Solar Air Condition
- Page 246 and 247: IEA SHC Task 38 Solar Air Condition
<strong>IEA</strong> SHC Task 38 <strong>Solar</strong> Air Conditioning <strong>and</strong> Refriger<strong>at</strong>ion Subtask A Report A-D3b, D<strong>at</strong>e: December 2010<br />
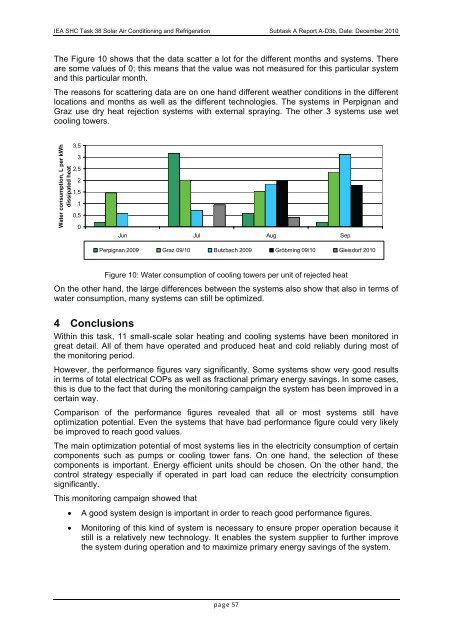
The Figure 10 shows th<strong>at</strong> the d<strong>at</strong>a sc<strong>at</strong>ter a lot for the different months <strong>and</strong> systems. There<br />
are some values of 0; this means th<strong>at</strong> the value was not measured for this particular system<br />
<strong>and</strong> this particular month.<br />
The reasons for sc<strong>at</strong>tering d<strong>at</strong>a are on one h<strong>and</strong> different we<strong>at</strong>her conditions in the different<br />
loc<strong>at</strong>ions <strong>and</strong> months as well as the different technologies. The systems in Perpignan <strong>and</strong><br />
Graz use dry he<strong>at</strong> rejection systems with external spraying. The other 3 systems use wet<br />
cooling towers.<br />
W<strong>at</strong>er consumption, L per kWh<br />
dissip<strong>at</strong>ed he<strong>at</strong><br />
3,5<br />
3<br />
2,5<br />
2<br />
1,5<br />
1<br />
0,5<br />
0<br />
Jun Jul Aug Sep<br />
Perpignan 2009 Graz 09/10 Butzbach 2009 Gröbming 09/10 Gleisdorf 2010<br />
Figure 10: W<strong>at</strong>er consumption of cooling towers per unit of rejected he<strong>at</strong><br />
On the other h<strong>and</strong>, the large differences between the systems also show th<strong>at</strong> also in terms of<br />
w<strong>at</strong>er consumption, many systems can still be optimized.<br />
4 Conclusions<br />
Within this task, 11 small-scale solar he<strong>at</strong>ing <strong>and</strong> cooling systems have been monitored in<br />
gre<strong>at</strong> detail. All of them have oper<strong>at</strong>ed <strong>and</strong> produced he<strong>at</strong> <strong>and</strong> cold reliably during most of<br />
the monitoring period.<br />
However, the performance figures vary significantly. Some systems show very good results<br />
in terms of total electrical COPs as well as fractional primary energy savings. In some cases,<br />
this is due to the fact th<strong>at</strong> during the monitoring campaign the system has been improved in a<br />
certain way.<br />
Comparison of the performance figures revealed th<strong>at</strong> all or most systems still have<br />
optimiz<strong>at</strong>ion potential. Even the systems th<strong>at</strong> have bad performance figure could very likely<br />
be improved to reach good values.<br />
The main optimiz<strong>at</strong>ion potential of most systems lies in the electricity consumption of certain<br />
components such as pumps or cooling tower fans. On one h<strong>and</strong>, the selection of these<br />
components is important. Energy efficient units should be chosen. On the other h<strong>and</strong>, the<br />
control str<strong>at</strong>egy especially if oper<strong>at</strong>ed in part load can reduce the electricity consumption<br />
significantly.<br />
This monitoring campaign showed th<strong>at</strong><br />
<br />
<br />
A good system design is important in order to reach good performance figures.<br />
Monitoring of this kind of system is necessary to ensure proper oper<strong>at</strong>ion because it<br />
still is a rel<strong>at</strong>ively new technology. It enables the system supplier to further improve<br />
the system during oper<strong>at</strong>ion <strong>and</strong> to maximize primary energy savings of the system.<br />
page 57


