Charting New Waters: State of Watershed Payments - Forest Trends
Charting New Waters: State of Watershed Payments - Forest Trends
Charting New Waters: State of Watershed Payments - Forest Trends

Create successful ePaper yourself
Turn your PDF publications into a flip-book with our unique Google optimized e-Paper software.
<strong>Charting</strong> <strong>New</strong> <strong>Waters</strong><br />
<strong>State</strong> <strong>of</strong> <strong>Waters</strong>hed <strong>Payments</strong> 2012
A FOREST TRENDS INITIATIVE<br />
About <strong>Forest</strong> <strong>Trends</strong><br />
<strong>Forest</strong> <strong>Trends</strong>’ mission is to maintain, restore, and<br />
enhance forests and connected natural ecosystems,<br />
which provide life-sustaining processes, by promoting<br />
incentives stemming from a broad range <strong>of</strong> ecosystem<br />
services and products. Specifically, <strong>Forest</strong> <strong>Trends</strong> seeks<br />
to catalyze the development <strong>of</strong> integrated carbon, water,<br />
and biodiversity incentives that deliver real conservation<br />
outcomes and benefits to local communities<br />
and other stewards <strong>of</strong> our natural resources.<br />
<strong>Forest</strong> <strong>Trends</strong> analyzes strategic market and policy<br />
issues, catalyzes connections between producers,<br />
communities and investors, and develops new financial<br />
tools to help markets work for conservation and<br />
people.<br />
Find out more at<br />
www.forest-trends.org<br />
About Ecosystem Marketplace<br />
Ecosystem Marketplace, an initiative <strong>of</strong> the non-pr<strong>of</strong>it<br />
organization <strong>Forest</strong> <strong>Trends</strong>, is a leading source <strong>of</strong> information<br />
on environmental markets and payments for<br />
ecosystem services. Our publicly available information<br />
sources include annual reports, quantitative market<br />
tracking, weekly articles, daily news and news briefs<br />
designed for different payments for ecosystem services<br />
stakeholders. We believe that by providing solid<br />
and trustworthy information on prices, regulation, science<br />
and other market-relevant issues, we can help<br />
payments for ecosystem services and incentives for<br />
reducing pollution become a fundamental part <strong>of</strong> our<br />
economic and environmental systems, helping make<br />
the priceless valuable.<br />
Find out more at<br />
www.ecosystemmarketplace.com<br />
About <strong>Waters</strong>hed Connect<br />
<strong>Waters</strong>hed Connect, a project <strong>of</strong> <strong>Forest</strong> <strong>Trends</strong> and<br />
Ecosystem Marketplace, is an online platform connecting<br />
practitioners, policy-makers, and other stakeholders<br />
involved in investing in our natural water infrastructure.<br />
The online platform serves as a centralized<br />
space to learn about the latest news and analyses, join<br />
relevant social media discussions, share your project<br />
or organization’s work, access key resources and tools,<br />
and research ongoing efforts on investments in watershed<br />
services (IWS) and water quality trading.<br />
Find out more at<br />
www.watershedconnect.org<br />
2 | <strong>Charting</strong> <strong>New</strong> <strong>Waters</strong><br />
Acknowledgments<br />
This report is a compilation <strong>of</strong> information and insights from a wide<br />
range <strong>of</strong> individuals across the globe. It would not be possible without<br />
the more than one hundred individuals who shared valuable information<br />
about their programs.<br />
The report is publicly available due to the core funding from the Swiss<br />
Agency for Development and Cooperation (SDC).<br />
Special thanks are due to Michael Bennett for his invaluable contributions<br />
to the section on Chinese programs, to Marta Echavarria and<br />
Karol Fierro for their work spearheading our Latin America survey, and<br />
to Heidi Huber-Stearns for her collaboration with Ecosystem Marketplace<br />
in gathering data on North American programs.<br />
This report was shaped by the insights, time and invaluable contributions<br />
<strong>of</strong> numerous people. They include: Rebecca Asare, Nigel Asquith,<br />
Ricardo Bayon, Lei Beria, Jan Cassin, Matthew Cranford, Ben Dappen,<br />
Ian Dickie, Susan Dobbertin, Jessica Fox, Gena Gammie, Kevin Green,<br />
Chris Hartley, Frank Hicks, Mark Kieser, Carlos Muñoz-Piña, Dan Nees,<br />
Alice Ruhweza, Diane Tarte, Anne Thiel, Ted Toombs, Julio Tresierra,<br />
Ashley Webb, Phuc Xuan To, and Steve Zwick.<br />
We also wish to thank Michael Jenkins, President <strong>of</strong> <strong>Forest</strong> <strong>Trends</strong>, for<br />
his guidance, and the entire staff <strong>of</strong> <strong>Forest</strong> <strong>Trends</strong> for their continued<br />
support and contributions.
<strong>Charting</strong> <strong>New</strong> <strong>Waters</strong><br />
<strong>State</strong> <strong>of</strong> <strong>Waters</strong>hed <strong>Payments</strong> 2012<br />
Genevieve Bennett, Nathaniel Carroll,<br />
and Katherine Hamilton<br />
Contributors: Michael Bennett, Marta Echavarria, Karol Fierro,<br />
and Heidi Huber-Stearns<br />
January 2013<br />
Bennett, Genevieve, Nathaniel Carroll, and Katherine Hamilton. (2013). <strong>Charting</strong> <strong>New</strong> <strong>Waters</strong>: <strong>State</strong> <strong>of</strong> <strong>Waters</strong>hed <strong>Payments</strong> 2012.<br />
Washington, DC: <strong>Forest</strong> <strong>Trends</strong>. Available online at http://www.ecosystemmarketplace.com/reports/sowp2012.<br />
<strong>State</strong> <strong>of</strong> <strong>Waters</strong>hed <strong>Payments</strong> 2012 | 3
Copyright and Disclaimer<br />
© Ecosystem Marketplace<br />
Ecosystem Marketplace is an initiative <strong>of</strong> <strong>Forest</strong> <strong>Trends</strong>. Any reference to <strong>Forest</strong> <strong>Trends</strong> or Ecosystem Marketplace in this disclaimer<br />
includes <strong>Forest</strong> <strong>Trends</strong>, Ecosystem Marketplace, and all <strong>of</strong> their respective affiliates, partners, <strong>of</strong>ficers, directors, and employees.<br />
The information in this report is provided for general informational purposes only and should not be construed to contain legal, business,<br />
accounting, tax, or other pr<strong>of</strong>essional advice.<br />
No one should act or refrain from acting on the basis <strong>of</strong> any information contained in this report without seeking appropriate pr<strong>of</strong>essional<br />
advice based on his or her particular circumstances.<br />
While Ecosystem Marketplace strives to provide accurate and timely information, all information in the report is presented “as-is,”<br />
without any representation as to its accuracy, suitability, timeliness, completeness, or continued availability.<br />
4 | <strong>Charting</strong> <strong>New</strong> <strong>Waters</strong>
Executive Summary<br />
Table 1: Summary Details, Global<br />
Number <strong>of</strong> active programs: 205<br />
Number <strong>of</strong> programs in development: 76<br />
Value <strong>of</strong> transactions in 2011: $8.17 billion<br />
Value <strong>of</strong> transactions 1973-2011: $66 billion<br />
Hectares managed for watershed services in 2011: 117 million hectares<br />
Hectares managed for watershed services 1973-2011: 195 million hectares<br />
Overview<br />
This report is the second installment in the “<strong>State</strong> <strong>of</strong> <strong>Waters</strong>hed <strong>Payments</strong>” series, an effort to globally track the size, scope, and direction<br />
<strong>of</strong> investments in watershed services (IWS) as well as the ecological infrastructure from which they flow. Throughout this report<br />
we use the term ‘investments in watershed services’ to cover the broad diversity <strong>of</strong> incentive- or market-based mechanisms being<br />
used to protect the natural infrastructure <strong>of</strong> watersheds – including payments for ecosystem services (PES), payments for watershed<br />
services (PWS), water quality trading markets, and reciprocal or in-kind agreements. Data comes from surveys, interviews, and desk<br />
research on over 200 programs worldwide in more than 30 countries.<br />
Report Objectives<br />
Building on the 2010 <strong>State</strong> <strong>of</strong> <strong>Waters</strong>hed <strong>Payments</strong> report, the primary objective <strong>of</strong> the current report is to provide an accurate snapshot<br />
<strong>of</strong> the scale, size, shape, and direction <strong>of</strong> investments in watershed services worldwide.<br />
A second objective <strong>of</strong> this report is to provide detailed design and project analysis that informs smart decision-making among policymakers,<br />
local communities, conservation organizations, private businesses, and other natural resource managers. The IWS field is<br />
growing rapidly; transparency and access to reliable information is critical to ensure that practices and policies are beneficial for both<br />
society and nature.<br />
Gathering project-level information at a global scale on mechanism design, transaction values, and project outcomes is no small undertaking.<br />
Information on projects and programs is <strong>of</strong>ten scarce, fragmented, and rapidly changing. This report represents our most<br />
comprehensive inventory <strong>of</strong> programs yet, but it is not the complete picture. In all cases, we have done our best to err on the side <strong>of</strong><br />
conservatism in our estimates and analyses.<br />
In this report, we <strong>of</strong>fer an overview <strong>of</strong> our findings at global and regional scales. More detailed project-level data is available in our<br />
online global project inventory at www.watershedconnect.org/projects.<br />
Key Findings: By the Numbers<br />
Source: Ecosystem Marketplace.<br />
In 2011, we tracked 205 active programs around the world. More than half <strong>of</strong> the programs are in two countries: China (61) and the<br />
United <strong>State</strong>s (67). In all, watershed investment programs are active in 29 countries.<br />
<strong>State</strong> <strong>of</strong> <strong>Waters</strong>hed <strong>Payments</strong> 2012 | i
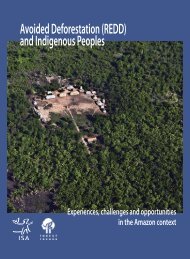
Transactions totaled $8.17 billion in 2011. Globally, investments in watershed services have steadily increased since tracking began in<br />
2008. 1 On a regional level, the picture is a bit different. 2011 was a slower year for IWS in North and Latin America. But preliminary<br />
evidence suggests that markets saw a bounce in 2012.<br />
China represents the lion’s share <strong>of</strong> reported payments as the country’s leadership has increased funding for “eco-compensation”<br />
mechanisms and placed eco-compensation in a key role in the most recent national Five-Year Plan and in a proposed new zoning<br />
system. In the aggregate, Chinese economic muscle has more than <strong>of</strong>fset falling investments in ecological infrastructure in North and<br />
Latin America, traditionally global leaders in funding watershed protection.<br />
Number <strong>of</strong> Programs<br />
Billions<br />
80<br />
70<br />
60<br />
50<br />
40 40<br />
30<br />
20<br />
10<br />
$9<br />
$8<br />
$7<br />
$6<br />
$5<br />
$4<br />
$3<br />
$2<br />
$1<br />
$0<br />
1 In contrast to our 2010 report, we have tightened our scope here to exclude bundled government agri-environmental schemes that pay for<br />
environmental stewardship but do not focus primarily on watershed services. Programs like these certainly can support watershed functions<br />
but are not driven by them. Where our 2008 baseline data is discussed in this report, we have revised it to reflect these changes.<br />
ii | <strong>Charting</strong> <strong>New</strong> <strong>Waters</strong><br />
0<br />
Figure 1: Global Annual Transactions, 2008-2011<br />
2008 2009 2010 2011<br />
Source: Ecosystem Marketplace.<br />
Figure 2: <strong>New</strong> <strong>Waters</strong>hed Investment Programs by Year, Globally<br />
Source: Ecosystem Marketplace.
In terms <strong>of</strong> environmental outcomes, these payments have translated into efforts to rehabilitate and protect nearly 117 million hectares<br />
– a total land area nearly the size <strong>of</strong> South Africa.<br />
Of course, not all programs measure success in terms <strong>of</strong> land. Programs also returned nearly 138,000 megaliters <strong>of</strong> water to rivers and<br />
aquifers around the world in 2011 and more than 4.6 million megaliters to date – that’s the equivalent <strong>of</strong> enough water to nearly fill<br />
Lake Michigan. Thanks to watershed investment programs, 3.4 million pounds <strong>of</strong> nitrogen and 97,000 pounds <strong>of</strong> phosphorus were<br />
kept out <strong>of</strong> global waterways in 2011, where they would have led to algal blooms and oxygen-starved “dead zones.”<br />
Nor do all watershed investments take the form <strong>of</strong> cash payments. We also see watershed service providers being compensated in<br />
the form <strong>of</strong> technical training, agricultural inputs, or even tenure security. Our survey respondents, where possible, have estimated<br />
the value <strong>of</strong> in-kind payments to be included in our aggregate transaction figures.<br />
China Takes the Wheel, Water Funds Take Off, and Nutrient Trading<br />
Takes It Easy<br />
<strong>Waters</strong>hed investments had their share <strong>of</strong> highs and lows in 2011. In some regions, a still-sluggish economy seems to have dampened<br />
activity, while in others, natural infrastructure’s cost-effectiveness made it all the more attractive. A sampling <strong>of</strong> key report trends to<br />
take away:<br />
• China has cemented its position as a global leader in using compensation for ecological restoration and protection. The country’s<br />
political leadership has given “eco-compensation” a key role in China’s latest Five-Year Plan and a proposed national land<br />
zoning system. Water insecurity poses probably the single biggest risk to the country’s continued economic growth today, and<br />
the government has clearly decided that its ecological investments will pay <strong>of</strong>f. 2<br />
• Water funds, which draw on a mix <strong>of</strong> funding<br />
streams to capitalize a fund, generally<br />
managed in trust, to invest in conservation<br />
and restoration projects, are the fastestgrowing<br />
model today in Latin America.<br />
We’ve tracked eight new funds since our<br />
2008 baseline and at least another seven<br />
are set to launch in 2012 and beyond. A<br />
new $27-million dollar partnership between<br />
The Nature Conservancy, the FEMSA<br />
Foundation, the Inter-American Development<br />
Bank, and the Global Environment<br />
Facility aims to have 32 funds capitalized<br />
across Latin America by 2015. These funds<br />
<strong>of</strong>fer sustainable financing, long-term stakeholder<br />
engagement, and flexibility to select<br />
projects at a landscape scale.<br />
• 2011 was a slow year in North America as far as water quality trading, with $7.7 million in trades tracked down from a 2008<br />
high <strong>of</strong> $10.6 million. A slow economy is probably partly to blame, although we also see some signs that counter-intuitively<br />
suggest this means that markets are working. Survey respondents reported that increased engagement with nonpoint-source<br />
credit sellers like farmers translated into lower credit prices (and thus lower overall market values). Meanwhile, a number <strong>of</strong><br />
point sources noted that they’d come in under their regulatory caps so haven’t needed to trade at all in 2011, suggesting that<br />
trading in recent years had allowed them to buy time while making environmentally-friendly technological upgrades.<br />
2 World Bank, 2007.<br />
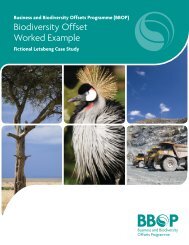
Figure 3: Transactions by <strong>Waters</strong>hed Investment Program Type, Annually<br />
82%<br />
8%<br />
8% 2%
• We tracked growing interest in stacking and bundling payments for multiple ecosystem services – not just in the US, but<br />
also in Indonesia, Vietnam, Tanzania, Kenya, and Colombia. ‘Bundling’ refers to a payment that recognizes multiple ecosystem<br />
services delivered by an intervention, while “stacked” payments not only recognize multiple services but <strong>of</strong>fer distinct revenue<br />
streams for each. Biodiversity is the most commonly “bundled” service, though the degree <strong>of</strong> rigor in measuring and protecting<br />
it appears to vary quite a bit. Financing for stacking and bundling remains mostly “internal” – we aren’t yet seeing many signs <strong>of</strong><br />
linkages to new buyers in the carbon or biodiversity markets.<br />
• It’s not just developing countries who rely on natural water infrastructure to keep water sources clean and safe. Green infrastructure<br />
as a substitute for or complement to traditional engineered approaches is gaining currency in the developed world<br />
– from using forests as green infiltration galleries in Germany, to using mussel beds to filter nitrate pollution instead <strong>of</strong> a treatment<br />
plant in Sweden, to <strong>New</strong> York City planning to restore wetlands to its waterfront to deal with storm events.<br />
• For the first time, we’ve tracked environmental water markets in Australia and the United <strong>State</strong>s. Governments and conservation<br />
groups are taking advantage <strong>of</strong> traditional water rights markets – which have historically been used by irrigators and<br />
municipalities to trade water rights for consumptive use – to buy and retire water rights to ensure sufficient water is left in rivers<br />
(known as “instream buybacks”). It’s an innovative use <strong>of</strong> existing markets to achieve environmental goals that channeled more<br />
than $171 million in 2011 to restoring critical river systems.<br />
A Field Guide to <strong>Waters</strong>hed Investments<br />
The term ‘investments in watershed services’ covers a spectrum <strong>of</strong> instruments in practice. All are premised on the idea that our ecological<br />
infrastructure has tremendous value: we rely on it to filter our drinking water, absorb floods, keep soil on the land from eroding<br />
and clogging waterways, and recharge aquifers. Healthy watersheds can <strong>of</strong>ten do all <strong>of</strong> these things more cost-effectively than built<br />
infrastructure and with co-benefits like providing wildlife habitat and sequestering carbon.<br />
In more than 200 towns, cities, and regions around the world, leaders and communities have opted to invest in our natural infrastructure<br />
and reward the people who protect it. The approach is a powerful new source <strong>of</strong> financing for conservation, a cost-effective way<br />
to ensure clean drinking water and supplies for other uses, and can be tailored to improve livelihoods in poor and rural communities<br />
who <strong>of</strong>ten manage water resources at their source.<br />
In this report, we track a variety <strong>of</strong> mechanisms for investment and a range <strong>of</strong> terminology being used to describe them – from “payments<br />
for ecosystem services” to “reciprocal agreements for water” to “eco-compensation.” But all have some common elements<br />
(see Table 2). Where they vary lies in how these elements are operationalized. Project design can vary according to a region’s regulatory<br />
and institutional frameworks, local politics, economic realities, and regional environmental problems.<br />
In our tracking, we see many <strong>of</strong> these design elements tending to “cluster” together. For example, a “polluter pays” program might<br />
usually be linked to some regulatory driver and transacts payments in cash. Cluster analysis on our inventory <strong>of</strong> global programs gives<br />
us several overarching program types that repeatedly appear around the world. We use these broad groupings in analysis in this<br />
report, as we feel they best reflect the “on-the-ground” realities <strong>of</strong> investments in watershed services, as opposed to a theory-driven<br />
typology. Still, it should be noted that these are general types; in practice we see a range <strong>of</strong> sub-types and hybrids. 3<br />
3 For further discussion, please see <strong>Forest</strong> <strong>Trends</strong>’ forthcoming white paper which can be accessed at .<br />
iv | <strong>Charting</strong> <strong>New</strong> <strong>Waters</strong>
Table 2: Key Elements <strong>of</strong> Project Design<br />
Design Element For example…<br />
Hydrological Service Goals:<br />
What problem is this<br />
mechanism trying to solve?<br />
Scale: At what geographic<br />
level do investments occur?<br />
Participants and other<br />
Stakeholders: Who are the<br />
key actors?<br />
Buyer: Who pays?<br />
Intervention: What does<br />
the buyer pay for?<br />
Driver: Why does the buyer<br />
pay?<br />
Exchange Arrangement:<br />
How do they pay the hydrological<br />
service provider?<br />
Compensation: What form<br />
does the payment take?<br />
Co-Benefits: Does the program<br />
have multiple objectives,<br />
beyond hydrological<br />
services?<br />
Core Program Types<br />
- Groundwater infiltration, filtering <strong>of</strong> pollutants, or trapping <strong>of</strong> sediments<br />
- Local or watershed-scale<br />
- Regional, spanning multiple watersheds or jurisdictions, or encompassing a major basin<br />
- National, active in multiple areas or across an entire country<br />
- Providers: Private or communal landholders, forest managers, factories or treatment plants<br />
discharging into a water body<br />
- Beneficiaries: Water users downstream, hydropower operators concerned about<br />
sedimentation <strong>of</strong> their reservoir, beverage companies depending on clean water supplies<br />
- Other stakeholders: Community organizations, regulators, policy-makers, conservation<br />
pr<strong>of</strong>essionals, ecosystem market service providers (such as aggregators or trading platform<br />
hosts)<br />
- Beneficiaries<br />
- Polluters<br />
- Public good payers (such as a government or NGO)<br />
- Agricultural best management practices<br />
- Afforestation/reforestation or improved forest management<br />
- Technology upgrades to limit polluted discharge<br />
- Water rights transactions<br />
- Voluntary arrangement<br />
- Discharge permit requirements<br />
- Environmental tax or fee on water use<br />
- Bilateral contracts<br />
- Water fund<br />
- Marketplace mechanism<br />
- Cash<br />
- In-kind: Agro-inputs, technical training, or tenure security<br />
- Socio-economic goals: Poverty alleviation, indigenous representation/management <strong>of</strong> resources,<br />
or gender equity<br />
- Environmental co-benefits: Habitat for imperiled species, carbon sequestration, or landscape<br />
beauty<br />
Source: Ecosystem Marketplace.<br />
When people talk about payments for watershed services, they are generally referring to either a bilateral agreement or a beneficiarypays<br />
fund. These two are the most commonly observed program types around the world, though in practice we see a good deal <strong>of</strong><br />
variation on these broad models. Beyond differences in implementation, we also see evidence <strong>of</strong> hybrids and even one type morphing<br />
into another over time. In addition to bilateral agreements and beneficiary-pays funds, we track two other general types: trading<br />
& <strong>of</strong>fsets and instream buybacks. In this report, we attempt to highlight trends and outcomes specific to different program types<br />
wherever useful for the models described below.<br />
<strong>State</strong> <strong>of</strong> <strong>Waters</strong>hed <strong>Payments</strong> 2012 | v
Key Programs Tracked in this Report<br />
BILATERAL AGREEMENTS<br />
The largest group <strong>of</strong> programs tracked is bilateral agreements, which are characterized by the use <strong>of</strong> direct deals between payer and<br />
provider. Multiple payers and providers may participate in the program, but contracts always take a bilateral form, as opposed to using<br />
other exchange arrangements like a marketplace or water fund mechanism. Government agri-environmental payments <strong>of</strong>ten fall into<br />
this category. Bilateral arrangements may be either voluntary on the part <strong>of</strong> the payer or driven by some form <strong>of</strong> regulation. These<br />
types <strong>of</strong> arrangements are observed at a range <strong>of</strong> scales, from a local deal up to a national-level payment program.<br />
BENEFICIARY-PAYS FUND<br />
Here, individuals or organizations who benefit from watershed restoration or preservation contribute to a centralized fund, <strong>of</strong>ten<br />
matched by public co-investment. The contributors to the fund do not necessarily determine how money is invested in the watershed;<br />
generally some trustee, council, or technical committee selects interventions. An endowment fund is a common feature, with only<br />
interest being used for restoration or conservation projects while the principal is left untouched. We also <strong>of</strong>ten see a mix <strong>of</strong> participation<br />
drivers on the payer/beneficiary side: some beneficiaries (usually domestic water users) may be required to contribute to the<br />
fund through mandatory fees, while others participate voluntarily. <strong>Waters</strong>hed service providers always participate voluntarily. These<br />
schemes predominantly take place at the local level though there are also instances <strong>of</strong> regional and national programs that fall into<br />
this type. These programs are most <strong>of</strong>ten seen in Latin America.<br />
TRADING & OFFSETS<br />
These are the cases where we observe a fairly high degree <strong>of</strong> commoditization <strong>of</strong> watershed services, <strong>of</strong>ten paired with some kind<br />
<strong>of</strong> marketplace exchange arrangement. Water quality trading programs in North America and Oceania fall into this group as do some<br />
quantity-driven mechanisms like groundwater mitigation banking programs and instream flow restoration certificates in the United<br />
<strong>State</strong>s. The “polluter pays” principle is <strong>of</strong>ten an underlying force: there is usually a linked regulatory driver for participation, particularly<br />
on the side <strong>of</strong> the buyer.<br />
INSTREAM BUYBACKS<br />
Instream buybacks are the purchase <strong>of</strong> water rights for the purpose <strong>of</strong> leaving that water instream (rather than diverting it for irrigation,<br />
drinking, or some other consumptive use) to restore natural flow regimes. These transactions usually have a strong biodiversity<br />
co-benefit component, with the goal <strong>of</strong> protecting or enhancing aquatic and riparian habitats. The buyer is generally a government or<br />
non-pr<strong>of</strong>it organization which may not necessarily benefit from the intervention; in this respect the presence <strong>of</strong> a “public good payer”<br />
is a defining characteristic <strong>of</strong> instream buybacks. We observe these types <strong>of</strong> programs only in areas with defined property rights for<br />
water extraction and existing markets for water rights – thus to date, instream buybacks have only taken place in Australia and the<br />
United <strong>State</strong>s.<br />
Who’s Buying? Who’s Selling?<br />
We find three main types <strong>of</strong> funders: beneficiaries <strong>of</strong> watershed protection (like a downstream city), polluters compensating for their<br />
impacts (like a factory <strong>of</strong>fsetting its polluted effluent) and ‘public good payers’ that may not be directly benefitted by or responsible<br />
for watershed cleanup, but fund it nonetheless on behalf <strong>of</strong> general welfare (usually a government or NGO).<br />
Considered by payer type – beneficiary, polluter, or a public good payer – payments were overwhelmingly initiated by public good<br />
payers like governments and NGOs. However, China again skews these numbers with massive spending by government eco-compensation<br />
programs (see Figures 4a and 4b). When China is set aside, beneficiary-pays programs account for an estimated $162 million<br />
out <strong>of</strong> $517 million in global transactions, or nearly a third <strong>of</strong> payments. Polluter-pays programs, leaving aside China, comprise about<br />
three percent <strong>of</strong> transactions.<br />
vi | <strong>Charting</strong> <strong>New</strong> <strong>Waters</strong>
Figure 4a: <strong>Waters</strong>hed Investments by Payer Type,<br />
Figure 4a.<br />
Globally<br />
Co-Benefits<br />
97%<br />
3%
Thirteen programs reported that stacking payments for co-benefits was taking place. These tended to be Latin American water funds<br />
or programs supported by a single buyer. In all cases but one, payments came from ‘inside’ the program – that is, through existing<br />
funding streams and established buyers.<br />
Socio-Economic Co-Benefits<br />
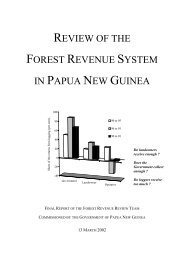
We tracked 54 programs that report explicit social objectives, exhibiting a variety <strong>of</strong> social goals (see Figure 6). Nearly half <strong>of</strong> these are<br />
in China, where eco-compensation can be considered in part a rural welfare support program to more evenly distribute benefits <strong>of</strong><br />
economic growth to poorer regions <strong>of</strong> the country.<br />
Investments in watershed services programs<br />
also appear to be pursued as a strategy for<br />
community development; program requirements<br />
like strong social capital, functioning<br />
institutions, and tenure security also support<br />
larger goals <strong>of</strong> socio-economic development.<br />
Though some programs <strong>of</strong>fer compelling<br />
evidence that social goals are being met with<br />
demonstrated improvements for incomes,<br />
equity, and food security, we also found that<br />
worryingly little socio-economic monitoring<br />
appears to be taking place.<br />
Outlook<br />
5%<br />
Tenure security<br />
4%<br />
We’ve seen watershed investment programs<br />
nearly double in number and geographic<br />
Source: Ecosystem Marketplace.<br />
spread over the past four years. These four<br />
years have also seen government cutbacks, austerity measures, down-sized corporate environmental departments, and unprecedented<br />
economic and political uncertainly, including the largest global recession in recent memory.<br />
Such continued growth in management systems for a natural resource in the midst <strong>of</strong> a major global economic downturn should be<br />
raising eyebrows. Leaders and communities around the world are recognizing water security as a serious problem and taking creative<br />
steps to address it.<br />
This report attempts to capture activity that has taken place over the course <strong>of</strong> a year, 2011, that is already in our past. But in our<br />
research, we’ve also come across new developments, ongoing trends, and future projections. In this section, we summarize the most<br />
important <strong>of</strong> these.<br />
The Good <strong>New</strong>s<br />
• With 76 new programs in development, interest in IWS clearly continues to spread. Countries like Gabon, Ghana, Kyrgyzstan, Malawi,<br />
Bulgaria, and Romania are in line to implement their first IWS mechanism in 2012 and the coming years.<br />
• China’s already-massive investments in watershed services are expected to grow even more, as eco-compensation settles into its<br />
new role as a key element <strong>of</strong> environmental policy in the most recent Five-Year plan and new land-zoning framework, a new national<br />
‘eco-compensation’ ordinance, and ramped-up government funding for pilots.<br />
• Latin American transactions overall are expected to see a jump in 2012. Between new water funds coming online and increased<br />
funding for national programs like Mexico’s PSAH and Ecuador’s Socio Páramo, relatively modest activity in Latin America appears to<br />
have turned the corner in 2012 based on our initial tracking.<br />
• Water quality markets in the United <strong>State</strong>s are expected to see a 2012 bounce as well, with an uptick in overall economic activity<br />
and a surge <strong>of</strong> regulatory drivers behind new growth. <strong>New</strong> water quality standards in the Chesapeake Bay watershed made<br />
themselves felt in 2012. The first interstate water quality trading program under a single set <strong>of</strong> rules also expects to begin trading<br />
soon in the Ohio River Basin. We’re also tracking the emergence <strong>of</strong> a new player in water quality trading: private nutrient banks,<br />
viii | <strong>Charting</strong> <strong>New</strong> <strong>Waters</strong><br />
13%<br />
1%<br />
9%<br />
14%<br />
6%<br />
Figure 6: Socio-Economic Objectives Reported by<br />
<strong>Waters</strong>hed Investment Program Globally<br />
48%<br />
Poverty alleviation<br />
Gender Equity<br />
Indigenous rights/management<br />
Community economic development<br />
Community management <strong>of</strong> resources<br />
Strengthening community social capital and<br />
institutions<br />
Maintenance <strong>of</strong> traditional landscapes
which are repurposing the wetland banking model for nutrient credits. In Virginia, banks look to have quadrupled in number in<br />
2012 and have been behind a big piece <strong>of</strong> trading activity in the state.<br />
• Transboundary programs are slowly emerging. We tracked a developing program in the Danube Basin, as well as a new effort<br />
to restore instream flows in the Colorado River, which flows from the United <strong>State</strong>s into Mexico, with a coalition <strong>of</strong> American<br />
and Mexican NGOs working together to secure instream flow rights.<br />
• Increased experimentation with stacking and bundling <strong>of</strong> multiple ecosystem services is everywhere. We’ve heard about<br />
streambank credits in the US state <strong>of</strong> Georgia, programs linking with carbon in Indonesia, bundled payments for landscape<br />
beauty by tourism operators in Vietnam, and more. While in 2011 payments still tended to come from “inside” existing programs<br />
– that is, from the same buyers that also paid for watershed services, rather than new sources <strong>of</strong> financing – in 2012<br />
and beyond we expect to see increased cross-investment between ecosystem markets. We’ve heard about pollinator credits<br />
stacking with water quality, wetland banks pursuing both carbon and nutrient accreditation, water funds linking to international<br />
carbon markets, and more.<br />
• Climate risk adaptation and mitigation are increasingly cited as a driver <strong>of</strong> watershed investment. Protecting water supplies<br />
from climate change effects like natural disasters, glacier melt, and food insecurity were much more frequently reported as program<br />
drivers than in our last survey, though it’s not always clear how these concerns are translating into management. Better<br />
information about how IWS can increase resilience to climate effects and natural disasters and the cost-effectiveness <strong>of</strong> doing<br />
so will likely strengthen the usefulness <strong>of</strong> IWS mechanisms as a tool for communities in long-term planning. IWS as a risk mitigation<br />
strategy is already being taken up in locales from <strong>New</strong> York City and Denver to Peru and the Philippines.<br />
The Bad <strong>New</strong>s<br />
• We have seen little movement from the private sector to tackle their water-related risk. Fifty-three programs tracked use<br />
some private sector funding, but these are nearly always regulation-driven and public or NGO-initiated. IWS remains largely<br />
powered by the public sector and public good investors. This trend is echoed in a recent Deloitte report (CDP Global Water<br />
Report) showing that over half the Global 500 companies report having experienced water-related challenges, yet are failing to<br />
take action to improve water stewardship. The exception to this are a few progressive and clearly exposed businesses, namely<br />
certain beverage companies including the members <strong>of</strong> the Water Futures Partnership, Coca-Cola, natural mineral water companies,<br />
and a number <strong>of</strong> breweries around the world.<br />
• In many regions and particularly Africa and Latin America, new or developing programs identified in 2008 no longer existed<br />
by 2011. This seems to be directly linked to initial grant monies running out and programs struggling to stay operative thereafter.<br />
Of course, sometimes an IWS mechanism may simply not be appropriate to a given locale or water resource problem. But<br />
it’s an unwelcome trend nonetheless, and underscores how long-term financing and local ownership are essential.<br />
• Survey responses suggest that socio-economic monitoring is relatively rare. Only sixteen cases <strong>of</strong> monitoring these impacts<br />
were reported. In contrast, 126 programs confirmed that environmental monitoring takes place.<br />
The Bottom Line<br />
We hope you’ll come away from this report convinced <strong>of</strong> two things: firstly, that the widespread adoption <strong>of</strong> ecological investment<br />
mechanisms is a key part <strong>of</strong> any strategy for ensuring secure and sustainable water systems – and secondly, that accurate tracking<br />
<strong>of</strong> these finance mechanisms and making information about them freely available to decision makers around the world is crucial to<br />
timely and widespread adoption. The latter conviction drives this report and the rest <strong>of</strong> our work at Ecosystem Marketplace.<br />
The global landscape in 2011 looks very different from what we found in 2008 in our first report. Water insecurity has sharpened the<br />
need for scaling up investment in our ecological infrastructure, while patchy global economic growth has underlined to need to do so<br />
cost-effectively.<br />
This report tracks a rich and diverse portfolio <strong>of</strong> programs around the world that have found creative ways to finance safe drinking<br />
water and instream supplies. Models for watershed investment have both multiplied and matured since our last report, and show<br />
great promise in 2012 and beyond.<br />
<strong>State</strong> <strong>of</strong> <strong>Waters</strong>hed <strong>Payments</strong> 2012 | ix
Mapping <strong>Waters</strong>hed Payment Programs<br />
x | <strong>Charting</strong> <strong>New</strong> <strong>Waters</strong><br />
Mexico 3<br />
Canada 1<br />
Summary <strong>of</strong> <strong>Waters</strong>hed Payment Programs (2011)<br />
67 United <strong>State</strong>s<br />
Costa Rica 2<br />
Total Active Programs 205<br />
Total Programs in Development 76<br />
Value <strong>of</strong> Transactions US$8.17 billion<br />
Hectares Managed for <strong>Waters</strong>hed Services 117 million ha<br />
18<br />
Colombia<br />
2<br />
3<br />
Ecuador 10<br />
2<br />
Peru 1<br />
Brazil 4<br />
5<br />
3<br />
Bolivia<br />
1<br />
United Kingdom 1<br />
3<br />
Spain<br />
Sw<br />
France 3<br />
1<br />
Guinea 1<br />
Ghana 1<br />
Ga
eden 1<br />
4<br />
Germany<br />
2 Switzerland<br />
Italy 2<br />
1 Bulgaria/Romania<br />
transboundary program<br />
Kyrgyzstan 1<br />
4 Japan<br />
61 China<br />
19<br />
Pakistan 1<br />
2<br />
1<br />
Nepal<br />
bon<br />
1<br />
Uganda 1<br />
Zambia<br />
1<br />
3<br />
1<br />
3<br />
South Africa<br />
Kenya<br />
1 Tanzania<br />
2<br />
1 Malawi<br />
India<br />
1<br />
1<br />
Thailand<br />
1<br />
1 Vietnam<br />
3<br />
5 Philippines<br />
4<br />
8 Indonesia<br />
6<br />
Australia 4<br />
<strong>New</strong> Zealand 1<br />
1<br />
<strong>State</strong> <strong>of</strong> <strong>Waters</strong>hed <strong>Payments</strong> 2012 | xi
xii | <strong>Charting</strong> <strong>New</strong> <strong>Waters</strong>
Table <strong>of</strong> Contents<br />
Executive Summary i<br />
Mapping <strong>Waters</strong>hed Payment Programs x<br />
Foreword 1<br />
Methodology 3<br />
Approach and Scope 3<br />
Data Sources 3<br />
Global Findings 5<br />
General Status Update 5<br />
Transactions by the Numbers 6<br />
Africa 15<br />
General Status Update 15<br />
Transaction Activity 15<br />
Outlook 18<br />
Asia 21<br />
General Status Update 21<br />
Transaction Activity 23<br />
Outlook 30<br />
Europe 33<br />
General Status Update 33<br />
Transaction Activity 35<br />
Outlook 39<br />
Latin America 41<br />
General Status Update 41<br />
Transaction Activity 43<br />
Outlook 47<br />
North America 49<br />
General Status Update 49<br />
Transaction Activity - Bilateral and Fund Arrangements 51<br />
Outlook - Bilateral and Fund Arrangements 55<br />
Transaction Activity - Water Quality Trading 56<br />
Outlook - Water Quality Trading 60<br />
Transaction Activity - Environmental Water Markets: Instream Buybacks and Water Quantity Offsets 62<br />
Outlook - Environmental Water Markets: Instream Buybacks and Water Quantity Offsets 66<br />
<strong>State</strong> <strong>of</strong> <strong>Waters</strong>hed <strong>Payments</strong> 2012 | xiii
Oceania 69<br />
General Status Update 69<br />
Transaction Activity - Water Quality Trading 71<br />
Transaction Activity - Instream Buybacks 72<br />
Other Activity 72<br />
Outlook 73<br />
The Global Outlook 75<br />
<strong>Charting</strong> <strong>New</strong> <strong>Waters</strong> in 2012 and Beyond 75<br />
The Bottom Line 76<br />
Bibliography 77<br />
List <strong>of</strong> Tables<br />
Table 1: Summary Details, Global i<br />
Table 2: Key Elements <strong>of</strong> Project Design v<br />
Table 3: Summary Details, Global 5<br />
Table 4: Dollars per Hectare Average by Program Type, 2011 8<br />
Table 5: Socio-Economic Co-Benefits Objectives Reported, by Country 13<br />
Table 6: Summary Details, Africa 15<br />
Table 7: Active Programs, Africa 17<br />
Table 8: Summary Details, Asia 21<br />
Table 9: Summary Details, Europe 33<br />
Table 10: Tracking Activity in Europe, 2008-2011 36<br />
Table 11: Summary Details, Latin America 41<br />
Table 12: Water Funds, Latin America 45<br />
Table 13: Summary Details, North America 49<br />
Table 14: Active Source Water Protection Programs, North America 52<br />
Table 15: A Sample <strong>of</strong> <strong>Waters</strong>hed Investment Programs in North America: Where Are They Now? 54<br />
Table 16: Active Water Quality Trading Programs, North America 58<br />
Table 17: Tracking Water Quality Trading 2008-2011, North America 59<br />
Table 18: <strong>State</strong> Instream Acquisition/Leasing Programs Active in 2011, United <strong>State</strong>s 64<br />
Table 19: Summary Details, Oceania 67<br />
Table 20: Tracking Activity in Oceania, 2008-2011 68<br />
Table 21: Active and Developing Programs, Oceania 70<br />
List <strong>of</strong> Boxes<br />
Box 1: Environmental Co-Benefits: “Stacking” and “Bundling” 11<br />
Box 2: Eco-Compensation in Action, China 24<br />
Box 3: The Water Framework Directive in Europe 35<br />
Box 4: Federal Funding for Drinking Water Protection, United <strong>State</strong>s 52<br />
Box 5: Water Quality Trading in the United <strong>State</strong>s: The Regulatory Framework 57<br />
Box 6: The Murray-Darling Basin, Australia 68<br />
xiv | <strong>Charting</strong> <strong>New</strong> <strong>Waters</strong>
List <strong>of</strong> Figures<br />
Figure 1: Global Annual Transactions, 2008-2011 ii<br />
Figure 2: <strong>New</strong> <strong>Waters</strong>hed Investment Programs by Year, Globally ii<br />
Figure 3: Transactions by <strong>Waters</strong>hed Investment Program Type, Annually iii<br />
Figure 4a: <strong>Waters</strong>hed Investments by Payer Type, Globally vii<br />
Figure 4b: <strong>Waters</strong>hed Investments by Payer Type, Globally, Excluding China vii<br />
Figure 5: Stacking and Bundling with <strong>Waters</strong>hed Investments, Globally vii<br />
Figure 6: Socio-Economic Objectives Reported by <strong>Waters</strong>hed Investment Program Globally viii<br />
Figure 7: Sample IWS Project 1<br />
Figure 8: Survey Response Rates 3<br />
Figure 9: Global Annual Transactions, 2008-2011 5<br />
Figure 10: <strong>New</strong> Programs by Year, Globally 6<br />
Figure 11a: <strong>Waters</strong>hed Investments by Region, 2011 6<br />
Figure 11b: <strong>Waters</strong>hed Investments by Region, Historically 6<br />
Figure 12a: Global Demand for Investments in <strong>Waters</strong>hed Services by Sector 7<br />
Figure 12b: Global Supply <strong>of</strong> Investments in <strong>Waters</strong>hed Services by Sector 7<br />
Figure 13a: Payer Driver, <strong>Waters</strong>hed Investment Programs, Globally 7<br />
Figure 13b: Provider Driver, <strong>Waters</strong>hed Investment Programs, Globally 7<br />
Figure 14: Average Amount <strong>of</strong> Dollars per Hectare Transacted in 2011, by Country 8<br />
Figure 15a: <strong>Waters</strong>hed Investments by Payer Type, Globally 8<br />
Figure 15b: <strong>Waters</strong>hed Investments by Payer Type, Globally, Excluding China 8<br />
Figure 16: Transactions by <strong>Waters</strong>hed Investment Program Type, Globally 9<br />
Figure 17: Active Investment in <strong>Waters</strong>hed Services Programs by Type 9<br />
Figure 18: Management Interventions Used by <strong>Waters</strong>hed Investment Programs, by Region 10<br />
Figure 19: Stacking and Bundling with <strong>Waters</strong>hed Investments, Globally 12<br />
Figure 20: Socio-Economic Objectives Reported by <strong>Waters</strong>hed Investment Programs Globally 12<br />
Figure 21: Active IWS Programs by Transactions and Hectares Protected, 2008-2011, Africa 17<br />
Figure 22: Growth in Investments in <strong>Waters</strong>hed Services in China 23<br />
Figure 23: <strong>New</strong> <strong>Waters</strong>hed Investment Programs by Area <strong>of</strong> Focus, China 24<br />
Figure 24: Composition <strong>of</strong> Estimated Annual Eco-Compensation Funds, China 25<br />
Figure 25: Total Area Protected by IWS Program Composition, China 26<br />
Figure 26: Demand for IWS by Buyer Type, Southeast Asia 29<br />
Figure 27: Active IWS Programs by Seller Type, Europe 37<br />
Figure 28: Active IWS Programs by BuyerType, Europe 37<br />
Figure 29: Annual <strong>Waters</strong>hed Investments by Year and Country 2001-2011, Latin America 43<br />
Figure 30: Average IWS Program Payment Ranges in 2011 (Cash and In-kind), Latin America 46<br />
Figure 31: <strong>New</strong> IWS Programs by Year and Type, North America 51<br />
Figure 32: Annual IWS Transactions by Year and Program Type 2009-2011, North America 51<br />
Figure 33: <strong>Waters</strong>hed Investors by Sector - Bilateral and Fund Arrangements, North America 53<br />
Figure 34: Annual Transactions 2001-2011, Water Quality Trading, North America 57<br />
Figure 35: Buyers by Sector, Water Quality Trading in North America 59<br />
Figure 36: Sellers by Sector, Water Quality Trading in North America 59<br />
Figure 37: Management Interventions Used to Generate Water Quality Credits, North America 60<br />
Figure 38: <strong>New</strong> Instream Buybacks and Groundwater Offset Programs by Year and Type, North America 66<br />
<strong>State</strong> <strong>of</strong> <strong>Waters</strong>hed <strong>Payments</strong> 2012 | xv
List <strong>of</strong> Maps<br />
Map 1: Global IWS Transactions by Country x<br />
Map 2: Active and Developing Programs, Africa 16<br />
Map 3: Active Programs, Asia 22<br />
Map 4: Active and Developing Programs, Europe 34<br />
Map 5: Active Programs, Latin America 42<br />
Map 6: Active Programs by <strong>State</strong>, United <strong>State</strong>s 50<br />
Map 7: Historical Transactions by <strong>State</strong>, United <strong>State</strong>s 50<br />
Map 8: 2011 Average Credit Prices by <strong>State</strong>, United <strong>State</strong>s 61<br />
Map 9: Instream Buybacks in 2011 by <strong>State</strong>, United <strong>State</strong>s 63
Foreword<br />
Water, like its flow through the physical landscape, touches almost every sector <strong>of</strong> society and aspect <strong>of</strong> human life. Businesses are<br />
materially affected by water risks and dependencies; governments are charged with building systems to ensure clean and continuous<br />
supplies <strong>of</strong> water; human settlements are vulnerable to flooding and climate instability; and our food systems that sustain the well-being<br />
<strong>of</strong> a global population <strong>of</strong> over seven billion are strikingly vulnerable to changes in the water cycle. This immediate and inextricable<br />
connection between people and water means that vulnerability in water systems are at the top <strong>of</strong> the most pressing environmental<br />
challenges facing society this century.<br />
Throughout the development <strong>of</strong> human civilization, people have been acutely aware <strong>of</strong> the value <strong>of</strong> watersheds. Almost all major cities,<br />
from Babylon to Beijing to <strong>New</strong> York City, were built around access to clean water – along rivers, lakes, and estuaries. Even as our<br />
modern civilization becomes more and more detached from the natural world, our fundamental need for clean water remains. This<br />
immediate and inextricable connection between people and water means that vulnerability in water systems are among the most<br />
pressing economic and environmental challenges facing society this century.<br />
Societies <strong>of</strong>ten respond to water problems by investing in “grey” infrastructure like storage reservoirs, water transfers from one river<br />
basin to another, piped drainage, and water treatment systems. Such infrastructure is not the only piece <strong>of</strong> the equation. In nearly all<br />
cases, our drinking water also flows through a watershed. Protecting the health <strong>of</strong> this watershed can not only improve water flowing<br />
through the tap but also across the landscape. Maintaining ecological systems to support water quality or supplies is far more cost<br />
effective in some cases than grey solutions. Still, watershed protection inevitably requires us to pay for or invest in something that we<br />
have for centuries thought was free.<br />
In this report, we track new and innovative watershed management tools emerging across the globe – from local communities,<br />
individual businesses, and regional and national governments. These approaches, which are effective, affordable, and sustainable,<br />
work to enhance the landscapes and ecological processes that naturally maintain and regulate water flows, instead <strong>of</strong> trying to recreate<br />
them with bricks and mortar<br />
Figure 7: Sample IWS Project<br />
engineering. Known as investments<br />
in watershed services (IWS), these<br />
approaches address the natural<br />
landscape and the overlying social<br />
and economic fabric – which <strong>of</strong>ten<br />
directly controls the health <strong>of</strong> the<br />
natural environment.<br />
Projects are as varied as the communities<br />
and countries in which<br />
they take place and go by different<br />
names: payments for watershed<br />
services, reciprocal agreements for<br />
water, water funds, eco-compensation,<br />
benefit-sharing arrangements,<br />
source water protection, green infrastructure<br />
investments, and so on.<br />
This report focuses on such investments<br />
in watershed services (IWS).<br />
These investments are one tool to<br />
deal with the water crisis and to<br />
Source: <strong>Forest</strong> <strong>Trends</strong><br />
<strong>State</strong> <strong>of</strong> <strong>Waters</strong>hed <strong>Payments</strong> 2012 | 1
manage water quality and supplies. While IWS is not the only solution, it has the potential to be a central component <strong>of</strong> watershed<br />
solutions in many parts <strong>of</strong> the world, with myriad co-benefits for local communities, biodiversity, and climate adaptation.<br />
The following analysis presents a landscape filled with tremendous variety and creativity. It is our hope that by capturing in this report<br />
the range <strong>of</strong> available mechanisms for investment, future project developers may find useful models for their own work.<br />
As diagrammed in Figure 7, the essence <strong>of</strong> watershed investment or payments is to provide incentives to landholders and other actors<br />
impacting the landscape, to manage water resources in a way that sustains clean and reliable water supplies for beneficiaries. This is<br />
usually an upstream provider-downstream beneficiary relationship – although, as you’ll see in later chapters, not always.<br />
In 2010, <strong>Forest</strong> <strong>Trends</strong>’ Ecosystem Marketplace released the first <strong>State</strong> <strong>of</strong> <strong>Waters</strong>hed <strong>Payments</strong> report. This is the second report in<br />
which we’ve catalogued data on payments, impacts, and stakeholders for over 200 active programs. Months <strong>of</strong> online research, interviews,<br />
questionnaires, emails, and phone calls have resulted in the following snapshot <strong>of</strong> these investments globally.<br />
Increasing transparency and access to information around investments in conservation is the core mission <strong>of</strong> <strong>Forest</strong> <strong>Trends</strong>’ Ecosystem<br />
Marketplace. If you find this report useful, we encourage you to utilize our (free) ongoing coverage on investments in watershed<br />
services at www.ecosystemmarketplace.com and detailed project inventory on www.watershedconnect.org.<br />
Leveraging<br />
the Landscape<br />
<strong>State</strong> <strong>of</strong> the <strong>Forest</strong><br />
Carbon Markets 2012<br />
2 | <strong>Charting</strong> <strong>New</strong> <strong>Waters</strong><br />
Michael B. Jenkins,<br />
President and CEO, <strong>Forest</strong> <strong>Trends</strong><br />
PREMIUM SPONSORS SPONSORS<br />
DEVELOPING<br />
DIMENSION:<br />
<strong>State</strong> <strong>of</strong> the Voluntary<br />
Carbon Markets 2012<br />
PREMIUM SPONSOR SPONSORS<br />
Katherine Hamilton,<br />
Director, Ecosystem Marketplace<br />
<strong>State</strong> <strong>of</strong> Biodiversity Markets<br />
Offset and Compensation Programs Worldwide<br />
<strong>State</strong> <strong>of</strong> Biodiversity Markets 1<br />
<strong>Charting</strong> <strong>New</strong> <strong>Waters</strong><br />
<strong>State</strong> <strong>of</strong> <strong>Waters</strong>hed <strong>Payments</strong> 2012<br />
Standard on Biodiversity Offsets
Methodology<br />
Approach and Scope<br />
This report aims to track global transactions paying for or otherwise incentivizing the restoration, enhancement, or protection <strong>of</strong><br />
watershed services.<br />
As we noted in our “<strong>State</strong> <strong>of</strong> <strong>Waters</strong>hed <strong>Payments</strong> 2010” report, this is not always a case <strong>of</strong> “apples to apples” in comparing projects,<br />
as we see a tremendous variety <strong>of</strong> models on the ground for financing watershed rehabilitation and conservation. As far as scope,<br />
we have endeavored to include mechanisms where a clear buyer and seller (generally, representing the “beneficiary” and “provider”<br />
<strong>of</strong> watershed services, respectively) exist, where some form <strong>of</strong> remuneration for providing those services takes place, and where the<br />
primary motivation is clearly water. In contrast to the last report, we do not include bundled agri-environmental payment schemes in<br />
our tracking. These mechanisms, which include for example agricultural subsidies for sustainable farming practices, can and do support<br />
watershed health, but have not been included here.<br />
Our findings are based primarily on data collected through a survey <strong>of</strong> program administrators. Respondents were asked to provide<br />
information about program design and annual aggregate transactions. We define an ‘active’ program as one which has seen transactions<br />
taking place in 2009, 2010, or 2011. Units transacted and payment values are reported according to the year in which payments<br />
actually exchanged hands, rather than the year in which a contract was signed, as payment timing can vary considerably - either taking<br />
place up-front, at regular intervals on an ongoing basis or over some period specified in the contract, or conditional upon some<br />
outcome.<br />
We believe that market participants, observers, and stakeholders will benefit from improved transparency and access to information<br />
about these types <strong>of</strong> programs. We have attempted to follow up with respondents where necessary to clarify or confirm survey responses.<br />
But as is our practice at Ecosystem Marketplace, we do not attempt to “screen” projects for perceived quality <strong>of</strong> outcomes<br />
or project design.<br />
We also do not attempt to extrapolate data on overall global market size. Gathering project-level information at a global scale on<br />
mechanism design, transaction values, and project outcomes is no small undertaking. Information on projects and programs is <strong>of</strong>ten<br />
scarce, fragmented, and rapidly changing. This report represents our most comprehensive inventory <strong>of</strong> programs yet, but it is by no<br />
means the complete picture. In all cases, we have done our best to err on the side <strong>of</strong> conservatism in our estimates and analyses, and<br />
report only the best available data.<br />
In all cases, exchange rates are in 2012 US dollars. For Chinese Yuan, we have used a rate <strong>of</strong> 6.23 Yuan to the dollar.<br />
Data Sources<br />
Our primary sources <strong>of</strong> data are responses<br />
to a survey disseminated to known projects<br />
and through <strong>Forest</strong> <strong>Trends</strong>’ networks.<br />
Overall, 61% <strong>of</strong> program administrators responded<br />
to our survey.<br />
Survey data was complemented by direct<br />
and<br />
contact with more than fifty practitioners,<br />
project developers, and market observers,<br />
either through phone interview or email.<br />
We have also relied extensively on published<br />
and unpublished research and analy-<br />
100%<br />
80%<br />
60%<br />
40%<br />
20%<br />
0%<br />
9<br />
28<br />
Latin<br />
America<br />
Figure 8: Survey Figure Response 8. Rates<br />
43<br />
61<br />
North<br />
America<br />
7<br />
14<br />
Asia<br />
excluding<br />
China*<br />
6 5<br />
6 4<br />
4<br />
74<br />
115<br />
Africa Europe Oceania Global<br />
*Chinese data was not collected via survey Responses No responses<br />
Source: Ecosystem Marketplace.<br />
<strong>State</strong> <strong>of</strong> <strong>Waters</strong>hed <strong>Payments</strong> 2012 | 3<br />
2
sis (which is cited throughout the report), reports, articles, and general and targeted internet searches. In China, we relied entirely on<br />
desk research and direct contact with program developers and did not use a survey.<br />
Colleagues expert in each <strong>of</strong> the geographic regions we cover have been kind enough to review our regional chapters to ensure that<br />
we’ve captured key trends and initiatives.<br />
4 | <strong>Charting</strong> <strong>New</strong> <strong>Waters</strong>
Global Findings<br />
Table 3: Summary Details, Global<br />
Number <strong>of</strong> active programs: 205<br />
Number <strong>of</strong> programs in development: 76<br />
Value <strong>of</strong> transactions in 2011: $8.17 billion<br />
Value <strong>of</strong> transactions 1973-2011: $66 billion<br />
Hectares managed for watershed services in 2011: 117 million hectares<br />
Hectares managed for watershed services 1973-2011: 195 million hectares<br />
General Status Update<br />
Source: Ecosystem Marketplace.<br />
Overall, we tracked 205 programs around the world. More than half are in China (61) and the United <strong>State</strong>s (67). In all, watershed<br />
investment programs are taking place in 29 countries, though a staggering 91% <strong>of</strong> payments in 2011 took place in China (see Map 1).<br />
Despite the exclusion <strong>of</strong> bundled government agri-environmental schemes (which were tracked in our last report, and which are<br />
estimated at at least $3.8 billion in 2011), 2011 saw more than $8 billion in transactions around the world. 4 These figures are conservative;<br />
data was available for just over half <strong>of</strong> active programs’ transactions for the year. Actual payments are likely higher.<br />
Billions<br />
$9<br />
$8<br />
$7<br />
$6<br />
$5<br />
$4<br />
$3 $3<br />
$2<br />
$1<br />
$0<br />
Figure 9: Global Annual Transactions, 2008-2011<br />
2008 2009 2010 2011<br />
Source: Ecosystem Marketplace.<br />
4 In this report, where we make comparisons with our 2008 baseline, we have adjusted those numbers to reflect this tightened scope.<br />
<strong>State</strong> <strong>of</strong> <strong>Waters</strong>hed <strong>Payments</strong> 2012 | 5
Number <strong>of</strong> Programs<br />
80<br />
70<br />
60<br />
50<br />
40<br />
30<br />
20<br />
10<br />
Figure 11a: <strong>Waters</strong>hed Investments by Region, 2011<br />
Latin America North America<br />
$85.9 million $360.5 million<br />
Africa<br />
$109.3 million<br />
Transactions by the Numbers<br />
Looking at demand, we see a range <strong>of</strong> “buyers” <strong>of</strong> watershed services across sectors, while private landholders – <strong>of</strong>ten agricultural producers<br />
and forestland holders – continue to be the most prominent “sellers.” However, interventions to enhance or maintain hydrological<br />
functions on public land make up more than 25% <strong>of</strong> transactions. Privately-generated watershed services are not uncommon; this category<br />
is mostly made up <strong>of</strong> point-source facilities in the United <strong>State</strong>s (i.e., facilities that discharge to water bodies through a single conveyance)<br />
who have discharged less than their permit allows and thus been able to sell water quality credits. This group also holds some<br />
innovative programs, such as a mussel bed farmer in Sweden that is paid for nitrate filtration services by a municipality in lieu <strong>of</strong> constructing<br />
a wastewater treatment plant, 5 and a private nutrient bank in Virginia that restores degraded lands to generate nutrient credits.<br />
5 See page 38.<br />
6 | <strong>Charting</strong> <strong>New</strong> <strong>Waters</strong><br />
0<br />
Source: Ecosystem Marketplace.<br />
Figure 10: <strong>New</strong> Programs by Year, Globally<br />
Oceania $149.2<br />
million<br />
Europe<br />
$2.7 million<br />
Asia<br />
$7.5 billion<br />
Source: Ecosystem Marketplace.<br />
Figure 11b: <strong>Waters</strong>hed Investments by Region, Historically<br />
L<br />
Latin America $<br />
$527.6 million North America<br />
$6.3 billion<br />
Europe<br />
$57.7 million<br />
Afric<br />
Africa<br />
$864 $864.7 7 m<br />
$864.7 $864 7 million illi<br />
Oceania<br />
$1.8 billion<br />
Source: Ecosystem Marketplace.<br />
Asia<br />
$56.4 billion
On both the payer and provider side, participation is still largely voluntary. However, the share <strong>of</strong> participants driven by policy frameworks<br />
is growing, suggesting that compensation for watershed services is gaining popularity as a carrot to accompany regulatory<br />
sticks.<br />
Figure 13a.<br />
25%<br />
Figure 12a: Global Demand for Investments in<br />
<strong>Waters</strong>hed Services by Sector<br />
11%<br />
1%<br />
25%<br />
11%<br />
6%<br />
21%<br />
Federal<br />
St <strong>State</strong>/Province t /P i<br />
County<br />
Municipal<br />
Private<br />
Civil/NGO<br />
Academic<br />
Figure 12b: Global Supply <strong>of</strong> Investments in<br />
<strong>Waters</strong>hed Services by Sector<br />
1%<br />
5%<br />
9%<br />
Average payments per hectare ranged considerably, as evidenced by Figure 14. Payment levels can be affected by local resources,<br />
opportunity costs, the value (perceived or otherwise) and costs <strong>of</strong> the intervention itself, transaction costs, and also project<br />
stage. For example, Working for Water, the largest program in South Africa, reported hectares newly rehabilitated from invasive<br />
plant species in 2011. Intensive restoration will likely cost much more on a per-hectare basis than annual maintenance<br />
payments thereafter, or ongoing payments for soil and water conservation measures undertaken by agricultural producers.<br />
7%<br />
47%<br />
7%<br />
6%<br />
4%<br />
14%<br />
Federal<br />
<strong>State</strong>/Province<br />
County<br />
Municipal<br />
Private landholders<br />
Business/Industry<br />
Civil/NGO<br />
Source: Ecosystem Marketplace. Source: Ecosystem Marketplace.<br />
Figure 13a: Payer Driver,<br />
<strong>Waters</strong>hed Investment Programs, Globally<br />
42%<br />
58%<br />
Voluntary<br />
Compliance<br />
Academic<br />
Communally‐Held y Lands<br />
Figure 13b: Provider Driver,<br />
<strong>Waters</strong>hed Investment Programs, Globally<br />
Figure 13b. Provider Driver, <strong>Waters</strong>hed Investment Programs Globally<br />
23%<br />
Source: Ecosystem Marketplace. Source: Ecosystem Marketplace.<br />
77%<br />
Voluntary<br />
Compliance<br />
<strong>State</strong> <strong>of</strong> <strong>Waters</strong>hed <strong>Payments</strong> 2012 | 7
$800<br />
$700<br />
$600<br />
$500<br />
$400<br />
$300<br />
$200<br />
$100<br />
$‐<br />
Payer Type<br />
Considered by payer type – beneficiary, polluter, or a public<br />
good payer – payments were overwhelmingly initiated by<br />
public good payers like governments and NGOs. However,<br />
China again skews these numbers with massive spending by<br />
government eco-compensation programs (see Figure 11).<br />
When China is set aside, beneficiary-pays programs account<br />
for an estimated $162 million out <strong>of</strong> $517 million in global<br />
transactions, or nearly a third <strong>of</strong> payments. Polluter-pays<br />
programs, leaving aside China, comprise about three percent<br />
<strong>of</strong> transactions.<br />
Program Type<br />
The role <strong>of</strong> policy in driving compensation mechanisms is also evident when examining transactions by program type, as depicted in<br />
Figure 16. 6 Bilateral, regulation-driven contracts were the dominant model as far as payments generated. Again, we see the influence<br />
<strong>of</strong> Chinese eco-compensation on global figures.<br />
0<br />
Figure 15a: <strong>Waters</strong>hed Figure 4a. Investments by Payer Type, Figure 15b: <strong>Waters</strong>hed Investments by Payer Type,<br />
Figure 4b.<br />
Globally<br />
Globally, Excluding China<br />
3%
It is interesting to contrast this with the share <strong>of</strong> active programs <strong>of</strong> each type; bilateral regulation-driven programs account for twelve<br />
percent <strong>of</strong> all programs but 82% <strong>of</strong> transactions. This indicates that not only may payments be higher when a regulatory stick or policy<br />
framework is involved, but also that these programs tend to be larger in scale. Beneficiary-pays funds, for example, comprise 28% <strong>of</strong><br />
all programs but tend to be smaller in scale, with funds created and managed at a catchment level.<br />
82%<br />
Figure 16: Transactions by <strong>Waters</strong>hed<br />
Investment Program Type, Globally<br />
8%<br />
8% 2%<br />
Number <strong>of</strong> Programs Employing Intervention<br />
140<br />
120<br />
100<br />
80<br />
60<br />
40<br />
20<br />
0<br />
Co-Benefits<br />
Sixty-six programs – nearly a third <strong>of</strong> those tracked– reported some form <strong>of</strong> stacking and bundling (see Figure 19 and Box 1). Conservation<br />
<strong>of</strong> habitats that support biodiversity was the most common ecosystem service targeted. Most <strong>of</strong>ten this meant protection or<br />
rehabilitation <strong>of</strong> ecologically valuable habitats, although a large number <strong>of</strong> bundled biodiversity payments were instream buybacks in<br />
the US and Australia, where restoring natural flow regimes was expected to support aquatic and riparian habitats. These programs are<br />
<strong>of</strong>ten driven by concerns about endangered and threatened species. Ecuador was an outsized player; its programs reported multiple<br />
instances <strong>of</strong> bundling and stacking.<br />
Although we did not ask programs to provide detailed information on how bundled environmental co-benefits are measured, protected,<br />
or monitored, we suspect that there is considerable variation across programs, ranging from assuming habitat protection will<br />
deliver biodiversity benefits to very detailed tracking and management strategies.<br />
Thirteen programs reported that stacking payments for co-benefits was taking place. These tended to be Latin American water funds<br />
or programs supported by a single buyer.<br />
10 | <strong>Charting</strong> <strong>New</strong> <strong>Waters</strong><br />
Figure 18: Management Interventions Used by <strong>Waters</strong>hed Investment Programs, by Region<br />
Oceania North<br />
America<br />
Latin<br />
America<br />
Europe Asia Africa<br />
Source: Ecosystem Marketplace.<br />
Other<br />
Fire suppression<br />
Water right transaction<br />
Stormwater management<br />
Restoration<br />
Protection<br />
Operational management<br />
Agricultural best management practices<br />
Afforestation/reforestation
Box 1: Environmental Co-Benefits: “Stacking” and “Bundling”<br />
While the majority <strong>of</strong> market-based and incentive programs for watershed protection<br />
remain focused on a single water-related service, there is growing interest in programs<br />
that protect or restore multiple ecosystem services in addition to the targeted or primary<br />
service <strong>of</strong> interest. These programs either ‘stack’ or ‘bundle’ multiple individual services<br />
or credit types to realize potentially greater environmental and market efficiency benefits<br />
than single service programs can deliver. Despite the potential benefits, both stacking<br />
and bundling present challenges in terms <strong>of</strong> program design and implementation<br />
that need to be addressed – there is currently a lack <strong>of</strong> clarity around:<br />
• What is meant by stacking and bundling,<br />
• How programs are actually implementing stacking or bundling,<br />
• How legal or regulatory contexts affect the potential for stacking or bundling,<br />
• How stacking and bundling will affect program elements such as transaction<br />
costs, additionality, and social co-benefits or impacts, and<br />
• The pros and cons <strong>of</strong> stacking and bundling in a particular program context.<br />
Lack <strong>of</strong> a consistent terminology has made it difficult to evaluate stacking and bundling in<br />
practice, with bundling sometimes referring to financial bundling <strong>of</strong> payments and other<br />
times to the ecological bundling <strong>of</strong> services (the sense used here). Stacking in particular<br />
has been a confusing topic with a proliferation <strong>of</strong> terms, including horizontal stacking,<br />
vertical stacking, temporal stacking, layering, and piggybacking. Standard definitions are<br />
emerging however, which will make it much easier to critically evaluate both stacking<br />
and bundling approaches (see sidebar).<br />
Why bundle or stack?<br />
The growing interest in bundling and stacking reflects increasing recognition <strong>of</strong> the potential<br />
benefits – both in terms <strong>of</strong> market or program efficiencies and in environmental<br />
benefits – including:<br />
• Greater incentives for conservation from price premiums for bundling or multiple<br />
revenue streams from stacking;<br />
• More effective conservation through valuing the suite <strong>of</strong> services a land or<br />
seascape typically produces, and less likelihood for negative trade-<strong>of</strong>fs such as<br />
maximizing carbon sequestration at the expense <strong>of</strong> water or biodiversity;<br />
• More resilient markets or IWS programs with stacking if access to multiple revenue<br />
streams buffers sellers against collapse <strong>of</strong> individual markets or revenue<br />
sources; and<br />
• Better management <strong>of</strong> social impacts (both positive and negative) as inclusion<br />
<strong>of</strong> multiple ecosystem services necessitates a broader consideration <strong>of</strong> multiple<br />
beneficiaries.<br />
Research needed to realize the potential <strong>of</strong> stacking and bundling:<br />
• Critical evaluation <strong>of</strong> the ecological benefits <strong>of</strong> stacking or bundling compared to<br />
single service programs.<br />
• Case studies documenting how stacking and/or bundling are being implemented<br />
in IWS programs.<br />
• Evaluation <strong>of</strong> additionality and the potential for double counting with credit stacking<br />
– implications for regulatory and voluntary programs.<br />
• Critical assessment <strong>of</strong> the demand for bundled or stacked credits in both voluntary<br />
and regulatory programs.<br />
• Effects <strong>of</strong> stacking or bundling on transaction costs and recommendations for<br />
minimizing these costs.<br />
Bundling: A suite <strong>of</strong> ecosystem services<br />
provided by an area <strong>of</strong> land/sea<br />
is sold as a single package (i.e., in the<br />
form <strong>of</strong> one credit type) to a single<br />
buyer. One payment occurs for a set <strong>of</strong><br />
multiple services that cannot be disaggregated<br />
(Wunder & Wertz-Kanounnik<strong>of</strong>f,<br />
2009; LaRocco & Deal, 2011;<br />
Deal, Cochran, & LaRocco, 2012).<br />
In the U.S., wetland mitigation banking<br />
and wetland credits illustrate bundling<br />
<strong>of</strong> multiple ecosystem services – wetland<br />
credits are typically based on the<br />
area <strong>of</strong> wetland but a single wetland<br />
credit includes the aggregated set <strong>of</strong><br />
services typical <strong>of</strong> wetlands – including<br />
water purification, flood hazard mitigation,<br />
carbon sequestration, landscape<br />
beauty, and recreation – the set<br />
is sold or traded as a single credit type.<br />
Stacking: A set <strong>of</strong> ecosystem services<br />
generated on a single land/sea area<br />
are disaggregated and sold individually<br />
as different credit types to multiple<br />
buyers (Olander & Cooley, 2012).<br />
Some authors have distinguished<br />
“horizontal” stacking, where the area<br />
<strong>of</strong> land is subdivided and a different<br />
credit type is sold from each subdivision,<br />
from ‘vertical’ stacking where<br />
the different credit types are all sold<br />
from the same area <strong>of</strong> land, but following<br />
(Fox, Gardner, & Maki, 2011)<br />
the emerging consensus definition for<br />
stacking is vertical stacking. ‘Temporal’<br />
stacking is a special case <strong>of</strong> vertical<br />
stacking where the different services<br />
come from the same land/sea area<br />
but may be sold at different times.<br />
The Ohio River Basin water quality<br />
trading program being developed by<br />
EPRI will include stacking <strong>of</strong> N, P, and,<br />
GHG emissions reduction credits - pilot<br />
transactions will implement and<br />
test protocols under development to<br />
allow for transparent and accountable<br />
credit stacking.<br />
<strong>State</strong> <strong>of</strong> <strong>Waters</strong>hed <strong>Payments</strong> 2012 | 11
Number <strong>of</strong> Programs<br />
40<br />
35<br />
30<br />
25<br />
20<br />
15<br />
10<br />
5<br />
0<br />
In all cases but one, payments came from “inside” the program – that is, through existing funding streams and established buyers,<br />
rather than a new set <strong>of</strong> buyers. We found one exception – the Carroll County source water protection program in Georgia in the<br />
United <strong>State</strong>s has sold streambank credits on land it has acquired for watershed protection, an intriguing model for revenue generation.<br />
Six developing programs in Latin America and Asia also reported that they’re exploring carbon payments, potentially through<br />
international carbon markets. The Conservation Marketplace <strong>of</strong> Minnesota has also developed pollinator credits with financing from<br />
General Mills which could potentially in the future be stacked with water quality credits from agricultural best management practices,<br />
though at present the two are generated on different lands.<br />
Fifty-three programs include explicit social objectives, exhibiting a variety <strong>of</strong> social goals (see Figure 20). Half <strong>of</strong> these are in China,<br />
where eco-compensation can be considered in part a rural welfare support program to more evenly distribute benefits <strong>of</strong> economic<br />
growth to poorer regions <strong>of</strong> the country.<br />
12 | <strong>Charting</strong> <strong>New</strong> <strong>Waters</strong><br />
Figure 5 19: Stacking and Bundling with <strong>Waters</strong>hed Investments, Globally<br />
Source: Ecosystem Marketplace.<br />
Figure 20: Socio-Economic Objectives Reported by <strong>Waters</strong>hed Investment Programs Globally<br />
13%<br />
1%<br />
9%<br />
14%<br />
5%<br />
6%<br />
4%<br />
48%<br />
Poverty alleviation<br />
Gender Equity<br />
Indigenous rights/management<br />
Community economic development<br />
Community management <strong>of</strong> resources<br />
Strengthening community social capital and<br />
institutions<br />
Maintenance <strong>of</strong> traditional landscapes<br />
Tenure security<br />
Source: Ecosystem Marketplace.<br />
Bundled: Biodiversity<br />
Bundled: Carbon<br />
BBundled: dl d LLandscape d BBeauty<br />
Stacked: Biodiversity<br />
Stacked: Carbon<br />
Stacked: Landscape beauty<br />
N b f l i
Investments in watershed services programs also appear to be pursued as a strategy for community development; program requirements<br />
like strong social capital, functioning institutions, and tenure security also support larger goals <strong>of</strong> socio-economic development.<br />
We see evidence that these social goals are being met. A compensation mechanism in Lake Naivasha, Kenya, for example, has found<br />
in its socio-economic monitoring that program participants have seen livelihood, food security, and gender equity benefits in just a<br />
few years <strong>of</strong> operation. 7 However, only sixteen programs reported that they are currently carrying out socio-economic monitoring. In<br />
other cases, monitoring <strong>of</strong> these impacts may be taking place but could not be confirmed.<br />
Table 5: Socio-Economic Co-Benefits Objectives Reported, by Country<br />
7 See page 17 for more information.<br />
Australia<br />
Bolivia<br />
Poverty alleviation <br />
Gender equity <br />
Indigenous management <br />
Local economic development <br />
Community management <strong>of</strong> resources <br />
Strengthening community social capital & institutions <br />
Maintenance <strong>of</strong> traditional landscapes <br />
Tenure security <br />
China<br />
Colombia<br />
Ecuador<br />
Source: Ecosystem Marketplace.<br />
France<br />
India<br />
Indonesia<br />
Kenya<br />
Mexico<br />
Pakistan<br />
Philippines<br />
South Africa<br />
Tanzania<br />
USA<br />
<strong>State</strong> <strong>of</strong> <strong>Waters</strong>hed <strong>Payments</strong> 2012 | 13
14 | <strong>Charting</strong> <strong>New</strong> <strong>Waters</strong>
Africa<br />
Table 6: Summary Details, Africa<br />
Number <strong>of</strong> active programs: 6<br />
Number <strong>of</strong> programs in development: 10<br />
Value <strong>of</strong> transactions in 2011: $109.3 million<br />
Value <strong>of</strong> transactions 1995-2011: $864.7 million<br />
Hectares managed for watershed services in 2011: 162,115 hectares<br />
Hectares managed for watershed services 1995-2011: 2.3 million hectares<br />
General Status Update<br />
Africa is perhaps the continent most vulnerable to climate change-driven freshwater risk. It is also – though rapidly urbanizing – still<br />
largely composed <strong>of</strong> disbursed low-income agrarian economies. For both <strong>of</strong> these reasons, low-cost, pro-poor, land-based interventions<br />
to ensure water security are an obvious fit. We’ve observed considerable interest in eastern and southern African countries in<br />
investments in watershed services. Africa <strong>of</strong>ten makes for a fascinating study in project design; active and proposed projects take a<br />
range <strong>of</strong> forms.<br />
Africa also makes for a useful lesson in the difficulty <strong>of</strong> getting projects <strong>of</strong>f the ground. Despite interest, projects <strong>of</strong>ten struggle to secure<br />
upfront capital for design and implementation, and long-term funding for operation. This is partly due to trouble finding buyers,<br />
but we <strong>of</strong>ten frequently see institutional and regulatory frameworks standing in the way <strong>of</strong> compensation for watershed services.<br />
Four <strong>of</strong> the ten active programs identified in 2010 are no longer in operation, while three <strong>of</strong> five developing projects in 2010 appear<br />
to have been abandoned.<br />
That said, the region also <strong>of</strong>fers some strong evidence for IWS’ effectiveness and ability to deliver multiple objectives – including<br />
socio-economic benefits and a bundle <strong>of</strong> environmental services. All but one <strong>of</strong> the active programs tracked reports social goals like<br />
poverty alleviation and gender equity at the core <strong>of</strong> program design, and the evidence that they’re succeeding is starting to come in.<br />
Transaction Activity<br />
Source: Ecosystem Marketplace.<br />
Altogether, the six active programs tracked delivered at least $109.3 million in payments in 2011, protecting nearly 161,000 hectares.<br />
Limiting sediment loads to water bodies and protecting extractive supplies were common program goals; in South Africa the removal<br />
<strong>of</strong> invasive plants is the focus <strong>of</strong> efforts, while in Uganda, a brewery pays for wetlands protection as a pollution filtration strategy.<br />
By far the largest program is South Africa’s Working for Water (WfW), a public works program that hires the long-term unemployed<br />
to remove invasive plant species. Alien invasive plants are a major contributor to de-watered streams and sedimentation problems<br />
in the country. Removing a large eucalyptus tree, which can draw 40,000 gallons <strong>of</strong> water a year through its roots, essentially puts<br />
all <strong>of</strong> that water back into the river system. In the Thukela catchment, for example, good management practice will deliver annually<br />
an estimated additional 12.8 million cubic meters <strong>of</strong> flows in the dry season and reduce sediment yields by 1.2 million cubic meters.<br />
Studies estimate that the program has saved South Africa more than $50 billion in avoided costs from invasive plant impacts (de Lange<br />
& van Wilgen, 2010).<br />
WfW employs nearly 30,000 people at present. Funds come from the government’s poverty relief fund as well as water use fees for<br />
households and foundation support. WfW spent $109 million in 2011 on watershed restoration efforts treating over 160,000 hectares.<br />
Working for Water has also joined forces with WWF on an initiative that works with companies to become “water use neutral”. The<br />
<strong>State</strong> <strong>of</strong> <strong>Waters</strong>hed <strong>Payments</strong> 2012 | 15
Guinea<br />
Source: Ecosystem Marketplace.<br />
Investment Programs in Africa (2011)<br />
Active Programs 6<br />
Programs in Development 10<br />
16 | <strong>Charting</strong> <strong>New</strong> <strong>Waters</strong><br />
1<br />
1<br />
Ghana<br />
Map 2: Active and Developing Programs, Africa<br />
Gabon<br />
1<br />
Zambia<br />
3<br />
South Africa<br />
Uganda 1<br />
1<br />
1<br />
3<br />
Kenya<br />
1 Tanzania<br />
2<br />
1 Malawi
Table 7: Active Programs, Africa<br />
Lake Naivasha <strong>Waters</strong>hed Management<br />
Project<br />
Water Balance Programme helps participating firms improve their water use efficiency and then <strong>of</strong>fset the remainder through catchment<br />
restoration via WfW contracts. South African Breweries piloted the methodology; more recently, insurance company Sanlam,<br />
chip manufacturer Sonae Novobord, and retailer Woolworths have also gotten involved.<br />
A similar invasive plants species-removal program is underway in Cape Town, where the Cape Town City Council has partnered with<br />
a local conservation group, Cape Nature, and public and private landowners to clear invasive aquatic plants to improve supplies and<br />
water quality for the city.<br />
In Kenya’s Lake Naivasha basin, the WWF-CARE consortium’s Equitable <strong>Payments</strong> for <strong>Waters</strong>hed Services (EPWS) program has supported<br />
a compensation mechanism linking upstream farmers with downstream users. A receding shoreline, expensive clogging <strong>of</strong><br />
irrigation systems due to sediment, and declining biodiversity and landscape beauty are all cited as motivating factors for buyers,<br />
whom at present include the Lake Naivasha Water Resource Users Association (LANAWRUA), representing large-scale horticulture<br />
farms, ranchers, and hoteliers near the lake. Farmers in the upper catchment, represented by local Water Resource Users Associations<br />
(WRUAs) receive annual vouchers worth $17 each that can be redeemed for agro-inputs, in exchange for implementing agricultural<br />
best management practices and protecting riparian areas.<br />
Figure 21: Active IWS Programs by Transactions and Hectares Protected, 2008-2011, Africa<br />
<strong>Payments</strong> (in millions)<br />
$120<br />
$100<br />
$80<br />
$60<br />
$40<br />
$20<br />
$‐<br />
$63<br />
Country Payer type Driver Payment Co-Benefits<br />
Kenya Beneficiary pays Voluntary Cash, In-kind<br />
Working for Water South Africa Public good payer Voluntary Cash, In-kind<br />
$67<br />
$97<br />
Figure 21.<br />
$109<br />
2008 2009 2010 2011<br />
Source: Ecosystem Marketplace.<br />
200<br />
180<br />
160<br />
140<br />
120<br />
100<br />
80<br />
60<br />
40 40<br />
20<br />
0<br />
Hectares protected<br />
<strong>Payments</strong><br />
Stacked: Biodiversity,<br />
Landscape beauty<br />
Bundled: Biodiversity,<br />
Carbon sequestration,<br />
Landscape beauty<br />
Cape Town City Council South Africa Beneficiary pays Voluntary Cash Bundled: Biodiversity<br />
Water Balance Programme* South Africa Polluter pays Voluntary Cash Bundled: Biodiversity<br />
Uluguru Mountains Tanzania Beneficiary pays Voluntary Cash, In-kind<br />
Uganda Breweries/National<br />
Wetland Programme<br />
Stacked: Carbon sequestration<br />
Uganda Polluter pays Voluntary Cash Bundled: Biodiversity<br />
* Note: This program contracts with Working for Water to carry out catchment management activities.<br />
Hectares protected (in thousands)<br />
<strong>State</strong> <strong>of</strong> <strong>Waters</strong>hed <strong>Payments</strong> 2012 | 17
Participating farmers report that they have used their vouchers to buy high-value crop seeds, which result in harvest revenues 30<br />
times the value <strong>of</strong> the original voucher payment. Recent program evaluation also confirms that the mechanism has led to improved<br />
food security and livelihoods among participants – and that these benefits appear to be shared equitably gender-wise. $12,070 was<br />
disbursed in payments in 2011, with 1,150 hectares enrolled to date.<br />
The Equitable <strong>Payments</strong> for <strong>Waters</strong>hed Services program has also supported a pilot program in Tanzania, where the Dar es Salaam<br />
municipal water supplier DAWASCO has begun to compensate villages in the Uluguru Mountains for changing land-use practices,<br />
including implementing agr<strong>of</strong>orestry and limiting erosion, as well as riparian rehabilitation. Two hundred households in the upper<br />
catchment participate, with payments channeled through village councils. Coca-Cola and SAB (a brewery) have also signed MOUs as<br />
<strong>of</strong> 2011.<br />
<strong>Payments</strong> are designed to cover both hydrological benefits and carbon sequestration, and are outcome based – households receive<br />
$0.20 per year per surviving seedling planted. Farmers receive free seedlings and training in planting and maintenance. An evaluation<br />
one year into the program found that many farmers would be willing to continue managing and protecting trees even if payments<br />
were to cease; they felt that the training, seedlings, and expected income from forest products were sufficient incentive (PRESA,<br />
2011).<br />
Finally, we identified a program in Uganda, wherein Uganda Breweries Limited in Kampala makes voluntary payments to the National<br />
Wetlands Program in order to ensure the protection <strong>of</strong> nearby wetlands, which are valued for their ability to filter water pollution<br />
from brewery operations. Limited information is available about this effort.<br />
Outlook<br />
Activity in Africa has grown steadily since our tracking began, underpinned in large part by the success <strong>of</strong> South Africa’s Working for<br />
Water, which has become something <strong>of</strong> a banner program for pro-poor IWS. WfW expects budgets to continue to grow in the coming<br />
years for its activities, and has launched sister programs including Working for <strong>Forest</strong>s, Working for Wetlands, and Working on Fire<br />
following a similar model <strong>of</strong> using rehabilitation as an engine for employment. WfW’s work in recent years with private-sector ‘buyers’<br />
is also an intriguing development as far as suggesting a public-private model for water resources management in the country.<br />
We identified an array <strong>of</strong> projects in development, including in Malawi, Kenya, Tanzania, Gabon, and Ghana. Quite a few <strong>of</strong> these<br />
are supported by the Pro-poor Rewards for Environmental Services in Africa (PRESA) initiative, part <strong>of</strong> the World Agr<strong>of</strong>orestry Center<br />
(ICRAF). With four watershed payments projects at varying stages <strong>of</strong> progress in Kenya and Guinea, the program has generated a large<br />
body <strong>of</strong> research findings and program design lessons.<br />
In late 2011, a payment mechanism was piloted in Kenya along the Kapingazi River which will compensate local households for tree<br />
planting. The mechanism is unique in that participating farmers signed one <strong>of</strong> two contracts: one set payments based on the implementation<br />
<strong>of</strong> practices such as watering seedlings, which were monitored regularly, while the second contract type had lower monitoring<br />
and payments based entirely conditional on seedling survival rates at the end <strong>of</strong> the six month contract. Farmers were engaged<br />
through a reverse auction mechanism wherein they submitted bids indicating their preferred level <strong>of</strong> compensation; the lowest bids<br />
were chosen for contracts. The pilot study is expected to generate important lessons for project design as to designing conditionality<br />
into a project (Andeltová & Nzyoka, 2012).<br />
Another developing program in Kenya, Green Water Credits, aims to engage agricultural producers at a basin scale in soil and water<br />
conservation practices, and compensate them for their efforts. Demonstrations <strong>of</strong> the methodology took place in Kenya and Morocco,<br />
and in 2011 program developers reached an agreement, with funding from international groups and Kenyan utilities, to pilot<br />
the model in Kenya.<br />
Program developers have also recently signed an MOU with the Changjiang (Yangtze River) Water Resources Protection Institute <strong>of</strong><br />
China, to co-implement the Green Water Credits concept – a development we’ll be watching closely in the future. China has indicated<br />
tremendous interest in watershed investment to date; cross-fertilization efforts like these can help both parties move up the program<br />
design learning curve more quickly, with lessons learned in Kenya getting a shot in the arm in the form <strong>of</strong> Chinese resources for implementation.<br />
The Green Water Credits concept is also taking root in Malawi’s Shire River Basin, which provides a full 98 percent <strong>of</strong> the country’s<br />
power generation capacity; heavy siltation in the basin has led to staggering costs for the Electric Supply Company <strong>of</strong> Malawi (“Es-<br />
18 | <strong>Charting</strong> <strong>New</strong> <strong>Waters</strong>
com”). The SIP-Private Public Sector Partnership on Capacity Building for Sustainable Land Management in the Shire River Basin, a<br />
GEF/UNDP funded program, aims to pilot a Green Water Credits mechanism in the Shire River basin districts <strong>of</strong> Blantyre, Balaka, Neno<br />
and Mwanza, with plans to ultimately develop a Shire River Basin Development Authority and basin-wide SLM incentive program.<br />
We’ve observed that several developing projects identified in a 2008 inventory remain in the developing stage. These ‘slow starts’ can<br />
be attributed to a number <strong>of</strong> factors, though a few common ones are emerging. One difficulty – securing demand – is well-known<br />
to PES project developers worldwide. In Africa, the problem is exacerbated by resource constraints. A PRESA project in Kenya in the<br />
Nyando and Yala River Basins that feed Lake Victoria, for example, found only smallholder farmers both upstream and downstream<br />
and concluded that it would be necessary to seek a public payment option since a beneficiary-pays model appeared unworkable.<br />
Sometimes the difficulty lies not in the absence <strong>of</strong> a buyer, but in institutional constraints. Legal hurdles are a commonly-cited barrier<br />
in some countries. Another PRESA project aiming to protect the Sasumua Reservoir, a water supply source for Kenya’s capital<br />
city Nairobi, had an interested buyer in the Nairobi Water Company (NWC). But NWC is prohibited from raising tariffs to fund such a<br />
mechanism, nor could it easily redirect existing fees it already paid into the state corporation Water Services Trust Fund (WSTF) via<br />
the national Water Resources Management Authority (WRMA), since such a use <strong>of</strong> funds was outside the WSTF mandate. Project<br />
developers have been able to negotiate a pilot through the WRMA and are currently pursuing reforms to Kenyan policy and legal<br />
frameworks (Mwangi, Gathenya, Namirembe, & Mwangi, 2012).<br />
2012 also saw work kick <strong>of</strong>f on a pre-feasibility assessment <strong>of</strong> IWS mechanisms in Ghana’s Pra and Kakum River basins serving the<br />
Sekondi-Takoradi Metropolitan Area and the city <strong>of</strong> Cape Coast. The study found high potential in both areas, which suffer from sedimentation<br />
and toxic chemical contamination. Plans for large investments in “grey” treatment infrastructure in the area also underscore<br />
the need for complementary “green” infrastructure investments to ensure clean, dependable supplies.<br />
A stakeholder working group has been convened by <strong>Forest</strong> <strong>Trends</strong> and its local partner, the Nature Conservation Research Centre to<br />
develop a “business case” and full feasibility assessment. The group is currently working to engage the Ghana Water Company and<br />
national Water Resources Commission to support a demonstration project in one or both <strong>of</strong> the watersheds.<br />
Significant policy support for investment in watershed resources can also be found across Africa. In Gabon, policymakers are developing<br />
a comprehensive legal framework for environmental protection and are supporting, through the Ministry <strong>of</strong> Environment, a pilot<br />
compensation mechanism in the Mbé <strong>Waters</strong>hed which aims to be operational by 2013. Encouragingly, a hydroelectric plant has<br />
already expressed interest in funding watershed protection around its reservoir. Gabon’s government is also exploring possibilities <strong>of</strong><br />
integrating payment mechanisms into future hydropower development, such as the Grand Poubara dam in the northeastern part <strong>of</strong><br />
the country.<br />
In Tanzania, 2011 saw the “Valuing the Arc” project beginning to draw to a close. A collaboration between WWF and the Tanzanian<br />
government, Valuing the Arc aimed to quantify ecosystem service values across the Eastern Arc Mountains, whose cloud forests provide<br />
much <strong>of</strong> Dar es Salaam’s drinking water and are the source <strong>of</strong> flows generating half <strong>of</strong> the country’s electricity. Project outcomes<br />
will be used to support payment mechanism proposals; for example, the Equitable <strong>Payments</strong> for <strong>Waters</strong>hed Services program plans<br />
to use their data.<br />
A similar valuation exercise was carried out in Kenya and completed in 2012 following an initial valuation <strong>of</strong> the country’s Mau <strong>Forest</strong><br />
Complex. The Kenyan <strong>Forest</strong> Service and the United Nations Environment Programme (UNEP) have collaborated on valuing the ecosystem<br />
services generated by the country’s montane forests and quantifying the true costs <strong>of</strong> deforestation (Government <strong>of</strong> Kenya &<br />
United Nations Environment Programme, 2012).<br />
In Zambia, the Water Futures Partnership, a consortium including SABMiller, WWF, and the Deutsche Gesellschaft für Internationale<br />
Zusammenarbeit (GIZ), has begun work on a mechanism to protect the Itawa springs, which provide water for the city <strong>of</strong> Ndola,<br />
where SABMiller subsidiary Zambian Breweries PLC operates a brewery. The project comes as part <strong>of</strong> a broader expansion <strong>of</strong> the<br />
Partnership – to be renamed the Water Futures Initiative – including new members like Coca-Cola and greater global reach.<br />
<strong>State</strong> <strong>of</strong> <strong>Waters</strong>hed <strong>Payments</strong> 2012 | 19
20 | <strong>Charting</strong> <strong>New</strong> <strong>Waters</strong>
Asia<br />
Table 8: Summary Details, Asia<br />
Number <strong>of</strong> active programs: 83<br />
Number <strong>of</strong> programs in development: 36<br />
Value <strong>of</strong> transactions in 2011: $7.46 billion<br />
Value <strong>of</strong> transactions 1979-2011: $56.43 billion<br />
Hectares managed for watershed services in 2011: 115.96 million hectares<br />
Hectares managed for watershed services 1979-2011: 188.5 million hectares<br />
General Status Update<br />
Source: Ecosystem Marketplace.<br />
When it comes to investments in watershed services, Asia is perhaps the world’s epicenter today. China is responsible for most <strong>of</strong> the<br />
transaction activity in the region by several orders <strong>of</strong> magnitude, but other Asian countries are also home to long-running compensation<br />
mechanisms, innovative mechanisms, and strong national policy support.<br />
High economic growth rates and population densities characterize the region. These contribute to rapid and intensive land conversion<br />
and pressure on water resources, which in turn are behind ecological degradation, water scarcity, and pollution problems. Climate<br />
risk is also making itself known in many areas, whether in the form <strong>of</strong> drought in China, receding glaciers in the Himalaya, or storminduced<br />
landslides in the Philippines.<br />
A range <strong>of</strong> program types and scales can be found in Asia – from China’s massive government-driven “Eco-Compensation” efforts, to<br />
local NGO-backed initiatives in Indonesia, to private-sector financing in the Philippines.<br />
In Southeast Asia, there is a long history <strong>of</strong> local-scale NGO-driven payment mechanisms. Many <strong>of</strong> these are part <strong>of</strong> the World Agr<strong>of</strong>orestry<br />
Center (ICRAF)’s RUPES (“Rewards for, Use <strong>of</strong> and shared investment in Pro-poor Environmental Services”) program and<br />
WWF-Care’s Equitable <strong>Payments</strong> for <strong>Waters</strong>hed Services initiative. But we may be seeing a slight turning <strong>of</strong> the tide: RUPES and WWF<br />
in 2011 were both winding down their engagement, having laid groundwork for programs to continue functioning under community<br />
leadership.<br />
At the same time, we may be witnessing the rise <strong>of</strong> national watershed investment programs and policies. Vietnam’s national <strong>Forest</strong><br />
Protection and Development Fund moved out <strong>of</strong> the pilot phase in 2011 after rapid scale-up <strong>of</strong> the model in two provinces from 2008<br />
to 2010. Now, other countries in Southeast Asia including Cambodia, Thailand, and Laos are expressing interest in the model, which,<br />
unlike prior national payment programs, sources its funding directly from beneficiaries like hydropower operators.<br />
China is responsible for 99.98% <strong>of</strong> payment values in 2011 in Asia – showing growth from our last report even despite a stricter standard<br />
for program inclusion. In this report, we have not included bundled agri-environmental programs where government payments<br />
target a bundle <strong>of</strong> environmental goods and not watershed services primarily.<br />
Chinese policy backing eco-compensation is stronger as well. Due to the extreme stress <strong>of</strong> several decades <strong>of</strong> breakneck extractive<br />
economic growth, water is now likely the single most pressing resource bottleneck to China’s ongoing economic growth over the next<br />
ten to fifteen years. China has among the lowest annual per capita freshwater resources for a major country, and a recent government<br />
report found that drinking water for one in seven Chinese does not meet national pollution standards, while 300 million rural Chinese<br />
lack access to safe drinking water (World Bank, 2007). The World Bank very conservatively estimates that the country’s water crisis<br />
is already costing the country 2.3 percent <strong>of</strong> its gross domestic product, <strong>of</strong> which 1.3 percent is attributable to water scarcity and the<br />
remainder from the direct impacts <strong>of</strong> water pollution (World Bank, 2007; Asian Development Bank, 2012).<br />
<strong>State</strong> <strong>of</strong> <strong>Waters</strong>hed <strong>Payments</strong> 2012 | 21
In face <strong>of</strong> these challenges, and given that China’s “economic miracle” has provided the government with the financial wherewithal<br />
to invest in its environment, national and regional governments across the country have been experimenting with a range <strong>of</strong> new<br />
regulatory and financial instruments to improve watershed management outcomes under the broad heading <strong>of</strong> “eco-compensation”.<br />
Eco-compensation appears to us a distinctly Chinese form <strong>of</strong> IWS, characterized by a voluntary public good ‘payer’, ongoing practicebased<br />
payments, and bilateral deals – all at a very large scale and <strong>of</strong>ten making participation for landholders (who may be working on<br />
communally-held <strong>State</strong> lands) mandatory.<br />
These programs represent a potentially important new direction in China’s evolving water resource management framework. The<br />
concept has also constituted an important rallying point and platform for debate and negotiation among key stakeholders in water<br />
management as to how fundamental and much-needed institutional reforms to the water sector, like clarifying access rights and<br />
enforcing regulations, can be approached.<br />
Outside <strong>of</strong> public support, we also tracked the emergence <strong>of</strong> programs initiated or supported by international NGOs – a most interesting<br />
development for a country that has long looked internally for IWS support. These include partnerships with existing ecocompensation<br />
frameworks as in the Miyun <strong>Waters</strong>hed demonstration project, as well as examples <strong>of</strong> cross-fertilization <strong>of</strong> models,<br />
like proposed nutrient trading in Anhui province and a Conservation International-backed water fund in Sichuan province.<br />
Transaction Activity<br />
China<br />
While it remains challenging to obtain detailed information on many local and provincial programs, and even some national programs,<br />
a clear picture has emerged <strong>of</strong> strong growth in both investments and the number and diversity <strong>of</strong> programs targeting watershed<br />
services in China.<br />
22 | <strong>Charting</strong> <strong>New</strong> <strong>Waters</strong><br />
Kyrgyzstan<br />
1<br />
Pakistan<br />
1<br />
India 1<br />
1<br />
Map 3: Active Programs, Asia<br />
2<br />
Nepal<br />
1<br />
61 China<br />
19<br />
Thailand<br />
1<br />
Indonesia 8<br />
6<br />
Source: Ecosystem Marketplace.<br />
1 Vietnam<br />
3<br />
4<br />
5 Philippines<br />
4<br />
Japan
Such growth is despite a stricter standard for inclusion compared to the 2010 <strong>State</strong> <strong>of</strong> <strong>Waters</strong>hed <strong>Payments</strong> report. In this report, only<br />
those programs that explicitly target watershed services as key benefits (as compared to a potential, but somewhat indirect, co-benefit)<br />
are included in the analysis. As a result, the current results exclude a few large-scale national forestry and agricultural programs<br />
that were included in previous reports.<br />
Even with such restrictions we conservatively estimate that total transactions for IWS programs in 2011 exceeded $7.46 billion, while<br />
total transactions to date are at least $56.42 billion, if not significantly more. More striking is the trend in total number <strong>of</strong> programs,<br />
as provincial and sub-provincial governments are increasingly launching their own watershed eco-compensation programs to address<br />
water management challenges, in response to encouragement by the central government. Starting from only a few (albeit very largescale)<br />
programs before 1999, the number <strong>of</strong> programs has exploded in recent years, jumping from around 5 in 2000 to 61 by 2011,<br />
with this a conservative estimate due to much information remaining unavailable.<br />
Number <strong>of</strong> Programs<br />
50<br />
45<br />
40<br />
35<br />
30<br />
25<br />
20<br />
15<br />
10<br />
5<br />
0<br />
Figure 22: Growth in Investments in <strong>Waters</strong>hed Services in China<br />
Source: Ecosystem Marketplace.<br />
The Eco-Compensation Model<br />
One <strong>of</strong> the most apparent trends we’ve tracked is the growth in programs directly concerned with watershed “eco-compensation.”<br />
There is no <strong>of</strong>ficial definition <strong>of</strong> an eco-compensation program, but generally speaking, current watershed management programs<br />
fall into two main types (though these <strong>of</strong>ten overlap): (i) Cross-Boundary <strong>Waters</strong>hed Management initiatives, and (ii) Water Source<br />
Protection initiatives. Cross-Boundary <strong>Waters</strong>hed Management initiatives focus on mechanisms and approaches to better coordinate<br />
and incentivize watershed management across jurisdictional boundaries, while Water Source Protection initiatives directly target and<br />
compensate for better management in the upper watersheds <strong>of</strong> reservoirs and river systems that are important sources <strong>of</strong> drinking<br />
water. In practice, these twin goals <strong>of</strong> compensation and cooperation are pursued through a variety <strong>of</strong> arrangements (see Box 2).<br />
Eco-compensation programs <strong>of</strong>ten also have a redistributive element, entailing the transfer <strong>of</strong> funds from urban and rich to rural and<br />
poor regions, or requiring that polluters compensate those experiencing environmental degradation from the polluting activity.<br />
Programs in the first group are <strong>of</strong>ten generally concerned with how best to develop cross-jurisdictional management frameworks that<br />
map out responsibilities, rights, and targets, and include a range <strong>of</strong> different financial transfer mechanisms. These include programs<br />
like the Min River <strong>Waters</strong>hed Water Resource Protection Eco-compensation Program, wherein downstream Fuzhou City annually<br />
provides roughly $800 million (CNY 5 million) each to upstream Sanming and Nanping cities, which also provide matching funds <strong>of</strong><br />
$800 million each for pollution control, source water protection, and township waste disposal in the basin. The Fujian government<br />
has also set up a special fund (under the Water Environmental Protection <strong>of</strong> the Min River Special Fund Administrative Measures)<br />
whereby the Fujian Provincial EPB and Development and Reform Commission provide $2.4 million (CNY 15 million) per year each, to<br />
be used mainly in the implementation <strong>of</strong> projects listed in the Min River Basin Water Environmental Protection Plan.<br />
Programs in the second group (though these <strong>of</strong>ten also have cross-jurisdictional elements), generally involve some form <strong>of</strong> direct<br />
compensation from downstream beneficiaries (water users and local governments) to upstream ecosystem services providers (local<br />
governments, communities, and households), with compensation being linked to direct interventions (e.g., land-use changes<br />
<strong>State</strong> <strong>of</strong> <strong>Waters</strong>hed <strong>Payments</strong> 2012 | 23
or restrictions, investment in waste management<br />
facilities, restructuring <strong>of</strong> husbandry and agricultural<br />
activities, etc.) (Zhang & Bennett, 2010). Such watershed<br />
programs have grown greatly in recent years,<br />
from around three in 2004 to more than 30 by 2012.<br />
One example <strong>of</strong> a program in which the polluter<br />
must compensate those who are negatively impacted<br />
by pollution is in Zhuhai City. Communities<br />
located within the drinking water source protection<br />
zone for Zhuhai City have lagged behind their neighbors<br />
in social and economic development, with<br />
residents long not easily able to enjoy the benefits<br />
<strong>of</strong> economic reforms, industrialization, and the results<br />
<strong>of</strong> modernization, so the that per capita rural<br />
incomes were around $130 below the township average.<br />
In 2009, the city earmarked $106 million and<br />
approved the Zhuhai City Drinking Water Source<br />
Protection Area Support and Incentive Instrument<br />
for a 5-year pilot period. This program will provide<br />
health insurance for 108,000 rural residents in the<br />
drinking water source areas as non-cash compensation<br />
for foregone livelihood benefits.<br />
Parallel to these developments there have been an<br />
increasing number <strong>of</strong> provincial <strong>Forest</strong> Ecosystem<br />
Compensation Fund (FECF) programs, which are<br />
related to the national program <strong>of</strong> the same name.<br />
These programs provide subsidies to communities,<br />
households, and forestry units for the management<br />
and protection <strong>of</strong> designated “ecological public ben-<br />
efit forests”. These “ecological public benefit forests” have imposed harvesting and use restrictions and are most <strong>of</strong>ten categorized as<br />
such due to the watershed ecosystem services they provide (e.g., “headwaters forests”, “riparian forests”, “mangrove forests”).<br />
Number <strong>of</strong> Programs<br />
70<br />
60<br />
50 50<br />
40<br />
30<br />
20<br />
10<br />
0<br />
24 | <strong>Charting</strong> <strong>New</strong> <strong>Waters</strong><br />
Box 2: Eco-Compensation in Action, China<br />
The term “Eco-Compensation” in China actually captures a variety <strong>of</strong><br />
frameworks for compensation and cooperation between government<br />
bodies and households, communities, and other arms <strong>of</strong> government.<br />
These include:<br />
• Direct payments from the government to individual and community<br />
suppliers <strong>of</strong> watershed ecosystem services to ensure and improve<br />
ecosystem service provision;<br />
• Compensation to households, communities, or regional governments<br />
for regulatory takings associated with environmental policy<br />
(e.g. ,the creation <strong>of</strong> protected areas or restricted development<br />
zones for conservation, and the associated introduction <strong>of</strong> land use<br />
stipulations or quasi-mandatory relocation to remove stress on fragile<br />
ecosystems);<br />
• The creation <strong>of</strong> transparent, horizontal frameworks <strong>of</strong> cooperation<br />
and financial transfers between regional or administrative levels <strong>of</strong><br />
government to ensure and improve watershed ecosystem services<br />
delivery;<br />
• The adjustment or introduction <strong>of</strong> fees, levies, taxes, tax reductions,<br />
or subsidies on resource uses to increase funding and/or incentives<br />
for conservation, environmental management, and/or restoration;<br />
• Increased upper- to lower-level government financial transfers to<br />
better fund environmental management; and<br />
• Compensation to regions, especially China’s less-developed west<br />
(which is the headwaters for both the Yangtze and Yellow Rivers), for<br />
past and current extractive and environmentally damaging development<br />
mode.<br />
Figure 23: <strong>New</strong> <strong>Waters</strong>hed Investment Figure 23. Programs by Area <strong>of</strong> Focus, China<br />
Agriculture<br />
Cross‐boundary Water Programs<br />
Water Source Protection<br />
<strong>Forest</strong>ry<br />
* Descrepancies between yearly and comprehsive totals is due to lack <strong>of</strong> information on program starting<br />
years, specifically for provincial <strong>Forest</strong> Ecosystem Compensation Funds.<br />
Source: Ecosystem Marketplace.<br />
Soil Erosion Prevention/Control
Often, watershed programs and provincial and national FECF funds are interrelated; in program documents for watershed protection<br />
one <strong>of</strong>ten sees line items for funding for local public benefit forests.<br />
Finally, two additional broad categories <strong>of</strong> programs are (i) soil erosion prevention/control programs, which have been a long-term<br />
investment item for the government, and (ii) the more recent appearance <strong>of</strong> agricultural programs for grassland management and<br />
restoration (again, in strong part due to water source services provided) and for freshwater aquatic biodiversity. One example is in<br />
the “Three Rivers Source Area” <strong>of</strong> Qinghai Province (the source <strong>of</strong> the Yangtze, Yellow and Mekong Rivers). As part <strong>of</strong> a large-scale<br />
conservation effort, the Master Program for the Three-Rivers Source National Ecological Protection Comprehensive Experimental<br />
Zone <strong>of</strong>fers production subsidies and financial assistance for rural herdsmen to shift livelihoods to protect water supplies.<br />
In terms <strong>of</strong> funding and land area affected, the Conversion <strong>of</strong> Cropland to <strong>Forest</strong>s and Grassland (CCFG) program remains the dominant<br />
IWS program in China, comprising fully 47% <strong>of</strong> total funding in 2011. This is followed by the national FECF and soil erosion prevention/control<br />
funding, making up 21 percent and 15 percent <strong>of</strong> totals, respectively. However, when it comes to scale, the provincial<br />
FECF programs take up the majority <strong>of</strong> area (31 percent), followed by the national FECF and then agricultural programs.<br />
This is in part due to the fact that area-based subsidies for the FECF programs are still quite small. While the national FECF program<br />
just recently (in 2010) increased the subsidy rate to $24/hectare (CNY 150), and provincial programs generally add to this somewhat,<br />
it pales in comparison to subsidies under the CCFG program, which have been upwards <strong>of</strong> $300/hectare (CNY 1,875). That said, both<br />
national and provincial programs involve a long-term subsidy payment system, and are operating under the principal <strong>of</strong> continually increasing<br />
subsidy rates to more accurately reflect the opportunity costs <strong>of</strong> restricted harvesting and access to designated forest areas.<br />
2008 2009 2010 2011<br />
Figure 24: Composition <strong>of</strong> Estimated Annual Eco-Compensation Funds, China<br />
Figure 24.<br />
48%<br />
1%<br />
4% 5%<br />
21%<br />
6%<br />
15%<br />
Agriculture (Grassland Management<br />
& River Biodiversity)<br />
<strong>Forest</strong>ry ‐ Provincial <strong>Forest</strong><br />
Ecological Compensation Fund<br />
Cross‐Boundary <strong>Waters</strong>hed<br />
Management<br />
Water Source Protection<br />
Investments in Soil Erosion<br />
Prevention and Control<br />
<strong>Forest</strong>ry ‐ National <strong>Forest</strong> Ecological<br />
Compensation Fund<br />
<strong>Forest</strong>ry/Agriculture ‐ Conversion <strong>of</strong><br />
Cropland C l dt to <strong>Forest</strong>s F t and d GGrassland l d<br />
Program<br />
Source: Ecosystem Marketplace.<br />
Figure 27 Active IWS Programs by Seller Type<br />
“The National Government Makes the Policy, the Local Government Makes the Counter-Policy”<br />
IWS is dominated by the public sector in China. The central and provincial governments are by far the largest, and <strong>of</strong>ten the only buyers<br />
<strong>of</strong> watershed ecosystem services in the country.<br />
At the same time, how and from whom services are purchases <strong>of</strong>ten varies significantly across locales, even within the same national<br />
or provincial programs. Informational asymmetries and shortfalls in national government manpower and capacity provide regional and<br />
local governments significant leeway in how upper-level programs are interpreted and implemented on the ground. A common refrain is<br />
“the national government makes the policy; the local government makes the counter-policy”.<br />
Further complicating this dynamic is the opaque delineation between public and private sectors in China; for example, it is not uncommon<br />
for local government forestry <strong>of</strong>fices and departments to serve in an intermediary role and to operate in some instances somewhat<br />
like private sector entities. These local agencies can <strong>of</strong>ten provide technical support and consultation regarding – and be subcontracted to<br />
implement and manage – the afforestation components <strong>of</strong> other agencies’ programs. Such work can also be spun <strong>of</strong>f to quasi-private research<br />
institutes or technical companies that operate more explicitly on a “for-pr<strong>of</strong>it” basis. Soil erosion prevention and control programs<br />
and agro-environmental programs also use similar approaches for on-the-ground implementation and management.<br />
<strong>State</strong> <strong>of</strong> <strong>Waters</strong>hed <strong>Payments</strong> 2012 | 25
In short, current programs contain the seeds <strong>of</strong> what could eventually become a decentralized, complex and value-driven landscape<br />
<strong>of</strong> investments in and payments for watershed ecosystem services. Investments in watershed services are <strong>of</strong>ten siloed within larger<br />
national and regional programs; in reality these larger programs hide what is likely a significant degree <strong>of</strong> de facto diversity in program<br />
design and implementation on the ground.<br />
Figure 25.<br />
Non-Governmental Actors<br />
Beyond public eco-compensation programs, we find evidence <strong>of</strong> several local-scale initiatives driven by international NGOs. In Sichuan<br />
Province, Conservation International and the San Shui Conservation Center have supported the Pingwu Biodiversity and Water Conservation<br />
Fund, which raises funds from downstream water users in Pingwu City to pay upstream landholders to de-intensify livestock<br />
production and agri-chemical use. The fund also supports alternative livelihood activities including beekeeping, and developing solar<br />
energy production as an alternative to forest products combustion.<br />
Engaging Rural Households<br />
The Ministry <strong>of</strong> Water Resource’s soil erosion prevention and control work, which include a long-term program category called “small watershed<br />
integrated management” that is not unlike the Conversion <strong>of</strong> Cropland to <strong>Forest</strong>s and Grassland program, has the longest history<br />
<strong>of</strong> rural engagement in implementing land-use interventions for watershed services and conservation. These programs, followed more<br />
recently by the growing range <strong>of</strong> initiatives implemented by other line agencies, have traditionally followed three modes <strong>of</strong> engagement<br />
<strong>of</strong> rural households:<br />
• Labor Investment – These types <strong>of</strong> programs pay rural households to conduct land-use interventions (afforestation, planting grasses,<br />
terracing land etc) on village, collective land or state-owned land.<br />
• Land Investment – These types <strong>of</strong> programs compensate rural households for allowing interventions on household land (i.e., land<br />
to which the household has use rights over a reasonably long time horizon), with the labor contracted to outside workers, sometimes<br />
from the same village;<br />
• Labor and Land Investment – These programs pay rural households for both the provision <strong>of</strong> household land, and their labor input<br />
in conducting interventions on this land.<br />
Numerous case studies <strong>of</strong> the Conversion <strong>of</strong> Cropland to <strong>Forest</strong>s and Grassland (CCFG) program, which is a huge national program<br />
implemented throughout China, indicate that all three <strong>of</strong> these modes have been adopted to implement the program in different locales.<br />
It is also interesting to note that many rural programs targeting land-use interventions in China also involve the engagement <strong>of</strong> indigenous<br />
peoples. This is because many <strong>of</strong> these programs are implemented in mountain areas at the headwaters <strong>of</strong> key rivers, where soil erosion,<br />
deforestation, biodiversity and poverty alleviation are all key concerns, and where ethnic minority groups are more common, especially<br />
in China’s western regions. (Apart from the dominant Han ethnic group, China has 55 <strong>of</strong>ficially-recognized ethnic minorities.)<br />
26 | <strong>Charting</strong> <strong>New</strong> <strong>Waters</strong><br />
Figure 25: Total Area Protected by IWS Program Composition, China<br />
31%<br />
26%<br />
3%<br />
4%<br />
14%<br />
22%<br />
Water Source Protection<br />
Source: Ecosystem Marketplace.<br />
Soil Erosion Prevention/Control<br />
Conversion <strong>of</strong> Cropland to <strong>Forest</strong>s<br />
and Grassland Program<br />
Agriculture [Grasslands Protection<br />
and Freshwater Aquatic Biodiversity<br />
Conservation]<br />
National <strong>Forest</strong> Ecological<br />
Compensation p Fund<br />
Provincial <strong>Forest</strong> Ecological<br />
Compensation Fund
Japan<br />
We tracked four programs in Japan – all newly-identified since 2010. Limited transaction information is available about these (Japan<br />
Ministry <strong>of</strong> Environment, 2010). Three involve a city protecting its source water supplies.<br />
Fukuoka City has no water supply within its boundaries, relying instead on desalinization and dams some distance from the city. To<br />
protect the latter, an add-on fee on water users was channeled into a dedicated fund, which is matched by an allocation from the city’s<br />
general account – altogether amounting to a bit over $0.01 per cubic meter <strong>of</strong> water used. The water source conservation fund pays<br />
for forest management, reforestation, and land acquisition in catchments around the dams supplying the city, as well as supporting<br />
small municipal governments’ watershed management efforts in areas upstream <strong>of</strong> the city. Investments are estimated at about $1.2<br />
million annually, with at least 505 hectares restored and protected to date. Fukuoka City’s fund was modeled on Toyota City, about<br />
which little information could be gathered for this report. Toyota City uses a similar funding mechanism, directing a water user fee<br />
toward watershed conservation.<br />
An interesting model <strong>of</strong> cooperation can be found in the Anjo City-Neba Village agreement. Neba Village, facing falling wood prices<br />
and degradation <strong>of</strong> water resources from logging-related erosion, decided in the early 1990s to suspend future logging activities. To<br />
do so, it purchased the local forestry <strong>of</strong>fice’s logging rights, but found that it lacked the necessary funds to rehabilitate cleared lands.<br />
Anjo City, recognizing the importance <strong>of</strong> protecting and restoring forest lands in the upper Yahagigawa River watershed, agreed to<br />
purchase the logging rights from Neba. The negotiated payment covered stumpage costs and rent, with Anjo City agreeing not to fell<br />
stumpage until 2022 and to share pr<strong>of</strong>its from lumber obtainment through management thinning.<br />
Finally, a privately-funded IWS mechanism in Kumamoto City aims to recharge groundwater through a novel mechanism. Agricultural<br />
policies discouraging rice production coupled with urbanization and paving over <strong>of</strong> permeable surfaces had the unintended effect<br />
<strong>of</strong> decreasing groundwater infiltration. In the early 2000s, concerns sharpened with a proposed Sony semiconductor manufacturing<br />
facility in the city that would have significant groundwater pumping requirements. A local NGO, Kumamoto Environmental Network,<br />
proposed an innovative solution: the semiconductor manufacturer agreed to <strong>of</strong>fset its groundwater withdrawals by paying agricultural<br />
producers in the area to flood fields no longer under rice production, in order to increase infiltration to the aquifer. Producers<br />
are compensated for their management costs at an initial rate <strong>of</strong> 11,000 yen per hectare, which increases depending on the length <strong>of</strong><br />
<strong>of</strong>f-season flooding. The semiconductor company also purchases sustainably grown rice from partner producers to sell in its cafeteria<br />
as a further indirect <strong>of</strong>fset. As <strong>of</strong> 2009, the quantity <strong>of</strong> water <strong>of</strong>fset was significantly higher than water used by the company. The<br />
success <strong>of</strong> the program has led to participation by other local businesses and the Kumamoto City government’s water conservation<br />
program activities.<br />
South Asia<br />
South Asia is home to several long-running payment mechanisms. Compensation for watershed services in this region is <strong>of</strong>ten linked<br />
to water infrastructure development like dams, and has a strong socio-economic development component. In the four active programs<br />
we identified, all place an emphasis on benefit-sharing from watershed development.<br />
In India’s Sukhomajri <strong>Waters</strong>hed, marginal community members had not received benefits from soil conservation structures built<br />
to reduce sedimentation and store rainwater for irrigation. To reach these groups, a compensation mechanism was initiated. In exchange<br />
for limiting land conversion and animal grazing in sensitive areas, participants receive non-cash supports including rainwater<br />
collection dams and access to other grazing areas.<br />
In Pakistan, the government-operated Mangla and Tarbela dams benefit from soil and water conservation practices by upstream<br />
communities that reduce sedimentation. These communities receive in-kind payments and technical support for these activities<br />
through the regional “Poverty Reduction through Participatory <strong>Waters</strong>hed Development” program.<br />
A hydropower plant located in Nepal’s Kulekhani <strong>Waters</strong>hed provides seventeen percent <strong>of</strong> the country’s electricity, but is negatively<br />
impacted by sedimentation from upstream land-use change. The Kulekhani <strong>Waters</strong>hed Conservation and Development Forum, supported<br />
by RUPES, developed a payment mechanism whereby under the Hydropower Royalty Distribution and Use Directive (2062)<br />
the hydropower operator allocates 50 percent <strong>of</strong> central government royalties from hydropower toward compensation for villages<br />
for impacts from hydropower and promote sustainable agricultural practices upstream. An estimated $134,000 has been disbursed<br />
by the Fund to date.<br />
<strong>State</strong> <strong>of</strong> <strong>Waters</strong>hed <strong>Payments</strong> 2012 | 27
Land-use change in the region around Nepal’s Rupa Lake, driven by forest clearing for agriculture and settlements, is a major contributor<br />
to heavy siltation and nutrient pollution in the lake. To promote land management practices to rehabilitate the watershed,<br />
the Rupa Lake Restoration and Fishery Cooperative (“the Cooperative”) has arranged to share benefits with upstream land managers<br />
for conservation activities that benefit the lake’s fisheries. The Cooperative makes annual direct and in-kind payments, at a value <strong>of</strong><br />
about $45 annually, to Community <strong>Forest</strong>ry User Groups (CFUGs), and to Community Development Groups through the Rupa Lake<br />
<strong>Waters</strong>hed Conservation Fund. Seventeen CFUGs participate and receive annual payments. The Cooperative also financially supports<br />
schools and annual scholarships in the upper catchment to increase environmental education.<br />
Southeast Asia<br />
We tracked significant IWS activity in Southeast Asia, finding eight active programs in Indonesia and five in the Philippines, and another<br />
nine in development between the two countries. These programs delivered at least $55,000 in 2011 and $4.9 million to date,<br />
with 111,655 hectares confirmed under management.<br />
The region also is home to Vietnam’s national <strong>Forest</strong> Protection and Development Fund, which in early 2011 was launched at a<br />
national scale. The program began in 2008 with a government decree, Decision 380 on the “Pilot Policy for Payment for <strong>Forest</strong> Ecosystem<br />
Services.” Two pilots in Lam Dong and Son La provinces were developed with support from the German Development Cooperation<br />
(GTZ) and NGO Winrock International. Under the new policy, four categories <strong>of</strong> watershed services buyers were delineated<br />
and required to compensate local communities for watershed benefits, including water and electric utilities and tourism operators.<br />
The Decree identifies a bundle <strong>of</strong> forest ecosystem services; buyers must pay specifically for those that their operations rely on – so a<br />
hydropower plant pays specifically for erosion control, for example.<br />
The pilots in Lam Dong and Son La provinces were both rapidly scaled up, delivering an estimated $4.46 million in payments in their<br />
first two years. Based on this success, a national decree (Decree No. 99/2010/ND-CP) went into effect in 2011. The Lam Dong province<br />
pilot paid farmers about $500 per year to rehabilitate and protect forestlands that the government has assigned or leased (forests are<br />
not owned privately in the country). An estimated 104,000 hectares were conserved in the pilot phase, with households on average<br />
managing about 20 hectares.<br />
<strong>Payments</strong> are differentiated by watershed service – flow regulation is valued at about $16/hectare, soil protection at $15/hectare,<br />
and landscape scenic values at $0.50/hectare. <strong>Payments</strong> can be either through direct contract or paid indirectly through provincial<br />
funds. Some funds are also allocated for overhead and for community projects like funding fire fighting.<br />
All <strong>of</strong> the tracked programs but two (the Vietnamese program and the Philippines’ National Power Corporation’s watershed management<br />
efforts) are local in scale, and the majority have their roots in efforts by NGOs like RUPES and WWF. These catchment-scale<br />
efforts united by common intermediaries benefit from shared learning and tool development. Southeast Asia is also characterized<br />
by a strong emphasis on delivering livelihood and local institutional benefits from compensation mechanisms. All programs save<br />
one reported poverty alleviation objectives, as well as community management <strong>of</strong> resources, tenure security for participants, and<br />
strengthening <strong>of</strong> social capital.<br />
The Sumberjaya Community <strong>Forest</strong>ry Program, for example, works with local communities in the Way Besai watershed to enroll<br />
in Indonesia’s Community <strong>Forest</strong>ry Program wherein conditional tenure is granted in exchange for adopting sustainable agricultural<br />
practices and committing to protecting standing forest. The watershed is a source <strong>of</strong> water for hydroelectric generation and the Tulang<br />
Bawang River, a major water source in Lampung Province.<br />
Another initiative in the same watershed, the Sumberjaya River Care Project, is a pilot project demonstrating how agricultural best<br />
management practices can limit sedimentation in the Way Besai hydroelectric company’s reservoir. The company provides $1000 in<br />
upfront capital for implementation upon signing <strong>of</strong> a one-year contract, and between $ 250 - 2000 at the end <strong>of</strong> contract depending<br />
on level <strong>of</strong> sediment reduction achieved.<br />
We also identified active agreements between water companies in Rinjani, Magelang, and the Cidanau catchment to upstream communities.<br />
In the first two programs, a portion <strong>of</strong> water user fees are channeled toward conservation efforts. In Cidanau’s case, PT KTI,<br />
the company which manages water distribution from the Cidanau River, makes regular payments – about $20,000 in 2011 – to farmer<br />
groups through the multi-stakeholder Forum Komunikaski DAS Cidanau.<br />
In the Brantas <strong>Waters</strong>hed, a quasi-compensation mechanism is at work. Representatives for several upstream villages cooperate<br />
with downstream water users on an ad-hoc basis on rehabilitation projects including planting seedlings, protecting spring areas, and<br />
28 | <strong>Charting</strong> <strong>New</strong> <strong>Waters</strong>
sts<br />
ion<br />
ersity<br />
restoring riparian and other critical zones; no formal compensation mechanism appears to exist. Downstream buyers include the<br />
Community Water Buyers Association (HIPPAM), public river basin operator Perum Jasa Tirta I, and the Java-Bali Power Company<br />
(USAID Indonesia, 2009).<br />
We also tracked an intriguing fund model centered in the Gunung Gede Pangrango National Park (TNGGP), the site <strong>of</strong> three major<br />
watersheds supplying water to the urban centers <strong>of</strong> Jakarta, Bogor, Sukabumi, Cianjur, and the Puncak tourist region. The park is also<br />
a designated UNESCO Biosphere Reserve. Businesses and industry surrounding the park have contracted with non-pr<strong>of</strong>it stakeholder<br />
group FORPELA to pay for forest conservation activities in the park and its buffer zone contributing to TNGGP’s ongoing provision <strong>of</strong><br />
ecosystem services. Buyers – who come from the private, public, civil, and academic sectors – pay a “joining fee” and make monthly<br />
membership payments (about US$50/month) to FORPELA, and sometime also provide in-kind support. Funding also comes from<br />
government and academic institutions. Suppliers are represented by six model Village Conservation Pilots. Transactions, based on<br />
projected revenues from fees in the FORPELA TNGGP Statutes, amounted to roughly $19,400 in 2011 (USAID Indonesia, 2009).<br />
19%<br />
Figure 26<br />
Figure 26: Demand for IWS by Buyer Type, Southeast Asia<br />
6% 6%<br />
6%<br />
25%<br />
25%<br />
19%<br />
Source: Ecosystem Marketplace.<br />
Water utility<br />
Hydropower Operator<br />
Government<br />
Business/Industrial Users<br />
Household Water Users<br />
Electricity Users<br />
Finally, the hydropower-beneficiary and farmer-provider dynamic has been turned on its head in Singkarak Lake in West Sumatra<br />
Province, where declining water quality was assumed to be caused by upstream logging and agriculture. A RUPES-led study based on<br />
water-balance models, local ecological knowledge and soliciting community input indicated that inflows in the Lake have also been<br />
affected by the local hydropower plant. RUPES helped to facilitate an arrangement between the hydropower company and local communities<br />
to direct some portion <strong>of</strong> company revenues upstream to compensate for impacts and improve livelihoods.<br />
In the Philippines, two payment programs are supported by private-sector companies. In Ilagan, WWF and Coca-Cola are partnering<br />
on an initiative to conserve critical watersheds in the Northern Sierra Madre Natural Park, paying upland communities to rehabilitate<br />
denuded areas and implement agr<strong>of</strong>orestry practices. Isuzu Corporation is also contributing funds for reforestation work. After an<br />
initial project phase from 2008-2010, the program been extended through 2015. <strong>Payments</strong> appear to be in-kind in the form <strong>of</strong> seedlings<br />
for reforestation and estimated to be worth $12,000 in 2011. Opportunities for marketing carbon credits are also being explored.<br />
Meanwhile, in Mt. Kanla-on National Park, the Kanla-on Spring Water company has arranged voluntarily to provide support for farmers<br />
living within the park to support water quality. <strong>Payments</strong> are in-kind, including tree saplings for planting and technical training on<br />
agr<strong>of</strong>orestry, as well as support for community development projects.<br />
Other programs are underpinned by policy drivers. The Philippines’ National Power Corporation is authorized under the Electric<br />
Power Industry Reform Act <strong>of</strong> 2001 to levy a PhP 0.0025 kW/hr charge on its electricity consumers for watershed management. This<br />
“social responsibility” fee supports reforestation and watershed management projects, as well as livelihood improvements like electrification.<br />
Communities in turn help provide labor for maintaining water infrastructure (Porras & Neves, 2006). Nearly 2000 hectares<br />
have come under sustainable management under this arrangement.<br />
<strong>State</strong> <strong>of</strong> <strong>Waters</strong>hed <strong>Payments</strong> 2012 | 29
The Baticulan watershed is a source <strong>of</strong> water for the city <strong>of</strong> San Carlos. To limit soil erosion and flooding, the city passed an ordinance<br />
in 2004 requiring that a fee <strong>of</strong> PhP 0.75 (roughly $0.02) is collected for every cubic meter <strong>of</strong> water used by water consumers. This<br />
levy funds the “<strong>Waters</strong>hed Development and Environmental Protection Fund”, which supports watershed restoration projects. Since<br />
many landowners upstream live in the city, they are both providers and beneficiaries; tenants on the upper catchment land are paid<br />
for labor in reforestation projects.<br />
In 2009, the Local Government <strong>of</strong> Lantapan enacted Municipal Ordinance No 114, which outlines an incentive mechanism for smallholders<br />
to adopt sustainable land use. The government has allocated funds for building the capacity <strong>of</strong> the Agriculture Extension and<br />
Municipal Planning <strong>of</strong>fice, linking with ES buyers, and investing in in-kind incentives for soil and water conservation activities including<br />
input subsidies for crop production, subsidies for crop insurance, and micro-financing support.<br />
Outlook<br />
Outlook - China<br />
Eco-Compensation in China on the whole has been in line with, and supported by, an overall shift in the central government’s approach<br />
towards a more environmentally sustainable growth model and proactive conservation and environmental management<br />
regime.<br />
To provide additional regulatory and legal support to the diversity <strong>of</strong> local eco-compensation initiatives taking place, the National<br />
Development and Reform Commission has been tasked with drafting a national Eco-compensation Ordinance. Eco-compensation<br />
will also ostensibly play a key role in the country’s new ecological function-based land-zoning system, which allocates development<br />
rights or restrictions to regions based on their determined ecological functions. In terms <strong>of</strong> land area and population, watershed ecosystem<br />
services make up at least 39% and 59% <strong>of</strong> zoned area, respectively (Zhang & Bennett, 2011). However, much work still needs<br />
to be done to operationalize the concept, and to find approaches which are both financial sustainable, politically and socially stable,<br />
and environmentally effective. The ongoing experimentation at national and regional levels in eco-compensation is thus playing an<br />
important role in the ongoing evolution <strong>of</strong> China’s water management regime.<br />
The range <strong>of</strong> actors supporting IWS is also slowly expanding beyond government bodies. International NGOs in the last few years have<br />
proposed an array <strong>of</strong> programs across the country.<br />
<strong>Forest</strong> <strong>Trends</strong> is working with partners and local stakeholders to improve the efficiency, equity, and performance <strong>of</strong> afforestation, forest<br />
management and rural land use investments in the Miyun <strong>Waters</strong>hed in Hebei Province under the existing Beijing-Hebei cooperation<br />
framework. WWF-CARE’s Equitable <strong>Payments</strong> for <strong>Waters</strong>hed Services program is supporting a payment mechanism in Sichuan<br />
province, as is Conservation International through its Yujiashan Nature Reserve PES Pilot. ICRAF China meanwhile is backing a Tibet<br />
Grasslands PES Scheme and has proposed a Songhuaba IWS program to the Kunming City and Yunnan Provincial government. The<br />
Asian Development Bank and WWF-Beijing are part <strong>of</strong> a public-private partnership developing a compensation mechanism in the<br />
Chishui River Basin. And the US-based World Resources Institute is working with government bodies in Anhui Province to evaluate<br />
the potential <strong>of</strong> agricultural nutrient trading in Chao Lake – an interesting example <strong>of</strong> cross-fertilization <strong>of</strong> regional models.<br />
Outlook - Central & South Asia<br />
Several new programs are on the horizon in South Asia. RUPES and local partner Loktak Development Authority are exploring the<br />
potential for a payment mechanism around India’s Loktak Lake, wherein the Authority is compensated for providing a sustainable<br />
supply <strong>of</strong> water to the local hydropower company. Demand is growing for water for hydropower generation at the same time that the<br />
lake is experiencing increased degradation due to steadily growing water abstraction for power, ecological impacts from damming the<br />
former floodplain wetlands, and urban sewage upstream.<br />
In Nepal, RUPES is exploring with local stakeholders a payment for ecosystem services arrangement in Shivapuri National Park to<br />
protect downstream water benefits while improving livelihoods <strong>of</strong> local peoples inside the park.<br />
Central Asia may soon host its first IWS mechanism: in Kyrgyzstan’s Lake Issyk-Kul, a PWS/REDD mechanism is in exploratory stages.<br />
30 | <strong>Charting</strong> <strong>New</strong> <strong>Waters</strong>
Outlook - Southeast Asia<br />
In Southeast Asia, program development has reached something <strong>of</strong> a turning point. Donor-driven pilots are maturing; RUPES and<br />
EPWS both wound down activity in 2012, though local stakeholders will continue to maintain and develop these compensation<br />
mechanisms.<br />
Meanwhile, Vietnam’s payments for forest ecosystem services program kicked <strong>of</strong>f on a national scale in 2011, and based on the success<br />
<strong>of</strong> its pilots could rapidly become a significant model for a national IWS program. Unlike other national efforts like Mexico’s or<br />
Costa Rica’s, beneficiaries directly engage with watershed services providers to pay for specific services. Cambodia, Laos, and Thailand<br />
have all expressed interest in the model. The program is not without its snags – in Son La Province, Electricity <strong>of</strong> Viet Nam in 2011<br />
simply didn’t pay its required fees for the previous year, estimated at $26.2 million, and the smallholders due to receive them felt they<br />
had little recourse for enforcement (Anh, 2012).<br />
IWS is expected to continue to grow in Indonesia and the Philippines. As <strong>of</strong> 2011, nine new compensation mechanisms are under<br />
development – in Loktak Lake, Aceh Province, the Kapuas Basin, Kuningan, Singkarak Lake, and the Upper Brantas watershed in<br />
Indonesia, and in Bakun, Kalahan, and Lantapan in the Philippines.<br />
<strong>State</strong> <strong>of</strong> <strong>Waters</strong>hed <strong>Payments</strong> 2012 | 31
32 | <strong>Charting</strong> <strong>New</strong> <strong>Waters</strong>
Europe<br />
Table 9: Summary Details, Europe<br />
Number <strong>of</strong> active programs: 15<br />
Number <strong>of</strong> programs in development: 3<br />
Value <strong>of</strong> transactions in 2011: $2.7 million<br />
Value <strong>of</strong> transactions 1991-2011: $57.7 million<br />
Hectares managed for watershed services in 2011: 99 hectares<br />
Hectares managed for watershed services / Units <strong>of</strong><br />
pollution reduction 1991-2011:<br />
65,030 hectares; 85,980 pounds nitrogen<br />
General Status Update<br />
Source: Ecosystem Marketplace.<br />
Europe plays host to a number <strong>of</strong> long-running catchment protection initiatives that fall within the scope <strong>of</strong> “watershed payments,”<br />
though details on payments themselves and the impacts <strong>of</strong> these programs are <strong>of</strong>ten difficult to uncover.<br />
Nutrient pollution, replenishment <strong>of</strong> groundwater supplies, and protecting general watershed functions against the pressures <strong>of</strong> development<br />
are common themes in the fifteen active programs we identified. In the majority <strong>of</strong> these programs, funding comes from<br />
the beneficiary <strong>of</strong> watershed protection. In three instances, compensation mechanisms have been initiated by private beverage companies;<br />
another nine are driven by a utility or municipality engaging private forest landowners and agricultural producers in protecting<br />
drinking water supplies. In one interesting example in Sweden, a local authority has covered costs <strong>of</strong> establishing blue mussel beds in<br />
Gullmar Fjord, having determined that mussel filtration <strong>of</strong> nitrate pollution is cheaper than an onshore treatment facility – a solution<br />
which has been proposed, among other places, in the United <strong>State</strong>s’ Chesapeake Bay.<br />
Sellers are generally private landowners, though the city <strong>of</strong> Munich, Germany and an Italian public water company, Romagna Acque<br />
S.p.A., have directly purchased land and interventions also take place on land managed by the ‘buyer’ in the cases <strong>of</strong> Italy’s Veneto<br />
Region, Switzerland’s Canton Basel-Stadt, and the UK’s SCAMP’s United Utilities.<br />
With the exception <strong>of</strong> Switzerland and a program in development in the Danube Basin involving both Bulgaria and Romania, programs<br />
are concentrated in the EU-15 region. 8 Uptake <strong>of</strong> IWS has been slower in the 2004 Accession <strong>State</strong>s and in Southern Europe, likely<br />
due to a combination <strong>of</strong> factors including varying levels <strong>of</strong> economic development, political receptivity, and uneven progress in implementing<br />
river basin management plans under the WFD.<br />
Program distribution doesn’t always align with Europe’s water resource problems. Water scarcity issues including dry-season shortages<br />
and falling groundwater levels are especially severe in southern Europe. A deadly 5.1-magnitude earthquake in Spain in May<br />
2011 appears to have actually been triggered by groundwater depletion (BBC <strong>New</strong>s, 2012). Europe also faces wide-ranging issues with<br />
nutrient pollution from industry, wastewater treatment facilities, and nonpoint agricultural pollution. The latter is the target <strong>of</strong> a lively<br />
debate on reforming the EU’s Common Agricultural Policy, which effectively subsidizes agricultural intensification and is probably a<br />
major driver <strong>of</strong> increasing degradation <strong>of</strong> river basins over the past five decades. The EU has spent a good deal <strong>of</strong> policy effort and<br />
money attempting to address water quality issues, including the 1991 Urban Wastewater Treatment and Nitrates Directives and the<br />
2000 Water Framework Directive, but efforts to reduce nitrate concentrations have failed to keep pace with agricultural intensification<br />
and other pressures (Esteban & Albiac, 2012).<br />
8 The “EU-15” are the fifteen member states belonging to the European Union prior to the accession <strong>of</strong> twelve new countries in 2004. Economically,<br />
the EU-15 tends to be wealthier, both in real GDP and GDP per capita terms<br />
<strong>State</strong> <strong>of</strong> <strong>Waters</strong>hed <strong>Payments</strong> 2012 | 33
United Kingdom<br />
34 | <strong>Charting</strong> <strong>New</strong> <strong>Waters</strong><br />
Spain<br />
Map 4: Active and Developing Programs, Europe<br />
3<br />
1<br />
1<br />
France 3<br />
4<br />
Switzerland 2<br />
Sweden<br />
Germany<br />
2<br />
1<br />
Italy<br />
Source: Ecosystem Marketplace.<br />
1<br />
Bulgaria/Romania<br />
transboundary program
The EU has been historically less receptive than North America and<br />
Oceania to incentive-based approaches, but with the scale and likely<br />
high costs <strong>of</strong> the WFD on the horizon, we may be witnessing a<br />
movement toward IWS. A blueprint for implementing the WFD to<br />
released in late 2012 emphasizes economic instruments and natural<br />
infrastructure to maximize cost-effectiveness (European Commission,<br />
2012). But regulatory frameworks are slow to catch up; in one<br />
case in Italy detailed below, a public water company cannot pay landowners<br />
cash for maintaining forest cover to limit erosion because the<br />
‘service’ in question is not legally well-defined.<br />
The UK government in particular has embraced an ecosystem services<br />
approach. Two active and one developing program were tracked<br />
in 2011; the same year also saw the establishment <strong>of</strong> an Ecosystem<br />
Markets Task Force and the release <strong>of</strong> the UK National Ecosystem<br />
Assessment (UK NEA) and a series <strong>of</strong> white papers from the Department<br />
for Food, Environment, and Rural Affairs (Defra) exploring the<br />
potential for PES in the nation (National Ecosystem Assessment,<br />
2011; Dunn, 2011; URS Scott Wilson, 2011). Indeed, the Head <strong>of</strong> Economics<br />
for the UK NEA has identified both payments for ecosystem<br />
services and water as two <strong>of</strong> the top ten most promising opportunities<br />
for economic interventions for ecosystem services in the UK<br />
(Bateman, 2012).<br />
The models that do exist in the EU are generally quite innovative. For<br />
example, we found two programs in Bulgaria/Romania and France/<br />
England cooperating on transboundary program development, experimentation<br />
in multiple countries with using forested areas to recharge<br />
groundwater, and the Swedish program mentioned earlier,<br />
where commercial mussel beds take the place <strong>of</strong> an onshore wastewater<br />
filtration plant.<br />
Like North America, the lion’s share <strong>of</strong> funding for land management<br />
practices protecting water quality in Europe comes from agri-environmental<br />
programs. <strong>Payments</strong> frequently target water quality and<br />
supply, but are not included in analysis here as they also pursue a<br />
bundle <strong>of</strong> other environmental services.<br />
Transaction Activity<br />
Box 3: The Water Framework Directive in<br />
Europe<br />
Water policy goals in the European Union are largely guided<br />
by the Water Framework Directive (WFD), which sets<br />
out a timeline for preventing further degradation and<br />
achieving ‘good status’ for all waters by 2015, through<br />
integrated river basin management plans to created and<br />
implemented by member states. Management <strong>of</strong> water<br />
resources is thereby set at a river basin level rather than<br />
along political boundaries, and guided by the “polluter<br />
pays” principle. The WFD provides guidance on good<br />
management and establishing water quality standards,<br />
but leaves the choice <strong>of</strong> specific policy interventions to<br />
Member <strong>State</strong>s.<br />
At the time <strong>of</strong> this report’s writing in late 2012, it looks<br />
unlikely that the goal <strong>of</strong> “good status” will be achieved by<br />
2015 as planned. Almost half <strong>of</strong> Member <strong>State</strong>s (thirteen<br />
out <strong>of</strong> 27) were unready to adopt approved river basin<br />
management plans by the 2010 deadline; consequently<br />
implementation is delayed in many countries. Many<br />
states have requested deadline extensions driven by disproportionately<br />
high costs <strong>of</strong> implementing the Directive<br />
and/or technical infeasibility <strong>of</strong> meeting Directive goals<br />
on time.<br />
There is no dedicated funding stream for WFD implementation,<br />
though a number <strong>of</strong> EU funding instruments are<br />
potential sources <strong>of</strong> financing to meet water resource<br />
management goals, including the European Regional<br />
Development Fund, the European Agricultural Fund for<br />
Rural Development (EARFD), and the EU Cohesion Fund.<br />
Still, it is recognized that regional and rural development<br />
funding will be insufficient to achieve WFD goals, and<br />
there is considerable interest from many quarters in exploring<br />
investments in watershed services as a financing<br />
tool.<br />
Across the fifteen active programs in 2011, payments totaled at least $2.7 million. Similarly, historical payments are conservatively<br />
estimated to be at least $57.7 million, protecting some 65,030 hectares. A Swedish mussel bed filtration program has posted nutrient<br />
load reductions <strong>of</strong> 85,980 lbs <strong>of</strong> nitrogen to date. Actual figures are probably much higher. Most programs tracked here have been<br />
in place for at least five years but don’t necessarily identify themselves as IWS, making them both hard to identify and transaction<br />
data difficult to obtain. Since higher-level policy support in the EU (with the exception <strong>of</strong> the United Kingdom) for IWS remains low,<br />
programs also tend to be small in scale and driven by local actors – which again makes for difficulty in tracking.<br />
Per-hectare payments ran from about $45 (Evian catchment protection in France) to $1,400-10,170/ha (Veneto Region in Italy). Part<br />
<strong>of</strong> the reason for such a range is that some programs face large up-front costs for rehabilitation; subsequent annual maintenance payments<br />
are found to be far lower.<br />
<strong>State</strong> <strong>of</strong> <strong>Waters</strong>hed <strong>Payments</strong> 2012 | 35
France<br />
In France, transaction figures rest largely on the well-known<br />
Vittel brand spring water (now owned by Nestlé <strong>Waters</strong>) program,<br />
which since the early 1980s has compensated farmers<br />
for minimizing nutrient and pesticide pollution to its aquifer.<br />
French law, which dictates that treated water cannot be sold<br />
as ‘natural mineral water’, has driven Vittel’s interest in preserving<br />
the purity <strong>of</strong> its source. Vittel set up a consulting firm,<br />
Agrivair, to manage efforts and provide technical assistance<br />
to land managers. Payment information for the program, approximately<br />
$30 million, is only available for the first seven<br />
years <strong>of</strong> operation program (1992-1999). However, since<br />
compensation was designed to cover the costs <strong>of</strong> purchasing<br />
new farm equipment and pay <strong>of</strong>f land-ownership debt,<br />
and included only a relatively small stipend (€200 annually),<br />
payments have tapered <strong>of</strong>f significantly in recent years. 9 In<br />
recent years Agrivair has also expanded its focus to other issues<br />
impacting the aquifer, partnering with other stakeholders<br />
including the national forestry <strong>of</strong>fice, local spas and golf<br />
courses, and Gaz de France.<br />
Europe is notable for the relatively high pr<strong>of</strong>ile <strong>of</strong> private sector-initiated programs, especially by beverage companies. In addition<br />
to the Vittel case in France, the Evian Company has initiated and largely funded efforts to protect the aquifer from which it bottles<br />
natural mineral water. Protection efforts include a mix <strong>of</strong> policy instruments working across multiple sectors, including some IWS-like<br />
support to agricultural producers in the catchment to manage their animal wastes and otherwise minimize negative impacts on the<br />
aquifer, as well as for practices favoring maintaining traditional agricultural landscapes. The Evian Company itself does not directly<br />
pay farmers or acquire land for protection, but rather provides about two-thirds <strong>of</strong> funds for a local association, APIEME, which leads<br />
decision-making about managing the aquifer.<br />
A third French program uses a PWS-like mechanism to ensure adequate instream flows for ecological health. Etablissement Public<br />
Territorial de Bassin Loire (EPTB Loire), which maintains two dams, Naussac and Villerest, levies a charge on water users to pay for<br />
dam operations supporting ecological flows in the Loire and Allier rivers. Charges are calculated to cover costs <strong>of</strong> operational changes<br />
and are set at different levels depending on the user’s sector, location, season and volume abstracted. Paying users, <strong>of</strong> which there<br />
are several hundred, include agricultural producers, drinking water companies, and private industries. Contributions total about €3<br />
million annually as <strong>of</strong> 2009, the latest year for which transaction data is available (Greiber, van Ham, Jansse, & Gaworska, 2009).<br />
France/United Kingdom<br />
An innovative cross-border partnership – the first <strong>of</strong> its kind we’ve seen - is piloting payments for watershed services programs at<br />
seven sites across France and England. The WATER (“Wetted Land: the Assessment, Techniques & Economics <strong>of</strong> Restoration”) Project<br />
is a collaboration between several English water trusts, led by Westcountry Rivers Trust, and several French environmental NGOs.<br />
The project aims to demonstrate a model Channel-wide framework for cooperating on the development <strong>of</strong> cost-effective models for<br />
catchment management. The WATER project will target a broad set <strong>of</strong> ecosystem services payments in its conservation work – including<br />
payments for water treatment, flood mitigation, carbon <strong>of</strong>fsetting, biodiversity and catchment food branding – and are part <strong>of</strong> a<br />
larger workstream also examining wetlands and carbon sequestration payments. <strong>Payments</strong> in 2011 totaled $1.5 million.<br />
United Kingdom<br />
Sustainable Catchment Management Programme (SCaMP) was developed by United Utilities in association with the Royal Society<br />
for the Protection <strong>of</strong> Birds (RSPB) to protect peatland bog habitats in the upper catchment. Drainage and livestock grazing-caused<br />
9 Daniele Perrot-Maitre, personal communication, February 2010.<br />
36 | <strong>Charting</strong> <strong>New</strong> <strong>Waters</strong><br />
Table 10: Tracking Activity in Europe, 2008-2011<br />
2008 2011<br />
Programs identified 5 17<br />
Annual transactions n/a $2.7 million<br />
Annual volume n/a n/a<br />
Historical transactions $30 million $57.7 million<br />
Historical volume 3,900 hectares<br />
Source: Ecosystem Marketplace.<br />
64,730 hectares;<br />
85,980 lbs N<br />
2008 figures come from the 2010 Ecosystem Marketplace report<br />
“<strong>State</strong> <strong>of</strong> <strong>Waters</strong>hed <strong>Payments</strong>.” Increases in program payment<br />
values and volumes reflect better available information<br />
about programs in recent years, and not necessarily a “boom”<br />
in IWS during that period.
degradation <strong>of</strong> the upland heath and peatlands meant that designated nature conservation sites were in unfavorable condition, and that<br />
United Utilities was required to undertake additional treatment to get water to potable standards. Under the SCaMP project, the utility<br />
works with farmer tenants on agricultural management plans and supports farmer applications for agri-environmental payments from<br />
the national government. The project has also invested in restoration in blanket bog habitats and peat moorland, tree planting activities,<br />
and blocking drainage grips to improve water quality. In the project’s second phase, activities have expanded to include a focus on the<br />
carbon sequestration services and wildlife values provided by peat habitats. Transaction information for 2011 is unavailable.<br />
In Devon, water company South West Water has committed over $14 million (£9 million) for catchment management projects in areas<br />
where it operates through the Upstream Thinking initiative, citing reduced treatment costs resulting from source water protection and a<br />
desire to go ‘beyond compliance’. Upstream Thinking funds rehabilitation, protection, and implementing agricultural best management<br />
practices on private lands and in one National Park area. Conservation groups and other local stakeholders act as an intermediary and are<br />
responsible for implementation. Six projects are currently active, with a goal <strong>of</strong> restoring and/or protecting more than 3000 hectares. In<br />
the 2010/2011 year, 98.7 hectares were conserved.<br />
Germany<br />
Figure 27: Active IWS Programs by Seller Type,<br />
Figure 27.<br />
Europe<br />
7%<br />
21%<br />
7%<br />
29%<br />
Private company<br />
29%<br />
7%<br />
Farmers<br />
Non‐farmer Non farmer private<br />
landowners<br />
Public lands<br />
Mix <strong>of</strong> public and private<br />
landowners<br />
Dam operator<br />
Figure 28: Active IWS Programs by BuyerType,<br />
Figure 28. ,<br />
Europe<br />
Source: Ecosystem Marketplace. Source: Ecosystem Marketplace.<br />
A voluntary, privately-driven investment in watershed services can also be found in Germany, where the Bionade Corporation has partnered<br />
with the NGO Trinkwasserwald e.V. (Drinking Water <strong>Forest</strong> Association) to create ‘”drinking water forests” in Germany by afforesting<br />
and reforesting private and public lands with deciduous broad-leaved trees, which are understood to enhance groundwater replenishment.<br />
Bionade aims to voluntarily <strong>of</strong>fset its own water use in doing so, with a target <strong>of</strong> about 100 million liters each year or 130<br />
hectares <strong>of</strong> reforested lands.<br />
Three other programs in Germany focus on water damage mitigation. The city <strong>of</strong> Munich since 1991 has worked with upstream farmers<br />
to encourage a switch to organic agriculture to protect its water supplies. The city makes per-hectare payments to compensate for<br />
foregone income, and also encourages enrollment in organic farming associations by covering the costs <strong>of</strong> agricultural inputs and technical<br />
support. Munich has also purchased land in critical parts <strong>of</strong> the catchment and established a protection zone in pumping areas. The<br />
majority <strong>of</strong> farmers in the catchments participate, with an estimated 3,800 hectares enrolled. <strong>Payments</strong> to farmers amount to roughly<br />
over one million dollars a year (or €830,000) and $22 million to date.<br />
In Lower Saxony and Bavaria payments are driven by legal requirements that public waterworks must compensate landowners for lost<br />
income where property restrictions in designated protected areas require management beyond a reasonable standard <strong>of</strong> good stewardship.<br />
Limited information is available about these two programs. In the municipality <strong>of</strong> Kaufering, nitrate concentrations in groundwater<br />
have been observed to be higher underlying spruce monoculture forests; meanwhile mixed stands with beech are associated with lower<br />
nitrate levels. The municipal water utility has engaged private forest landowners in designated protection areas, paying them to voluntarily<br />
convert spruce forests into mixed deciduous forests. Funding comes from an increase in water rates (Greiber, van Ham, Jansse, &<br />
Gaworska, 2009).<br />
21%<br />
7%<br />
7%<br />
14%<br />
29%<br />
22%<br />
Private water users<br />
Public utility<br />
Municipality<br />
National government<br />
Private utility<br />
Regional government<br />
<strong>State</strong> <strong>of</strong> <strong>Waters</strong>hed <strong>Payments</strong> 2012 | 37
In Lower Saxony, groundwater supplies – the primary drinking water source in many areas – have experienced rising nitrate concentrations<br />
linked to agricultural intensification. The Water Association <strong>of</strong> Oldenburg and East Frisia (OOWV) in response initiated a<br />
groundwater protection program, declaring by legal ordinance eleven designated water protection areas. Private lands within these<br />
areas must comply with restrictions regarding land use. Landowners are eligible for payments from OOWV, the beneficiary, to cover<br />
foregone income and other costs in accordance with the national Water Act; OOWV also <strong>of</strong>fers larger payments for additional management<br />
actions and has acquired lands directly in key areas.<br />
Switzerland<br />
Similar legal requirements exist in Switzerland, where Basel and its suburb Riehen manage forests for groundwater replenishment<br />
capabilities, though it is unclear whether any private landowners are involved at present. Via a system <strong>of</strong> impoundment areas, water<br />
from the Rhine river is redirected into forested areas for recharge to the aquifer. Conversion <strong>of</strong> stands to desired species composition,<br />
such as the removal <strong>of</strong> hybrid poplars and planting <strong>of</strong> willows and wild cherry trees, also takes place. No transaction information is<br />
available about this program.<br />
Switzerland’s National Nitrate Strategy pays farmers for management activities reducing nitrate pollution in groundwater in areas<br />
near contaminated wells. Compensation is designed to make up for lost income due to changes in agricultural methods that go beyond<br />
legal requirements, as well as varying by measure and habitat type. <strong>Payments</strong> are disbursed annually in six-year contracts and<br />
range from $170-1,660 per hectare. The program’s budget for payments in 2011 is estimated at $10.3 million.<br />
Italy<br />
Facing aquifer depletion in Italy’s Veneto region, the Pedemontano Brenta Consortium has embraced natural infrastructure-based<br />
methods for groundwater recharge. The Consortium is piloting managing forest areas for infiltration, flooding forest-wetlands during<br />
peak season in the winter to ensure adequate groundwater levels during the dry summer months. The basin water body has signed<br />
contracts with private landowners, with the regional government paying $10,400 per hectare for forest infiltration area establishment<br />
and $1400/year (€1100/year), for their maintenance. More than $300,000 in funding is available, though relatively few farmers have<br />
expressed interest in participating. Eight hectares are under contract at present.<br />
Another example can be found in Romagna Acque S.p.A., a public water company, which compensates landowners for forest management<br />
practices that limit erosion, and thus sedimentation <strong>of</strong> the basin surrounding a key reservoir in the municipality <strong>of</strong> Bagno di<br />
Romagna. Funds come from Romagna Acque S.p.A.’s water tariff revenues. However, since the public water company is prohibited by<br />
Italian regulatory structures from making direct payments to landowners where the good or service in question is not well-defined,<br />
Romagna Acque S.p.A. has invested in forest roads useful to the landowners or sought to acquire land directly (Pettenella, Vidale,<br />
Gatto, & Secco, 2012).<br />
Sweden<br />
An innovative approach to using ‘green infrastructure’ for water pollution filtration is active in Lysekil, Sweden, where the community<br />
in response to EU Urban Waste Water Treatment Directives was required to reduce nutrient-rich effluent into Gullmar Fjord. A study<br />
showed that contracting with a company farming blue mussels, which are effective at filtering out pollutants and preventing eutrophication,<br />
in the Fjord was far more cost-effective at removing nitrogen than investing in wastewater treatment facilities onshore, by<br />
a factor <strong>of</strong> about one third. Under the terms <strong>of</strong> the current contract, Nordic Shell Holdings will remove 39 megatons <strong>of</strong> nitrogen, with<br />
the Lysekil local authority paying for the costs for the mussel beds each year - half up front and the remainder when 50 percent <strong>of</strong> the<br />
mussels are harvested. Transaction values are not available for 2011.<br />
Outlook<br />
Investments in watershed services in Europe, while generally remaining local in scale and relatively low in volume, look to remain<br />
steady in the coming years. Nestlé-Vittel’s well-known payments for catchment protection in France just entered its third decade,<br />
while municipal source water protection programs continue to enjoy a reliable financing source in the form <strong>of</strong> user fees.<br />
Many <strong>of</strong> these programs predate the very term “payments for ecosystem services”. But several promising new self-identified PES<br />
initiatives are also on the horizon in Europe that aim to demonstrate ecosystem investment principles at a broader scale. A transboundary<br />
payment for ecosystem services project in the Danube Basin region <strong>of</strong> Bulgaria and Romania is in development, led by<br />
38 | <strong>Charting</strong> <strong>New</strong> <strong>Waters</strong>
WWF. Several local PES projects are planned under the initiative, contributing to overall basin management and helping to finance<br />
implementation <strong>of</strong> the “Lower Danube Green Corridor” conservation strategy. Incentives for agricultural management in the Danube<br />
through the national agri-environmental program and payments for biodiversity protection are also being explored.<br />
In the United Kingdom, the Department for Environment, Food, and Rural Affairs (Defra) is supporting a pilot project, implemented by<br />
Natural England in partnership with local stakeholders, to develop payments for ecosystem services (PES) in upland areas in Cumbria,<br />
Yorkshire and South West England, largely on public lands.<br />
The water industry in the UK is also building on the examples set by United Utilities’ SCaMP, Upstream Thinking, and other demonstration<br />
projects. At the last price review (PR09), the water industry regulator Ofwat approved more than $96 million (£60 million) in<br />
funding for catchment management schemes in 100 water company catchments, which includes potential IWS opportunities that<br />
could increase following the next price review for 2014 (Ofwat, 2009).<br />
At a broader scale, pressure is mounting from some quarters to more tightly link CAP payments in the 2014-2020 period to environmental<br />
performance, including stricter cross-compliance requirements with the WFD and expanding support for “ecological focus<br />
areas” on farmland such as riparian buffer zones and wetlands. 10<br />
Interest in cost-effective watershed protection strategies may also be on the rise. The Blueprint to Safeguard Europe’s Water Resources,<br />
released in late 2012 just as this report goes to print, sets an agenda for common implementation <strong>of</strong> the WFD through 2020. The<br />
Blueprint promisingly contains an emphasis on natural infrastructure approaches, driven by concerns about the increasing frequency<br />
and severity <strong>of</strong> droughts and floods in the region due to climate change and land-use change; it also recommends “greening” CAP<br />
payments to encourage investments in “Natural Water Retention Measures” such as buffer strips as well as suggesting investigating<br />
water trading, certifications, and other market mechanisms to rationalize water use in the region.<br />
Another recent policy development germane to natural water infrastructure is the EU’s 2011-2020 biodiversity strategy, which prioritizes<br />
the development <strong>of</strong> a strategy for restoring degraded ecosystems and creating and maintaining an EU-wide green infrastructure<br />
network <strong>of</strong> connected natural areas. Though the preservation <strong>of</strong> biodiversity is the core objective, a landscape-level approach to<br />
ecological restoration and conservation will almost certainly benefit watershed functions as well. Rural Development Plans, Regional<br />
Development Plans, and the EU LIFE-Biodiversity fund have been identified as potential financing mechanisms, along with private<br />
sector-driven biodiversity <strong>of</strong>fsets and potentially other privately-financed PES-like mechanisms.<br />
10 See, for example, European Environmental Bureau, 2012.<br />
<strong>State</strong> <strong>of</strong> <strong>Waters</strong>hed <strong>Payments</strong> 2012 | 39
40 | <strong>Charting</strong> <strong>New</strong> <strong>Waters</strong>
Latin America<br />
Table 11: Summary Details, Latin America<br />
Number <strong>of</strong> active programs: 28<br />
Number <strong>of</strong> programs in development: 8<br />
Value <strong>of</strong> transactions in 2011: $87.1 million<br />
Value <strong>of</strong> transactions 2001-2011: $528.9 million<br />
Hectares managed for watershed services in 2011: 610,413 hectares<br />
Hectares managed for watershed services 2001-2011: 3.4 million hectares<br />
General Status Update<br />
Source: Ecosystem Marketplace.<br />
Latin American countries are home to some <strong>of</strong> the world’s best-known watershed investment programs – as well as some <strong>of</strong> the<br />
planet’s most pressing environmental challenges. Deforestation and other land-use changes, coupled with climate effects on glaciers<br />
and montane cloud forests are putting serious pressure on Latin American water supplies.<br />
Large-scale programs like Costa Rica’s national payments for ecosystem services program (parts <strong>of</strong> which we track here) and Mexico’s<br />
<strong>Payments</strong> for Hydrological Services program (PSAH) are well-known early PES initiatives, and our 2011 survey found programs like<br />
these alive and well and still constituting the lion’s share <strong>of</strong> payments.<br />
But another model – the water fund – has also come into its own since our last report. These funds draw initial capital, usually from a<br />
mix <strong>of</strong> user fees and public, private and NGO sources, to endow a trust fund or some other dedicated account that invests in conservation<br />
projects chosen by a stakeholder group, technical committee or other intermediary. These funds <strong>of</strong>fer the possibility <strong>of</strong> sustainable<br />
financing, landscape-level planning, and flexibility in selecting the most effective interventions. We tracked 23 fund mechanisms<br />
active in 2011, and several more in development.<br />
Active programs are concentrated in Ecuador, Colombia, Brazil, and Mexico. We find a good deal <strong>of</strong> regional variation in program<br />
size and activity within these. Bolivia, for example, had five active programs in 2011 – the second-highest in Latin America – but at<br />
$118,000 the second-lowest transaction volumes due to local-level focus and comparatively low payment rates.<br />
Programs in Latin America are also noteworthy for a frequent focus on building community social capital, and using IWS as a tool to<br />
connect stakeholders and even resolve conflicts. This approach is reflected in the language used to talk about watershed investments.<br />
The term “payments for ecosystem services” is <strong>of</strong>ten passed over in favor <strong>of</strong> “reciprocal agreements for water” or “benefits-sharing.<br />
mechanisms.” Compensation mechanisms may come paired with social marketing campaigns, social investments, and environmental<br />
awareness initiatives.<br />
Nearly half <strong>of</strong> programs tracked reported that they pay land managers with in-kind compensation, such as agro-inputs and technical<br />
training, rather than in cash. These tend to be local-scale initiatives, though larger funds like Quito’s Water Conservation Fund (in<br />
Spanish, “Fondo para la Protección del Agua” – known as FONAG) also make use <strong>of</strong> in-kind compensation. Programs relying on in-kind<br />
compensation tend to be concentrated in Ecuador, Colombia, and Bolivia. The cash versus in-kind question is <strong>of</strong>ten debated in the PES<br />
literature; lessons generated at these sites will be useful in determining whether one is any more effective than the other.<br />
<strong>State</strong> <strong>of</strong> <strong>Waters</strong>hed <strong>Payments</strong> 2012 | 41
42 | <strong>Charting</strong> <strong>New</strong> <strong>Waters</strong><br />
3<br />
Mexico<br />
Map 5: Active Programs, Latin America<br />
Costa Rica 2<br />
Ecuador 10<br />
2<br />
3<br />
2<br />
Colombia<br />
Peru 1<br />
5<br />
1<br />
Source: Ecosystem Marketplace.<br />
Bolivia<br />
Brazil 4<br />
3
A variety <strong>of</strong> payment mechanisms <strong>of</strong>ten makes programs difficult to compare. In-kind payments may be upfront or irregularly delivered<br />
and make it difficult to estimate values. Other contracts award compensation monthly, annually, or semi-annually. Some<br />
payments are made to individual households while others go to representative organizations, sometimes on communally-managed<br />
lands.<br />
Seventeen <strong>of</strong> the 20 programs we tracked in the 2010 report are still active. Several others appear to be “on-hold” programs – active<br />
in name, but it is unclear whether any payments are actually taking place. There is a worrying trend <strong>of</strong> programs initiated by international<br />
development assistance or foundational support that cease to operate once the initial grant period ends. It may be the case<br />
that a pilot shows that PWS is simply not the right mechanism for an area. Still, this pattern underscores the need in project design for<br />
securing long-term sustainable financing mechanisms and deep stakeholder engagement.<br />
Transaction Activity<br />
Altogether, we confirmed 28 active programs in the region in 2011 and eight in development. Another nine – mostly in Central<br />
America and Brazil– are believed active but could not be confirmed. Active programs responding to our survey reported more than<br />
$84 million in payments in 2011, down from the previous year’s transactions, which totaled $92 million (see Figure 29). This translates<br />
into 610,413 hectares protected in 2011 and nearly 3.4 million to date.<br />
Total values since 2008 have stayed relatively stable, although number <strong>of</strong> programs and activity levels can vary considerably year-toyear.<br />
Eleven <strong>of</strong> the 36 active programs identified in our last report are now inactive or could not be confirmed. In their place, only<br />
seven initiatives have emerged.<br />
Since the last report, we have also ceased tracking Costa Rica’s national <strong>Payments</strong> for Ecosystem Services program (PSA in Spanish) in<br />
the aggregate, as it targets an array <strong>of</strong> services including carbon and biodiversity. Where the national program has invested in hydrological<br />
services specifically with local partners, these are listed as individual programs.<br />
Investments in watershed services in Latin America continue to come mostly from Mexico’s national <strong>Payments</strong> for Hydrological Services<br />
program (PSAH in Spanish). PSAH provides core and matching funds, financed through water fees, for conservation projects in<br />
forested areas critical to watershed services. Local ownership <strong>of</strong> watershed investment efforts and the development <strong>of</strong> local financing<br />
streams, particularly from water users, are emphasized. PSAH works with both private landowners and holders <strong>of</strong> communal, or ejidal,<br />
land. <strong>Payments</strong> are differentiated to reflect opportunity costs for landowners and ranged from $28-100 per hectare in 2011. PSAH<br />
also leverages local stakeholder resources with matching funds, which are included in the figures presented in this report.<br />
Millions<br />
$100<br />
$90<br />
$80<br />
$70<br />
$60<br />
$50<br />
$40<br />
$30<br />
$20<br />
$10<br />
$0<br />
Figure 29: Annual <strong>Waters</strong>hed Investments by Year and Country 2001-2011, Latin America<br />
Figure 29<br />
2001 2002 2003 2004 2005 2006 2007 2008 2009 2010 2011<br />
Source: Ecosystem Marketplace.<br />
Bolivia<br />
Brazil<br />
Colombia<br />
Costa Rica<br />
Ecuador<br />
El Salvador<br />
Guatemala<br />
Honduras<br />
Mexico<br />
Nicaragua<br />
Perú<br />
<strong>State</strong> <strong>of</strong> <strong>Waters</strong>hed <strong>Payments</strong> 2012 | 43
Another national-scale program, Ecuador’s Socio Páramo, began investments in 2009. It pays farmers and indigenous communities<br />
in the country’s high-altitude grasslands to protect these critical sources <strong>of</strong> water. Socio Páramo is part <strong>of</strong> a larger national program,<br />
Socio Bosque, which pays rural landholders for conservation <strong>of</strong> lands with high biodiversity, carbon sequestration, and/or hydrological<br />
values, which alleviating poverty and building social capital in poor and indigenous communities. 19,680 hectares were enrolled in<br />
Socio Páramo in 2011, with payments to participants estimated at $137,000 that year. Compensation is scaled so that a landholder’s<br />
per-hectare payments decrease with additional enrolled hectares. This is designed to build greater social equity into the program by<br />
discouraging very large landholders’ reaping most <strong>of</strong> the economic benefits (de Koning, et al., 2011).<br />
The Water Fund<br />
Probably the most significant development since our last report has been the emergence <strong>of</strong> water funds as the dominant model in<br />
the region. We’ve tracked at least 23 active fund-like mechanisms with several more in development. Ecuador is the leader in these<br />
mechanisms, though there are a growing number in Colombia, Brazil, and other countries. Many are developed with support from<br />
The Nature Conservancy, which has amassed considerable experience in implementing the model. Water funds in Latin America were<br />
responsible for at least $3.8 million in watershed investments in 2011 – small in comparison to Mexico’s national PSAH program, but<br />
impressive considering their local scales.<br />
Funds generally rely on a mix <strong>of</strong> funds, including user contributions, public and private sources, and NGO support. Water user contributions<br />
are most <strong>of</strong>ten voluntary, though in several cases (for example, FONAG, FORAGUA, and FONACRUZ in Ecuador) water<br />
fee revenues have been earmarked or increased. Water funds also usually establish an endowment fund, <strong>of</strong> which the interest and<br />
perhaps some portion <strong>of</strong> the principal are directed toward conservation each year. A stakeholder board makes joint decisions about<br />
investments across the landscape. We use the term “fund” relatively loosely here, including in that category all programs where user<br />
contributions are managed by some representative group which makes decisions about watershed investments, and not just mechanisms<br />
involving a trust fund.<br />
Several funds have secured private-sector funds, such as in Quito, Ecuador, where FONAG receives payments from a brewery and<br />
spring water company, and Colombia’s Valle del Cauca where sugar mills and Bavaria Brewery among others have contributed. Still,<br />
private-sector support has yet to live up to the expectations set in earlier years, possibly because water is still <strong>of</strong>ten perceived as a<br />
public good and water resource management as properly the concern <strong>of</strong> the public sector. On the other hand, funds <strong>of</strong>ten rely heavily<br />
on NGO seed capital and support; donor financing is especially important in early stages to capitalize the fund if local stakeholders<br />
perceive the mechanism as risky or unenforceable.<br />
One interesting example <strong>of</strong> the benefits <strong>of</strong> the water fund model is FORAGUA, a joint initiative by a number <strong>of</strong> small municipalities in<br />
the provinces <strong>of</strong> Loja, Zamora Chinchipe, and El Oro in southern Ecuador. These municipalities have pooled their resources to create<br />
a regional fund. FORAGUA <strong>of</strong>fers a good case study in scaling up investments in watershed services: individually, these municipalities<br />
would have had difficulty paying to hire a secretariat to administer a fund or attracting significant donor aid, both <strong>of</strong> which they’ve<br />
been able to do collectively. The joint effort has also had something <strong>of</strong> a ‘bandwagon’ effect, with other municipalities also now expressing<br />
interest in participating in the fund, too. 11<br />
Funds have collectively invested at least $3.8 million in watersheds across Latin America in 2011 and more than $6 million to date.<br />
More than 125,000 hectares were restored and protected via water funds in 2011.<br />
Beyond Cash <strong>Payments</strong><br />
Another striking trend in Latin America is the frequent use <strong>of</strong> in-kind compensation, such as agro-inputs, training, and other resources<br />
in place <strong>of</strong> cash payments for protecting watershed services. Nearly half <strong>of</strong> the 28 surveyed active programs report that in-kind payments<br />
are their primary form <strong>of</strong> compensation. For instance, in Santa Cruz, Bolivia, the 415 families that participate in reciprocal<br />
agreements through the FONACRUZ fund receive beehives, fruit plants, and wire in return for their efforts. Participants in the Alto<br />
Mayo project in Perú can receive compensation for a range <strong>of</strong> best management practices, ranging from switching to honey production<br />
or raising guinea pigs to agr<strong>of</strong>orestry and solid waste management.<br />
11 Pers. communication, Leander Raes, Universiteit Gent. August 30, 2012.<br />
44 | <strong>Charting</strong> <strong>New</strong> <strong>Waters</strong>
Table 12: Water Funds, Latin America<br />
Name Country Status<br />
Comarapa Bolivia Active<br />
FONACRUZ (Santa Cruz) Bolivia Active<br />
Los Negros Bolivia Active<br />
Mairana Bolivia Active<br />
Rio Grande-Valles Crucenos Bolivia Active<br />
Água e Floresta (Guandu) Brazil Active<br />
Extrema Water Producers (São Paulo) Brazil Active<br />
Oásis Apucarana (Paraná state) Brazil Active<br />
Water Producers <strong>of</strong> the Piracicaba, Capivari and Jundiaí<br />
basins (“PCJ”)<br />
Source: Ecosystem Marketplace.<br />
Brazil Active<br />
Bogotá Water Fund Colombia Active<br />
Cundinamarca and Boyacá Colombia Active<br />
Valle del Cauca Colombia Active<br />
ESPH (Heredia) Costa Rica Active<br />
FONAG (Quito) Ecuador Active<br />
Celica Ecuador Active<br />
Espindola (Colombo-Yacuri <strong>Forest</strong>) Ecuador Active<br />
FONAPA (Cuenca) Ecuador Active<br />
FORAGUA (Loja, El Oro and Zamora Chinchipe provinces) Ecuador Active<br />
Pimampiro Ecuador Active<br />
Tungurahua Ecuador Active<br />
Cuencas y Ciudades (Saltillo) Mexico Active<br />
Alto Mayo Peru Active<br />
FOPAR (Riobamba) Ecuador Semi-active<br />
Gran Chaco Bolivia In Development<br />
Camboriu River Water Producers Brazil In Development<br />
Sustainable Livestock Managers (Regional) Colombia In Development<br />
Río El Ángel Ecuador In Development<br />
Pro-Cuencas (Zamora) Ecuador In Development<br />
<strong>State</strong> <strong>of</strong> <strong>Waters</strong>hed <strong>Payments</strong> 2012 | 45
Land managers themselves sometimes prefer in-kind compensation to cash: agro-inputs or technical training, for example, might better<br />
contribute to long-term livelihood improvement through income diversification or improved food security. Project developers also<br />
cite these benefits, and as well as the strengthening <strong>of</strong> community institutions and the superior ‘demonstration effects’ <strong>of</strong> concrete<br />
compensation like a beehive. In-kind payments may also be better received by those uncomfortable with a perceived commoditization<br />
<strong>of</strong> nature but amenable to a “reciprocal exchange.” On the other hand, it has been suggested that a large upfront non-rescindable<br />
payment might lower incentives for fulfilling contracts in the long-term or make enforcement <strong>of</strong> agreements much more difficult. 12<br />
Fundación Natura Bolivia is currently carrying out a randomized control trial with FONACRUZ participants, to be completed in 2013,<br />
to evaluate whether cash or non-cash payments contribute to better development outcomes. The study is also looking for evidence<br />
that the model delivers superior conservation benefits than other alternatives.<br />
Direct Contracts<br />
Other programs use bilateral contracts with buyers engaging directly with landholders on specific watershed investment projects.<br />
One, Costa Rica’s National Power & Light Company (Compañía Nacional de Fuerza y Luz S.A., or CNFL) was tracked in our last report.<br />
CNFL, faced with costly sedimentation and aquifer depletion issues, since 2001 has supported upstream landholders in switching to<br />
agr<strong>of</strong>orestry. <strong>Payments</strong> are channeled through the National <strong>Forest</strong>ry Fund (FONAFIFO) and average about $40 per hectare. An estimated<br />
$340,000 was paid out in 2011.<br />
In Ecuador, another hydroelectric operator, EMAPAL, has also embraced a compensation mechanism in the Tabacay River Basin.<br />
Steep slopes, land clearing, and intensive livestock ranching have led to an array <strong>of</strong> water quality issues in the city <strong>of</strong> Azogues and<br />
surrounding areas. Participating households receive in-kind compensation for switching to more sustainable agricultural and land<br />
management measures; the hydroelectric operator works with the state Ministry <strong>of</strong> Environment to provide seeds, other inputs, and<br />
training, at an estimated value <strong>of</strong> $65,000 annually.<br />
In Mexico, an effort to implement integrated watershed management in the Pixquiac River Basin secured agreements with landowners<br />
and communal landholders on 1,170 hectares in 2011. The Pixquiac River Basin Committee manages the Pixquiac River <strong>Waters</strong>hed<br />
Compensation for Ecosystem Services Program (Programa de Compensación por Servicios Ambientales de la subcuenca del río<br />
Pixquiac, or COSAPIX), channeling contributions from state and municipal governments and non-pr<strong>of</strong>it groups, matched 60:40 by the<br />
national PSAH program to total more than $45,000 in 2011.<br />
12 For further discussion <strong>of</strong> these issues, see (Wunder, 2005; Heyman & Ariely, 2004; and Goldman-Benner, et al., 2012).<br />
46 | <strong>Charting</strong> <strong>New</strong> <strong>Waters</strong><br />
Figure 30: Average IWS Program Payment Ranges in 2011 (Cash and In-kind), Latin America<br />
Rio Grande‐Valles Crucenos (Bolivia)<br />
Los Negros (Bolivia)<br />
FONACRUZ (Bolivia)<br />
Comarapa (Bolivia)<br />
Alto Mayo (Peru) (per connection)<br />
COSAPIX (Mexico)<br />
PSAH (Mexico)<br />
Celica (Ecuador)<br />
FORAGUA (Ecuador) (per 10‐person participant group)<br />
CNFL‐FONAFIFO (Costa Rica)<br />
Oásis Apucarana Project (Brazil)<br />
Oasis São Paulo Project (Brazil)<br />
$‐ $50 $100 $150 $200 $250 $300 $350 $400 $450 $500<br />
Per hectare/year (unless otherwise indicated)<br />
Source: Ecosystem Marketplace.<br />
In Kind<br />
Cash
Finally, a donor-funded program in Brazil aims to protect water supplies and quality for the Metropolitan Region <strong>of</strong> São Paulo. The<br />
Mitsubishi Foundation and the Institute Hedging Griffo have seeded the São Paulo Oasis Project, which engages landholders in<br />
protecting areas critical for watershed services, biodiversity, and carbon sequestration. Participants tend to be larger landholders;<br />
the program currently holds five-year contracts with fourteen landholders representing 748 hectares <strong>of</strong> land. <strong>Payments</strong>, which are<br />
in cash, are also on the higher side for the region, reaching up $182.26/hectare/year and averaging $147.78/ha/year. Just under<br />
$120,000 was paid out in 2011.<br />
Strengthening Community Institutions and Environmental Education<br />
Programs in Bolivia, Colombia, Ecuador, and Mexico all reported explicitly pro-poor social objectives including poverty alleviation, gender<br />
equality, and supporting indigenous rights and management <strong>of</strong> natural resources. About half report monitoring socio-economic<br />
impacts.<br />
A focus on building social capital and community engagement on environmental issues also came through loud and clear. An intriguing<br />
model for building buy-in for watershed compensation are NGO Rare Conservation’s “Pride Campaigns” that took place in Colombia,<br />
Ecuador, Peru and Bolivia from 2009-2011, building support for reciprocal water agreements.<br />
Pride campaigns are social marketing efforts carried out by local partners. They focus on environmental education and behavior<br />
change, employing radio, television, public events to build support for compensation to upstream communities in exchange for their<br />
protecting critical watershed and biodiversity values. A Pride Campaign has contributed to the creation <strong>of</strong> at least one currently active<br />
compensation mechanisms, in Ecuador’s Tabacay River watershed. Other programs initiated by these efforts are still in development;<br />
thirteen new campaigns are planned for 2012-14. Half <strong>of</strong> the 2009-2011 sites reported that they were able to facilitate agreements<br />
within year – a fifth <strong>of</strong> the normal time required; these campaigns have also generated $90,000 from communities for non-cash incentives<br />
to participants. 13<br />
Management Goals<br />
Fourteen programs reported that afforestation and reforestation were central management interventions; these strategies were <strong>of</strong>ten<br />
linked with stated goals <strong>of</strong> regulating and restoring flows and recharging aquifers. The perceived link between forests and flows is<br />
well-documented (though not always well-substantiated) (Echavarria, 2007) but the emphasis on groundwater was somewhat higher<br />
than expected.<br />
More than half <strong>of</strong> active programs tracked report that they reward interventions supporting a bundle <strong>of</strong> ecosystem services, including<br />
biodiversity, carbon sequestration, and landscape beauty. Three make additional payments (or “stack”) for biodiversity (the Bogotá<br />
Water Fund in Colombia and FORAGUA and Tabacay in Ecuador) and three for carbon sequestration (the FORAGUA, Tungurahua,<br />
and Pimampiro funds in Ecuador).<br />
Outlook<br />
<strong>New</strong> Program Development<br />
Latin America is due for a tremendous burst in activity in the coming years. Water funds in Zamora and Carchi provinces in Ecuador<br />
were close to becoming active as <strong>of</strong> 2011. In Colombia, a mechanism to reward livestock producers for sustainable management is<br />
also in advanced stages <strong>of</strong> development. In Brazil, a water fund for the Camboriu River basin in Brazil became active in 2012, where<br />
the Ribeirão Taquarussu and Ribeirão Piripau Water Producers funds are also in development. Fundación Natura Bolivia is also working<br />
to expand its model to the Bolivian Gran Chaco region in the near future.<br />
Many more programs are proposed. Rare Conservation, as mentioned earlier, is supporting thirteen new Pride Campaigns across<br />
Latin America from 2012-2014. Meanwhile, a new public-private initiative, the Latin American Water Funds Partnership, supported<br />
by The Nature Conservancy, the FEMSA Foundation, the Inter-American Development Bank (IDB) and the Global Environment Facility<br />
(GEF), has committed $27 million to develop and seed water funds across Latin America. The Partnership plans to support at least 32<br />
funds in total, protecting more than 2.8 million hectares.<br />
13 Rare Program for <strong>Waters</strong>hed Protection. Water for Life. Retrieved from http://www.rareconservation.org/sites/rareconservation.org/files/<br />
<strong>Waters</strong>hedProtectionResultsBrochureLR_Final.pdf.<br />
<strong>State</strong> <strong>of</strong> <strong>Waters</strong>hed <strong>Payments</strong> 2012 | 47
Policy<br />
Policy and legal frameworks are also beginning to embrace an ecosystem services approach. Brazil’s National Water Agency (ANA)<br />
has long supported a “Water Producer” approach at local and regional levels that channels water user fees and other funds toward<br />
compensation for landowners carrying out ecological restoration.<br />
Other national governments are also turning to incentive-based mechanisms to address water resource challenges. Peru’s Ministry <strong>of</strong><br />
Environment (MINAM), in partnership with <strong>Forest</strong> <strong>Trends</strong>, in early 2012 announced the launch <strong>of</strong> a new <strong>Waters</strong>hed Services Incubator<br />
to support IWS projects and policies. The Colombian and Ecuadorian governments are collaborating with The Nature Conservancy<br />
and other partners to develop spatial assessment tools to assess ecosystem services impacts <strong>of</strong> infrastructure projects. These mapping<br />
tools will help inform decisions about siting projects and regional planning.<br />
In Mexico, we’ve tracked some interest in establishing environmental flow allocations in streams, which would set minimum flows for<br />
instream and riparian habitat protection – similar to existing legal requirements in South Africa.<br />
Social Engagement and “Selling” Ecosystem Services<br />
The region <strong>of</strong>fers rich experience in developing effective outreach strategies for compensation for ecosystem services. ‘Social marketing’<br />
efforts like Pride Campaigns can be critical in strengthening capacity and overcoming concerns and resistance to compensation<br />
mechanisms. As Rare has found, efforts like these <strong>of</strong>ten significantly increase the pace <strong>of</strong> local buy-in.<br />
There are also valuable lessons to be taken from the way that Latin American program developers communicate about incentivebased<br />
arrangements. Concerns about commoditizing nature are especially strong in many areas in Latin America, and the language<br />
<strong>of</strong> “market mechanisms” and “ecosystem services” is not <strong>of</strong>ten well-received. On the other hand, emphasis on a culture <strong>of</strong> reciprocal<br />
agreements and community stewardship is more likely to be welcomed. This should not be written <strong>of</strong>f as a Latin American idiosyncrasy:<br />
the ecosystem services field has a global communication problem that’s increasingly well-documented. 14 Lessons learned about<br />
crafting messages to appeal to a broader audience and putting an emphasis on social engagement are useful beyond the region’s<br />
borders.<br />
14 For further reading on this subject, see Morris, 2010 and Resource Media, 2012.<br />
48 | <strong>Charting</strong> <strong>New</strong> <strong>Waters</strong>
North America<br />
Table 13: Summary Details, North America<br />
Number <strong>of</strong> active programs: 68<br />
Number <strong>of</strong> programs in development: 18<br />
Value <strong>of</strong> transactions in 2011: $360.5 million<br />
Value <strong>of</strong> transactions 1973-2011: $6.3 billion<br />
Hectares managed for watershed services / Units <strong>of</strong> 18,615 hectares; 343,136 lbs nitrogen; 96,819 lbs<br />
pollution reduction / Volume <strong>of</strong> instream flow restoration phosphorus; 3.745 million kCal/day; 8,080 acre-<br />
in 2011:<br />
feet; 301.61 cubic feet per second<br />
Hectares managed for watershed services / Units <strong>of</strong> 642,849 hectares; 12,537,389 lbs nitrogen; 199,656<br />
pollution reduction / Volume <strong>of</strong> instream flow restoration lbs phosphorus; 299 million kCal/day; 2,858,629<br />
1973-2011:<br />
acre-feet; 858 cubic feet per second<br />
General Status Update<br />
Source: Ecosystem Marketplace.<br />
Most watershed payment initiatives in North America are based in the United <strong>State</strong>s. Programs are taking place in 28 states with one<br />
active in Ontario, Canada. Oregon, Washington, and Minnesota lead as far as active programs. A range <strong>of</strong> models are evident, including<br />
bilateral and trustee mechanisms for drinking water protection, trading and <strong>of</strong>fsets, and instream buybacks. In this chapter, we’ll<br />
consider each <strong>of</strong> these in turn in separate sections.<br />
Across the country, municipal drinking water protection programs are maturing. Several new efforts have also appeared on the landscape<br />
since our last report, as municipalities consider investing in natural water infrastructure as a cost-effective alternative to treatment<br />
technologies. We’re also seeing diversification in the funding streams used to pay for these investments, and a growing interest<br />
in some areas in user-financed programs and voluntary contribution mechanisms.<br />
On the other hand, 2011 was a slow year for water quality trading (WQT). North America is home to nearly all <strong>of</strong> the world’s WQT<br />
programs. Overall, there are 23 trading programs in the region; thirteen <strong>of</strong> these reported transaction activity in 2011 totaling nearly<br />
$7.7 million. This is down from a recorded high in 2009 <strong>of</strong> $10.7 million. The Chesapeake Bay Total Maximum Daily Load (see Box<br />
5), which came into effect in January <strong>of</strong> that year, had yet to make its effects strongly felt – though signs indicate that trading saw a<br />
bounce in 2012. Similarly, in the Ohio River Basin and in Oregon, the year was spent developing new markets that we expect to show<br />
significant growth in the coming years.<br />
Other factors might have come into play as well – high food prices may have led farmers to prefer increasing production over risking<br />
lower yields through nutrient management to generate credits. Slower economic activity overall likely dampened demand. <strong>New</strong>er<br />
programs tend to focus on nonpoint source-generated credits, which can be (depending on transaction costs) cheaper than their<br />
point-source counterparts and thus might lead to lower overall payments. And many programs reported to us that point sources had<br />
not needed to trade in 2011 at all, as they had not hit their pollution limits thanks to technological upgrades.<br />
This report marks the first year we’ve tracked environmental water transactions, which take advantage <strong>of</strong> existing water rights markets<br />
to acquire diversion rights and then leave the water instream to support ecological health. These programs have been steadily<br />
increasing in the past decade and make up nearly a third <strong>of</strong> new program growth in North America from 2008-2011. Groundwater<br />
mitigation programs have also taken <strong>of</strong>f in the last few years – an exciting new development as groundwater is <strong>of</strong>ten both over-used<br />
and under-regulated in North America.<br />
<strong>State</strong> <strong>of</strong> <strong>Waters</strong>hed <strong>Payments</strong> 2012 | 49
2<br />
12<br />
50 | <strong>Charting</strong> <strong>New</strong> <strong>Waters</strong><br />
7<br />
2<br />
> $250 Million<br />
> $50 Million<br />
> $10 Million<br />
> $1 Million<br />
< $1 Million<br />
Data Unavailable<br />
2<br />
1<br />
1<br />
Map 6: Active Programs by <strong>State</strong>, United <strong>State</strong>s<br />
3<br />
1<br />
1<br />
6<br />
1<br />
Source: Ecosystem Marketplace.<br />
Map 7: Historical Transactions by <strong>State</strong>, United <strong>State</strong>s<br />
Source: Ecosystem Marketplace.<br />
1<br />
7<br />
1<br />
2<br />
2<br />
1<br />
1<br />
2<br />
4<br />
2<br />
1<br />
1<br />
1<br />
1<br />
1
Number <strong>of</strong> Programs<br />
All <strong>of</strong> the programs identified in our 2010 report are still active, aside from the Chatfield Reservoir, which appears to not have experienced<br />
any trading <strong>of</strong> late. The Pennsylvania Water Quality Trading, developed in anticipation <strong>of</strong> a Total Maximum Daily Load (see Box<br />
5), has been superseded by the Pennsylvania Chesapeake Nutrient Trading Program with the advent <strong>of</strong> the Chesapeake Bay TMDL in<br />
early 2011.<br />
16<br />
14<br />
12<br />
10<br />
8<br />
6<br />
4<br />
2<br />
0<br />
Millions<br />
Figure 31: <strong>New</strong> IWS Programs by Year and Type, North America<br />
Source: Ecosystem Marketplace.<br />
$400 Figure 32: Annual IWS Transactions by Year and Program Type 2009-2011, North America<br />
$350<br />
$300<br />
$250<br />
$200<br />
$150<br />
$100<br />
$50<br />
$‐<br />
2009 2010 2011<br />
Source: Ecosystem Marketplace.<br />
Transaction Activity - Bilateral Arrangements and Funds<br />
Water quality trading<br />
Instream buybacks<br />
Groundwater <strong>of</strong>fsets<br />
Bilateral & Funds<br />
Instream buybacks<br />
Bilateral & Funds<br />
Groundwater <strong>of</strong>fsets<br />
Water quality trading<br />
In 2011, we tracked 21 programs investing in natural water infrastructure as a cost-effective strategy to secure water supplies and<br />
quality. The group is dominated by municipalities and cities taking steps to safeguard drinking water supplies against current pressures<br />
and future risks, although “buyers” also included a hydropower facility mitigating impacts, individual donation programs, and NGOs<br />
and other public good buyers interested in demonstrating natural capital interventions. These programs rely on bilateral and fund<br />
models to finance their activities.<br />
<strong>State</strong> <strong>of</strong> <strong>Waters</strong>hed <strong>Payments</strong> 2012 | 51
Box 4: Federal Funding for Drinking Water Protection, United <strong>State</strong>s<br />
A long-standing source <strong>of</strong> federal financing has been EPA’s 319 Program, which provides grants to states and tribes to implement<br />
nonpoint source projects and programs in accordance with section 319 <strong>of</strong> the Clean Water Act (CWA). Nonpoint source pollution<br />
reduction projects can be used to protect source-water areas and the general quality <strong>of</strong> water resources in a watershed. $175 million<br />
was disbursed in 2011 via 319 grants, and more than $3 billion since 1990.<br />
The Clean Water <strong>State</strong> Revolving Fund (CWSRF) provides low-to-no interest loans for water quality projects, including source water<br />
assessment and protection efforts. <strong>State</strong> funds are capitalized by state and federal contributions; repaid loans return to the Fund and<br />
are rolled into new loans. <strong>State</strong>s set funding priorities individually. The CWRSF has more than $30 billion in capital today and funded<br />
almost $3 billion worth <strong>of</strong> projects in 2011. Similarly, water managers can apply to the Drinking Water <strong>State</strong> Revolving Fund (DWSRF)<br />
for financing for infrastructure improvements, which in 2010 had a total appropriation <strong>of</strong> more than $1.3 billion. The CWSRF and<br />
DWSRF are significant funding sources for watershed protection, though they are not included in our aggregated transaction data<br />
since they support a variety <strong>of</strong> projects beyond natural capital investment and are not true payment mechanisms.<br />
Table 14: Active Source Water Protection Programs, North America<br />
Name Location<br />
52 | <strong>Charting</strong> <strong>New</strong> <strong>Waters</strong><br />
Total<br />
Investments<br />
Hectares<br />
Protected<br />
Funding Source<br />
Carroll County GA $11,840,455 759 Voter-approved sales tax increase<br />
Catskills (<strong>New</strong> York City) NY $1,500,000,000 510,745 City, state, and federal funds<br />
Cedar River and Tolt River <strong>Waters</strong>heds<br />
(Seattle)<br />
Conservation Reserve Enhancement<br />
Program (Tulsa)<br />
WA $82,000,000 40,670 Habitat Conservation Plan budget,<br />
utility budget<br />
OK $234,515 2,351 City, state, and federal funds<br />
Edwards Aquifer (San Antonio) TX $128,000,000 39,250 Voter-approved sales tax increase<br />
Lambert Creek (Saint Paul) MN - - <strong>State</strong> and federal grants<br />
Minnesota Clean Water Fund<br />
(<strong>State</strong>wide)<br />
Mountain Island Lake (Charlotte-<br />
Mecklenburg County)<br />
National <strong>Forest</strong> System Lands,<br />
Rocky Mountain Region (Denver)<br />
Nonpoint Source Implementation<br />
Grants<br />
Quabbin-Wachusetts (Metro<br />
Boston)<br />
MN $201,960,000 - Voter-approved sales tax increase<br />
NC $35,000,000 2,430 <strong>State</strong> and county government<br />
grants, foundation support, bond<br />
issue, dedicated fee on water bills<br />
CO $16,500,000 13,355 Water bill increase; Funds matched<br />
by US <strong>Forest</strong> Service<br />
National $3,416,000,000 - Federal funds<br />
MA $130,846,485 29,755 <strong>State</strong> budget allocations, bond<br />
funds, ratepayer fees<br />
Salt Lake City UT - 9,700 Water user fees<br />
San Francisco CA $50,000,000 - Bond funds and operating budget<br />
allocation
Source Water Protection Strategies Going Strong<br />
Drinking water protection initiatives, including well-known public programs established to protect <strong>New</strong> York City’s, Seattle’s, and<br />
Massachusetts’s Quabbin and Wachusetts reservoirs’ watersheds continue to loom large on the landscape. Similar efforts were<br />
found in San Francisco, California; Suffolk County, <strong>New</strong> York; Carroll County, Georgia; Denver, Colorado; San Antonio, Texas; Saint<br />
Paul, Minnesota; Charlotte-Mecklenburg County, North Carolina; Tulsa, Oklahoma; and Salt Lake City, Utah.<br />
Overall, these types <strong>of</strong> programs account for more than $5.9 billion in investments since 1981. <strong>Payments</strong> in 2011 were at least $4.6<br />
million but probably somewhat higher than that, as recent spending data was difficult to obtain for this group. However, to the extent<br />
that these programs involve direct land acquisition – and nine <strong>of</strong> the twelve do – dollars transacted are likely to peak initially with<br />
upfront capital costs, followed by lower ongoing management costs. Only Denver Water reported new land coming under management<br />
in 2011.<br />
Programs generally engage private landowners, <strong>of</strong>ten through a mix <strong>of</strong> conservation easements, ongoing payments for good management,<br />
or land acquisition. Sometimes this is driven by a municipality’s strategy for compliance with drinking water standards; 15 other<br />
programs have engaged in watershed investment to pre-empt future regulation or voluntarily protect water quality or supply.<br />
Figure 33: <strong>Waters</strong>hed Investors by Sector - Bilateral and Fund<br />
Arrangements, North America<br />
3%<br />
17%<br />
7%<br />
7%<br />
21%<br />
17%<br />
7%<br />
Per hectare/year (unless otherwise indicated)<br />
Federal<br />
21%<br />
<strong>State</strong><br />
County<br />
Municipal<br />
Hydroelectric operator<br />
Water users<br />
Civil/NGO<br />
Voluntary user donations<br />
As for funding, programs to protect municipal water supplies<br />
are well-suited to a water fund model, as water user<br />
fees or a designated portion <strong>of</strong> local taxes can be directed<br />
into a dedicated “pot” for watershed protection and used to<br />
leverage other public or private funds, with the municipality<br />
or a water utility acting as a trustee and making decisions<br />
about investment. (See the introduction for more information<br />
on trustee-fund models.) We’ve identified several<br />
programs relying on voter-approved tax increases or water<br />
user fees (<strong>of</strong>ten as part <strong>of</strong> a larger funding ‘mix’), including<br />
in San Antonio, Carroll County, Suffolk County, Denver, and<br />
Salt Lake City (see Table 15).On the other hand, quite a few<br />
project developers also reported to us that they had found<br />
user fees an unpopular idea in their locality, especially given<br />
2011’s slow economy.<br />
Source: Ecosystem Marketplace.<br />
Source-water protection programs are by definition local in<br />
scale, targeting water supplies for a specific city or municipality.<br />
An example <strong>of</strong> a broader-scale fund can be found in Minnesota’s Clean Water Fund. Minnesota voters in 2008 approved a<br />
sales tax increase <strong>of</strong> three-eighths <strong>of</strong> one percent; one-third <strong>of</strong> those revenues are earmarked for a state Clean Water Fund to finance<br />
watershed protection and restoration projects around the state. Seven state agencies partner to administer funds and implement<br />
projects. The fund had a budget <strong>of</strong> $150.8 million in 2011.<br />
Voluntary User Contributions: A <strong>New</strong> <strong>Trends</strong> in Financing?<br />
Since the last report, we’ve tracked the emergence <strong>of</strong> a new species <strong>of</strong> watershed investment program - the voluntary individual userfinanced<br />
mechanism. These initiatives are fairly small in terms <strong>of</strong> dollar values but we’re intrigued by their future potential, and the<br />
lessons they can <strong>of</strong>fer on engaging the public on watershed conservation.<br />
In Tucson, Conserve to Enhance (C2E) works with water utilities and non-pr<strong>of</strong>it groups to track consumers’ water use over time, and<br />
enables donation <strong>of</strong> the monetary value <strong>of</strong> conserved water directly to an environmental enhancement fund. In 2011, 60 households<br />
participated in the pilot (<strong>of</strong> which 45 received subsidies to implement rainwater harvesting practices), conserving over 1.1 million<br />
gallons <strong>of</strong> water. The monthly Tucson Water utility bill also has an opt-in check box for “riparian enhancement” that allows water<br />
customers to make donations to the C2E fund. Transaction data is not yet available for this program.<br />
15 Efforts are <strong>of</strong>ten driven by the 1989 federal Surface Water Treatment Rule (SWTR), which establishes that if the water quality within a<br />
given watershed meets a certain standard, a permit can be issued exempting the watershed from the filtration requirements typically enforced<br />
by the Environmental Protection Agency. This is known as a filtration avoidance determination (FAD) or alternative to filtration (LAF). <strong>New</strong> York<br />
City, Seattle, San Francisco, Salt Lake City, and Quabbin-Wachusetts all cite the Surface Water Treatment Rule as a key driver.<br />
<strong>State</strong> <strong>of</strong> <strong>Waters</strong>hed <strong>Payments</strong> 2012 | 53
Another initiative where individuals support watershed investment is the National <strong>Forest</strong> Foundation (NFF)’s Ski Conservation Fund<br />
and <strong>Forest</strong> Stewardship Fund, which collects funds from participating ski resorts, lodges, and others, operating in national forest regions.<br />
NFF matches contributions at a 50 percent rate. Local nonpr<strong>of</strong>it organizations implement funded projects, which are selected<br />
by representatives from the resorts and lodges, the NFF, and the US <strong>Forest</strong> Service. Many projects focus on watershed restoration<br />
and protection, through direct and indirect actions such as trail restoration, riparian and forest restoration, and restoration <strong>of</strong> eroded<br />
recreation areas. Transaction data was unavailable for 2011 at the time <strong>of</strong> this report’s writing.<br />
And in the Deschutes River Basin, the Avion Water Company allows ratepayers to donate to water rights leasing programs to restore<br />
instream flows, via a ‘checkbox’ option. Leases are facilitated by the Deschutes River Conservancy’s Blue Water Program. Avion’s<br />
consumers can choose to donate at four different levels ranging from $1.60 to $6.40 each month. 2010 donations totaled $14,554<br />
and enabled the protection <strong>of</strong> 2,624 acre-feet <strong>of</strong> water. 16<br />
Table 15: A Sample <strong>of</strong> <strong>Waters</strong>hed Investment Programs in North America: Where Are They Now?<br />
54 | <strong>Charting</strong> <strong>New</strong> <strong>Waters</strong><br />
<strong>New</strong> York City-<br />
Catskills <strong>Waters</strong>hed<br />
Protection<br />
Cedar River <strong>Waters</strong>hed,<br />
Seattle<br />
Quabbin and Wachusett<br />
<strong>Waters</strong>heds,<br />
Massachusetts<br />
Year established 1997 1992 1985 1993<br />
Status in 2011 Active Active Active Active<br />
San Francisco Public<br />
Utilities Commission<br />
("Hetch Hetchy" in<br />
2010 report)<br />
Transactions as <strong>of</strong> 2008 $1.5 billion $10.7 million $121 million $14.5 million<br />
Transactions as <strong>of</strong> 2011 $1.5 billion $82 million $130.8 million $50 million<br />
Units Protected/<br />
Restored as <strong>of</strong> 2008<br />
Units Protected/<br />
Restored as <strong>of</strong> 2011<br />
510,745 ha 36,624 ha 52,486 ha 507,637 ha<br />
510,745 ha 40,670 ha n/a n/a<br />
Privately Owned <strong>Forest</strong>s: Tapping a <strong>New</strong> Supply<br />
<strong>Payments</strong> for watershed services efforts have historically focused on engaging private agricultural producers, interventions on public<br />
lands, or outright land acquisition. But more than half <strong>of</strong> forestland in the United <strong>State</strong>s is privately owned. Two new programs are<br />
working with private forest landowners in the east to protect landscapes critical to water supplies in the east. Both are in early stages<br />
but are expected to generate important knowledge about this as-yet untapped supply <strong>of</strong> watershed services.<br />
The US Endowment for <strong>Forest</strong>ry and Communities has funded two “<strong>Forest</strong>s to Faucet” initiatives currently in their pilot stages in the<br />
South Fork Rivanna River basin in Virginia and in <strong>New</strong> York/<strong>New</strong> Jersey/Pennsylvania’s Delaware River <strong>Waters</strong>hed.<br />
The pilot in Virginia compensates forestland owners for converting marginal agricultural land to tree cover and protecting high-quality<br />
standing forest. The Virginia Department <strong>of</strong> <strong>Forest</strong>ry administers the program with support from non-pr<strong>of</strong>it conservation groups and<br />
other local stakeholders, and provides some funding as well; administrators are exploring the possibility <strong>of</strong> water utilities contributing<br />
in the post-pilot phase. About $160,000 was paid out in 2011.<br />
The Upper Delaware River watershed provides drinking water to more than fifteen million people in <strong>New</strong> York, <strong>New</strong> Jersey, and<br />
Pennsylvania. The Common <strong>Waters</strong> Fund, coordinated by the Pinchot Institute for Conservation, will secure conservation easements<br />
from forest landowners to protect downstream water quality and guard against urbanization pressures. This project is also planning<br />
for post-pilot funding, and is seeking support from foundations and downstream beneficiaries including businesses and other water<br />
users in the Delaware Basin. A first round <strong>of</strong> $250,000 in landowner grants has been awarded as <strong>of</strong> the end <strong>of</strong> 2011 to fund forest<br />
management plans and practices on 48 properties, covering more than 13,000 acres in the basin.<br />
16 Please note that these payments are tracked as instream buybacks in our analysis.
Co-Benefits<br />
A number <strong>of</strong> programs tracked manage their watersheds for multiple benefits. Carroll County and Suffolk County both focus on restoring<br />
and protecting natural habitats. Conserve to Enhance, the National <strong>Forest</strong> Foundation, and Saint Paul, Minnesota, all report<br />
that biodiversity values, landscape beauty, and recreational benefits are integral to their efforts.<br />
In Seattle’s Cedar River <strong>Waters</strong>hed, Seattle Public Utilities (SPU) manages lands under the terms <strong>of</strong> a 50-year Habitat Conservation<br />
Plan (HCP) in order to be assured <strong>of</strong> compliance under the US Endangered Species Act, as several imperiled fish species are present in<br />
the watershed. SPU anticipates spending a total <strong>of</strong> $150 million by 2050 for the HCP, which includes funding for watershed restoration<br />
and protection projects.<br />
Finally, we uncovered one case <strong>of</strong> “stacking” ecosystem services in Carroll County, Georgia, where streambank credits for mitigation<br />
have also been generated on some <strong>of</strong> the lands acquired for drinking water protection in the Chattahoochee Basin – a very interesting<br />
example <strong>of</strong> one way publicly-owned watershed lands might help to self-finance their management.<br />
Outlook - Bilateral and Fund Arrangements<br />
United <strong>State</strong>s<br />
Though long-running programs like <strong>New</strong> York City’s efforts in the Catskills or the Quabbin/Wachusetts reservoirs in Massachusetts<br />
look like they’re slowing down in terms <strong>of</strong> dollars transacted, their impacts grow in value every year. Other municipalities have taken<br />
notice: a third <strong>of</strong> the source water protection programs tracked are new since our last report, and our research shows that several<br />
more are waiting in the wings. What’s especially interesting is that all <strong>of</strong> these are considering a user-financed model – a promising<br />
new source <strong>of</strong> revenue as government budgets for water infrastructure remain tight in the US.<br />
<strong>New</strong> Programs in Development<br />
In Florida, the Florida Ranchlands Environmental Services Project, which connects ranchers with state agencies to incentivize best<br />
management practices, shifted out <strong>of</strong> the pilot phase in 2012, with the South Florida Water Management District, the program’s expected<br />
main buyer, taking over administration <strong>of</strong> the mechanism that same year.<br />
A new mechanism in Santa Fe, <strong>New</strong> Mexico, was first proposed in the city’s 2007 watershed management plan, in the ashes <strong>of</strong> the<br />
2000 Cerro Grande Fire which cost Santa Fe more than $970 million in compensation, suppression and rehabilitation. In 2008, the<br />
city and the US <strong>Forest</strong> Service finalized a cost-share agreement for managing lands in the Santa Fe River watershed, with Santa Fe’s<br />
contributions coming out <strong>of</strong> its existing operating budget. Other municipalities in the west have also shown interest in models like<br />
Santa Fe’s and Denver’s, including Ashland, Oregon, and Bozeman, Montana, where wildfire risk on public forestlands threatens to<br />
pose crippling costs on water utilities in the event <strong>of</strong> a fire.<br />
In Oregon, the Eugene Water & Electric Board (EWEB) envisions a “Voluntary Incentives Program” that compensates private landowners<br />
in the McKenzie River <strong>Waters</strong>hed for protecting and restoring riparian zones. <strong>Payments</strong> would come from an established<br />
water fund, potentially capitalized by water user fees, utility budget allocations, corporate contributions, development impact fees,<br />
state or federal mitigation funds, or some mix <strong>of</strong> the above.<br />
In California, just over the bay from San Francisco, a project to protect the Mokelumne River watershed, which supplies the East Bay<br />
Municipal Utility District, is in planning stages. It proposes to link East Bay water users to upstream private forest landowners via a<br />
ratepayer-funded compensation mechanism.<br />
More voluntary contribution programs are also on the horizon. Conserve to Enhance is planning a second pilot in Fort Collins, Colorado.<br />
In southwestern Colorado, the Rushing Rivers Program works with ratepayers to ensure that water conservation savings benefit<br />
the environment, rather than just meeting new growth. Water providers commit to not diverting the quantity <strong>of</strong> water saved by<br />
participating customers, instead leaving it in the San Juan River to support instream flows. And in Milwaukee and Madison Wisconsin,<br />
the H20 Score program which helps water users monitor their consumption is piloting a mechanism wherein residents are actually<br />
paid a penny per gallon conserved (funds are put up by local businesses).<br />
<strong>State</strong> <strong>of</strong> <strong>Waters</strong>hed <strong>Payments</strong> 2012 | 55
IWS-Friendly Institutions<br />
Another promising effort to catalyze investment in watershed protection takes a different approach. In Seattle, a stakeholder group,<br />
the WRIA 9 <strong>Waters</strong>hed Ecosystem Forum, has drafted legislation proposing a <strong>Waters</strong>hed Investment District to contribute to restoration<br />
<strong>of</strong> the Puget Sound basin. A watershed investment district is a legal body that can raise and disburse funding via taxes and utility<br />
fees for watershed and salmon habitat conservation. The district would be delineated by watershed boundaries instead <strong>of</strong> jurisdictional<br />
ones, which would contribute to better coordination <strong>of</strong> restoration efforts.<br />
Several US states are also working to develop policies conducive to investments in ecosystem services, including working groups<br />
commissioned in Oregon and Maryland to explore opportunities for ecosystem services markets and recommendations for market<br />
frameworks, which both presented findings in 2011 (Oregon Sustainability Board, 2010; Ecosystem Services Working Group, 2011).<br />
On a final note, utility investments in watersheds remain limited by the accounting standards they must adhere to, which are set by<br />
the US Governmental Accounting Standards Board (GASB). Under current rules, utilities cannot list watersheds as assets on their<br />
books beyond simple values <strong>of</strong> land and trees. That makes it difficult to justify capital improvement projects to better manage the<br />
watershed, since the utility can’t borrow against the true economic value <strong>of</strong> their watershed assets. A working group including seven<br />
public utilities in the US and Canada has formed to propose amendments to GASB standards to correct this.<br />
Canada<br />
In Canada, payments for ecosystem services have not been as widely embraced as in other developed countries, though examples<br />
are becoming more common. Our research concluded that the South National Phosphorus Trading Program (discussed in the next<br />
section) is the only active program in Canada, though a quasi-PWS mechanism was found in Manitoba in the form <strong>of</strong> a tax credit to<br />
farmers for rehabilitating and conserving riparian zones (Kenny, Elgie, Sawyer, & Wichtendahl, 2011).<br />
Transaction Activity - Water Quality Trading<br />
Water quality programs have been steadily appearing (though not always sticking around) in North America in the past decade and<br />
make up half <strong>of</strong> newly developing programs. We’ve identified five new active programs since our last report in 2010 and eight in<br />
development.<br />
In 2011, programs were active in thirteen US states and in Ontario with new markets coming online in Oregon, California, and Nevada.<br />
Minnesota, North Carolina, and Colorado led the nation in 2011 in number <strong>of</strong> active programs, while the largest markets by transaction<br />
volumes are found in Connecticut, North Carolina, and Virginia.<br />
Water quality trading programs are generally driven by regulatory standards setting a maximum acceptable level <strong>of</strong> pollution in a<br />
given water body, implemented by capping point sources’ (facilities discharging through a discrete conveyance, like a pipe) permitted<br />
discharge allowances. Facilities then can meet these standards by controlling pollution on-site (generally through technological upgrades)<br />
or by trading “credits” that represent a given amount <strong>of</strong> pollution reduction achieved elsewhere. Point sources (PS) may trade<br />
with other point sources, or with nonpoint sources (NPS) like farmers who reduce pollution loads through nutrient management or<br />
maintaining buffer zones around water bodies.<br />
Total Maximum Daily Loads (TMDLs) remain the key driver <strong>of</strong> water quality trading in the US. The Chesapeake Bay TMDL has spurred<br />
a noticeable jump in market activity in Virginia and Pennsylvania, parts <strong>of</strong> which are drained by the Chesapeake Bay basin. However, in<br />
Maryland, despite the development <strong>of</strong> crediting tools and a public marketplace and registry, no trades were tracked in 2011. In West Virginia,<br />
parts <strong>of</strong> which are also subject to the Chesapeake TMDL, no formal trading program exists due to government resource constraints,<br />
though the state Department <strong>of</strong> Environmental Protection will review <strong>of</strong>fsets for new development on a case-by-case basis. 17<br />
Overall 343,136 lbs <strong>of</strong> nitrogen and 96,800 pounds <strong>of</strong> phosphorus were tracked in 2011. Nitrogen volume is low as transaction data for<br />
the Connecticut Nitrogen Exchange (CNE), the biggest market for nitrogen, was unavailable at the time <strong>of</strong> the report. (For comparison,<br />
493,133 nitrogen credits were sold on the CNE in 2010.) Volumes in the Chesapeake Bay basin are still low but growing, with the Virginia<br />
Nutrient Credit Exchange (which covers five basins) posting more than 246,000 lbs in 2011 and 61,000 credits sold at auction in Pennsylvania.<br />
Virginia trading also made up a major piece <strong>of</strong> the phosphorus pie, accounting for roughly 79,000 lbs marketed in 2011.<br />
17 Pers. Communication with Teresa M. Koon, WV DEP Division <strong>of</strong> Water and Waste Management, July 27 2012.<br />
56 | <strong>Charting</strong> <strong>New</strong> <strong>Waters</strong>
Box 5: Water Quality Trading in the United <strong>State</strong>s: The Regulatory Framework<br />
Water quality markets are generally developed as a way to cost-effectively comply with water quality regulations. In the United<br />
<strong>State</strong>s, commercial and public entities releasing pollutants into water bodies through a “discrete conveyance” like a pipe or manmade<br />
ditch (known as “point sources”) are required by the Clean Water Act to hold a National Pollutant Discharge Elimination System<br />
(NPDES) permit. NPDES permits set either technology-based or water quality standard-based limits on pollution. If water bodies<br />
experience degradation despite NPDES permit controls, a Total Maximum Daily Load (TMDL) may be set at the watershed scale,<br />
setting out recommended pollution limits.<br />
TMDLs are generally implemented by focusing on reducing point source pollution. But in some cases it’s more cost-effective to<br />
achieve those reductions through an intervention by another party or at another site in the same watershed, such as a sewage<br />
treatment paying a nearby factory to reduce their pollution in place <strong>of</strong> the treatment plant’s doing so. Or the plant might instead<br />
contract with a farmer to adjust the timing or amount <strong>of</strong> fertilizer application on his fields in order to reduce nutrient pollution to the<br />
water body that the two share. Water quality “trades” like this have been going on since the early 1980s, but it wasn’t until 2003 that<br />
the US Environmental Protection Agency released a national water quality trading policy, which has been followed by guidance for<br />
permit writers and watershed planners.<br />
Not all water quality trading are driven by regulations: in the Conservation Marketplace <strong>of</strong> Minnesota and the Great Miami River programs,<br />
market development are “pre-compliance” – that is, they’ve been created in anticipation <strong>of</strong> a future TMDL but are currently<br />
voluntary.<br />
Still, 2011 was a slow year for water quality markets, both in terms <strong>of</strong> dollar values and volumes traded. Transactions totaled $7.7 million,<br />
down from a high in 2008 <strong>of</strong> $10.6 million. No trades took place in 2011 in several programs including in the Tar-Pamlico Basin in<br />
North Carolina, and the South Nation Total Phosphorus Management Program in Ontario.<br />
This is not necessarily a bad sign, environmentally speaking: when point source facilities do not exceed their load allocation for the<br />
year, trading is unnecessary. Technological upgrades, for example, <strong>of</strong>ten are followed by a drop in trading. In the Connecticut Nitrogen<br />
Exchange, for example, despite credit prices (which are set by the exchange) steadily increasing and load limits tightening to comply<br />
with the TMDL, volumes and dollars have fallen – in part because end <strong>of</strong> pipe loads have been dropping on average every year thanks<br />
to upgrades and new facilities (Nitrogen Credit Advisory Board, 2011).<br />
Several programs focused on nonpoint source-generated credits also reported that they have exceeded regulatory expectations.<br />
In Ohio for example, the Alpine Cheese Company has reduced phosphorus loads by 20% more than required by paying farmers to<br />
implement nutrient management practices. The Southern Minnesota Beer Sugar Cooperative has surpassed its nutrient reduction<br />
requirements <strong>of</strong> 6,500 lbs annually, generating over 15,000 credits in both 2010 and 2011.<br />
Millions<br />
Figure 34: Annual Transactions 2001-2011, Water Quality Trading, North America<br />
$12<br />
$10<br />
$8<br />
$6<br />
$4<br />
$2 $2<br />
$0<br />
2001 2002 2003 2004 2005 2006 2007 2008 2009 2010 2011<br />
Source: Ecosystem Marketplace.<br />
<strong>State</strong> <strong>of</strong> <strong>Waters</strong>hed <strong>Payments</strong> 2012 | 57
Table 16: Active Water Quality Trading Programs, North America<br />
58 | <strong>Charting</strong> <strong>New</strong> <strong>Waters</strong><br />
Program <strong>State</strong> Actors 2011 Trades Trades to Date<br />
Bear Creek CO PS-PS/NPS 82 lbs phosphorus -<br />
Chatfield Reservoir CO PS-PS/NPS 71 lbs phosphorus -<br />
Southern Minnesota Beet Sugar Cooperative MN PS-NPS 15,717 lbs phosphorus 69,066 lbs phosphorus<br />
Conservation Marketplace <strong>of</strong> Minnesota MN<br />
Municipality-NPS<br />
4076 lbs nitrogen 4,076 lbs nitrogen<br />
North Carolina <strong>State</strong> Nutrient Offset Program NC PS/NPS-NPS 21,891.6 lbs nitrogen 1,438,012 lbs nitrogen<br />
Pennsylvania Chesapeake Bay Nutrient Trading<br />
Program<br />
1,121 lbs phosphorus 4,920 lbs phosphorus<br />
PA PS-PS/NPS 61,859 lbs nitrogen 82,859 lbs nitrogen<br />
700 lbs phosphorus 700 lbs phosphorus<br />
Virginia Nutrient Credit Exchange Program VA PS-PS/NPS 246,309 lbs nitrogen 246,309 lbs nitrogen<br />
79,128 lbs phosphorus 79,128 lbs phosphorus<br />
Clean Water Services OR PS-NPS 295 million kCal/day 295 million kCal/day<br />
Willamette Ecosystem Marketplace OR PS-NPS 3.745 million kCal/day 3.745 million kCal/day<br />
Neuse River Compliance Association NC PS-PS 9,000 lbs nitrogen 1,670,000 lbs nitrogen<br />
- 6,000 lbs phosphorus<br />
Alpine Cheese Company/ Sugar Creek OH PS-NPS - 16,743 lbs phosphorus<br />
South Nation Total Phosphorus Management<br />
Program<br />
Minnesota River Basin Phosphorus Trading<br />
Permit<br />
Connecticut Nitrogen Credit Exchange Program<br />
ON PS-NPS 0 12,144 lbs phosphorus<br />
MN PS-PS - 10,955 lbs phosphorus<br />
CT PS-PS - 9,032,133 lbs nitrogen<br />
Tar-Pamlico Basin Association NC PS-PS/NPS 0 64,000 lbs nitrogen<br />
Delaware Inland Bays DE PS-NPS - -<br />
Dillon Reservoir Water Quality Management<br />
Program<br />
Great Miami River <strong>Waters</strong>hed Water Quality<br />
Credit Trading Program<br />
CO PS-PS/NPS - -<br />
OH PS-NPS - -<br />
Las Vegas Wash NV PS-PS - -<br />
Maryland Nutrient Trading MD - -<br />
Piasa Creek IL PS-NPS - -<br />
Rahr Malting Co MN PS-NPS - -<br />
Red Cedar River WI PS-NPS - -<br />
Blanks fields indicate unavailable data.<br />
96,819 lbs phosphorus 199,656 lbs phosphorus<br />
343,136 lbs nitrogen 12,537,389 lbs nitrogen<br />
298.745 million kCal/day 3.745 million kCal/day
Table 17: Tracking Water Quality Trading 2008-2011,<br />
North America<br />
2008 2011<br />
Number <strong>of</strong> active programs: 12 23<br />
Number <strong>of</strong> programs responding to<br />
our survey<br />
9 17<br />
Programs trading nitrogen credits 3 9<br />
Programs trading phosphorus credits 9 15<br />
Programs trading temperature credits 1 2<br />
Annual dollars transacted $10.7 million $7.7 million<br />
Total dollars transacted to date $52 million $94 million<br />
Total lbs N reduction that year 7,623,937 343,136*<br />
Total lbs P that year 124,145 96,819<br />
Total lbs N reduction to date 42,261,620 n/a<br />
Total lbs P reduction to date 331,139 n/a<br />
*This low number is largely due to nitrogen trading data for the Connecticut Nitrogen<br />
Exchange being unavailable for 2011.<br />
Figure 35: Buyers by Sector, Water Quality Trading<br />
Figure 35. in North America<br />
33%<br />
8%<br />
3% 3%<br />
6%<br />
3%<br />
44%<br />
<strong>State</strong><br />
County<br />
Municipal<br />
Private<br />
Civil/NGO<br />
Other government: Water and<br />
Sanitation District<br />
Federal<br />
A fall in the total value <strong>of</strong> payments may also mean<br />
that programs are becoming more efficient. Point<br />
sources are low-hanging fruit from the perspective<br />
<strong>of</strong> regulators, but nonpoint source pollution control<br />
is generally a bigger part <strong>of</strong> the problem and in some<br />
cases is cheaper to address – the difficulty is in enticing<br />
nonpoint sources to voluntarily participate in markets.<br />
In the Chesapeake, there is a concerted effort to engage<br />
farmers and other non-point sources. In Virginia,<br />
for example, point-to-point trading is allowed for existing<br />
facilities, but for any new point source pollution,<br />
nutrient reduction <strong>of</strong>fsets must come from non-point<br />
sources implementing best management practices.<br />
Where reductions are achieved through nonpoint interventions,<br />
costs also generally taper as the program<br />
matures. Upfront costs <strong>of</strong> agricultural best management<br />
practices are usually the biggest expense; annual<br />
maintenance payments thereafter tend to be<br />
fairly low. The Alpine Cheese Company has seen its<br />
costs fall significantly in recent years to about $2/lb for<br />
phosphorus, now that only annual management payments<br />
to farmers are required.<br />
Figure 36: Sellers by Sector, Water Quality Trading<br />
in North America<br />
3% 3% 3% 3%<br />
Source: Ecosystem Marketplace. Source: Ecosystem Marketplace.<br />
Credit Prices<br />
Information on credit prices remains difficult to obtain, particularly where transactions are direct contracts between private parties.<br />
Credit prices can be influenced by any number <strong>of</strong> factors: by the cost <strong>of</strong> intervention in both real terms and relative to alternative<br />
interventions or land uses, transaction costs, presence <strong>of</strong> subsidies on the seller side or grant funds on the buyer side, trading ratios,<br />
and crediting period. That last refers to how long credits are “good” for: some programs trade credits on an annual basis (“term” credits),<br />
while in other cases one payment will cover reductions for a period <strong>of</strong> years (“perpetual” credits). In the Neuse River program in<br />
North Carolina, which allows for both, annual credit prices are in the range <strong>of</strong> $4-$9 per lb, or $490 per lb for a permanent sale.<br />
Bundling Multiple Co-Benefits<br />
Several programs note that multiple co-benefits were bundled in their credits. The riparian restoration that cools streams to generate<br />
temperature credits for Clean Water Services and the Willamette Partnership also supports biodiversity by providing critical habitat.<br />
61%<br />
27%<br />
<strong>State</strong><br />
County<br />
Municipal<br />
Private<br />
Civil/NGO<br />
Other government: Water and<br />
Sanitation District<br />
<strong>State</strong> <strong>of</strong> <strong>Waters</strong>hed <strong>Payments</strong> 2012 | 59
The Willamette Partnership has developed protocols to allow landowners to generate multiple credit types – currently temperature,<br />
wetlands, salmonid habitat, and upland prairie habitat – on their properties, though the credits cannot overlap spatially. Bear Creek<br />
and the Pennsylvania Chesapeake Bay Nutrient Trading Program also reported that their nutrient credits support biodiversity and<br />
landscape beauty.<br />
Water right transaction<br />
Stormwater management<br />
Restoration<br />
Protection<br />
Operational management*<br />
Agricultural management<br />
Outlook - Water Quality Trading<br />
Water quality trading in the US continues to spread, with project developers exploring new applications. A slow 2011 appears to have<br />
been spent laying the groundwork in many places for a bounce in trading activity in 2012.<br />
<strong>New</strong> Areas <strong>of</strong> Growth<br />
In the Ohio River Basin, a nitrogen and phosphorus trading program is in development led by the Electric Power Research Institute<br />
(EPRI) that could potentially span eight states; it would be the first interstate trading effort operating under a single trade plan, and the<br />
largest program <strong>of</strong> its kind. A pilot phase will take place in Indiana, Kentucky, and Ohio from 2012-2014 with trades planned between<br />
three large power plants and agricultural producers. The pilot is expected to deliver 45,000 lbs <strong>of</strong> nitrogen reduction and 15,000 lbs<br />
<strong>of</strong> phosphorus reduction each year. At scale, thousands <strong>of</strong> point-source buyers and more than 200,000 farmers could be involved.<br />
We’re also intrigued by the rise <strong>of</strong> for-pr<strong>of</strong>it nutrient banks in Virginia, driven by Chesapeake TMDL requirements. Whereas 2011 saw<br />
three banks and one transaction in the state, 2012 looks to have been a boom year for the industry, with the number <strong>of</strong> established<br />
and proposed banks quadrupling and thirty transactions taking place. 18 Unlike the VA Nutrient Exchange, these banks are marketing<br />
nonpoint-generated perpetual credits. Potential buyers include groups like the state Department <strong>of</strong> Transportation and the US military.<br />
Temperature trading is turning up across Oregon, with five new proposed programs identified. Two are entering their pilot phases. In the<br />
Rogue River basin, projects generating 14.52million kCals/day in credits for the City <strong>of</strong> Medford and the US <strong>Forest</strong> Service will begin in<br />
2012. And in the Klamath basin, the Klamath Tracking and Accounting Program has begun a three-year pilot period. Both are working<br />
closely with the Willamette Partnership to share crediting protocols and other market infrastructure wherever possible.<br />
2011 also saw Wisconsin developing an adaptive management policy allowing point-source facilities to pay farmers and other nonpointsource<br />
landowners for phosphorus reductions. The program is driven by numeric nutrient standards for water bodies – rather than pollution<br />
caps set for individual NPDES permit holders. The <strong>Waters</strong>hed Adaptive Management Option also differs from water quality trading<br />
in that there are no trading ratios (which require buyers to purchase some greater ratio <strong>of</strong> credits than needed to provide a buffer against<br />
reductions not being achieved).<br />
Finally, two other interesting water quality trading programs in development should be noted, in California’s Sacramento River-San Joaquin<br />
Delta system and in Washington DC. Limited information is available about the Delta program, but a methylmercury <strong>of</strong>fset program<br />
has been proposed there as part <strong>of</strong> the Delta Mercury Control Program. The larger context for water quality improvement efforts is the<br />
Sacramento River-San Joaquin Delta’s Water Quality Control Plan that establishes a Total Maximum Daily Load for methylmercury. In<br />
Washington DC, a stormwater trading program is under study as a way to cost-effectively meet upcoming Municipal Separate Storm<br />
Sewer System (MS4) permit obligations by allowing regulated sites to fund <strong>of</strong>f-site retention projects.<br />
18 Pers. Communication, Brent Fults, Chesapeake Bay Nutrient Land Trust. November 13, 2012.<br />
60 | <strong>Charting</strong> <strong>New</strong> <strong>Waters</strong><br />
Figure 37: Management Interventions Used to Generate Water Quality Credits, North America<br />
Figure 37.<br />
0 2 4 6 8 10 12 14<br />
Number <strong>of</strong> programs<br />
*Operational management refers to technological upgrades at point source facilities. Note that many programs employ more than one type<br />
<strong>of</strong> intervention to generate credits.<br />
Source: Ecosystem Marketplace.
(a)<br />
Market Infrastructure<br />
Map 8: 2011 Average Credit Prices by <strong>State</strong>, United <strong>State</strong>s<br />
(b)<br />
(a) OR: Clean Water Services: $0.05/kCal/day<br />
(b) CO: Bear Creek: $5000/lb P<br />
(c) MN: Southern Minnesota Beet Sugar Cooperative: $4.00/acre P<br />
(d) OH: Alpine Cheese Company: $2.00/lb P<br />
(e) OH: Great Miami River: $1.52/lb N/P<br />
(f) CT: Connecticut Nitrogen Exchange: $5.42/lb N<br />
(g) PA: Pennsylvania Chesapeake Bay Nutrient Auctions: $3.10/lb N<br />
(spot); $2.90/lb N (forward); $4.73/lb P (spot)<br />
(c)<br />
Some clear leaders in tools and infrastructure are beginning to emerge. As mentioned above, the Willamette Partnership has put considerable<br />
effort into developing market infrastructure that can be adapted to work in other basins. NutrientNet is a crediting tool and<br />
marketplace developed by the World Resources Institute that aims to provide a single platform for Chesapeake Bay states (Maryland,<br />
Pennsylvania, and West Virginia). It uses the US Department <strong>of</strong> Agriculture-developed Nutrient Tracking Tool (formerly known as the<br />
Nutrient Trading Tool), an interface that allows agricultural producers to calculate nutrient credits generated by different management<br />
practices. The Nutrient Tracking Tool has also been adapted for use in a number <strong>of</strong> other markets, including the upcoming Ohio River<br />
Basin trading program. Private-sector companies are also stepping up to support trading: the Markit platform, for example, is used by<br />
PENNVEST to host its regular nutrient credit auctions and by the Willamette Partnership as a credit registry.<br />
The US Department <strong>of</strong> Agriculture Office <strong>of</strong> Environmental Markets (OEM), created in response to section 2709 <strong>of</strong> the 2008 Farm Bill,<br />
has also been focused on tool and protocol development recently. OEM is working with the Natural Resources Conservation Service, the<br />
Texas Institute for Applied Environmental Research, and other partners to improve the Nutrient Tracking Tool. OEM also aims to develop<br />
consistent policy relevant to ecosystem services across the US Department <strong>of</strong> Agriculture. A particular focus has been the Chesapeake Bay<br />
and outreach to agricultural producers and landowners to voluntarily help achieve the TMDL.<br />
(d,e)<br />
(f)<br />
(h)<br />
(i,j,k,l,m)<br />
(h) VA: Cranston’s Mill Pond Nutrient Bank: $19,000/lb (perpetual)<br />
(i) NC: Jordan Lake: $20.29/lb N; $147.23/lb P<br />
(j) NC: Neuse River-Falls Lake: $20.29/lb N; $147.23/lb P<br />
(k) NC: Tar-Pamlico: $18.92/lb N; $147.23/lb P<br />
(l) NC: Neuse River (EEP): $13.16/lb N<br />
(m) NC: Neuse River (Compliance Association trading): $6.50/lb N<br />
(term); $490/lb N (perpetual)<br />
Source: Ecosystem Marketplace.<br />
<strong>State</strong> <strong>of</strong> <strong>Waters</strong>hed <strong>Payments</strong> 2012 | 61<br />
(g)
A major boost for water quality trading in the US came in 2012, when the US Department <strong>of</strong> Agriculture awarded $6.5 million in Conservation<br />
Innovation Grants to support the development <strong>of</strong> twelve water quality trading markets around the country. Five <strong>of</strong> the grants focused<br />
on supporting trading in the Chesapeake Bay, while the largest grant at $1.6 million went to the Willamette Partnership to develop<br />
guidance on cross-border water-quality trading in the Pacific Northwest.<br />
Transaction Activity - Environmental Water Markets: Instream Buybacks<br />
and Water Quantity Offsets<br />
The third broad category <strong>of</strong> programs tracked in North America is environmental water markets. These include both groundwater <strong>of</strong>fsets<br />
and instream buybacks, wherein water rights are appropriated for non-consumptive use. That is, rather than exercising the right to<br />
divert water from a stream or river, under an instream buyback the holder simply leaves the water instream. Water rights can be leased,<br />
purchased, or donated to an entity that holds them – <strong>of</strong>ten a state agency or a water trust. Rights are generally acquired from individual<br />
holders or large entities like the Federal Bureau <strong>of</strong> Reclamation.<br />
In this report, we only track water rights purchases and leases that are for instream use – that is, we do not here attempt to assess the size<br />
<strong>of</strong> the entire Western water rights market, where rights can also be traded for agricultural or urban use.<br />
A second sub-category are groundwater mitigation programs, which require that new wells or pumping be <strong>of</strong>fset to protect a basin’s<br />
groundwater supplies. Offsets can be purchased from established groundwater banks, which, depending on hydrological relationships,<br />
may convert surface water rights to groundwater use.<br />
Programs like these are growing in scale and prominence in the US West, where the paper right to divert water can be legally separated<br />
from land ownership and traded. In the last few decades, states in the region have begun to legally recognize instream use as a “beneficial<br />
use” and allow the conversion <strong>of</strong> consumptive (such as for irrigation or municipal drinking supplies) to non-consumptive use. Rights may<br />
be permanently acquired or leased. Leasing is <strong>of</strong>ten a popular option for water rights holders unwilling to part with their right altogether.<br />
Given the region’s “use it or lose it” approach to water use, leasing also allows the owner to retain their legal claim during periods when<br />
they may not need to exercise it. And since timing <strong>of</strong> flows is as important as the presence <strong>of</strong> flows themselves, leasing allows the payer<br />
to ensure that water is available at important times, such as during the dry summer and fall months.<br />
Environmental water acquisition and leasing support natural flow regimes in rivers and streams, which are critical for supporting aquatic<br />
and riparian habitats – thus by definition, these programs “bundle” hydrological and biodiversity values. Instream flow augmentation<br />
also benefits scenic and recreational values. From a hydropower perspective, adequate flows are also necessary for power generation.<br />
Environmental Water Markets in Action<br />
Our study found 25 programs active in 2011, including state programs in Oregon, Washington, Montana, Colorado, Idaho, and Wyoming.<br />
Transaction activity was also driven by non-pr<strong>of</strong>it groups effectively acting as buyers for the public good, acquiring rights and either holding<br />
them or donating them to state programs. Other buyers included the Federal Bureau <strong>of</strong> Reclamation and a hydroelectric facility driven<br />
by Endangered Species Act requirements and mitigation requirements for hydroelectric license renewal, respectively. Altogether these<br />
programs funded $22 million in instream buybacks in 2011, representing at least 9643 acre-feet (AF) returned to western rivers. 19 Since<br />
1986, transactions add up to at least $227 million, or 2.8 million AF.<br />
It should be stressed that these figures are conservative ones, and actual transactions are probably higher. Scarborough (2010) estimates<br />
that transactions between1987 and 2007 exceeded $500 million, adjusted for inflation. Water markets in the region <strong>of</strong>ten lack transparency<br />
to an extreme degree due to high transaction costs, disconnects between paper claims and actual historical use, and lack <strong>of</strong> centralized<br />
information about prices and trading. In that spirit, this section should be considered only an initial attempt at tracking environmental<br />
water markets. Our data comes mostly from personal interviews and survey responses, and also rests heavily on the Columbia Basin<br />
Water Transactions Program (CBWTP)’s public database. 20 On a final note, since rights are <strong>of</strong>ten acquired by non-pr<strong>of</strong>it groups and then<br />
donated to state trust programs, and our study engaged both, we have been wary <strong>of</strong> double-counting transactions and have tried to err<br />
on the side <strong>of</strong> conservatism in our aggregate numbers.<br />
19 An acre-foot is the quantity <strong>of</strong> water required to inundate an acre <strong>of</strong> land a foot deep, or about 1.2 megaliters. Note that some programs use<br />
cubic feet per second (cfs). Cfs measures volume over time and so isn’t strictly comparable to acre-feet, a static measure more commonly used for<br />
water that is impounded, such as behind a reservoir. We have not attempted to convert between the two and simply report both. One acre-foot<br />
produces roughly 0.5 cfs per day.<br />
20 http://www.cbwtp.org<br />
62 | <strong>Charting</strong> <strong>New</strong> <strong>Waters</strong>
$1,369,812<br />
8,280,141<br />
$186,747,204<br />
> $50 Million<br />
> $10 Million<br />
> $1 Million<br />
< $1 Million<br />
Data Unavailable<br />
$1,155,686<br />
$188,200<br />
$130,500<br />
The majority <strong>of</strong> instream buybacks take place on a voluntary basis, with state agencies or non-pr<strong>of</strong>it groups funding activities essentially<br />
as a public good provider, and water rights holders voluntarily selling or leasing their claims. One example <strong>of</strong> a polluter paying for instream<br />
mitigation was found in Oregon, where Portland General Electric and the Confederated Tribes <strong>of</strong> the Warm Springs Reservation, coowners<br />
<strong>of</strong> the Pelton Round Butte hydroelectric facility, have established the Pelton Round Butte Water Rights Fund to acquire or lease<br />
instream water rights or participate in water conservation projects that benefit aquatic habitat, as required under the terms <strong>of</strong> a 2005<br />
hydroelectric license renewal. In Idaho, the federal Bureau <strong>of</strong> Reclamation has acquired natural flow rights in the Snake River Basin in<br />
order to stay on the right side <strong>of</strong> the Endangered Species Act, based on biological opinions from the National Oceanic and Atmospheric<br />
Administration Fisheries. Finally, in California’s Central Valley Region, the Central Valley Improvement Project since 1992 has been required<br />
by the US Congress to restore critical fish and wildlife habitat. Water acquisition efforts to meet that mandate are a joint effort<br />
between the US Bureau <strong>of</strong> Reclamation and the US Fish & Wildlife Service.<br />
Most states have a dedicated body for instream flow rights purchases and leasing (see Table 19). In practice, these take very different<br />
forms, as legal frameworks for water rights vary from state to state. Beyond different policies on who can legally hold rights for instream<br />
use, varying levels <strong>of</strong> public support and funding, and the presence <strong>of</strong> drivers like imperiled species concerns leave us with a range <strong>of</strong><br />
models and activity levels across the West. Where instream buyback programs are present, there is usually a very motivated conservation<br />
group or state agency standing behind them. But on the other hand, regional variation has led to innovation, and in some cases<br />
cross-fertilization; Montana’s Trout Unlimited chapter, for example, is currently exploring whether Washington’s groundwater mitigation<br />
banking model might work in their own state (Bates, 2009).<br />
Emerging Models for <strong>Waters</strong>hed Protection<br />
Map 9: Instream Buybacks in 2011 by <strong>State</strong>, United <strong>State</strong>s<br />
Source: Ecosystem Marketplace.<br />
Beyond state efforts, non-pr<strong>of</strong>it groups are becoming the dominant actor in funding instream flow restoration in the US West. We tracked<br />
eleven different programs in operation responsible for at least $3.8 million in payments in 2011, concentrated in the Pacific Northwest.<br />
Groups like Oregon’s Deschutes River Conservancy, Freshwater Trust, and Klamath Basin Rangeland Transactions Program, Trout Unlimited’s<br />
Washington and Montana Water Projects, Montana’s Clark Fork Coalition, and the Colorado Water Trust have returned at<br />
least 282,000 acre-feet to streams in the region since 1995. Conservation groups also commonly act as an initiator and facilitator for<br />
contracts between private rights holders and state programs. These groups are <strong>of</strong>ten able to leverage their own funds with other financing<br />
sources including cost-share arrangements with the Columbia Basin Water Transactions Program (which is funded largely by the<br />
Bonneville Power Administration and is a major source <strong>of</strong> funding for IFT in the West), mitigation funds, state support, and landowners<br />
themselves.<br />
<strong>State</strong> <strong>of</strong> <strong>Waters</strong>hed <strong>Payments</strong> 2012 | 63
Table 18: <strong>State</strong> Instream Acquisition/Leasing Programs Active in 2011, United <strong>State</strong>s<br />
<strong>State</strong> Framework<br />
Colorado The Colorado Water Conservation Board (CWCB)'s Instream Flow Program acquires and holds water rights<br />
designated for instream non-consumptive use to protect fisheries, riparian zones, and critical wildlife habitat.<br />
Rights are acquired through appropriation and through voluntary leases, loans, sales, and donations.<br />
Rights are also <strong>of</strong>ten <strong>of</strong>fered voluntarily to the Board, as it is the only entity in the state that can legally hold<br />
instream flow rights. Voluntary donations are eligible for a tax credit <strong>of</strong> up to 50 percent. Private landowners,<br />
municipalities, the Colorado Water Trust, and the Nature Conservancy have all donated rights to the CWCB<br />
in the past.<br />
Idaho Idaho's Water Resource Board operates a Water Supply Bank and a number <strong>of</strong> rental pools to facilitate the<br />
marketing <strong>of</strong> water rights for instream flows and water storage in reservoirs. The "Board's bank" manages<br />
natural flow rights and privately held storage. The majority <strong>of</strong> rental contracts are for irrigation purposes,<br />
although a number <strong>of</strong> agreements have been for the purposes <strong>of</strong> restoring instream flows (seven out <strong>of</strong> fifty<br />
contracts in 2010, though volume is unclear). Minimum flow requirements or diversion moratoria in some<br />
areas have driven Water Supply Bank activity around flow restoration. Roughly ten percent <strong>of</strong> transactions<br />
are parties renting out their own leased water, possibly because the Idaho Water Resources Board is the only<br />
entity in the state that can legally hold permanent instream rights.<br />
Montana Montana's Department <strong>of</strong> Fish, Wildlife & Parks leases water rights from rights holders for instream flow protection,<br />
particularly to address seasonal low flows or drought conditions in tributaries <strong>of</strong> rivers critical to fish<br />
spawning habitats. The leasing program is active only in the 40 streams for which FWP is authorized to hold<br />
leases. Leases generally cover water use during the summer and fall seasons e.g. the period <strong>of</strong> lowest flows.<br />
<strong>New</strong> Mexico <strong>New</strong> Mexico's Strategic Water Reserve, operated by the <strong>New</strong> Mexico Interstate Stream Commission, may<br />
acquire and lease water rights to protect species by restoring instream flows and assist the state in complying<br />
with interstate river compacts that govern withdrawals by individual states in a river system.<br />
Oregon The Oregon Water Resources Department coordinates instream transfers and leases, as well as allocations<br />
from conserved water, for flow restoration. Both individual and 'pooled' leases (with groups such as irrigation<br />
districts) are held. More than 1,100 instream leases have been signed as <strong>of</strong> 2009. The Department<br />
works both directly with water right holders (whom it does not pay, but only holds rights in trust) and acts as<br />
trustee for leases initiated by conservation groups.<br />
Washington The Washington Water Acquisition Program is a voluntary program to increase stream flows in watersheds<br />
with vulnerable salmon and trout populations. A state trust holds water rights acquired through direct<br />
purchases, reverse auctions, leases, and donations. The program also works with the state Water Irrigation<br />
Efficiencies Program participants to place conserved water in trust.<br />
Wyoming The Wyoming Game and Fish Department oversees the transfer <strong>of</strong> water rights to instream flow rights.<br />
Activities have largely consisted <strong>of</strong> the state transferring fish hatchery water rights to in-stream use and the<br />
acquisition <strong>of</strong> water in reservoirs. The first transaction with a private rights holder took place in late 2011,<br />
with a landowner agreeing to convert an irrigation right to an instream right in order to protect the unused<br />
right from diversion.<br />
Another intriguing model for attracting private-sector funding is the Bonneville Environmental Foundation (BEF)’s Water Restoration<br />
Certificate project. Every thousand gallons <strong>of</strong> restored flows from BEF restoration projects represents a single ‘Water Restoration<br />
Certificate’ which private buyers can purchase. Past buyers include the National Hockey League and the Big Sky Brewing company;<br />
both used certificates to voluntarily <strong>of</strong>fset their water use impacts. Projects are vetted by the US Fish & Wildlife Foundation and<br />
generally implemented on small farmers’ lands. Monitoring and technical assistance are contributed by local land and water trusts.<br />
Management actions include conservation <strong>of</strong> agricultural water use and riparian restoration projects. To date projects have been<br />
implemented in the Lower Willamette, Middle Rogue, Upper Deschutes, and Upper Missouri watersheds.<br />
Groundwater Mitigation Activity<br />
2011 saw continued development <strong>of</strong> a new mechanism in the Pacific Northwest – groundwater mitigation banks to <strong>of</strong>fset new<br />
groundwater pumping in basins where groundwater has been over-extracted or is under serious pressure. We identified four such<br />
64 | <strong>Charting</strong> <strong>New</strong> <strong>Waters</strong>
anks. Driven by moratoria on new groundwater pumping, major new development (low-volume users are exempt) can <strong>of</strong>fset new<br />
wells by buying mitigation credits from these banks, which in turn undertake streamflow augmentation activities.<br />
Limited information is available to date about these banks’ transaction activities. Under the Walla Walla Exempt Well Mitigation<br />
Program, new developers pay a fee <strong>of</strong> $2,000 for mitigation credits, with three such <strong>of</strong>fsets taking place in 2011. Recent price information<br />
(determined by instream lease prices) is available for the Deschutes River Conservancy’s Groundwater Mitigation Bank, at<br />
$70 per credit or $126 per acre-foot. The Deschutes River Conservancy also administers a separate Water Alliance Water Bank in the<br />
basin. And the Kittitas Water Exchange, a subset <strong>of</strong> the larger state water banking program, reported 95 acre-feet transacted in 2011.<br />
Finally, the Walla Walla Water Bank allows holders to bank instream and groundwater rights, though no actual financial transaction<br />
occurs. “Sellers” can place their water right into a non-use agreement for any amount <strong>of</strong> time, up to the ten years allotted to this pilot<br />
program. The program is voluntary and provides water rights holders a way to preserve their water right for the future without being<br />
subject to state ‘use it or lose it’ policies. Slightly more than 8000 acre-feet have been restored to the basin since 2010 through this<br />
mechanism.<br />
Outlook - Environmental Water Markets: Instream Buybacks and Water<br />
Quantity Offsets<br />
United <strong>State</strong>s<br />
Creating the supporting infrastructure needed for conservation market mechanisms can be a long, expensive process. That’s why environmental<br />
water markets have attracted our interest: using an existing market (for water rights trading) to achieve ecological goals<br />
is a promising way to get quick results and rationalize water allocation in the US West.<br />
Transboundary Markets<br />
The first transboundary instream buyback initiative we’ve seen is under development in the Colorado River, where the Delta Water<br />
Trust, a partnership between the Sonoran Institute, Pronatura Noreste, and the Environmental Defense Fund, aims to raise $2 million<br />
to acquire up to 8,000 acre-feet <strong>of</strong> water rights from Mexican rights holders to restore flows to the Delta. In Mexico, legal barriers and<br />
transaction costs related to rights transfers are lower than in the US.<br />
Quantity-Quality Crossovers<br />
There is also some intriguing initial evidence that flow restoration might be a means to address water quality pollution. Clean Water<br />
Services, for example, has met part <strong>of</strong> their temperature cap via flow augmentation. Similarly, flow restoration in Prickly Pear Creek,<br />
overseen by the Clark Fork Coalition (formerly the Montana Water Trust) has been one part <strong>of</strong> the strategy to meet the Lake Helena<br />
TMDL in Montana. Where possible, environmental water transactions might <strong>of</strong>fer a way to side-step some <strong>of</strong> the difficulties <strong>of</strong> developing<br />
water quality trading programs. However, these arrangements are highly dependent on the receptivity <strong>of</strong> regulators, which<br />
varies from place-to-place (Frey, 2011).<br />
Market Potential<br />
These transactions remain mostly voluntary, relying on non-pr<strong>of</strong>it organizations and state leasing/acquisition programs to act as<br />
public good providers <strong>of</strong> instream flow restoration. Some private companies have stepped up to voluntarily <strong>of</strong>fset their water use,<br />
including the National Hockey League and Big Sky Brewery (through BEF’s Water Restoration Certificates) and the Deschutes Brewery<br />
(through the Deschutes River Conservancy’s leasing program). Greater private participation, both voluntary and for required mitigation,<br />
would help to diversify the funding mix for flow augmentation.<br />
It should be noted that urban demand for drinking water continues to grow, while agricultural producers are increasingly finding that<br />
selling their water rights is much more lucrative than continuing to farm. Where instream flow buyers encounter urban buyers, the<br />
former are not likely to outbid the latter. In other words, environmental water transactions are a very effective tool, but they are not<br />
a panacea for the West’s water problems.<br />
The US also lacks a large guaranteed source <strong>of</strong> demand like Australia’s national water buyback program. Decisions about water law<br />
and allocations are largely left to the states, and it is difficult to imagine that a federal ‘cap’ or buyback initiative would be politically<br />
feasible in the West.<br />
<strong>State</strong> <strong>of</strong> <strong>Waters</strong>hed <strong>Payments</strong> 2012 | 65
Number <strong>of</strong> Programs<br />
4<br />
3<br />
2<br />
1<br />
0<br />
Figure 38: <strong>New</strong> Instream Buybacks and Groundwater Offset Programs by Year and Type, North America<br />
66 | <strong>Charting</strong> <strong>New</strong> <strong>Waters</strong><br />
Source: Ecosystem Marketplace.<br />
Groundwater Offsets<br />
Other buybacks<br />
NGO‐administered buybacks<br />
<strong>State</strong>‐administered buybacks
Oceania<br />
Table 19: Summary Details, Oceania<br />
Number <strong>of</strong> active programs: 5<br />
Number <strong>of</strong> programs in development: 1<br />
Value <strong>of</strong> transactions in 2011: $149.2 million<br />
Value <strong>of</strong> transactions 1992-2011: $1.8 billion<br />
Units <strong>of</strong> pollution reduction / volume <strong>of</strong> instream flow<br />
restoration in 2011:<br />
127,822 megaliters; 49.749 salinity credits<br />
Units <strong>of</strong> pollution reduction / volume <strong>of</strong> instream flow 1,280,600 megaliters; 222,581 lbs nitrogen<br />
restoration 1992-2011:<br />
reduction<br />
General Status Update<br />
Source: Ecosystem Marketplace.<br />
Australia and <strong>New</strong> Zealand, with a combined population <strong>of</strong> 25 million and GDP <strong>of</strong> $2 trillion, are dwarfed by the European Union (503<br />
million, $17 trillion) and the United <strong>State</strong>s (314 million, $15 trillion). Yet Oceania has emerged as a leader in government support for investments<br />
in watershed services thanks to ambitious programs, innovative design, and national-level policies.<br />
Australia is home to several long-running water quality trading and instream buyback programs, distinguished by both their large scales<br />
and careful program design. Market mechanisms are central to efforts to address two <strong>of</strong> the country’s biggest freshwater concerns: high<br />
levels <strong>of</strong> salinity and over-withdrawal <strong>of</strong> water in the Murray-Darling Basin, a major river basin in southeastern Australia and the country’s<br />
agricultural ‘breadbasket’ (see Box 6).<br />
All four active Australian programs identified target salinity, either by means <strong>of</strong> salinity trading programs (the Hunter River Salinity Trading<br />
Scheme – perhaps the most successful water quality trading program in the world – and the Murray-Darling Basin Salinity Credits Scheme)<br />
or through augmenting instream flows to dilute salt concentrations in water bodies (the Commonwealth’s “Restoring the Balance in the<br />
Murray-Darling Basin” initiative, the largest <strong>of</strong> its kind on the planet, and <strong>New</strong> South Wales’ “Water for the Environment” programs).<br />
Our study also found two programs in <strong>New</strong> Zealand – one active in Lake Taupo and one in development in the Rotorua Lakes catchment –<br />
which both employ a nutrient trading model to control nutrient pollution. In all cases, government has been the initiator, either providing<br />
funding itself or putting the necessary regulatory drivers in place.<br />
Buyers vary by program; in the Murray-Darling Basin Salinity Credits Scheme, states are responsible for managing their respective contributions<br />
to salinity in the basin. In the Hunter River trading program, private point-source dischargers such as power stations and mining<br />
companies can trade to meet their regulatory obligations.<br />
The Lake Taupo program in <strong>New</strong> Zealand extends its nitrogen load limits to non-point sources as well, with trade being driven to date by a<br />
dairy company and the publicly-funded Lake Taupo Protection Trust, which seeks to reduce overall loads by 20 percent over time by purchasing<br />
and retiring nitrogen allowances. These are unique elements; requiring non-point source participation while guaranteeing some<br />
minimum level <strong>of</strong> market activity via the Trust’s purchasing efforts both point to a market that has potential to be both effective and robust.<br />
Instream buybacks are the largest source <strong>of</strong> market activity in the region. Australia’s national government’s massive water rights buyback<br />
program (supported by a similar program at the state level in <strong>New</strong> South Wales) is the biggest <strong>of</strong> its kind in the world, with a budget <strong>of</strong> $3.2<br />
billion over ten years. Here, the government pays for improvement <strong>of</strong> instream supplies, buying water allowances on the open market and<br />
leaving the water in the river system to restore health to the severely-stressed basin. The buybacks – which are not without controversy -<br />
accompany a basin-wide limit (“The Cap”) on diversions, massive investments in irrigation efficiency, and efforts to streamline markets for<br />
water rights trading for consumptive uses like irrigation.<br />
<strong>State</strong> <strong>of</strong> <strong>Waters</strong>hed <strong>Payments</strong> 2012 | 67
Australia has a rich history <strong>of</strong> policy experimentation with market-based instruments to achieve its environmental goals for watershed<br />
health, biodiversity, and carbon sequestration; several programs that include hydrological services among a targeted “bundle” <strong>of</strong><br />
ecosystem services are also detailed later in this chapter.<br />
Box 6: The Murray-Darling Basin, Australia<br />
At more than 106 million hectares, the Murray-Darling system is a large basin that drains fourteen percent <strong>of</strong> the country’s landmass.<br />
It spans parts <strong>of</strong> four states (<strong>New</strong> South Wales, Victoria,<br />
Queensland, and South Australia) and most <strong>of</strong> the Australian<br />
Capital Territory. Any intervention in the basin must consider<br />
impacts at the whole-basin level, and Australia is notable<br />
in that three <strong>of</strong> its five watershed payment programs are<br />
regional in scale and <strong>of</strong>ten require considerable cooperation<br />
between states/territories, the Murray-Darling Basin Authority<br />
(MDBA)(which reports to the Commonwealth Government),<br />
and other governmental bodies.<br />
Years <strong>of</strong> unsustainable extraction <strong>of</strong> water from the Murray-<br />
Darling basin for agriculture and other uses have also contributed<br />
to degradation <strong>of</strong> the Basin’s ecosystems. Over-withdrawal<br />
<strong>of</strong> water means that instream flows are insufficient to<br />
sustain aquatic, riparian, and wetland habitats. Low flows also<br />
aggravate water quality pollution problems: pollutant concentrations<br />
increase as the water available for dilution decreases.<br />
Tasmania<br />
High salinity levels – referring the concentrations <strong>of</strong> dissolved<br />
salts in water or earth – occur when naturally occurring salts<br />
in rocks and sediments are mobilized, <strong>of</strong>ten through human<br />
disturbances such as irrigation and clearing <strong>of</strong> vegetation. Excess salinity leads to reduced agricultural outputs, degraded soil structures,<br />
and harm to native habitats and aquatic species – all <strong>of</strong> which are currently being experienced in the Murray-Darling.<br />
Table 20: Tracking Activity in Oceania, 2008-2011<br />
68 | <strong>Charting</strong> <strong>New</strong> <strong>Waters</strong><br />
Western Australia<br />
Northern<br />
Territory<br />
Murray-Darling River Basin<br />
South<br />
Australia<br />
Queensland<br />
Victoria<br />
<strong>New</strong> South<br />
Wales<br />
Australian<br />
Capial<br />
Terriroty<br />
2008 2011 excluding instream buybacks 2011 including instream buybacks<br />
Programs identified 2 4 6<br />
Annual transactions $167, 149 n/a $149.2 million<br />
Annual volume n/a 49.749 salinity credits 127,822 megaliters; 49.749 salinity credits<br />
Historical transactions $356,175 $727,000 $1.8 billion<br />
Historical volume n/a 222,581 lbs nitrogen reduction<br />
1,280,600 megaliters; 222,581 lbs nitrogen<br />
reduction<br />
2008 data comes from Ecosystem Marketplace’s 2010 <strong>State</strong> <strong>of</strong> <strong>Waters</strong>hed <strong>Payments</strong> report. 2011 figures are presented with<br />
and without instream buybacks, which were not tracked in the 2010 report.
Transaction Activity - Water Quality Trading<br />
Australia<br />
The Murray-Darling Basin Salinity Credits Scheme is a credit and debit mechanism administered under the Basin Salinity Management<br />
Strategy (BSMS), a fifteen-year plan to stabilize salinity levels in the basin, which tracks states’ respective contributions to salinity<br />
in the river system.<br />
Reductions are carried out through long-term land management activities and ‘salt interception’ projects capturing saline flows (to be<br />
disposed <strong>of</strong> usually via evaporation). These actions are tracked as credits on a basin-wide salinity register maintained by the Murray-<br />
Darling Basin Authority BSMS. <strong>New</strong> development is counted as a debit and must be <strong>of</strong>fset. Offsets are based on the estimated economic<br />
value <strong>of</strong> salinity impacts, and require states to either pay for actions within their own borders or invest in joint works, such as<br />
funding salt interception schemes in other areas where projects may be more cost-effective. In 2011, the “A” register posted a total<br />
<strong>of</strong> 49.749 credits, and nearly $8.8 million was invested in salt interception schemes diverting 324,162 tonnes <strong>of</strong> salt from the river<br />
system.<br />
In <strong>New</strong> South Wales, the Hunter River Salinity Trading Scheme is driven by the 1997 Protection <strong>of</strong> the Environment Operations Act,<br />
which establishes a system <strong>of</strong> load-based licensing for dischargers like mining companies or power stations that caps pollution emissions<br />
and links license fees to environmental impacts.<br />
In order to reduce salinity in the river system, which drains the largest coastal catchment in the state, one thousand tradable discharge<br />
credits were initially allocated free <strong>of</strong> charge to license holders, based on a formula that took into account the environmental performance,<br />
salty water by-product, employment and economic output <strong>of</strong> each license holder. A credit allows its holder to discharge in<br />
a river ‘block’ at times <strong>of</strong> high flow, determined by flow levels and ambient salinity. During high flow conditions, discharge limits are<br />
relaxed. Credit holders can invest in technologies to mitigate salinity and sell their extra credits, or buy credits from each other if they<br />
overshoot their allocation.<br />
The program’s design allows unusual flexibility and efficiency in credit allocation – a major factor in the scheme’s success. A 24-hour<br />
online credit exchange allows participants to rapidly take advantage <strong>of</strong> high flow periods. Credits have different lifespans, with 200 expiring<br />
every other year from 2004 - 2012. Two hundred credits, replacing those that expire, are sold at public auction every two years,<br />
allowing new businesses in the basin to buy into the market and existing companies to augment their credit holdings as needed. At<br />
the 2010 auction, average credit price was $1660 (up from $520 at the initial 2004 auction). The Hunter River Salinity Trading Scheme<br />
is fully self-financed; an annual fee paid by participants covers the program’s administrative costs.<br />
For the trading cycle ending in 2010, low rainfall meant that Hunter River flows were insufficient to allow any industries to discharge.<br />
No trades therefore occurred, though results from that year’s credit auction totaled about $320,000. No auction took place in 2011.<br />
Proceeds from auctions to date amount to about $727,000.<br />
<strong>New</strong> Zealand<br />
In the Lake Taupo basin, a nonpoint-to-nonpoint source water quality trading program has been active since 2009. To date the Lake<br />
Taupo Protection Trust and a dairy operation have bought allowances representing nutrient reductions on 19,000 hectares <strong>of</strong> forested<br />
and agricultural lands. Transaction information about the latter, a private contract, is unavailable. The Trust’s purchasing to date<br />
translates into a total <strong>of</strong> 222,581 pounds <strong>of</strong> nitrogen reduction in the catchment. The Trust has paid $300-$400 per kg/ha/year, paid<br />
out over time.<br />
The Lake Taupo basin program is driven by a nitrogen load cap on agricultural producers, including some indigenous farmers, set out<br />
by the public Waikato Regional Council (WRC). The program is unique among water quality trading programs in that all nitrogen pollution<br />
in the catchment – both point-source and nonpoint-source – is subject to the cap. Farmers receive tradable nitrogen allowances<br />
based on impacts during a single year between 2001 and 2005 which landowners themselves select. The WRC also plans to reduce<br />
nutrient pollution by twenty percent via the Lake Taupo Protection Trust’s purchasing nitrogen allowances on the open market, with<br />
an ultimate goal <strong>of</strong> retiring 183 tonnes. The Trust is funded by national, regional and local governments.<br />
<strong>State</strong> <strong>of</strong> <strong>Waters</strong>hed <strong>Payments</strong> 2012 | 69
Table 21: Active and Developing Programs, Oceania<br />
Name Country Status Payer Type Driver<br />
<strong>New</strong> South Wales Water<br />
for the Environment<br />
programs<br />
Restoring the Balance in<br />
the Murray-Darling Basin<br />
Murray-Darling Basin<br />
Salinity Credits Scheme<br />
Hunter River Salinity<br />
Trading Scheme<br />
Lake Taupo Trading<br />
Program<br />
Rotorua Lakes Trading<br />
Program<br />
Transaction Activity - Instream Buybacks<br />
The water allowance buyback program, Restoring the Balance in the Murray-Darling Basin, is a massive effort that uses existing<br />
water rights markets in the basin to dedicate water to instream uses, where increased flows are greatly needed to support aquatic,<br />
wetland, and riparian ecosystems. Over ten years, the Australian government plans to purchase $3.2 billion dollars’ worth <strong>of</strong> water<br />
rights – approximately 2,750 billion liters <strong>of</strong> water each year - in the Murray-Darling Basin. Water entitlements bought by the program<br />
will be returned to the river system and its wetlands. Entitlements are purchased from willing irrigators on the open market through<br />
regular tenders and some ad-hoc purchasing. Rights are held and managed by the Commonwealth Environmental Water Holder.<br />
As <strong>of</strong> 30 April 2011, since the program’s first year <strong>of</strong> operation in 2007-2008 the government has bought $1.7 billion worth <strong>of</strong> water,<br />
representing 977.1 gigalitres. Three new tenders have taken place since for the 2011-2012 year, with $144 million budgeted to purchase<br />
entitlements. Prices per ML <strong>of</strong> water in the 2011 tenders ranged from $734-$1,944.<br />
The policy framework for instream buybacks in Australia is shaped by the Commonwealth Water Act <strong>of</strong> 2007. The Water Act established<br />
the Murray-Darling Basin Authority and instructed it to monitor state and territorial compliance with ‘The Cap’, a policy that<br />
limits diversions from the basin to 1993 levels, or 11,000 GL each year. The MDBA is charged with overseeing a comprehensive Basin<br />
Plan including the Water for the Future initiative, which commits over $12 billion to programs improving irrigation efficiency, purchasing<br />
water allowances to restore instream flows (via the Restoring the Balance in the Murray-Darling program detailed here), and<br />
funding other environmental restoration and infrastructure projects.<br />
The <strong>New</strong> South Wales government’s Water for the Environment programs also restore environmental flows through water license<br />
purchasing and water savings projects. Current initiatives include Riverbank, a government-supported fund (the first <strong>of</strong> its kind in<br />
Australia) that makes environmental water purchases to restore flows and functions in <strong>New</strong> South Wales’ wetlands and river systems;<br />
Water for Rivers which similarly recovers water through water infrastructure investments and water purchases; and the Hawkesbury–<br />
Nepean River Recovery Program, which aims to test market trading in a new area and address flow regulation and nutrient loading<br />
issues below major supply dams in that river system. The program also aims to protect and incorporate into management the cultural<br />
values associated with iconic wetlands in the region by Aboriginal groups. In 2011-2012, 6,822 megaliters (ML) <strong>of</strong> water holdings were<br />
purchased by the NSW government and an estimated $5.6 million transacted.<br />
70 | <strong>Charting</strong> <strong>New</strong> <strong>Waters</strong><br />
Australia Active<br />
Australia Active<br />
Public good<br />
payer<br />
Public good<br />
payer<br />
Government<br />
initiative<br />
Government<br />
initiative<br />
Payment<br />
Type<br />
Cash<br />
Australia Active Polluter pays Mandatory Cash<br />
Australia Active Polluter pays Mandatory Cash<br />
<strong>New</strong><br />
Zealand<br />
<strong>New</strong><br />
Zealand<br />
Active Polluter pays Mandatory Cash<br />
In Development<br />
Polluter pays Mandatory Cash<br />
Co-Benefits<br />
Biodiversity, Carbon<br />
sequestration, Landscape<br />
beauty<br />
Cash Biodiversity
Other Activity<br />
A quasi-water quality trading program can be found in <strong>New</strong> South Wales in the South Creek Bubble Licensing Scheme. This is a ‘bubble<br />
permit’ covering three sewage treatment plants in the South Creek area <strong>of</strong> the Hawkesbury-Nepean River. Under the terms <strong>of</strong> the<br />
agreement with the <strong>New</strong> South Wales Environmental Protection Authority, the three plants face an aggregate cap on phosphorus and<br />
nitrogen, giving them flexibility in how they adjust their individual loads to meet regulatory requirements. No cash actually changes<br />
hands, but cost savings through trading are estimated at over $46 million.<br />
Australia is also home to a number <strong>of</strong> initiatives financing restoration and protection <strong>of</strong> a ‘bundle’ <strong>of</strong> ecosystem services. These programs<br />
do not figure in this report’s statistics given the difficulty <strong>of</strong> parsing watershed services from other targeted services like carbon<br />
sequestration and habitat conservation, but are worth discussing in brief.<br />
The National Action Plan for Salinity and Water Quality National (NAPSWQ) began funding a Market-Based Instruments Pilots Program<br />
in 2003 that provided $10.3 million in funds for two successive rounds <strong>of</strong> pilots, some <strong>of</strong> which remain active in some capacity.<br />
Budget for the program came from the national and state/territorial governments. A number <strong>of</strong> funded projects focused on water<br />
quality issues, particularly salinity and nutrient pollution.<br />
<strong>State</strong> and territorial governments have also provided funding for restoration and conservation using tenders, essentially a reverse<br />
auction where landowners submit competitive bids to receive grants for projects. The EcoTender pilot in Victoria for example has<br />
carried out four demonstration tenders as <strong>of</strong> 2011. Landowner bids that <strong>of</strong>fer the most significant environmental outcomes most<br />
cost-effectively were awarded contracts by the Victoria government’s Department <strong>of</strong> Sustainability and Environment. In the pilot<br />
projects, 72 percent <strong>of</strong> proposals delivered improved watershed functions. Nearly all tenders enhanced multiple environmental services.<br />
Ultimately the pilot has funded $4.6 million worth <strong>of</strong> restoration and protection projects on 1684 hectares. No new tenders<br />
are planned; DSE now supports regional environmental tenders implemented by catchment management authorities or Landcare<br />
Networks. Other Natural Resource Management bodies and catchment authorities have also expressed interest in using tenders and<br />
other market-based instruments to fund restoration and conservation projects.<br />
Reforestation and vegetation management activities under the BSMS to control salinity, while not employing any innovative financing<br />
mechanism, nevertheless reflect a “natural infrastructure” investment approach. Projects in Victoria, for example, have created and<br />
protected native vegetation and forest stands on more than 8,000 hectares to date, in order to enhance groundwater replenishment<br />
and limit salt discharges.<br />
Outlook<br />
A history <strong>of</strong> policy support and relative success with market-based mechanisms in Oceania suggest continued interest in investments<br />
in watershed services in the region, though the overall volume <strong>of</strong> funding may decline as the Australian government buybacks program<br />
for water allowances in the Murray-Darling draws down as planned in 2017-2018.<br />
Programs in the region rely on government backing, either through funding directly or a supportive regulatory framework. That is<br />
both a strength and a weakness; investments in watershed services in Oceania have benefitted from significant public financing and<br />
policy support, but activity may taper <strong>of</strong>f in future years if and when the government steps back from its role as a public good payer.<br />
Commonwealth funding for instream buybacks in the Murray-Darling, for example, has only a ten-year lifespan.<br />
Australia<br />
In Australia, the Basin Plan and cap on diversions also continue to be quite politically contentious, with some state governments and<br />
agricultural interests sharply critical <strong>of</strong> the buybacks’ effect on food production and local agricultural economies, while on the other<br />
hand the South Australian government and environmentalists argue the current goal <strong>of</strong> 2750 GL is inadequate to restore health to the<br />
Basin. <strong>State</strong>s historically have taken a tug-<strong>of</strong>-war approach to water management in the Basin; the Restoring the Balance initiative<br />
represents an attempt toward increased centralization and improved cooperation, though progress has been uneven. At the time <strong>of</strong><br />
this report’s writing, the Basin Plan remains in draft form and subject to revision.<br />
Meanwhile, many catchment authorities and Natural Resource Management bodies have expressed interest in testing incentivebased<br />
mechanisms compensating landowners for good stewardship. These initiatives, which <strong>of</strong>ten target a bundle <strong>of</strong> environmental<br />
services rather than water quality alone, draw on lessons learned from state- and NAPSWQ-funded demonstrations <strong>of</strong> environmental<br />
tenders.<br />
<strong>State</strong> <strong>of</strong> <strong>Waters</strong>hed <strong>Payments</strong> 2012 | 71
<strong>New</strong> Zealand<br />
In <strong>New</strong> Zealand, freshwater management is largely the domain <strong>of</strong> local government. The pollution targets that can drive trading in<br />
a water quality trading program in <strong>New</strong> Zealand are set by regional councils. The central government, however, establishes policy<br />
frameworks guiding regional decisions. The national “Fresh Start for Fresh Water” program in 2011 released a National Water Policy<br />
<strong>State</strong>ment that signaled intent to move as a country toward a “limits-based regime” <strong>of</strong> enforceable quality and quantity limits nationally<br />
(<strong>New</strong> Zealand Government, 2011). These targets would be a useful tool for regional authorities interested in mechanisms like<br />
nutrient trading and instream buybacks.<br />
A nitrogen trading program modeled on the Lake Taupo market is also in development for Lake Rotorua, one <strong>of</strong> thirteen major lakes<br />
in the Bay <strong>of</strong> Plenty region. The lake has significant cultural and tourism values but has steadily degraded as land use around the lake<br />
has intensified in recent decades. The Regional Council (BoPRC) has set water quality targets, upgraded sewerage and stormwater<br />
systems, and addressed harmful land management practices. Still, further intervention is needed to control nitrogen and phosphorus<br />
discharges. A nitrogen trading program is being planned with initial funding expected to come from the BoPRC and several government<br />
ministries and credits generated by private landowners in the catchment.<br />
72 | <strong>Charting</strong> <strong>New</strong> <strong>Waters</strong>
The Global Outlook<br />
<strong>Charting</strong> <strong>New</strong> <strong>Waters</strong> in 2012 and Beyond<br />
We’ve seen watershed payment programs nearly double in number and geographic spread over the past four years. These four years<br />
have also seen government cutbacks, austerity measures, down-sized corporate environmental departments, and unprecedented<br />
economic and political uncertainly, including the largest global recession in recent memory.<br />
Such continued growth in management systems for a natural resource in the midst <strong>of</strong> a major global economic downturn should be<br />
raising eyebrows. Leaders and communities around the world are recognizing water security as a serious problem and taking creative<br />
steps to address it.<br />
This report attempts to capture activity that has taken place over the course <strong>of</strong> a year, 2011, that is already in our past. But in our<br />
research, we’ve also come across new developments, ongoing trends, and future projections. In this section, we summarize the most<br />
important <strong>of</strong> these.<br />
The Good <strong>New</strong>s<br />
Our survey turned up nearly half as many programs in development as those that are active. If history is any guide, some <strong>of</strong> these<br />
may not reach the implementation stage, whether due to policy change, lack <strong>of</strong> demand or supply, low stakeholder engagement, or<br />
– too <strong>of</strong>ten – lack <strong>of</strong> a sustainable financing mechanism once the initial grant or capital funding runs out. But interest in IWS clearly<br />
continues to grow, with countries like Gabon, Ghana, Kyrgyzstan, Malawi, Bulgaria, and Romania in line to implement their first IWS<br />
in 2012 and the coming years.<br />
Key Program <strong>Trends</strong> to Watch for in 2012 and Beyond<br />
China’s embrace <strong>of</strong> “eco-compensation” is an unprecedented use <strong>of</strong> incentives for watershed protection. 91% <strong>of</strong> payments<br />
tracked in 2011 originated in China, and investments in watershed services are expected to grow even more, as eco-compensation<br />
settles into its new role as a key element <strong>of</strong> environmental policy in the most recent Five-Year plan and new land-zoning<br />
framework, a new national ‘eco-compensation’ ordinance, and ramped-up government funding for pilots.<br />
Water funds show no sign <strong>of</strong> slowing down in Latin America. We’ve tracked eight new funds since our 2008 baseline, and<br />
another seven set to launch in 2012 and beyond. A new $27 million dollar partnership between The Nature Conservancy, the<br />
FEMSA Foundation, the Inter-American Development Bank and the Global Environment Facility aims to have 32 funds capitalized<br />
across Latin America by 2015.<br />
Latin American transactions overall are expected to see a jump in 2012. Between new water funds coming online and increased<br />
funding for national programs like Mexico’s PSAH and Ecuador’s Socio Páramo, relatively modest activity in Latin America<br />
appears to have turned the corner in 2012 based on our initial tracking.<br />
Water quality markets in the United <strong>State</strong>s are expected to see a 2012 bounce as well, with an uptick in overall economic<br />
activity and a surge <strong>of</strong> regulatory drivers behind new growth. <strong>New</strong> water quality standards in the Chesapeake Bay watershed<br />
made themselves felt in 2012. Trading is expected to kick <strong>of</strong>f in the near future in the Ohio River Basin, the first interstate water<br />
quality trading program under a single set <strong>of</strong> rules. We’re also tracking the emergence <strong>of</strong> a new player in water quality trading:<br />
private nutrient banks, which are repurposing the wetland banking model for nutrient credits. In Virginia, banks look to have<br />
quadrupled in number in 2012 and been behind a big piece <strong>of</strong> trading activity in the state.<br />
Transboundary programs are slowly emerging. We tracked a developing program in the Danube Basin, as well as a new effort<br />
to restore instream flows in the Colorado River, which flows from the United <strong>State</strong>s into Mexico, with a coalition <strong>of</strong> American<br />
and Mexican NGOs working together to secure instream flow rights.<br />
<strong>State</strong> <strong>of</strong> <strong>Waters</strong>hed <strong>Payments</strong> 2012 | 73
Increased experimentation with stacking and bundling <strong>of</strong> multiple ecosystem services is everywhere. We’ve heard about<br />
streambank credits in Georgia, programs linking with carbon in Indonesia, bundled payments for landscape beauty by tourism<br />
operators in Vietnam, and more. While in 2011 payments still tended to come from ‘inside’ existing programs – that is, from<br />
the same buyers that also paid for watershed services, rather than new sources <strong>of</strong> financing – in 2012 and beyond we expect to<br />
see increased cross-investment between ecosystem markets. We’ve heard about pollinator credits stacking with water quality,<br />
wetland banks pursuing both carbon and nutrient accreditation, water funds linking to international carbon markets, and more.<br />
Climate risk adaptation and mitigation are increasingly cited as a driver <strong>of</strong> watershed investment. Protecting water supplies<br />
from climate change effects like natural disasters, glacier melt, and food insecurity were much more frequently reported as program<br />
drivers than in our last survey, though it’s not always clear how these concerns are translating into management. Better<br />
information about how IWS can increase resilience to climate effects and natural disasters and the cost-effectiveness <strong>of</strong> doing<br />
so will likely strengthen the usefulness <strong>of</strong> IWS mechanisms as a tool for communities in long-term planning. IWS as a risk mitigation<br />
strategy is already being taken up in locales from <strong>New</strong> York City and Denver to Peru and the Philippines.<br />
... and the Bad <strong>New</strong>s<br />
We have seen little movement from the private sector to tackle their water-related risk. Fifty-three programs tracked use<br />
some private sector funding, but these are nearly always regulation-driven and public or NGO-initiated. This trend is echoed in<br />
a recent Deloitte report (CDP Global Water Report) showing that over half <strong>of</strong> responding Global 500 companies report having<br />
experienced water-related challenges, yet are failing to take action to improve water stewardship (except for a few progressive<br />
and clearly exposed businesses, namely certain beverage companies). This speaks to both the need for more private sector<br />
action but also better engagement <strong>of</strong> the private sector by government, better policy and regulatory frameworks, and better<br />
assessment and management tools that can make IWS a workable strategy for water resource management.<br />
In many regions and particularly Africa and Latin America, new or developing programs identified in 2008 no longer existed<br />
by 2011. This seems to be directly linked to initial grant monies running out and programs struggling to stay operative thereafter.<br />
Of course, sometimes an IWS mechanism may simply not be appropriate to a given locale or water resource problem. But<br />
it’s an unwelcome trend nonetheless, and underscores how long-term financing and local ownership are essential.<br />
Survey responses suggest that socio-economic monitoring is relatively rare. Only sixteen cases <strong>of</strong> monitoring these impacts<br />
were reported. In contrast, 126 programs confirmed that environmental monitoring takes place.<br />
The Bottom Line<br />
We hope you’ll come away from this report convinced <strong>of</strong> two things: firstly, that the widespread adoption <strong>of</strong> ecological investment<br />
mechanisms is a key part <strong>of</strong> any strategy for ensuring secure and sustainable water systems – and secondly, that accurate tracking <strong>of</strong><br />
these financing mechanisms and making information about them freely available to decision makers around the world is crucial to<br />
timely and widespread adoption. The latter conviction drives this report and the rest <strong>of</strong> our work at Ecosystem Marketplace.<br />
The global landscape in 2011 looks very different from what we found in 2008 in our first report. Water insecurity has sharpened the<br />
need for scaling up investment in our ecological infrastructure, while patchy global economic growth has underlined to need to do so<br />
cost-effectively.<br />
This report tracks a rich and diverse portfolio <strong>of</strong> programs around the world that have found creative ways to finance safe drinking<br />
water and instream supplies. Models for watershed investment have both multiplied and matured since our last report, and show<br />
great promise in 2012 and beyond.<br />
74 | <strong>Charting</strong> <strong>New</strong> <strong>Waters</strong>
Bibliography<br />
Andeltová, L., & Nzyoka, J. (2012, December 5). Implementation <strong>of</strong> tree-planting field trial in Kenya. Retrieved December 5, 2012, from<br />
Pro-poor Rewards for Environmental Services in Africa (PRESA) Blog: http://presa.worldagr<strong>of</strong>orestry.org/blog/2012/12/05/cost-effectiveness-<strong>of</strong>-conservation-auctions-for-outcome-based-and-action-based-pes/<br />
Anh, L. Q. (2012, March 27). Locals responsible for future <strong>of</strong> forests. Viet Nam <strong>New</strong>s , pp. Retrieved from: http://vietnamnews.vn/Sunday/<br />
Features/222703/locals-responsible-for-future-<strong>of</strong>-forests.html.<br />
Arriagada, R. A., Ferraro, P. J., Sills, E. O., Pattanayak, S. K., & Cordero-Sancho, S. (2012). Do payments for environmental services affect forest<br />
cover? A farm-level evaluation from Costa Rica. Land Economics, 88(2), 382-399.<br />
Asian Development Bank. (2012). Toward an Environmentally Sustainable Future: Country Environmental Analysis <strong>of</strong> the People’s Republic<br />
<strong>of</strong> China. Manila: ADB.<br />
Bateman, I. (2012). Paper for the Ecosystem Markets Task Force – ‘Top 10 opportunities’. Defra. Retrieved from http://www.defra.gov.uk/<br />
ecosystem-markets/files/Briefing-Paper-for-the-EMTF-Pr<strong>of</strong>essor-Ian-Bateman-final.pdf.<br />
Bates, S. (2009). Blueprint for a Ground Water Mitigation Exchange Pilot Project in Montana. Trout Unlimited. Retrieved from http://www.<br />
tu.org/sites/www.tu.org/files/documents/GroundwaterBlueprintSept2009.pdf.<br />
BBC <strong>New</strong>s. (2012, October 22). Lorca earthquake ‘caused by groundwater extraction’. BBC <strong>New</strong>s , pp. Retrieved from http://www.bbc.<br />
co.uk/news/science-environment-20025807.<br />
Calvache, A., Benítez, S., & Ramos, A. (2012). Fondos de Agua: Conservando la Infraestructura Verde. Guía de Diseño, Creación y Operación.<br />
Alianza Latinoamericana de Fondos de Agua. Bogotá: The Nature Conservancy, Fundación FEMSA y Banco Interamericano de Desarrollo.<br />
Carpe Diem West. (2010). User Contribution Programs: Linking Upstream <strong>Waters</strong>hed Health to the Hearts, Minds & Wallets <strong>of</strong> Downstream<br />
Water Users. Carpe Diem West. Retrieved from: http://www.carpediemwest.org/sites/carpediemwest.org/files/UCPReport-<br />
FINALOctober2010_0.pdf.<br />
de Koning, F., Aguinaga, M., Bravo, M., Chiu, M., Lascano, M., Lozada, T., et al. (2011). Bridging the gap between forest conservation and<br />
poverty alleviation: the Ecuadorian Socio Bosque program. Environmental Science & Policy, 14:5 , 531-542.<br />
de Lange, W. J., & van Wilgen, B. W. (2010). An economic assessment <strong>of</strong> the contribution <strong>of</strong> biological control to the management <strong>of</strong> invasive<br />
alien plants and to the protection <strong>of</strong> ecosystem services in South Africa. Biological Invasions, 12:12 , 4113-4124.<br />
Deal, R. L., Cochran, B., & LaRocco, G. (2012). Bundling <strong>of</strong> ecosystem services to increase forestland value and enhance sustainable forest<br />
management. <strong>Forest</strong> Policy and Economics 17, 69–76.<br />
Defrance, P. (2011). Financial compensation for environmental services: the case <strong>of</strong> Evian Natural Mineral Water. EPI Water, WP3 EX-POST<br />
Case studies. Retrieved from:http://www.feem-project.net/epiwater/pages/events/120126/ppt/ses_5_wg2_defrance.pdf.<br />
Duhon, M., Young, J., & Kerr, S. (2011). Nitrogen Trading in Lake Taupo: An Analysis and Evaluation <strong>of</strong> an Innovative Water Management<br />
Strategy. Motu Economic and Public Policy Research. Paper presented at the 2011 NZARES Conference, Nelson, <strong>New</strong> Zealand, 25-26<br />
August 2011. Retrieved from: http://ageconsearch.umn.edu/bitstream/115353/2/Duhon Paper.pdf.<br />
Dunn, H. (2011). <strong>Payments</strong> for Ecosystem Services. Defra Evidence and Analysis Series Paper 4. London: Department for Environment, Food<br />
and Rural Affairs.<br />
Echavarria, M. (2007). When and Where Is a PWS Investment Justified in Biophysical Terms. Quito: Ecodecisión.<br />
Ecosystem Services Working Group. (2011). Ecosystem Services Working Group Final Report. Maryland Department <strong>of</strong> Natural Resources.<br />
Retrieved from: http://www.dnr.state.md.us/dnrnews/pdfs/ESWGFinalReportOct2011.pdf.<br />
Esteban, E., & Albiac, J. (2012). Water nonpoint pollution problems in Europe. Global Water Forum Discussion Paper 1224. Retrieved from<br />
http://www.globalwaterforum.org/2012/07/03/water-nonpoint-pollution-problems-in-europe/.<br />
European Commission. (2012). A Blueprint to Safeguard Europe’s <strong>Waters</strong>. European Commission. Retrieved from http://ec.europa.eu/<br />
environment/water/blueprint/index_en.htm.<br />
<strong>State</strong> <strong>of</strong> <strong>Waters</strong>hed <strong>Payments</strong> 2012 | 75
European Environmental Bureau. (2012). CAP-Reform Must Deliver to Safeguard Europe’s <strong>Waters</strong>! European Environmental Bureau. Retrieved<br />
from http://www.eeb.org/EEB/?LinkServID=19F16CD0-5056-B741-DB8F388CA5F5A5C9&showMeta=0.<br />
Fox, J., Gardner, R. C., & Maki, T. (2011). Stacking Opportunities and Risks in Environmental Credit Markets. Environmental Law Reporter 41,<br />
10121-10125.<br />
Frey, M. (2011). An Artificial Distinction: Addressing water quantity concerns under the Clean Water Act. River Network. Retrieved from<br />
http://www.rivernetwork.org/sites/default/files/finalartificialdistinction.pdf.<br />
Goldman-Benner, R., Benitez, S., Boucher, T., Calvache, A., Daily, G., Kareiva, P., et al. (2012). Goldman-Benner, Rebecca L., et al. “Water<br />
funds and payments for ecosystem services: practice learns from theory and theory can learn from practice. Oryx, 46 , 55-63.<br />
Government <strong>of</strong> Kenya & United Nations Environment Programme. (2012). The Role and Contribution <strong>of</strong> Montane <strong>Forest</strong>s and Related<br />
Ecosystem Services to the Kenyan Economy. Nairobi: United Nations Environment Programme.<br />
Greiber, T., van Ham, C., Jansse, G., & Gaworska, M. (2009). Final report study on the economic value <strong>of</strong> groundwater and biodiversity in<br />
European forests. IUCN.<br />
Herbert, T., Vonada, R., Jenkins, M., Bayon, R., & Frausto, J. (2010). Environmental Funds and <strong>Payments</strong> for Ecosystem Services: RedLAC<br />
Capacity Building Project for Environmental Funds. Rio de Janeiro: Latin America and Caribbean Network <strong>of</strong> Environmental Funds<br />
(RedLAC).<br />
Heyman, J., & Ariely, D. (2004). Effort for payment. A tale <strong>of</strong> two markets. Psychological Science 15:11, 787-793.<br />
Hirsch, F., Clark, D., Vihervaara, P., & Primmer, E. (2011). <strong>Payments</strong> for <strong>Forest</strong>–related Ecosystem Services: What role for a Green Economy?<br />
Background Paper for Workshop: <strong>Payments</strong> for Ecosystem Services: What role for a Green Economy? Concept, Approaches and Case<br />
Studies. Geneva: UNECE/FAO <strong>Forest</strong>ry and Timber Section.<br />
Institute for Natural Resources. (2012). EWEB’s Vision: <strong>Payments</strong> for Ecosystem Services through a Voluntary Incentives Program. Corvallis,<br />
OR: Oregon <strong>State</strong> University.<br />
Japan Ministry <strong>of</strong> Environment. (2010). <strong>Payments</strong> for ecosystem services (PES) - An introduction <strong>of</strong> good practices in Japan. Retrieved February<br />
18, 2011, from Japan Ministry <strong>of</strong> Environment: http://www.biodic.go.jp/biodiversity/shiraberu/policy/pes/en/index.html.<br />
Kenny, A., Elgie, S., Sawyer, D., & Wichtendahl, C. G. (2011). Advancing the Economics <strong>of</strong> Ecosystems and Biodiversity in Canada: A Survey <strong>of</strong><br />
Economic Instruments for the Conservation & Protection <strong>of</strong> Biodiversity. Sustainable Prosperity.<br />
LaRocco, G., & Deal, R. (2011). Giving credit where credit is due: increasing landowner compensation for ecosystem services. Portland OR:<br />
Gen. Tech. Rep. PNW-GTR-842. U.S. Department <strong>of</strong> Agriculture, <strong>Forest</strong> Service, Pacific Northwest Research Station.<br />
Leimona, B., Lusiana, B., Noordwijk, M. V., Ekadinata, A., & Mulyoutami, E. (2011). Reconciling multiple ecological knowledge for rewarding<br />
watershed services in the uplands <strong>of</strong> Indonesia. World Agr<strong>of</strong>orestry Centre.<br />
Lopa, D., & Mwanyoka, I. (2010). Equitable <strong>Payments</strong> for <strong>Waters</strong>hed Services (EPWS) Programme: A Practical Experience in Delivering Conservation<br />
and Poverty Reduction in the Ulugurus, Morogoro, Tanzania. EPWS.<br />
Majanen, T., Friedman, R., & Milder, J. (2011). Innovations in Market-based <strong>Waters</strong>hed Conservation in the United <strong>State</strong>s. EcoAgriculture<br />
Partners. Retrived from: http://ecoagriculture.org/documents/files/doc_362.pdf.<br />
Martin-Ortega, J., Ojea, E., & Roux, C. (2012). Evidence-based understanding <strong>of</strong> <strong>Payments</strong> for Water Ecosystem Services: the Latin American<br />
experience. Submission to the 14th Annual BIOECON Conference Resource Economics, Biodiversity Conservation and Development.<br />
Morris, E. (2010). Nature’s Benefits Messaging Memo. The Nature Conservancy. Retrieved from http://www.conservationgateway.org/<br />
Files/Pages/natures-benefit-messaging.aspx.<br />
Murray-Darling Basin Authority. (2012). Basin Salinity Management Strategy 2010-2011 Summary. Murray-Darling Basin Authority. Retrieved<br />
from: http://www.mdba.gov.au/files/BSMS-Summary-2011-12.pdf.<br />
Mwangi, J., Gathenya, J. M., Namirembe, S., & Mwangi, H. (2012). Institutional and policy requirements for payments for watershed services<br />
in Kenya - a case study <strong>of</strong> Sasumua watershed, Kenya. Nairobi: PRESA policy brief No. 2.<br />
National Ecosystem Assessment. (2011). The UK National Ecosystem Assessment: Synthesis <strong>of</strong> the Key Findings. Cambridge: UNEP-WCMC.<br />
Nestle <strong>Waters</strong>. (2012). A Brand that Works Hand in Hand with its Ecosystem Agrivair, 20 Years On: “Working Together”, Reviewing Experience<br />
and Future Prospects [Press release]. Nestle <strong>Waters</strong>. Retrieved from: http://www.nestle-waters.com/media/featuredstories/<br />
Documents/CP%20agrivairUk.pdf.<br />
<strong>New</strong> Zealand Government. (2011). National Policy <strong>State</strong>ment for Freshwater Management 2011. <strong>New</strong> Zealand Government. Retrieved<br />
from http://www.mfe.govt.nz/publications/rma/nps-freshwater-management-2011/docs/nps- freshwater-mgnt-2011.pdf.<br />
76 | <strong>Charting</strong> <strong>New</strong> <strong>Waters</strong>
Nitrogen Credit Advisory Board. (2011). Report <strong>of</strong> the Nitrogen Credit Advisory Board for Calendar Year 2010 To the Joint Standing Environment<br />
Committee <strong>of</strong> the General Assembly. Connecticut Department <strong>of</strong> Energy and Environmental Protection. Retrieved from http://<br />
www.ct.gov/dep/lib/dep/water/municipal_wastewater/nitrogen_report_2010.pdf.<br />
Ofwat. (2009). Price review 2009. Retrieved December 27, 2012, from Ofwat: http://www.<strong>of</strong>wat.gov.uk/pricereview/pr09faqs.<br />
Olander, & Cooley. (2012). Stacking Ecosystem Services <strong>Payments</strong>: Risks and Solutions. Environmental Law Reporter 42, 10150-10164.<br />
Oregon Sustainability Board. (2010). Senate Bill 513 Ecosystem Services and Markets [prepared for the Oregon Legislative Assembly]. Oregon<br />
Sustainability Board. Retrieved from: http://www.oregon.gov/OWEB/docs/sb513_final_report.pdf.<br />
Pettenella, D., E.Vidale, Gatto, P., & Secco, L. (2012). Paying for water-related forest services: a survey on Italian payment mechanisms.<br />
Journal <strong>of</strong> Biogeosciences and <strong>Forest</strong>ry vol. 5, 210-215.<br />
Porras, I., & Neves, N. (2006). Case Studies: Philippines (<strong>Waters</strong>hed Rehabilitation Fund). Retrieved February 13, 2011, from IIED <strong>Waters</strong>hed<br />
Markets: http://www.watershedmarkets.org/casestudies/Philippines_<strong>Waters</strong>h_Rehab_Fund.html.<br />
PRESA. (2011). Pro-poor Rewards for Environmental Services in Africa 2008-2011. Nairobi: PRESA, World Agr<strong>of</strong>orestry Centre.<br />
Rare Conservation. (n.d.). “Water for Life” Brochure. Retrieved November 13, 2012, from Rare Program for <strong>Waters</strong>hed Protection: Retrieved<br />
from http://www.rareconservation.org/sites/rareconservation.org/files/<strong>Waters</strong>hedProtectionResultsBrochureLR_Final.pdf.<br />
Resource Media. (2012). Ecosystem Services Messaging Needs Assessment and Initial Messaging Recommendations. Resource Media.<br />
Scarborough, B. (2010). Environmental Water Markets: Restoring Streams Through Trade. Bozeman: Property & Environment Research<br />
Center (PERC) Policy Series No. 46.<br />
<strong>State</strong> <strong>of</strong> Virginia Department <strong>of</strong> Environmental Quality. (2012). 2011 Nutrient Trades Report. <strong>State</strong> <strong>of</strong> Virginia Department <strong>of</strong> Environmental<br />
Quality. Retrieved from http://www.deq.state.va.us/Portals/0/DEQ/Water/PollutionDischargeElimination/2011NutrientTradesReport.<br />
pdf.<br />
Stubbs, M. (2012). Agricultural Conservation: A Guide to Programs. Congressional Research Service, 7-5700. Retrieved from http://www.<br />
fas.org/sgp/crs/misc/R40763.pdf.<br />
URS Scott Wilson. (2011). Barriers and opportunities for use <strong>of</strong> payment for ecosystems services. Department for Environment, Food and<br />
Rural Affairs: London.<br />
USAID Indonesia. (2009). Payment for Environmental Services: A Summary <strong>of</strong> ESP Case Studies. USAID Indonesia. Retrieved from: http://<br />
issuu.com/esp-usaid/docs/payment-for-environmental-services_en.<br />
USDA Farm Service Agency. (2010). Conservation Reserve Program ANNUAL SUMMARY AND ENROLLMENT STATISTICS 2010. USDA Farm<br />
Service Agency. Retrieved from: http://www.fsa.usda.gov/Internet/FSA_File/annual2010summary.pdf.<br />
Winrock International. (2011). Payment for <strong>Forest</strong> Environmental Services: A Case Study on Pilot Implementation in Lam Dong Province,<br />
Vietnam 2006-2010. Winrock International. Retrieved from: http://www.winrock.org/fnrm/files/PaymentFor<strong>Forest</strong>EnvironmentalServicesARBCPCaseStudy.pdf.<br />
World Bank. (2007). Cost <strong>of</strong> Pollution in China: Economic Estimates <strong>of</strong> Physical Damages. Washington, DC.: World Bank.<br />
Wunder. (2005). <strong>Payments</strong> for environmental services: Some nuts and bolts. CIFOR Occasional Paper No. 42. Retrived from: http://www.<br />
cifor.org/publications/pdf_files/OccPapers/OP-42.pdf.<br />
Wunder, & Wertz-Kanounnik<strong>of</strong>f. (2009). <strong>Payments</strong> for Ecosystem Services: A <strong>New</strong> Way <strong>of</strong> Conserving Biodiversity in <strong>Forest</strong>s. Journal <strong>of</strong><br />
Sustainable <strong>Forest</strong>ry, 28:3-5, 576-596.<br />
Zhang, Q., & Bennett, M. (2010b). An Eco-Compensation Policy Framework for the People’s Republic <strong>of</strong> China: Challenges and Opportunities.<br />
Manila: ADB.<br />
Zhang, Q., & Bennett, M. (2011). Eco-Compensation for <strong>Waters</strong>hed Services in the People’s Republic <strong>of</strong> China. ADB: Manila.<br />
Zhang, Q., & Bennett, M. (2010). <strong>Payments</strong> for Ecological Services and Eco-Compensation: Practices and Innovations in the People’s Republic<br />
<strong>of</strong> China. Manila: ADB.<br />
<strong>State</strong> <strong>of</strong> <strong>Waters</strong>hed <strong>Payments</strong> 2012 | 77
The Family <strong>of</strong><br />
The <strong>Forest</strong><br />
Family <strong>Trends</strong><br />
<strong>of</strong><br />
Initiatives<br />
<strong>Forest</strong> <strong>Trends</strong> Initiatives<br />
The<br />
The Family <strong>of</strong><br />
The Family<br />
Family<br />
Family <strong>of</strong><br />
<strong>of</strong><br />
<strong>of</strong><br />
<strong>Forest</strong><br />
<strong>Forest</strong> <strong>Trends</strong><br />
<strong>Trends</strong> Initiatives<br />
Initiatives<br />
<strong>Forest</strong> <strong>Trends</strong> Initiatives<br />
Protecting watershed services through markets and<br />
incentives that complement conventional management<br />
Using Using innovative financing financing to to promote promote the the<br />
conservation <strong>of</strong> <strong>of</strong> coastal coastal and and marine marine ecosystem ecosystem services services<br />
Using<br />
A Using global<br />
innovative platform<br />
financing to promote the<br />
for transparent<br />
to to promote<br />
information<br />
the<br />
conservation Using innovative<br />
<strong>of</strong> coastal<br />
financing<br />
and marine<br />
to promote<br />
ecosystem<br />
the<br />
conservation A Using global innovative<br />
services<br />
on ecosystem<br />
<strong>of</strong> platform<br />
<strong>of</strong> coastal<br />
service<br />
and for financing<br />
and transparent to promote<br />
marine<br />
payments marine ecosystem information the<br />
and markets<br />
services<br />
conservation <strong>of</strong> coastal and marine ecosystem services<br />
conservation on ecosystem <strong>of</strong> coastal service and payments marine ecosystem and markets services<br />
<strong>Forest</strong> Trade & Finance<br />
A global A Bringing global platform platform sustainability for for transparent transparent information<br />
to trade and information<br />
information<br />
A financial<br />
on ecosystem service payments and markets<br />
investments on<br />
Bringing global platform for transparent information<br />
on ecosystem ecosystem sustainability for transparent<br />
on ecosystem in the service service<br />
service global payments payments to trade<br />
payments market for and<br />
and information<br />
and<br />
and forest markets<br />
financial<br />
markets<br />
investments on ecosystem in the service global payments market for and forest markets products products<br />
<strong>Forest</strong> Trade & Finance<br />
<strong>Forest</strong><br />
<strong>Forest</strong><br />
<strong>Forest</strong> Trade<br />
Trade<br />
Trade & Finance<br />
Finance<br />
Finance<br />
Bringing Bringing sustainability to trade and financial<br />
investments<br />
Bringing sustainability sustainability<br />
in<br />
sustainability to to<br />
the global market<br />
to trade trade<br />
trade and and<br />
for<br />
and financial<br />
financial<br />
Bringing sustainability to trade and<br />
investments in the global market for forest financial<br />
investments investments products<br />
investments in in<br />
in the the<br />
the global global<br />
global market market<br />
market for for<br />
for forest forest<br />
forest products<br />
investments in the global market for forest products<br />
Building Building capacity capacity for for local local communities and and governments<br />
to to engage engage in in emerging emerging environmental markets markets<br />
Building Building capacity for local communities and governments<br />
Building<br />
capacity capacity<br />
Business to engage<br />
capacity<br />
for for<br />
and Biodiversity in<br />
for<br />
local local<br />
emerging<br />
local<br />
communities communities<br />
communities<br />
and and governments<br />
Offsets environmental Program, and<br />
governments<br />
Building governments<br />
Business<br />
capacity<br />
markets developing,<br />
to to engage in emerging environmental markets<br />
testing to<br />
engage and in emerging environmental markets<br />
and engage<br />
in Biodiversity<br />
for local communities<br />
supporting in<br />
emerging Offsets<br />
emerging<br />
environmental Program,<br />
and governments<br />
best practice environmental<br />
markets developing,<br />
to engage in emerging environmental in biodiversity markets<br />
testing and supporting best practice in biodiversity<br />
markets<br />
<strong>of</strong>fsets <strong>of</strong>fsets<br />
Building Business a and market-based Biodiversity program Offsets to Program, developing,<br />
testing and supporting best practice in<br />
address developing,<br />
Business Building Business and Biodiversity Offsets Program,<br />
biodiversity<br />
developing, water-quality<br />
testing <strong>of</strong>fsets<br />
(nitrogen) and<br />
and a market-based and<br />
testing and supporting<br />
Biodiversity supporting problems in best program Offsets best the practice<br />
Program, to Program, address developing,<br />
practice Chesapeake in<br />
in biodiversity<br />
developing,<br />
water-quality<br />
biodiversity Bay and beyond <strong>of</strong>fsets<br />
testing testing (nitrogen) and and supporting problems supporting best in best the practice Chesapeake practice in in biodiversity Bay and beyond <strong>of</strong>fsets<br />
<strong>of</strong>fsets<br />
Incubator<br />
Building a market-based program to address water-quality<br />
Building<br />
(nitrogen)<br />
a market-based Incubator<br />
(nitrogen) problems in the<br />
program<br />
Chesapeake<br />
to address<br />
Bay<br />
water-quality<br />
(nitrogen) and beyond<br />
(nitrogen) Linking problems<br />
problems local in<br />
in producers the<br />
the Chesapeake<br />
Chesapeake and communities Bay<br />
Bay and<br />
and beyond<br />
(nitrogen) Linking problems local local producers in producers the Chesapeake and communities<br />
Bay and beyond<br />
to to to ecosystem ecosystem service service markets<br />
markets<br />
Incubator<br />
Learn Learn more more about about our our programs programs at at<br />
Learn<br />
Linking www.forest-trends.org<br />
more Incubator about our programs at<br />
Linking www.forest-trends.org<br />
local producers and communities<br />
Linking<br />
to local www.forest-trends.org<br />
ecosystem producers<br />
service and<br />
markets<br />
communities<br />
to ecosystem service markets<br />
to ecosystem service markets<br />
Learn more about our programs at