Department-Owned Facilities ALLIGATOR ALLEY - Florida's Turnpike
Department-Owned Facilities ALLIGATOR ALLEY - Florida's Turnpike
Department-Owned Facilities ALLIGATOR ALLEY - Florida's Turnpike

You also want an ePaper? Increase the reach of your titles
YUMPU automatically turns print PDFs into web optimized ePapers that Google loves.
FY 2011 Annual Report<br />
Florida <strong>Department</strong> of Transportation<br />
EntErprisE toll opErations<br />
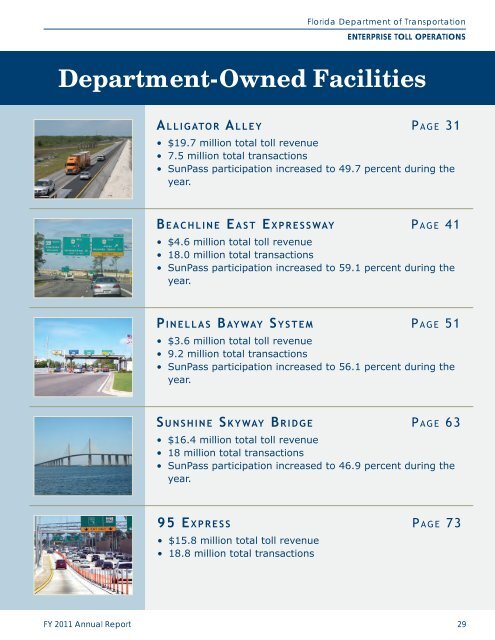
<strong>Department</strong>-<strong>Owned</strong> <strong>Facilities</strong><br />
A l l i g At o r Al l e y P a g e 31<br />
• $19.7 million total toll revenue<br />
• 7.5 million total transactions<br />
• SunPass participation increased to 49.7 percent during the<br />
year.<br />
B e A c h l i n e eA s t ex p r e s s w Ay Pag e 41<br />
• $4.6 million total toll revenue<br />
• 18.0 million total transactions<br />
• SunPass participation increased to 59.1 percent during the<br />
year.<br />
p i n e l l A s BA y w A y sy s t e m Pag e 51<br />
• $3.6 million total toll revenue<br />
• 9.2 million total transactions<br />
• SunPass participation increased to 56.1 percent during the<br />
year.<br />
s u n s h i n e sk y w A y Br i d g e P a g e 63<br />
• $16.4 million total toll revenue<br />
• 18 million total transactions<br />
• SunPass participation increased to 46.9 percent during the<br />
year.<br />
95 ex p r e s s P a g e 73<br />
• $15.8 million total toll revenue<br />
• 18.8 million total transactions<br />
29
Florida <strong>Department</strong> of Transportation<br />
EntErprisE toll opErations<br />
tHis paGE intEntionallY lEFt BlanK<br />
30 Alligator Alley<br />
FY 2011 Annual Report
A l l i g At o r Al l e y<br />
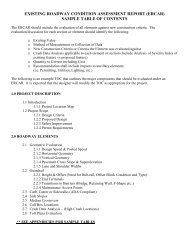
2.1 Background<br />
Alligator Alley (Everglades Parkway in the original<br />
bond documents) was originally constructed as a<br />
two-lane, controlled access, 78-mile toll facility connecting<br />
the southwestern coastal areas of Collier<br />
and Lee Counties (Naples and Fort Myers) to the<br />
southeastern coastal areas of Broward and Miami-<br />
Dade Counties (Fort Lauderdale and Miami).<br />
During the late 1970’s and early 1980’s, the <strong>Department</strong><br />
completed construction of the I-75 corridor on<br />
the west coast between Tampa and Naples. Additionally,<br />
from 1986 to 1992, the <strong>Department</strong> widened<br />
Alligator Alley to four lanes and made it a limited-access,<br />
tolled, interstate facility (I-75) that is part of the<br />
Florida Interstate Highway System (FIHS). The facility<br />
was constructed with a mainline plaza located at<br />
each end of the facility, and two intermediate tollfree<br />
interchanges. The East mainline plaza is located<br />
in Broward County near the US 27 interchange, while<br />
the West mainline plaza is located in Collier County<br />
near the CR 951 interchange. Originally, both mainline<br />
Florida <strong>Department</strong> of Transportation<br />
EntErprisE toll opErations<br />
plazas had six lanes, and collected tolls in both directions.<br />
The two intermediate toll-free interchanges are<br />
located at SR 29, the route to Immokalee; and CR<br />
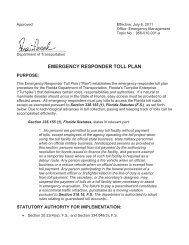
833, serving the Miccosukee Indian Reservation. Figure<br />
2.1 shows a detailed map of the facility.<br />
The original toll configuration (payment made at<br />
the two mainline plazas in both directions) was converted<br />
to the new one-stop toll configuration in May<br />
1999. Under the one-stop toll configuration, a toll is<br />
collected at the West Plaza from vehicles traveling<br />
eastbound. The same toll is collected for the westbound<br />
traffic at the East plaza. With one-stop tolling,<br />
transactions on Alligator Alley decrease, but the<br />
total toll incurred to travel on the facility remains the<br />
same thereby not impacting revenues.<br />
In February 2006, a toll rate increase was imple-<br />
mented for all customers on Alligator Alley. This was<br />
the first toll rate increase since the facility opened<br />
to traffic in 1969. Toll rates for two-axle vehicles<br />
increased from $1.50 to $2.00 for SunPass customers<br />
and to $2.50 for non-SunPass customers. Concurrent<br />
with the toll rate increase, the 10 percent SunPass<br />
discount program was discontinued. The discount<br />
program is explained further in section 2.3.<br />
Alligator Alley annual traffic and toll revenue from<br />
FY 2001 through FY 2011 are presented in table 2.1.<br />
As a result of the FY 2006 toll rate increase, FY 2006<br />
revenues significantly increased by 31.4 percent<br />
while transactions grew by 0.6 percent over FY 2005<br />
levels. Compared to FY 2006, FY 2007 transactions<br />
increased by approximately 0.2 percent, while revenues<br />
increased by 24.1 percent as a result of a full<br />
year of higher tolls from the FY 2006 toll rate increase<br />
(i.e., partial year of toll rate increase in FY 2006). In<br />
FY 2008, transactions and revenue decreased by 5.2<br />
percent and 6.7 percent, respectively, compared to<br />
FY 2007 levels. In FY 2009, traffic and revenue continued<br />
to decrease by 8.4 percent and 11.7 percent,<br />
respectively. This decline in FY 2008 and FY 2009 can<br />
primarily be attributed to the economic recession. In<br />
FY 2011 Annual Report Alligator Alley<br />
31
Florida <strong>Department</strong> of Transportation<br />
EntErprisE toll opErations<br />
Fiscal<br />
Year<br />
Toll<br />
Paying<br />
Non<br />
Revenue Total<br />
Percent<br />
Change<br />
Amount Percent<br />
Change<br />
2001 6,347 20 6,367 - $12,061 - $1.894<br />
2002 6,709 25 6,734 5.8% 12,468 3.4% 1.851<br />
2003 7,132 31 7,163 6.4 13,023 4.5 1.818<br />
2004 7,720 33 7,753 8.2 14,118 8.4 1.821<br />
2005 7,734 567 8,301 7.1 14,437 2.3 1.739<br />
2006 (2)<br />
table 2.1<br />
alligator alley<br />
Historical transactions and revenue Growth<br />
FY 2001 through FY 2011<br />
Transactions (000)<br />
Toll Revenue (1)<br />
($000)<br />
8,095 253 8,348 0.6 18,968 31.4 2.272<br />
2007 8,321 45 8,366 0.2 23,538 24.1 2.814<br />
2008 7,919 14 7,933 (5.2) 21,962 (6.7) 2.768<br />
2009 7,193 76 7,269 (8.4) 19,384 (11.7) 2.667<br />
2010 7,530 24 7,554 3.9 19,962 3.0 2.643<br />
2011 7,449 22 7,471 (1.1) 19,737 (1.1) 2.642<br />
FY 2010, transactions and revenue increased by 3.9<br />
percent and 3.0 percent, respectively, compared to<br />
FY 2009 levels. Compared to FY 2010, FY 2011 transactions<br />
and revenue both decreased by 1.1 percent,<br />
which reflects the continuing uncertainty of the<br />
economic recovery. The economic factors affecting<br />
traffic and revenue are discussed in greater detail in<br />
the overview chapter of this report.<br />
Historical operating and routine maintenance<br />
expenses from FY 2001 through FY 2011 are shown in<br />
table 2.2. Operating expenses have increased from<br />
$2.0 million in FY 2001 to approximately $3.7 million<br />
in FY 2011. This increase represents an annual compounded<br />
growth rate of 6.1 percent. FY 2011 operating<br />
expenses increased by approximately 19.6 percent,<br />
or $605 thousand, from FY 2010 levels primarily<br />
due to an increase in expenses related to credit card<br />
fees, toll plaza operating contracts and FHP costs.<br />
Maintenance of Alligator Alley, along with other<br />
portions of I-75, has been under private contract<br />
since the beginning of FY 2001, with the <strong>Department</strong><br />
providing oversight through its Asset Management<br />
Coordinator. Maintenance activities include rest<br />
Average<br />
Toll<br />
Source: FDOT Office of the Comptroller and <strong>Turnpike</strong> Enterprise Finance Office.<br />
Note: The non-revenue class includes authorized vehicles that pass through a toll plaza without<br />
incurring a toll (i.e., law enforcement, emergency vehicles) and transactions reported during toll<br />
suspensions attributable to hurricanes.<br />
(1) Toll revenue reported net of the SunPass discount from FY 2011 through FY 2006.<br />
(2) A toll rate increase for non-SunPass and SunPass customers was implemented on February 5, 2006.<br />
area preservation, mowing, canal and<br />
cabling system upkeep, litter removal and<br />
repairs due to accidents. Beginning in FY<br />
2008, Road Ranger service was included<br />
under a separate contract through District<br />
4, providing roadside assistance to<br />
stranded motorists as well as roadway<br />
debris removal. In previous years, these<br />
costs were included as part of the Asset<br />
Maintenance Contract.<br />
FY 2011 routine maintenance expenses<br />
increased approximately 3 percent over<br />
FY 2010 levels primarily due to an increase<br />
in toll facility maintenance and safety<br />
costs. In addition to routine maintenance<br />
table 2.2<br />
alligator alley<br />
Historical operating and routine<br />
Maintenance Expenses ($000)<br />
FY 2001 through FY 2011<br />
Operating<br />
Expense<br />
Routine<br />
Maintenance<br />
Expense<br />
Total O&M<br />
Expenses<br />
expenses, renewal and replacement and capital<br />
improvement periodic costs totaling $1.8 million were<br />
incurred primarily for resurfacing and recreational<br />
access improvements.<br />
32 Alligator Alley<br />
FY 2011 Annual Report<br />
Fiscal<br />
Year<br />
2001 $2,034 $2,639 $4,673<br />
2002 2,166 2,534 4,700<br />
2003 2,151 2,923 5,074<br />
2004 2,475 3,197 5,672<br />
2005 2,487 3,049 5,536<br />
2006 2,099 2,796 4,895<br />
2007 2,953 3,192 6,145<br />
2008 3,460 2,089 5,549<br />
2009 3,696 3,265 6,961<br />
2010 3,085 3,262 6,347<br />
2011 3,690 3,369 7,059<br />
Source: FDOT Office of the Comptroller.
Figure 2.1<br />
1<br />
98<br />
Lake<br />
Okeechobee<br />
27<br />
710<br />
29<br />
GLADES<br />
CHARLOTTE<br />
Alligator<br />
Alley<br />
West Palm<br />
Beach<br />
700<br />
78<br />
31<br />
45<br />
80<br />
La Belle<br />
41<br />
80<br />
441<br />
27<br />
Belle<br />
Glade<br />
80<br />
95<br />
441<br />
80<br />
25<br />
98 80<br />
880<br />
HENDRY<br />
Fort Myers<br />
Cape<br />
Coral<br />
832<br />
29<br />
75<br />
PALM BEACH<br />
833 835<br />
82<br />
LEE<br />
Orlando<br />
Tampa<br />
Delray<br />
Beach<br />
Immokalee<br />
41<br />
846<br />
441<br />
Ft. Myers<br />
27<br />
Miami<br />
Alligator Alley<br />
846<br />
887<br />
833<br />
45<br />
A1A<br />
WESTBOUND TOLLS<br />
SunPass Cash<br />
$2.00 $2.50 2 - Axles<br />
$2.00 $2.50 Each Additional Axle<br />
951<br />
31<br />
817<br />
EASTBOUND TOLLS<br />
SunPass Cash<br />
$2.00 $2.50 2 - Axles<br />
$2.00 $2.50 Each Additional Axle<br />
75<br />
886<br />
84<br />
Naples<br />
Fort<br />
Lauderdale<br />
595<br />
EAST<br />
PLAZA<br />
Big Cypress National Preserve<br />
823<br />
WEST<br />
PLAZA<br />
BROWARD<br />
COLLIER<br />
Fakahatchee<br />
Strand<br />
Preserve<br />
State<br />
Park<br />
0 5 10<br />
Miles<br />
75<br />
951<br />
29<br />
27<br />
95<br />
41<br />
A1A<br />
Marco<br />
Island<br />
SOURCE:<br />
Florida <strong>Department</strong><br />
of Transportation 2011;<br />
NAVTEQ 2010<br />
25<br />
Everglades<br />
Miami<br />
Beach<br />
997<br />
Miami<br />
41<br />
Produced by:<br />
URS Corporation<br />
94<br />
MIAMI-DADE<br />
MONROE<br />
STATE OF FLORIDA<br />
ATLANTIC<br />
OCEAN<br />
1<br />
GULF<br />
OF<br />
MEXICO<br />
DEPARTMENT<br />
Biscayne Bay<br />
994<br />
Everglades National Park<br />
OF TRANSPORTATION<br />
Homestead<br />
LEGEND<br />
Toll Plaza<br />
Interchange<br />
Alligator Alley<br />
Interstate Highway<br />
<strong>Turnpike</strong> Facility<br />
Other Tolled Facility<br />
Other Tolled Bridge<br />
Principal Arterial<br />
Minor Arterial<br />
Other Route<br />
County Boundary<br />
STATE OF FLORIDA<br />
DEPARTMENT<br />
OF TRANSPORTATION<br />
dotstphgis/gisprojects/oto_tear_2011/layouts/figure_2_1_alligator_alley.mxd
Florida <strong>Department</strong> of Transportation<br />
EntErprisE toll opErations<br />
2.2 FY 2011 Transactions, Revenues<br />
and Expenses<br />
Monthly transactions and toll revenue on Alligator<br />
Alley during FY 2011 are presented in table 2.3 and<br />
show the East and West mainline plazas, as well as system<br />
totals. Total transactions at the East plaza were<br />
approximately 4.0 million for the year compared to<br />
3.5 million at the West plaza, totaling approximately<br />
7.5 million transactions on the facility for FY 2011. The<br />
corresponding revenues were approximately $10.5<br />
million and $9.2 million at the East and West plazas,<br />
respectively, for a system-wide total of $19.7 million.<br />
The third quarter of FY 2011 (i.e., January through<br />
March) was the peak period for travel on the facility.<br />
Transactions of nearly 2.0 million were realized during<br />
that period.<br />
Transactions on Alligator Alley vary by time of day.<br />
table 2.3<br />
alligator alley<br />
Monthly transactions and toll revenue<br />
FY 2011<br />
Month<br />
East<br />
Plaza<br />
Transactions (000)<br />
West<br />
Plaza<br />
Toll Revenue ($000)<br />
East West<br />
Total Plaza Plaza Total<br />
July 2010 342 299 641 $890 $771 $1,661<br />
August 320 283 603 842 738 1,580<br />
September 275 249 524 738 656 1,394<br />
1st Quarter Total 937 831 1,768 2,470 2,165 4,635<br />
October 313 273 586 833 719 1,552<br />
November 338 297 635 905 796 1,701<br />
December 342 304 646 919 795 1,714<br />
2nd Quarter Total 993 874 1,867 2,657 2,310 4,967<br />
January 2011 337 293 630 903 769 1,672<br />
February 337 298 635 892 781 1,673<br />
March 382 342 724 1,005 896 1,901<br />
3rd Quarter Total 1,056 933 1,989 2,800 2,446 5,246<br />
April 343 303 646 931 799 1,730<br />
May 330 293 623 880 763 1,643<br />
June 306 272 578 808 708 1,516<br />
4th Quarter Total 979 868 1,847 2,619 2,270 4,889<br />
Annual Total 3,965 3,506 7,471 $10,546 $9,191 $19,737<br />
Source: FDOT Office of the Comptroller (Annual Toll Revenue) and <strong>Turnpike</strong> Enterprise Finance Office.<br />
Note: Transactions represent - tollpaying<br />
and non- revenue traffic at mainline plazas.<br />
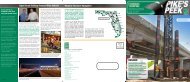
Graph 2.1 shows the number of hourly weekday<br />
and weekend transactions of a typical week at the<br />
mainline plazas during FY 2011. Travel demand on<br />
the facility increases during the early morning hours<br />
and remains relatively high throughout the midday<br />
period, tapering off during the evening hours. For<br />
Alligator Alley, there is no clear morning or evening<br />
peak periods typical of commuter facilities. Instead,<br />
Alligator Alley serves long-distance trips between<br />
the southeastern and southwestern coasts of Florida.<br />
Due to recreational travel, weekend transactions<br />
tend to exceed weekday transactions. Over 1,800<br />
transactions occur between 11:00 a.m. and 12:00<br />
p.m. on weekends.<br />
The monthly transaction variation in FY 2011 is ana-<br />
lyzed in table 2.4. On average, 20,500 vehicles trav-<br />
eled through the East and West toll plazas each day.<br />
The seasonal transaction analysis identifies periods<br />
of the year when traffic exceeds or falls below the<br />
normal pattern observed on the facility under average<br />
conditions. Based on average daily transactions<br />
at the East and West plazas, March was 14 percent<br />
above the average for the facility, while September<br />
was the lowest month at 15 percent below the average.<br />
September is typically the lowest month in south<br />
Florida due to fewer seasonal residents and tourists<br />
at that time of year.<br />
34 Alligator Alley<br />
FY 2011 Annual Report<br />
Transactions<br />
2,400<br />
2,000<br />
1,600<br />
1,200<br />
800<br />
400<br />
0<br />
1:00<br />
AM<br />
3:00<br />
AM<br />
Graph 2.1<br />
alligator alley<br />
typical Hourly transactions<br />
FY 2011<br />
5:00<br />
AM<br />
7:00<br />
AM<br />
9:00<br />
AM<br />
11:00<br />
AM<br />
1:00<br />
PM<br />
Time of Day<br />
3:00<br />
PM<br />
Weekday Weekend<br />
5:00<br />
PM<br />
7:00<br />
PM<br />
9:00<br />
PM<br />
11:00<br />
PM<br />
Source: Data obtained from <strong>Turnpike</strong> Enterprise Finance Office for the 7-day period<br />
beginning Monday, July 19, 2010.
Month<br />
The FY 2011 two-way annual average daily traffic<br />
(AADT) profile for the facility is presented in Figure<br />
2.2. Although East plaza paying-transactions averaged<br />
10,900 per day, total two-way traffic volumes<br />
at the East mainline location averaged approximately<br />
21,700 vehicles per day. Corresponding paying-transaction<br />
volumes at the West plaza averaged<br />
Figure 2.2<br />
Alligator Alley<br />
Two-way AADT Profile<br />
FY 2011<br />
Mile Post - Description SunPass Cash AADT<br />
To Ft.<br />
Lauderdale<br />
25 - East Plaza $2.00 $2.50<br />
21,700<br />
49 - CR 833<br />
80 - SR 29<br />
table 2.4<br />
alligator alley<br />
seasonal transaction Variation<br />
FY 2011<br />
100 - West Plaza $2.00<br />
Average Daily Transactions<br />
East<br />
Plaza<br />
West<br />
Plaza<br />
Passenger Car Toll<br />
2,200<br />
1,000<br />
20,500<br />
2,000<br />
700<br />
$2.50 19,200<br />
N<br />
Total<br />
To Naples<br />
Seasonal<br />
Factor<br />
July 2010 11,000 9,600 20,600 1.00<br />
August 10,300 9,100 19,400 0.95<br />
September 9,200 8,300 17,500 0.85<br />
October 10,100 8,800 18,900 0.92<br />
November 11,300 9,900 21,200 1.03<br />
December 11,000 9,800 20,800 1.01<br />
January 2011 10,900 9,400 20,300 0.99<br />
February 12,000 10,600 22,600 1.10<br />
March 12,300 11,000 23,300 1.14<br />
April 11,400 10,100 21,500 1.05<br />
May 10,600 9,500 20,100 0.98<br />
June 10,200 9,100 19,300 0.94<br />
AADT 10,900 9,600 20,500 1.00<br />
Florida <strong>Department</strong> of Transportation<br />
EntErprisE toll opErations<br />
9,600 per day, with total two-way traffic volumes<br />
totaling 19,200. The East mainline location had<br />
approximately 1,300 more paying-transactions per<br />
day, due to the CR 833 and SR 29 ramps to and from<br />
the east having higher volumes than the respective<br />
ramps to and from the west.<br />
The “N minus 1” method of toll collection was imple-<br />
mented on Alligator Alley concurrent with one-stop<br />
tolling. Currently, truck toll rates are established in<br />
even multiples of the two-axle passenger car toll.<br />
This method results in a more equitable toll structure<br />
for passenger cars relative to trucks. Additionally,<br />
revenue can be reconciled to the treadle and loop<br />
counts for accountability (i.e., it does not rely on<br />
manual classification of various truck types).<br />
Graph 2.2 shows the truck transactions and revenue<br />
contributions for FY 2011. Since Alligator Alley is part<br />
5-axles<br />
5%<br />
4-axles<br />
1%<br />
3-axles<br />
1%<br />
6+-axles<br />
1%<br />
Additional Axles<br />
Graph 2.2<br />
Alligator Alley<br />
Transactions by Axle Class<br />
FY 2011<br />
Revenue Contribution by Axle Class<br />
FY 2011<br />
FY 2011 Annual Report Alligator Alley<br />
23%<br />
92%<br />
77%<br />
Two Axles<br />
Two Axles<br />
35
Florida <strong>Department</strong> of Transportation<br />
EntErprisE toll opErations<br />
of the interstate highway system, the truck percentages<br />
are the greatest of the seven <strong>Department</strong>owned<br />
and <strong>Department</strong>-operated toll facilities.<br />
Trucks accounted for 8 percent of traffic on the facility<br />
and 23 percent of the revenue. In terms of actual<br />
revenue contributions, two-axle vehicles provided<br />
approximately $15.1 million while vehicles with three<br />
or more axles provided $4.6 million in revenue for FY<br />
2011.<br />
The <strong>Department</strong> monitors the cost associated with<br />
the collection of tolls from customers by comparing<br />
the annual operating expense budget for the facility<br />
to the actual performance for the year. table 2.5<br />
provides a comparison between the FY 2011 actual<br />
and budgeted operating and routine maintenance<br />
expenses. Actual operating expenses were 3.7 percent<br />
more than the FY 2011 budget primarily due<br />
to higher costs associated with credit card fees,<br />
toll plaza operating contracts, and FHP costs than<br />
table 2.5<br />
alligator alley<br />
operating and routine Maintenance<br />
Expenses ($000)<br />
FY 2011<br />
Type of Expense Budget Actual<br />
what was originally budgeted. Actual routine maintenance<br />
expenses were approximately 1.5 percent<br />
lower than the FY 2011 budget.<br />
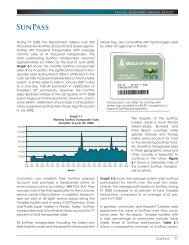
2.3 SunPass<br />
Over/<br />
(Under) Variance<br />
Operating $3,557 $3,690 $133 3.7%<br />
Routine Maintenance 3,422 3,369 (53) (1.5)<br />
Total $6,979 $7,059 $80 1.1%<br />
Source: FDOT Office of the Comptroller, <strong>Turnpike</strong> Enterprise Finance Office and the<br />
FY 2010 Enterprise Toll Operations Traffic Engineer’s Annual Report.<br />
SunPass technology was implemented on Alligator<br />
Alley beginning in October 1999. The project<br />
included the installation of new electronic toll collection<br />
equipment at the East and West plazas and<br />
allows for future installation of SunPass equipment<br />
and conversion to mixed-use or dedicated lanes,<br />
if needed (see appendix a for current lane<br />
configurations).<br />
A SunPass discount program was implemented<br />
concurrently with the deployment of SunPass and<br />
provided a 10 percent retroactive discount. The<br />
discount was offered to drivers of all vehicle classes<br />
when they reached a threshold of 40 monthly toll<br />
payments. Concurrent with the February 2006 toll<br />
rate increase for all customers on Alligator Alley, the<br />
10 percent SunPass discount program was discontinued.<br />
Under the new toll rate structure, SunPass customers<br />
pay less than non-SunPass customers at the<br />
East and West plazas with no minimum transaction<br />
threshold required.<br />
table 2.6 shows transactions by payment method<br />
on Alligator Alley for FY 2011. SunPass accounted for<br />
approximately 50.0 percent of the total transactions<br />
in FY 2011, an increase from the 45.0 percent real-<br />
SunPass<br />
Non-<br />
SunPass<br />
ized in FY 2010. Non-SunPass transactions constituted<br />
the remaining 50.0 percent. Monthly SunPass percentages<br />
ranged from approximately 47 percent<br />
to nearly 55 percent during the year. SunPass participation<br />
on Alligator Alley is lower than most other<br />
36 Alligator Alley<br />
FY 2011 Annual Report<br />
Month<br />
table 2.6<br />
alligator alley<br />
transactions by payment Method<br />
FY 2011<br />
Transactions (000)<br />
Source: <strong>Turnpike</strong> Enterprise Finance Office.<br />
Total<br />
Percent<br />
SunPass<br />
July 2010 315 326 641 49.1%<br />
August 297 306 603 49.3<br />
September 264 260 524 50.4<br />
October 292 294 586 49.8<br />
November 308 327 635 48.5<br />
December 305 341 646 47.2<br />
January 2011 299 331 630 47.5<br />
February 299 336 635 47.1<br />
March 351 373 724 48.5<br />
April 333 313 646 51.5<br />
May 337 286 623 54.1<br />
June 315 263 578 54.5<br />
Total 3,715 3,756 7,471<br />
Percentage 49.7% 50.3% 100.0%
Florida toll facilities due to fewer commuters using<br />
the facility.<br />
table 2.7 shows gross toll revenue by payment<br />
method. Revenue attributable to SunPass was<br />
approximately $9.3 million, representing 47.2 percent<br />
of the total revenue in FY 2011. Non-SunPass<br />
table 2.7<br />
alligator alley<br />
Gross toll revenue by payment Method<br />
FY 2011<br />
Month<br />
Gross Toll Revenue (000)<br />
Non-<br />
SunPass SunPass Total<br />
constituted the remaining 52.8 percent of revenue.<br />
Monthly SunPass revenue percentages ranged from<br />
45 to 51 percent during the year.<br />
2.4 Noteworthy Events<br />
Percent<br />
SunPass<br />
July 2010 $777 $884 $1,661 46.8%<br />
August 746 834 1,580 47.2<br />
September 674 720 1,394 48.4<br />
October 735 817 1,552 47.4<br />
November 790 911 1,701 46.4<br />
December 770 944 1,714 44.9<br />
January 2011 755 917 1,672 45.2<br />
February 749 924 1,673 44.8<br />
March 869 1,032 1,901 45.7<br />
April 839 891 1,730 48.5<br />
May 833 810 1,643 50.7<br />
June 777 739 1,516 51.3<br />
Total $9,314 $10,423 $19,737<br />
Percentage 47.2% 52.8% 100.0%<br />
Source: FDOT Office of the Comptroller (Annual Toll Revenue) and <strong>Turnpike</strong><br />
Enterprise Finance Office.<br />
The 2007 Legislature amended Section 338.165,<br />
Florida Statutes, to require the <strong>Turnpike</strong> System and<br />
other FDOT-owned facilities to index toll rates on<br />
existing toll facilities to the annual Consumer Price<br />
Index (CPI) or similar inflation indicator effective as<br />
of July 1, 2007. Toll rate adjustments for inflation may<br />
be made no more frequently than once a year and<br />
must be made no less frequently than once every<br />
five years as necessary to accommodate cash toll<br />
rate schedules. Pursuant to this requirement, effective<br />
no later than July 1, 2012 (FY 2013), the twoaxle<br />
cash toll on the Alligator Alley will increase to<br />
$3.00 and the SunPass toll will increase to $2.75. In<br />
order to facilitate public involvement, the <strong>Turnpike</strong><br />
Florida <strong>Department</strong> of Transportation<br />
EntErprisE toll opErations<br />
conducted an indexing workshop on September 13,<br />
2011 and also a public hearing on October 25, 2011<br />
in Fort Myers, FL. The indexing workshop and public<br />
hearing were also available through a webinar for<br />
those unable to attend in person. A detailed description<br />
of the indexing methodology used to calculate<br />
the toll rate increase is included in the Executive<br />
summary chapter of this report.<br />
A number of improvement projects were planned on<br />
the facility with the issue of the Alligator Alley Revenue<br />
Bonds, Series 1997. These projects were partially<br />
financed by the Series 1997 bonds and included SR<br />
29 improvements, the relocation of a microwave<br />
tower, rest area improvements and recreational<br />
access improvements. Currently, all projects have<br />
been substantially completed, except for a parking<br />
facility related to recreational access improvements<br />
on Alligator Alley. Construction for this project is currently<br />
underway.<br />
The 2011 Legislative Session amended FS 338.26 (3)<br />
that toll revenues would be used to develop and<br />
operate a fire station at mile marker 63 on Alligator<br />
Alley to provide fire, rescue and emergency management<br />
services to the adjacent counties along<br />
Alligator Alley. Construction of the fire station will<br />
begin in the summer of 2012 in conjunction with the<br />
rest area at the same mile marker. Construction of<br />
the north rest area is programmed in FY 2018.<br />
2.5 Traffic, Revenue and Expense<br />
Forecasts<br />
The ratio between historical traffic growth and population<br />
growth was used along with projected population<br />
growth as a guideline to estimate future traffic on<br />
Alligator Alley. Historical population growth focused<br />
on the four counties that have a significant regional<br />
impact on Alligator Alley traffic. These counties are<br />
Broward, Collier, Lee and Miami-Dade. Since Alligator<br />
Alley is part of the interstate system, the statewide<br />
population growth was also considered.<br />
FY 2011 Annual Report Alligator Alley<br />
37
Florida <strong>Department</strong> of Transportation<br />
EntErprisE toll opErations<br />
Since FY 2001, the annual traffic growth rate<br />
on the Alligator Alley through FY 2011 was<br />
approximately 1.6 percent, whereas, the<br />
historical annual population growth rate<br />
for the same period for the four counties<br />
was 1.1 percent. As such, traffic growth has<br />
exceeded population growth by approximately<br />
1.5 times. However, over the past few<br />
years, traffic growth has started to decline as<br />
a result of the economic recession. According<br />
to an economic study prepared by Fishkind<br />
& Associates, Inc., Florida’s economic<br />
recovery over the next 10 years will not<br />
achieve growth rates as high as those seen<br />
in the years leading up to the recession.<br />
Future population estimates have been calculated<br />
based on medium projections from the most recent<br />
publication by the Bureau of Economic and Business<br />
Research (BEBR), College of Business Administration<br />
at the University of Florida. The corresponding<br />
estimated annual population growth rate through<br />
2020 for the four counties is 0.9 percent. (Historical<br />
and projected population growth rates for the four<br />
counties were previously shown in table 1.4.) The historical<br />
ratio of traffic growth to population growth<br />
was applied to projected population growth rates<br />
to obtain a general guideline to estimate future<br />
annual traffic growth on the Alligator Alley. A higher<br />
growth rate was used for the Alligator Alley traffic<br />
forecast from FY 2014 to FY 2017 as the facility begins<br />
to recover from the economic recession. This traffic<br />
growth tapers off in the later years of the forecast<br />
period. As such, traffic is estimated to grow at<br />
2.2 percent on an annual basis. Traffic profiles are<br />
provided in appendix B, showing two-way AADT on<br />
each segment of the system, as well as the ramps,<br />
for FY 2011 through FY 2022.<br />
The traffic and gross toll revenue forecasts for FY<br />
2012 through FY 2022 are shown in table 2.8. The<br />
forecast table includes the impact that indexing<br />
will have on revenue. Overall, the gross toll revenue<br />
Fiscal<br />
Year<br />
table 2.8<br />
alligator alley<br />
Traffic and Gross Toll Revenue Forecasts<br />
FY 2012 through FY 2022<br />
Toll Revenue ($000) Toll Revenue Comparisons ( $000)<br />
Revenue<br />
with<br />
Constant<br />
Tolls Amount Percent<br />
(1)<br />
Indexing<br />
Gross<br />
Toll<br />
2010<br />
Annual<br />
Report<br />
Variance<br />
Impact Revenue Forecast<br />
2012 7,417 $19,536 N/A $19,536 $21,011 ($1,475) (7.0%)<br />
2013 7,198 19,770 $5,068 24,838 21,936 2,902 13.2<br />
2014 7,420 20,343 5,538 25,881 22,813 3,068 13.4<br />
2015 7,733 21,157 6,112 27,269 23,634 3,635 15.4<br />
2016 8,043 21,919 6,766 28,685 24,391 4,294 17.6<br />
2017 8,337 22,620 7,465 30,085 25,098 4,987 19.9<br />
2018 8,282 23,254 9,537 32,791 25,776 7,015 27.2<br />
2019 8,504 23,812 10,284 34,096 26,420 7,676 29.1<br />
2020 8,755 24,288 11,270 35,558 27,028 8,530 31.6<br />
2021 9,001 24,725 12,329 37,054 27,622 9,432 34.1<br />
2022 9,230 25,121 13,415 38,536 N/A N/A N/A<br />
forecast for this ten-year period was increased from<br />
the forecast presented in the 2010 Annual Report<br />
due to the indexing of tolls, which will begin in FY<br />
2013. However, the revenue forecast for FY 2012 was<br />
decreased due to the anticipated slow economic<br />
recovery. Transactions in FY 2013 and FY 2018 are<br />
expected to decrease slightly as a result of indexing.<br />
A summary of the economic factors affecting traffic<br />
and revenue is included in the overview chapter of<br />
this report. In addition, appendix a includes future<br />
indexed toll rate schedules.<br />
Projected operating and maintenance expenses<br />
during the same forecast period are shown in table<br />
2.9. The operating expenses for FY 2012 presented<br />
in this table represent the budget amount for that<br />
fiscal year (see appendix C for a detailed description<br />
of the FY 2012 operating expense budget). This<br />
budget amount exceeds FY 2011 actual expenses<br />
by approximately $195 thousand. The expected<br />
increase is due primarily to an increase in toll plaza<br />
operating contracts and FHP costs. Subsequent to<br />
FY 2012, operating expenses are projected to grow<br />
at 3.5 percent annually. The routine maintenance<br />
expense forecast is based on the Asset Maintenance<br />
Contract through FY 2015. Subsequent to FY 2015,<br />
routine maintenance expenses were increased at<br />
3.5 percent annually.<br />
38 Alligator Alley<br />
FY 2011 Annual Report<br />
Total<br />
Traffic<br />
Note: Total traffic corresponds to the gross toll revenue.<br />
N/A The FY 2010 Traffic Engineer's Annual Report forecast went through FY 2021.<br />
(1) Toll revenue forecast without indexing.
table 2.9<br />
alligator alley<br />
projected operating and Maintenance<br />
Expenses ($000)<br />
FY 2012 through FY 2022<br />
Fiscal<br />
Year<br />
Operating<br />
Expense<br />
Routine<br />
Maintenance<br />
Expense<br />
Total<br />
Operating &<br />
Routine<br />
Maintenance<br />
Expenses<br />
In addition, estimated costs for work not performed<br />
under the Asset Maintenance Contract are based<br />
on FY 2011 actual results increased for inflation at 3.5<br />
percent annually.<br />
Periodic maintenance expenses are based on<br />
information provided by the Office of Financial<br />
Development based on the 5-year Work Program.<br />
Significant periodic maintenance expenses are<br />
incurred from FY 2012 through FY 2013 as a result of<br />
expenses related to the fire station, rest area and toll<br />
system enhancement.<br />
2.6 Revenue Sufficiency<br />
Periodic<br />
Maintenance<br />
Expense (1)<br />
Total O&M<br />
Expenses<br />
2012 $3,885 $3,589 $7,474 $10,648 $18,122<br />
2013 4,021 3,616 7,637 11,967 19,604<br />
2014 4,162 3,714 7,876 4,074 11,950<br />
2015 4,308 3,140 7,448 4,250 11,698<br />
2016 4,459 3,249 7,708 4,738 12,446<br />
2017 4,615 3,363 7,978 3,059 11,037<br />
2018 4,777 3,481 8,258 3,166 11,424<br />
2019 4,944 3,603 8,547 3,277 11,824<br />
2020 5,117 3,729 8,846 3,392 12,238<br />
2021 5,296 3,859 9,155 3,511 12,666<br />
2022 5,481 3,994 9,475 3,634 13,109<br />
Note: Operating expenses are based on the budget developed by <strong>Turnpike</strong> Enterprise Finance<br />
Office for FY 2011.<br />
(1) Periodic maintenance expenses include resurfacing, recreational access improvements<br />
and other <strong>Department</strong>-funded R&R and improvements in the 5-year Work Program and<br />
are reported on a cash basis. Periodic maintenance expenses beyond FY 2016 have not<br />
been fully programmed. However, a minimal level of preservation (excluding extraordinary<br />
expenses) has been estimated based on historical costs.<br />
A timeline of Alligator Alley bond issues is shown in<br />
Figure 2.3. As of June 30, 2011, bonds in the principal<br />
amount of $37.4 million remained outstanding from<br />
the 2007 Series. Each year, an amount of principal<br />
and accrued interest (annual debt service) on the<br />
outstanding bonds becomes due and payable. As<br />
a test of the ability of a facility to repay the annual<br />
debt service, a “coverage” calculation is performed.<br />
In accordance with the 2007 Series Bond Resolution,<br />
gross revenues are first required to provide 100 percent<br />
of the administrative, operating and routine<br />
Florida <strong>Department</strong> of Transportation<br />
EntErprisE toll opErations<br />
1963 1997 2007<br />
$17 million<br />
Revenue<br />
Bonds<br />
maintenance expenses. The amount of revenues<br />
remaining (net revenues) is then available for the<br />
payment of debt service. Both renewal and replacement<br />
and other expenses funded by the <strong>Department</strong><br />
(work program projects, repair, restoration, etc.) are<br />
not included in the operating and routine maintenance<br />
expenses for debt service calculations. The<br />
Bond Resolution requires that net revenues be 120<br />
percent (1.2 times) of the annual debt service.<br />
table 2.10 provides a forecast of the sufficiency of<br />
Alligator Alley to meet annual debt service requirements<br />
through FY 2022. Generally, revenues used<br />
for debt service analysis on the facility include gross<br />
toll revenue and other income derived from (or in<br />
connection with) the operation of Alligator Alley.<br />
(1) Periodic maintenance includes significant expenses for resurfacing of the entire facility; however,<br />
these expenses are not included in the operating and routine maintenance expenses as bond<br />
resolutions exclude these expenses when calculating net revenue.<br />
(2) Does not include investment income and operating revenues available for debt service.<br />
(3) Annual debt service is obtained from the State Board of Adminstration Annual Report for the year<br />
ended June 30, 2011.<br />
FY 2011 Annual Report Alligator Alley<br />
Fiscal<br />
Year<br />
Figure 2.3<br />
Alligator Alley Bond Issues<br />
table 2.10<br />
alligator alley<br />
net toll revenue Forecast and Debt<br />
service Coverage ($000)<br />
FY 2011 through FY 2022<br />
Gross Toll<br />
Revenue<br />
Operating &<br />
Routine<br />
Maintenance<br />
Expenses (1)<br />
Net Toll<br />
Revenue (2)<br />
$55.2 million<br />
Revenue<br />
Bonds<br />
Payment<br />
Debt<br />
Service (3)<br />
$43.2 million<br />
Revenue<br />
Refunding<br />
Bonds<br />
Note: A list of projects funded by each bond issue is included in Table 1.5 of<br />
this report.<br />
Coverage<br />
Ratio<br />
2011 $19,737 $7,059 $12,678 $3,448 3.7<br />
2012 19,536 7,474 12,062 3,448 3.5<br />
2013 24,838 7,637 17,201 3,450 5.0<br />
2014 25,881 7,876 18,005 3,447 5.2<br />
2015 27,269 7,448 19,821 3,450 5.7<br />
2016 28,685 7,708 20,977 3,449 6.1<br />
2017 30,085 7,978 22,107 3,448 6.4<br />
2018 32,791 8,258 24,533 3,452 7.1<br />
2019 34,096 8,547 25,549 3,451 7.4<br />
2020 35,558 8,846 26,712 3,450 7.7<br />
2021 37,054 9,155 27,899 3,453 8.1<br />
2022 38,536 9,475 29,061 3,450 8.4<br />
39
Florida <strong>Department</strong> of Transportation<br />
EntErprisE toll opErations<br />
However, a conservative approach was taken for<br />
this analysis and only gross revenue was used in the<br />
calculation of net revenue (i.e., gross toll revenue<br />
less operating and routine maintenance expenses).<br />
As shown in the table, Alligator Alley significantly<br />
exceeds the 1.2 minimum debt service coverage<br />
requirement.<br />
As indicated in Figure 2.4, revenues remaining after<br />
the fulfillment of the annual debt service require-<br />
ment are used next to fund renewal and replacements.<br />
Additionally, these revenues will also be<br />
used to repay the <strong>Department</strong> for outstanding contractual<br />
commitments for Work Program projects<br />
or repair, renewal, reconstruction and restoration<br />
costs paid with <strong>Department</strong> funds. The excess revenues<br />
remaining after all of these obligations have<br />
been determined and met are transferred to the<br />
Figure 2.4<br />
Flow of Funds<br />
Series 2007<br />
Alligator Alley Revenue Refunding Bonds<br />
Toll Revenue<br />
Administrative<br />
Operating & Maintenance<br />
Debt Service<br />
Debt Service Reserve<br />
Renewal & Replacement<br />
Fund<br />
Arbitrage<br />
STTF (<strong>Department</strong> Funded)<br />
R&R, Repair, Restoration,<br />
Reconstruction, Fire Station<br />
SFWMD - Everglades Fund<br />
South Florida Water Management District (SFWMD)<br />
to fund environmental projects designed to restore<br />
the Florida Everglades in accordance with Section<br />
338.26, Florida Statutes. This transfer is necessary to<br />
help restore the natural values of the Everglades<br />
affected by construction of Alligator Alley that may<br />
have contributed to the alteration of water flows in<br />
the Everglades and changes in the ecological patterns<br />
of the historical southern Everglades.<br />
In keeping with the intent of the statute, on June 30,<br />
1997, the <strong>Department</strong> signed a Memorandum of<br />
Agreement with the SFWMD regarding the transfer<br />
of the excess toll revenues to the SFWMD. This agreement<br />
provides the transfer to be made annually and<br />
limits the transfer amount to the annual Legislative<br />
appropriation. Furthermore, the agreement provides<br />
for the total transfers made by the <strong>Department</strong> not<br />
to exceed $63.6 million. The agreement also requires<br />
that prior to its expiration, the agreement will be<br />
renegotiated.<br />
This negotiation will take into account toll revenues<br />
from Alligator Alley, reconstruction and restoration<br />
activities, transportation funding needs of Broward<br />
and Collier Counties and the continuing costs of the<br />
Everglades restoration projects. The results of these<br />
negotiations will be presented to the Legislature prior<br />
to execution of an amended agreement.<br />
The <strong>Department</strong> determined that the cumulative<br />
total of $63.6 million will be paid by FY 2016. In FY<br />
2011, a payment was not transferred to the SFWMD<br />
because there was no excess revenue available<br />
after paying operating and maintenance expenses<br />
and renewal and replacement costs on the facility.<br />
To date, the <strong>Department</strong> has transferred $39.1 million<br />
to the SFWMD.<br />
40 Alligator Alley<br />
FY 2011 Annual Report
Be a c h l i n e ea s t ex p r e s s w a y<br />
3.1 Background<br />
The Beachline East Expressway (Central Florida<br />
Expressway in its original bond documents and formerly<br />
known as the Bee Line East Expressway) is an<br />
east-west, four-lane toll facility that extends from<br />
SR 520 in Orange County east into Brevard County,<br />
where it splits into two branches. The 5-mile northeast<br />
branch becomes SR 407 and extends to a connection<br />
with SR 405, while the 9-mile southeast branch<br />
continues as SR 528 to a connection with the Bennett<br />
Causeway at US 1. The facility connects the John F.<br />
Kennedy Space Center and the aerospace industry<br />
to Orlando and serves as a regional connector to<br />
Florida’s east coast.<br />
Revenue bonds were sold in 1968 to fund the design<br />
and construction of the facility, and were retired on<br />
September 1, 1992. The facility opened to traffic in<br />
February 1974 with an initial toll of $0.20 for passenger<br />
cars and other two-axle vehicles. In July 1996,<br />
this toll was rounded to a quarter ($0.25) to improve<br />
toll collection efficiency. The mainline toll plaza on<br />
the facility was originally located east of SR 520. Following<br />
an agreement dated May 8, 1998 between<br />
the <strong>Department</strong> and the Orlando-Orange County<br />
Expressway Authority (OOCEA), this toll plaza was<br />
Florida <strong>Department</strong> of Transportation<br />
EntErprisE toll opErations<br />
removed. At this time, OOCEA began collecting the<br />
toll at the Beachline Main Plaza located west of SR<br />
520 between SR 417 and the interchange to International<br />
Corporate Park (ICP), with an initial toll of $1.00<br />
for two-axle vehicles. Also, as part of this agreement,<br />
OOCEA was authorized to collect an additional $0.25<br />
at the Beachline Main Plaza for the <strong>Department</strong>.<br />
Therefore, the toll collected at the plaza for two-axle<br />
vehicles was $1.25. This consolidation of toll plazas<br />
reduces the number of stops required by drivers, and<br />
provides considerable capital and annual operating<br />
cost savings to the <strong>Department</strong>. Subsequent to<br />
the removal of the original mainline toll plaza, the<br />
ramps to and from the east at SR 520 were tolled<br />
at $0.25 to maintain a closed system west of I-95.<br />
The tolling of the SR 520 ramps occurred on August<br />
19, 1999. SunPass, E-Pass and cash are accepted at<br />
these unstaffed ramps (see appendix a for the lane<br />
configuration at these ramps). Figure 3.1 shows a<br />
detailed map of the facility.<br />
OOCEA implemented a toll rate increase for all<br />
customers (does not impact <strong>Department</strong> toll rate)<br />
on April 5, 2009 at all tolled locations on the facility<br />
except for the SR 520 ramps. The 2-axle vehicle toll<br />
at the Beachline Main Plaza for all customers, after<br />
the April 2009 toll rate increase, is $1.50. This amount<br />
still includes the additional $0.25 collected for the<br />
<strong>Department</strong>.<br />
Historically, Beachline East transactions and revenue<br />
have increased over the years. In FY 2001, total transactions<br />
were nearly 14.7 million, and revenues were<br />
approximately $3.7 million. In FY 2011, total transactions<br />
increased to nearly 18.0 million, while revenues<br />
increased to $4.6 million. The annual transactions<br />
and revenue for the facility from FY 2001 through<br />
FY 2011 are presented in table 3.1. In FY 2002, transactions<br />
decreased by 3.7 percent as tourism in the<br />
FY 2011 Annual Report Beachline East Expressway<br />
41
Florida <strong>Department</strong> of Transportation<br />
EntErprisE toll opErations<br />
Fiscal<br />
Year<br />
table 3.1<br />
Beachline East Expressway<br />
Historical transactions and revenue Growth<br />
FY 2001 through FY 2011<br />
Toll<br />
Paying<br />
Transactions (000) Toll Revenue ($000)<br />
Non<br />
Revenue Total<br />
Percent<br />
Change Amount<br />
Percent<br />
Change<br />
Orlando area was impacted by the events of September<br />
11, 2001. During August and September 2004<br />
(FY 2005), the State of Florida was impacted by Hurricanes<br />
Charley, Frances, Ivan and Jeanne leading<br />
to periods of toll suspensions to aid in the evacuation<br />
of threatened areas and recovery efforts. Estimated<br />
revenue losses resulting from these temporary toll<br />
suspensions were $232 thousand. As a result, revenue<br />
growth for FY 2005 was approximately 1.4 percent,<br />
compared to 8.2 percent in FY 2004. FY 2006<br />
revenues increased by 6.5 percent over FY 2005<br />
revenues primarily due to a less active hurricane<br />
season. In FY 2007, the Beachline East experienced<br />
a diminished growth rate of 3.4 percent. In FY 2008,<br />
transactions and revenue decreased by 1.8 percent<br />
and 2.4 percent, respectively, compared to FY 2007<br />
levels. This decline in FY 2007 and FY 2008 can primarily<br />
be attributed to the economic slowdown and rising<br />
fuel prices. In FY 2009, transactions and revenue<br />
decreased by 8.6 percent and 12.8 percent, respectively,<br />
due to the severe economic recession. In FY<br />
2010, transactions and revenue increased by 2.5 percent<br />
and 5.2 percent, respectively, compared to FY<br />
2009 levels. This increase can primarily be attributed<br />
to the early signs of recovery following the economic<br />
recession. In FY 2011, transactions and revenue continued<br />
to increase by 4.9 percent and 3.9 percent,<br />
Average<br />
Toll<br />
2001 14,644 40 14,684 - $3,732 - $0.254<br />
2002 14,098 45 14,143 (3.7)% 3,828 2.6% 0.271<br />
2003 15,065 49 15,114 6.9 4,077 6.5 0.270<br />
2004 16,671 56 16,727 10.7 4,410 8.2 0.264<br />
2005 16,841 617 17,458 4.4 4,473 1.4 0.256<br />
2006 17,917 130 18,047 3.4 4,765 6.5 0.264<br />
2007 18,562 68 18,630 3.2 4,928 3.4 0.265<br />
2008 18,215 75 18,290 (1.8) 4,810 (2.4) 0.263<br />
2009 16,577 132 16,709 (8.6) 4,194 (12.8) 0.251<br />
2010 17,053 72 17,125 2.5 4,410 5.2 0.258<br />
2011 17,808 159 17,967 4.9 4,584 3.9 0.255<br />
Source: FDOT Office of the Comptroller and <strong>Turnpike</strong> Enterprise Finance Office.<br />
Note: The non-revenue class includes authorized vehicles that pass through a toll plaza without incurring<br />
a toll (i.e., law enforcement, emergency vehicles) and transactions reported during toll suspensions<br />
attributable to hurricanes.<br />
respectively. The economic factors affecting<br />
traffic and revenue are discussed in greater<br />
detail in the overview chapter of this report.<br />
Historical operating and routine maintenance<br />
expenses from FY 2001 through FY 2011 are<br />
presented in table 3.2. Operating expenses<br />
decreased from $538 thousand in FY 2001 to<br />
$165 thousand in FY 2011. Beginning in FY 2002,<br />
operating expenses increased significantly,<br />
primarily due to certain costs associated with<br />
SunPass and other information technology<br />
projects. In prior years, these costs were generally<br />
considered nonrecurring and related primarily<br />
to capital acquisitions during the early<br />
table 3.2<br />
Beachline East Expressway<br />
Historical operating and routine<br />
Maintenance Expenses ($000)<br />
FY 2001 through FY 2011<br />
implementation phase of the projects. For FY 2004,<br />
a change in the methodology used to allocate certain<br />
operating costs was adopted resulting in significant<br />
reductions in costs associated with the Tolls<br />
Data Center, SunPass Service Center, SunPass transponders<br />
and toll equipment maintenance. FY 2011<br />
operating expenses increased approximately 9.3<br />
percent from FY 2010. This increase is primarily due<br />
to an increase in transponder purchases and credit<br />
card fees.<br />
42 Beachline East Expressway<br />
FY 2011 Annual Report<br />
Fiscal<br />
Year<br />
Operating<br />
Expense<br />
Routine<br />
Maintenance<br />
Expense<br />
Source: FDOT Office of the Comptroller.<br />
Total O&M<br />
Expenses<br />
2001 $538 $188 $726<br />
2002 767 333 1,100<br />
2003 647 312 959<br />
2004 206 353 559<br />
2005 139 416 555<br />
2006 141 523 664<br />
2007 150 546 696<br />
2008 226 542 768<br />
2009 204 440 644<br />
2010 151 255 406<br />
2011 165 331 496
STATE OF FLORIDA<br />
DEPARTMENT<br />
OF TRANSPORTATION
Florida <strong>Department</strong> of Transportation<br />
EntErprisE toll opErations<br />
Maintenance of the Beachline East Express-<br />
way is performed under a private Asset Main-<br />
tenance Contract with the <strong>Department</strong> pro-<br />
viding oversight through its Asset Management<br />
Coordinator. This contract also provides for<br />
maintenance of I-95 in Brevard, Volusia, Flagler<br />
and Indian River Counties and for SR 407. Maintenance<br />
activities include roadside mowing<br />
and upkeep, guardrail repair, shoulder repair<br />
and other routine maintenance items. FY 2011<br />
routine maintenance expenses increased<br />
approximately 30 percent from FY 2010 due<br />
to an increase in Asset Maintenance Contract<br />
costs paid in FY 2011 and an increase in toll<br />
facility maintenance costs. In addition to the<br />
FY 2011 operating and routine maintenance<br />
expenses reflected in the table, $3 thousand<br />
in periodic maintenance and capital improvements<br />
expense was incurred.<br />
3.2 FY 2011 Transactions and<br />
Toll Revenues<br />
Monthly transactions and toll revenue on the<br />
Beachline East Expressway during FY 2011 are presented<br />
in table 3.3. The table shows transactions<br />
at the Beachline Main Plaza and the SR 520 ramps,<br />
as well as system totals. Total transactions at the<br />
Beachline Main Plaza were approximately 16.7 million<br />
for the year, compared to 1.2 million at the SR<br />
520 ramps, providing approximately 17.9 million<br />
transactions on the facility for FY 2011. The corresponding<br />
revenues were approximately $4.3 million<br />
and $0.3 million at the Beachline Main Plaza and the<br />
SR 520 ramps, respectively, for a system-wide total<br />
of nearly $4.6 million. The fourth quarter experienced<br />
the largest amount of transactions and revenue in FY<br />
2011. Conversely, the second quarter had the lowest<br />
amounts.<br />
Graph 3.1 shows the number of hourly transactions<br />
on weekdays of a typical week during FY 2011 at the<br />
Beachline Main Plaza and the tolled SR 520 ramps.<br />
Demand for travel on the facility increases during<br />
the morning and evening peak hours with hourly volumes<br />
in the evening reaching the maximum levels.<br />
The monthly seasonal transaction variation in FY 2011<br />
44 Beachline East Expressway<br />
FY 2011 Annual Report<br />
Month<br />
Transactions<br />
table 3.3<br />
Beachline East Expressway<br />
Monthly transactions and toll revenue<br />
FY 2011<br />
4,000<br />
3,500<br />
3,000<br />
2,500<br />
2,000<br />
1,500<br />
1,000<br />
500<br />
0<br />
Beachline<br />
Main<br />
Plaza<br />
1:00<br />
AM<br />
Graph 3.1<br />
Beachline East Expressway<br />
typical Hourly Weekday transactions<br />
FY 2011<br />
3:00<br />
AM<br />
Transactions (000) Toll Revenue ($000)<br />
SR 520<br />
Ramps Total<br />
5:00<br />
AM<br />
7:00<br />
AM<br />
9:00<br />
AM<br />
11:00<br />
AM<br />
Beachline<br />
Main<br />
Plaza<br />
1:00<br />
PM<br />
Time of Day<br />
3:00<br />
PM<br />
5:00<br />
PM<br />
Beachline Main Plaza SR 520 Ramps<br />
SR 520<br />
Ramps Total<br />
July 2010 1,494 114 1,608 $388 $25 $413<br />
August 1,402 110 1,512 368 23 391<br />
September 1,279 101 1,380 334 22 356<br />
1st Quarter Total 4,175 325 4,500 1,090 70 1,160<br />
October 1,377 103 1,480 356 21 377<br />
November 1,338 93 1,431 346 19 365<br />
December 1,368 84 1,452 353 17 370<br />
2nd Quarter Total 4,083 280 4,363 1,055 57 1,112<br />
January 2011 1,296 86 1,382 338 17 355<br />
February 1,322 93 1,415 335 20 355<br />
March 1,549 115 1,664 402 25 427<br />
3rd Quarter Total 4,167 294 4,461 1,075 62 1,137<br />
April 1,500 114 1,614 380 22 402<br />
May 1,443 110 1,553 370 22 392<br />
June 1,376 100 1,476 361 20 381<br />
4th Quarter Total 4,319 324 4,643 1,111 64 1,175<br />
Annual Total 16,744 1,223 17,967 $4,331 $253 $4,584<br />
Source: FDOT Office of the Comptroller (Annual Toll Revenue) and <strong>Turnpike</strong> Enterprise Finance Office.<br />
Note: Transactions represent toll-paying and non-revenue traffic at Beachline Main Plaza and the<br />
SR 520 ramps.<br />
7:00<br />
PM<br />
9:00<br />
PM<br />
11:00<br />
PM<br />
Source: Data obtained from <strong>Turnpike</strong> Enterprise Finance Office for the 5-day period beginning<br />
Monday, June 20, 2011.
is analyzed in table 3.4. On average, 45,900 vehicles<br />
use the Beachline Main Plaza each day and approximately<br />
3,300 use the tolled SR 520 ramps. Based on<br />
average daily transactions, March and April had the<br />
highest volumes at 9 percent above the average for<br />
the facility.<br />
Month<br />
table 3.4<br />
Beachline East Expressway<br />
seasonal transaction Variation<br />
FY 2011<br />
Average Daily Transactions<br />
Beachline<br />
Main<br />
Plaza<br />
SR 520<br />
Ramps Total<br />
Seasonal<br />
Factor<br />
July 2010 48,200 3,700 51,900 1.05<br />
August 45,200 3,600 48,800 0.99<br />
September 42,600 3,400 46,000 0.93<br />
October 44,400 3,300 47,700 0.97<br />
November 44,600 3,100 47,700 0.97<br />
December 44,100 2,700 46,800 0.95<br />
January 2011 41,800 2,800 44,600 0.91<br />
February 47,200 3,300 50,500 1.03<br />
March 50,000 3,700 53,700 1.09<br />
April 50,000 3,800 53,800 1.09<br />
May 46,500 3,600 50,100 1.02<br />
June 45,900 3,300 49,200 1.00<br />
AADT 45,900 3,300 49,200 1.00<br />
The FY 2011 two-way annual average daily traffic<br />
(AADT) profile for the facility is presented in Figure<br />
3.2. As previously mentioned, the FY 2011 AADT at<br />
the OOCEA Mainline plaza totaled 45,900, and the<br />
tolled SR 520 ramps totaled approximately 3,300. The<br />
tolled volumes at the International Corporate Park<br />
(ICP) ramps amounted to 900 vehicles daily. Revenues<br />
at the ICP ramps are collected by OOCEA<br />
and are not included as a part of the <strong>Department</strong>’s<br />
transactions and revenue for the Beachline East<br />
Expressway.<br />
The contribution to traffic and revenue that trucks<br />
provide on the Beachline East Expressway is shown in<br />
Graph 3.2. For FY 2011, trucks accounted for approximately<br />
4 percent of the traffic on the facility and 13<br />
percent of the revenue.<br />
Florida <strong>Department</strong> of Transportation<br />
EntErprisE toll opErations<br />
Passenger<br />
Mile Post - Description Car Toll AADT<br />
37 - SR 407 (to Titusville)<br />
31 - SR 520 $0.25<br />
24 - Dallas Boulevard<br />
Figure 3.2<br />
Beachline East Expressway<br />
Two-way AADT Profile<br />
FY 2011<br />
20 - ICP (OOCEA) $1.25<br />
16 - Beachline Main Plaza $1.50<br />
To Cocoa<br />
To Orlando<br />
In terms of actual revenue contributions recorded<br />
at the Beachline Main Plaza, two-axle vehicles provided<br />
$3.6 million and vehicles with three or more<br />
axles provided approximately $0.6 million in revenue<br />
for FY 2011. The remaining $0.4 million in revenue is<br />
attributed to the tolled ramps at SR 520.<br />
FY 2011 Annual Report Beachline East Expressway<br />
N<br />
27,500<br />
6,700<br />
34,200<br />
3,400<br />
8,900<br />
39,700<br />
3,200<br />
42,900<br />
900<br />
3,900<br />
45,900<br />
45
Florida <strong>Department</strong> of Transportation<br />
EntErprisE toll opErations<br />
Additional Axles<br />
Additional Axles<br />
Graph 3.2<br />
Beachline East Expressway<br />
Transactions by Axle Class<br />
FY 2011<br />
4%<br />
96%<br />
Revenue Contribution by Axle Class<br />
FY 2011<br />
13%<br />
3.3 SunPass/E-Pass<br />
87%<br />
Two Axles<br />
Two Axles<br />
In 1998, the original Beachline East Expressway toll<br />
plaza east of SR 520 was removed, and an agreement<br />
between the <strong>Department</strong> and OOCEA was<br />
created authorizing OOCEA to collect an additional<br />
$0.25 at the Beachline Main Plaza for the <strong>Department</strong>.<br />
Through this agreement, E-Pass became a<br />
part of the toll collection system for the Beachline<br />
East Expressway. E-Pass is the electronic toll collection<br />
system that has been in place on OOCEA facilities<br />
since 1995 as a convenient alternative to cash<br />
payments. Dedicated E-Pass lanes were installed at<br />
the Beachline Main Plaza in 1997 to reduce the time<br />
spent waiting at toll plazas for those who established<br />
an E-Pass account. Electronic toll collection equipment<br />
was installed on the tolled ramps at SR 520 prior<br />
to opening to traffic in August 1999 (see appendix a<br />
for lane configuration).<br />
As of January 26, 2001 (FY 2001) the Beachline East<br />
Expressway system, as well as all other OOCEA toll<br />
facilities, integrated E-Pass and SunPass, providing<br />
two fully inter-operable systems. Drivers can now use<br />
either type of transponder to travel on any toll facility<br />
in the region, expanding the attractiveness and convenience<br />
of electronic toll collection. SunPass (and<br />
E-Pass) transactions were approximately 10.6 million,<br />
or 59 percent of the nearly 18.0 million total transactions<br />
in FY 2011. As shown in table 3.5, the monthly<br />
SunPass participation ranged from a low of 56.8 percent<br />
to a high of 61.6 percent during FY 2011.<br />
table 3.5<br />
Beachline East Expressway<br />
transactions by payment Method<br />
FY 2011<br />
SunPass<br />
Non-<br />
SunPass<br />
The resulting SunPass revenue attributable to the<br />
Beachline East Expressway is approximately $3.2 million,<br />
or 70.3 percent of the $4.6 million collected in FY<br />
2011. This rate is higher than that of the SunPass transaction<br />
percentage, indicating that a large portion of<br />
multi-axle vehicles use SunPass. table 3.6 shows the<br />
revenue contributions from SunPass and non-Sun-<br />
Pass attributable to the Beachline East Expressway.<br />
The monthly SunPass revenue contributions ranged<br />
from a low of approximately 66.8 percent to a high<br />
of 72.5 percent.<br />
46 Beachline East Expressway<br />
FY 2011 Annual Report<br />
Month<br />
Transactions (000)<br />
Total<br />
Percent<br />
SunPass<br />
July 2010 913 695 1,608 56.8%<br />
August 891 621 1,512 58.9<br />
September 850 530 1,380 61.6<br />
October 893 587 1,480 60.3<br />
November 850 581 1,431 59.4<br />
December 866 586 1,452 59.6<br />
January 2011 837 545 1,382 60.6<br />
February 813 602 1,415 57.5<br />
March 964 700 1,664 57.9<br />
April 924 690 1,614 57.2<br />
May 925 628 1,553 59.6<br />
June 886 590 1,476 60.0<br />
Total 10,612 7,355 17,967<br />
Percentage 59.1% 40.9% 100.0%<br />
Source: <strong>Turnpike</strong> Enterprise Finance Office.<br />
Note: Cash transactions represent toll-paying and non-revenue traffic.
table 3.6<br />
Beachline East Expressway<br />
Gross toll revenue by payment Method<br />
FY 2011<br />
Month<br />
Gross Toll Revenue ($000)<br />
SunPass<br />
Non-<br />
SunPass<br />
3.4 noteworthy events<br />
Total<br />
Percent<br />
SunPass<br />
July 2010 $276 $137 $413 66.8%<br />
August 275 116 391 70.3<br />
September 258 98 356 72.5<br />
October 268 109 377 71.1<br />
November 257 108 365 70.4<br />
December 261 109 370 70.5<br />
January 2011 255 100 355 71.8<br />
February 248 107 355 69.9<br />
March 292 135 427 68.4<br />
April 279 123 402 69.4<br />
May 281 111 392 71.7<br />
June 274 107 381 71.9<br />
Total $3,224 $1,360 $4,584<br />
Percentage 70.3% 29.7% 100.0%<br />
Source: FDOT Office of the Comptroller (Annual Toll Revenue) and <strong>Turnpike</strong><br />
Enterprise Finance Office.<br />
The 2007 Legislature amended Section 338.165,<br />
Florida Statutes, to require the <strong>Turnpike</strong> System and<br />
other FDOT-owned facilities to index toll rates on<br />
existing toll facilities to the annual Consumer Price<br />
Index (CPI) or similar inflation indicator effective as<br />
of July 1, 2007. Toll rate adjustments for inflation may<br />
be made no more frequently than once a year and<br />
must be made no less frequently than once every<br />
five years as necessary to accommodate cash toll<br />
rate schedules. Pursuant to this requirement, effective<br />
no later than July 1, 2012 (FY 2013), the twoaxle<br />
cash toll collected for the <strong>Department</strong> on the<br />
Beachline East will increase to $0.50 and the SunPass<br />
toll will remain at the current $0.25. In order to facilitate<br />
public involvement, the <strong>Turnpike</strong> conducted<br />
an indexing workshop on September 13, 2011 and<br />
also a public hearing on October 25, 2011 in Ocoee,<br />
FL. The indexing workshop and public hearing were<br />
also available through a webinar for those unable<br />
to attend in person. A detailed description of the<br />
indexing methodology used to calculate the toll<br />
rate increase is included in the Executive summary<br />
chapter of this report.<br />
Florida <strong>Department</strong> of Transportation<br />
EntErprisE toll opErations<br />
3.5 FY 2011 Expenses and Liabilities<br />
A comparison between actual and budgeted oper-<br />
ating and routine maintenance expenses for FY 2011<br />
is shown in table 3.7. Actual operating expenses<br />
were approximately $23 thousand less than the FY<br />
2011 budget. This decrease is primarily due to lower<br />
actual expenses incurred for toll equipment repair<br />
and maintenance. Routine maintenance expenses<br />
of $331 thousand were approximately 28.5 percent<br />
table 3.7<br />
Beachline East Expressway<br />
operating and routine Maintenance Expenses<br />
($000)<br />
FY 2011<br />
Type of Expense Budget Actual<br />
Over/<br />
(Under) Variance<br />
Operating $188 $165 ($23) (12.2%)<br />
Routine Maintenance 463 $331 (132) (28.5)<br />
Total $651 $496 ($155) (23.8%)<br />
Source: FDOT Office of the Comptroller,<strong>Turnpike</strong> Enterprise Finance Office and the FY<br />
2010 Enterprise Toll Operations Traffic Engineer's Annual Report.<br />
less than the FY 2011 budget due to a general decline<br />
in routine maintenance needed on the facility compared<br />
to what was originally budgeted. Overall,<br />
actual FY 2011 operating and routine maintenance<br />
expenses were 23.8 percent less than budgeted.<br />
The Beachline East Expressway has two liabilities<br />
that are payable to the <strong>Department</strong>. The first liability<br />
was set up to defer improvements and operating<br />
and maintenance expenses for the facility that<br />
exceeded available revenues while the bonds were<br />
outstanding. After retirement of the bonds, operating<br />
and maintenance expenses, and improvement<br />
costs were first added to the liability, then all gross toll<br />
revenues were used to reduce the liability.<br />
Beginning in February 1999, gross toll revenue was<br />
first transferred to an escrow account to fund SR<br />
520 off-system improvements. However, in FY 2006<br />
the escrow account at the <strong>Department</strong> of Financial<br />
Services was closed because FY 2006 expenditures<br />
for SR 520 improvements significantly exceeded<br />
escrow account funding. As shown in Figure 3.3, toll<br />
FY 2011 Annual Report Beachline East Expressway<br />
47
Florida <strong>Department</strong> of Transportation<br />
EntErprisE toll opErations<br />
revenues are now deposited in the State Transpor-<br />
tation Trust Fund (STTF) and are used to reduce the<br />
second liability consisting of deferred costs for SR<br />
520 improvements. Correspondingly, operating and<br />
maintenance expenses and other facility improvements<br />
are deferred until the second liability is paid.<br />
Analysis of the FY 2011 long-term liability for deferred<br />
SR 520 costs is presented in table 3.8. Analysis of the<br />
Additions (1)<br />
Reductions (2)<br />
OLD<br />
Figure 3.3<br />
Flow of Funds<br />
Beachline East Expressway<br />
Transaction<br />
Balance, end of year<br />
Toll Revenue<br />
State Transportation Trust Fund<br />
(STTF)<br />
Deferred SR 520<br />
Improvements - Until Completed<br />
(Long-Term Debt Due STTF)<br />
Deferred Operating, Maintenance<br />
& Facility Improvements<br />
(Long-Term Debt Due STTF)<br />
table 3.8<br />
Beachline East Expressway<br />
Deferred sttF advances for sr 520 Costs ($000)<br />
FY 2011<br />
Balance, beginning of year<br />
Amount<br />
$22,988<br />
Source: FDOT Office of the Comptroller.<br />
(1) Additions represent increases in the long-term<br />
liability due to SR 520 expenditures.<br />
(2) As used here, reductions represent deposits<br />
from toll receipts.<br />
FY 2011 long-term liability for deferred facility costs is<br />
presented in table 3.9.<br />
-<br />
4,522<br />
$18,466<br />
table 3.9<br />
Beachline East Expressway<br />
Deferred sttF advances for Facility Costs ($000)<br />
FY 2011<br />
Transaction<br />
Balance, beginning of year<br />
Additions<br />
Reductions<br />
Balance, end of year<br />
Source: FDOT Office of the Comptroller.<br />
Amount<br />
$29,072<br />
Operating & Maintenance 496<br />
Periodic Maintenance 3<br />
$29,571<br />
3.6 Traffic, Revenue and Expense<br />
Forecasts<br />
The ratio between historical traffic growth and<br />
population growth was used along with projected<br />
population growth to estimate future traffic on the<br />
Beachline East Expressway. Historical population<br />
growth focused on the four counties that have a significant<br />
regional impact on the facility. These counties<br />
are Brevard, Orange, Osceola and Seminole.<br />
Since the Beachline East Expressway is a primary<br />
east-west connector in central Florida, the statewide<br />
population growth was also considered.<br />
From FY 2001 through FY 2011, the annual traffic<br />
growth rate on the Beachline East Expressway was<br />
approximately 2.0 percent, whereas, the historical<br />
annual population growth rate for the same period<br />
for the four counties was 1.9 percent. As such, traffic<br />
growth has been consistent with population growth.<br />
However, during FY 2008 and FY 2009, traffic growth<br />
started to decline as a result of the economic recession.<br />
According to an economic study prepared by<br />
Fishkind & Associates, Inc., Florida’s economic recovery<br />
over the next 10 years would not achieve growth<br />
rates as high as those seen in the years leading up to<br />
the recession.<br />
Future population estimates have been calculated<br />
based on medium projections from the most recent<br />
publication by the Bureau of Economic and Business<br />
48 Beachline East Expressway<br />
FY 2011 Annual Report<br />
-
Research (BEBR), College of Business Administration<br />
at the University of Florida. The corresponding estimated<br />
annual population growth rate through 2020<br />
for the four counties is 1.6 percent. (Historical and<br />
projected population growth rates for the four counties<br />
were previously shown in table 1.5.) The historical<br />
ratio of traffic growth to population growth was<br />
applied to projected population growth rates to<br />
obtain a general guideline to estimate future annual<br />
traffic growth on the Beachline East Expressway. For<br />
the ten-year forecast period, traffic is estimated to<br />
grow at 1.4 percent on an annual basis, with slower<br />
growth for the first five years and then ramping up<br />
from FY 2017 to FY 2022. Traffic profiles are provided<br />
in appendix B, showing two-way AADT on each segment<br />
of the system, as well as the ramps, for FY 2011<br />
through FY 2022.<br />
The traffic and gross toll revenue forecasts for FY 2012<br />
through FY 2022 are shown in table 3.10. The forecast<br />
table includes the impact that indexing will have on<br />
revenue. The toll revenue forecast for this ten-year<br />
period was increased from the forecast presented<br />
in the 2010 Annual Report due to indexing of tolls,<br />
Fiscal<br />
Year<br />
table 3.10<br />
Beachline East Expressway<br />
Traffic and Gross Toll Revenue Forecasts<br />
FY 2012 through FY 2022<br />
Total<br />
Traffic<br />
Revenue<br />
with<br />
Constant<br />
Tolls (1)<br />
Toll Revenue ($000)<br />
Indexing<br />
Impact<br />
Gross<br />
Toll<br />
Revenue<br />
Toll Revenue Comparisons ( $000)<br />
2010<br />
Annual<br />
Report<br />
Variance<br />
Forecast Amount Percent<br />
2012 18,524 $4,726 N/A $4,726 $4,601 $125 2.7%<br />
2013 17,857 4,920 $1,417 6,337 4,790 1,547 32.3<br />
2014 18,253 5,107 1,456 6,563 4,972 1,591 32.0<br />
2015 18,764 5,296 1,541 6,837 5,156 1,681 32.6<br />
2016 19,294 5,492 1,634 7,126 5,347 1,779 33.3<br />
2017 19,828 5,689 1,735 7,424 5,539 1,885 34.0<br />
2018 19,540 5,889 2,527 8,416 5,733 2,683 46.8<br />
2019 20,053 6,089 2,574 8,663 5,905 2,758 46.7<br />
2020 20,480 6,284 2,625 8,909 6,059 2,850 47.0<br />
2021 20,941 6,472 2,679 9,151 6,192 2,959 47.8<br />
2022 21,390 6,653 2,737 9,390 N/A N/A N/A<br />
Note: Total traffic corresponds to the gross toll revenue.<br />
N/A The FY 2010 Traffic Engineer's Annual Report forecast went through FY 2021.<br />
(1) Toll revenue forecast without indexing.<br />
which will begin in FY 2013. Transactions in FY 2013<br />
and FY 2018 are expected to decrease slightly as a<br />
result of indexing. A summary of the economic factors<br />
affecting traffic and revenue is included in the<br />
Florida <strong>Department</strong> of Transportation<br />
EntErprisE toll opErations<br />
overview chapter of this report. In addition, appen-<br />
dix a includes future indexed toll rate schedules.<br />
The projected operating and maintenance expenses<br />
during the same forecast period are shown in table<br />
3.11. The operating budget amount for the facility in<br />
FY 2012 is $189 thousand, which is provided in detail in<br />
table 3.11<br />
Beachline East Expressway<br />
projected operating and Maintenance<br />
Expenses ($000)<br />
FY 2012 through FY 2022<br />
Operating<br />
Expense<br />
Maintenance Expenses<br />
Routine Periodic (1)<br />
appendix C. The FY 2012 operating budget exceeds<br />
FY 2011 actual operating expenses by approximately<br />
$24 thousand due, in part, to an expected increase<br />
in toll equipment maintenance. Operating expenses<br />
for years subsequent to FY 2012 are estimated to<br />
increase at 3.5 percent annually to account for inflation.<br />
The routine maintenance expense forecast is<br />
based on the Asset Maintenance Contract through<br />
FY 2016. Subsequent to FY 2016, routine maintenance<br />
expenses were increased at 3.5 percent annually.<br />
In addition, estimated costs for work not performed<br />
under the Asset Maintenance Contract are based<br />
on FY 2011 actual results increased for inflation at 3.5<br />
percent annually. Periodic maintenance expenses<br />
are provided by the <strong>Department</strong>’s Office of Financial<br />
Development and are based on the 5-year Work<br />
Program.<br />
FY 2011 Annual Report Beachline East Expressway<br />
Fiscal<br />
Year<br />
Total O&M<br />
Expenses<br />
2012 $189 $471 $63 $723<br />
2013 196 539 149 884<br />
2014 202 536 674 1,412<br />
2015 210 537 1,667 2,414<br />
2016 217 538 1,410 2,165<br />
2017 224 556 721 1,501<br />
2018 232 576 746 1,554<br />
2019 240 596 772 1,608<br />
2020 249 617 799 1,665<br />
2021 258 638 827 1,723<br />
2022 267 660 856 1,783<br />
Note: Operating expenses are based on the budget developed by <strong>Turnpike</strong><br />
Enterprise Finance Office for FY 2012.<br />
(1) Periodic maintenance expenses were provided by the FDOT Office of Financial<br />
Development and include resurfacing projects and other <strong>Department</strong> funded<br />
renewal and replacement and improvements in the 5 year Work Program and are<br />
reported on a cash basis. Periodic maintenance expenses beyond FY 2017 include<br />
a minimal level of preservation (excluding extraordinary expenses) that are<br />
estimated based on FY 2017 expenses increased at 3.5 percent annually.<br />
49
Florida <strong>Department</strong> of Transportation<br />
EntErprisE toll opErations<br />
tHis paGE intEntionallY lEFt BlanK<br />
50 Beachline East Expressway<br />
FY 2011 Annual Report
P i n e l l a s Ba y w a y sy s t e m<br />
4.1 Background<br />
The Pinellas Bayway System consists of a series of<br />
causeways and bridges providing a connection<br />
between St. Petersburg Beach, Fort DeSoto Park and<br />
I-275. The system is approximately 15.2 miles in length<br />
and includes 1.3 miles of bridges. Figure 4.1 shows a<br />
map of the facility.<br />
The east-west section of the facility (SR 682) provides<br />
a connection between I-275 (via 54th Avenue) on<br />
the east and Gulf Boulevard (SR 699) on the west.<br />
This section crosses the Bayway Isles and Isle Del Sol.<br />
The north-south section of the facility (SR 679) extends<br />
from Isle Del Sol through Tierra Verde to Mullet Key<br />
and Fort DeSoto Park. The facility was opened to traffic<br />
in December 1962. The 1960 bonds, used to fund<br />
construction of the facility, were refunded in 1966,<br />
and all of the 1966 bonds were retired in June 1989.<br />
There are three mainline toll plazas on the Pinellas<br />
Bayway System. Tolls at the first plaza, located at the<br />
northeast end of the facility on the mainland near<br />
Eckerd College, are collected for westbound travel<br />
only. The second plaza is located on the northwest<br />
end of the facility in St. Petersburg Beach, near the<br />
Florida <strong>Department</strong> of Transportation<br />
EntErprisE toll opErations<br />
intersection with Gulf Boulevard (SR 699). Tolls at this<br />
plaza are collected for eastbound travel only. Finally,<br />
tolls at the third mainline plaza, located on Tierra<br />
Verde, are collected for southbound travel only. No<br />
tolls are collected on the Pinellas Bayway System for<br />
the return trip from the south end of the facility. The<br />
toll for passenger cars and other two-axle vehicles is<br />
$0.50 at each of the plazas on SR 682, and increases<br />
at the rate of $0.25 per axle for vehicles with three or<br />
more axles. Tolls at the southern mainline plaza on SR<br />
679 are $0.35, and increase at the rate of $0.10 per<br />
axle for vehicles with three or more axles.<br />
Annual transactions and revenue for the facility from<br />
FY 2001 through FY 2011 are presented in table 4.1.<br />
In FY 2001, total transactions were approximately 9.8<br />
million and revenues were approximately $3.6 million.<br />
FY 2011 transactions are slightly lower at approximately<br />
9.2 million and revenue is the same at $3.6<br />
million. The variation in transaction and revenue performance<br />
in FY 2001 and FY 2002 is due, in part, to<br />
increased participation in the annual pass program.<br />
In addition, a decrease in seasonal residents was<br />
seen in FY 2002. Primarily due to the active hurricane<br />
season, FY 2005 transactions decreased 4.3 percent<br />
from the previous year, while revenues dropped by<br />
3.6 percent. The decline in traffic and revenue in FY<br />
2007, FY 2008, and FY 2009 can be attributed to the<br />
economic recession. In FY 2010, transactions and<br />
revenue decreased by 1.7 percent and 0.7 percent,<br />
respectively. This decline can be attributed to the<br />
sluggish economy following the economic recession.<br />
Compared to FY 2010, FY 2011 transactions<br />
and revenue increased by 0.6 percent and 2.7 percent,<br />
respectively, which reflects the early signs of<br />
a slow recovery following the economic recession.<br />
The economic factors affecting the decline in traffic<br />
and revenue are discussed in greater detail in the<br />
overview chapter of this report.<br />
FY 2011 Annual Report Pinellas Bayway System<br />
51
Florida <strong>Department</strong> of Transportation<br />
EntErprisE toll opErations<br />
Fiscal<br />
Year<br />
table 4.1<br />
pinellas Bayway system<br />
Historical transactions and revenue Growth<br />
FY 2001 through FY 2011<br />
Toll<br />
Paying<br />
Historical operating and routine maintenance<br />
expenses from FY 2001 through FY 2011 are presented<br />
in table 4.2. As indicated, operating expenses have<br />
decreased from $2.2 million in FY 2001 to $1.8 million<br />
in FY 2011. FY 2011 operating expenses decreased<br />
approximately 2.1 percent from FY 2010. Decreases<br />
in FY 2011 operating expenses were primarily related<br />
to toll plaza operating contracts and insurance<br />
premiums.<br />
Fiscal<br />
Year<br />
Transactions (000) Toll Revenue (1) ($000)<br />
Non<br />
Revenue Total<br />
table 4.2<br />
pinellas Bayway system<br />
Historical operating and routine<br />
Maintenance Expenses ($000)<br />
FY 2001 through FY 2011<br />
Operating<br />
Expense<br />
Routine<br />
Maintenance<br />
Expense<br />
Source: FDOT Office of the Comptroller.<br />
Percent<br />
Change Amount<br />
Total O&M<br />
Expenses<br />
2001 $2,245 $302 $2,547<br />
2002 2,115 333 2,448<br />
2003 2,128 413 2,541<br />
2004 2,565 564 3,129<br />
2005 1,997 649 2,646<br />
2006 2,000 650 2,650<br />
2007 2,146 484 2,630<br />
2008 2,083 473 2,556<br />
2009 2,122 588 2,710<br />
2010 1,840 723 2,563<br />
2011 1,802 747 2,549<br />
Percent<br />
Change<br />
Average<br />
Toll<br />
2001 9,796 39 9,835 - $3,647 - $0.371<br />
2002 9,599 44 9,643 (2.0%) 3,511 (3.7)% 0.364<br />
2003 9,673 46 9,719 0.8 3,576 1.9 0.368<br />
2004 10,060 46 10,106 4.0 3,769 5.4 0.373<br />
2005 9,451 220 9,671 (4.3) 3,634 (3.6) 0.376<br />
2006 9,921 21 9,942 2.8 3,732 2.7 0.375<br />
2007 9,769 26 9,795 (1.5) 3,711 (0.6) 0.379<br />
2008 9,649 30 9,679 (1.2) 3,656 (1.5) 0.378<br />
2009 9,290 37 9,327 (3.6) 3,535 (3.3) 0.379<br />
2010 9,142 26 9,168 (1.7) 3,510 (0.7) 0.383<br />
2011 9,195 30 9,225 0.6 3,605 2.7 0.391<br />
Source: FDOT Office of the Comptroller and <strong>Turnpike</strong> Enterprise Finance Office.<br />
Note: The non-revenue class includes authorized vehicles that pass through a toll plaza without<br />
incurring a toll (i.e., law enforcement, emergency vehicles) and transactions reported during<br />
toll suspensions attributable to hurricanes.<br />
(1) Toll revenue reported net of the SunPass discount since FY 2000.<br />
Maintenance of the Pinellas Bayway System<br />
is performed under a private Asset Maintenance<br />
Contract beginning in January 2003<br />
(FY 2003). The contract includes expenses for<br />
movable bridge maintenance for the two<br />
drawbridges, as well as maintenance and<br />
inspection of all other bridges on the Pinellas<br />
Bayway System. Total FY 2011 routine maintenance<br />
expenses increased by 3.3 percent<br />
over FY 2010 due to bridge inspection costs.<br />
In addition to operating and routine maintenance<br />
expenses, renewal and replacement<br />
and capital improvement (periodic) costs<br />
totaling nearly $1.0 million were incurred during<br />
FY 2011 primarily due to bridge replacement<br />
costs.<br />
4.2 FY 2011 Transactions and<br />
Toll Revenues<br />
Monthly transactions and toll revenue on the Pinellas<br />
Bayway System during FY 2011 are presented in<br />
table 4.3. Typically, the first quarter (i.e., July through<br />
table 4.3<br />
pinellas Bayway system<br />
Monthly transactions and toll revenue<br />
FY 2011<br />
52 Pinellas Bayway System<br />
FY 2011 Annual Report<br />
Month<br />
Transactions<br />
(000)<br />
Toll Revenue<br />
($000)<br />
July 2010 781 $278<br />
August 708 239<br />
September 677 460<br />
1st Quarter Total 2,166 977<br />
October 745 425<br />
November 685 257<br />
December 632 215<br />
2nd Quarter Total 2,062 897<br />
January 2011 696 233<br />
February 771 260<br />
March 967 335<br />
3rd Quarter Total 2,434 828<br />
April 940 329<br />
May 865 303<br />
June 758 271<br />
4th Quarter Total 2,563 903<br />
Annual Total 9,225 $3,605<br />
Source: FDOT Office of the Comptroller (Annual Toll Revenue) and<br />
<strong>Turnpike</strong> Enterprise Finance Office.<br />
Note: Transactions represent toll-paying and non-revenue traffic<br />
at the mainline plazas.
STATE OF FLORIDA<br />
DEPARTMENT<br />
OF TRANSPORTATION
Florida <strong>Department</strong> of Transportation<br />
EntErprisE toll opErations<br />
September) generates more revenue compared to<br />
the remaining three quarters due to revenues from<br />
the general public annual passes (which represent a<br />
large percent of the available types of passes) being<br />
recorded in September when the passes are primarily<br />
sold. The results indicate that the first quarter generated<br />
nearly $1.0 million in revenues compared<br />
to the $0.9 million (average) generated in each of<br />
the remaining three quarters. Graph 4.1 shows the<br />
monthly distribution of pass sales.<br />
Graph 4.2 shows the number of hourly transactions<br />
on weekdays of a typical week during FY 2011 and<br />
Transactions<br />
300,000<br />
250,000<br />
200,000<br />
150,000<br />
100,000<br />
50,000<br />
2,000<br />
1,500<br />
1,000<br />
500<br />
0<br />
0<br />
1:00<br />
AM<br />
3:00<br />
AM<br />
Graph 4.1<br />
pinellas Bayway system<br />
Monthly pass sales Distribution<br />
FY 2011<br />
Jul Aug Sep Oct Nov Dec Jan Feb Mar Apr May Jun<br />
Note: Includes General Public and Bayway Isle passes<br />
Graph 4.2<br />
pinellas Bayway system<br />
typical Hourly Weekday transactions<br />
FY 2011<br />
5:00<br />
AM<br />
7:00<br />
AM<br />
9:00<br />
AM<br />
11:00<br />
AM<br />
1:00<br />
PM<br />
Time of Day<br />
3:00<br />
PM<br />
SR 682 SR 679<br />
5:00<br />
PM<br />
7:00<br />
PM<br />
9:00<br />
PM<br />
11:00<br />
PM<br />
Source: Data obtained from <strong>Turnpike</strong> Enterprise Finance Office for the 5-day period beginning<br />
Monday, July 19, 2010.<br />
differentiates between the main east-west traf-<br />
fic on SR 682 and traffic on SR 679 traveling to Fort<br />
DeSoto Park. The majority of the transactions occur<br />
at the two plazas on SR 682, with a much smaller<br />
percentage occurring at the plaza on SR 679. As<br />
indicated, the travel demand on the facility quickly<br />
builds during the early morning hours and remains<br />
steady throughout the midday hours. Typical weekday<br />
traffic volumes peak in the early evening hours<br />
and quickly subside after 6:00 p.m., showing that the<br />
Pinellas Bayway System serves both commuter traffic<br />
and traffic related to the recreational beach activity<br />
in the area.<br />
The monthly transaction variation in FY 2011 is illus-<br />
trated in table 4.4. Annual average daily traffic<br />
(AADT) on the Pinellas Bayway System for FY 2011 was<br />
approximately 25,300. The peak season occurred<br />
from March through May, with April traffic exceeding<br />
the average by 24 percent. This transaction level<br />
is expected since traffic during this period in westcentral<br />
Florida tends to exceed the average due to<br />
tourists and seasonal residents. December transactions<br />
are 19 percent below the yearly average as a<br />
result of fewer tourists and seasonal residents in the<br />
area.<br />
table 4.4<br />
pinellas Bayway system<br />
seasonal transaction Variation<br />
FY 2011<br />
Month<br />
Average<br />
Daily<br />
Transactions Seasonal<br />
Factor<br />
July 2010 25,200 1.00<br />
August 22,900 0.91<br />
September 22,600 0.89<br />
October 24,000 0.95<br />
November 22,800 0.90<br />
December 20,400 0.81<br />
January 2011 22,400 0.89<br />
February 27,500 1.09<br />
March 31,200 1.23<br />
April 31,300 1.24<br />
May 27,900 1.10<br />
June 25,300 1.00<br />
AADT 25,300 1.00<br />
54 Pinellas Bayway System<br />
FY 2011 Annual Report
The FY 2011 two-way AADT profile for the facility is<br />
presented in Figure 4.2. The AADT at the East, West<br />
and South plazas during FY 2011 was 28,200, 18,400<br />
and 4,000, respectively. The East Plaza experiences<br />
the highest traffic volumes, while the number of drivers<br />
traveling to Fort DeSoto Park through the South<br />
Location<br />
Figure 4.2<br />
Pinellas Bayway System<br />
Two-way AADT Profile<br />
FY 2011<br />
Passenger<br />
Car Toll AADT<br />
Pinellas Bayway East $0.50 To Beaches 28,200<br />
Pinellas Bayway West $0.50 18,400<br />
Pinellas Bayway South $0.35 4,000<br />
N<br />
To I-275<br />
To Fort DeSoto<br />
Plaza is the lowest of the three plazas. The sum of<br />
the two-way volumes for the three tolled locations is<br />
double that of the one-way volume shown in table<br />
4.4. Paying-transactions averaged 25,300 per day<br />
and the total two-way traffic volumes for the three<br />
locations averaged approximately 50,600 vehicles<br />
per day.<br />
The traffic and revenue contributions from trucks on<br />
the Pinellas Bayway System are shown in Graph 4.3.<br />
For FY 2011, trucks accounted for approximately 1<br />
percent of the traffic on the facility and 4 percent<br />
of the revenue. In terms of annual revenue contributions,<br />
vehicles with three or more axles accounted<br />
for approximately $0.1 million while two-axle vehicles<br />
comprised the remaining $3.5 million.<br />
Additional Axles<br />
Additional Axles<br />
Florida <strong>Department</strong> of Transportation<br />
EntErprisE toll opErations<br />
Revenue Contribution by Axle Class<br />
FY 2011<br />
Graph 4.4 shows multi-axle vehicle transactions by<br />
plaza. As shown, the west plaza had the highest<br />
amount of truck traffic in FY 2011. As indicated, the<br />
majority of multi-axle vehicles on the Pinellas Bayway<br />
FY 2011 Annual Report Pinellas Bayway System<br />
140,000<br />
120,000<br />
100,000<br />
80,000<br />
60,000<br />
40,000<br />
20,000<br />
0<br />
Graph 4.3<br />
Pinellas Bayway System<br />
Transactions by Axle Class<br />
FY 2011<br />
1%<br />
4%<br />
99%<br />
96%<br />
West Plaza East Plaza South Plaza Total<br />
3, 4 Axle 5+ Axle<br />
Two Axles<br />
Two Axles<br />
Graph 4.4<br />
pinellas Bayway system<br />
Multi-axle Vehicle transactions by plaza<br />
FY 2011<br />
55
Florida <strong>Department</strong> of Transportation<br />
EntErprisE toll opErations<br />
System are 3 and 4 axles. This is due to a large per-<br />
centage of customers using the facility for recre-<br />
ational activities such as boating.<br />
4.3 SunPass<br />
Travel on the Pinellas Bayway System has become<br />
more convenient with the implementation of SunPass<br />
on June 6, 2000. During the conversion to SunPass,<br />
electronic toll collection equipment was installed at<br />
each of the three toll plazas. While one lane at the<br />
East Plaza was converted to a dedicated SunPass<br />
lane, all other lanes were retrofitted with SunPass<br />
equipment and are designated as mixed-use lanes,<br />
accommodating both cash and SunPass transactions<br />
(see appendix a for the lane configuration).<br />
Concurrent with the implementation of SunPass, the<br />
Bayway Isle decal and the General Public decal<br />
were discontinued on June 30, 2000 and September<br />
30, 2000, respectively. However, the discount program<br />
remains as annual passes are still issued. Under<br />
SunPass, a Bayway Isle resident pays $15 annually,<br />
allowing residents unlimited passage through the<br />
northeast toll plaza. The Bayway Isle annual pass,<br />
which was authorized at the time of the original construction<br />
of the facility, is sold in June of each year<br />
and expires on the first day of July of the following<br />
year (e.g., drivers who purchase a pass at the beginning<br />
of March will have only four months to use the<br />
pass before it expires). Likewise, the general public<br />
may purchase a pass for unlimited usage of the<br />
Pinellas Bayway System for an annual rate of $50. The<br />
General Public annual pass, which was authorized in<br />
1985 pursuant to legislation, is sold in September of<br />
each year and expires on the first day of October<br />
of the following year. In FY 2011, there were approximately<br />
10,395 General Public and 708 Bayway Isle<br />
passes sold.<br />
In FY 2011, approximately 2.8 million transactions or<br />
53.4 percent of all SunPass transactions on the Pinellas<br />
Bayway System were attributable to pass usage.<br />
Correspondingly, annual pass sales accounted for<br />
$515 thousand or 30.5 percent of total SunPass revenue.<br />
With an average toll of $0.183 for pass transactions,<br />
the annual pass program provided a combined<br />
savings of approximately $854 thousand to<br />
pass holders.<br />
For those SunPass customers who do not participate<br />
in the Bayway Isle or General Public pass programs,<br />
a standard 10 percent discount is offered when a<br />
threshold of 40 transactions per month is reached.<br />
Transactions for SunPass customers with multi-axle<br />
vehicles on the Sunshine Skyway Bridge also count<br />
toward this minimum threshold. The FY 2011 total<br />
for the discount program was approximately $15.2<br />
thousand.<br />
table 4.5 shows transactions by payment method<br />
on the facility. SunPass transactions increased from<br />
approximately 54 percent of total transactions in FY<br />
2010 to 56 percent of total transactions in FY 2011.<br />
Non-SunPass transactions constituted the remaining<br />
44 percent of transactions in FY 2011. Monthly SunPass<br />
participation percentages ranged from approximately<br />
53 percent to nearly 62 percent during the<br />
year. In general, SunPass participation is highest during<br />
off season months as a result of fewer tourists and<br />
56 Pinellas Bayway System<br />
FY 2011 Annual Report
Month<br />
table 4.5<br />
pinellas Bayway system<br />
transactions by payment Method<br />
FY 2011<br />
SunPass<br />
Transactions (000)<br />
Non-<br />
SunPass Total<br />
Percent<br />
SunPass<br />
July 2010 412 369 781 52.8%<br />
August 394 314 708 55.6<br />
September 391 286 677 57.8<br />
October 412 333 745 55.3<br />
November 403 282 685 58.8<br />
December 388 244 632 61.4<br />
January 2011 428 268 696 61.5<br />
February 439 332 771 56.9<br />
March 510 457 967 52.7<br />
April 499 441 940 53.1<br />
May 474 391 865 54.8<br />
June 423 335 758 55.8<br />
Total 5,173 4,052 9,225<br />
Percentage 56.1% 43.9% 100.0%<br />
Source: <strong>Turnpike</strong> Enterprise Finance Office.<br />
Notes: General Public and Bayway Isle passes are included in the SunPass<br />
Program. Cash transactions represent toll-paying and non-revenue<br />
transactions.<br />
seasonal residents, indicating that more commuters<br />
using SunPass travel on the facility during this time.<br />
table 4.6 shows SunPass transactions by payment<br />
method. As previously mentioned, pass usage on<br />
the Pinellas Bayway System accounted for 53.4 percent<br />
of all SunPass transactions.<br />
table 4.6<br />
pinellas Bayway system<br />
sunpass transactions by payment Method<br />
FY 2011<br />
Month<br />
Transactions (000)<br />
General<br />
Public Pass Bayway<br />
Isle Pass<br />
Regular<br />
SunPass<br />
Total<br />
July 2010 194 11 207 412<br />
August 196 12 186 394<br />
September 200 12 179 391<br />
October 186 14 212 412<br />
November 210 15 178 403<br />
December 213 15 160 388<br />
January 2011 234 16 178 428<br />
February 238 16 185 439<br />
March 260 17 233 510<br />
April 241 16 242 499<br />
May 220 14 240 474<br />
June 197 13 213 423<br />
Total 2,589 171 2,413 5,173<br />
Percentage 50.0% 3.3% 46.7% 100.0%<br />
Source: <strong>Turnpike</strong> Enterprise Finance Office<br />
Florida <strong>Department</strong> of Transportation<br />
EntErprisE toll opErations<br />
table 4.7 shows gross toll revenue by payment<br />
method. SunPass accounted for approximately<br />
46.7 percent of the total revenue in FY 2011. Correspondingly,<br />
non-SunPass payments totaled 53.3 percent.<br />
Monthly revenues are influenced by annual<br />
pass sales. As previously mentioned, General Public<br />
annual passes are primarily sold in September and<br />
October, and as a result, approximately 70 percent<br />
of revenue for the month of September is attributable<br />
to SunPass. After November, sales drop significantly<br />
and the SunPass contribution was 45 percent<br />
or lower for all months other than September, Octo-<br />
table 4.7<br />
pinellas Bayway system<br />
Gross toll revenue by payment Method<br />
FY 2011<br />
SunPass<br />
Non-<br />
SunPass Total<br />
ber and November. The contribution to revenue from<br />
the Bayway Isle annual pass, with yearly renewal in<br />
June, is negligible.<br />
4.4 NOTEWORTHY EVENTS<br />
In FY 2012, construction will begin on the replacement<br />
of the bridge along Pinellas Bayway (SR. 682).<br />
The new high level bridge will increase the traffic<br />
capacity between the west toll plaza and S.R. 679 by<br />
adding two additional travel lanes. The construction<br />
FY 2011 Annual Report Pinellas Bayway System<br />
Month<br />
Gross Toll Revenue ($000)<br />
Percent<br />
SunPass<br />
July 2010 $104 $174 $278 37.4%<br />
August<br />
September<br />
91 148 239 38.1<br />
(1)<br />
324 136 460 70.4<br />
October 269 156 425 63.3<br />
November 122 135 257 47.5<br />
December 96 119 215 44.7<br />
January 2011 105 128 233 45.1<br />
February 101 159 260 38.8<br />
March 119 216 335 35.5<br />
April 121 208 329 36.8<br />
May 121 182 303 39.9<br />
June (2)<br />
112 159 271 41.3<br />
Total $1,685 $1,920 $3,605<br />
Percentage 46.7% 53.3% 100.0%<br />
Source: FDOT Office of the Comptroller (Annual Toll Revenue) and <strong>Turnpike</strong><br />
Enterprise Finance Office.<br />
Note: General Public and Bayway Isle passes are included in the SunPass program.<br />
(1) General Public passes are sold in September.<br />
(2) Bayway Isle passes are sold in June.<br />
57
Florida <strong>Department</strong> of Transportation<br />
EntErprisE toll opErations<br />
also includes the reconstruction and resurfacing of<br />
a portion of S. R. 682 from S.R. 699 to the west toll<br />
plaza. New signing, lighting and landscaping will<br />
also be added along the entire 1.3 mile length of<br />
the bridge.<br />
The 2007 Legislature amended Section 338.165,<br />
Florida Statutes, to require the <strong>Turnpike</strong> System and<br />
other FDOT-owned facilities to index toll rates on<br />
existing toll facilities to the annual Consumer Price<br />
Index (CPI) or similar inflation indicator effective as<br />
of July 1, 2007. Toll rate adjustments for inflation may<br />
be made no more frequently than once a year and<br />
must be made no less frequently than once every<br />
five years as necessary to accommodate cash toll<br />
rate schedules. Pursuant to this requirement, effective<br />
no later than July 1, 2012 (FY 2013), the two-axle<br />
cash toll collected at the east and west plazas on<br />
the Pinellas Bayway System will increase to $0.75 and<br />
the SunPass toll will remain at the current $0.50. The<br />
two-axle cash toll at the south plaza will increase to<br />
$0.50 and the SunPass toll will be a quarter less. The<br />
General Public Pass and Bayway Isles Pass were not<br />
adopted in the toll rate rule and will not be indexed.<br />
In order to facilitate public involvement, the <strong>Turnpike</strong><br />
conducted an indexing workshop on September 13,<br />
2011 and also a public hearing on October 25, 2011 in<br />
Tampa, FL. The indexing workshop and public hearing<br />
were also available through a webinar for those<br />
unable to attend in person. A detailed description of<br />
the indexing methodology used to calculate the toll<br />
rate increase is included in the Executive summary<br />
chapter of this report.<br />
4.5 FY 2011 Expenses and Liabilities<br />
A comparison between actual and budgeted<br />
operating and routine maintenance expenses for<br />
FY 2011 is presented in table 4.8. Actual operating<br />
expenses were approximately 12.9 percent, or $268<br />
thousand, less than the FY 2011 budget primarily due<br />
to lower costs associated with toll plaza operating<br />
contracts, salaries and insurance premiums. Actual<br />
table 4.8<br />
pinellas Bayway system<br />
operating and routine Maintenance<br />
Expenses ($000)<br />
FY 2011<br />
Type of Expense Budget Actual<br />
routine maintenance expenses were less than the FY<br />
2011 budget by 1.1 percent, or $8 thousand due to<br />
lower than anticipated costs associated with bridge<br />
inspections. Overall, FY 2011 actual operating and<br />
routine maintenance expenses were approximately<br />
9.8 percent below the FY 2011 budget.<br />
The Pinellas Bayway System has a liability that is<br />
payable to the <strong>Department</strong>. This liability was set up<br />
to defer both routine and periodic maintenance<br />
expenses until the completion of the adopted<br />
improvement projects required by law (see section<br />
4.7). Since retirement of the bonds, maintenance<br />
and renewal and replacement expenses are added<br />
to the liability.<br />
An analysis of the FY 2011 long-term liability on the<br />
facility is presented in table 4.9. In addition to routine<br />
maintenance, approximately $121 thousand of capital<br />
improvement (periodic) expenses were incurred.<br />
An additional $28.5 thousand reported as capitalized<br />
improvement costs was operating in nature and<br />
therefore, not deferred (e.g., costs were recouped<br />
from toll revenue).<br />
Transaction<br />
Balance, beginning of year<br />
Maintenance<br />
Additions<br />
table 4.9<br />
pinellas Bayway system<br />
long-term liability ($000)<br />
FY 2011<br />
Balance, end of year<br />
Source: FDOT Office of the Comptroller.<br />
Over/<br />
(Under) Variance<br />
Operating $2,070 $1,802 ($268) (12.9%)<br />
Routine Maintenance 755 747 (8) (1.1)<br />
Total $2,825 $2,549 ($276) (9.8%)<br />
Source: FDOT Office of the Comptroller, <strong>Turnpike</strong> Enterprise Finance Office and the FY<br />
2010 Enterprise Toll Operations Traffic Engineer’s Annual Report.<br />
Amount<br />
$34,602<br />
Routine 747<br />
Periodic 121<br />
$35,470<br />
58 Pinellas Bayway System<br />
FY 2011 Annual Report
4.6 Traffic, Revenue and Expense<br />
Forecasts<br />
The ratio between historical traffic growth and population<br />
growth was used along with projected population<br />
growth to estimate future traffic growth on the<br />
Pinellas Bayway System. Historical population growth<br />
focused on Pinellas County, which has a significant<br />
impact on the facility.<br />
From FY 2001 through FY 2011, the annual traffic<br />
growth rate on the Pinellas Bayway System was<br />
negative at -0.6 percent, whereas, the historical<br />
annual population growth rate for the same period<br />
has shown no growth. Additionally, over the past<br />
few years traffic growth has started to decline as a<br />
result of the economic recession. According to an<br />
economic study prepared by Fishkind & Associates,<br />
Inc., Florida’s economic recovery over the next 10<br />
years would not achieve growth rates as high as<br />
those seen in the years leading up to the recession.<br />
Future population estimates have been calculated<br />
based on medium projections from the most recent<br />
publication by the Bureau of Economic and Business<br />
Research (BEBR), College of Business Administration<br />
at the University of Florida. The corresponding<br />
estimated annual population growth rate through<br />
2020 for Pinellas County is 0.2 percent. (Historical<br />
and projected population growth rates for Pinellas<br />
County were previously shown in table 1.4.) The historical<br />
ratio of traffic growth to population growth<br />
was applied to projected population growth rates<br />
to obtain a general guideline to estimate future<br />
annual traffic growth on the Pinellas Bayway System.<br />
Given the built-out nature of Pinellas County and the<br />
future low population growth estimates, for the tenyear<br />
forecast period, traffic is estimated to grow at<br />
0.1 percent on an annual basis. Traffic profiles are<br />
provided in appendix B, showing two-way AADT on<br />
each segment of the system, for FY 2011 through FY<br />
2022.<br />
Florida <strong>Department</strong> of Transportation<br />
EntErprisE toll opErations<br />
The traffic and gross toll revenue forecasts for FY 2012<br />
through FY 2022 are shown in table 4.10. The forecast<br />
table includes the impact that indexing will have on<br />
revenue. The gross toll revenue forecast for this tenyear<br />
period was increased from the forecast presented<br />
in the 2010 Annual Report due to the indexing<br />
of toll rates, which will begin in FY 2013. Transactions<br />
in FY 2013 and FY 2018 are expected to decrease<br />
slightly as a result of indexing. A summary of the<br />
economic factors affecting traffic and revenue is<br />
included in the overview chapter of this report. In<br />
addition, appendix a includes future indexed toll<br />
rate schedules.<br />
Projected operating and maintenance expenses<br />
during the same forecast period are shown in table<br />
4.11. The operating expenses in FY 2012 represent the<br />
budget in the amount of approximately $2.0 million.<br />
(appendix C contains a detailed description of the<br />
FY 2012 operating expense budget.) Estimated FY<br />
2012 operating expenses increased approximately<br />
$201 thousand over actual FY 2011 levels due, in part,<br />
to an expected increase in toll equipment maintenance<br />
and repair costs. Subsequent to FY 2012,<br />
operating expenses are projected to grow at 3.5<br />
percent annually. The routine maintenance expense<br />
forecast is based on Asset Maintenance Contract<br />
FY 2011 Annual Report Pinellas Bayway System<br />
Fiscal<br />
Year<br />
table 4.10<br />
pinellas Bayway system<br />
Traffic and Gross Toll Revenue Forecasts<br />
FY 2012 through FY 2022<br />
Total<br />
Traffic<br />
Toll Revenue ($000) Toll Revenue Comparisons ( $000)<br />
Revenue<br />
with<br />
Constant<br />
Tolls Amount Percent<br />
(1)<br />
SunPass<br />
Indexing Discount<br />
Gross<br />
Toll<br />
2010<br />
Annual<br />
Report<br />
Variance<br />
Impact Impact Revenue Forecast<br />
2012 9,283 $3,656 N/A $17 $3,639 $3,553 $86 2.4%<br />
2013 9,200 3,694 $676 18 4,352 3,588 764 21.3<br />
2014 9,239 3,727 652 18 4,361 3,621 740 20.4<br />
2015 9,267 3,752 633 17 4,368 3,646 722 19.8<br />
2016 9,288 3,774 621 17 4,378 3,668 710 19.4<br />
2017 9,311 3,793 614 17 4,390 3,686 704 19.1<br />
2018 9,222 3,812 904 17 4,699 3,704 995 26.9<br />
2019 9,250 3,831 914 17 4,728 3,723 1,005 27.0<br />
2020 9,273 3,850 927 17 4,760 3,741 1,019 27.2<br />
2021 9,310 3,870 968 18 4,820 3,761 1,059 28.2<br />
2022 9,350 3,889 1,013 18 4,884 N/A N/A N/A<br />
Note: Total traffic corresponds to the gross toll revenue.<br />
N/A The FY 2010 Traffic Engineer's Annual Report forecast went through FY 2021.<br />
(1) Toll revenue forecast without indexing.<br />
59
Florida <strong>Department</strong> of Transportation<br />
EntErprisE toll opErations<br />
Fiscal<br />
Year<br />
table 4.11<br />
pinellas Bayway system<br />
projected operating and Maintenance<br />
Expenses ($000)<br />
FY 2012 through FY 2022<br />
Operating<br />
Expense<br />
Maintenance Expenses<br />
Routine Periodic (1)<br />
Total O&M<br />
Expenses<br />
2012 $2,003 $783 $523 $3,309<br />
2013 2,073 793 2,999 5,865<br />
2014 2,146 807 2,688 5,641<br />
2015 2,221 811 1,516 4,548<br />
2016 2,298 811 853 3,962<br />
2017 2,379 834 883 4,096<br />
2018 2,462 863 914 4,239<br />
2019 2,548 893 946 4,387<br />
2020 2,638 924 979 4,541<br />
2021 2,730 957 1,013 4,700<br />
2022 2,825 990 1,048 4,863<br />
Note: Operating expenses are based on the budget developed by <strong>Turnpike</strong> Enterprise<br />
Finance Office for FY 2012.<br />
(1) Periodic maintenance expenses include expenditures for toll plaza renovations,<br />
-<br />
replacement of the west toll plaza, SunPass dedicated lane extension at the main<br />
plaza and various other improvements as part of the 5 year Work Program and<br />
are reported on a cash basis. Periodic maintenance expenses beyond FY 2016<br />
have not been fully programmed, however, a minimum level of preservation<br />
(excluding extraordinary expenses such as resurfacing, etc.) has been estimated<br />
based on historical costs.<br />
expenses programmed in work program through FY<br />
2017. Subsequent to FY 2017, routine maintenance<br />
expenses were increased at 3.5 percent annually.<br />
In addition, estimated costs for work not performed<br />
under the Asset Maintenance Contract are based<br />
on FY 2011 results increased for inflation at 3.5 percent<br />
annually.<br />
Periodic maintenance expenses are based on information<br />
provided by the Office of Financial Development<br />
for the 5-year Work Program.<br />
4.7 Reserve Construction Account<br />
Pursuant to legislation passed in 1985 (Chapter<br />
85-364, Laws of Florida) and revised in 1995 (Chapter<br />
95-382, Laws of Florida), toll collection on the Pinellas<br />
Bayway System has continued since the retirement<br />
of all outstanding bonds. Tolls collected were designated<br />
by the legislation for certain improvement<br />
projects: Phase I construction, Phase II construction<br />
and the Blind Pass Road widening. table 4.12 shows<br />
the status of the costs related to the Phase II construction<br />
and the Blind Pass Road widening as of<br />
June 30, 2011.<br />
table 4.12<br />
pinellas Bayway system<br />
Financial status of Construction<br />
projects ($000)<br />
Project<br />
As indicated in Figure 4.3, the Phase II and Blind Pass<br />
Road projects are being funded by a reserve con-<br />
struction account established by the <strong>Department</strong><br />
to accumulate toll revenues after the payment of<br />
operating expenses. During FY 1995, the <strong>Department</strong><br />
entered into an agreement with the <strong>Department</strong> of<br />
Financial Services, Division of Treasury, to maintain<br />
and invest the reserve construction account. All<br />
interest earnings accumulate in this account and<br />
assist in funding the projects.<br />
Figure 4.3<br />
Flow of Funds<br />
Pinellas Bayway System<br />
Toll Revenue<br />
State Transportation Trust Fund<br />
Current Operating Costs<br />
Estimated<br />
Project<br />
Cost<br />
Source: FDOT Office of Financial Development.<br />
Reserve Construction Account<br />
(Blind Pass Road & Phase II Construction)<br />
Deferred Maintenance & Other Improvements<br />
(Long-Term Debt Due STTF)<br />
Cumulative<br />
Disbursements<br />
through<br />
June 30, 2011<br />
Blind Pass Road $19,633 $18,470<br />
Phase II 51,944 5,854<br />
Total $71,577 $24,324<br />
Interest Earnings<br />
60 Pinellas Bayway System<br />
FY 2011 Annual Report
A summary of the activity in the reserve account<br />
during FY 2011 is shown in table 4.13. Additions to the<br />
reserve account primarily consist of net toll revenues<br />
(toll revenues less operating expenses) and interest<br />
earnings on the account. Reductions are reimbursements<br />
to the State Transportation Trust Fund related<br />
to the Blind Pass Road and Phase II construction<br />
projects.<br />
table 4.13<br />
pinellas Bayway system<br />
analysis of reserve Construction<br />
account ($000)<br />
FY 2011<br />
Transaction<br />
Balance, beginning of year<br />
Additions (net of FY 2011 Operating Costs)<br />
Reductions Phase II Construction<br />
Amount<br />
$43,448<br />
748<br />
480<br />
Balance, end of year $43,716<br />
Source: FDOT Office of the Comptroller (reported on a cash basis).<br />
Florida <strong>Department</strong> of Transportation<br />
EntErprisE toll opErations<br />
FY 2011 Annual Report Pinellas Bayway System<br />
61
Florida <strong>Department</strong> of Transportation<br />
EntErprisE toll opErations<br />
tHis paGE intEntionallY lEFt BlanK<br />
62 Pinellas Bayway System<br />
FY 2011 Annual Report
Su n S h i n e Sk y w a y Br i d g e<br />
5.1 Background<br />
The original Sunshine Skyway Bridge opened in 1954<br />
and was constructed as a two-lane toll project crossing<br />
Tampa Bay from US 19 at Maximo Point in Pinellas<br />
County to US 41, north of Palmetto in Manatee<br />
County. The facility was 15.1 miles in length and consisted<br />
of 10.2 miles of embankment and five bridges<br />
having a combined length of 4.9 miles. The facility<br />
underwent an expansion project to add two additional<br />
lanes on the existing causeways, an additional<br />
two-lane trestle bridge and a high-level bridge parallel<br />
to the existing main bridge span that opened in<br />
1970.<br />
Over the years, several accidents occurred, involving<br />
maritime shipping freighters traversing the channel<br />
between Tampa Bay and the Gulf of Mexico. These<br />
accidents were attributed, in part, to the positioning<br />
of the piers of the high-level structure over the navigation<br />
channel. On May 9, 1980, a freighter collided<br />
with one of the piers of the main span structure carrying<br />
the southbound roadway, causing a section of<br />
the center span to collapse into Tampa Bay. In order<br />
to maximize safe vehicular and maritime passage in<br />
the area, the <strong>Department</strong> constructed the new<br />
Florida <strong>Department</strong> of Transportation<br />
EntErprisE toll opErations<br />
Sunshine Skyway Bridge as a single four-lane highlevel<br />
structure, east of the original bridge, providing<br />
greater horizontal clearances between the main<br />
piers and an increased vertical height. The new<br />
17.4-mile bridge opened to traffic in 1987 with one<br />
mainline plaza located at each end of the facility.<br />
The new bridge consists of 13.3 miles of embankment<br />
and causeway, which makes the actual<br />
bridge approximately 4.1 miles in length. The cost<br />
to replace the bridge was approximately $232 million.<br />
Funds to replace the bridge were provided<br />
from various sources including insurance recoveries,<br />
federal emergency relief and interstate funds,<br />
state funds and a $36 million bond issue in 1984. In<br />
honor of former Florida governor, Bob Graham, who<br />
spearheaded the state-of-the-art design of the new<br />
bridge, the Sunshine Skyway Bridge was designated<br />
the Bob Graham Sunshine Skyway Bridge effective<br />
July 1, 2005 (FY 2006) with the signing of House Bill<br />
385.<br />
Tolls at the northern plaza in Pinellas County are col-<br />
lected in the southbound direction only, while tolls<br />
at the southern plaza in Manatee County are collected<br />
in the northbound direction. The current toll<br />
on the facility for passenger cars and other two-axle<br />
vehicles is $1.00. Drivers of two-axle vehicles with a<br />
SunPass transponder receive an immediate, in-lane,<br />
25 percent discount. Tolls for three or more axle vehicles<br />
are calculated based on a per-axle basis and<br />
increase at the rate of $0.50 per axle. The bridge is<br />
part of the FIHS (Florida Intrastate Highway System),<br />
designated as I-275, and is managed and operated<br />
by the <strong>Department</strong>. The <strong>Department</strong> provides for toll<br />
collection and maintenance of the facility, but may<br />
assign or contract these operations to a third party.<br />
Figure 5.1 shows a detailed map of the facility.<br />
FY 2011 Annual Report Sunshine Skyway Bridge<br />
63
Florida <strong>Department</strong> of Transportation<br />
EntErprisE toll opErations<br />
Historically, traffic and revenue on the Sunshine Sky-<br />
way Bridge have increased over the years. In FY 2001,<br />
total transactions were approximately 15.5 million,<br />
and toll revenues were approximately $15.4 million.<br />
In FY 2011, total transactions increased to 18.0 million,<br />
while toll revenues increased to approximately<br />
$16.4 million. Annual transactions and revenue for<br />
the facility from FY 2001 through FY 2011 are presented<br />
in table 5.1. Over the course of the past 10<br />
years, traffic on the facility has grown at an annual<br />
compounded rate of 1.5 percent. Correspondingly,<br />
toll revenues have increased by 0.7 percent annually.<br />
The decline in traffic and revenue in FY 2008 and<br />
FY 2009 can primarily be attributed to the economic<br />
recession. Compared to FY 2010, FY 2011 transactions<br />
increased by approximately 1.2 percent, while<br />
revenues increased by 0.7 percent. This minimal<br />
growth is due to the continued affects of the recession.<br />
The economic factors affecting traffic and revenue<br />
are discussed further in the overview chapter<br />
of this report.<br />
Fiscal<br />
Year<br />
Toll<br />
Paying<br />
table 5.1<br />
sunshine skyway Bridge<br />
Historical transactions and revenue Growth<br />
FY 2001 through FY 2011<br />
Transactions (000) Toll Revenue (1) ($000)<br />
Non<br />
Revenue Total<br />
Percent<br />
Change Amount<br />
Historical operating and routine maintenance<br />
expenses from FY 2001 through FY 2011 are presented<br />
in table 5.2. Operating expenses have increased<br />
from $2.2 million in FY 2001 to $5.1 million in FY 2011.<br />
Percent<br />
Change<br />
2001 15,486 30 15,516 - $15,379 - $0.991<br />
2002 16,015 35 16,050 3.4% 15,933 3.6% 0.993<br />
2003 16,463 43 16,506 2.8 16,251 2.0 0.985<br />
2004 17,682 42 17,724 7.4 17,230 6.0 0.972<br />
2005 17,708 397 18,105 2.1 17,053 (1.0) 0.942<br />
2006 18,694 30 18,724 3.4 17,798 4.4 0.951<br />
2007 18,748 12 18,760 0.2 17,758 (0.2) 0.947<br />
2008 18,192 15 18,207 (2.9) 17,025 (4.1) 0.935<br />
2009 17,607 32 17,639 (3.1) 16,212 (4.8) 0.919<br />
2010 17,764 22 17,786 0.8 16,310 0.6 0.917<br />
2011 17,974 31 18,005 1.2 16,427 0.7 0.912<br />
Source: FDOT Office of the Comptroller and <strong>Turnpike</strong> Enterprise Finance Office.<br />
Note: The non-revenue class includes authorized vehicles that pass through a toll plaza without incurring a toll<br />
(i.e., law enforcement, emergency vehicles) and transactions reported during toll suspensions attributable<br />
to hurricanes.<br />
(1) Toll revenue reported net of the SunPass discount since FY 2001.<br />
This increase represents an annual compounded<br />
growth rate of 8.8 percent. The significant increase<br />
in operating expenses from $3.9 million in FY 2006<br />
to over $5.3 million in FY 2007 is due to an increase<br />
in insurance costs after the FY 2006<br />
hurricane season. FY 2011 operating<br />
expenses increased $281 thousand, or<br />
5.9 percent, from FY 2010. This increase<br />
was primarily related to an increase in<br />
Average toll plaza operating contract costs,<br />
Toll<br />
credit card fees, transponder purchases<br />
and toll equipment repair and<br />
maitenance.<br />
Beginning in February 2004, inspec-<br />
tion and maintenance of the Sunshine<br />
Skyway Bridge is performed under<br />
a private Asset Maintenance Contract<br />
with the <strong>Department</strong> providing<br />
oversight through its Asset Management<br />
Coordinator. FY 2011 routine<br />
maintenance expenses increased<br />
57.1 percent over FY 2010 levels primarily due to an<br />
increase in the amount of work performed under<br />
the Asset Maintenance Contract, specifically the biennial<br />
bridge inspection costs. Total operating and<br />
64 Sunshine Skyway Bridge<br />
FY 2011 Annual Report<br />
Fiscal<br />
Year<br />
table 5.2<br />
sunshine skyway Bridge<br />
Historical operating and routine<br />
Maintenance Expenses ($000)<br />
FY 2001 through FY 2011<br />
Operating<br />
Expense<br />
Routine<br />
Maintenance<br />
Expense<br />
Source: FDOT Office of the Comptroller.<br />
Total O&M<br />
Expenses<br />
2001 $2,191 $987 $3,178<br />
2002 3,249 1,233 4,482<br />
2003 3,171 943 4,114<br />
2004 3,683 1,195 4,878<br />
2005 3,395 1,722 5,117<br />
2006 3,879 879 4,758<br />
2007 5,340 1,686 7,026<br />
2008 5,185 1,582 6,767<br />
2009 5,129 2,165 7,294<br />
2010 4,793 1,575 6,368<br />
2011 5,074 2,475 7,549
STATE OF FLORIDA<br />
DEPARTMENT<br />
OF TRANSPORTATION
Florida <strong>Department</strong> of Transportation<br />
EntErprisE toll opErations<br />
routine maintenance expenses on the facility have<br />
increased from $3.2 million in FY 2001 to $7.5 million in<br />
FY 2011. In addition, renewal and replacement and<br />
capital improvement periodic costs totaling $3.9<br />
million were incurred in FY 2011 primarily for bridge<br />
repairs and rehabilitation.<br />
5.2 FY 2011 Transactions and Toll<br />
Revenues<br />
Monthly transactions and toll revenue on the Sunshine<br />
Skyway Bridge during FY 2011 are presented<br />
in table 5.3 for the north and south mainline plazas.<br />
There were approximately 9.1 million transactions at<br />
the north plaza and approximately 8.9 million transactions<br />
at the south plaza, for a total of 18.0 million<br />
transactions during FY 2011. The corresponding<br />
annual revenue was $8.3 million at the north plaza<br />
and $8.1 million at the south plaza, for a total of<br />
approximately $16.4 million during FY 2011. The third<br />
Month<br />
table 5.3<br />
sunshine skyway Bridge<br />
Monthly transactions and toll revenue<br />
FY 2011<br />
North<br />
Plaza<br />
Transactions (000) Toll Revenue ($000)<br />
South<br />
Plaza Total<br />
North<br />
Plaza<br />
South<br />
Plaza Total<br />
July 2010 743 731 1,474 $680 $667 $1,347<br />
August 726 715 1,441 659 648 1,307<br />
September 715 682 1,397 629 614 1,243<br />
1st Quarter Total 2,184 2,128 4,312 1,968 1,929 3,897<br />
October 744 726 1,470 679 660 1,339<br />
November 733 719 1,452 670 656 1,326<br />
December 742 723 1,465 680 660 1,340<br />
2nd Quarter Total 2,219 2,168 4,387 2,029 1,976 4,005<br />
January 2011 738 724 1,462 673 660 1,333<br />
February 758 743 1,501 698 682 1,380<br />
March 897 882 1,779 829 811 1,640<br />
3rd Quarter Total 2,393 2,349 4,742 2,200 2,153 4,353<br />
April 810 800 1,610 745 732 1,477<br />
May 763 751 1,514 699 685 1,384<br />
June 726 714 1,440 662 649 1,311<br />
4th Quarter Total 2,299 2,265 4,564 2,106 2,066 4,172<br />
Annual Total 9,095 8,910 18,005 $8,303 $8,124 $16,427<br />
Source: FDOT Office of the Comptroller (Annual Toll Revenue) and <strong>Turnpike</strong> Enterprise Finance Office.<br />
Note: Transactions represent toll-paying and non-revenue traffic at mainline plazas.<br />
quarter experienced the largest amount of transac-<br />
tions and revenue in FY 2011, with March being the<br />
busiest month.<br />
Graph 5.1 shows the number of hourly weekday and<br />
weekend transactions of a typical week during FY<br />
2011 for both northbound and southbound traffic.<br />
During weekdays from 7:00 a.m. to 7:00 p.m. traffic<br />
levels are over 2,500 vehicles per hour. The weekday<br />
traffic on the facility has a morning peak from 7:00<br />
a.m. to 10:00 a.m. and an evening peak from 4:00<br />
p.m. to 7:00 p.m., reflecting the presence of commuters<br />
on the facility. On weekends, there is no<br />
clear morning or evening peak periods indicating<br />
that a large number of non-commuters use the<br />
facility (e.g., interstate travel influence).<br />
The FY 2011 monthly transaction variation is analyzed<br />
in table 5.4. Annual average daily transactions<br />
(AADT) on the Sunshine Skyway Bridge for FY<br />
2011 was 49,300. The peak season occurred from<br />
February through April, with March being the highest<br />
month at 16 percent above average for the<br />
facility. This is expected, as traffic during March in<br />
southwest Florida tends to exceed the average due<br />
to tourists and seasonal residents. August and September<br />
were the lowest months at 6 percent below<br />
average. Historically, the month of September has<br />
the fewest transactions.<br />
66 Sunshine Skyway Bridge<br />
FY 2011 Annual Report<br />
Transactions<br />
4,500<br />
4,000<br />
3,500<br />
3,000<br />
2,500<br />
2,000<br />
1,500<br />
1,000<br />
500<br />
0<br />
1:00<br />
AM<br />
3:00<br />
AM<br />
Graph 5.1<br />
sunshine skyway Bridge<br />
typical Hourly transactions<br />
FY 2011<br />
5:00<br />
AM<br />
7:00<br />
AM<br />
9:00<br />
AM<br />
11:00 1:00<br />
AM AM<br />
Time of Day<br />
3:00<br />
PM<br />
5:00<br />
PM<br />
Weekday Weekend<br />
7:00<br />
PM<br />
9:00<br />
PM<br />
11:00<br />
PM<br />
Source: Data obtained from <strong>Turnpike</strong> Enterprise Finance Office for the 7-day period<br />
beginning Monday, May 09, 2011.
Month<br />
table 5.4<br />
sunshine skyway Bridge<br />
seasonal transaction Variation<br />
FY 2011<br />
Average Daily Transactions<br />
North<br />
Plaza<br />
South<br />
Plaza Total<br />
Seasonal<br />
Factor<br />
July 2010 24,000 23,600 47,600 0.97<br />
August 23,400 23,100 46,500 0.94<br />
September 23,800 22,700 46,500 0.94<br />
October 24,000 23,400 47,400 0.96<br />
November 24,400 24,000 48,400 0.98<br />
December 23,900 23,300 47,200 0.96<br />
January 2011 23,800 23,400 47,200 0.96<br />
February 27,100 26,500 53,600 1.09<br />
March 28,900 28,500 57,400 1.16<br />
April 27,000 26,700 53,700 1.09<br />
May 24,600 24,200 48,800 0.99<br />
June 24,200 23,800 48,000 0.97<br />
AADT 24,900 24,400 49,300 1.00<br />
The traffic and revenue contributions from trucks on<br />
the Sunshine Skyway Bridge are shown in Graph 5.2.<br />
For FY 2011, trucks accounted for 3 percent of the<br />
traffic on the facility but accounted for 7 percent of<br />
the total revenue. In terms of actual revenue contributions,<br />
vehicles with three or more axles provided<br />
approximately $1.2 million, while two-axle vehicles<br />
comprised the remaining $15.2 million.<br />
3+ - Axles<br />
3%<br />
3+ - Axles<br />
5.3 SunPass<br />
Florida <strong>Department</strong> of Transportation<br />
EntErprisE toll opErations<br />
Graph 5.2<br />
Sunshine Skyway Bridge<br />
Transactions by Axle Class<br />
FY 2011<br />
Revenue Contribution by Axle Class<br />
FY 2011<br />
SunPass was installed at the north and south plazas<br />
on the Sunshine Skyway Bridge by August 19, 2000<br />
(FY 2001). SunPass implementation included the<br />
conversion of three of the six tolled lanes at each of<br />
the plazas to SunPass. Currently, there is a dedicated<br />
SunPass lane at each plaza and two mixed-use lanes,<br />
serving both cash and SunPass users. The remaining<br />
three lanes at each plaza are currently manned but<br />
will be able to accommodate future conversion to<br />
mixed-use or dedicated SunPass lanes if needed<br />
(see appendix a for the lane configurations).<br />
Historically, the Sunshine Skyway Bridge offered discounts<br />
to drivers in the form of tokens. Until October<br />
2000, tokens were available for two-axle vehicles only<br />
and were sold in rolls of 40 coins for $30 (a revenue<br />
value of $0.75 for each), representing a discount of 25<br />
FY 2011 Annual Report Sunshine Skyway Bridge<br />
7%<br />
97%<br />
93%<br />
Two Axles<br />
Two Axles<br />
67
Florida <strong>Department</strong> of Transportation<br />
EntErprisE toll opErations<br />
percent compared to cash payments. The discount<br />
program now operates through SunPass, and therefore,<br />
cash customers do not receive a discount.<br />
Drivers of two-axle vehicles with a SunPass transpon-<br />
der receive an immediate, in-lane, 25 percent dis-<br />
count. Additionally, SunPass customers with three or<br />
more axle vehicles receive a 10 percent retroactive<br />
discount when they reach a threshold of 40 monthly<br />
toll payments. The Pinellas Bayway System also participates<br />
in the discount program. Drivers who make<br />
toll payments on this facility are credited for these<br />
payments toward the threshold. SunPass discounts<br />
on the Sunshine Skyway Bridge totaled $12 thousand<br />
in FY 2011.<br />
table 5.5 shows the percentage of transactions by<br />
payment method on the Sunshine Skyway Bridge.<br />
Non-SunPass transactions amounted to approximately<br />
9.6 million, or 53 percent of all transactions;<br />
whereas, SunPass transactions totaled nearly 8.5<br />
million, or 47 percent of all transactions on the facility.<br />
Over the course of FY 2011, the monthly SunPass<br />
transaction percentage ranged from approximately<br />
44 to 50 percent.<br />
Month<br />
table 5.5<br />
sunshine skyway Bridge<br />
transactions by payment Method<br />
FY 2011<br />
SunPass<br />
Transactions (000)<br />
Non-<br />
SunPass<br />
Total<br />
Percent<br />
SunPass<br />
July 2010 678 796 1,474 46.0%<br />
August 691 750 1,441 48.0<br />
September 678 719 1,397 48.5<br />
October 702 768 1,470 47.8<br />
November 682 770 1,452 47.0<br />
December 678 787 1,465 46.3<br />
January 2011 688 774 1,462 47.1<br />
February 677 824 1,501 45.1<br />
March 779 1,000 1,779 43.8<br />
April 742 868 1,610 46.1<br />
May 738 776 1,514 48.7<br />
June 717 723 1,440 49.8<br />
Total 8,450 9,555 18,005<br />
Percentage 46.9% 53.1% 100.0%<br />
Source: <strong>Turnpike</strong> Enterprise Finance Office.<br />
Note: Cash transactions represent toll-paying and non-revenue transactions.<br />
Revenue attributable to SunPass was approximately<br />
$6.8 million, representing approximately 42 percent<br />
of the total system revenue in FY 2011. Toll revenue<br />
is reported net of the SunPass discount. Non-SunPass<br />
constituted the remaining 58 percent ($9.6 million)<br />
of revenue. Monthly SunPass revenue percentages<br />
ranged from 39 to approximately 44 percent during<br />
the year. table 5.6 shows the gross toll revenue by<br />
payment method.<br />
table 5.6<br />
sunshine skyway Bridge<br />
Gross toll revenue by payment Method<br />
FY 2011<br />
SunPass<br />
Non-<br />
SunPass Total<br />
5.4 noteworthy events<br />
The 2007 Legislature amended Section 338.165, Florida<br />
Statutes, to require the <strong>Turnpike</strong> System and other<br />
FDOT-owned facilities to index toll rates on existing toll<br />
facilities to the annual Consumer Price Index (CPI) or<br />
similar inflation indicator effective as of July 1, 2007.<br />
Toll rate adjustments for inflation may be made no<br />
more frequently than once a year and must be<br />
made no less frequently than once every five years<br />
as necessary to accommodate cash toll rate schedules.<br />
Pursuant to this requirement, effective no later<br />
than July 1, 2012 (FY 2013), the two-axle cash toll collected<br />
on the Sunshine Skyway Bridge will increase<br />
to $1.25 and the SunPass toll will increase to $1.00. In<br />
order to facilitate public involvement, the <strong>Turnpike</strong><br />
68 Sunshine Skyway Bridge<br />
FY 2011 Annual Report<br />
Month<br />
Gross Toll Revenue ($000)<br />
Percent<br />
SunPass<br />
July 2010 $549 $798 $1,347 40.8%<br />
August 557 750 1,307 42.6<br />
September 547 696 1,243 44.0<br />
October 566 773 1,339 42.3<br />
November 551 775 1,326 41.6<br />
December 546 794 1,340 40.7<br />
January 2011 553 780 1,333 41.5<br />
February 547 833 1,380 39.6<br />
March 632 1,008 1,640 38.5<br />
April 602 875 1,477 40.8<br />
May 599 785 1,384 43.3<br />
June 581 730 1,311 44.3<br />
Total $6,830 $9,597 $16,427<br />
Percentage 41.6% 58.4% 100.0%<br />
Source: FDOT Office of the Comptroller (Annual Toll Revenue) and <strong>Turnpike</strong><br />
Enterprise Finance Office.
conducted an indexing workshop on September 13,<br />
2011 and also a public hearing on October 25, 2011 in<br />
Tampa, FL. The indexing workshop and public hearing<br />
were also available through webinar for those<br />
unable to attend in person. A detailed description of<br />
the indexing methodology used to calculate the toll<br />
rate increase is included in the Executive summary<br />
chapter of this report.<br />
5.5 FY 2011 Expenses and Liabilities<br />
A comparison between actual and budgeted operating<br />
and routine maintenance expenses for FY 2011<br />
is shown in table 5.7.<br />
table 5.7<br />
sunshine skyway Bridge<br />
operating and routine Maintenance Expenses<br />
($000)<br />
FY 2011<br />
Type of Expense Budget Actual<br />
Over/<br />
(Under) Variance<br />
Operating $5,154 $5,074 ($80) (1.6%)<br />
Routine Maintenance 2,367 2,475 108 4.6<br />
Total $7,521 $7,549 $28 0.4%<br />
Source: FDOT Office of the Comptroller, <strong>Turnpike</strong> Enterprise Finance Office and the<br />
FY 2010 Enterprise Toll Operations Traffic Engineer’s Annual Report.<br />
Actual FY 2011 operating expenses were 1.6 percent<br />
lower than the FY 2011 operating budget. This<br />
variance is primarily due to a decrease in insurance<br />
premiums. Routine maintenance expenses were<br />
approximately 4.6 percent higher than the FY 2011<br />
budget amount primarily due to a general increase<br />
in routine maintenance needed on the facility compared<br />
to what was originally budgeted. Overall,<br />
actual FY 2011 operating and routine maintenance<br />
expenses were 0.4 percent more than the budget.<br />
The Sunshine Skyway Bridge has two liabilities that<br />
are payable to the <strong>Department</strong>. Any expenditure for<br />
improvements or new projects on the Sunshine Skyway<br />
Bridge is first added to this liability. Then, net toll<br />
revenues are used to reduce the liability. An analysis<br />
of the FY 2011 liability for facility costs is presented in<br />
table 5.8.<br />
Florida <strong>Department</strong> of Transportation<br />
EntErprisE toll opErations<br />
table 5.8<br />
sunshine skyway Bridge<br />
sttF advances for Facility Costs ($000)<br />
FY 2011<br />
Transaction Amount<br />
Balance, beginning of year $562<br />
Additions (1)<br />
3,916<br />
Reductions (2)<br />
562<br />
Balance, end of year $3,916<br />
Source: FDOT Office of the Comptroller.<br />
(1)<br />
(2)<br />
Additions represent costs incurred in the FY<br />
being reported.<br />
Reductions represent costs from prior FY that<br />
were reimbursed in the FY being reported.<br />
Analysis of the second liability that was established<br />
to defer costs for off-system improvements is pre-<br />
sented in table 5.9. Off-system capital projects,<br />
including the Selmon Crosstown/I-4 connector, SR<br />
64 widening, US 19 interchange and the Manatee<br />
County automated traffic management system will<br />
initially be funded by the STTF. However, pursuant to<br />
Section 338.165 (4), Florida Statutes, the <strong>Department</strong><br />
is authorized to issue bonds backed by Sunshine<br />
Skyway Bridge toll revenues to help fund a portion<br />
of these needed transportation projects located in<br />
Manatee, Hillsborough and Pinellas Counties.<br />
table 5.9<br />
sunshine skyway Bridge<br />
Deferred sttF advances for off-system<br />
improvements ($000)<br />
FY 2011<br />
Transaction Amount<br />
Balance, beginning of year $45,708<br />
Additions 12,350<br />
Reductions 8,558<br />
Balance, end of year $49,500<br />
Source: FDOT Office of the Comptroller.<br />
5.6 Traffic, Revenue and Expense<br />
Forecasts<br />
The ratio between historical traffic growth and population<br />
growth was used along with projected population<br />
growth to estimate future traffic on the Sunshine<br />
Skyway Bridge. Historical population growth focused<br />
FY 2011 Annual Report Sunshine Skyway Bridge<br />
69
Florida <strong>Department</strong> of Transportation<br />
EntErprisE toll opErations<br />
on the five counties that have a significant regional<br />
impact on the facility. These counties are Hillsborough,<br />
Manatee, Pasco, Pinellas and Sarasota. Since<br />
the facility is part of the Florida Intrastate Highway<br />
System (FIHS), the statewide growth in<br />
population was also considered.<br />
From FY 2001 to FY 2011, the annual traf-<br />
fic growth rate on the Sunshine Skyway<br />
Bridge was approximately 1.5 percent, Fiscal<br />
Year<br />
whereas, the historical annual population<br />
growth rate for the same period for<br />
the five counties was 1.2 percent. As<br />
such, traffic growth has been exceeding<br />
population growth by approximately<br />
1.3 times. However, over the<br />
past few years, traffic growth has started<br />
to decline as a result of the economic<br />
recession. According to an economic<br />
study prepared by Fishkind & Associates, Inc., Florida’s<br />
economic recovery over the next 10 years will<br />
not achieve growth rates as high as those seen in the<br />
years leading up to the recession.<br />
Future population estimates have been calculated<br />
based on medium projections from the most recent<br />
publication by the Bureau of Economic and Business<br />
Research (BEBR), College of Business Administration<br />
at the University of Florida. The corresponding estimated<br />
annual population growth rate through 2020<br />
for the five counties is 1.0 percent. (Historical and<br />
projected population growth rates for the five counties<br />
were previously shown in table 1.5.) The historical<br />
ratio of traffic growth to population growth was<br />
applied to projected population growth rates to<br />
obtain a general guideline to estimate future annual<br />
traffic growth on the Sunshine Skyway Bridge. Traffic is<br />
estimated to grow at 1.3 percent on an annual basis.<br />
Traffic profiles are provided in appendix B, showing<br />
two-way AADT on the facility for FY 2011 through FY<br />
2022.<br />
Total<br />
Traffic<br />
The traffic and gross toll revenue forecasts for FY 2012<br />
through FY 2022 are shown in table 5.10. The forecast<br />
table includes the impact that indexing will have on<br />
revenue. The gross toll revenue forecast for this ten-<br />
table 5.10<br />
sunshine skyway Bridge<br />
Traffic and Gross Toll Revenue Forecasts<br />
FY 2012 through FY 2022<br />
Toll Revenue ($000) Toll Revenue Comparisons ( $000)<br />
Revenue<br />
with<br />
Constant<br />
Tolls Amount Percent<br />
(1)<br />
2010<br />
SunPass Gross Annual<br />
Indexing Discount Toll Report<br />
Impact Impact Revenue Forecast<br />
Variance<br />
2012 18,459 $16,848 N/A $13 $16,835 $17,283 ($448) (2.6%)<br />
2013 17,922 17,320 $4,380 14 21,686 17,992 3,694 20.5<br />
2014 18,403 17,770 4,743 14 22,499 18,621 3,878 20.8<br />
2015 18,865 18,197 5,127 15 23,309 19,218 4,091 21.3<br />
2016 19,326 18,616 5,536 16 24,136 19,794 4,342 21.9<br />
2017 19,765 19,007 5,965 16 24,956 20,328 4,628 22.8<br />
2018 19,591 19,388 7,920 17 27,291 20,816 6,475 31.1<br />
2019 19,969 19,756 8,395 17 28,134 21,274 6,860 32.2<br />
2020 20,337 20,132 8,947 18 29,061 21,699 7,362 33.9<br />
2021 20,699 20,496 9,765 20 30,241 22,112 8,129 36.8<br />
2022 21,080 20,865 10,607 21 31,451 N/A N/A N/A<br />
Note: Total traffic corresponds to the gross toll revenue.<br />
N/A The FY 2010 Traffic Engineer's Annual Report forecast went through FY 2021.<br />
(1) Toll revenue forecast without indexing.<br />
year period was increased from the forecast presented<br />
in the 2010 Annual Report due to the indexing<br />
of tolls, which will begin in FY 2013. However, the<br />
revenue forecast for FY 2012 was decreased due to<br />
anticipated slow economic recovery. Transactions<br />
in FY 2013 and FY 2018 are expected to decrease<br />
slightly as a result of indexing. A summary of the<br />
economic factors affecting traffic and revenue is<br />
included in the overview chapter of this report. In<br />
addition, appendix a includes future indexed toll<br />
rate schedules.<br />
The projected operating and maintenance expenses<br />
for FY 2012 through FY 2022 are shown in table 5.11.<br />
The operating expenses in FY 2012 represent the<br />
budget amount for that fiscal year (see appendix C<br />
for a detailed description of the FY 2012 operating<br />
expense budget). The budget amount of $5.2 million<br />
is 2.4 percent higher than FY 2011 actual operating<br />
expenses. The expected increase is due primarily to<br />
an increase in utilities and toll plaza operating contracts.<br />
Subsequent to FY 2012, operating expenses<br />
are projected to grow at 3.5 percent annually to<br />
account for inflation.<br />
70 Sunshine Skyway Bridge<br />
FY 2011 Annual Report
Fiscal<br />
Year<br />
Operating<br />
Expense<br />
Routine<br />
Maintenance<br />
Expense<br />
Total<br />
Operating &<br />
Routine<br />
Maintenance<br />
Expenses<br />
Periodic<br />
Maintenance<br />
Expense (1)<br />
Total O&M<br />
Expenses<br />
2012 $5,194 $1,539 $6,733 $3,042 $9,775<br />
2013 5,376 2,351 7,727 2,762 10,489<br />
2014 5,564 1,748 7,312 3,702 11,014<br />
2015 5,759 2,435 8,194 3,281 11,475<br />
2016 5,960 1,873 7,833 7,752 15,585<br />
2017 6,169 2,608 8,777 4,905 13,682<br />
2018 6,385 2,006 8,391 5,077 13,468<br />
2019 6,608 2,794 9,402 5,254 14,656<br />
2020 6,840 2,149 8,989 5,438 14,427<br />
2021 7,079 2,993 10,072 5,629 15,701<br />
2022 7,327 2,302 9,629 5,826 15,455<br />
Note: Operating expenses are based on the budget developed by the <strong>Turnpike</strong> Enterprise Finance Office<br />
for FY 2012.<br />
(1) Periodic maintenance expenses include bridge repairs, bridge painting, Florida Highway Patrol<br />
services and other <strong>Department</strong>-funded improvements included in the 5-year Work Program and are<br />
reported on a cash basis. Periodic maintenance expenses beyond FY 2015 have not been fully<br />
programmed, however, a minimal level of preservation (excluding extraordinary expenses such as<br />
major bridge repairs) has been estimated based on FY 2015 expenses increased at 3.5 percent<br />
annually.<br />
The routine maintenance expense forecast is based<br />
on the Asset Maintenance Contract through FY<br />
2015. Subsequent to FY 2015, routine maintenance<br />
expenses have been increased 3.5 percent annually<br />
and take into account biennial bridge inspection<br />
expenses. Additional maintenance expenses<br />
not covered under the Asset Maintenance Contract<br />
are budgeted based on actual FY 2011 expenses<br />
increased by 3.5 percent annually.<br />
Periodic maintenance expenses were provided by<br />
the <strong>Department</strong>’s Office of Financial Development<br />
$21.3 million<br />
Revenue<br />
Bonds<br />
table 5.11<br />
sunshine skyway Bridge<br />
projected operating and Maintenance<br />
Expenses ($000)<br />
FY 2012 through FY 2022<br />
Figure 5.2<br />
Sunshine Skyway Bond Issues<br />
Florida <strong>Department</strong> of Transportation<br />
EntErprisE toll opErations<br />
and are based on estimated expenditures for proj-<br />
ects included in the Work Program and include<br />
bridge repairs, bridge painting and other <strong>Department</strong>-funded<br />
improvements.<br />
A timeline of Sunshine Skyway bond issues is shown<br />
in Figure 5.2. On June 30, 2009 (FY 2009) the Sunshine<br />
Skyway Refunding Revenue Bonds, Series 2001<br />
issue was retired; therefore, there are no outstanding<br />
bonds on the Sunshine Skyway at this time.<br />
table 5.12 shows the projected net toll revenues<br />
through FY 2022. Net toll revenues consist of gross toll<br />
revenue less operating expense and routine and peri-<br />
table 5.12<br />
sunshine skyway Bridge<br />
net toll revenue Forecast ($000)<br />
FY 2012 through FY 2022<br />
odic maintenance expenses.<br />
The projected net revenues for<br />
the facility are estimated to<br />
increase from $7.1 million in FY<br />
2012 to $16.0 million in FY 2022.<br />
Net revenues are currently<br />
being used to reimburse STTF for<br />
system related costs and nonsystem<br />
related costs (long term<br />
debt).<br />
FY 2011 Annual Report Sunshine Skyway Bridge<br />
Fiscal<br />
Year<br />
1951 1966 1984 1986 1991 2001<br />
$23.5 million<br />
Revenue<br />
Refunding<br />
Bonds<br />
$36.0 million<br />
Revenue<br />
Bonds<br />
$35.2 million<br />
Revenue<br />
Refunding<br />
Bonds<br />
Note: A list of projects funded by each bond issue is included in Table 1.5 of this report.<br />
$33.0 million<br />
Revenue<br />
Refunding<br />
Bonds<br />
Adjusted<br />
Gross Toll<br />
Revenue<br />
Total O&M<br />
Expenses<br />
Net Toll<br />
Revenue<br />
2012 $16,835 $9,775 $7,060<br />
2013 21,686 10,489 11,197<br />
2014 22,499 11,014 11,485<br />
2015 23,309 11,475 11,834<br />
2016 24,136 15,585 8,551<br />
2017 24,956 13,682 11,274<br />
2018 27,291 13,468 13,823<br />
2019 28,134 14,656 13,478<br />
2020 29,061 14,427 14,634<br />
2021 30,241 15,701 14,540<br />
2022 31,451 15,455 15,996<br />
$17.6 million<br />
Revenue<br />
Refunding<br />
Bonds<br />
71
Florida <strong>Department</strong> of Transportation<br />
EntErprisE toll opErations<br />
tHis paGE intEntionallY lEFt BlanK<br />
72 Sunshine Skyway Bridge<br />
FY 2011 Annual Report
95 Ex p r E s s<br />
6.1 Background<br />
95 Express is a facility that provides limited access<br />
express lanes for patrons traveling north and south<br />
on 95 from I-395 in downtown Miami to Broward Boulevard<br />
in Fort Lauderdale. The facility is a Design/Build<br />
project developed in partnership between USDOT,<br />
FDOT Districts Four and Six, Florida’s <strong>Turnpike</strong> Enterprise,<br />
the Miami-Dade and Broward Metropolitan<br />
Planning Organizations (MPO), Miami-Dade Expressway<br />
Authority, Miami-Dade and Broward County<br />
Transit and South Florida Commuter Services.<br />
In 2007, District Six applied for and received $62.9 mil-<br />
lion in federal funding from the U.S. <strong>Department</strong> of<br />
Transportation Urban Partnership Agreement (UPA)<br />
program to assist in implementing 95 Express. The<br />
first phase of the project (Phase 1A), which began<br />
toll collection in December 2008 (FY 2009), includes<br />
the 7-mile northbound direction only from SR 112 to<br />
the Golden Glades interchange just north of 151st Street in Miami-Dade County. The second phase of<br />
the project (Phase 1B), which began toll collection<br />
in January 2010 (FY 2010), includes the southbound<br />
direction from the Golden Glades interchange to just<br />
south of S.R. 836. This phase also extends the northbound<br />
express lanes further to the south from SR 112<br />
to I-395. The express lanes are currently 7.3 miles in<br />
both directions. The final phase of the project (Phase<br />
2) will extend the express lanes 13 miles in both directions<br />
to provide continuous mobility between I-395<br />
and Broward Boulevard in Broward County. The total<br />
length of the final project will be 20 miles. Figure 6.1<br />
shows a map of 95 Express and Figure 6.2 shows the<br />
entry/exit illustration for all phases of the project.<br />
The express lanes operate as High Occupancy Toll<br />
(HOT) lanes for passenger vehicles only (no trucks)<br />
and are designed to alleviate traffic congestion<br />
on the heavily traveled section of 95. HOV 3+ (high<br />
Florida <strong>Department</strong> of Transportation<br />
EntErprisE toll opErations<br />
occupancy vehicles, or carpools, of three or more<br />
passengers), South Florida vanpools, hybrid vehicles,<br />
Miami-Dade and Broward County transit buses,<br />
Miami-Dade and Broward County public school<br />
buses and over-the-road motor coaches can drive<br />
toll-free on the facility by registering with South Florida<br />
Commuter Services (SFCS), the regional commuter<br />
assistance program funded by the Florida<br />
<strong>Department</strong> of Transportation. Motorcycles and<br />
emergency vehicles are also allowed to travel tollfree<br />
on the facility but are not required to register<br />
with SFCS. As of June 2011, approximately 8.7 thousand<br />
vehicles were registered with SFCS. Graph 6.1<br />
shows the percentage of exempt vehicle registrations<br />
by type for FY 2011.<br />
Graph 6.1<br />
95 Express<br />
Exempt Vehicle registrations to Date by type<br />
FY 2011<br />
Over the Road<br />
95 Express was converted from High Occupancy<br />
Vehicle lanes to a tolled facility in order to utilize the<br />
excess capacity available in these lanes to relieve<br />
congestion in the general purpose lanes. Therefore,<br />
all other unregistered 2-axle vehicles can use 95<br />
FY 2011 Annual Report 95 Express<br />
Buses<br />
1.8%<br />
Broward County<br />
Transit Buses<br />
0.5%<br />
Miami-Dade<br />
School Buses<br />
19.9%<br />
Miami-Dade<br />
Transit Buses<br />
10.5%<br />
Hybrids<br />
40.5%<br />
Vanpools<br />
0.4%<br />
HOV3+<br />
26.4%<br />
73
W Broward Blvd.<br />
Davie Blvd.<br />
SR 84<br />
I-595<br />
SW 48th St. Griffin Rd.<br />
Stirling Rd.<br />
Sheridan St.<br />
Hollywood Blvd.<br />
Pembroke Rd.<br />
W. Hallandale Beach Blvd.<br />
Ives Dairy<br />
NE Miami Gardens Dr.<br />
Golden Glades<br />
Tri-Rail<br />
Park and Ride<br />
NW 2nd Ave.<br />
Rt. 441<br />
SR 826<br />
Florida’s <strong>Turnpike</strong><br />
Express Lane<br />
Access<br />
Matchline A<br />
95 Express<br />
SW 60th St.<br />
Future Express Lanes<br />
Gantry<br />
$x.xx $x.xx<br />
Future Express Lanes<br />
Gantry<br />
$x.xx $x.xx<br />
Express Lanes<br />
Gantry<br />
$0.25 $7.00<br />
NW 151st St.<br />
Opa Locka Blvd.<br />
NW 135th St.<br />
NW 125th St.<br />
SR 924/119th St.<br />
NW 103rd St.<br />
NW 95th St.<br />
NW 82nd St.<br />
NW 79th St.<br />
NW 69th St.<br />
NW 62nd St.<br />
SR 112<br />
NW 10th Ave.<br />
Matchline A<br />
Express Lanes<br />
Gantry<br />
$0.25 $7.00<br />
I-195<br />
SR 836 I-395<br />
Express Lanes:<br />
$0.00<br />
$0.00<br />
LEGEND<br />
Phase 1A<br />
Phase 1B<br />
Phase 2<br />
Express Lanes Gantry<br />
Future Express Lanes Gantry<br />
Minimum toll rate<br />
(not finalized for Phase 2)<br />
Maximum toll rate<br />
(not finalized for Phase 2)<br />
General Purpose Lanes<br />
STATE OF FLORIDA<br />
DEPARTMENT<br />
OF TRANSPORTATION
Florida <strong>Department</strong> of Transportation<br />
EntErprisE toll opErations<br />
Express lanes by paying a toll with their SunPass transponder.<br />
Tolls in these lanes are collected electronically<br />
using SunPass and are variably priced based on<br />
traffic volume. The toll rate is increased during peak<br />
periods when demand is greater in order to control<br />
the number of vehicles using the facility, enabling<br />
traffic to continue moving at a minimum speed of 45<br />
miles per hour. To aid in customer decision making,<br />
the amount of the toll is clearly posted before the<br />
tolling point on overhead dynamic message signs.<br />
95 Express is an all-electronic toll facility, meaning that<br />
no cash payment option is available. As previously<br />
mentioned, vehicles equipped with a transponder<br />
are processed through SunPass. For vehicles without<br />
a SunPass transponder, an image of the vehicle’s<br />
license plate is captured and either recognized as a<br />
registered toll-exempt vehicle or processed through<br />
the toll violation system (see section 6.3).<br />
table 6.1 shows the historical transactions and revenue<br />
growth on 95 Express. In FY 2009, the facility was<br />
Fiscal<br />
Year<br />
table 6.1<br />
95 Express<br />
Historical transactions and revenue Growth<br />
FY 2009 through FY 2011<br />
Toll<br />
Paying<br />
Transactions (000) Toll Revenue ($000)<br />
Non<br />
Percent<br />
Revenue Total Change Amount<br />
Percent<br />
Change<br />
open to traffic for approximately seven months in the<br />
northbound direction. During that time, 4.1 million<br />
transactions occurred, with the toll revenue amounting<br />
to approximately $2.8 million. FY 2010 was the<br />
first full year of operation for the northbound lanes.<br />
In addition, the southbound lanes began toll collection<br />
on January 15, 2010 (FY 2010). Annual transactions<br />
totaled approximately 11.9 million, resulting in<br />
toll revenues of approximately $9.2 million. FY 2011<br />
was the first full year of operating for the southbound<br />
lanes. Annual transactions on 95 Express totaled<br />
nearly 18.8 million and toll revenues totaled nearly<br />
$15.8 million. The average toll on the facility during<br />
FY 2011 was $0.84.<br />
Historical toll operating and routine maintenance<br />
expenses for FY 2009 through FY 2011 are presented<br />
in table 6.2. Total toll operating expenses on the<br />
facility have increased from nearly $1.0 million in FY<br />
2010 to approximately $1.3 million in FY 2011. This<br />
table 6.2<br />
95 Express<br />
Historical toll operating and routine<br />
Maintenance Expenses ($000)<br />
FY 2009 through FY 2011<br />
increase is attributed to only a partial year<br />
of operation for the southbound lanes in FY<br />
2010. Also, additional operating costs totaling<br />
$3.9 million were paid with toll revenue.<br />
These costs were for 95 Express highway<br />
operations incurred by District VI. Also, routine<br />
maintenance expenses totaling $1.1<br />
million were incurred during FY 2011 primarily<br />
for the replacement of pavement delineators<br />
along the roadway.<br />
6.2 FY 2011 Transactions and<br />
Toll Revenues<br />
Monthly transactions and toll revenue on 95 Express<br />
during FY 2011 are presented in table 6.3 and show<br />
the northbound and southbound lanes, as well as<br />
system totals. Total transactions on the northbound<br />
and southbound lanes were each approximately 9.4<br />
million for the year, totaling 18.8 million for the facility.<br />
76 95 Express<br />
FY 2011 Annual Report<br />
Fiscal<br />
Year<br />
Toll<br />
Operating<br />
Expense<br />
Source: FDOT Office of the Comptroller<br />
Average<br />
Toll<br />
(1)<br />
2009 4,075 69 4,144 - $2,777 - $0.681<br />
(2)<br />
2010 11,631 285 11,916 N/A 9,224 N/A 0.774<br />
2011 18,341 451 18,792 57.7% 15,780 71.1% 0.840<br />
Source: FDOT Office of the Comptroller and <strong>Turnpike</strong> Enterprise Finance Office.<br />
N/A: Not comparable since only Phase IA was open in FY 2009.<br />
Note: The non- revenue class includes authorized vehicles that pass through a toll plaza without incurring a toll (i.e., law<br />
enforcement, emergency vehicles) and transactions reported during toll suspensions attributable to hurricanes.<br />
(1) The facility opened in December 2008 (FY 2009) in the northbound direction only.<br />
(2) The southbound express lanes opened in January 2010 (FY 2010).<br />
Routine<br />
Maintenance<br />
Expense<br />
Total O&M<br />
Expenses<br />
2009 $518 - $518<br />
2010 961 - 961<br />
2011 1,269 $1,084 2,353
Month<br />
table 6.3<br />
95 Express<br />
Monthly transactions and toll revenue<br />
FY 2011<br />
Northbound<br />
Lanes<br />
Transactions (000) Toll Revenue ($000)<br />
Southbound<br />
Lanes<br />
Northbound Southbound<br />
Total Lanes Lanes Total<br />
July 2010 713 701 1,414 $552 $519 $1,071<br />
August 746 719 1,465 534 576 1,110<br />
September 714 702 1,416 661 573 1,234<br />
1st Quarter Total 2,173 2,122 4,295 1,747 1,668 3,415<br />
October 774 765 1,539 667 590 1,257<br />
November 763 777 1,540 702 653 1,355<br />
December 784 788 1,572 638 558 1,196<br />
2nd Quarter Total 2,321 2,330 4,651 2,007 1,801 3,808<br />
January 2011 798 799 1,597 676 650 1,326<br />
February 780 797 1,577 753 661 1,414<br />
March 896 915 1,811 861 834 1,695<br />
3rd Quarter Total 2,474 2,511 4,985 2,290 2,145 4,435<br />
April 830 835 1,665 730 754 1,484<br />
May 812 813 1,625 661 692 1,353<br />
June 785 786 1,571 652 633 1,285<br />
4th Quarter Total 2,427 2,434 4,861 2,043 2,079 4,122<br />
Annual Total 9,395 9,397 18,792 $8,087 $7,693 $15,780<br />
Source: FDOT Office of the Comptroller (Annual Toll Revenue) and <strong>Turnpike</strong> Enterprise Finance Office.<br />
Note: Transactions represent - tollpaying<br />
and non-revenue traffic at mainline plazas.<br />
The corresponding revenues were approximately<br />
$8.1 million and $7.7 million on the northbound and<br />
southbound lanes, respectively, for a system-wide<br />
total of $15.8 million. The third quarter of FY 2011 (i.e.,<br />
January through March) was the peak period for<br />
travel on the facility. Transactions of approximately<br />
5.0 million were realized during that period.<br />
Graph 6.2 shows the number of hourly transactions<br />
on weekdays of a typical week during FY 2011 and<br />
Transactions<br />
3,200<br />
2,800<br />
2,400<br />
2,000<br />
1,600<br />
1,200<br />
800<br />
400<br />
0<br />
1:00<br />
AM<br />
3:00<br />
AM<br />
Graph 6.2<br />
95 Express<br />
typical Hourly Weekday transactions<br />
FY 2011<br />
5:00<br />
AM<br />
7:00<br />
AM<br />
9:00<br />
AM<br />
11:00<br />
AM<br />
1:00<br />
PM<br />
Time of Day<br />
3:00<br />
PM<br />
5:00<br />
PM<br />
Northbound Southbound<br />
7:00<br />
PM<br />
9:00<br />
PM<br />
11:00<br />
PM<br />
Source: Data obtained from <strong>Turnpike</strong> Enterprise Finance Office for the 5-day period beginning<br />
Monday July 19, 2010.<br />
Florida <strong>Department</strong> of Transportation<br />
EntErprisE toll opErations<br />
differentiates between the northbound<br />
and southbound lanes on I-95 Express. As<br />
indicated, the demand for travel on the<br />
facility is highest during the morning and<br />
evening peak hours. The morning peak<br />
period occurs from 7:00 a.m. to 9:00 a.m.<br />
primarily in the southbound lanes and<br />
the evening peak period occurs from<br />
3:00 p.m. to 6:00 p.m. in the northbound<br />
lanes. In addition, the noticeable number<br />
of transactions during the middle of the<br />
day indicates that there are a number<br />
of non-commuters (tourist/recreational<br />
travelers) also using the facility.<br />
The average weekday toll rates by hour<br />
for a typical week during FY 2011 are presented<br />
in Graph 6.3. As indicated, the toll<br />
rate for the 95 Express facility increases<br />
during the morning and evening peak<br />
periods when traffic volumes are the highest.<br />
The FY 2011 monthly transaction variation is analyzed<br />
in table 6.4. On average, approximately 51,400 drivers<br />
use the facility each day. Based on average daily<br />
transactions, the facility experienced 58,400 vehicles<br />
per day during the month of March, resulting in 14<br />
FY 2011 Annual Report 95 Express<br />
$3.00<br />
$2.50<br />
$2.00<br />
$1.50<br />
$1.00<br />
$0.50<br />
$0.00<br />
Graph 6.3<br />
95 Express<br />
average Weekday toll rates by Hour<br />
FY 2011<br />
1 3 5 7 9 11 13 15 17 19 21 23<br />
Hour<br />
Northbound Southbound<br />
Source: Data obtained from SunGuide for the weekday period beginning<br />
Monday, July 19, 2010.<br />
77
Florida <strong>Department</strong> of Transportation<br />
EntErprisE toll opErations<br />
Month<br />
percent more traffic than the average. July was<br />
the lowest month at only 11 percent below the<br />
average.<br />
Transactions by customer type on 95 Express are<br />
shown in Graph 6.4. For FY 2011, SunPass accounted<br />
for approximately 94 percent of the transactions on<br />
the facility and essentially all of the revenue. Unpaid<br />
Toll Violation Notice (UTVN) transactions, exempt<br />
vehicles, and non-revenue vehicles account for the<br />
Exempt Vehicles<br />
1.5%<br />
Non-Revenue<br />
0.5%<br />
Unpaid Toll<br />
Violation Notice<br />
4%<br />
table 6.4<br />
95 Express<br />
seasonal transaction Variation<br />
FY 2011<br />
Average Daily Transactions<br />
Northbound<br />
Lanes<br />
Southbound<br />
Lanes Total<br />
Graph 6.4<br />
95 Express<br />
Transactions by Customer Type<br />
FY 2011<br />
SunPass<br />
94%<br />
Seasonal<br />
Factor<br />
July 2010 23,000 22,600 45,600 0.89<br />
August 24,100 23,200 47,300 0.92<br />
September 23,800 23,400 47,200 0.92<br />
October 24,900 24,700 49,600 0.96<br />
November 25,400 25,900 51,300 1.00<br />
December 25,300 25,400 50,700 0.99<br />
January 2011 25,700 25,800 51,500 1.00<br />
February 27,800 28,400 56,200 1.09<br />
March 28,900 29,500 58,400 1.14<br />
April 27,700 27,800 55,500 1.08<br />
May 26,200 26,200 52,400 1.02<br />
June 26,200 26,200 52,400 1.02<br />
AADT 25,700 25,700 51,400 1.00<br />
remaining 6 percent of the transactions. The UTVN<br />
process is explained in detail in section 6.3 of this<br />
chapter.<br />
6.3 SunPass<br />
As previously mentioned, 95 Express is an all-electronic<br />
toll facility. Drivers of exempt vehicles are<br />
responsible for shielding their SunPass transponder to<br />
prevent the toll rate from being deducted from their<br />
account.<br />
The toll rate on the 95 Express lanes fluctuates<br />
throughout the day. If travel speeds in the lanes start<br />
to slow and fall below 45 miles per hour, then the<br />
toll rate is increased to maintain highway speeds.<br />
Essentially, as the price increases, some customers<br />
choose to buy-out of the Express lanes. The toll rate<br />
is displayed on overhead electronic signs prior to<br />
each of the 95 Express northbound and southbound<br />
entrance ramps.<br />
In order to manage safety conditions on 95 Express,<br />
the Florida <strong>Department</strong> of Transportation (FDOT), has<br />
implemented a program that includes cameras, traffic<br />
detectors, incident response, and other measures<br />
to reduce the effects of crashes and breakdowns on<br />
traffic flow. Various situations on the facility (Express<br />
Lanes or General Purpose Lanes) that affect traffic<br />
flow can result in no tolls being charged for a period<br />
of time. This includes incidents that result in blocked<br />
travel lanes on the facility or when traffic is diverted<br />
from the general purpose lanes into the express<br />
lanes.<br />
The toll gantry structures include enforcement beacons<br />
to alert Florida Highway Patrol troopers when<br />
a vehicle has entered the express lanes without a<br />
transponder. License plate images are captured for<br />
all vehicles without a transponder and are then processed<br />
and filtered against the SFCS database of registered<br />
toll exempt users. All vehicles not registered as<br />
78 95 Express<br />
FY 2011 Annual Report
exempt are identified by their license plate and sent<br />
a UTVN which is an itemized bill of unpaid toll trans-<br />
actions. The total amount collected in FY 2011 as a<br />
result of the UTVN process was approximately $328<br />
thousand. The itemized bill includes an administrative<br />
charge of $2.50 to recover the cost of administering<br />
this payment option. The customer is responsible<br />
for paying the bill via phone, mail or online at www.<br />
sunpass.com. Cameras also allow law enforcement<br />
vehicles to monitor illegal movement in and out of<br />
the express lanes.<br />
6.4 FY 2011 Expenses<br />
A comparison between actual and budgeted operating<br />
and routine maintenance expenses for FY 2011<br />
is shown in table 6.5. Actual toll operating expenses<br />
table 6.5<br />
95 Express<br />
toll operating and routine Maintenance<br />
Expenses ($000)<br />
FY 2011<br />
Type of Expense Budget Actual<br />
Over/<br />
(Under) Variance<br />
Toll Operating $1,416 $1,269 ($147) (10.4%)<br />
Routine Maintenance (1)<br />
- 1,084 1,084 N/A<br />
Total $1,416 $2,353 $937 66.2%<br />
Source: FDOT Office of the Comptroller.<br />
(1) A budget was not completed for FY 2011. FY 2011 is the first year that routine<br />
maintenance expenses were incurred on the facility.<br />
were approximately $147 thousand, or 10.4 percent,<br />
less than the FY 2011 budget. This decrease is primarily<br />
due to lower actual expenses incurred for toll<br />
equipment repairs and toll operating contracts. FY<br />
2011 was the first year that maintenance costs were<br />
incurred on 95 Express since it is a newer facility. As<br />
previously mentioned, the maintenance expenses<br />
of $1.1 million during the year were primarily for the<br />
replacement of delineators, which are used to separate<br />
the express lanes from the general purpose<br />
lanes.<br />
Florida <strong>Department</strong> of Transportation<br />
6.5 Noteworthy Events<br />
EntErprisE toll opErations<br />
As previously mentioned, the 95 Express project is<br />
being conducted in several phases. The first part of<br />
Phase 1, known as Phase 1A, was completed and<br />
toll collection began in December 2008 (FY 2009).<br />
Construction on Phase 1B began in the summer of<br />
2008 and toll collection began in January 2010 (FY<br />
2010). Phase 2 is a 13-mile long project that includes<br />
extending the express lanes from the Golden Glades<br />
interchange in northern Miami-Dade County to Broward<br />
Boulevard in Fort Lauderdale. This phase is primarily<br />
funded by $88 million in federal economic<br />
stimulus money. Phase 2 construction is scheduled<br />
to begin in Fall of 2011 with a tentative completion<br />
date of early 2014.<br />
Starting in FY 2010, an escrow account for transit<br />
operations was created. Transit operations include<br />
express bus services and Bus Rapid Transit service<br />
within the 95 express lanes. This also includes<br />
improvements to the Golden Glades park-n-ride<br />
facility in Miami-Dade County. The excess revenue<br />
derived will be used to reimburse the State Transportation<br />
Trust Fund (STTF) when transit ramps up to full<br />
operation. The escrow account balance as of June<br />
30, 2011 is $13.4 million.<br />
Broward County Transit offers an express bus service<br />
on 95 Express for passengers traveling to and from<br />
downtown Miami. The first morning route in the southbound<br />
direction begins at 5:30 a.m. with the final<br />
morning route at 8:40 a.m. The afternoon route leaving<br />
downtown Miami in the northbound direction<br />
begins at 3:40 p.m. with the final route at 6:50 p.m.<br />
The service has been a huge success with approximately<br />
700 riders taking advantage of the routes on<br />
a daily basis. Broward County Transit currently plans<br />
to expand the program by adding two new routes<br />
by Spring of 2012.<br />
FY 2011 Annual Report 95 Express<br />
79
Florida <strong>Department</strong> of Transportation<br />
EntErprisE toll opErations<br />
The 2007 Legislature amended Section 338.165,<br />
Florida Statutes, to require the <strong>Turnpike</strong> System and<br />
other FDOT-owned facilities to index toll rates on<br />
existing toll facilities to the annual consumer price<br />
index (CPI) or similar inflation indicator effective as<br />
of July 1, 2007. Toll rate adjustments for inflation may<br />
be made no more frequently than once a year and<br />
must be made no less frequently than once every<br />
five years. The toll rates for 95 Express are set under<br />
a different rule than the other FDOT-owned facilities<br />
and is therefore excluded from the indexing<br />
requirement.<br />
80 95 Express<br />
FY 2011 Annual Report