Caspar creek watershed study - A current status report
Caspar creek watershed study - A current status report
Caspar creek watershed study - A current status report

You also want an ePaper? Increase the reach of your titles
YUMPU automatically turns print PDFs into web optimized ePapers that Google loves.
y<br />
y<br />
No. 66<br />
State of California<br />
The Resources Agency<br />
Department of Forestry<br />
STATE FOREST NOTES<br />
CASPAR CREEK WATERSHED STUDY<br />
- A CURRENT STATUS REPORT -<br />
By Forest B. Tilley ~ and Raymond M. Rice ~<br />
North Fork <strong>Caspar</strong> Creek Weir<br />
1416 Ninth Street<br />
Sacramento, CA 95814<br />
Phone 916-445-5571<br />
July, 1977<br />
Forester II, California Department of Forestry, Assistant Forest<br />
Manager, Jackson State Forest, Fort Bragg, California.<br />
Project Leader, USFS, Pacific<br />
Station, Arcata, California.<br />
Southwest Forest & Range Experiment
UP-DATE CASPAR WATERSHED PROJECT<br />
INTRODUCTION<br />
For 16 years Jackson State Forest, managed by the California Department<br />
of Forestry, has been the site of a comprehensive <strong>watershed</strong><br />
experiment. This experiment, on <strong>Caspar</strong> Creek five miles south of<br />
Fort Bragg on the Mendocino coast, is a cooperative project between<br />
the California Department of Forestry and the U. S. Forest Service<br />
Pacific Southwest Forest and Range Experiment Station. The California<br />
Department of Fish and Game, the California Department of Water<br />
Resources, the California Division of Mines and Geology and Humboldt<br />
State University have been cooperators in the past.<br />
The <strong>study</strong> area is composed of two similar <strong>watershed</strong>s, the North Fork<br />
(1,228 acres) and the South Fork (1,047 acres) of <strong>Caspar</strong> Creek. The<br />
topography runs from broad rounded ridge tops to steep slopes near<br />
the stream. The underlying geology of the <strong>Caspar</strong> Creek drainage is<br />
described in PSW-93 by Krammes and Burns as sedimentary rocks of<br />
Cretaceous age. Soils mapped in the area are the Hugo and Mendocino<br />
soil series. Hard sandstone and moderately weathered coarse-grained<br />
shale are found beneath the Hugo soils. The Mendocino soil is associated<br />
with highly weathered sandstone which is often streaked with<br />
lenses of red and white clay. Weakly consolidated Pleistocene marine<br />
terrace deposits are found in less than ten percent of the South Fork.<br />
These deposits form the parent material for the <strong>Caspar</strong> and Noyo soil<br />
series.<br />
Forest cover on both <strong>watershed</strong>s consists of fairly dense stands<br />
(60,000board feet per acre) of second growth redwood, Douglas-fir,<br />
hemlock, grand fir and some minor hardwoods in scattered areas. These<br />
stands are now 80 to 100 years old. Both drainages were clear-cut and<br />
burned in the late 1800's, the North Fork about 15 years after the<br />
South Fork. There has been little or no disturbance since with the<br />
exception of some minor pole and piling cutting during World War II.<br />
Undergrowth consists of huckleberry, tanoak, sword fern and other<br />
species typically found in association with redwood/Douglas-fir type.<br />
-2
39" 25' .+<br />
'23' 50' 123'4
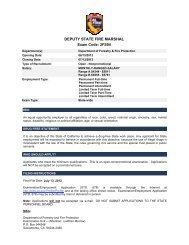
The climate can be described as that found along the northern coast<br />
of California with foggy days during the summer and mild winters<br />
with an average of 401' + rainfall each year (fig. 2).<br />
HYDROLOGIC YEAR Jj<br />
1963 64 65 66 67 68 69 70 71 72 73 74 75 76 77<br />
1-i<br />
70 I !<br />
Z 60<br />
0<br />
l<br />
i=! 50<br />
a.. - <br />
PROJECT HISTORY<br />
The project was started in 1961 when a series of rain gauges were<br />
set up in and around the selected <strong>watershed</strong>s. In November 1962<br />
installation of "Vf1 notch weirs and attendant Stevens A-35 recording<br />
stream gauges at the lower end of both <strong>watershed</strong>s was<br />
completed. This was followed by a period of calibration during<br />
which precipitation, stream flow, suspended sediment and bed load<br />
deposits were measured. In the summer of 1967 a road system was<br />
built providing access to th~ South Fork <strong>watershed</strong>. From 1967 to<br />
1971 the same measurements were taken to record the impact of this<br />
road construction. In addition, the aquatic habitat was studied<br />
to determine the changes caused by road construction. The results<br />
of this <strong>study</strong> were published in PSW-93 mentioned earlier.<br />
In 1971 selective logging of a portion of the South Fork <strong>watershed</strong><br />
began. The Watershed #1 Timber Sale covered 249 acres and totaled<br />
10.3 MM board feet, or 60 percent of the volume. Watershed #2 in<br />
1972 harvested 13.6 MM board feet and covered 316 acres. This sale<br />
resulted in removal of approximately 70 percent of the stand volume.<br />
The remaining portion of the South Fork <strong>watershed</strong> was logged in<br />
1973. This sale, Watershed #3 removed 14.4 MM board feet or 65 percent<br />
of the volume from 435 acres. In total 38.3 MM board feet were<br />
harvested from 1,000 acres.<br />
The average d.b.h. of timber removed was about 28'1. The amount of<br />
ground disturbance resulting from this selective harvest utilizing<br />
tractors and skidders is summarized in Table 1.<br />
Table 1. Harvesting activity South Fork Watershed.<br />
WS #1 WS #2 WS #3 Average<br />
Total stand/acre (MEF) 69.9 62.7 51.3 61.3<br />
Actual harvest/acre (MBF) 41.4 43.0 33.1 38.3<br />
New road construction (miles) 1.625 1.25 1.125 4<br />
Total<br />
Skid trail (acres) 21.7 27.5 38.0 87.2<br />
Landings (acres) 8.7 3.3 9.0 21.0<br />
-5
During and following the logging of the South Fork, drainage monitoring<br />
of both <strong>watershed</strong>s has continued. In the winter of 1973-74<br />
sampling of the streams during storm periods was intensified. This<br />
sampling concentrated on those flows over 25 cu.ft./sec. In 1975<br />
PS-69 automatic pumping samplers were installed on both <strong>watershed</strong>s<br />
allowing for continuous sampling. Prior to this all sampling had<br />
been done manually. During the spring of 1976 frequenqy controlling<br />
devices were added to these pumping samplers. This addition provided<br />
for more intensive sampling during higher flows.<br />
The debris basins behind the weirs have each been cleaned out three<br />
times since 1962; the North Fork in 1967, 1971 and 1974, the South<br />
Fork in 1968, 1971 and 1975. Cross sections on permanent stations<br />
are measured annually and before and after each clean-out. This<br />
provides information on the amount of debris and bed load each<br />
stream produces.<br />
Slope Erosion<br />
RESULTS TO DATE<br />
A survey of landslides in the South Fork <strong>watershed</strong> was conducted<br />
by Forestry Aides during the summer of 1976. The entire <strong>watershed</strong><br />
was walked. The volume of landslides was estimated. Soil movements<br />
as little as 150 cubic feet were recorded. Aspect and location<br />
were noted for preparation of a base map. Color aerial photos<br />
with a scale of 4" to the mile helped confirm the accuracy of this<br />
base map. This survey showed an estimated 100 cubic yards per acre<br />
of soil displacement due to landslides.<br />
Eighty-five percent of the slides were associated with road and skid<br />
trail cuts. A down tree or stump was present in a significant number<br />
of these slides. Whether the tree or stump helped trigger the<br />
soil displacement or was merely a victim of this displacement is<br />
difficult to determine. The volume of these individual road bank<br />
failures was not too significant; however, many of them may have<br />
affected road drainage and channeled runoff into hazardous areas<br />
thereby causing major soil movement elsewhere.<br />
In 1976 the U. S. Forest Service, Pacific Southwest Forest and Range<br />
Experiment Station measured seven plots in the South Fork <strong>watershed</strong>.<br />
These plots were part of a larger <strong>study</strong> to assess soil movement<br />
associated with the various logging systems studied. Each plot<br />
started with a transect through a landing. Additional transects<br />
were run across the slope bisecting the skid trail system leading<br />
into the landing. Measurements were taken along these transects<br />
to determine cross sectional area of rills, gullies, ruts and cuts<br />
for skid trails or roads. All major events (defined as one cubic<br />
yard or gully cross section in excess of one square foot) within<br />
the plot were surveyed. A total measured soil loss was calculated<br />
-6
from this information. Fill volume (soil deposited on the site)<br />
and rut volume (which occurs more from compaction than displacement)<br />
were then subtracted from this maximum measured soil movement<br />
to arrive at a net soil loss. A total of 94 acres was<br />
sampled amounting to nine percent of the <strong>watershed</strong>. A net soil<br />
loss of 147 cubic yards per acre was recorded.<br />
The soil movement recorded in both of these surveys did not<br />
necessarily end up in the stream. Most of it came to rest<br />
downslope from its original position. .<br />
Stream Flow<br />
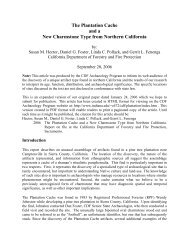
Monthly mean flow for the <strong>study</strong> period is shown in figure 3. The<br />
distribution of this flow is dependent on rainfall intensity and<br />
storm patterns for the year. In most cases the North Fork, being<br />
the larger <strong>watershed</strong>, produced a slightly greater flow in cubic<br />
feet per second (cfs) than the South Fork. Logging of the South<br />
Fork seems to have had little effect on this pattern.<br />
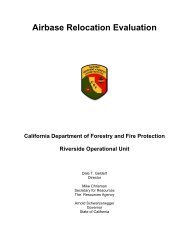
Analysis of peak flow information (fig. 4) shows a fair degree of<br />
correlation between the two <strong>watershed</strong>s through the first year of<br />
logging. After that, data indicates the South Fork became much<br />
more responsive to precipitation and had more peaks over 25 cfs.<br />
Robert Ziemer of the Pacific Southwest Forest and Range Experiment<br />
Station is doing a detailed analysis of this peak flow information.<br />
A paper on his work is forthcoming. In a comparison of flows after<br />
logging, Ziemer's preliminary analysis indicates the first three<br />
or four storms produce considerably higher peaks in the South Fork<br />
than those of the North Fork. These early peaks are, however,<br />
usually quite small in relation to peaks occurring from later storms.<br />
As the season progresses, the differences between the peaks in the<br />
North Fork and the South Fork become insignificant. This reflects<br />
the fact that they react similarly once the soil water deficits in<br />
both <strong>watershed</strong>s have been satisfied. This also suggests that there<br />
has been little change in infiltration rate in the logged <strong>watershed</strong><br />
due to soil compaction or disturbance.<br />
-7
CUBIC FT. / SEC.<br />
0 5.0 10.0 15.0 20.0 0 5.0 10.0 15.0 20.0 25.0 0 5.0 10.0 15.0 20.0<br />
-<br />
.<br />
DEC<br />
1--1<br />
I<br />
JAN<br />
-- - FEB<br />
62 63 67 68 72 -73<br />
---'<br />
OCT .<br />
NOV ....I<br />
MAR<br />
APR .<br />
MAY<br />
i<br />
JUN J "<br />
OCT I J<br />
NOV J I<br />
-<br />
. DEC oJ<br />
JAN<br />
FEB<br />
MAR<br />
63- - 64<br />
I<br />
'68<br />
I<br />
-69<br />
loJ<br />
..,'"<br />
I"T<br />
APR<br />
MAY<br />
JUN<br />
.:J<br />
.<br />
..,."<br />
- OCT<br />
NOV<br />
-<br />
J<br />
DEC<br />
-<br />
- JAN<br />
....<br />
64 65<br />
MAR 69 -70<br />
74 - 75<br />
FEB I<br />
APR... r<br />
MAY J<br />
JUN<br />
OCT .<br />
NOV<br />
DEC<br />
JAN<br />
I---J -<br />
FEB<br />
MAR<br />
APR .--'<br />
MAY J<br />
65- 66<br />
-J<br />
.""<br />
.. J<br />
I I<br />
JUN<br />
J<br />
I<br />
. ..,,, ..,.<br />
I I<br />
OCT<br />
NOV - I--J<br />
DEC ,<br />
JAN<br />
I.<br />
- FEB I-J<br />
MAR<br />
66 -67<br />
I<br />
APR<br />
MAY<br />
JUN U<br />
--oJ<br />
-<br />
J<br />
71- 72<br />
FIGURE:<br />
MONTHLY<br />
HYDROLO<br />
CASPAR<br />
.. Developedfrom daily mean flows including some<br />
U JUNE<br />
estimated data.<br />
-8<br />
--
SOUTH FORK NORTH FORK<br />
cfs 300 200 10050 0 0 50 100 200 300 cfs ---<br />
I<br />
f-- ,-<br />
I<br />
r<br />
T<br />
ru= 11-2&-&2<br />
12- 2 -62 Lh<br />
II-- 12-22-62<br />
I--<br />
r!L-<br />
I<br />
7-<br />
i.-<br />
r<br />
I I r::<br />
---<br />
1-31-63 -Lh<br />
3-27-63 ::r 4- 6-63 h<br />
4-14-63<br />
11-'4-63 I<br />
11-23-63<br />
1-2'-64 I<br />
11-9 -64 ...L<br />
11-28-64<br />
12-2'-64<br />
1- 5 -65<br />
12-28-65 Ti<br />
1- 4 -66<br />
3- II -66<br />
II-21-66 -i<br />
12- 2 -66 -<br />
1-21 -67 HI<br />
1-29 -67 '<br />
3-10-67 ,1..1 ;<br />
3-20-67<br />
3-31 -67 I I<br />
I<br />
I<br />
I<br />
i<br />
i<br />
--f<br />
1<br />
;<br />
:..r:<br />
rL. T<br />
I<br />
Ir -<br />
I<br />
r ..L..<br />
12-2 -67<br />
1-10-68<br />
1-14-68<br />
r<br />
'.<br />
T<br />
I<br />
r<br />
..... 4-17-67 ={<br />
h<br />
1-29-68 I<br />
I<br />
2-19-68<br />
12-10-68W 12- 16-68 h<br />
12-24-68<br />
12-26-68 f-tJ-1<br />
1-13-69<br />
'-20-69<br />
I<br />
L<br />
!<br />
2- 7 -69<br />
2- 12-69...i.n<br />
3- I -69<br />
12- 12-69 =r<br />
I<br />
12- 14-69 ..L<br />
12- 19-69<br />
12-21 -69<br />
I<br />
12-29-69<br />
1-16-70<br />
I<br />
1-2'-70<br />
1-23-70<br />
1-27-70<br />
2- 17-70<br />
"-27-70 W ...,<br />
'2- 2 -70 I<br />
12- 3 -70<br />
I<br />
12-29-70<br />
1-15-71<br />
3- 12-71<br />
I<br />
3-25-71<br />
1-21-72 ---1<br />
1-22-72 1<br />
;:c 2-28-72 u..<br />
3- 3 -72<br />
T 11-13-72 I<br />
12-17-72<br />
,- 9 -73<br />
,- II -73<br />
1-'2-73<br />
'-16-73<br />
1- 18-73<br />
2- 4 -73<br />
I<br />
rOC:<br />
IT<br />
2-26-73<br />
10-22-73 H<br />
11- 7 -73 1<br />
11- 9-73<br />
T<br />
T<br />
I<br />
IT<br />
I<br />
I<br />
Ir-<br />
11-16-73 I-- h<br />
11-30-73<br />
12-29-73<br />
,- 14-74<br />
1- 18-74 --L<br />
2-28-74<br />
3- 11-74<br />
3-29-74<br />
4- I -74 I<br />
12- 3 -74 I<br />
12-27-74 :::L<br />
1- 6 -75 h<br />
2- I -75<br />
2- 9 -75<br />
2-12-75 I<br />
2- 19-75<br />
3 - 8 -75<br />
3- 17-75<br />
3-21 -75<br />
3-24-75 I<br />
-9<br />
; -<br />
I<br />
I<br />
j T<br />
;<br />
! i<br />
ROAD CONSTRUCTION<br />
LOGGING START<br />
LOGGING COMPLETE<br />
FIGURE 4 - CASPARWATERSHED<br />
SOUTH FORK FLOOD PEAKS<br />
OVER 25 cfs COMPARED TO<br />
CORRESPONDING<br />
FLOOD PEAKS.<br />
NORTH FORK
NF<br />
Debris Basin Deposits<br />
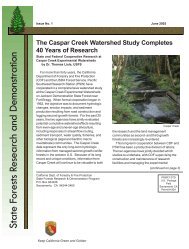
Figure 5 is a graphical comparison of debris basin deposits behind<br />
the weirs of the two <strong>watershed</strong>s. The upper half of the figure represents<br />
debris basin deposits of the South Fork divided by the North<br />
Fork. This gives a relationship where one is the base, indicating<br />
equal magnitude; less than one indicates greater deposits in the<br />
North Fork, more than one indicates greater amounts in the South<br />
Fork. The bar graph in the lower portion of the figure indicates<br />
deposits in each basin in cubic yards per acre.<br />
3<br />
2<br />
SF RATIO I<br />
0<br />
lLI<br />
a::<br />
~ 2<br />
.......<br />
(j)<br />
HYDROLOGIC YEAR<br />
1963 64 65 66 67 68 69 70 71 72 73 74 75 76<br />
---- .<br />
'" " --/<br />
l\\<br />
/ \<br />
V<br />
I<br />
\ ,- -"" '-" /'<br />
I<br />
./ \.<br />
" / /<br />
~I<br />
~ - r<br />
~ 0 - ... - r- -1 :'\\\1 -<br />
m L<br />
IX>0 N N 10 - V en .,. U> U> 0 10 en 1010 - 10 10 0 NIO it)<br />
=> U> en 0 -7 10<br />
10 en I'- 0 10 I'- 0 en I'- en 0 IX>U> - 10 10 10 N 10 NI'- 0 U> 1'-1'<br />
q q -: q N - q "! q "! Iq "! q 0 r<br />
I I<br />
FIGURE 5 - DEBRIS BASIN DEPOSITS BEHIND NORTH FORK (NF)AND SOUTH FORK (SF)<br />
CASPAR CREEK WATERSHED WIERS, 1963- 1975.<br />
Debris basin deposition in the South Fork appears to bear little<br />
correlation with harvesting activity. On the average the North<br />
Fork or unlogged drainage has produced more debris than the South<br />
Fork, the logged drainage. One anomaly remains unanswered:<br />
What accounts for the apparent loss of debris basin deposits in<br />
both <strong>watershed</strong>s over the 1971-72 period? The authors believe the<br />
most likely reason is settling of existing deposits. It appears<br />
the winter of 1971-72 was a fairly low year in precipitation.<br />
-10
Monthly mean flows never exceeded six cubic feet per second. Peak<br />
flows only exceeded 50 cfs on two occasions in either <strong>watershed</strong><br />
and suspended sediment appears to be lower than any other year.<br />
These situations may have combined to produce little new deposits<br />
and a settling of olp deposits with the net result of a recorded<br />
loss.<br />
High deposition years on the North Fork seem to be associated<br />
with intense storms producing peaks in excess of. 200 cfs coupled<br />
with mass soil movement during these peak flows. Carrying<br />
capacity is greatest at this time and most of the debris seems<br />
to be carried to the debris basin. This is borne out by personal<br />
observations after the March 1974 storm which peaked at 269 cfs.<br />
The senior author walked the length of the North Fork drainages<br />
noting one slide of approximately 1,500 cubic yards and several<br />
bank sloughages of one or two cubic yards each. There was little<br />
evidence of bed scouring or deposition in the stream channel.<br />
This indicates that debris which reached the stream was transported<br />
at least as far as the debris basin. 2,340 cubic yards<br />
of debris were deposited in the North Fork basin during the 1973-74<br />
winter period. It is estimated that at least half of this material<br />
resulted from the March storm. .<br />
During this same period there was a slide of approximately the same<br />
magnitude in the upper portion of the South Fork. The major portion<br />
of this slide was not transported but remained in place with the<br />
stream traveling through underneath. This slide occurred in an<br />
uncut portion of the 1973 timber sale and although there is a road<br />
above it, there was no apparent drainage into the slide area from<br />
this road.<br />
Suspended Sediment<br />
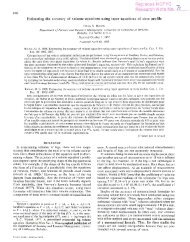
Figure 6 is a graphic comparison of suspended sediment concentrations<br />
in parts per million by weight. Again on the upper portion<br />
of the figure, data from the South Fork, or logged <strong>watershed</strong>, has<br />
been divided by that from the North Fork, or control <strong>watershed</strong>,<br />
giving the relationship where one means equal amounts from both<br />
<strong>watershed</strong>s. Less than one indicates more suspended sediment in<br />
the North Fork, more than one indicates the South Fork carried<br />
more suspended sediment than the North Fork. In the winter of<br />
19G7-68 an old splash dam washed out in the headwaters of the<br />
South Fork. This failure accounts for a major portion of the 895<br />
cubic yards of suspended sediment in the South Fork for that period.<br />
Logging of the South Fork started in 1971 and by the winter of<br />
1972-73 (Hydrologic Year 1973) 60 percent of the <strong>watershed</strong> had been<br />
logged. An increase in suspended sediment occurred during this<br />
period and the following year but 1975 shows a decline. The high<br />
amount of suspended sediment in the North Fork for the period<br />
1973-74 is most likely due to the slide occurring in March 1974<br />
discussed under Debris Basin Deposits. Table 2 lists mean annual<br />
suspended sediment concentrations and annual suspended sediment<br />
discharges in the two <strong>watershed</strong>s for the hydrological years<br />
1963-1975.<br />
-11
8<br />
7<br />
6<br />
5<br />
4 '<br />
3<br />
HYDROLOGIC YEAR<br />
1963 64 65 66 67 68 69 70 71 72 73 74 75<br />
2<br />
" .............. V<br />
SF<br />
/ /<br />
NF RATIO 1 .....--- / /'<br />
0<br />
w 4<br />
a:::<br />
()<br />
« 3 .......<br />
(/)<br />
0<br />
a::: 2<br />
)!<br />
u<br />
m \\' ""'u<br />
::><br />
......<br />
r \\'<br />
m<br />
\\ - \'I<br />
0<br />
\'f .....<br />
J,<br />
/ \ \<br />
/ / \'<br />
' / \<br />
v 10 0 10 10 10 V 10 t\I t\I 10 -t\l-V - V 10 - CD10 - I'- (7) I\') <br />
t\I - t\I - I'- (7) 10 - I\') t\I CD -(7)10 V 10 (7) I'- I\') 0 (1) 10 10 "! 10<br />
0 0 0 0 0 0 0 ":000 000 0 0 0 0 0 ON 0 rt>
Table 2. Estimated Suspended Sediment of Measured Stream Flow<br />
Hydro- South Fork North Fork<br />
Logic Mean 1/ 1/<br />
Year Cubic- Cubic Mean Cubic- Cubic<br />
S.S.Conc. Yards Yds/Ac. S.S.Conc. Yards Yds/Ac.<br />
PPM PPM<br />
1963 103 255 0.24 69 192 0.15<br />
1964 132 213 0.20 98 180 0.15<br />
1965 245 784 0.75 317 1175 0.95<br />
1966 289 673 0.64 555 1428 1.16<br />
1967 106 338 0.32 73 265 0.22<br />
1968 472 895 0.85 67 130 0.11<br />
1969 240 926 0.92 175 748 0.61<br />
1970 160 464 0.44 205 743 0.61<br />
1971 290 976 0.94 256 938 0.76<br />
1972 181 326 0.31 51 98 0.08<br />
1973 770 3090 2.95 151 625 0.51<br />
1974 681 3840 3.67 774 5272 4.29<br />
1975 473 1909 1.83 182 749 0.61<br />
Y Conversion from ppm by weight to volume figures was made on the<br />
assumption that suspended sediment weighs 74 pounds per cubic<br />
foot.<br />
CONCLUSIONS<br />
Surveys of the South Fork drainage indicate that 100 to 150 yards<br />
per acre of soil were displaced. This soil did not entirely leave<br />
the site. Only a small portion ended up in the stream. The most<br />
apparent effect of logging is on the suspended sediment. PPM increased<br />
manyfold but the volume in cubic yards per acre for the<br />
period 1971 through 1975 remains about six percent of total displacement.<br />
-13
The next most significant change after logging was the South Fork ts<br />
respo~se to precipitation. It became more responsive to smaller<br />
storms.<br />
Debris basin deposits are more difficult to analyze as there is no<br />
real trend before, during or after logging. They appear to be<br />
much more dependent on storm patterns and intensities.<br />
Table 3. Summary of soil movement by period.<br />
Average annual production in cubic yards per acre.<br />
Pre-logging Road-Calibration Logg ing &<br />
1963 - 1967 1968 - 1971 Post Logging<br />
1972 - 1975<br />
NF SF NF SF NF SF<br />
Average<br />
Annual .53 .43 .52 .79 1.37 2.19<br />
Suspended<br />
Sediment<br />
Debris<br />
Basin .46 .21 .36 .36 .63 .29<br />
Deposits<br />
PROJECT FUTURE<br />
Future plans for the <strong>Caspar</strong> Creek <strong>watershed</strong> project call for logging<br />
of the North Fork in about 1982. This allows seven or more years<br />
for the South Fork to stabilize and provide approximately 20 years<br />
of data on the North Fork in an undisturbed condition.<br />
The silvicultural treatment planned is selective harvest of approximately<br />
50 percent of the merchantable volume of the stand, however,<br />
the limiting factor will be the leave stand. Current objectives in<br />
stands of this type on Jackson State Forest are to leave a well<br />
spaced stand of healthy thrifty trees with approximately 200 square<br />
feet basal area per acre.<br />
Logging plans include the use of cable yarding on the steeper slopes<br />
with tractor and rubber-tired skidders on the more gentle upper<br />
slopes. Road construction will be almost entirely on the upper onethird<br />
of the slope except where spur roads may be required to reach<br />
some scattered large residual trees. Little or no ground disturbance<br />
-14
should occur below the road fill. Roads are to be carefully designed<br />
and constructed to reduce drainage problems and construction<br />
failures. Tractor ~ogging will be done at least a year in<br />
advance of the yarder po~tion, meaning that the operations above<br />
the road would be completed and wintered-over before operations<br />
commence below the road.<br />
The same measurements for sediment, run-off and water quality will<br />
continue to be taken during and following logging so that a comparison<br />
may be developed between two differing logging systems.<br />
Continuation of the <strong>study</strong> within the North Fork <strong>watershed</strong> as planned<br />
will yield additional information and data to determine the effects<br />
of harvesting upon coastal <strong>watershed</strong>s.<br />
LITERATURE CITED<br />
Krammes, J. S., David M. Burns, 1973. Road Construction<br />
on <strong>Caspar</strong> Creek Watersheds, USDA, Forest Service Research<br />
Paper, PSW-93. 10 pages.<br />
REPORTS TO BE PUBLISHED IN THE NEAR FUTURE<br />
1. Analysis of peak flows on the <strong>Caspar</strong> Watershed. R. Ziemer.<br />
U. S. Forest Service, Pacific Southwest Forest & Range<br />
Experiment Station.<br />
2. Estimating sedimentation from an erosion hazard rating.<br />
Rice and Sherbin. U. S. Forest Service, Pacific Southwest<br />
Forest & Range Experiment Station.<br />
3. Erosion and Logging in <strong>Caspar</strong> Creek as compared to the remainder<br />
of the North Coast Region. Rice, U. S. Forest Service<br />
and Tilley, California Department of Forestry.<br />
-15<br />
..