SUNPASS - Florida's Turnpike
SUNPASS - Florida's Turnpike
SUNPASS - Florida's Turnpike

Create successful ePaper yourself
Turn your PDF publications into a flip-book with our unique Google optimized e-Paper software.
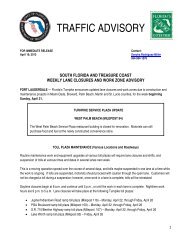
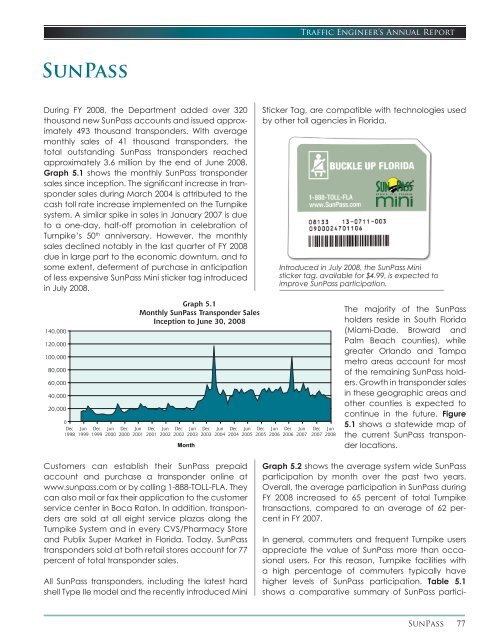
SunPass<br />
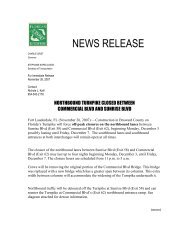
During FY 2008, the Department added over 320<br />
thousand new SunPass accounts and issued approximately<br />
493 thousand transponders. With average<br />
monthly sales of 41 thousand transponders, the<br />
total outstanding SunPass transponders reached<br />
approximately 3.6 million by the end of June 2008.<br />
Graph 5.1 shows the monthly SunPass transponder<br />
sales since inception. The significant increase in transponder<br />
sales during March 2004 is attributed to the<br />
cash toll rate increase implemented on the <strong>Turnpike</strong><br />
system. A similar spike in sales in January 2007 is due<br />
to a one-day, half-off promotion in celebration of<br />
<strong>Turnpike</strong>’s 50 th anniversary. However, the monthly<br />
sales declined notably in the last quarter of FY 2008<br />
due in large part to the economic downturn, and to<br />
some extent, deferment of purchase in anticipation<br />
of less expensive SunPass Mini sticker tag introduced<br />
in July 2008.<br />
140,000<br />
120,000<br />
100,000<br />
80,000<br />
60,000<br />
40,000<br />
20,000<br />
0<br />
Dec<br />
1998<br />
Jun<br />
1999<br />
Dec<br />
1999<br />
Jun<br />
2000<br />
Dec<br />
2000<br />
Jun<br />
2001<br />
Dec<br />
2001<br />
Jun<br />
2002<br />
Dec<br />
2002<br />
Jun<br />
2003<br />
Month<br />
Dec<br />
2003<br />
Jun<br />
2004<br />
Dec<br />
2004<br />
Customers can establish their SunPass prepaid<br />
account and purchase a transponder online at<br />
www.sunpass.com or by calling 1-888-TOLL-FLA. They<br />
can also mail or fax their application to the customer<br />
service center in Boca Raton. In addition, transponders<br />
are sold at all eight service plazas along the<br />
<strong>Turnpike</strong> System and in every CVS/Pharmacy Store<br />
and Publix Super Market in Florida. Today, SunPass<br />
transponders sold at both retail stores account for 77<br />
percent of total transponder sales.<br />
All SunPass transponders, including the latest hard<br />
shell Type IIe model and the recently introduced Mini<br />
Jun<br />
2005<br />
Traffic Engineer’s Annual Report<br />
Sticker Tag, are compatible with technologies used<br />
by other toll agencies in Florida.<br />
Dec<br />
2005<br />
Jun<br />
2006<br />
Introduced in July 2008, the SunPass Mini<br />
sticker tag, available for $4.99, is expected to<br />
improve SunPass participation.<br />
Dec<br />
2006<br />
Jun<br />
2007<br />
Dec<br />
2007<br />
Jun<br />
2008<br />
The majority of the SunPass<br />
holders reside in South Florida<br />
(Miami-Dade, Broward and<br />
Palm Beach counties), while<br />
greater Orlando and Tampa<br />
metro areas account for most<br />
of the remaining SunPass holders.<br />
Growth in transponder sales<br />
in these geographic areas and<br />
other counties is expected to<br />
continue in the future. Figure<br />
5.1 shows a statewide map of<br />
the current SunPass transponder<br />
locations.<br />
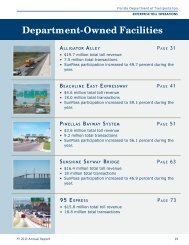
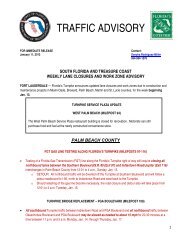
Graph 5.2 shows the average system wide SunPass<br />
participation by month over the past two years.<br />
Overall, the average participation in SunPass during<br />
FY 2008 increased to 65 percent of total <strong>Turnpike</strong><br />
transactions, compared to an average of 62 percent<br />
in FY 2007.<br />
In general, commuters and frequent <strong>Turnpike</strong> users<br />
appreciate the value of SunPass more than occasional<br />
users. For this reason, <strong>Turnpike</strong> facilities with<br />
a high percentage of commuters typically have<br />
higher levels of SunPass participation. Table 5.1<br />
shows a comparative summary of SunPass partici-<br />
SunPass<br />
77
DEPARTMENT<br />
STATE OF FLORIDA<br />
OF TRANSPORTATION
Participation<br />
75%<br />
60%<br />
45%<br />
Jun<br />
2006<br />
pation by <strong>Turnpike</strong> component for FY 2007<br />
and FY 2008. Growth in participation on the<br />
Mainline averaged 7 percent, and growth<br />
on the expansion projects averaged 3 percent.<br />
The table also indicates that average<br />
SunPass participation in June 2008 reached<br />
67 percent for the entire system.<br />
To improve customer service and provide<br />
added convenience to SunPass account<br />
holders, the Department signed a joint<br />
agreement with OOCEA and the Greater<br />
Orlando Aviation Authority to allow drivers<br />
to pay for airport parking through their<br />
transponders. Starting on February 22, 2005,<br />
SunPass (and also E-Pass) customers can<br />
HEFT<br />
Sep<br />
2006<br />
Graph 5.2<br />
SunPass Participation by Month<br />
FY 2007 and FY 2008<br />
FY 2007<br />
Average = 62%<br />
Dec<br />
2006<br />
Mar<br />
2007<br />
Jun<br />
2007<br />
Month<br />
Sep<br />
2007<br />
FY 2008<br />
Average = 65%<br />
Dec<br />
2007<br />
Mar<br />
2008<br />
40%<br />
30%<br />
20%<br />
10%<br />
0%<br />
Jun<br />
2008<br />
Feb<br />
2005<br />
SunPass Participation June 2008<br />
SunPass<br />
<strong>Turnpike</strong> Facility FY 2008 FY 2007 Change Participation<br />
Southern Coin System<br />
Ticket System<br />
Northern Coin System<br />
Beachline West Expressway<br />
Total Mainline<br />
Sawgrass Expressway<br />
Seminole Expressway<br />
Veterans Expressway<br />
Southern Connector Extension<br />
Polk Parkway<br />
Table 5.1<br />
Florida’s <strong>Turnpike</strong> System<br />
SunPass Participation (Percent of Transactions)<br />
Suncoast Parkway<br />
Western Beltway, Part C<br />
Total Expansion Projects<br />
Total System<br />
Source: <strong>Turnpike</strong> Enterprise Finance Office<br />
68% 63% 8% 70%<br />
65 62 5 67<br />
69 64 8 71<br />
59 56 5 58<br />
53 52 2 51<br />
65% 61% 7% 66%<br />
72 71 1 75<br />
69 68 1 69<br />
66 63 5 66<br />
62 59 5 63<br />
52 48 8 53<br />
65 62 5 64<br />
58 58 - 56<br />
66% 64% 3% 67%<br />
65% 62% 5% 67%<br />
Apr<br />
2005<br />
Traffic Engineer’s Annual Report<br />
pay the normal airport parking fee electronically<br />
when they enter and exit the Orlando International<br />
Airport (OIA) terminal parking garages through the<br />
designated SunPass lanes. These customers will later<br />
receive an OIA parking receipt via e-mail.<br />
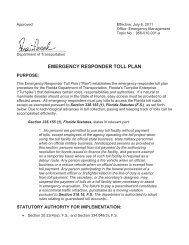
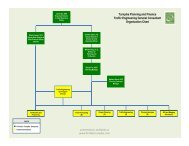
As shown in Graph 5.3, 28 percent of airport customers<br />
took advantage of this payment option<br />
during June 2008, up from 15 percent when<br />
this program was launched. The Department<br />
is also working with city and airport officials<br />
across Florida to implement a similar program<br />
at the international airports in Fort Lauderdale,<br />
Tampa, Palm Beach and Miami.<br />
Jun<br />
2005<br />
Aug<br />
2005<br />
Oct<br />
2005<br />
Graph 5.3<br />
Percent ETC Parking Payments at OIA<br />
Dec<br />
2005<br />
Feb<br />
2006<br />
Apr<br />
2006<br />
Jun<br />
2006<br />
Aug<br />
2006<br />
Oct<br />
2006<br />
Dec<br />
2006<br />
Feb<br />
2007<br />
Apr<br />
2007<br />
Jun<br />
2007<br />
Aug<br />
2007<br />
Oct<br />
2007<br />
Dec<br />
2007<br />
Feb<br />
2008<br />
Furthermore, as a result of agreements signed with<br />
two private companies in September 2007, rental car<br />
customers who do not own SunPass transponders are<br />
now able to use <strong>Turnpike</strong> facilities. With the help of<br />
license plate information to identify rental vehicles,<br />
tolls are electronically collected from these two service<br />
providers. Rental customers can either opt for<br />
a nominal fee plus the cash toll rate, or a flat daily/<br />
weekly fee for unlimited use of <strong>Turnpike</strong> toll roads<br />
on their rental agreements. This program provides a<br />
valuable benefit to car renters across the state. In FY<br />
2008, over half a million rental car transactions were<br />
processed since the introduction of this program in<br />
September.<br />
The <strong>Turnpike</strong> is continuing its efforts towards increasing<br />
SunPass participation, mitigating toll violations<br />
and enhancing infrastructure for increased throughput.<br />
Some of the key projects currently underway<br />
include the addition of SunPass-only lanes, conversion<br />
of select toll plazas to Open Road Tolling (ORT)<br />
SunPass<br />
Apr<br />
2008<br />
Jun<br />
2008<br />
79
80<br />
Traffic Engineer’s Annual Report<br />
and the recent introduction of low cost Mini sticker<br />
Tag to customers. ORT allows customers to pay tolls<br />
electronically while traveling at highway speeds.<br />
Mainline toll plazas on commuter facilities with high<br />
SunPass participation are being converted to ORT<br />
at an accelerated pace. As such, Bird Road and<br />
Homestead Toll Plazas on the HEFT, Sunrise Toll Plaza<br />
on the Sawgrass Expressway, Cypress Creek Toll<br />
Plaza on the Southern Coin System and Lantana Toll<br />
Plaza on the Ticket System were converted to ORT<br />
in FY 2008. More conversions are planned on other<br />
facilities in the upcoming years.<br />
As more SunPass-only lanes are added, the <strong>Turnpike</strong><br />
is susceptible to higher risk of toll evasion. As part of<br />
the comprehensive approach to mitigate this risk,<br />
the <strong>Turnpike</strong> partnered with Florida’s Highway Patrol<br />
to launch a highly effective “Toll Abuse. No Excuse.”<br />
campaign in FY 2007 primarily aimed at repeat<br />
violators. Additionally, a new toll violation business<br />
rule was implemented starting January 2007 that<br />
provides for the issuance of an Unpaid Toll Notice<br />
(UTN) which describes in detail each instance of<br />
toll violation. Each toll violation included in the UTN<br />
can lead to Uniform Traffic Citation if not paid within<br />
the stated time period. Furthermore, the House Bill<br />
985 passed in FY 2007 requires specific location and<br />
display of license plates and prohibits tampering<br />
with an intent to obscure a camera from taking a<br />
picture. The Bill also allows the suspension of driver’s<br />
licenses of those with excessive toll violations.<br />
The SunPass program is supported by two Customer<br />
Service Centers located in Boca Raton and Orlando.<br />
These Call Centers provide an outstanding customer<br />
service to <strong>Turnpike</strong> customers. In fact, the Call<br />
Centers have been recognized for their customer<br />
service excellence by J.D. Powers and Associates<br />
for the second time. This recognition is the most prestigious<br />
in the call center industry.<br />
5.1 CurrEnT TransaCTions and<br />
rEvEnuE<br />
The number of SunPass transactions on the <strong>Turnpike</strong><br />
System increased during FY 2008 to approximately<br />
437 million, compared to 427 million in FY 2007; an<br />
increase of 2 percent. Table 5.2 provides a summary<br />
of SunPass and conventional transactions by facility<br />
during FY 2008.<br />
SunPass<br />
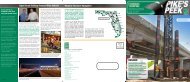
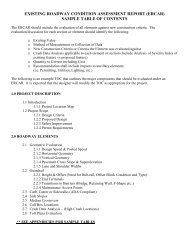
SunPass revenue collected during FY 2008 was $387<br />
million, or 61 percent of total toll revenues collected<br />
on the <strong>Turnpike</strong> System. Graph 5.4 shows the monthly<br />
cash and SunPass revenues during FY 2008.<br />
Toll Revenue (in millions)<br />
$70<br />
$60<br />
$50<br />
$40<br />
$30<br />
$20<br />
$10<br />
<strong>Turnpike</strong> Facility ETC Conventional Total Participation<br />
HEFT<br />
Southern Coin System<br />
Ticket System<br />
Northern Coin System<br />
Beachline West Expressway<br />
Sawgrass Expressway<br />
Seminole Expressway<br />
Veterans Expressway<br />
Southern Connector Extension<br />
Polk Parkway<br />
Suncoast Parkway<br />
Western Beltway, Part C<br />
Total System<br />
$0<br />
Jul Aug Sep Oct Nov Dec Jan Feb Mar Apr May Jun<br />
5.1.1 MaInlIne<br />
Table 5.2<br />
ETC Transactions and Participation<br />
FY 2008<br />
Annual Transactions (000)<br />
Note: ETC transactions include SunPass, E-PASS and O-PASS.<br />
115,927 53,957 169,884 68%<br />
87,588 46,910 134,498 65<br />
32,871 15,100 47,971 69<br />
37,538 26,016 63,554 59<br />
13,517 11,956 25,473 53<br />
50,365 19,138 69,503 72<br />
24,794 10,925 35,719 69<br />
33,138 17,448 50,586 66<br />
6,005 3,755 9,760 62<br />
14,214 13,116 27,330 52<br />
18,222 9,892 28,114 65<br />
2,838 2,090 4,928 58<br />
437,017 230,303 667,320 65%<br />
Graph 5.4<br />
Toll Revenue by Payment Type<br />
FY 2008<br />
Month<br />
Cash Revenues SunPass Revenues<br />
HEFT: Table 5.3 summarizes the monthly number of<br />
SunPass and conventional transactions on the HEFT<br />
during FY 2008. Annual SunPass transactions totaled<br />
nearly 116 million, representing an average of 317<br />
thousand SunPass transactions each day. Average<br />
SunPass participation on the HEFT reached 68 percent<br />
during FY 2008, compared to 63 percent in the<br />
preceding fiscal year. This level of participation is<br />
attributed to the large number of local commuters<br />
in the area who use SunPass and increasing number
Month SunPass Conventional Total<br />
July 2007<br />
August<br />
September<br />
October<br />
November<br />
December<br />
January 2008<br />
February<br />
March<br />
April<br />
May<br />
June<br />
Total<br />
Table 5.3<br />
HEFT SunPass Transactions and Participation<br />
FY 2008<br />
Number of Transactions (000)<br />
Source: <strong>Turnpike</strong> Enterprise Finance Office<br />
SunPass<br />
Participation<br />
9,571 4,783 14,354 66.7%<br />
10,138 4,771 14,909 68.0<br />
9,338 4,403 13,741 68.0<br />
10,147 4,648 14,795 68.6<br />
9,497 4,742 14,239 66.7<br />
9,274 4,737 14,011 66.2<br />
9,639 4,493 14,132 68.2<br />
9,533 4,331 13,864 68.8<br />
9,994 4,618 14,612 68.4<br />
9,859 4,274 14,133 69.8<br />
9,848 4,224 14,072 70.0<br />
9,089 3,933 13,022 69.8<br />
115,927 53,957 169,884 68.2%<br />
of SunPass-only lanes due to conversion of toll plazas<br />
to Open Road Tolling (ORT).<br />
As indicated in Table 5.4, total SunPass revenues on<br />
the HEFT was nearly $71 million in FY 2008. This amount<br />
represents an increase of nearly $600 thousand (or<br />
approximately 1 percent) over the same period in FY<br />
2007. This low growth rate is attributed to dramatic<br />
slowdown in the economy triggered by the housing<br />
correction, and the unprecedented rise in fuel<br />
prices.<br />
Months FY 2008 FY 2007 Amount Change<br />
July<br />
August<br />
September<br />
1st Quarter Subtotal<br />
October<br />
November<br />
December<br />
2nd Quarter Subtotal<br />
January<br />
February<br />
March<br />
3rd Quarter Subtotal<br />
April<br />
May<br />
June<br />
4th Quarter Subtotal<br />
Annual Total<br />
Table 5.4<br />
HEFT<br />
Quarterly SunPass Revenue Results<br />
FY 2008 vs. FY 2007<br />
Source: <strong>Turnpike</strong> Enterprise Finance Office<br />
Variance<br />
$5,931,482 $4,703,939 $1,227,543 26.1%<br />
6,257,217 5,925,753 331,464 5.6<br />
5,695,767 5,604,986 90,781 1.6<br />
17,884,466 16,234,678 1,649,788 10.2<br />
6,250,788 5,936,466 314,322 5.3<br />
5,735,063 5,821,002 (85,939) (1.5)<br />
5,627,702 5,725,680 (97,978) (1.7)<br />
17,613,553 17,483,148 130,405 0.7<br />
5,872,694 5,951,266 (78,572) (1.3)<br />
5,790,085 5,698,571 91,514 1.6<br />
6,075,613 6,459,576 (383,963) (5.9)<br />
17,738,392 18,109,413 (371,021) (2.0)<br />
6,057,521 5,929,669 127,852 2.2<br />
5,949,070 6,474,368 (525,298) (8.1)<br />
5,463,352 5,922,329 (458,977) (7.7)<br />
17,469,943 18,326,366 (856,423) (4.7)<br />
$70,706,354 $70,153,605 $552,749 0.8%<br />
Traffic Engineer’s Annual Report<br />
southern Coin system: Table 5.5 summarizes the<br />
monthly number of SunPass and conventional<br />
transactions on the Southern Coin System during FY<br />
2008. Annual SunPass transactions totaled nearly 88<br />
million, representing an average of 239 thousand<br />
SunPass transactions each day. Average SunPass<br />
participation on the Southern Coin System reached<br />
65 percent during FY 2008, compared to 62 percent<br />
in the preceding year.<br />
Month SunPass Conventional Total<br />
July, 2007<br />
August<br />
September<br />
October<br />
November<br />
December<br />
January, 2008<br />
February<br />
March<br />
April<br />
May<br />
June<br />
Total<br />
Table 5.5<br />
Southern Coin System<br />
SunPass Transactions and Participation<br />
FY 2008<br />
Source: <strong>Turnpike</strong> Enterprise Finance Office<br />
Number of Transactions (000)<br />
SunPass<br />
Participation<br />
7,183 4,007 11,190 64.2%<br />
7,703 4,154 11,857 65.0<br />
6,928 3,800 10,728 64.6<br />
7,506 4,075 11,581 64.8<br />
7,257 3,887 11,144 65.1<br />
7,052 4,020 11,072 63.7<br />
7,352 3,983 11,335 64.9<br />
7,223 3,924 11,147 64.8<br />
7,652 4,177 11,829 64.7<br />
7,478 3,767 11,245 66.5<br />
7,503 3,735 11,238 66.8<br />
6,751 3,381 10,132 66.6<br />
87,588 46,910 134,498 65.1%<br />
As indicated in Table 5.6, total SunPass revenues on<br />
the Southern Coin System approached $65 million<br />
in FY 2008. This amount represents a decrease of<br />
nearly $228 thousand (or about half a percent) over<br />
the same period in FY 2007. With the exception of the<br />
first quarter, all subsequent quarters show an escalating<br />
decline in revenues due to the deteriorating<br />
economy, rising fuel prices and to some extent the<br />
impact of construction activities along the facility.<br />
Ticket system: Table 5.7 summarizes the monthly<br />
number of SunPass and conventional transactions<br />
on the Ticket System during FY 2008. Annual SunPass<br />
transactions approached 33 million, representing an<br />
average of nearly 90 thousand SunPass transactions<br />
each day. Average SunPass participation on the<br />
Ticket System reached 69 percent during FY 2008,<br />
compared to 64 percent last year.<br />
SunPass<br />
81
82<br />
Traffic Engineer’s Annual Report<br />
This level of participation is primarily attributed to the<br />
increasing number of commuters in the urban areas<br />
to the west of the <strong>Turnpike</strong> in Palm Beach, Martin,<br />
and St. Lucie counties. Additionally, three new<br />
SunPass-only interchanges were added on the ticket<br />
SunPass<br />
Table 5.6<br />
Southern Coin System<br />
Quarterly SunPass Revenue Results<br />
FY 2008 vs. FY 2007<br />
Variance<br />
Months FY 2008 FY 2007 Amount Change<br />
July<br />
$4,635,360 $3,938,538 $696,822 17.7%<br />
August<br />
5,006,390 4,513,834 492,556 10.9<br />
September<br />
4,451,628 4,502,734 (51,106) (1.1)<br />
1st Quarter Subtotal 14,093,378 12,955,106 1,138,272 8.8<br />
October<br />
4,813,336 4,774,974 38,362 0.8<br />
November<br />
4,692,640 4,678,085 14,555 0.3<br />
December<br />
4,514,160 4,659,025 (144,865) (3.1)<br />
2nd Quarter Subtotal 14,020,136 14,112,084 (91,948) (0.7)<br />
January<br />
4,710,912 4,952,414 (241,502) (4.9)<br />
February<br />
4,643,391 4,514,131 129,260 2.9<br />
March<br />
4,917,252 5,247,463 (330,211) (6.3)<br />
3rd Quarter Subtotal 14,271,555 14,714,008 (442,453) (3.0)<br />
April<br />
4,825,240 4,835,930 (10,690) (0.2)<br />
May<br />
4,771,527 5,123,142 (351,615) (6.9)<br />
June<br />
4,330,328 4,728,209 (397,881) (8.4)<br />
4th Quarter Subtotal 13,927,095 14,687,281 (760,186) (5.2)<br />
Lantana Adjustment * 8,303,363 8,374,836 (71,473) (0.9)<br />
Annual Total $64,615,527 $64,843,315 ($227,788) (0.4%)<br />
Source: <strong>Turnpike</strong> Enterprise Finance Office<br />
* Amount based on actual two-way revenue traffic at the plaza multiplied by an average<br />
adjustment rate. See Note G in Appendix D for further description of adjustment.<br />
Table 5.7<br />
Ticket System<br />
SunPass Transactions and Participation<br />
FY 2008<br />
Month SunPass Conventional Total<br />
July, 2007<br />
August<br />
September<br />
October<br />
November<br />
December<br />
January, 2008<br />
February<br />
March<br />
April<br />
May<br />
June<br />
Total<br />
Source: <strong>Turnpike</strong> Enterprise Finance Office<br />
Number of Transactions (000)<br />
SunPass<br />
Participation<br />
2,612 1,355 3,967 65.8%<br />
2,817 1,350 4,167 67.6<br />
2,576 1,149 3,725 69.2<br />
2,882 1,235 4,117 70.0<br />
2,716 1,228 3,944 68.9<br />
2,660 1,300 3,960 67.2<br />
2,759 1,247 4,006 68.9<br />
2,736 1,327 4,063 67.3<br />
2,858 1,484 4,342 65.8<br />
2,840 1,208 4,048 70.2<br />
2,831 1,160 3,991 70.9<br />
2,584 1,057 3,641 71.0<br />
32,871 15,100 47,971 68.5%<br />
system in recent years at SR 710, Becker Road and<br />
Jog Road to provide easy access to the <strong>Turnpike</strong> for<br />
the growing number of residents in these counties.<br />
As indicated in Table 5.8, total SunPass revenues on<br />
the Ticket System were nearly $85 million in FY 2008.<br />
This amount represents an increase of nearly $2 million<br />
(or 2 percent) over the same period in FY 2007.<br />
A moderate growth rate of 2 percent (compared<br />
to 13 percent in FY 2007) is attributed to persistent<br />
economic slowdown and high fuel cost to travel on<br />
a long distance ticket system.<br />
Table 5.8<br />
Ticket System<br />
Quarterly SunPass Revenue Results<br />
FY 2008 vs. FY 2007<br />
Variance<br />
Months FY 2008 FY 2007 Amount Change<br />
July<br />
$8,180,196 $7,424,333 $755,863 10.2%<br />
August<br />
8,613,359 7,338,276 1,275,083 17.4<br />
September<br />
7,564,761 7,345,511 219,250 3.0<br />
1st Quarter Subtotal 24,358,316 22,108,120 2,250,196 10.2<br />
October<br />
8,373,693 8,144,679 229,014 2.8<br />
November<br />
8,637,274 8,253,571 383,703 4.6<br />
December<br />
8,374,512 8,218,350 156,162 1.9<br />
2nd Quarter Subtotal 25,385,479 24,616,600 768,879 3.1<br />
January<br />
8,108,917 8,128,822 (19,905) (0.2)<br />
February<br />
7,539,172 7,420,970 118,202 1.6<br />
March<br />
8,321,764 8,667,822 (346,058) (4.0)<br />
3rd Quarter Subtotal 23,969,853 24,217,614 (247,761) (1.0)<br />
April<br />
8,236,671 8,295,400 (58,729) (0.7)<br />
May<br />
8,462,640 8,616,411 (153,771) (1.8)<br />
June<br />
7,639,052 8,181,943 (542,891) (6.6)<br />
4th Quarter Subtotal 24,338,363 25,093,754 (755,391) (3.0)<br />
Lantana Adjustment* (8,303,363) (8,374,836) 71,473 (0.9)<br />
Three Lakes Adjustment** (4,987,900) (4,788,442) (199,458) 4.2<br />
Total Adjustments (13,291,263) (13,163,278) (127,985) 1.0<br />
Annual Total $84,760,748 $82,872,810 $1,887,938 2.3%<br />
Source: <strong>Turnpike</strong> Enterprise Finance Office<br />
* Allocated to Southern Coin System, amount based on actual two-way revenue traffic at<br />
the plaza multiplied by an average adjustment rate.<br />
** Allocated to Northern Coin System, amount based on actual two-way revenue traffic at<br />
the plaza multiplied by an average adjustment rate.<br />
northern Coin system: Table 5.9 summarizes the<br />
monthly number of SunPass and conventional transactions<br />
on the Northern Coin System during FY 2008.<br />
Annual SunPass transactions approached 38 million,<br />
representing an average of nearly 103 thousand<br />
SunPass transactions each day. Average SunPass<br />
participation on the Northern Coin System was 59<br />
percent during FY 2008, compared to 56 percent in<br />
the preceding fiscal year.
Month SunPass Conventional Total<br />
July, 2007<br />
August<br />
September<br />
October<br />
November<br />
December<br />
January, 2008<br />
February<br />
March<br />
April<br />
May<br />
June<br />
Total<br />
Table 5.9<br />
Northern Coin System<br />
SunPass Transactions and Participation<br />
FY 2008<br />
Source: <strong>Turnpike</strong> Enterprise Finance Office<br />
Number of Transactions (000)<br />
SunPass<br />
Participation<br />
3,101 2,401 5,502 56.4%<br />
3,269 2,225 5,494 59.5<br />
2,960 1,959 4,919 60.2<br />
3,320 2,176 5,496 60.4<br />
3,143 2,178 5,321 59.1<br />
3,119 2,281 5,400 57.8<br />
3,139 2,077 5,216 60.2<br />
3,053 2,096 5,149 59.3<br />
3,240 2,401 5,641 57.4<br />
3,144 2,102 5,246 59.9<br />
3,137 2,053 5,190 60.4<br />
2,913 2,067 4,980 58.5<br />
37,538 26,016 63,554 59.1%<br />
As indicated in Table 5.10, total SunPass revenues<br />
on the Northern Coin System were $45 million in FY<br />
2008. This amount represents an increase of nearly<br />
$2 million (or 4 percent) over the same period in FY<br />
2007. The comparable increase in revenue in FY 2007<br />
was $6 million, or 16 percent. The decline in revenue<br />
Table 5.10<br />
Northern Coin System<br />
Quarterly SunPass Revenue Results<br />
FY 2008 vs. FY 2007<br />
Months FY 2008 FY 2007 Amount Change<br />
July<br />
August<br />
September<br />
1st Quarter Subtotal<br />
October<br />
November<br />
December<br />
2nd Quarter Subtotal<br />
January<br />
February<br />
March<br />
3rd Quarter Subtotal<br />
April<br />
May<br />
June<br />
4th Quarter Subtotal<br />
Three Lakes Adjustment *<br />
Annual Total<br />
Variance<br />
$3,353,286 $2,927,971 $425,315 14.5%<br />
3,534,234 3,132,656 401,578 12.8<br />
3,168,709 3,011,317 157,392 5.2<br />
10,056,229 9,071,944 984,285 10.8<br />
3,468,897 3,186,284 282,613 8.9<br />
3,437,651 3,139,191 298,460 9.5<br />
3,290,988 3,139,349 151,639 4.8<br />
10,197,536 9,464,824 732,712 7.7<br />
3,328,403 3,198,800 129,603 4.1<br />
3,226,355 3,054,035 172,320 5.6<br />
3,440,081 3,509,468 (69,387) (2.0)<br />
9,994,839 9,762,303 232,536 2.4<br />
3,361,478 3,344,320 17,158 0.5<br />
3,322,437 3,502,607 (180,170) (5.1)<br />
3,103,131 3,343,006 (239,875) (7.2)<br />
9,787,046 10,189,933 (402,887) (4.0)<br />
4,987,900 4,788,442 199,458 4.2<br />
$45,023,550 $43,277,446 $1,746,104 4.0%<br />
Source: <strong>Turnpike</strong> Enterprise Finance Office<br />
* Amount based on actual two-way revenue traffic at the plaza multiplied by an average adjustment rate.<br />
See Note G in Appendix D for further description of adjustment.<br />
Traffic Engineer’s Annual Report<br />
growth in FY 2008 compared to FY 2007 is attributed<br />
to the economic downturn, high fuel prices, and to<br />
some extent, the ongoing widening project from<br />
Beachline West to Gotha Road on this facility.<br />
Beachline West Expressway: Table 5.11 summarizes the<br />
monthly number of SunPass and conventional transactions<br />
on the Beachline West Expressway during<br />
FY 2008. Annual SunPass transactions approached<br />
14 million, representing an average of 37 thousand<br />
SunPass transactions each day. Average SunPass<br />
participation on the Beachline West Expressway was<br />
53 percent during FY 2008, compared to 52 percent<br />
last year.<br />
Month SunPass Conventional Total<br />
July, 2007<br />
August<br />
September<br />
October<br />
November<br />
December<br />
January, 2008<br />
February<br />
March<br />
April<br />
May<br />
June<br />
Total<br />
Table 5.11<br />
Beachline West Expressway<br />
SunPass Transactions and Participation<br />
FY 2008<br />
Source: <strong>Turnpike</strong> Enterprise Finance Office<br />
Number of Transactions (000)<br />
As indicated in Table 5.12, total SunPass revenues on<br />
the Beachline West Expressway exceeded $7 million<br />
in FY 2008. This amount represents an increase of $78<br />
thousand (or 1 percent) over the same period in FY<br />
2007. The relatively flat growth is attributed to the<br />
persistent slowdown in the economy and the volatility<br />
in the tourism sector.<br />
5.1.2 exPanSIon ProJectS<br />
SunPass<br />
Participation<br />
1,162 1,014 2,176 53.4%<br />
1,167 993 2,160 54.0<br />
1,044 810 1,854 56.3<br />
1,202 975 2,177 55.2<br />
1,138 964 2,102 54.1<br />
1,073 980 2,053 52.3<br />
1,118 998 2,116 52.8<br />
1,132 1,052 2,184 51.8<br />
1,191 1,154 2,345 50.8<br />
1,139 1,036 2,175 52.4<br />
1,147 1,003 2,150 53.3<br />
1,004 977 1,981 50.7<br />
13,517 11,956 25,473 53.1%<br />
sawgrass Expressway: Table 5.13 summarizes the<br />
monthly number of SunPass and conventional transactions<br />
on the Sawgrass Expressway during FY 2008.<br />
Annual SunPass transactions exceeded 50 million,<br />
SunPass<br />
83
84<br />
Traffic Engineer’s Annual Report<br />
Months FY 2008 FY 2007 Amount Change<br />
July<br />
August<br />
September<br />
1st Quarter Subtotal<br />
October<br />
November<br />
December<br />
2nd Quarter Subtotal<br />
January<br />
February<br />
March<br />
3rd Quarter Subtotal<br />
April<br />
May<br />
June<br />
4th Quarter Subtotal<br />
Annual Total<br />
Source: <strong>Turnpike</strong> Enterprise Finance Office<br />
representing an average of 138 thousand SunPass<br />
transactions each day. Average SunPass participation<br />
on the Sawgrass Expressway reached 73 percent<br />
during FY 2008, the highest among all the <strong>Turnpike</strong><br />
facilities.<br />
As indicated in Table 5.14, total SunPass revenues on<br />
the Sawgrass Expressway were nearly $37 million in<br />
FY 2008. This amount represents an increase of $677<br />
thousand (or 2 percent) over the same period in FY<br />
SunPass<br />
Table 5.12<br />
Beachline West Expressway<br />
Quarterly SunPass Revenue Results<br />
FY 2008 vs. FY 2007<br />
Variance<br />
$643,330 $553,545 $89,785 16.2%<br />
670,192 588,740 81,452 13.8<br />
581,262 559,171 22,091 4.0<br />
1,894,784 1,701,456 193,328 11.4<br />
655,855 610,801 45,054 7.4<br />
630,158 586,996 43,162 7.4<br />
591,325 589,174 2,151 0.4<br />
1,877,338 1,786,971 90,367 5.1<br />
620,263 628,300 (8,037) (1.3)<br />
623,288 612,183 11,105 1.8<br />
652,585 702,886 (50,301) (7.2)<br />
1,896,136 1,943,369 (47,233) (2.4)<br />
627,407 642,332 (14,925) (2.3)<br />
627,832 681,905 (54,073) (7.9)<br />
555,334 644,686 (89,352) (13.9)<br />
1,810,573 1,968,923 (158,350) (8.0)<br />
$7,478,831 $7,400,719 $78,112 1.1%<br />
Table 5.13<br />
Sawgrass Expressway<br />
SunPass Transactions and Participation<br />
FY 2008<br />
Number of Transactions (000)<br />
SunPass<br />
Month SunPass Conventional Total Participation<br />
July, 2007<br />
4,091 1,533 5,624 72.7%<br />
August<br />
4,394 1,719 6,113 71.9<br />
September<br />
4,055 1,450 5,505 73.7<br />
October<br />
4,442 1,621 6,063 73.3<br />
November<br />
4,265 1,601 5,866 72.7<br />
December<br />
3,605 1,630 5,235 68.9<br />
January, 2008 4,038 1,701 5,739 70.4<br />
February<br />
4,022 1,827 5,849 68.8<br />
March<br />
4,475 1,711 6,186 72.3<br />
April<br />
4,381 1,519 5,900 74.3<br />
May<br />
4,461 1,472 5,933 75.2<br />
June<br />
4,136 1,354 5,490 75.3<br />
Total<br />
50,365 19,138 69,503 72.5%<br />
Source: <strong>Turnpike</strong> Enterprise Finance Office<br />
2007. A modest growth of 2 percent (compared to 12<br />
percent in the prior year) is attributed to economic<br />
conditions as described earlier and in part due to<br />
the extensive widening projects and toll plaza modifications.<br />
Source: <strong>Turnpike</strong> Enterprise Finance Office.<br />
Table 5.14<br />
Sawgrass Expressway<br />
Quarterly SunPass Revenue Results<br />
FY 2008 vs. FY 2007<br />
Months FY 2008 FY 2007 Amount Change<br />
July<br />
August<br />
September<br />
1st Quarter Subtotal<br />
October<br />
November<br />
December<br />
2nd Quarter Subtotal<br />
January<br />
February<br />
March<br />
3rd Quarter Subtotal<br />
April<br />
May<br />
June<br />
4th Quarter Subtotal<br />
Annual Total<br />
Source: <strong>Turnpike</strong> Enterprise Finance Office<br />
Variance<br />
$2,951,819 $2,409,573 $542,246 22.5%<br />
3,162,336 3,007,779 154,557 5.1<br />
2,910,146 2,857,641 52,505 1.8<br />
9,024,301 8,274,993 749,308 9.1<br />
3,210,666 3,054,807 155,859 5.1<br />
3,035,901 2,997,698 38,203 1.3<br />
2,988,265 2,986,523 1,742 0.1<br />
9,234,832 9,039,028 195,804 2.2<br />
3,034,806 3,111,033 (76,227) (2.5)<br />
2,978,228 2,958,712 19,516 0.7<br />
3,231,766 3,318,587 (86,821) (2.6)<br />
9,244,800 9,388,332 (143,532) (1.5)<br />
3,136,759 3,022,624 114,135 3.8<br />
3,139,640 3,256,565 (116,925) (3.6)<br />
2,868,099 2,990,374 (122,275) (4.1)<br />
9,144,498 9,269,563 (125,065) (1.3)<br />
$36,648,431 $35,971,916 $676,515 1.9%<br />
The <strong>Turnpike</strong> continues to move forward with plans<br />
to implement Open Road Tolling (ORT) on the entire<br />
Sawgrass Expressway. As such, conversion at Sunrise<br />
Toll Plaza is already complete. ORT allows SunPass<br />
customers to pay tolls electronically at highway<br />
speed while maintaining cash toll collection in select<br />
outside lanes for the benefit of customers who do<br />
not have SunPass. A very high SunPass participation<br />
at this facility makes it ideal for ORT conversion.<br />
seminole Expressway: Table 5.15 summarizes the<br />
monthly number of SunPass and conventional<br />
transactions on the Seminole Expressway during FY<br />
2008. Annual SunPass transactions were nearly 25<br />
million, representing an average of 68 thousand<br />
SunPass transactions each day. Average SunPass<br />
participation on the Seminole Expressway reached<br />
69 percent during FY 2008. This level of participation<br />
is one of the highest on the <strong>Turnpike</strong> System primarily<br />
due to the connectivity of the Seminole Expressway<br />
with OOCEA’s Central Florida GreeneWay which has<br />
many E-Pass commuters.
Month SunPass Conventional Total<br />
July, 2007<br />
August<br />
September<br />
October<br />
November<br />
December<br />
January, 2008<br />
February<br />
March<br />
April<br />
May<br />
June<br />
Total<br />
Table 5.15<br />
Seminole Expressway<br />
SunPass Transactions and Participation<br />
FY 2008<br />
Source: <strong>Turnpike</strong> Enterprise Finance Office<br />
Number of Transactions (000)<br />
SunPass<br />
Participation<br />
2,017 948 2,965 68.0%<br />
2,169 980 3,149 68.9<br />
2,007 886 2,893 69.4<br />
2,193 946 3,139 69.9<br />
2,038 898 2,936 69.4<br />
2,007 924 2,931 68.5<br />
2,071 883 2,954 70.1<br />
2,033 896 2,929 69.4<br />
2,126 945 3,071 69.2<br />
2,102 876 2,978 70.6<br />
2,091 889 2,980 70.2<br />
1,940 854 2,794 69.4<br />
24,794 10,925 35,719 69.4%<br />
As indicated in Table 5.16, total SunPass revenues on<br />
the Seminole Expressway were nearly $25 million in<br />
FY 2008. This amount represents an increase of nearly<br />
$506 thousand (or 2 percent) over the same period<br />
in FY 2007. This modest growth of 2 percent (compared<br />
to 12 percent in the prior year) is due to the<br />
dramatic slowdown in the economy.<br />
Table 5.16<br />
Seminole Expressway<br />
Quarterly SunPass Revenue Results<br />
FY 2008 vs. FY 2007<br />
Months FY 2008 FY 2007 Amount Change<br />
July<br />
August<br />
September<br />
1st Quarter Subtotal<br />
October<br />
November<br />
December<br />
2nd Quarter Subtotal<br />
January<br />
February<br />
March<br />
3rd Quarter Subtotal<br />
April<br />
May<br />
June<br />
4th Quarter Subtotal<br />
Annual Total<br />
Source: <strong>Turnpike</strong> Enterprise Finance Office<br />
Variance<br />
$2,023,192 $1,639,487 $383,705 23.4%<br />
2,191,588 2,158,723 32,865 1.5<br />
1,983,950 1,929,211 54,739 2.8<br />
6,198,730 5,727,421 471,309 8.2<br />
2,179,014 2,027,081 151,933 7.5<br />
2,011,456 1,943,973 67,483 3.5<br />
1,946,367 1,926,065 20,302 1.1<br />
6,136,837 5,897,119 239,718 4.1<br />
2,039,383 2,040,000 (617) 0.0<br />
2,006,162 1,932,259 73,903 3.8<br />
2,095,676 2,164,821 (69,145) (3.2)<br />
6,141,221 6,137,080 4,141 0.1<br />
2,077,053 2,028,388 48,665 2.4<br />
2,052,626 2,200,219 (147,593) (6.7)<br />
1,902,219 2,012,853 (110,634) (5.5)<br />
6,031,898 6,241,460 (209,562) (3.4)<br />
$24,508,686 $24,003,080 $505,606 2.1%<br />
Traffic Engineer’s Annual Report<br />
veterans Expressway: Table 5.17 summarizes the<br />
monthly number of SunPass and conventional transactions<br />
on the Veterans Expressway during FY 2008.<br />
Annual SunPass transactions exceeded 33 million,<br />
representing an average of nearly 91 thousand<br />
SunPass transactions each day. Average SunPass<br />
participation on the Veterans Expressway was 66<br />
percent during FY 2008, compared to 63 percent in<br />
the preceding fiscal year.<br />
Table 5.17<br />
Veterans Expressway<br />
SunPass Transactions and Participation<br />
FY 2008<br />
Month SunPass Conventional Total<br />
July, 2007<br />
August<br />
September<br />
October<br />
November<br />
December<br />
January, 2008<br />
February<br />
March<br />
April<br />
May<br />
June<br />
Total<br />
Source: <strong>Turnpike</strong> Enterprise Finance Office<br />
Number of Transactions (000)<br />
SunPass<br />
Participation<br />
2,696 1,485 4,181 64.5%<br />
2,900 1,501 4,401 65.9<br />
2,638 1,378 4,016 65.7<br />
2,957 1,467 4,424 66.8<br />
2,716 1,435 4,151 65.4<br />
2,776 1,542 4,318 64.3<br />
2,782 1,418 4,200 66.2<br />
2,695 1,429 4,124 65.3<br />
2,786 1,554 4,340 64.2<br />
2,780 1,467 4,247 65.5<br />
2,793 1,442 4,235 66.0<br />
2,619 1,330 3,949 66.3<br />
33,138 17,448 50,586 65.5%<br />
As indicated in Table 5.18, total SunPass revenues on<br />
the Veterans Expressway were $20 million in FY 2008.<br />
This amount represents an increase of $298 thousand<br />
(or 2 percent) over the same period in FY 2007. The<br />
current growth rate of 2 percent is significantly less<br />
than 13 percent in the prior year due to the overall<br />
decline in traffic, particularly multi-axle vehicles.<br />
southern Connector Extension: Table 5.19 summarizes<br />
the monthly number of SunPass and conventional<br />
transactions on the Southern Connector<br />
Extension during FY 2008. Annual SunPass transactions<br />
were 6 million, representing an average of approximately<br />
16 thousand SunPass transactions each day.<br />
Average SunPass participation on the Southern<br />
Connector Extension was 62 percent during FY<br />
2008, up from 59 percent last year. Compared to the<br />
Seminole Expressway, SunPass participation on the<br />
Southern Connector Extension is lower due to the<br />
SunPass<br />
85
86<br />
Traffic Engineer’s Annual Report<br />
fact that the facility serves a higher percentage of<br />
tourists traveling between the Orlando International<br />
Airport and the theme park attractions.<br />
Table 5.19<br />
Southern Connector Extension<br />
SunPass Transactions and Participation<br />
FY 2008<br />
Month SunPass Conventional Total<br />
July, 2007<br />
August<br />
September<br />
October<br />
November<br />
December<br />
January, 2008<br />
February<br />
March<br />
April<br />
May<br />
June<br />
Total<br />
Source: <strong>Turnpike</strong> Enterprise Finance Office<br />
As indicated in Table 5.20, total SunPass revenues on<br />
the Southern Connector Extension were nearly $3 million<br />
in FY 2008. This amount represents an increase of<br />
$162 thousand (or 6 percent) over the same period<br />
in FY 2007.<br />
SunPass<br />
Table 5.18<br />
Veterans Expressway<br />
Quarterly SunPass Revenue Results<br />
FY 2008 vs. FY 2007<br />
Number of Transactions (000)<br />
Variance<br />
Months FY 2008 FY 2007 Amount Change<br />
July<br />
$1,669,075 $1,495,326 $173,749 11.6%<br />
August<br />
1,790,451 1,669,743 120,708 7.2<br />
September<br />
1,628,360 1,550,614 77,746 5.0<br />
1st Quarter Subtotal 5,087,886 4,715,683 372,203 7.9<br />
October<br />
1,781,618 1,693,712 87,906 5.2<br />
November<br />
1,670,985 1,647,315 23,670 1.4<br />
December<br />
1,689,402 1,669,006 20,396 1.2<br />
2nd Quarter Subtotal 5,142,005 5,010,033 131,972 2.6<br />
January<br />
1,710,987 1,712,772 (1,785) (0.1)<br />
February<br />
1,661,301 1,598,899 62,402 3.9<br />
March<br />
1,723,867 1,802,789 (78,922) (4.4)<br />
3rd Quarter Subtotal 5,096,155 5,114,460 (18,305) (0.4)<br />
April<br />
1,719,437 1,713,150 6,287 0.4<br />
May<br />
1,723,930 1,830,414 (106,484) (5.8)<br />
June<br />
1,611,320 1,699,106 (87,786) (5.2)<br />
4th Quarter Subtotal 5,054,687 5,242,670 (187,983) (3.6)<br />
Annual Total $20,380,733 $20,082,846 $297,887 1.5%<br />
Source: <strong>Turnpike</strong> Enterprise Finance Office<br />
SunPass<br />
Participation<br />
507 344 851 59.6%<br />
517 320 837 61.8<br />
460 255 715 64.3<br />
504 297 801 62.9<br />
491 296 787 62.4<br />
509 336 845 60.2<br />
479 303 782 61.3<br />
488 327 815 59.9<br />
546 381 927 58.9<br />
523 323 846 61.8<br />
512 294 806 63.5<br />
469 279 748 62.7<br />
6,005 3,755 9,760 61.5%<br />
Polk Parkway: Table 5.21 summarizes the monthly<br />
number of SunPass and conventional transactions<br />
on the Polk Parkway during FY 2008. Annual SunPass<br />
transactions exceeded 14 million, representing an<br />
average of 39 thousand daily SunPass transactions.<br />
Average SunPass participation on the Polk Parkway<br />
reached 52 percent during FY 2008, compared to 48<br />
percent last year.<br />
Table 5.21<br />
Polk Parkway<br />
SunPass Transactions and Participation<br />
FY 2008<br />
Month SunPass Conventional Total<br />
July, 2007<br />
August<br />
September<br />
October<br />
November<br />
December<br />
January, 2008<br />
February<br />
March<br />
April<br />
May<br />
June<br />
Total<br />
Months FY 2008 FY 2007 Amount Change<br />
July<br />
August<br />
September<br />
1st Quarter Subtotal<br />
October<br />
November<br />
December<br />
2nd Quarter Subtotal<br />
January<br />
February<br />
March<br />
3rd Quarter Subtotal<br />
April<br />
May<br />
June<br />
4th Quarter Subtotal<br />
Annual Total<br />
Table 5.20<br />
Southern Connector Extension<br />
Quarterly SunPass Revenue Results<br />
FY 2008 vs. FY 2007<br />
Source: <strong>Turnpike</strong> Enterprise Finance Office<br />
Source: <strong>Turnpike</strong> Enterprise Finance Office<br />
Number of Transactions (000)<br />
Variance<br />
$243,246 $200,023 $43,223 21.6%<br />
248,678 203,928 44,750 21.9<br />
218,587 195,650 22,937 11.7<br />
710,511 599,601 110,910 18.5<br />
239,572 207,752 31,820 15.3<br />
232,797 209,429 23,368 11.2<br />
230,661 219,748 10,913 5.0<br />
703,030 636,929 66,101 10.4<br />
225,291 223,433 1,858 0.8<br />
229,862 219,539 10,323 4.7<br />
256,122 261,408 (5,286) (2.0)<br />
711,275 704,380 6,895 1.0<br />
247,174 247,537 (363) (0.1)<br />
239,848 245,434 (5,586) (2.3)<br />
217,936 233,678 (15,742) (6.7)<br />
704,958 726,649 (21,691) (3.0)<br />
$2,829,774 $2,667,559 $162,215 6.1%<br />
SunPass<br />
Participation<br />
1,115 1,096 2,211 50.4%<br />
1,221 1,120 2,341 52.2<br />
1,112 1,035 2,147 51.8<br />
1,253 1,123 2,376 52.7<br />
1,156 1,059 2,215 52.2<br />
1,156 1,111 2,267 51.0<br />
1,183 1,091 2,274 52.0<br />
1,192 1,093 2,285 52.2<br />
1,243 1,176 2,419 51.4<br />
1,230 1,107 2,337 52.6<br />
1,221 1,087 2,308 52.9<br />
1,132 1,018 2,150 52.7<br />
14,214 13,116 27,330 52.0%
As indicated in Table 5.22, total SunPass revenues on<br />
the Polk Parkway were nearly $13 million in FY 2008.<br />
This amount represents an increase of $828 thousand<br />
(or 7 percent) over the same period in FY 2007.<br />
Months FY 2008 FY 2007 Amount Change<br />
July<br />
August<br />
September<br />
1st Quarter Subtotal<br />
October<br />
November<br />
December<br />
2nd Quarter Subtotal<br />
January<br />
February<br />
March<br />
3rd Quarter Subtotal<br />
April<br />
May<br />
June<br />
4th Quarter Subtotal<br />
Annual Total<br />
Table 5.22<br />
Polk Parkway<br />
Quarterly SunPass Revenue Results<br />
FY 2008 vs. FY 2007<br />
Source: <strong>Turnpike</strong> Enterprise Finance Office<br />
Variance<br />
$1,008,976 $834,918 $174,058 20.8%<br />
1,098,184 948,686 149,498 15.8<br />
991,576 895,859 95,717 10.7<br />
3,098,736 2,679,463 419,273 15.6<br />
1,099,573 960,410 139,163 14.5<br />
1,036,968 931,785 105,183 11.3<br />
1,020,838 952,169 68,669 7.2<br />
3,157,379 2,844,364 313,015 11.0<br />
1,052,347 1,020,624 31,723 3.1<br />
1,054,881 988,605 66,276 6.7<br />
1,093,751 1,097,926 (4,175) (0.4)<br />
3,200,979 3,107,155 93,824 3.0<br />
1,089,604 1,047,132 42,472 4.1<br />
1,078,471 1,103,333 (24,862) (2.3)<br />
1,004,002 1,019,303 (15,301) (1.5)<br />
3,172,077 3,169,768 2,309 0.1<br />
$12,629,171 $11,800,750 $828,421 7.0%<br />
suncoast Parkway: Table 5.23 summarizes the<br />
monthly number of SunPass and conventional transactions<br />
on the Suncoast Parkway during FY 2008.<br />
Month SunPass Conventional Total<br />
July, 2007<br />
August<br />
September<br />
October<br />
November<br />
December<br />
January, 2008<br />
February<br />
March<br />
April<br />
May<br />
June<br />
Total<br />
Table 5.23<br />
Suncoast Parkway<br />
SunPass Transactions and Participation<br />
FY 2008<br />
Source: <strong>Turnpike</strong> Enterprise Finance Office<br />
Number of Transactions (000)<br />
SunPass<br />
Participation<br />
1,480 827 2,307 64.2%<br />
1,612 835 2,447 65.9<br />
1,464 769 2,233 65.6<br />
1,619 818 2,437 66.4<br />
1,511 828 2,339 64.6<br />
1,527 869 2,396 63.7<br />
1,524 820 2,344 65.0<br />
1,503 840 2,343 64.1<br />
1,577 889 2,466 63.9<br />
1,525 827 2,352 64.8<br />
1,519 804 2,323 65.4<br />
1,361 766 2,127 64.0<br />
18,222 9,892 28,114 64.8%<br />
Traffic Engineer’s Annual Report<br />
Annual SunPass transactions exceeded 18 million,<br />
representing an average of 50 thousand SunPass<br />
transactions each day. Average SunPass participation<br />
on the Suncoast Parkway reached 65 percent<br />
during FY 2008, compared to 62 percent last year.<br />
As shown in Table 5.24, total SunPass revenues on the<br />
Suncoast Parkway were nearly $15 million in FY 2008.<br />
This amount represents an increase of $375 thousand<br />
(or 3 percent) over the same period in FY 2007. The<br />
current growth rate of 3 percent is significantly less<br />
than 19 percent in the prior year due to the persistent<br />
economic conditions.<br />
Months FY 2008 FY 2007 Amount Change<br />
July<br />
August<br />
September<br />
1st Quarter Subtotal<br />
October<br />
November<br />
December<br />
2nd Quarter Subtotal<br />
January<br />
February<br />
March<br />
3rd Quarter Subtotal<br />
April<br />
May<br />
June<br />
4th Quarter Subtotal<br />
Annual Total<br />
Table 5.24<br />
Suncoast Parkway<br />
Quarterly SunPass Revenue Results<br />
FY 2008 vs. FY 2007<br />
Source: <strong>Turnpike</strong> Enterprise Finance Office<br />
Variance<br />
$1,206,894 $1,051,287 $155,607 14.8%<br />
1,292,984 1,110,592 182,392 16.4<br />
1,177,298 1,103,945 73,353 6.6<br />
3,677,176 3,265,824 411,352 12.6<br />
1,265,204 1,166,736 98,468 8.4<br />
1,216,747 1,176,736 40,011 3.4<br />
1,214,130 1,176,760 37,370 3.2<br />
3,696,081 3,520,232 175,849 5.0<br />
1,218,435 1,196,631 21,804 1.8<br />
1,193,690 1,145,751 47,939 4.2<br />
1,260,101 1,301,546 (41,445) (3.2)<br />
3,672,226 3,643,928 28,298 0.8<br />
1,221,616 1,230,682 (9,066) (0.7)<br />
1,199,772 1,291,402 (91,630) (7.1)<br />
1,058,231 1,197,762 (139,531) (11.6)<br />
3,479,619 3,719,846 (240,227) (6.5)<br />
$14,525,102 $14,149,830 $375,272 2.7%<br />
Western Beltway, Part C: The Western Beltway, Part<br />
C partially opened to traffic in December 2005.<br />
The remaining six-mile section of the 11-mile facility<br />
opened in December 2006. FY 2008 is the first full year<br />
of operation of this new facility. Table 5.25 summarizes<br />
the monthly number of SunPass and conventional<br />
transactions on the Western Beltway, Part C<br />
during FY 2008. Annual SunPass transactions ramped<br />
up to nearly 3 million, representing an average of 8<br />
thousand SunPass transactions each day. Average<br />
SunPass participation on the Western Beltway, Part<br />
C was 58 percent during FY 2008. As shown in Table<br />
5.26, total SunPass revenues on the Western Beltway,<br />
Part C exceeded $3 million during FY 2008. Due to<br />
SunPass<br />
Source: Turnp<br />
87
88<br />
Traffic Engineer’s Annual Report<br />
Table 5.25<br />
Western Beltway, Part C<br />
SunPass Transactions and Participation<br />
FY 2008<br />
Month SunPass Conventional Total<br />
July, 2007<br />
August<br />
September<br />
October<br />
November<br />
December<br />
January, 2008<br />
February<br />
March<br />
April<br />
May<br />
June<br />
Total<br />
Source: <strong>Turnpike</strong> Enterprise Finance Office<br />
the phased opening of this facility, comparative<br />
revenue variance analysis is not meaningful and,<br />
therefore, is not presented.<br />
SunPass<br />
Number of Transactions (000)<br />
SunPass<br />
Participation<br />
224 187 411 54.5%<br />
235 162 397 59.2<br />
211 137 348 60.6<br />
233 161 394 59.1<br />
227 161 388 58.5<br />
225 172 397 56.7<br />
228 169 397 57.4<br />
236 178 414 57.0<br />
256 211 467 54.8<br />
259 190 449 57.7<br />
269 178 447 60.2<br />
235 184 419 56.1<br />
2,838 2,090 4,928 57.6%<br />
Table 5.26<br />
Western Beltway, Part C<br />
Quarterly SunPass Revenue Results<br />
FY 2008 vs. 2007*<br />
Months FY 2008 FY 2007<br />
July<br />
$271,194 $111,997<br />
August<br />
276,596 117,310<br />
September<br />
243,583 113,193<br />
1st Quarter Subtotal<br />
791,373 342,500<br />
October<br />
271,863 122,436<br />
November<br />
264,048 123,241<br />
December<br />
257,684 164,795<br />
2nd Quarter Subtotal 793,595 410,472<br />
January<br />
267,140 208,834<br />
February<br />
277,673 209,543<br />
March<br />
297,021 278,698<br />
3rd Quarter Subtotal 841,834 697,075<br />
April<br />
298,035 269,686<br />
May<br />
281,350 280,833<br />
June<br />
267,678 258,863<br />
4th Quarter Subtotal 847,063 809,382<br />
Annual Total $3,273,865 $2,259,429<br />
Source: <strong>Turnpike</strong> Enterprise Finance Office<br />
* On December 13, 2005, approximately 5 miles of the 11-mile<br />
<strong>Turnpike</strong> section from Seidel Road to US 192 opened to traffic.<br />
The remaining 6 miles opened to traffic on December 9, 2006.<br />
Due to the phase opening of this facility, fiscal year 2007<br />
revenues reflect partial year and variance analysis is not<br />
meaningful.<br />
5.2 TraFFiC CHaraCTErisTiCs<br />
SunPass traffic can change substantially depending<br />
on key factors such as the geographical region,<br />
month of the year, day of the week (weekday vs.<br />
weekend), and time of the day (peak vs. off-peak<br />
hours). The impact of all four factors on SunPass usage<br />
along the <strong>Turnpike</strong> is explored in this section. It is also<br />
important to understand the timing of SunPass usage<br />
for better planning of future operational improvements.<br />
The traffic attributes discussed here are shown<br />
only for the barrier toll plazas on the Mainline and the<br />
expansion projects. These attributes may be different<br />
from those observed at the ramp toll plazas.<br />
The barrier toll plazas on the Mainline include<br />
Okeechobee on the HEFT, Golden Glades and<br />
Cypress Creek on the Southern Coin System, Lantana<br />
and Three Lakes on the Ticket System, Leesburg on<br />
the Northern Coin System, and the Beachline West<br />
Expressway. Similarly, the barrier toll plazas on the<br />
expansion projects include Deerfield and Sunrise<br />
on the Sawgrass Expressway, Lake Jesup on the<br />
Seminole Expressway, Anderson and Sugarwood on<br />
the Veterans Expressway, the Southern Connector<br />
Extension mainline plaza, the Central mainline plaza<br />
on Polk Parkway, Anclote on the Suncoast Parkway,<br />
and the mainline plaza on the Western Beltway, Part C.<br />
5.2.1 regIonal VarIatIon<br />
For the purpose of this analysis, we identified four<br />
primary regions that serve all the <strong>Turnpike</strong> customers<br />
in Florida, and examined how SunPass usage<br />
changes between these regions. The first is the South<br />
Florida region which includes the HEFT, Southern<br />
Coin System, Sawgrass, and the southern part of<br />
the Ticket System. <strong>Turnpike</strong> facilities in this region<br />
are characterized by heavy commuter travel with<br />
a few recreational trips. Typically, commuters are<br />
more likely to recognize the benefits of SunPass<br />
than other types of customers on the <strong>Turnpike</strong>. The<br />
second is the urban region of Central Florida which<br />
includes both, commuters and tourists. This region<br />
includes the Seminole Expressway, the Beachline<br />
West Expressway, the Southern Connector Extension<br />
and the Western Beltway, Part C. The third, which<br />
serves primarily tourist traffic with some commuter<br />
traffic, is the rural region of Central Florida. This region<br />
includes the northern section of the Ticket System
and a large part of the Northern Coin System. The<br />
fourth and final region is West Florida, which includes<br />
the Veterans Expressway, Polk Parkway, and the<br />
Suncoast Parkway. Similar to the urban region of<br />
Central Florida, traffic in West Florida includes both<br />
commuters and other recreational travelers.<br />
Graph 5.5 depicts the average SunPass participation<br />
on the <strong>Turnpike</strong> System by region during FY 2008. As<br />
expected, SunPass participation in the region with<br />
mostly commuters was the highest (South Florida at<br />
69 percent). On the other hand, SunPass participation<br />
in the tourist-oriented rural region of Central<br />
Florida was the lowest at 48 percent.<br />
5.2.2 Monthly VarIatIon<br />
SunPass Participation<br />
Percent<br />
80%<br />
0%<br />
69%<br />
South<br />
Florida<br />
60%<br />
Table 5.27 and Table 5.28 show the<br />
monthly variation in SunPass<br />
traffic along the <strong>Turnpike</strong><br />
during FY 2008. Using the<br />
normal AADT pattern for<br />
SunPass traffic on each facility<br />
as the baseline, the tables<br />
illustrate periods during the<br />
year when SunPass traffic<br />
volumes exceed or fall below<br />
August<br />
the normal pattern observed<br />
on each facility.<br />
October<br />
Table 5.27 indicates that<br />
SunPass traffic on all the<br />
Mainline facilities exceeded<br />
the baseline the most in<br />
October, ranging from 3<br />
percent on Southern Coin<br />
Graph 5.5<br />
<strong>Turnpike</strong> System<br />
SunPass Participation by Region<br />
FY 2008<br />
Central<br />
Florida<br />
(Urban)<br />
48%<br />
Central<br />
Florida<br />
(Rural)<br />
Month<br />
July, 2007<br />
September<br />
November<br />
December<br />
January, 2008<br />
February<br />
March<br />
April<br />
May<br />
June<br />
62%<br />
West<br />
Florida<br />
Sawgrass<br />
Expressway<br />
Source: <strong>Turnpike</strong> Enterprise Finance Office<br />
Traffic Engineer’s Annual Report<br />
System to 7 percent on Beachline West Expressway.<br />
Similarly, due to monthly traffic variation, SunPass<br />
traffic on all the facilities fell below the average the<br />
most in June, ranging from 6 percent on the HEFT<br />
and the Ticket System to 11 percent on Beachline<br />
West Expressway.<br />
July, 2007<br />
August<br />
Month<br />
September<br />
October<br />
November<br />
December<br />
January, 2008<br />
February<br />
March<br />
April<br />
May<br />
June<br />
Table 5.27<br />
Mainline Seasonal Variation<br />
SunPass Traffic<br />
FY 2008<br />
HEFT<br />
Southern<br />
Coin<br />
System<br />
Source: <strong>Turnpike</strong> Enterprise Finance Office<br />
Seasonal Factor<br />
Ticket<br />
System<br />
Northern<br />
Coin<br />
System<br />
Beachline<br />
West<br />
Expressway<br />
0.99 0.98 0.95 0.99 1.03<br />
1.05 1.06 1.03 1.04 1.04<br />
0.97 0.95 0.94 0.95 0.93<br />
1.05 1.03 1.05 1.06 1.07<br />
0.98 0.99 0.99 1.00 1.01<br />
0.96 0.97 0.97 1.00 0.95<br />
1.00 1.01 1.01 1.00 0.99<br />
0.99 0.99 1.00 0.98 1.00<br />
1.03 1.05 1.04 1.04 1.06<br />
1.02 1.02 1.04 1.01 1.01<br />
1.02 1.03 1.03 1.00 1.02<br />
0.94 0.92 0.94 0.93 0.89<br />
Table 5.28 indicates that SunPass traffic on the expansion<br />
projects exceeded the baseline traffic the<br />
most in March, ranging from 1 percent on Veterans<br />
Expressway to 9 percent on Southern Connector<br />
Extension. Similarly, SunPass traffic on all the expansion<br />
projects fell below the average the most in June,<br />
Table 5.28<br />
Expansion Projects Seasonal Variation<br />
SunPass Traffic<br />
FY 2008<br />
Seminole<br />
Expressway<br />
Veterans<br />
Expressway<br />
Seasonal Factor<br />
Southern<br />
Conn. Ext.<br />
Polk<br />
Parkway<br />
Suncoast<br />
Parkway<br />
SunPass<br />
Western<br />
Beltway,<br />
Part C<br />
0.97 0.98 0.98 1.01 0.94 0.97 0.95<br />
1.05 1.05 1.05 1.03 1.03 1.06 0.99<br />
0.97 0.97 0.96 0.92 0.94 0.96 0.89<br />
1.06 1.06 1.07 1.01 1.06 1.07 0.99<br />
1.02 0.99 0.98 0.98 0.98 0.99 0.96<br />
0.86 0.97 1.01 1.02 0.98 1.01 0.95<br />
0.96 1.00 1.01 0.96 1.00 1.00 0.97<br />
0.96 0.98 0.98 0.98 1.01 0.99 1.00<br />
1.07 1.03 1.01 1.09 1.05 1.04 1.08<br />
1.04 1.02 1.01 1.05 1.04 1.00 1.10<br />
1.06 1.01 1.01 1.02 1.03 1.00 1.14<br />
0.99 0.94 0.95 0.94 0.96 0.90 0.99<br />
89
90<br />
Traffic Engineer’s Annual Report<br />
ranging from 1 percent on Western Beltway, Part C<br />
to 10 percent on Suncoast Parkway.<br />
5.2.3 DaIly VarIatIon<br />
This type of analysis illustrates the variation in SunPass<br />
participation between weekdays and weekends. It<br />
reaffirms the belief that various <strong>Turnpike</strong> facilities are<br />
used by commuters during the week but not used<br />
as much on the weekend. A comparison between<br />
average weekday and weekend SunPass participation<br />
for a typical week in FY 2008 at select mainline<br />
plazas is presented in Graph 5.6.<br />
As expected, average participation during weekdays<br />
significantly exceeds weekend participation at<br />
each of the mainline plazas. SunPass participation<br />
at the Sawgrass Expressway mainline toll plazas<br />
reaches 76 percent during weekdays but drops<br />
to 69 percent on the weekend. In particular, most<br />
of the commuter facilities, such as Southern Coin<br />
System, southern part of the Ticket System (Lantana)<br />
and Seminole Expressway show the largest variation<br />
between weekday and weekend participation.<br />
100%<br />
SunPass Participation<br />
0%<br />
74%<br />
66% 64%<br />
Okeechobee<br />
(HEFT)<br />
53%<br />
SunPass<br />
75%<br />
Golden Glades/<br />
Cypress Creek<br />
(Southern Coin)<br />
64%<br />
Lantana<br />
(Ticket)<br />
Graph 5.6<br />
Select <strong>Turnpike</strong> Mainline Toll Plazas<br />
Weekday vs. Weekend SunPass Participation<br />
58%<br />
Three Lakes<br />
(Ticket)<br />
50% 49%<br />
46%<br />
42%<br />
38%<br />
Leesburg<br />
(Northern Coin)<br />
Beachline<br />
West<br />
76%<br />
69% 70%<br />
Deerfield/<br />
Sunrise<br />
(Sawgrass)<br />
58%<br />
Lake Jesup<br />
(Seminole)<br />
Weekday Weekend<br />
71%<br />
61% 63%<br />
Anderson/<br />
Sugarwood<br />
(Veterans)<br />
5.2.4 hourly VarIatIon<br />
Hourly variation indicates the fluctuations in SunPass<br />
participation during a full day (24-hour period). Graph<br />
5.7 shows the hourly SunPass participation on weekdays<br />
for a typical week at select mainline toll plazas<br />
on the southern components of the Mainline System.<br />
These components include the HEFT, Southern Coin<br />
Average Hourly SunPass Participation<br />
Southern<br />
Connector<br />
Extension<br />
90%<br />
70%<br />
50%<br />
Graph 5.7<br />
Mainline Toll Plazas - Southern Facilities<br />
Typical Weekday Hourly SunPass Participation<br />
30%<br />
12:00 AM 4:00 AM 8:00 AM 12:00 PM 4:00 PM 8:00 PM 12:00 AM<br />
Central<br />
(Polk)<br />
Source: Data obtained from <strong>Turnpike</strong> Finance Office for the week beginning Monday, June 23, 2008<br />
53%<br />
59%<br />
48%<br />
Okeechobee (HEFT) Golden Glades (Southern Coin)<br />
Cypress Creek (Southern Coin) Lantana (Ticket)<br />
Source: Data obtained from <strong>Turnpike</strong> Enterprise Finance Office for the 5-day period<br />
beginning Monday, June 23, 2008<br />
60%<br />
53%<br />
Anclote<br />
(Suncoast)<br />
64%<br />
50%<br />
Western<br />
Beltway,<br />
Part C<br />
System, and the southern portion<br />
of the Ticket System.<br />
As depicted in the graph, SunPass<br />
participation on these facilities<br />
increased during the early morning<br />
and evening hours. Peak-hour<br />
participation at the Lantana and<br />
Okeechobee toll plazas reached<br />
84 and 81 percent, respectively,<br />
in the morning, while SunPass participation<br />
at the Cypress Creek<br />
and Golden Glades toll plazas<br />
reached 77 percent and 72 percent,<br />
respectively. In general, the<br />
morning peak participation at all<br />
four toll plazas was higher than<br />
the evening peak participation.<br />
Graph 5.8 shows the hourly<br />
SunPass participation on weekdays<br />
for a typical week at select<br />
mainline toll plazas on the north-
Average Hourly SunPass Participation<br />
80%<br />
60%<br />
40%<br />
20%<br />
Graph 5.8<br />
Mainline Toll Plazas - Northern Facilities<br />
Typical Weekday Hourly SunPass Participation<br />
12:00 AM 4:00 AM 8:00 AM 12:00 PM 4:00 PM 8:00 PM 12:00 AM<br />
Leesburg (Northern Coin) Beachline West Three Lakes (Ticket)<br />
Source: Data obtained from <strong>Turnpike</strong> Enterprise Finance Office for the 5-day period<br />
beginning Monday, June 23, 2008<br />
ern components of the Mainline System. These components<br />
include the Northern Coin System, the northern<br />
portion of the Ticket System, and the Beachline<br />
West Expressway.<br />
As depicted in the graph, SunPass participation at all<br />
three facilities peaked at approximately 60 percent<br />
during the morning peak hours. While the Leesburg<br />
toll plaza showed a significant rise in SunPass participation<br />
during the early morning peak hours, it<br />
dropped in the late morning hours and declined<br />
further in the evening. In contrast, SunPass participation<br />
remained relatively stable throughout the day<br />
at the Three Lakes toll plaza. This pattern confirms the<br />
fact that long distance travelers and tourists are the<br />
primary users of that toll plaza.<br />
Traffic Engineer’s Annual Report<br />
Graph 5.9 shows the hourly SunPass participation<br />
on weekdays for a typical week at select mainline<br />
plazas on the expansion projects. The expansion<br />
projects are predominantly commuter facilities. As<br />
shown in the graph, mainline plazas on Sawgrass<br />
Expressway, Seminole Expressway, and Veterans<br />
Expressway have the highest peak hour SunPass<br />
participation levels. All three of these facilities experience<br />
participation levels at or above 78 percent<br />
during the morning peak hours. SunPass participation<br />
on the Southern Connector, Polk Parkway and to<br />
some extent Western Beltway, Part C is less defined<br />
during the morning and evening peak travel hours<br />
as these facilities largely serve the tourists and recreation<br />
travelers.<br />
Average Hourly SunPass Participation<br />
100%<br />
80%<br />
60%<br />
40%<br />
20%<br />
Graph 5.9<br />
Expansion Projects<br />
Typical Weekday Hourly SunPass Participation<br />
12:00 AM 4:00 AM 8:00 AM 12:00 PM 4:00 PM 8:00 PM 12:00 AM<br />
Lake Jesup (Seminole)<br />
Southern Connector Extension<br />
Deerfield/Sunrise (Sawgrass) Anderson/Sugarwood (Veterans)<br />
Central (Polk)<br />
Western Beltway, Part C<br />
Anclote (Suncoast)<br />
Source: Data obtained from <strong>Turnpike</strong> Enterprise Finance Office for the 5-day period beginning Monday,<br />
June 23, 2008<br />
SunPass<br />
91
92<br />
Traffic Engineer’s Annual Report<br />
SunPass<br />
Th i s Pa g e in T e n T i o n a l l y lefT Bl a n k