FTSE Factsheet
FTSE Factsheet
FTSE Factsheet

Create successful ePaper yourself
Turn your PDF publications into a flip-book with our unique Google optimized e-Paper software.
<strong>FTSE</strong> FACTSHEET<br />
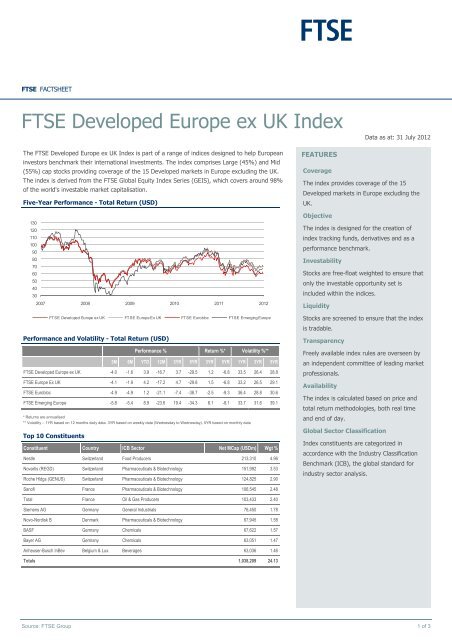
<strong>FTSE</strong> Developed Europe ex UK Index<br />
bmkTitle1<br />
The <strong>FTSE</strong> Developed Europe ex UK Index is part of a range of indices designed to help European<br />
investors benchmark their international investments. The index comprises Large (45%) and Mid<br />
(55%) cap stocks providing coverage of the 15 Developed markets in Europe excluding the UK.<br />
The index is derived from the <strong>FTSE</strong> Global Equity Index Series (GEIS), which covers around 98%<br />
of the world's investable market capitalisation.<br />
Five-Year Performance - Total Return (USD)<br />
130<br />
120<br />
110<br />
100<br />
90<br />
80<br />
70<br />
60<br />
50<br />
40<br />
30<br />
2007 2008 2009 2010 2011 2012<br />
<strong>FTSE</strong> Developed Europe ex UK <strong>FTSE</strong> Europe Ex UK <strong>FTSE</strong> Eurobloc <strong>FTSE</strong> Emerging Europe<br />
Performance and Volatility - Total Return (USD)<br />
Performance % Return %* Volatility %**<br />
3M 6M YTD 12M 3YR 5YR 3YR 5YR 1YR 3YR 5YR<br />
<strong>FTSE</strong> Developed Europe ex UK -4.0 -1.6 3.9 -16.7 3.7 -29.5 1.2 -6.8 33.5 26.4 28.8<br />
<strong>FTSE</strong> Europe Ex UK -4.1 -1.9 4.2 -17.2 4.7 -29.8 1.5 -6.8 33.2 26.5 29.1<br />
<strong>FTSE</strong> Eurobloc -4.9 -4.9 1.2 -21.1 -7.4 -38.7 -2.5 -9.3 36.4 28.8 30.6<br />
<strong>FTSE</strong> Emerging Europe -5.8 -5.4 8.9 -23.6 19.4 -34.3 6.1 -8.1 33.7 31.6 39.1<br />
* Returns are annualised<br />
** Volatility – 1YR based on 12 months daily data. 3YR based on weekly data (Wednesday to Wednesday). 5YR based on monthly data<br />
Top 10 Constituents<br />
Constituent Country ICB Sector Net MCap (USDm) Wgt %<br />
Nestle Switzerland Food Producers 213,310 4.96<br />
Novartis (REGD) Switzerland Pharmaceuticals & Biotechnology 151,992 3.53<br />
Roche Hldgs (GENUS) Switzerland Pharmaceuticals & Biotechnology 124,825 2.90<br />
Sanofi France Pharmaceuticals & Biotechnology 106,545 2.48<br />
Total France Oil & Gas Producers 103,433 2.40<br />
Siemens AG Germany General Industrials 76,450 1.78<br />
Novo-Nordisk B Denmark Pharmaceuticals & Biotechnology 67,945 1.58<br />
BASF Germany Chemicals 67,622 1.57<br />
Bayer AG Germany Chemicals 63,051 1.47<br />
Anheuser-Busch InBev Belgium & Lux. Beverages 63,036 1.46<br />
Totals 1,038,209 24.13<br />
FEATURES<br />
Coverage<br />
The index provides coverage of the 15<br />
Developed markets in Europe excluding the<br />
UK.<br />
Objective<br />
The index is designed for the creation of<br />
index tracking funds, derivatives and as a<br />
performance benchmark.<br />
Investability<br />
Stocks are free-float weighted to ensure that<br />
only the investable opportunity set is<br />
included within the indices.<br />
Liquidity<br />
Stocks are screened to ensure that the index<br />
is tradable.<br />
Transparency<br />
Freely available index rules are overseen by<br />
an independent committee of leading market<br />
professionals.<br />
Availability<br />
The index is calculated based on price and<br />
total return methodologies, both real time<br />
and end of day.<br />
Global Sector Classification<br />
Data as at: 31 July 2012<br />
Index constituents are categorized in<br />
accordance with the Industry Classification<br />
Benchmark (ICB), the global standard for<br />
industry sector analysis.<br />
Source: <strong>FTSE</strong> Group 1 of 3
<strong>FTSE</strong> Developed Europe ex UK Index Data as at: 31 July 2012<br />
ICB Industry Breakdown<br />
ICB Code ICB Industry No. of<br />
Cons<br />
<strong>FTSE</strong> Developed Europe ex UK <strong>FTSE</strong> Europe<br />
Net MCap (USDm) Wgt % No. of<br />
Cons<br />
Net MCap (USDm) Wgt %<br />
0001 Oil & Gas 21 301,036 7.00 43 881,210 12.63<br />
1000 Basic Materials 35 364,419 8.47 62 659,256 9.45<br />
2000 Industrials 85 643,893 14.96 106 798,053 11.43<br />
3000 Consumer Goods 52 863,162 20.06 68 1,245,101 17.84<br />
4000 Health Care 25 573,775 13.33 31 777,206 11.14<br />
5000 Consumer Services 40 224,416 5.22 66 443,267 6.35<br />
6000 Telecommunications 15 197,449 4.59 26 397,781 5.70<br />
7000 Utilities 23 195,725 4.55 40 317,276 4.55<br />
8000 Financials 85 781,228 18.15 134 1,279,017 18.33<br />
9000 Technology 14 158,097 3.67 18 181,418 2.60<br />
Totals 395 4,303,199 100.00 594 6,979,584 100.00<br />
Country Breakdown<br />
Country No. of Cons Net MCap (USDm) Wgt %<br />
Austria 10 31,289 0.73<br />
Belgium & Lux. 14 111,353 2.59<br />
Denmark 14 132,981 3.09<br />
Finland 14 72,371 1.68<br />
France 85 991,722 23.05<br />
Germany 56 827,440 19.23<br />
Greece 8 8,463 0.20<br />
Ireland 3 16,425 0.38<br />
Italy 35 231,581 5.38<br />
Netherlands 24 271,788 6.32<br />
Norway 12 107,727 2.50<br />
Portugal 8 20,294 0.47<br />
Spain 29 258,667 6.01<br />
Sweden 38 336,841 7.83<br />
Switzerland 45 884,257 20.55<br />
Totals 395 4,303,199 100.00<br />
INFORMATION<br />
Index Universe<br />
<strong>FTSE</strong> Global Equity Index Series<br />
Index Launch<br />
30 June 2000<br />
Base Date<br />
31 December 1986<br />
Base Value<br />
Source: <strong>FTSE</strong> Group 2 of 3<br />
100<br />
Investability Screen<br />
Free float adjusted and liquidity screened<br />
Index Calculation<br />
Real-time and end-of-day index available<br />
End-of-Day Distribution<br />
Via FTP and email<br />
Currency<br />
USD, Sterling, Yen, Euro and Local<br />
Review Dates<br />
Quarterly in March, June, September,<br />
December<br />
Index Rules and Vendor Codes<br />
Available at www.ftse.com/geis
<strong>FTSE</strong> Developed Europe ex UK Index Data as at: 31 July 2012<br />
Index Characteristics<br />
Attributes <strong>FTSE</strong> Developed Europe ex UK<br />
Number of constituents 395<br />
Net MCap (USDm) 4,303,199<br />
Constituent Sizes (Net MCap USDm)<br />
Average 10,894<br />
Largest 213,310<br />
Smallest 180<br />
Median 4,706<br />
Weight of Largest Constituent (%) 4.96<br />
Top 10 Holdings (% Index MCap) 24.13<br />
Data as at: 31 July 2012<br />
bmkImage1 bmkImage2 bmkImage3<br />
“<strong>FTSE</strong> ® ” is a trade mark of the London Stock Exchange Plc Group companies and is used by <strong>FTSE</strong> International Limited (“<strong>FTSE</strong>”) under licence. All rights in<br />
and to the <strong>FTSE</strong> Developed Europe ex UK (“Index”) vest in <strong>FTSE</strong>. The Industry Classification Benchmark (“ICB”) is owned by <strong>FTSE</strong>.<br />
All information is provided for information purposes only. Every effort is made to ensure that all information given in this publication is accurate, but no<br />
responsibility or liability can be accepted by <strong>FTSE</strong> or its licensors for any errors or for any loss from use of this publication. Neither <strong>FTSE</strong> nor any of its<br />
licensors makes any claim, prediction, warranty or representation whatsoever, expressly or impliedly, either as to the results to be obtained from the use of<br />
the name of the Index set out above or the fitness or suitability of the Index for any particular purpose to which it might be put. All figures and graphical<br />
representations in this publication refer to past performance and are sourced by <strong>FTSE</strong>. Past performance is not a reliable indicator of future results. No part<br />
of this information may be reproduced, stored in a retrieval system or transmitted in any form or by any means, electronic, mechanical, photocopying,<br />
recording or otherwise, without prior written permission of <strong>FTSE</strong>. Distribution of <strong>FTSE</strong> data and the use of <strong>FTSE</strong> indices to create financial products requires a<br />
licence with <strong>FTSE</strong> and/or its licensors. <strong>FTSE</strong> does not accept any liability to any person for any loss or damage arising out of any error or omission in the<br />
ICB.<br />
Data definitions available from info@ftse.com<br />
For further information visit www.ftse.com,<br />
email info@ftse.com or call your local <strong>FTSE</strong><br />
office:<br />
Beijing +86 (10) 8587 7722<br />
Dubai +971 4 319 9901<br />
Hong Kong +852 2164 3333<br />
London + 44 (0) 20 7866 1810<br />
Milan + 39 02 3604 6953<br />
Mumbai +91 22 6649 4180<br />
New York + 1 888 747 <strong>FTSE</strong> (3873)<br />
Paris +33 (0)1 53 76 82 89<br />
San Francisco +1 888 747 <strong>FTSE</strong> (3873)<br />
Sydney +61 (2) 9293 2864<br />
Tokyo +81 (3) 3581 2811<br />
Source: <strong>FTSE</strong> Group 3 of 3