LEED structure determination of the Ni(111)( / 3 x / 3)R30 ... - UFMG
LEED structure determination of the Ni(111)( / 3 x / 3)R30 ... - UFMG
LEED structure determination of the Ni(111)( / 3 x / 3)R30 ... - UFMG

You also want an ePaper? Increase the reach of your titles
YUMPU automatically turns print PDFs into web optimized ePapers that Google loves.
Abstract<br />
<strong>LEED</strong> <strong>structure</strong> <strong>determination</strong> <strong>of</strong> <strong>the</strong><br />
<strong>Ni</strong>(<strong>111</strong>)ð p 3 p 3Þ<strong>R30</strong>°-Sn surface<br />
E.A. Soares a , C. Bittencourt b,1 , E.L. Lopes a , V.E. de Carvalho a ,<br />
D.P. Woodruff b,*<br />
a<br />
Depto. de Fisica, ICEX––<strong>UFMG</strong>, CP 702, Belo Horizonte, MG 30123-970, Brazil<br />
b<br />
Department <strong>of</strong> Physics, University <strong>of</strong> Warwick, Coventry CV4 7AL, UK<br />
Received 30 October 2003; accepted for publication 14 December 2003<br />
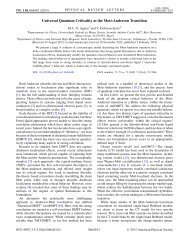
Quantitative low energy electron diffraction has been used to determine <strong>the</strong> <strong>structure</strong> <strong>of</strong> <strong>the</strong> <strong>Ni</strong>(1 1 1)ð p 3 p 3Þ<strong>R30</strong>°-<br />
Sn surface phase. The results confirm that <strong>the</strong> surface layer comprises a substitutional alloy <strong>of</strong> composition <strong>Ni</strong>2Sn as<br />
previously found by low energy ion scattering (LEIS), and also shows that <strong>the</strong>re is no stacking fault at <strong>the</strong> substrate/<br />
alloy interface as has been found in ð p 3 p 3Þ<strong>R30</strong>°-Sb surface alloys on Ag and Cu(1 1 1). The surface alloy layer is<br />
rumpled with <strong>the</strong> Sn atoms 0.45 ± 0.03 A higher above <strong>the</strong> substrate than <strong>the</strong> surrounding <strong>Ni</strong> atoms. This rumpling<br />
amplitude is almost identical to that previously reported on <strong>the</strong> basis <strong>of</strong> <strong>the</strong> LEIS study. Comparison with similar<br />
results for Sn-induced surface alloy phases on <strong>Ni</strong>(1 0 0) and <strong>Ni</strong>(1 1 0) shows a clear trend to reduced rumpling with<br />
reduced surface atomic layer density, an effect which can be rationalised in terms <strong>of</strong> <strong>the</strong> different effects <strong>of</strong> valence<br />
electron charge smoothing at <strong>the</strong> surface.<br />
Ó 2003 Elsevier B.V. All rights reserved.<br />
Keywords: Low energy electron diffraction (<strong>LEED</strong>); Surface <strong>structure</strong>, morphology, roughness, and topography; Surface relaxation<br />
and reconstruction; Alloys; <strong>Ni</strong>ckel; Tin; Low index single crystal surfaces<br />
1. Introduction<br />
Surface Science 550 (2004) 127–132<br />
While <strong>the</strong> deposition <strong>of</strong> atoms on surfaces<br />
commonly produces ordered overlayer <strong>structure</strong>s,<br />
such deposition may lead to modification <strong>of</strong> <strong>the</strong><br />
*<br />
Corresponding author. Tel.: +44-2476523378; fax: +44-<br />
2476692016.<br />
E-mail address: d.p.woodruff@warwick.ac.uk (D.P. Woodruff).<br />
1<br />
Present address: Laboratoire Interdisciplinaire de Spectroscopie<br />
Electronique, FUNDP, Rue de Bruxelles, 61 5000<br />
Namur, Belgium.<br />
0039-6028/$ - see front matter Ó 2003 Elsevier B.V. All rights reserved.<br />
doi:10.1016/j.susc.2003.12.027<br />
www.elsevier.com/locate/susc<br />
underlying substrate <strong>structure</strong>, and in particular to<br />
<strong>the</strong> formation <strong>of</strong> a surface alloy, in which <strong>the</strong><br />
deposited adsorbate atoms occupy substitutional<br />
sites in <strong>the</strong> outermost layer <strong>of</strong> <strong>the</strong> surface. Often<br />
<strong>the</strong>se surface alloy phases have no direct bulk<br />
analogue, and in some cases <strong>the</strong> constituent elements<br />
may even be immiscible in <strong>the</strong> bulk, providing<br />
a clear indication <strong>of</strong> <strong>the</strong> fundamentally<br />
different energetics at <strong>the</strong> solid surface [1]. Apart<br />
from <strong>the</strong> underlying need to identify which systems<br />
involve this substitutional ra<strong>the</strong>r than overlayer<br />
adsorption, <strong>the</strong> detailed structural parameters <strong>of</strong><br />
<strong>the</strong>se surface alloys provide fur<strong>the</strong>r insight into
128 E.A. Soares et al. / Surface Science 550 (2004) 127–132<br />
<strong>the</strong>ir nature. In particular, <strong>the</strong>se surface alloys<br />
commonly show a surface ÔcorrugationÕ, with <strong>the</strong><br />
atoms <strong>of</strong> <strong>the</strong> constituent elements having different<br />
layer spacings relative to <strong>the</strong> underlying substrate;<br />
such an effect may be expected on <strong>the</strong> basis <strong>of</strong> a<br />
simple hard-sphere picture as <strong>the</strong>se systems commonly<br />
involve an alloying atom <strong>of</strong> larger radius<br />
than those <strong>of</strong> <strong>the</strong> substrate. However, it seems that<br />
in such cases <strong>the</strong> surface corrugation is almost always<br />
smaller than predicted on <strong>the</strong> basis <strong>of</strong> this<br />
hard-sphere picture [2] even in those cases where<br />
one can take interatomic distances from bulk alloys<br />
<strong>of</strong> <strong>the</strong> constituent elements [3]. This conclusion<br />
supports <strong>the</strong> suggestion [4,5] that <strong>the</strong> reduced surface<br />
corrugation is a real surface effect, related to<br />
<strong>the</strong> reduced valence electron density in <strong>the</strong> surface<br />
layer <strong>of</strong> a metal due to spill-over into <strong>the</strong> vacuum,<br />
which gives rise to a contraction <strong>of</strong> <strong>the</strong> surface layer<br />
spacing and <strong>the</strong> presence <strong>of</strong> a tensile surface stress.<br />
Within a hard-sphere picture, this tensile surface<br />
stress reflects a reduction in <strong>the</strong> effective atomic<br />
radius, allowing larger substitutional atoms to be<br />
accommodated with less corrugation.<br />
Recently <strong>the</strong>re have been a number <strong>of</strong> structural<br />
studies, by quantitative low energy electron diffraction<br />
(<strong>LEED</strong>) and low energy alkali ion scattering,<br />
<strong>of</strong> surface alloys phases formed by Sn on<br />
transition and noble metal surfaces including<br />
Pt(1 1 1) [6], <strong>Ni</strong>(1 1 1) [7,8], Cu(1 1 1) [7], <strong>Ni</strong>(1 0 0) [9]<br />
and <strong>Ni</strong>(1 1 0) [10]. In part <strong>the</strong>se were motivated by<br />
<strong>the</strong> fact that Sn addition to some transition metals<br />
provides improved performance in heterogeneous<br />
catalysis (e.g. [11]). These studies revealed some<br />
clear systematics in terms <strong>of</strong> <strong>the</strong> amplitude <strong>of</strong> <strong>the</strong><br />
corrugation within <strong>the</strong> surface alloy phases which,<br />
consistent with a simple hard-sphere picture,<br />
showed an increasing amplitude <strong>of</strong> corrugation as<br />
<strong>the</strong> substrate lattice parameter decreased as well as<br />
indicating that <strong>the</strong> effective radii <strong>of</strong> <strong>the</strong> substitutional<br />
Sn atoms were smaller than expected even<br />
relative to bulk alloys <strong>of</strong> <strong>the</strong> substrate with Sn. The<br />
fact that Sn forms surface alloys on all three low<br />
index faces <strong>of</strong> <strong>Ni</strong> provides <strong>the</strong> interesting possibility<br />
<strong>of</strong> trying to identify <strong>the</strong> effect <strong>of</strong> surface atom<br />
density on <strong>the</strong> effective size <strong>of</strong> a common alloying<br />
atom, and indeed <strong>the</strong>re are subtle differences in <strong>the</strong><br />
rumpling amplitudes for <strong>the</strong>se three surface alloy<br />
phases which support <strong>the</strong> expectation that <strong>the</strong><br />
rumpling should be largest for <strong>the</strong> most highlypacked,<br />
and <strong>the</strong>refore atomically smooth, (1 1 1)<br />
surface [10]. However, <strong>the</strong> effect is extremely subtle,<br />
with <strong>the</strong> rumpling amplitudes differing by amounts<br />
which lie at <strong>the</strong> estimated limits <strong>of</strong> <strong>the</strong> structural<br />
methods used. In this regard, a potential limitation<br />
in making <strong>the</strong>se comparisons is that which <strong>the</strong> results<br />
on <strong>Ni</strong>(1 1 1) and (1 0 0) were obtained using<br />
low energy (alkali) ion scattering (LEIS), that for<br />
<strong>Ni</strong>(1 1 0) was obtained by quantitative low energy<br />
electron diffraction. Both methods are quite wellestablished,<br />
but <strong>the</strong>re is clearly potential for systematic<br />
errors <strong>of</strong> one or o<strong>the</strong>r technique at <strong>the</strong><br />
limits <strong>of</strong> <strong>the</strong> estimated random errors, so comparisons<br />
at <strong>the</strong>se limits are especially hazardous.<br />
For this reason, in part, we have undertaken an<br />
independent surface <strong>structure</strong> <strong>determination</strong> <strong>of</strong> <strong>the</strong><br />
<strong>Ni</strong>(1 1 1)ð p 3 p 3Þ<strong>R30</strong>°-Sn surface using quantitative<br />
<strong>LEED</strong>. Our results allow a direct comparison<br />
<strong>of</strong> <strong>the</strong> results <strong>of</strong> <strong>the</strong> two structural methods on<br />
<strong>the</strong> same surface phase, and also allow comparison<br />
<strong>of</strong> <strong>the</strong> rumpling amplitude <strong>of</strong> <strong>the</strong> highest and lowest<br />
atomic density surfaces ((1 1 1) and (1 1 0)) by a<br />
common methodology. In addition, however, <strong>the</strong><br />
new measurements allow us to investigate one<br />
fur<strong>the</strong>r related question. In <strong>the</strong> case <strong>of</strong> <strong>the</strong><br />
ð p 3 p 3Þ<strong>R30</strong>° surface alloy phases formed by<br />
Sb on Cu(1 1 1) and Ag(1 1 1) independent studies<br />
by surface X-ray diffraction (SXRD) and medium<br />
energy ion scattering (MEIS) led to <strong>the</strong> surprising<br />
result that <strong>the</strong>se phases form not by <strong>the</strong> simple<br />
substitution <strong>of</strong> 1/3 <strong>of</strong> <strong>the</strong> substrate atoms in<br />
<strong>the</strong> outermost layer, leaving all <strong>the</strong> surface alloy<br />
atoms in <strong>the</strong> ‘‘fcc’’ sites directly above third<br />
(unalloyed) layer substrate atoms, but <strong>the</strong> whole<br />
surface layer is translated over <strong>the</strong> surface to produce<br />
an interfacial stacking fault such that all <strong>the</strong><br />
surface alloy atoms occupy ‘‘hcp’’ sites above second<br />
layer substrate atoms. This possibility for <strong>the</strong><br />
<strong>Ni</strong>(1 1 1)ð p 3 p 3Þ<strong>R30</strong>°-Sn surface was not included<br />
in <strong>the</strong> analysis <strong>of</strong> <strong>the</strong> original LEIS data, but<br />
is now considered here.<br />
2. Experimental details<br />
The experiments were conducted using a standard<br />
ultra high vacuum chamber equipped with a
ange <strong>of</strong> facilities for sample preparation and<br />
surface characterisation operating with typical<br />
base pressures <strong>of</strong> (1–2) · 10 10 Torr. The <strong>Ni</strong>(1 1 1)<br />
substrate was initially prepared by X-ray Laue<br />
alignment, spark erosion and mechanical polishing.<br />
The crystal was <strong>the</strong>n cleaned in situ by repeated<br />
cycles <strong>of</strong> sputtering with 1 keV Ar þ ions<br />
and subsequent annealing to 900 K. <strong>LEED</strong><br />
observations were used to check <strong>the</strong> degree <strong>of</strong><br />
surface order and X-ray photoelectron spectroscopy<br />
(XPS) was used to verify <strong>the</strong> surface composition.<br />
The <strong>Ni</strong>(1 1 1)ð p 3 p 3Þ<strong>R30</strong>°-Sn surface<br />
phase was prepared by depositing Sn from a<br />
Knudsen cell operating at 1400 K for 6 min which<br />
resulted in a coverage <strong>of</strong> 0.45 ML; subsequent<br />
annealing to 1000 K for 25 min produced a wellordered<br />
ð p 3 p 3Þ<strong>R30</strong>° <strong>LEED</strong> pattern. This<br />
general procedure <strong>of</strong> over-dosing followed by<br />
elevated temperature annealing is widely used as<br />
<strong>the</strong> way <strong>of</strong> obtaining <strong>the</strong> best ordered surface<br />
phases for <strong>the</strong>se higher atomic number adsorption<br />
phases.<br />
Quantitative <strong>LEED</strong> measurements <strong>of</strong> <strong>the</strong> diffracted<br />
beam intensities were recorded from 55 to<br />
400 eV at a sample temperature <strong>of</strong> 198 K (<strong>the</strong><br />
reduced temperature being used to lower <strong>the</strong><br />
vibrational amplitudes) using a computer-interfaced<br />
Omicron video-<strong>LEED</strong> system at nominal<br />
normal incidence. The exact incidence geometry<br />
was adjusted to achieve normal incidence by<br />
comparing <strong>the</strong> intensity–energy spectra <strong>of</strong> diffracted<br />
beams which should be symmetrically<br />
equivalent. Intensity–energy spectra (I–E spectra)<br />
were collected for 14 integral order and 20 fractional<br />
order beams. The symmetry-equivalent<br />
beams were <strong>the</strong>n averaged, reducing <strong>the</strong> data set<br />
from a total <strong>of</strong> 34 beams to 10 symmetrically<br />
distinct beams, comprising 6 integral order and 4<br />
fractional order beams, covering a total energy<br />
range <strong>of</strong> 1710 eV. In order to provide a check on<br />
<strong>the</strong> methodology and overall consistency <strong>of</strong> <strong>the</strong><br />
procedures and gain some information on effective<br />
vibrational amplitudes an analysis <strong>of</strong> <strong>the</strong> clean<br />
surface <strong>structure</strong>, conducted at <strong>the</strong> same sample<br />
temperature, was also undertaken. This was based<br />
on <strong>the</strong> intensity–energy spectra from 5 symmetrically<br />
distinct beams covering a total energy range<br />
<strong>of</strong> 1562 eV.<br />
E.A. Soares et al. / Surface Science 550 (2004) 127–132 129<br />
3. Results and <strong>structure</strong> <strong>determination</strong><br />
The <strong>structure</strong> <strong>determination</strong> was effected by <strong>the</strong><br />
usual approach in <strong>LEED</strong> <strong>of</strong> simulating <strong>the</strong> diffracted<br />
beam I–E spectra for a range <strong>of</strong> model<br />
<strong>structure</strong>s, comparing <strong>the</strong>se with <strong>the</strong> experimental<br />
data with <strong>the</strong> aid <strong>of</strong> <strong>the</strong> Pendry R-factor (reliability<br />
factor) RP [12]. The <strong>LEED</strong> calculations were performed<br />
using <strong>the</strong> Barbieri/Van Hove Symmetrized<br />
Automated Tensor <strong>LEED</strong> computer codes with<br />
<strong>the</strong>ir associated programs to calculate <strong>the</strong> muffintin<br />
potential and scattering phase shifts [13,14]. In<br />
particular, a self-consistent Dirac–Fock approach<br />
was used in order to compute <strong>the</strong> self-consistent<br />
atomic orbitals for each element. The muffin-tin<br />
potential was <strong>the</strong>n computed following Mat<strong>the</strong>isÕ<br />
prescription and a set <strong>of</strong> 11 relativistic phase shifts<br />
(lmax ¼ 10) were evaluated by numerical integration<br />
<strong>of</strong> <strong>the</strong> Dirac equation. The real part <strong>of</strong> <strong>the</strong><br />
inner potential was simultaneously optimised with<br />
<strong>the</strong> structural parameters. All <strong>the</strong> calculations were<br />
performed on a small AMD Athlon (1.8 GHz)<br />
Linux cluster.<br />
The initial stage <strong>of</strong> <strong>the</strong> data analysis involved<br />
optimising <strong>the</strong> fit to <strong>the</strong> clean surface data; for this<br />
purpose <strong>the</strong> only structural variables were <strong>the</strong><br />
outermost two <strong>Ni</strong>–<strong>Ni</strong> interlayer spacings, but <strong>the</strong><br />
inner potential and <strong>the</strong> Debye temperature <strong>of</strong><br />
<strong>the</strong> outermost layer were adjusted. The Debye<br />
temperature for all o<strong>the</strong>r layers was fixed at <strong>the</strong><br />
bulk value <strong>of</strong> 350 K. This optimisation led to a<br />
good R-factor value <strong>of</strong> 0.17 with <strong>the</strong> optimum<br />
surface Debye temperature being found to be 220<br />
K. Fig. 1 shows a comparison <strong>of</strong> <strong>the</strong> experimental<br />
and best-fit <strong>the</strong>oretical <strong>LEED</strong> intensity–energy<br />
spectra. The outermost interlayer spacings were<br />
both found to be expanded, but by marginally or<br />
insignificant amounts <strong>of</strong> 1.1 ± 1.0% and 0.2 ± 1.0%.<br />
The most recent quantitative <strong>LEED</strong> study <strong>of</strong> <strong>the</strong><br />
clean <strong>Ni</strong>(1 1 1) surface, conducted as part <strong>of</strong> an<br />
investigation <strong>of</strong> a potassium overlayer phase,<br />
yielded closely similar results; <strong>the</strong> interlayer spacing<br />
changes were actually given as 0% yielding<br />
a RP value <strong>of</strong> 0.16 [15].<br />
For <strong>the</strong> <strong>Ni</strong>(1 1 1)ð p 3 p 3Þ<strong>R30</strong>°-Sn surface<br />
five structural models were tested, all <strong>of</strong> which<br />
preserved <strong>the</strong> point group symmetry <strong>of</strong> <strong>the</strong> surface.<br />
Three <strong>of</strong> <strong>the</strong>se were overlayer models in
130 E.A. Soares et al. / Surface Science 550 (2004) 127–132<br />
intensity (arb. units)<br />
(1,0)<br />
(2,0)<br />
(0,2)<br />
(0,1) (1,1)<br />
0 100 200 300 400 100 200 300 400<br />
electron energy (eV)<br />
Fig. 1. Comparison <strong>of</strong> <strong>the</strong> experimental (dashed line) <strong>LEED</strong><br />
intensity–energy spectra from <strong>the</strong> clean <strong>Ni</strong>(1 1 1) surface with<br />
<strong>the</strong> results <strong>of</strong> <strong>the</strong> best-fit simulations (full lines).<br />
which 1/3 ML <strong>of</strong> Sn atoms occupied ei<strong>the</strong>r fcc<br />
hollow, hcphollow or atopsites. In addition we<br />
considered two substitutional surface alloy models;<br />
in both <strong>the</strong> outermost layer is composed <strong>of</strong> 2/<br />
3 ML <strong>of</strong> <strong>Ni</strong> and 1/3 ML <strong>of</strong> Sn atoms, but in one<br />
case all such alloy atoms occupy fcc hollow sites<br />
relative to <strong>the</strong> underlying pure <strong>Ni</strong>(1 1 1) (unfaulted<br />
alloy) and in <strong>the</strong> o<strong>the</strong>r case <strong>the</strong>se atoms<br />
occupied hcp hollow sites (faulted alloy). In all <strong>of</strong><br />
<strong>the</strong> models tested, <strong>the</strong> interlayer spacings <strong>of</strong> <strong>the</strong><br />
outermost layer atoms were allowed to vary. In<br />
<strong>the</strong> initial optimisation stage for each <strong>structure</strong><br />
<strong>the</strong> Debye temperature <strong>of</strong> <strong>the</strong> outermost layer <strong>Ni</strong><br />
and Sn adsorbate atoms was fixed at 220 K (as<br />
found for <strong>the</strong> clean surface) and only 9 scattering<br />
phase shifts were used (lmax ¼ 8). This yielded Rfactor<br />
values <strong>of</strong> 0.28 (unfaulted alloy), 0.53 (fcc<br />
overlayer), 0.71 (faulted alloy), 0.73 (hcpoverlayer)<br />
and 0.57 (atopoverlayer), clearly strongly<br />
favouring <strong>the</strong> unfaulted alloy. For each <strong>of</strong> <strong>the</strong>se<br />
optimised geometries a grid search over <strong>the</strong> Debye<br />
temperature <strong>of</strong> <strong>the</strong> Sn and surface layer <strong>Ni</strong><br />
atoms was conducted over <strong>the</strong> range 100–600 K,<br />
<strong>the</strong> Sn and surface layer <strong>Ni</strong> spacings being optimised<br />
for each pair <strong>of</strong> Debye temperatures. This<br />
led to significant lowering <strong>of</strong> many <strong>of</strong> <strong>the</strong> Rfactor<br />
values: 0.20 (unfaulted alloy), 0.43 (fcc<br />
overlayer), 0.60 (faulted alloy), 0.56 (hcpover-<br />
layer) and 0.46 (atopoverlayer). Clearly this<br />
analysis confirms <strong>the</strong> very considerable superiority<br />
<strong>of</strong> <strong>the</strong> simple unfaulted surface alloy model<br />
over any <strong>of</strong> <strong>the</strong> o<strong>the</strong>rs. The optimum surface<br />
Debye temperatures found for this model were<br />
120(+50/)10) K for <strong>the</strong> Sn and 240(+50/)25) K<br />
for <strong>the</strong> <strong>Ni</strong>; a R-factor contour mapshowing <strong>the</strong><br />
dependence on <strong>the</strong>se two Debye temperatures is<br />
shown in Fig. 2, <strong>the</strong> precision limits being set by<br />
a R-factor value <strong>of</strong> 0.20 (Rmin ¼ 0:17 plus variance<br />
¼ 0.03). The optimum values for this model<br />
are actually quite similar to <strong>the</strong> values found for<br />
most <strong>of</strong> <strong>the</strong> o<strong>the</strong>r (incorrect) structural models.<br />
The significant dependence <strong>of</strong> <strong>the</strong> R-factor on <strong>the</strong><br />
vibrational parameters presumably results from<br />
<strong>the</strong> way this modifies <strong>the</strong> relative significance <strong>of</strong><br />
different multiple scattering event.<br />
In a final stage <strong>of</strong> structural optimisation,<br />
using a set <strong>of</strong> 11 phase shifts, <strong>the</strong> outermost<br />
substrate interlayer spacings were also adjusted<br />
and distortions <strong>of</strong> <strong>the</strong> outermost substrate layers<br />
were investigated. In particular, possible lateral<br />
distortions which preserved <strong>the</strong> ( p 3 p 3) periodicity<br />
were considered, such as a Ôpinching-inÕ <strong>of</strong><br />
<strong>Ni</strong> 1st layer Debye temperature (K)<br />
100 200 300 400 500<br />
100 200 300 400 500<br />
Sn Debye temperature (K)<br />
Fig. 2. R-factor contour map<strong>of</strong> <strong>the</strong> dependence <strong>of</strong> <strong>the</strong> quality<br />
<strong>of</strong> experiment/<strong>the</strong>ory fit on <strong>the</strong> surface layer Debye temperatures<br />
for <strong>the</strong> <strong>LEED</strong> analysis <strong>of</strong> <strong>the</strong> <strong>Ni</strong>(1 1 1)ð p 3 p 3Þ<strong>R30</strong>°-Sn<br />
surface.
intensity (arb. units)<br />
0 100 200 300 150 225 300 375<br />
(-2, 2)<br />
(2, 0)<br />
(1/3, 1/3)<br />
(1, 0)<br />
(0, 1)<br />
(0, 2)<br />
(1, 1)<br />
(-5/3, 4/3)<br />
(1/3, 4/3)<br />
(2/3, 2/3)<br />
100 200 300 400 100 175 250 325<br />
electron energy (eV)<br />
Fig. 3. Comparison <strong>of</strong> <strong>the</strong> experimental (dashed lines) <strong>LEED</strong><br />
intensity–energy spectra from <strong>the</strong> <strong>Ni</strong>(1 1 1)ð p 3 p 3Þ<strong>R30</strong>°-Sn<br />
surface with <strong>the</strong> results <strong>of</strong> <strong>the</strong> best-fit simulations (full lines) for<br />
<strong>the</strong> (unfaulted) surface alloy model.<br />
one opposing pair <strong>of</strong> <strong>Ni</strong> atoms neighbouring <strong>the</strong><br />
Sn surface alloy atoms. All <strong>of</strong> <strong>the</strong>se distortions<br />
werefoundtohaveoptimalvalues<strong>of</strong>zeroor0.01<br />
A with an estimated precision <strong>of</strong> ±0.05 A. The<br />
final best-fit <strong>structure</strong> gave a R-factor <strong>of</strong> 0.17 with<br />
a variance <strong>of</strong> 0.03 which was used to estimate <strong>the</strong><br />
precision <strong>of</strong> <strong>the</strong> resulting structural parameter<br />
values. The good agreement between <strong>the</strong>ory and<br />
experiment reflected in this R-factor may be seen<br />
from <strong>the</strong> spectral comparisons <strong>of</strong> Fig. 3. The<br />
optimised outermost <strong>Ni</strong>–<strong>Ni</strong> interlayer spacings<br />
(Fig. 4) were all essentially equal to <strong>the</strong> bulk<br />
value; specifically, <strong>the</strong> changes from <strong>the</strong> bulk<br />
value were Dz12 ¼ 0:5 1:0%; Dz23 ¼þ0:5<br />
1:0%; Dz34 ¼ 0:0 2:0%. Notice that in this<br />
nomenclature layer 1 corresponds to <strong>the</strong> <strong>Ni</strong><br />
atoms in <strong>the</strong> <strong>Ni</strong>2Sn surface alloy layer. The key<br />
parameter <strong>of</strong> <strong>the</strong> surface alloy rumpling amplitude,<br />
zSn1 was found to be 0.45 ± 0.03 A, essentially<br />
identical to <strong>the</strong> value found by LEIS<br />
(0.46 ± 0.04 A) [7].<br />
E.A. Soares et al. / Surface Science 550 (2004) 127–132 131<br />
Fig. 4. Schematic diagram <strong>of</strong> <strong>the</strong> best-fit unfaulted surface alloy<br />
model <strong>of</strong> <strong>the</strong> <strong>Ni</strong>(1 1 1)ð p 3 p 3Þ<strong>R30</strong>°-Sn surface, showing <strong>the</strong><br />
definition <strong>of</strong> <strong>the</strong> main structural parameters investigated.<br />
4. Discussion and conclusions<br />
Relative to <strong>the</strong> original objectives <strong>of</strong> this study,<br />
our first important conclusion is that <strong>the</strong><br />
<strong>Ni</strong>(1 1 1)ð p 3 p 3Þ<strong>R30</strong>°-Sn phase does, indeed,<br />
comprise a surface layer <strong>of</strong> ordered substitutional<br />
<strong>Ni</strong>2Sn alloy, confirming <strong>the</strong> earlier LEIS conclusions<br />
[7], and fur<strong>the</strong>rmore we find that this alloy<br />
phase does not have any stacking fault at <strong>the</strong><br />
substrate/surface alloy interface. Secondly, we<br />
obtain almost perfect agreement with <strong>the</strong> earlier<br />
LEIS study for <strong>the</strong> rumpling amplitude <strong>of</strong> this<br />
surface. This conclusion makes detailed quantitative<br />
comparisons <strong>of</strong> <strong>the</strong> behaviour <strong>of</strong> <strong>the</strong> three low<br />
index faces <strong>of</strong> <strong>Ni</strong>, on which Sn-induced surface<br />
alloy phases have been studied, more reliable. In<br />
particular we now have values for <strong>the</strong> rumpling<br />
amplitudes as follows: (i) from LEIS 0.46 ± 0.04 A<br />
[7] (<strong>Ni</strong>(1 1 1)) and 0.44 ± 0.05 A (<strong>Ni</strong>(1 0 0)) [9];<br />
(ii) from <strong>LEED</strong> 0.45 ± 0.03 A (<strong>Ni</strong>(1 1 1)) (this<br />
work) and 0.40 ± 0.03 A (<strong>Ni</strong>(1 1 0)) [10]. There is
132 E.A. Soares et al. / Surface Science 550 (2004) 127–132<br />
<strong>the</strong>refore a ra<strong>the</strong>r clear trend for <strong>the</strong> amplitude <strong>of</strong><br />
<strong>the</strong> rumpling to decrease as <strong>the</strong> atomic number<br />
density <strong>of</strong> <strong>the</strong> surface layer decreases. Of particular<br />
significance is <strong>the</strong> difference in rumpling amplitude<br />
between <strong>the</strong> closest and most open-packed surface<br />
((1 1 1) and (1 1 0)) which <strong>the</strong> <strong>LEED</strong> studies give<br />
as 0.05 ± 0.04 A.<br />
Because all three <strong>of</strong> <strong>the</strong>se surfaces have <strong>Ni</strong><br />
atoms close-packed in h110i azimuths (albeit<br />
with different spacings <strong>of</strong> <strong>the</strong>se close-packed<br />
rows), a simple hard-sphere model would predict<br />
<strong>the</strong> same rumpling amplitude for all three surfaces.<br />
Moreover, if one takes atomic radii for<br />
this hard-sphere model <strong>the</strong> predicted rumpling<br />
amplitude is much larger than any <strong>of</strong> <strong>the</strong>se<br />
experimental values. The exact value <strong>of</strong> this predicted<br />
rumpling amplitude is, however, dependent<br />
on <strong>the</strong> choice <strong>of</strong> atomic radii, especially for Sn<br />
which has different bulk structural forms. If we<br />
follow a common procedure <strong>of</strong> taking <strong>the</strong> atomic<br />
radius from <strong>the</strong> value <strong>of</strong> half <strong>the</strong> interatomic<br />
spacing in <strong>the</strong> elemental solid, but ÔcorrectedÕ to a<br />
coordination number <strong>of</strong> 12 [16,17], <strong>the</strong>n <strong>the</strong> radii<br />
<strong>of</strong> <strong>Ni</strong> and Sn are 1.246 and 1.623 A, respectively,<br />
leading to a <strong>Ni</strong>–Sn interatomic distance <strong>of</strong> 2.869<br />
A and a predicted surface rumpling amplitude <strong>of</strong><br />
1.42 A. A somewhat smaller value is obtained if<br />
one takes <strong>the</strong> <strong>Ni</strong>–Sn distance directly from <strong>the</strong><br />
bulk <strong>Ni</strong>3Sn alloy <strong>structure</strong> (2.61–2.64 A), thus<br />
taking some explicit account <strong>of</strong> <strong>the</strong> nature <strong>of</strong> <strong>Ni</strong>–<br />
Sn bonding; in this case <strong>the</strong> predicted rumpling<br />
amplitude is 0.78–0.87 A. still very much larger<br />
than what is observed. This difference is <strong>the</strong> basis<br />
<strong>of</strong> <strong>the</strong> earlier conclusion that reduced surface<br />
rumpling amplitudes are a true surface effect. Our<br />
comparison <strong>of</strong> <strong>the</strong> different amplitudes on <strong>the</strong><br />
three low index faces <strong>of</strong> <strong>Ni</strong> now provides fur<strong>the</strong>r<br />
clear evidence that <strong>the</strong> reduced rumpling is related<br />
to <strong>the</strong> nature <strong>of</strong> <strong>the</strong> surface, and that<br />
reducing <strong>the</strong> atom number density <strong>of</strong> <strong>the</strong> surface<br />
layer, leading to fur<strong>the</strong>r average valence charge<br />
depletion in <strong>the</strong> surface layer, fur<strong>the</strong>r reduces <strong>the</strong><br />
rumpling amplitude.<br />
Acknowledgements<br />
The financial support <strong>of</strong> <strong>the</strong> Physical Sciences<br />
and Engineering Research Council in <strong>the</strong> form <strong>of</strong> a<br />
senior research fellowshipfor DPW, and <strong>of</strong> <strong>the</strong><br />
European Community through a research contract<br />
(CI1*CT94-0063) is gratefully acknowledged.<br />
E.A.S., E.L.L. and V.E.C. would like to thank <strong>the</strong><br />
CNPq (Pr<strong>of</strong>ix) and Fapemig Brazilian research<br />
agencies for financial support.<br />
References<br />
[1] D.P. Woodruff (Ed.), The Chemical Physics <strong>of</strong> Solid<br />
Surfaces, Surface Alloys and Alloy Surfaces, vol. 10,<br />
Elsevier, Amsterdam, 2002.<br />
[2] D.P. Woodruff, E. Vlieg, in: D.P. Woodruff (Ed.), The<br />
Chemical Physics <strong>of</strong> Solid Surfaces, Surface Alloys and<br />
Alloy Surfaces, vol. 10, Elsevier, Amsterdam, 2002, p. 277.<br />
[3] D.P. Woodruff, J. Robinson, Appl. Surf. Sci. 219 (2003) 1.<br />
[4] D. Brown, P.D. Quinn, D.P. Woodruff, P. Bailey, T.C.Q.<br />
Noakes, Phys. Rev. B 61 (2000) 7706.<br />
[5] D.P. Woodruff, D. Brown, P.D. Quinn, T.C.Q. Noakes,<br />
P. Bailey, Nucl. Instrum. Meth. B 183 (2001) 128.<br />
[6] S.H. Overbury, D.R. Mullins, M.T. Paffett, B.E. Koel,<br />
Surf. Sci. 254 (1991) 45.<br />
[7] Y. Ku, S.H. Overbury, Surf. Sci. 273 (1992) 341.<br />
[8] S.H. Overbury, Y. Ku, Phys. Rev. B 46 (1992) 7868.<br />
[9] Y.D. Li, L.Q. Jiang, B.E. Koel, Phys. Rev. B 49 (1994)<br />
2813.<br />
[10] P.D. Quinn, C. Bittencourt, D. Brown, D.P. Woodruff,<br />
T.C.Q. Noakes, P. Bailey, J. Phys.: Condens. Matter 14<br />
(2002) 665.<br />
[11] A.F. Lee, C.J. Baddeley, C. Hardacre, G.D. Morridge,<br />
R.M. Ormerod, R.M. Lambert, J. Phys. Chem. B 101<br />
(1998) 2797.<br />
[12] J.B. Pendry, J. Phys. C: Solid State Phys. 13 (1980) 937.<br />
[13] M.A. Van Hove, W. Moritz, H. Over, P.J. Rous, A.<br />
Wander, A. Barbieri, N. Materer, U. Starke, G.A. Somorjai,<br />
Surf. Sci. Rep. 19 (1993) 191.<br />
[14] A. Barbieri, M.A. Van Hove, private communication.<br />
Available from .<br />
[15] P. Kaukasoina, M. Lindroos, R.D. Diehl, D. Fisher,<br />
S. Chandavarkar, I.R. Collins, J. Phys.: Condens. Matter<br />
5 (1993) 2875.<br />
[16] V.M. Goldschmidt, Z. Phys. Chem. 133 (1928) 397.<br />
[17] R.C. Evans, An Introduction to Crystal Chemistry, second<br />
ed., Cambridge University Press, 1966.