Terasen Utilities 2009 ROE Capital Structure Application - FortisBC
Terasen Utilities 2009 ROE Capital Structure Application - FortisBC
Terasen Utilities 2009 ROE Capital Structure Application - FortisBC

You also want an ePaper? Increase the reach of your titles
YUMPU automatically turns print PDFs into web optimized ePapers that Google loves.
May 15, <strong>2009</strong><br />
British Columbia <strong>Utilities</strong> Commission<br />
Sixth Floor, 900 Howe Street<br />
Vancouver, B.C. V6Z 2N3<br />
Attention:<br />
Ms. Erica M. Hamilton, Commission Secretary<br />
Dear Ms. Hamilton:<br />
Re: <strong>Terasen</strong> Gas Inc. ("TGI", the “Company”), <strong>Terasen</strong> Gas (Vancouver Island) Inc.<br />
(“TGVI”) and <strong>Terasen</strong> Gas (Whistler) Inc. (“TGW”)<br />
Collectively the “<strong>Terasen</strong> <strong>Utilities</strong>”<br />
Return on Equity and <strong>Capital</strong> <strong>Structure</strong><br />
On behalf of the <strong>Terasen</strong> <strong>Utilities</strong>, we respectfully attach our application for Return on Equity<br />
and <strong>Capital</strong> <strong>Structure</strong> (the “<strong>Application</strong>”).<br />
We propose that a Procedural Conference be held, on Tuesday, June 9, <strong>2009</strong>, to determine<br />
the most appropriate review process for the <strong>Application</strong>, subject to confirmation by the British<br />
Columbia <strong>Utilities</strong> Commission (the “Commission”). The Commission hearing room located<br />
at the 12 th floor, 1125 Howe Street, Vancouver, BC was confirmed to be available and has<br />
been tentatively reserved.<br />
Pursuant to Commission Order No. L-78-06, the <strong>Terasen</strong> <strong>Utilities</strong> have provided the<br />
Commission with a Draft forms of Procedural Order which includes a Draft Regulatory<br />
Timetable for the Commission’s consideration.<br />
Sincerely,<br />
TERASEN GAS INC.<br />
TERASEN GAS (VANCOUVER ISLAND) INC. and<br />
TERASEN GAS (WHISTLER) INC.<br />
Original signed by:<br />
Scott A. Thomson<br />
Vice President, Regulatory Affairs & CFO<br />
Attachments<br />
Scott A. Thomson<br />
Vice President, Regulatory Affairs and<br />
Chief Financial Officer<br />
16705 Fraser Highway<br />
Surrey, B.C. V4N 0E8<br />
Tel: (604) 443-6565<br />
Fax: (604) 443-6534<br />
Email: scott.thomson@terasengas.com<br />
www.terasengas.com<br />
Regulatory Affairs Correspondence<br />
Email: regulatory.affairs@terasengas.com<br />
cc (email only): Parties to the TGI 2004-<strong>2009</strong> Multi-Year PBR Settlement<br />
Parties to the <strong>Terasen</strong> Gas (Vancouver Island) Inc. 2006-<strong>2009</strong> Negotiated Settlement<br />
Parties to the 2005 TGI-TGVI <strong>ROE</strong> Proceeding<br />
PNG<br />
<strong>FortisBC</strong><br />
BC Hydro<br />
BCTC
May 15, <strong>2009</strong><br />
British Columbia <strong>Utilities</strong> Commission<br />
6 th Floor, 900 Howe Street<br />
Vancouver, BC<br />
V6Z 2N3<br />
Attention: Ms. Erica M. Hamilton, Commission Secretary<br />
Dear Ms. Hamilton:<br />
Scott A. Thomson<br />
Vice President, Regulatory Affairs and<br />
Chief Financial Officer<br />
16705 Fraser Highway<br />
Surrey, B.C. V4N 0E8<br />
Tel: (604) 443-6565<br />
Fax: (604) 443-6534<br />
Email: scott.thomson@terasengas.com<br />
www.terasengas.com<br />
Regulatory Affairs Correspondence<br />
Email: regulatory.affairs@terasengas.com<br />
Re: <strong>Terasen</strong> Gas Inc. ("TGI", the “Company”), <strong>Terasen</strong> Gas (Vancouver Island) Inc.<br />
(“TGVI”) and <strong>Terasen</strong> Gas (Whistler) Inc. (“TGW”), collectively the “<strong>Terasen</strong><br />
<strong>Utilities</strong>”<br />
Return on Equity and <strong>Capital</strong> <strong>Structure</strong><br />
This <strong>Application</strong> is made pursuant to sections 59 and 60 of the <strong>Utilities</strong> Commission Act (the<br />
“Act”) for an order or orders of the British Columbia <strong>Utilities</strong> Commission (“BCUC” or<br />
“Commission”) to revise the rates of the <strong>Terasen</strong> <strong>Utilities</strong> to reflect the relief requested herein.<br />
The <strong>Terasen</strong> <strong>Utilities</strong> request that the Commission consider the relief requested and matters<br />
raised in the <strong>Application</strong>.<br />
The <strong>Terasen</strong> <strong>Utilities</strong> request that the Commission determine an increased return on common<br />
equity (“<strong>ROE</strong>”) for TGI for rate-setting purposes, and that the so determined <strong>ROE</strong> for TGI be<br />
used in establishing the <strong>ROE</strong> of TGVI and TGW used for rate-setting. The <strong>Terasen</strong> <strong>Utilities</strong><br />
request that the revised <strong>ROE</strong> for TGI, TGVI and TGW be effective July 1, <strong>2009</strong>.<br />
The <strong>Terasen</strong> <strong>Utilities</strong> request that the Commission eliminate the use of an <strong>ROE</strong> automatic<br />
adjustment mechanism (“AAM”) in the determination of the <strong>ROE</strong> to be used by the <strong>Terasen</strong><br />
<strong>Utilities</strong> for rate-setting. While an AAM may be desirable for administrative efficiency, the AAM<br />
must produce an allowed <strong>ROE</strong> that is a fair return for the public utilities that are subject to the<br />
mechanism. The AAM used by the BCUC at the current time does not result in a fair return.<br />
For this reason, elimination of the current AAM is requested.<br />
In replacement of the use of an AAM in the determination of their <strong>ROE</strong>, the <strong>Terasen</strong> <strong>Utilities</strong><br />
request that the <strong>ROE</strong> determined in this proceeding to be appropriate for TGI be used as the<br />
benchmark or generic <strong>ROE</strong> (“Benchmark <strong>ROE</strong>”) for the determination of the <strong>ROE</strong> of TGVI and<br />
TGW. TGVI and TGW request that the Commission continue to set their respective allowed<br />
returns on equity with reference to the Benchmark <strong>ROE</strong> established in this proceeding by<br />
adding a utility specific risk premium of 70 basis points in the case of TGVI and 50 basis points<br />
in the case of TGW to the Benchmark <strong>ROE</strong>.<br />
TGI requests that the Commission alter and increase the common equity component of the<br />
capital structure of TGI for rate-setting purposes. TGI requests that the increased common<br />
equity component be included in the setting of TGI effective January 1, 2010.<br />
Page 1
THE TERASEN UTILITIES<br />
<strong>2009</strong> <strong>ROE</strong> AND CAPITAL STRUCTURE APPLICATION<br />
The Company and TGW further request that the Commission set their current rates as interim,<br />
effective July 1, <strong>2009</strong>, until such time as permanent rates are established which give effect to<br />
the relief requested in this <strong>Application</strong>.<br />
TGVI is not requesting changes to its <strong>2009</strong> rates, but rather requests that, pursuant to the<br />
provisions of the Special Direction, the increase in its allowed <strong>ROE</strong> resulting from the<br />
Commission’s determinations in this proceeding be treated as an increase to TGVI’s cost of<br />
service, effective July 1, <strong>2009</strong>, which will result in an adjustment to the <strong>2009</strong> Revenue<br />
Deficiency or Revenue Surplus and will be reflected in the Revenue Deficiency Deferral Account<br />
balance.<br />
The <strong>Terasen</strong> <strong>Utilities</strong> recognize that other investor owned utilities regulated by the BCUC may<br />
wish to have their allowed returns established with reference to the Benchmark <strong>ROE</strong> and expect<br />
that they will indicate their positions on these matters through intervention in this proceeding.<br />
Background to this <strong>Application</strong><br />
The Commission first introduced a generic <strong>ROE</strong> adjustment mechanism in 1994 to annually<br />
establish the allowed returns on equity for the utilities it regulates in the province. The 1994<br />
Decision established a return on equity for the benchmark “low risk” utility in British Columbia<br />
and BC Gas Utility Ltd. (now <strong>Terasen</strong> Gas Inc.) was deemed the benchmark low risk utility. The<br />
1994 Decision introduced an automatic adjustment mechanism to reset the annual generic<br />
allowed return on equity. The formula introduced at that time adjusted the allowed <strong>ROE</strong> on a<br />
one for one basis with movements in the forecast long-term Government of Canada Bond<br />
(“GCB”) yield provided the yield had moved more than 50 basis points year over year.<br />
Shortly thereafter, the National Energy Board (‘NEB”) established a generic allowed <strong>ROE</strong> for the<br />
pipelines it regulated in the 1995 Multi-Pipeline Cost of <strong>Capital</strong> Proceeding (Decision RH-2-94).<br />
In the RH-2-94 Decision, the NEB approved an <strong>ROE</strong> for a low risk, high-grade benchmark<br />
pipeline, based primarily on the equity risk premium test. The <strong>ROE</strong> was set at 12.25% for the<br />
1995 test year and the Board also adopted a formula for adjusting the allowed <strong>ROE</strong> on an<br />
annual basis for 75% of the change in the forecast GCB yield from a base of 9.25%.<br />
In 1997, the BCUC recalibrated the <strong>ROE</strong> adjustment mechanism by Order G-49-97 using a<br />
benchmark <strong>ROE</strong> of 12.25% at a long-term GCB yield of 9.25%. The Order introduced a sliding<br />
scale adjustment of 80% of the movement of the forecast yield of the 30 year GCB from a<br />
starting point of 9.25%. In that Order the Commission directed that the range of long-term GCB<br />
yields over which the adjustment formula will apply was 6% to 12%.<br />
In 1999, the BCUC once again examined the generic <strong>ROE</strong> and automatic adjustment<br />
mechanism. In its Order G-80-99, the Commission set the low risk benchmark <strong>ROE</strong> at 9.50%<br />
when the long-term GCB yield was forecast to be 6.00% and fixed the equity risk premium at<br />
350 basis points when the GCB yield was forecast to be below 6.00% and adjusted for 80% of<br />
the movement of the long-term GCB yield above 6.00%.<br />
In the last hearing into Cost of <strong>Capital</strong> in 2005 (resulting in Order G-14-06), the Commission<br />
adjusted the starting point for the formula based <strong>ROE</strong> to 9.145% when the long-term GCB yield<br />
is forecast to be 5.25%, modified the sliding scale adjustment factor to 75% of the movement in<br />
Page 2
THE TERASEN UTILITIES<br />
<strong>2009</strong> <strong>ROE</strong> AND CAPITAL STRUCTURE APPLICATION<br />
the GCB forecast from 80% and eliminated the asymmetry in the sliding scale adjustment<br />
mechanism above and below 6%.<br />
During this period, the Ontario Energy Board (“OEB”) in 1997, the Régie de l’Energie de<br />
Québec (“Régie”) in 1998 and the Alberta Energy and <strong>Utilities</strong> Board (“EUB”) in 2004, adopted<br />
formulas substantially similar in design and resulting <strong>ROE</strong>s to the BCUC and NEB formulas.<br />
While there has been some evolution in the parameters and the mechanics of the BCUC<br />
formula over the intervening decade and a half, it has converged with the design and <strong>ROE</strong><br />
produced by the NEB formula. Today the BCUC formula continues to annually adjust allowed<br />
<strong>ROE</strong> by 75% of the movement in forecast 30 year GCB yields, a similar adjustment to the<br />
operation of the RH-2-94 formula.<br />
In 2008 the NEB heard the application of Trans Quebec & Maritimes Pipeline (“TQM”) to<br />
establish an allowed return on equity and capital structure for 2007 and 2008. The Decision in<br />
that proceeding was a major departure from the formulaic means by which the NEB had<br />
determined allowed <strong>ROE</strong> since 1995 for the major pipelines it regulated. In the RH-1-08<br />
Reasons for Decision released in March <strong>2009</strong> (the “TQM Decision”), the NEB decided that the<br />
<strong>ROE</strong> for TQM should not be set by the RH-2-94 formula. Subsequent to this Decision the NEB<br />
communicated with the companies regulated by it, and regular Intervenors, advising that it had<br />
decided to consider whether it should initiate a review of the RH-2-94 Decision; and soliciting<br />
comments from interested parties. The Alberta <strong>Utilities</strong> Commission (“AUC”) has a generic<br />
proceeding underway respecting cost of capital for the utilities it regulates and the OEB has<br />
sought submissions on the relationship between current economic and financial conditions and<br />
the returns produced by its <strong>ROE</strong> formula, and what adjustment should be made to cost of<br />
capital parameters.<br />
This Commission must also review its formulaic approach to determining the <strong>ROE</strong> allowed in<br />
the rates of the utilities it regulates. Such a review is sought by this <strong>Application</strong>.<br />
<strong>Structure</strong> of the <strong>Application</strong><br />
The evidence in this application is structured as follows:<br />
• The Company’s <strong>Application</strong> Letter<br />
• Tab 1 – Business Risks<br />
• Tab 2 – Testimony of Mr. Donald A. Carmichael, MBA<br />
• Tab 3 – Opinion of Ms. Kathleen C. McShane, MBA, CFA<br />
• Tab 4 - Evidence of Dr. James H. Vander Weide, PhD<br />
• Appendices – Studies and expert commentary on Fair Returns and the shortcomings of<br />
the current formula <strong>ROE</strong> approach<br />
Reasons for a Review<br />
The <strong>Terasen</strong> <strong>Utilities</strong> believe there are four compelling reasons for the Commission to undertake<br />
this review and adjust both the Benchmark <strong>ROE</strong> and TGI’s equity thickness.<br />
Page 3
THE TERASEN UTILITIES<br />
<strong>2009</strong> <strong>ROE</strong> AND CAPITAL STRUCTURE APPLICATION<br />
The Commission’s 2006 Decision Triggers Review<br />
First, a review is required based on the Commission’s March 2006 Decision respecting TGI’s<br />
last application for a review of <strong>ROE</strong> and capital structure (the “2006 Decision”).<br />
The Commission’s 2006 Decision 1<br />
stated that:<br />
“In light of the AEUB finding in its 2004 Generic Cost of <strong>Capital</strong> Decision, the<br />
Commission Panel will adopt a review period of five years, while noting that any<br />
party continues to be free at any time to apply to the Commission to consider a<br />
review of the AAM. In addition, should the AAM result in a <strong>ROE</strong> for the benchmark<br />
low-risk utility of less than 8 percent or greater than 12 percent the Commission<br />
will canvass the views of the parties on whether the AAM should be reviewed.”<br />
Under the current formula, when the forecast long-term GCB yields fall below 3.72% the formula<br />
produces an allowed <strong>ROE</strong> of less than 8%.<br />
In December 2008, yields on 30 year GCBs hit 3.40%, a level not seen since the mid-1950s,<br />
and the January <strong>2009</strong> equivalent to the November Consensus forecast on which the annual<br />
benchmark <strong>ROE</strong> is set was 3.57%. The 3.57% forecast 30 year GCB yield falls below the level<br />
that would result in an <strong>ROE</strong> award of 8%, which the Commission recognized should trigger a<br />
review of the generic <strong>ROE</strong> adjustment mechanism.<br />
Recent NEB Decision Suggests <strong>ROE</strong> and Cost of <strong>Capital</strong> Review Required<br />
Second, the recent decision from the NEB respecting TQM suggests that it is imperative that the<br />
<strong>ROE</strong> formula be revisited.<br />
On March 19, <strong>2009</strong> the NEB released its TQM Decision, on TQM’s application relating to the<br />
cost of capital to be utilized by TQM in the calculation of its final tolls for the years 2007 and<br />
2008. Effectively the TQM application was to allow for the determination of an overall fair return<br />
on capital for those two years. In its application TQM sought relief from the results of the NEB’s<br />
formula for the setting of <strong>ROE</strong>, and in the TQM proceeding the formula and the appropriateness<br />
of its results were examined.<br />
The results produced by the <strong>ROE</strong> formula that the NEB reviewed are very similar to those<br />
produced by the current BCUC formula under which the <strong>Terasen</strong> <strong>Utilities</strong> operate. For the<br />
period 1995 through 2006, TQM’s returns had been set in accordance with the formula<br />
established in the 1994 Multi-Pipeline Cost of <strong>Capital</strong> Proceeding Decision RH-2-94. As noted<br />
above, while the NEB formula uses a different base GCB yield than the current BCUC formula<br />
(9.25% vs. 5.25%), the results are substantially the same; for <strong>2009</strong> the NEB formula produces<br />
an allowed <strong>ROE</strong> that is only 10 basis points different from the BCUC formula <strong>ROE</strong> for the<br />
benchmark low risk utility.<br />
1 Page 16, Section 3.2 Review Process, March 2, 2006 Decision<br />
Page 4
THE TERASEN UTILITIES<br />
<strong>2009</strong> <strong>ROE</strong> AND CAPITAL STRUCTURE APPLICATION<br />
The TQM Decision is noteworthy in many respects, and supports the Company’s conclusion<br />
that the BCUC should undertake a review of the benchmark <strong>ROE</strong>, the <strong>ROE</strong> adjustment formula,<br />
and TGI’s capital structure.<br />
In the RH-1-2008 Decision the NEB discarded the <strong>ROE</strong> determination from the RH-2-94<br />
formula, and effectively increased the allowed <strong>ROE</strong> for TQM, at the previously approved capital<br />
structure, by almost 300 basis points over what the RH-2-94 formula produced for 2007 and<br />
2008. The magnitude of the variance provides a strong indication that the formula had veered<br />
dramatically off course.<br />
Although this recent Decision is only applicable to TQM, the NEB made a number of<br />
determinations that are applicable more generally. In the TQM Decision the NEB accepted a<br />
number of factors and arguments that TGI and other Canadian utilities have previously put<br />
forward in cost of capital proceedings but which had not previously been given weight by their<br />
respective regulators. These factors, which will be discussed further below, were instrumental<br />
in forming the TQM Decision and are widely applicable in informing a fair return for Canadian<br />
utilities generally and for TGI specifically.<br />
It is also noteworthy that the significant increase in TQM’s allowed return for 2007 and 2008 was<br />
based on an evidentiary record that preceded the deterioration in capital market conditions that<br />
occurred in the latter part of 2008 and early <strong>2009</strong>. In other words, the NEB found that a<br />
significant increase in the allowed <strong>ROE</strong> was warranted even before the dramatic risk re-pricing<br />
evidenced in the run up in both corporate borrowing costs and equity costs. The risk re-pricing<br />
that occurred over the winter, and which was not considered by the NEB in its conclusion that<br />
the RH-2-94 formula produced results that were materially below a fair return, indicates that a<br />
similar review today would likely produce an even greater variance from the formula <strong>ROE</strong>.<br />
Commission’s Obligations Point to Need for Review<br />
Third, the <strong>Terasen</strong> <strong>Utilities</strong> submit that the Commission is compelled to revisit the <strong>ROE</strong> formula<br />
based on its obligations under the <strong>Utilities</strong> Commission Act. In particular those parts of sections<br />
59 and 60 which require that the Commission establish rates that are not unjust or<br />
unreasonable while providing investors in the public utilities regulated by the Commission an<br />
opportunity to earn a fair return on their capital. This is highlighted by the Commission’s<br />
determinations at page 7 and 8 of the 2006 Decision as follows:<br />
“The Commission’s mandate is to ensure that ratepayers receive safe, reliable and non<br />
discriminatory energy services at fair rates from the public utilities it regulates, and that<br />
shareholders of those public utilities are afforded a reasonable opportunity to earn a fair<br />
return on their invested capital. The process to establish a fair return and just and<br />
reasonable rates is enshrined in the UCA where “the commission must consider all<br />
matters that it considers proper and relevant affecting the rate” and in doing so it must<br />
have due regard to the setting of a rate that “is not unjust or unreasonable” within the<br />
meaning of section 59 (of the Act) [UCA, s.60 (1)(a) and (b)(i)].<br />
The reasons of Locke J. and Martland J. in the B.C. Electric Railway case are ad idem<br />
on the matter of the need to consider both the costs of providing service and a fair return<br />
on invested capital used or prudently incurred to provide the service.<br />
Page 5
THE TERASEN UTILITIES<br />
<strong>2009</strong> <strong>ROE</strong> AND CAPITAL STRUCTURE APPLICATION<br />
[quotations from judgments of Locke J and Martland J omitted]<br />
The submissions of the Applicants and the Intervenors in this proceeding are not ad<br />
idem regarding the appropriate consideration of the “balancing of interests”. The<br />
Commission Panel finds the reasons of Locke J. and Martland J. instructive, and notes<br />
that they are accepted in the Bell Canada case. The Commission Panel does not accept<br />
that the reference by Martland J. to a “balancing of interests” to mean that the exercise<br />
of determining a fair return is an exercise of balancing the customers’ interests in low<br />
rates, assuming no detrimental effects on the quality of service, with the shareholders’<br />
interest in a fair return. In coming to a conclusion of a fair return, the Commission does<br />
not consider the rate impacts of the revenue required to yield the fair return. Once the<br />
decision is made as to what is a fair return, the Commission has a duty to approve rates<br />
that will provide a reasonable opportunity to earn a fair return on invested capital.”<br />
The Commission must adhere to the Fair Return Standard which has been established by<br />
Canadian and US courts and was reaffirmed by the NEB in the recent TQM Decision at page 6:<br />
“The Board has considered the arguments put forward by TQM and CAPP and<br />
continues to believe that the legal framework for determining a fair return is as set out in<br />
Chapter 2 of the RH-2-2004, Phase II Decision. The Board notes that these views were<br />
based on the Federal Court of Appeal Decision in TransCanada v. NEB.<br />
When using the cost of service approach to determine tolls, the cost of capital is<br />
determined using the Board’s sound judgment. Often the largest and therefore most<br />
important portion of cost of capital is the overall return on equity. While customers and<br />
consumers have an interest in ensuring that the cost of equity is not overstated, in the<br />
Board’s view, this is factored in by having intervenors test and challenge the position the<br />
company has put forward. It does not mean that in determining the cost of capital that<br />
investor and consumer interests are balanced. In the Board’s view, the Federal Court of<br />
Appeal was clear that the overall return on equity must be determined solely on the<br />
basis of a company’s cost of equity capital, and that the impact of any resulting toll<br />
increase is an irrelevant consideration in that determination.<br />
Therefore, the Board reaffirms the Fair Return Standard as articulated on page 17 of the<br />
RH-2-2004, Phase II Decision. The Fair Return Standard requires that a fair or<br />
reasonable overall return on capital should:<br />
• be comparable to the return available from the application of the invested capital to<br />
other enterprises of like risk (comparable investment requirement);<br />
• enable the financial integrity of the regulated enterprise to be maintained (financial<br />
integrity requirement); and<br />
• permit incremental capital to be attracted to the enterprise on reasonable terms<br />
and conditions (capital attraction requirement).”<br />
The evidence presented in this <strong>Application</strong> demonstrates that this obligation is no longer being<br />
met by the current BCUC <strong>ROE</strong> formula. To properly serve the broad public interest, it is critical<br />
Page 6
THE TERASEN UTILITIES<br />
<strong>2009</strong> <strong>ROE</strong> AND CAPITAL STRUCTURE APPLICATION<br />
that British Columbia utilities are in a position to maintain their financial health. This is<br />
necessary to ensure that they can:<br />
• meet their customers’ service needs at a reasonable cost;<br />
• attract investment capital at reasonable cost under all market conditions;<br />
• earn a fair and reasonable return on previously invested capital;<br />
• support the Energy and Environmental Policy objectives of the BC Government;<br />
• pursue investments in efficiency; and<br />
• be sustainable in the face of ongoing and changing business risks.<br />
Worsening Market Conditions Shows Current Mechanism Is Flawed<br />
Fourth, business conditions have changed dramatically since the 2005 BCUC cost of capital<br />
hearing, and the nature of those changes strongly suggests the Commission should reset the<br />
Benchmark <strong>ROE</strong> and increase the equity in TGI's capital structure.<br />
Since 2006, the current mechanism has driven allowed <strong>ROE</strong> levels lower and lower even while<br />
utility debt costs have moved higher in absolute terms. Risk has been re-priced by the market<br />
and the costs of debt and equity capital have increased, as noted by the Company’s witnesses<br />
in this proceeding and by market commentators, and as evidenced by the dramatic widening of<br />
corporate credit spreads in recent months. This has exacerbated the inadequate formula-driven<br />
<strong>ROE</strong> results that pre-date the recent market developments as the allowed <strong>ROE</strong>s in BC under<br />
the formula have continued to decline steadily:<br />
• The gap between returns in BC (and other Canadian jurisdictions which employ a similar<br />
formulaic approach) has continued to increase relative to those in jurisdictions that have<br />
not relied on a formula tied to long bond rates (most notably jurisdictions in the US);<br />
• No new pipelines are being built under formula based allowed returns in Canada. These<br />
have been constructed under negotiated capital structures and <strong>ROE</strong>s as the formula<br />
based <strong>ROE</strong>s are not adequate; and<br />
• More recently, the formula is producing allowed returns that have narrowed in relation to<br />
investment grade utility corporate bond yields. In fact, in December 2008 indicative TGI<br />
30 year new debt issue costs came within 18 basis points of the potential formula<br />
generated <strong>ROE</strong> based on that month’s forecast of long-term GCB yields. This minimal<br />
spread between debt costs and formula based equity returns would not provide an<br />
adequate return for equity risk takers and underscores the fact that the formula isn’t<br />
working.<br />
There have been significant reductions in the yields on long-term GCBs used to determine the<br />
allowed return on equity since the automatic adjustment mechanism was first introduced, as<br />
well as material changes in both the general economic conditions and the risk profile of TGI<br />
over that period of time. These changes, and the allowed returns on equity calculated through<br />
the automatic adjustment mechanism, have resulted in inadequate returns for utility investments<br />
in British Columbia.<br />
Page 7
THE TERASEN UTILITIES<br />
<strong>2009</strong> <strong>ROE</strong> AND CAPITAL STRUCTURE APPLICATION<br />
The evidence establishes that the current AAM has veered dangerously off course. With the<br />
benefit of hindsight, evidence is now available (see Section 3 B 4 of Dr. Vander Weide’s<br />
testimony “Evidence on the Sensitivity of the Forward-looking Required Equity Risk Premium on<br />
Utility Stocks to Changes in Interest Rates”) that indicates that the adjustment factor used in the<br />
current formula should have been less than 50% of the movement in long-term GCB rates. That<br />
information was not available to the Company or the Commission at the time of the 2005<br />
hearing.<br />
The Way Forward: Revisiting the <strong>ROE</strong> and <strong>Capital</strong> <strong>Structure</strong><br />
In light of these realities, it is appropriate at this time for the Commission to re-examine the cost<br />
of capital for TGI (and indirectly for the other <strong>Terasen</strong> <strong>Utilities</strong>) and increase the return on equity<br />
for TGI (which has been considered the benchmark utility). The Commission must also review<br />
and eliminate the use of the current <strong>ROE</strong> automatic adjustment mechanism, in order to provide<br />
the public utilities it regulates with the opportunity to earn a fair return on the capital they have<br />
invested.<br />
In addition, the Commission should establish a capital structure for TGI that more appropriately<br />
reflects the business and financial risks of the company, and which is in line with its North<br />
American peers. Canadian utilities generally are thinly capitalized compared to the US utilities<br />
with whom they compete for capital. It is not sufficient to simply increase TGI’s equity thickness<br />
to bring it in line with the increases in equity thickness granted to other Canadian utilities in<br />
recent years.<br />
This <strong>Application</strong> presents the Company’s case respecting the required change in <strong>ROE</strong> and also<br />
an increase to the deemed equity component of TGI’s capital structure. The <strong>Application</strong> is<br />
structured around the following evidence and relief being sought:<br />
Part 1: A Flawed Methodology. This Section presents evidence that the <strong>ROE</strong> resulting<br />
from the Commission’s <strong>ROE</strong> formula is inadequate and must be increased in order for<br />
the <strong>Terasen</strong> <strong>Utilities</strong> to be allowed an opportunity earn a fair return This Section also<br />
provides evidence that the capital structure under which the Company operates should<br />
be changed if it is to compete for capital effectively.<br />
When the evidence is considered it will be clear that the allowed return on equity<br />
resulting from the current formula, as well as the common equity component in the<br />
capital structure of TGI deemed for rate making purposes, must be increased.<br />
Part 2: The Proposed Solution. This Section will set forth a recalibrated <strong>ROE</strong> for TGI<br />
(and the Benchmark <strong>ROE</strong>) and a more appropriate capital structure for TGI.<br />
Specifically:<br />
• The <strong>Terasen</strong> <strong>Utilities</strong> request that the return on equity allowed for TGI, which will<br />
be the Benchmark <strong>ROE</strong>, be set at 11% effective July 1, <strong>2009</strong>;<br />
Page 8
THE TERASEN UTILITIES<br />
<strong>2009</strong> <strong>ROE</strong> AND CAPITAL STRUCTURE APPLICATION<br />
• TGI requests that the deemed common equity component in its capital structure<br />
allowed for rate making purposes be increased to 40%, as compared to the<br />
current 35.01% with effect from January 1, 2010 2<br />
.<br />
• TGW requests that the company specific risk premium of 50 basis points recently<br />
established by the Commission in the Commission’s recent Decision in relation to<br />
TGW’s <strong>2009</strong> Revenue Requirements continue, and be applied to the new<br />
Benchmark <strong>ROE</strong> that is to be made effective July 1, <strong>2009</strong>; and<br />
• TGVI requests that the company specific risk premium of 70 basis points that<br />
was established for TGVI in the 2006 Decision continue, and be applied to the<br />
new Benchmark <strong>ROE</strong> that is to be made effective July 1, <strong>2009</strong>.<br />
The <strong>Terasen</strong> <strong>Utilities</strong> are confident that the evidence presented in this <strong>Application</strong> demonstrates<br />
that these requests are reasonable and warranted.<br />
Part 1: A Flawed Methodology<br />
With the passage of time and the availability of empirical evidence, it has become clear that the<br />
Commission’s AAM – even considering the revisions made to it – is flawed, and its results<br />
inadequate The flaws are significant, with the consequence that the <strong>ROE</strong> determined by the<br />
AAM is not sufficient to produce fair returns on the equity invested in the utility assets of the<br />
<strong>Terasen</strong> <strong>Utilities</strong>. Moreover, the capital structure under which TGI operates is no longer<br />
appropriate if TGI is to ensure its cost-effective access to capital, and if it is to achieve<br />
comparability with its North American peers. <strong>Capital</strong> structure and <strong>ROE</strong> are inextricably linked<br />
and cannot be examined properly in isolation from one another. These two components,<br />
together with debt costs, must be considered so that they result in an overall return on rate base<br />
which is fair.<br />
This Section of the <strong>Application</strong> presents the following evidence:<br />
1.0 The Fair Return Standard is No Longer Being Met;<br />
2.0 The Formula is Broken;<br />
3.0 Unprecedented Turbulence In Credit Markets Further Reinforces The Need To<br />
Change The Formula; and<br />
4.0 TGI’s Business Risk is Changing<br />
2 TGI’s deemed equity thickness was increased from 35% to 35.01% pursuant to a Special Direction related to the<br />
amalgamation of <strong>Terasen</strong> Gas (Squamish) Inc. and TGI to ensure the resultant capital structure reflected the<br />
weighted average capital structure of the two predecessor companies. TGI anticipates a final decision in this<br />
matter will not be rendered until late in <strong>2009</strong>. TGI therefore proposes as a practical matter that that the increase in<br />
its common equity component be made effective January 1, 2010, and rates for 2010 be set on that basis, similar<br />
to the manner in which an increase in its equity component was dealt with in respect of the 2006 Decision.<br />
Page 9
THE TERASEN UTILITIES<br />
<strong>2009</strong> <strong>ROE</strong> AND CAPITAL STRUCTURE APPLICATION<br />
Combined, these four realities mean that the results of the current formulaic approach to <strong>ROE</strong><br />
are inadequate, and the current equity component in the capital structure of TGI should be<br />
increased. The Commission should update both the Benchmark <strong>ROE</strong> and TGI’s capital<br />
structure. This will be an important and required determination to enable utilities in BC to<br />
operate from a healthy and sustainable foundation and continue to appropriately serve the<br />
public interest.<br />
1.0 The Fair Return Standard Is No Longer Being Met<br />
The evidence establishes that the current BCUC <strong>ROE</strong> formula and the results it is generating do<br />
not meet the Fair Return Standard for BC utilities.<br />
The Fair Return Standard is an accepted and established standard. It has been derived from<br />
accepted legal precedents and has been referred to in numerous regulatory decisions in<br />
Canada and the US. It was also re-affirmed by the NEB in its TQM Decision earlier this year.<br />
Section III of the evidence of Ms. Kathleen McShane discusses the derivation of the Fair Return<br />
Standard. According to the standard a fair return must give a regulated utility the opportunity to:<br />
1. earn a return on investment commensurate with that of comparable risk<br />
enterprises;<br />
2. maintain its financial integrity; and<br />
3. attract capital on reasonable terms.<br />
Ms. McShane states that:<br />
“The legal precedents make it clear that the three requirements are separate and<br />
distinct. None of the three requirements is given priority over the others. The fair return<br />
standard is met only if all three requirements are satisfied. In other words, the fair return<br />
standard is only satisfied if the utility can attract capital on reasonable terms and<br />
conditions, its financial integrity can be maintained and the return allowed is comparable<br />
to the returns of enterprises of similar risk.”<br />
In March 2008 the Honourable John C. Major, former Justice, Supreme Court of Canada, and<br />
Roland Priddle, former Chair of the National Energy Board, published “The Fair Return<br />
Standard for Return on Investment by Canadian Gas <strong>Utilities</strong>” 3<br />
. This paper discusses the legal<br />
foundations of the Fair Return Standard (“FRS’) and the obligations it places on regulators to set<br />
a fair and reasonable return. It also discusses the convergence of Canadian regulators on the<br />
adoption of formula based Automatic Adjustment Mechanisms very similar to the current AAM<br />
used by the BCUC. Significantly Major/Priddle state that:<br />
“The now-universal generic <strong>ROE</strong> approach by Canadian regulators of major gas<br />
utilities has created some regulatory economies. But unfortunately its mechanistic<br />
character suspends for lengthy periods the previously-valued application of informed<br />
3 The Fair Return Standard for Return on Investment by Canadian Gas <strong>Utilities</strong>: Meaning, <strong>Application</strong>, Results,<br />
Implications; by the Honourable John C. Major and Roland Priddle - March 2008, see Appendix 1<br />
Page 10
THE TERASEN UTILITIES<br />
<strong>2009</strong> <strong>ROE</strong> AND CAPITAL STRUCTURE APPLICATION<br />
judgment to the results of alternative methods of achieving the FRS required by<br />
Canadian jurisprudence in <strong>ROE</strong> awards.<br />
A wide and unprecedented gap has developed between Canadian gas utility <strong>ROE</strong>s<br />
and those of USA utilities and of North American low risk industrials. This is factual<br />
ground for concluding that the FRS, essentially the opportunity cost of capital<br />
needed to ensure financial integrity and capital attraction, is no longer being<br />
achieved by the generic <strong>ROE</strong> approach.” [emphasis added]<br />
The paper concludes by saying:<br />
“Finally, in an era of North American economic and business integration, the<br />
question must be asked “Can Canadian gas utilities successfully compete for capital<br />
if their regulators continue to award lower returns on generally thinner equity shares<br />
than those enjoyed by the American industry?”<br />
“Absent such a reconsideration and consequent adjustment, in an environment of<br />
continuing very low interest rates and bond yields, the present generic <strong>ROE</strong> formula<br />
alone may not be protecting the public interest in the provision by incumbent utilities<br />
of a robust, flexible natural gas delivery structure financially strong to support future<br />
sustainability of our energy economy.”<br />
Many industry observers erroneously attribute the introduction of an AAM to the NEB. The NEB<br />
adopted its formula to adjust the return on equity of the major pipelines it regulates shortly after<br />
the BCUC introduced an AAM in 1994. Nonetheless, there is a widely held belief that provincial<br />
regulators take notice of and are mindful of the findings of the NEB, and that the NEB’s adoption<br />
of a formula based approach influenced the adoption of similar approaches in Alberta,<br />
Manitoba, Ontario, Quebec and Newfoundland.<br />
It is significant that former NEB Chair Priddle (who was the Presiding Member of the NEB panel<br />
in the RH-2-94 proceeding that adopted a formulaic approach to <strong>ROE</strong> determination), now no<br />
longer has confidence that the current AAM provides Canadian utilities with an opportunity to<br />
earn a fair return, or attract capital when in competition with American utilities of similar risk<br />
profile.<br />
The events that have occurred in financial markets since the Major/Priddle paper was published<br />
create a heightened sense of urgency as well as need for action by regulators.<br />
1.1 Despite Adjustments, Fair Return Still Not Being Achieved<br />
The <strong>Terasen</strong> <strong>Utilities</strong> do not believe they are earning a fair return and share Justice Major’s and<br />
former Chair Priddle’s lack of confidence in the formula’s ability to allow Canadian utilities an<br />
opportunity to earn a fair rate of return relative to their peers. Improvements have been made to<br />
the sliding scale mechanism in the BCUC <strong>ROE</strong> formula, but these have been insufficient to<br />
allow the formula to meet the Fair Return Standard for investors in BC utilities.<br />
With its 2006 Decision, by eliminating the asymmetry of the risk adjustment where long GCB<br />
yields were above and below 6%, the Commission addressed a flaw in the sliding scale<br />
Page 11
THE TERASEN UTILITIES<br />
<strong>2009</strong> <strong>ROE</strong> AND CAPITAL STRUCTURE APPLICATION<br />
mechanism that had been introduced in 1999. Nonetheless, the point of departure for the recalibration<br />
of the current adjustment mechanism, which now adjusts for 75% of the change in<br />
forecast long-term GCB yields, was set based on an equity risk premium of 390 basis points<br />
over the forecast yield. This, when combined with the deemed capital structure of TGI,<br />
produces an allowed <strong>ROE</strong> that results in investors in TGI earning the lowest effective return in<br />
Canada.<br />
The evidence demonstrates that, despite some recalibration by the Commission, the current<br />
<strong>ROE</strong> formula under which BC utilities operate, combined with the current capital structure, does<br />
not allow equity invested in TGI’s utility assets to obtain a fair return.<br />
1.2 BC Policy: A Commitment to Attracting <strong>Capital</strong> (at Odds with Allowed <strong>ROE</strong>)<br />
The disadvantaged position of utilities in BC is even less favourable when considered in light of<br />
the Provincial Government commitment to capital attraction. The 2002 Policy document<br />
“Energy for our Future: A Plan for BC”, the Minister for Energy and Mines stated:<br />
“Rising energy demands and aging facilities call for major financial investment in plant<br />
upgrades and new energy production and delivery facilities. This, in turn, requires better<br />
access to energy resources and the timely, cost-effective development of new supplies.<br />
Unless domestic energy sources are developed, British Columbians could find themselves<br />
increasingly dependent on imports and vulnerable to price swings. The government, faced<br />
with competing fiscal priorities, is looking to the private sector for much-needed energy<br />
development.”<br />
These capital attraction objectives are even more relevant in <strong>2009</strong> when the Provincial<br />
Government is incurring deficits to stimulate the economy in the face of the current economic<br />
crisis. The Government is looking to the private sector to provide much needed investment in<br />
the provincial economy both directly, and through public private partnerships.<br />
The February <strong>2009</strong> budget discusses the government’s focus on the private sector in driving the<br />
economy and providing the source of capital investment in the province for infrastructure:<br />
“In 2002, government committed to increase the role of the private sector in the delivery<br />
of public infrastructure with the intention of minimizing costs and risks to taxpayers. By<br />
2007, public-private partnerships (P3) became the base case for capital investment<br />
decisions over $20 million.<br />
The government places a high priority on encouraging a thriving private sector economy<br />
that creates high-paying jobs while maintaining high environmental standards. A focus<br />
on results based regulation has created an environment that supports sustainable<br />
resource management.”<br />
The message is clear – the Government is increasingly looking to the private sector to drive the<br />
economy through capital investment. Inadequate returns for investor-owned utilities are<br />
contrary to the Government’s objectives.<br />
Page 12
THE TERASEN UTILITIES<br />
<strong>2009</strong> <strong>ROE</strong> AND CAPITAL STRUCTURE APPLICATION<br />
1.3 Lack of Fair Return Hinders Competition for <strong>Capital</strong> in Canada<br />
Such investment is increasingly unlikely to take place if the current allowed rates of return on<br />
equity are not changed. Under the Commission’s current AAM, TGI has amongst the lowest<br />
allowed returns on equity of any regulated gas or electric utility in Canada at 8.47% (which was<br />
set based on a forecast long-term GCB yield of 4.35%) and the lowest effective total return on<br />
equity. At 35.01% TGI also has the lowest level of common equity in its capital structure of the<br />
major Canadian investor-owned gas and electric distribution utilities.<br />
This higher leverage (more debt, less equity) makes TGI even less attractive to equity investors.<br />
Because higher leverage increases financial risk, it can impact the company’s credit ratings,<br />
degrade financial ratios and debt covenant tests and impact its ability to attract capital on<br />
reasonable terms and in sufficient quantities under all market conditions.<br />
Sub-standard utility investment returns do not create the investment climate the Provincial<br />
Government wants to foster given the infrastructure challenges we are facing in BC.<br />
TGI’s disadvantage can perhaps best be illustrated by the following table. The table reflects the<br />
effective returns on equity of the utilities listed for 2008/09. TGI’s allowed return was set using a<br />
forecast long GCB yield of 4.35%. The first two columns show the disadvantage that TGI suffers<br />
against comparable Canadian utilities in allowed equity thickness and in allowed returns on<br />
equity. The third column shows how these two disadvantages compound to create an<br />
approximate fifty basis point disadvantage on average for return on investment in TGI rate base<br />
compared to other major gas and electric utilities in Canada.<br />
Current Equity Effective Advantage to<br />
Allowed <strong>ROE</strong> Component Return <strong>Terasen</strong> (bps) Year Set<br />
Newfoundland Power 8.95% 44.55% 3.99% 102.2 <strong>2009</strong><br />
Maritime Electric 9.75% 40.00% 3.90% 93.5 <strong>2009</strong><br />
TGVI 9.17% 40.00% 3.67% 70.3 <strong>2009</strong><br />
<strong>FortisBC</strong> 8.87% 40.00% 3.55% 58.3 <strong>2009</strong><br />
Gaz Metro 8.94% 38.50% 3.44% 47.7 <strong>2009</strong><br />
TCPL 8.57% 40.00% 3.43% 46.3 <strong>2009</strong><br />
Atco Gas * 8.75% 38.00% 3.33% 36.0 2008*<br />
FortisAlberta* 8.75% 37.00% 3.24% 27.2 2008*<br />
Westcoast Energy Inc (Spectra) 8.57% 36.00% 3.09% 12.0 <strong>2009</strong><br />
Union Gas ** 8.54% 36.00% 3.07% 10.9 2007<br />
Enbridge Gas ** 8.39% 36.00% 3.02% 5.5 2007<br />
TGI 8.47% 35.01% 2.97% N/A <strong>2009</strong><br />
* The current <strong>ROE</strong> for the Alberta utilities is based on the 2008 formula setting pending a determination in the<br />
generic AUC cost of capital proceeding now underway.<br />
** The Enbridge and Union rates are set for five years based on the formula reset for 2007<br />
While TGI has the lowest effective return of all the major gas utilities, it must be noted that all of<br />
the major utilities, Gaz Metro, Atco Gas 4<br />
, Union Gas, Enbridge Gas, TCPL and Spectra<br />
(Westcoast Energy Inc.) have their allowed <strong>ROE</strong>s set by an automatic adjustment mechanism<br />
4 Alberta utilities whose <strong>ROE</strong> and capital structure are set by the AUC pursuant to its generic formula are continuing<br />
to use the 2008 cost of capital on an interim basis while the AUC conducts its current review of the generic<br />
formula.<br />
Page 13
THE TERASEN UTILITIES<br />
<strong>2009</strong> <strong>ROE</strong> AND CAPITAL STRUCTURE APPLICATION<br />
substantially similar to the BCUC formula. The <strong>Terasen</strong> <strong>Utilities</strong> understand that all of the gas<br />
distribution utilities are seeking to change the formula allowed returns in their respective<br />
jurisdictions to the extent permissible (Union and Enbridge are currently under PBR<br />
arrangements which may restrict them from pursuing changes to the formula but the OEB is<br />
currently considering whether its formula should be adjusted in light of current market<br />
conditions).<br />
In addition, as discussed in the Background Section above, the AUC, the NEB and the OEB are<br />
all in the process of considering cost of capital issues.<br />
1.4 Lack of Fair Return Hinders Competition for <strong>Capital</strong> Globally<br />
The Commission should further consider that TGI competes for capital not just with utilities and<br />
other companies in Canada, but also with participants in capital markets outside of Canada.<br />
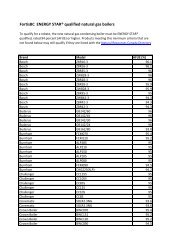
While TGI has the lowest effective return on equity in Canada, the returns on equity in Canada<br />
for the last 10 years have been substantially lower on average than they have been in the U.S<br />
(see figure below).<br />
14.00<br />
13.00<br />
12.00<br />
11.00<br />
10.00<br />
9.00<br />
8.00<br />
1990<br />
1991<br />
1992<br />
1993<br />
Allowed Returns on Equity For<br />
Canadian and U.S. <strong>Utilities</strong><br />
1994<br />
1995<br />
1996<br />
1997<br />
1998<br />
1999<br />
2000<br />
2001<br />
2002<br />
2003<br />
2004<br />
Canadian <strong>Utilities</strong> U.S. <strong>Utilities</strong><br />
This is of significant concern as U.S. investments are more accessible to Canadian individuals<br />
and institutions as a result of changes in foreign content investment rules, and as utility<br />
investment analysts provide more coverage of U.S. utility investment opportunities.<br />
Circumstances have changed since the <strong>ROE</strong> automatic adjustment mechanism was first<br />
introduced, and since the Commission held its last hearing on cost of capital in 2005 the returns<br />
on equity produced by the AAM have tracked abnormally low GCB yields. The changed<br />
circumstances require a different response if British Columbia wishes to be seen as an<br />
attractive place in which to invest capital.<br />
The NEB holds a view consistent with the position TGI is taking. At page 66 and 67 of the TQM<br />
Decision, the NEB found that:<br />
2005<br />
2006<br />
2007<br />
2008<br />
Page 14
THE TERASEN UTILITIES<br />
<strong>2009</strong> <strong>ROE</strong> AND CAPITAL STRUCTURE APPLICATION<br />
“In the Board’s view, global financial markets have evolved significantly since 1994.<br />
Canada has witnessed increased flows of capital and implemented tax policy changes<br />
that facilitate these flows. As a result, the Board is of the view that Canadian firms are<br />
increasingly competing for capital on a global basis. The Board notes that Canada has<br />
been diversifying its business partners such that there is currently proportionally less<br />
Canadian foreign direct investment in the United States than there was in the 1990’s.<br />
Nonetheless, the evidence is also clear that the United States is the single most<br />
important recipient of Canadian investments.<br />
A fair return on capital should, among other things, be comparable to the return available<br />
from the application of the invested capital to other enterprises of like risk and permit<br />
incremental capital to be attracted to the regulated company on reasonable terms and<br />
conditions. TQM needs to compete for capital in the global market place. The Board has<br />
to ensure that TQM is allowed a return that enables TQM to do so. Comparisons to<br />
returns in other countries would be useful, but challenging, in terms of differences in<br />
business risks and business environment. As a result, the Board is of the view that<br />
pipeline companies operating in the U.S. have the potential to act as a useful proxy for<br />
the investment opportunities available in the global market place.”<br />
The NEB also found that the regulatory environment in the US and Canada was similar and was<br />
not persuaded that US utilities were exposed to greater risk of cost disallowance and where that<br />
has happened in the past it related to unique events, and “are not likely to weigh significantly in<br />
investors' perceptions today, and would thus have little or no impact on cost of capital.”<br />
The NEB summarized its findings on the comparability and relevance of US utility return data<br />
when considering allowed returns in Canada vs. the US as follows:<br />
“In light of the Board's views expressed above on the integration of U.S. and Canadian<br />
financial markets, the problems with comparisons to either Canadian negotiated or<br />
litigated returns, and the Board's view that risk differences between Canada and the U.S.<br />
can be understood and accounted for, the Board is of the view that U.S. comparisons<br />
are very informative for determining a fair return for TQM for 2007 and 2008.”<br />
These findings are no less applicable to TGI and the other investor-owned BC <strong>Utilities</strong>. The<br />
above considerations, which are not reflected in the current levels of allowed returns in British<br />
Columbia, highlight why the Fair Return Standard is no longer being met in BC. Without a fair<br />
return, BC utilities are at a disadvantage when competing for capital.<br />
2.0 The Formula is Broken<br />
A growing body of evidence makes it clear that the formulaic approach to <strong>ROE</strong> used by<br />
regulatory commissions across Canada is broken and the allowed <strong>ROE</strong>s in Canada governed<br />
by a formula are too low. Numerous studies and articles have been published which point to the<br />
problems with the construction of, and the returns produced by, the automatic adjustment<br />
mechanisms.<br />
Page 15
THE TERASEN UTILITIES<br />
<strong>2009</strong> <strong>ROE</strong> AND CAPITAL STRUCTURE APPLICATION<br />
Since the introduction of the automatic adjustment mechanism in BC in 1994, the NEB and most<br />
provincial utility regulators have adopted similar mechanisms, which primarily rely on an<br />
adjustment factor by which 75% of the movement in forecast long GCB yields is used to<br />
annually adjust allowed returns on equity.<br />
The shortcomings of the currently employed formulae include the facts that:<br />
• They rely on a single variable, and adjust for 75% of the year over year change of the<br />
forecast 30 year GCB yield, which the evidence indicates materially overstates the<br />
relationship between the cost of equity and the long-term GCB yield;<br />
• They ignore factors directly relevant to equity return requirements in the markets, such<br />
as returns available to comparable risk companies, changes in dividend yields, and<br />
changes in corporate bond yields;<br />
• They do not consider changes in equity markets which have occurred over time; and<br />
• By focusing solely on the change in long-term GCB yields, they are incapable of<br />
expressly taking into account returns available to enterprises or investments of<br />
comparable risk.<br />
2.1 Recent NEB Decision Reinforces that the Formula Approach is Flawed<br />
In its TQM Decision, the NEB in effect acknowledged that the generic <strong>ROE</strong> formula it has<br />
applied since 1995 no longer produces fair returns for TQM. It can be inferred from the NEB’s<br />
subsequent actions to canvas its regulated entities and interested parties regarding the need to<br />
review the RH-2-94 Formula that the Board has concerns that the formula does not produce<br />
reasonable results for any of the pipelines it regulates.<br />
The NEB formula works in essentially the same way as the BCUC formula and effectively<br />
produces a similar level of generic <strong>ROE</strong> awards. If the major federal regulator, which was one<br />
of the original adopters of the formula, has concerns its formula is no longer working, then it is<br />
time that the BCUC revisit and change its approach to the determination of <strong>ROE</strong>s for utilities in<br />
British Columbia.<br />
2.2 Numerous External Experts Have Identified <strong>ROE</strong> Formula’s Shortcomings<br />
In December 2006, then BMO <strong>Capital</strong> Markets Equity Analyst Karen Taylor and Michael<br />
McGowan identified that there were significant shortcomings in the formula. In their research<br />
article entitled “2007 <strong>ROE</strong>s Decline to Unprecedented Levels”, they pointed out that there were<br />
problems with the level of returns being generated by the automatic adjustment mechanisms. 5<br />
They concluded:<br />
5<br />
BMO <strong>Capital</strong> Markets - 2007 <strong>ROE</strong>s Decline to Unprecedented Levels; by Karen Taylor and Michael McGowan -<br />
December 7, 2006, see Appendix 2<br />
Page 16
THE TERASEN UTILITIES<br />
<strong>2009</strong> <strong>ROE</strong> AND CAPITAL STRUCTURE APPLICATION<br />
“We believe on a collective basis, that the allowed returns as established by the formulas<br />
highlighted above [referring to the NEB, EUB, BCUC and OEB formulas] are confiscatory<br />
and likely violate the Fair Return Standard.”<br />
In 2007, Concentric Energy Advisors (“Concentric”) was commissioned by the Ontario Energy<br />
Board to compare the returns allowed Ontario utilities to those allowed by American regulators. 6<br />
The Concentric paper noted that the average allowed <strong>ROE</strong>s awarded to comparable risk US<br />
gas utilities is 160 to 200 basis points higher than those awarded by the formula to Union Gas<br />
and Enbridge. Concentric went on to conclude that “on the whole, there are no evident<br />
fundamental differences in the business and operating risks facing Ontario utilities as<br />
compared to those facing U.S. companies or other provinces’ utilities that would explain<br />
the difference in <strong>ROE</strong>s.” [emphasis added]<br />
In February 2008, National Energy Research Associates, Inc. (NERA) of Boston published<br />
7<br />
“Allowed Return on Equity in Canada and the United States” , a study commissioned by the<br />
Canadian Gas Association. The purpose of the paper was to examine the root causes of the<br />
disparity between Canadian and US <strong>ROE</strong>s (which was identified in the Concentric study) and<br />
assess whether Canadian utilities face sufficiently less risk than their US counterparts. The<br />
NERA study also examined whether the difference in allowed returns for ratemaking is merely a<br />
symptom of a structurally inflexible formula rather than an indicator of underlying risk<br />
differences.<br />
The study’s conclusions were unequivocal and damning with respect to formula allowed <strong>ROE</strong>s:<br />
“The Canadian <strong>ROE</strong>s produced by the generic Canadian <strong>ROE</strong> formula are biased<br />
downward. The formula has, since its inception, ridden on autopilot the declining<br />
Canadian long-bond interest rates (the cost of a kind of debt) with no independent check<br />
on the cost of equity. The generic Canadian formula might not always be biased, and<br />
indeed in an era of stable interest rates and equity markets it may have held a true<br />
course for many years. But it has been overtaxed by the relatively unprecedented<br />
decline in interest rates since the late 1990s. The uncorrected, un-calibrated formula—<br />
not risk differences or inherent Canadian regulatory differences—has driven the<br />
divergence between observed Canadian and US <strong>ROE</strong>s.”<br />
In April of 2008, the Canadian Gas Association published “Natural Gas Utility Return<br />
8<br />
Determination in Canada: Time For a New approach”. This paper drew from the research of<br />
the prior studies and reached a number of important conclusions:<br />
• The systemic bias evident in Canadian formula-based utility return determination and the<br />
significant gap that has emerged between Canadian <strong>ROE</strong> and US <strong>ROE</strong> levels warrants<br />
a Canadian proceeding to redetermine the cost of equity to gas utilities and to establish<br />
an improved approach in the future. The following processes and principles would help<br />
6<br />
A Comparative Analysis of Return on Equity of Natural Gas <strong>Utilities</strong>, Prepared for: The Ontario Energy Board; by<br />
Concentric Energy Advisors - June 14, 2007, see Appendix 3<br />
7<br />
Return on Equity in Canada and the United States – An Economic, Financial and Institutional Analysis; by National<br />
Economic Research Associates Inc. (“NERA”) - February 2008, see Appendix 4<br />
8<br />
Natural Gas Utility Return Determination in Canada: Time for a New Approach; by the Canadian Gas Association<br />
(“CGA”) – April 2008, see Appendix 5<br />
Page 17
THE TERASEN UTILITIES<br />
<strong>2009</strong> <strong>ROE</strong> AND CAPITAL STRUCTURE APPLICATION<br />
ensure a sound and enduring approach. There is a need to rebase Canadian <strong>ROE</strong>s<br />
based on a comprehensive review of the cost of capital using all accepted approaches<br />
including comparison with a broad comparator group extending across all reasonably<br />
comparable industrial groups and jurisdictions including the US.<br />
• There is a need to refresh the formula. In order to meet the requirements of<br />
transparency and stability the formula would need to be established on a reasonably<br />
stable and readily observable base with an adjustment factor that accounts as fully as<br />
possible for the changing relationship between the cost of equity and the cost of debt.<br />
• The formula should be allowed to stand for no more than five years (and probably not<br />
less) after which there would need to be another comprehensive cost of capital review<br />
which brings in other methodologies and comparators.<br />
Most recently in January <strong>2009</strong>, Equity Analyst Robert Kwan for RBC <strong>Capital</strong> Markets published<br />
his article entitled, “The Formula is Broken but will Regulators Fix It?” 9<br />
Mr. Kwan commented:<br />
9 RBC <strong>Capital</strong> Markets – Allowed <strong>ROE</strong>s: The Formula is Broken, but will Regulators Fix It? – January <strong>2009</strong>, see<br />
Appendix 6<br />
“With higher equity risk premiums and higher long bond yields for Energy<br />
Infrastructure companies that are trading at levels close to the allowed <strong>ROE</strong>s, it<br />
appears that the formula is broken. Forgetting the magnitude of change, it appears<br />
that the formula is producing a result that is directionally incorrect (i.e., <strong>ROE</strong>s<br />
declining yet corporate bond yields and equity risk premiums are rising).”<br />
Mr. Kwan recommended from a risk/reward perspective “We would focus on companies with the<br />
least exposure to the formula.”<br />
2.3 BC Government’s Actions Indicate it Recognizes the Current <strong>ROE</strong> is Inadequate<br />
The actions of the Provincial Government only further reinforce the conclusion that the current<br />
<strong>ROE</strong> does not meet the Fair Return Standard.<br />
In February <strong>2009</strong>, the Province amended Heritage Special Direction No. HC2 by Order in<br />
Council No. 074, which directed the Commission to increase, effective April 1, <strong>2009</strong>, the allowed<br />
return for BC Hydro by 163 basis points over the return it would otherwise receive pursuant to<br />
the formula benchmark return (previously BC Hydro had received the same return as the most<br />
comparable investor-owned public utility in BC). By virtue of Special Direction No. 9, BCTC,<br />
another crown corporation owned by the Province, also has the 163 basis point increase in <strong>ROE</strong><br />
extended to it. It is evident that the shareholder of BC Hydro and BCTC is not satisfied with the<br />
returns allowed by the formula.<br />
Unlike the shareholder of BC Hydro and BCTC, the <strong>Terasen</strong> <strong>Utilities</strong> have no power to issue a<br />
special direction to the Commission to provide the Company with fair returns, but the legislative<br />
framework of the <strong>Utilities</strong> Commission Act requires that the Commission must do so.<br />
Page 18
THE TERASEN UTILITIES<br />
<strong>2009</strong> <strong>ROE</strong> AND CAPITAL STRUCTURE APPLICATION<br />
3.0 Unprecedented Turbulence in <strong>Capital</strong> Markets Further Reinforces the Need to<br />
Change the Formula<br />
The evidence presented above strongly suggests that the formula is broken, and in and of itself<br />
constitutes a reason for the Commission to act. Recent turbulence in the capital markets has<br />
further reinforced the concern that utilities operating under the BCUC <strong>ROE</strong> formula are receiving<br />
inadequate returns and, absent a change, will be hampered in their efforts to compete for<br />
capital.<br />
3.1 <strong>Capital</strong> Markets Push Yields on 30 Year GCBs to Abnormally Low Levels<br />
The events taking place in the capital markets since 2005 have had the effect of driving down<br />
the yield on the long-term GCB yield that is the foundation of the current BCUC adopted AAM.<br />
This has significantly reduced the allowed <strong>ROE</strong>, even as the cost of debt and equity has<br />
increased.<br />
In his evidence filed under Tab 2, Mr Donald Carmichael discusses developments in the capital<br />
markets since 2005, and the impacts of those developments on the cost of debt and equity<br />
capital. His conclusion is that the costs of debt and equity have increased – in stark contrast to<br />
the decline in allowed <strong>ROE</strong>s under the automatic adjustment mechanisms.<br />
This decline in GCB yields, and consequent decline in allowed <strong>ROE</strong>, has been driven in part by<br />
a “flight to safety”, or “flight to quality”, in capital markets, which has pushed down yields on<br />
government securities, including yields on long-term GCBs.<br />
Lenders liquidated portfolios of corporate bonds and improved the credit quality of their<br />
portfolios by adding to their existing federal government bond portfolios. Investors abandoned,<br />
or reduced exposure to, the equity market in favour of risk-free securities. This flight to quality,<br />
was characterized by an increasing demand for relatively scarce medium and longer term<br />
government bonds, including GCBs, which drove the price of such securities continually higher<br />
and the yields progressively lower.<br />
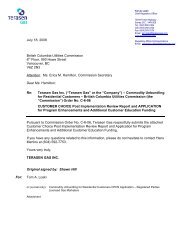
As a consequence, the current <strong>ROE</strong> formula, which is tied to long-term GCB yields, produces<br />
inappropriately low <strong>ROE</strong> for utilities, due to the impact of the flight to quality on GCB yields. The<br />
chart below shows how the benchmark <strong>ROE</strong> allowed by the BCUC formula has declined in<br />
response to declining yields on GCBs. The chart below also shows that the <strong>ROE</strong> allowed by the<br />
formula is to some extent “luck of the draw”, being highly dependent on the month used for the<br />
forecast of the GCB yield.<br />
Page 19
THE TERASEN UTILITIES<br />
<strong>2009</strong> <strong>ROE</strong> AND CAPITAL STRUCTURE APPLICATION<br />
9.00%<br />
8.80%<br />
8.60%<br />
8.40%<br />
8.20%<br />
8.00%<br />
7.80%<br />
7.60%<br />
7.40%<br />
Nov-05<br />
Jan-06<br />
Mar-06<br />
May-06<br />
Jul-06<br />
BCUC Formula <strong>ROE</strong> Based on Monthly GCB Forecasts<br />
Sep-06<br />
Nov-06<br />
Jan-07<br />
Mar-07<br />
May-07<br />
Jul-07<br />
Sep-07<br />
Nov-07<br />
3.2 Even as <strong>ROE</strong> Falls, Cost of Debt and Equity Rises<br />
Mr. Carmichael’s evidence shows that even as the allowed <strong>ROE</strong> has declined during the past<br />
two years, the cost of debt and equity capital has increased for corporations.<br />
The markets have rapidly re-priced risk and are demanding substantially higher returns for debt<br />
and equity investments compared to those required earlier in the last economic cycle. Lenders<br />
were the first to react to deteriorating conditions caused by the increased levels of consumer<br />
and corporate debt, the decline of housing values across the United States, the slowing of<br />
growth in the global economy and the collapse of many commodity prices.<br />
A severe liquidity crisis and credit crunch developed in North American corporate debt and<br />
credit markets as lenders demanded higher risk premiums from corporate issuers of<br />
reasonable credit quality, such as utilities, reflecting the re-pricing of business and financial risks<br />
and have cut off the funding of lower quality credits. Additionally the collapse of the proposed<br />
takeover of Bell Canada Enterprises by the Ontario Teachers Pension Fund and private equity<br />
investors highlighted the issues of much more limited liquidity in the financial system and higher<br />
cost of capital for investors.<br />
Jan-08<br />
Mar-08<br />
May-08<br />
Jul-08<br />
Sep-08<br />
Nov-08<br />
Jan-09<br />
Mar-09<br />
Page 20
THE TERASEN UTILITIES<br />
<strong>2009</strong> <strong>ROE</strong> AND CAPITAL STRUCTURE APPLICATION<br />
On the common equity side, North American and international stock markets sold off<br />
dramatically as investors began discounting the economic outlook and demanding higher rates<br />
of return for the risks associated with the lack of liquidity in the financial system and more<br />
uncertain economic times. The chart below illustrates the relative value of the S&P/TSX<br />
Composite Index and the S&P 500 Index for the five years commencing March 2004.<br />
Price/earnings multiples declined and dividend yields increased signalling a relatively significant<br />
increase in the cost of common equity. In Canada, exacerbated by the rapid collapse in<br />
commodity prices, the S&P/TSX Composite Index declined from a high of 15,073 in June 2008<br />
to a low of 7,566 in March <strong>2009</strong>, a reduction of 50%. Ms. McShane discusses the widening<br />
equity risk premium in Canada in Section II of her testimony.<br />
Although the costs of common equity and debt capital have increased for utilities operating in<br />
Canada; the <strong>ROE</strong> formulas used in virtually all regulatory jurisdictions in Canada are producing<br />
lower <strong>ROE</strong>s. The impacts of the economic forces leading to higher costs of capital are simply<br />
not captured in the automatic adjustment mechanisms. <strong>Capital</strong> market analysts, including<br />
Robert Kwan of RBC <strong>Capital</strong> Markets in his January <strong>2009</strong> report 10<br />
, have become more<br />
and more aware of the deficiencies of the automatic <strong>ROE</strong> adjustment mechanisms and<br />
are currently advising investors to avoid utility companies exposed to this form of<br />
regulation unless the potential for much lower <strong>ROE</strong>s is addressed by regulators.<br />
3.3 Recent Widening of Credit Spreads Exacerbates Formula’s Flaws<br />
Because the regulatory models used to determine the allowed equity returns for utilities have<br />
not been updated to reflect changes in the capital markets, the result is that the inadequacy of<br />
the returns for utilities in BC and elsewhere in Canada has been further exacerbated.<br />
As previously shown, the decline in long-term GCB yields has driven down the <strong>ROE</strong> for utilities<br />
that operate under the BCUC formula. Yet there is no evidence that required equity returns in<br />
10 RBC <strong>Capital</strong> Markets – Allowed <strong>ROE</strong>s: The Formula is Broken, but will Regulators Fix It? – January <strong>2009</strong>, see<br />
Appendix 6<br />
Page 21
THE TERASEN UTILITIES<br />
<strong>2009</strong> <strong>ROE</strong> AND CAPITAL STRUCTURE APPLICATION<br />
Canada or equity returns available on similar risk investments have been decreasing at the<br />
same time. The divergence between equity returns generally and the <strong>ROE</strong> formula results<br />
further highlights the flawed nature of the current formula. The returns allowed on<br />
investments in the equity of Canadian utilities should relate to the returns that investors<br />
can earn or expect on other equity investments of similar risk. The operation of the<br />
automatic adjustment mechanism, which is producing lower than adequate <strong>ROE</strong>s, fails to<br />
meet that requirement..<br />
Although the inadequacy of the formula generated <strong>ROE</strong> pre-dates the current financial crisis,<br />
recent developments in the capital markets further reinforce the fact that formula-based allowed<br />
<strong>ROE</strong>s are too low. In latter part of 2008 and early <strong>2009</strong>, spreads over long-term GCB yields<br />
more than doubled across the utility industry even as long-term GCB yields declined. From<br />
January 2000 to June 2008, the indicative monthly new issue spread 11<br />
for <strong>Terasen</strong> Gas 30 year<br />
bonds averaged 141 basis points (bps) with a standard deviation of +/- 20 bps. Between June<br />
2008 and March <strong>2009</strong>, the average indicative spread was approximately 290 bps, peaking in<br />
December at 410. The increase in both volatility and quantum of credit spreads is evidence that<br />
risk premiums required by investors have been increasing. Yet the formula produces an <strong>ROE</strong><br />
that erroneously suggests that the premium required by equity investors over corporate bonds<br />
has shrunk to a minimal level. While corporate credit spreads have come off their peak values,<br />
they continue to be volatile and no one can predict with confidence whether they will continue to<br />
narrow, or how long the turmoil in the markets will continue.<br />
The current <strong>ROE</strong> formula leaves the <strong>Terasen</strong> <strong>Utilities</strong> unable to satisfy equity investors’<br />
requirement for increased risk premiums. The <strong>2009</strong> BCUC formula allowed <strong>ROE</strong> of 8.47% was<br />
set in November of 2008. By January <strong>2009</strong>, TGI’s indicative new issue spread was<br />
approximately 385 basis points over 30 year GCB yields, indicating that a new TGI bond issue<br />
would be priced to yield 7.57%. At the same time, if the annual allowed <strong>ROE</strong> were set in<br />
January <strong>2009</strong> based on the underlying Consensus Forecast of benchmark 30 year GCB yields,<br />
it would have resulted in an allowed <strong>ROE</strong> of 7.89%. This would have resulted in an equity risk<br />
premium of only 32 bps over the corporate debt rate.<br />
In December 2008, the notional equity risk premium over indicative corporate new issue yield<br />
was only 18 bps. Historically, spreads between corporate bond yields and the GCB yield have<br />
been approximately 130-140 bps. The dramatic widening of the spread between the yield on<br />
GCBs and investment grade corporate bonds, as illustrated in the chart below, is a function of<br />
several factors, including a flight to quality and the relative scarcity of long-term GCBs as noted<br />
above, as well as a broader re-pricing of risk by investors in corporate securities.<br />
While the reduction in long-term GCB yields to abnormally low levels may well reverse over<br />
time, the reality is still that corporate bond issues are more costly – and this is relevant to the<br />
determination of cost of equity. Because equity investors require a premium over corporate<br />
11 Each week, <strong>Terasen</strong> obtains estimates of the prospective new issue spreads for <strong>Terasen</strong> bonds from four of the<br />
primary investment dealers <strong>Terasen</strong> utilizes for debt issuance, i.e. CIBC, RBC, Scotia and TD. The banks provide<br />
estimates of the new issue credit spreads based on their analysis of the secondary trading spreads for existing<br />
issues and discussions with institutional investors who buy such debt to estimate the current credit spreads on new<br />
debt issuance by the major utilities including <strong>Terasen</strong>. <strong>Terasen</strong> relies on this information to time the launch of its<br />
credit issuance in the market as well as to set the offered yield.<br />
Page 22
THE TERASEN UTILITIES<br />
<strong>2009</strong> <strong>ROE</strong> AND CAPITAL STRUCTURE APPLICATION<br />
debt investors, it would be reasonable to expect that the cost of equity will be positively<br />
correlated with the cost of corporate debt.<br />
10.00%<br />
9.50%<br />
9.00%<br />
8.50%<br />
8.00%<br />
7.50%<br />
7.00%<br />
6.50%<br />
6.00%<br />
5.50%<br />
5.00%<br />
4.50%<br />
4.00%<br />
3.50%<br />
3.00%<br />
Jan-00<br />
Jul-00<br />
Jan-01<br />
Jul-01<br />
<strong>ROE</strong> vs 30yr TGI Indicative New Issue Yield and 30yr GCB Yield<br />
Jan-02<br />
Annually Allowed <strong>ROE</strong> Monthly Formula Derived <strong>ROE</strong> 30yr TGI Indicative Yield 30yr GCB Yield<br />
Jul-02<br />
Jan-03<br />
Jul-03<br />
Jan-04<br />
Jul-04<br />
Given widening spreads, equity investors will be less likely to invest capital in utilities whose<br />
<strong>ROE</strong>s are tied to the current formula driven by the 30 year GCB yield as a benchmark. Since the<br />
summer of 2007, spreads between corporate and GCB yields have widened dramatically. That<br />
investors require greater absolute returns on corporate bonds underscores the fact that equity<br />
return expectations would be higher still; investors in the equity of utilities will require an<br />
appropriate “equity risk premium” over the return required by investors in the debt of those<br />
utilities; but <strong>ROE</strong>s formulaically tied to GCB yields fail to account for this fact, and instead the<br />
formula produces lower <strong>ROE</strong> results at the same time as required return on utility debt is<br />
increasing.<br />
In summary, the last three years have seen extraordinary turbulence in the capital markets.<br />
This turbulence has led to a flight to quality which has created an abnormal demand for longterm<br />
GCBs that were already in short supply. This flight to safety or flight to quality has driven<br />
down the yield on the GCBs, and consequently driven down the formulaic <strong>ROE</strong> that uses the<br />
long-term GCB as a benchmark. Yet even as the allowed <strong>ROE</strong> has declined, the cost of capital<br />
for utilities has risen dramatically, as investors have demanded higher premiums for risk.<br />
Unless TGI can offer a return to equity to investors similar to returns available to comparable<br />
risk investments, it will be disadvantaged in competing for capital in the future, even if the capital<br />
markets return to historical norms.<br />
Jan-05<br />
Jul-05<br />
Jan-06<br />
Jul-06<br />
Jan-07<br />
Jul-07<br />
Jan-08<br />
Jul-08<br />
Jan-09<br />
Jul-09<br />
Page 23
THE TERASEN UTILITIES<br />
<strong>2009</strong> <strong>ROE</strong> AND CAPITAL STRUCTURE APPLICATION<br />
4.0 TGI’s Business Risk is Changing<br />
Business risk is comprised of many elements. For a gas distribution utility, significant<br />
components of business risk are the competitiveness of the natural gas commodity as<br />
compared to alternate energy forms and the utility's related ability to attract customers and<br />
retain its customer base, which affect throughput levels and system load factors. Consumer<br />
sentiment, environmental considerations and government policy also play important roles in the<br />
determination of the gas distribution utility’s risk profile and competitive position. These risk<br />
factors determine whether the utility will be able to recover its investments in rate base over time<br />
and affect its ability to achieve its allowed return.<br />
When the automatic adjustment mechanism for <strong>ROE</strong> was introduced, the competitive<br />
environment in which TGI operated was very different than it is today. Changes in government<br />
policy and public perception of the desirability of natural gas (given it is a fossil fuel) have<br />
changed TGI’s business landscape since 1994 when the Commission first adopted an AAM,<br />
and since 2005 when the Commission last examined the <strong>ROE</strong> adjustment mechanism. A<br />
detailed discussion of TGI’s changing business risks is included with this <strong>Application</strong> in Tab 1.<br />
The evidence establishes that TGI’s business risks have increased, but the current formulaic<br />
approach to setting the allowed <strong>ROE</strong> incorrectly suggests that business risk is decreasing.<br />
Contrary to the results of the formulaic approach, both a higher <strong>ROE</strong> and a capital structure<br />
containing more common equity is appropriate for TGI rate making purposes.<br />
The following key drivers of competitiveness and business risk have changed for TGI in recent<br />
years:<br />
• Provincial climate change and energy policies has increased the risk inherent to TGI’s<br />
core natural gas business;<br />
• Natural gas’ competitive position relative to electricity has been weakened;<br />
• TGI is capturing a smaller percentage of new construction;<br />
• Electricity is increasingly the choice of high-density housing;<br />
• Alternative energy sources further weaken TGI’s competitive position; and<br />
• Fuel switching has also diminished demand for natural gas.<br />
Under the current <strong>ROE</strong> formula mechanism, TGI is discouraged from investing capital in the<br />
utility facilities beyond that which is required to meet the Company’s basic obligation to<br />
serve existing customers in its service areas, much less to respond to the changing<br />
consumer demands and government policy directives. However, unless TGI participates in<br />
meeting business and government policy challenges it will see its traditional business and share<br />
of the energy delivery market erode and with it, its ability to recover its existing investments over<br />
time.<br />
If TGI is to be part of the solution, as it proposes to be, to the government’s climate change<br />
challenge, then it requires higher returns to deal with the increased business risks related to<br />
Page 24
THE TERASEN UTILITIES<br />
<strong>2009</strong> <strong>ROE</strong> AND CAPITAL STRUCTURE APPLICATION<br />
introducing new technologies and service offerings. As it stands today, the government’s<br />
introduction of carbon taxes, escalating to $30/tonne (approximately $1.50/GJ) by 2012 (with no<br />
certainty the tax will not increase beforehand or thereafter) threatens the immediate and longer<br />
term competitiveness of TGI’s base business and its ability to recover its capital investments<br />
over the longer term. It is unclear just how significant that threat may prove to be in the future<br />
should the “price of carbon” escalate further over time but the current challenges demand a<br />
higher allowed return on equity than that being produced by the formula today.<br />
Notwithstanding the fact that the <strong>ROE</strong> formula is broken and demands a response from the<br />
Commission to establish a more appropriate, higher level of <strong>ROE</strong> for TGI, TGI’s increased<br />
business risk warrants (i) a higher return than it did in 2006 when the Commission last<br />
considered the benchmark <strong>ROE</strong> and (ii) the equity component of TGI’s capital structure be<br />
increased.<br />
Summary<br />
In summary, the evidence establishes that:<br />
• The Fair Return Standard is not being met;<br />
• The <strong>ROE</strong> formula that produces that return is broken;<br />
• The recent turbulence in credit markets have further highlighted the formula’s flaws; and<br />
• TGI’s business risks are increasing.<br />
Because of these realities, the BCUC must update both the TGI <strong>ROE</strong> (that is the Benchmark<br />
<strong>ROE</strong>) and TGI’s capital structure.<br />
Page 25
THE TERASEN UTILITIES<br />
<strong>2009</strong> <strong>ROE</strong> AND CAPITAL STRUCTURE APPLICATION<br />
Part 2: Proposed Solution<br />
The <strong>Terasen</strong> <strong>Utilities</strong> request that the Commission takes steps to award a return on equity for<br />
TGI that provides a fair return on TGI’s investment in its utility assets and serves as a<br />
Benchmark <strong>ROE</strong> to be used in establishing the allowed return of TGVI and TGW. TGI also<br />
requests that the Commission establish a capital structure for TGI that enables the Company to<br />
compete effectively for capital with other Canadian utilities and with utilities in the United States.<br />
Specifically, TGI requests that the Commission allow the Company a common equity<br />
component of 40% in its capital structure, and the <strong>Terasen</strong> <strong>Utilities</strong> request that the Commission<br />
set a return on equity of 11% for TGI, which 11% return will also be the Benchmark <strong>ROE</strong> to be<br />
used in establishing the allowed return on equity of TGVI and TGW.<br />
It is requested that the 11% allowed return on equity for TGI and as the Benchmark <strong>ROE</strong> take<br />
effect as of July 1, <strong>2009</strong>. It is requested that the common equity component of 40% in the<br />
capital structure of TGI take effect as of January 1, 2010.<br />
This section of the <strong>Application</strong> outlines how these requests were arrived at. Specifically, it is<br />
respectfully submitted that:<br />
5.0 An Appropriate Benchmark <strong>ROE</strong> Is One Based On A Number of Relevant Tests<br />
(Rather Than A Single One);<br />
6.0 The Current Adjustment Mechanism Should Be Abandoned; and,<br />
7.0 TGI’s <strong>Capital</strong> <strong>Structure</strong> Should Be Changed To Allow For A Higher Equity<br />
Component.<br />
By taking these actions the Commission will allow TGI and the other <strong>Terasen</strong> <strong>Utilities</strong> to<br />
compete for capital for the foreseeable future.<br />
5.0 An Appropriate Benchmark <strong>ROE</strong> Is One Based On A Number Of Relevant Tests<br />
(Rather Than A Single One)<br />
Prior to the 1994 introduction of the generic <strong>ROE</strong> adjustment mechanism for setting allowed<br />
returns to equity investors, the Commission and other regulatory tribunals used a number of<br />
tests to determine the appropriate return on equity for an investor in a utility. The discounted<br />
cash flow test, the comparable earnings test and the equity risk premium test were all used, but<br />
in its 1994, 1999 and 2006 Decisions the Commission adopted, for all intents and purposes, the<br />
equity risk premium test as the only test used. Moreover, the Commission implicitly concluded<br />
that the return required by investors in the equity of utilities always moves in the same direction<br />
as changes in the forecast yields on GCBs. The Company believes reliance on a single<br />
approach is inadequate, and has resulted in unfair low returns on equity for the investors in TGI<br />
and other investor owned utilities whose <strong>ROE</strong> is set pursuant to the BCUC adopted formula.<br />
Page 26
THE TERASEN UTILITIES<br />
<strong>2009</strong> <strong>ROE</strong> AND CAPITAL STRUCTURE APPLICATION<br />
In its 2006 Decision, the BCUC stated that these other tests, in particular the comparable<br />
earnings test, had merit but that inadequate data was available to give it any weight. The<br />
Commission stated at page 56 of the Decision:<br />
“the Commission Panel is not convinced that the CE methodology has outlived its<br />
usefulness, and believes that it may yet play a role in future <strong>ROE</strong> hearings.”<br />
Notwithstanding the view expressed in that quotation, in past proceedings the Commission has<br />
given no weight to the evidence presented on Comparable Earnings, in part because of<br />
concerns regarding the limited number of companies in the sample data. In this proceeding Ms.<br />
McShane has identified a larger number of Canadian proxy companies to address this issue,<br />
and has also examined US non-regulated companies of similar risk. In addition, Dr. Vander<br />
Weide provides evidence of the allowed returns of a large sample of comparable US utilities as<br />
one of a number of additional tests he applies in determining the appropriate level of return for<br />
TGI.<br />
5.1 Independent Experts Agree on A Fair Return for TGI<br />
In her testimony at Tab 3, Section I, Ms. McShane reaches the following conclusions:<br />
1. The automatic adjustment formula is clearly not producing returns that meet the fair<br />
return standard. The fair return and automatic adjustment mechanism for setting the<br />
allowed return on equity both need to be recalibrated.<br />
2. The sensitivity of the cost of equity to government bond yields is materially lower than<br />
the existing automatic adjustment mechanism implies. In addition, the cost of equity<br />
moves in the same direction as the utility cost of debt; this relationship has not been<br />
reflected in the automatic adjustment mechanism. As a result, the allowed <strong>ROE</strong>s have<br />
decreased over time to a much greater extent than is justified and recently have<br />
moved in the wrong direction.<br />
3. The allowed return for TGI must meet all three criteria of the Fair Return Standard,<br />
including the comparable return requirement. The fair return extends to both the<br />
capital structure and return on equity, that is, the overall return allowed must satisfy the<br />
fair return standard.<br />
4. The capital structure and the return on equity are inextricably linked; the fair return on<br />
equity cannot be established without reference to the level of financial risk inherent in<br />
the capital structure adopted for regulatory purposes.<br />
5. The TGI proposed capital structure in the application is reasonable in light of the<br />
increase in the Company’s business risks, the importance of maintaining the existing<br />
credit ratings, the trend toward stronger capital structures among other Canadian<br />
utilities, and the stronger capital structures and credit metrics of TGI’s U.S. peers, with<br />
whom TGI competes for capital and whose total returns form a basis for satisfying the<br />
comparable returns standard.<br />
6. The fair return on equity for TGI is estimated at 11.0%. The fair return for TGI reflects<br />
the following:<br />
Page 27
THE TERASEN UTILITIES<br />
<strong>2009</strong> <strong>ROE</strong> AND CAPITAL STRUCTURE APPLICATION<br />
o The return on equity is based on the results of three tests: equity risk premium,<br />
discounted cash flow and comparable earnings;<br />
o The equity risk premium test results are based on three separate approaches.<br />
The equity risk premium tests indicate the following costs of equity before<br />
adjustment for financing flexibility:<br />
Risk Premium Test Cost of Equity<br />
Risk-Adjusted Equity Market 8.75%-9.0%<br />
DCF-Based 10.0%<br />
Historic Utility 10.75%<br />
o The discounted cash flow test, applied to a sample of benchmark low risk U.S.<br />
utilities, supports a cost of equity of 10.5-11.0%;<br />
o The allowance for financing flexibility should be, at a minimum, 0.5%. The<br />
addition of a 0.5% financing flexibility adjustment results in a cost of equity based<br />
on the market-based risk premium and DCF tests of approximately 10.25-<br />
11.25%;<br />
o The comparable earnings test shows that, based on the achievable earnings<br />
returns of low risk competitive unregulated Canadian firms, a fair return<br />
applicable to a benchmark utility would be approximately 11.5-11.75%. and the<br />
test also shows that, based on U.S. companies the return would be<br />
approximately 14% (underscoring the reasonableness of the comparable<br />
earnings result based on Canadian unregulated companies); and<br />
o With primary weight given to the capital market-based tests, equity risk premium<br />
and discounted cash flow, the fair return on equity for TGI is 11.0%.<br />
Dr. Vander Weide’s evidence at Tab 4 considers the Fair Return Standard, assesses the validity<br />
of the current automatic adjustment mechanism for setting <strong>ROE</strong>s in BC using six separate tests,<br />
and estimates the cost of equity for companies whose risk is similar to TGI using equity risk<br />
premium tests and discounted cash flow approaches. Dr. Vander Weide also examines the<br />
capital structures of utilities with comparable risks to those of TGI.<br />
The key findings in Dr. Vander Weide’s testimony are that:<br />
1. Experienced equity risk premiums on investments in Canadian utilities stocks provide<br />
evidence that investors require an equity return that is at least 5.5 percent above the<br />
yield on GCBs, whereas the AAM <strong>ROE</strong> Formula implies an equity premium of only<br />
4.3 percent.<br />
2. Recent average allowed returns for U.S. utilities are in the range of 10.3% to 10.4%,<br />
whereas the AAM <strong>ROE</strong> Formula implies an <strong>ROE</strong> equal to 7.9 percent (based on<br />
capital market data at March <strong>2009</strong>).<br />
Page 28
THE TERASEN UTILITIES<br />
<strong>2009</strong> <strong>ROE</strong> AND CAPITAL STRUCTURE APPLICATION<br />
3. The forward-looking required equity risk premium on utility stocks is less sensitive to<br />
changes in government bond yields than is implied by the AAM <strong>ROE</strong> Formula.<br />
4. The allowed equity risk premium for U.S. utilities is less sensitive to changes in<br />
government bond yields than is implied by the AAM <strong>ROE</strong> Formula.<br />
5. The risk of investing in Canadian utilities stocks is higher relative to the Canadian<br />
market as a whole than is implied by the AAM <strong>ROE</strong> Formula.<br />
6. The cost of equity for investments in comparable risk utilities is 11.0 percent based on<br />
ex post risk premium, ex ante risk premium, and discounted cash flow studies.<br />
7. Allowed equity ratios for U.S. utilities are in the range 48 percent to 49 percent,<br />
whereas the allowed equity ratio for TGI is 35.01 percent.<br />
8. The business risk of TGI is somewhat less than the average business risk of U.S.<br />
utilities, whereas the average financial risk of TGI is significantly greater than the<br />
average financial risk of U.S. utilities.<br />
Dr. Vander Weide concludes that the allowed return on rate base, or overall rate of return, for<br />
TGI is significantly less than the overall return that investors can earn on other investments of<br />
similar risk. He has determined that the overall allowed return (return on rate base) of<br />
comparable US utilities is approximately 8.0%. In his opinion, an allowed <strong>ROE</strong> of 11.0% on<br />
40% equity would produce an overall return on capital (return on rate base) of approximating<br />
8.0% and that would be reasonable.<br />
Based on the evidence presented by Ms. McShane and Dr. Vander Weide, a fair <strong>ROE</strong> for TGI,<br />
which will establish the Benchmark <strong>ROE</strong>, is 11%, with a deemed equity thickness of 40%.<br />
5.2 The Company Specific Risk Premia for Remaining <strong>Terasen</strong> <strong>Utilities</strong> Should<br />
Continue to be Applied to the new Benchmark <strong>ROE</strong><br />
At present, the allowed <strong>ROE</strong> of TGVI and TGW are set with reference to the annual<br />
determination for the benchmark utility, which has been TGI. The allowed <strong>ROE</strong>s for TGVI and<br />
TGW, and the other investor-owned utilities regulated by the BCUC, have been determined by<br />
adding to the benchmark <strong>ROE</strong> a company specific risk premium. With the establishment of a<br />
new Benchmark <strong>ROE</strong> pursuant to this application, the company specific premia for TGVI and<br />
TGW, as previously determined by the Commission, should continue to be used in the<br />
determination of their allowed <strong>ROE</strong>s.<br />
Section 4 and Tab 1 of this <strong>Application</strong> present evidence respecting the increase in TGI’s<br />
business risks over time and how new risk factors have manifested themselves since 2006.<br />
These new business risk factors also apply to TGVI and TGW, and accordingly continuation of<br />
the use of a Benchmark <strong>ROE</strong> that is used in establishing the allowed <strong>ROE</strong>s for all the <strong>Terasen</strong><br />
<strong>Utilities</strong> is appropriate.<br />
Page 29
THE TERASEN UTILITIES<br />
<strong>2009</strong> <strong>ROE</strong> AND CAPITAL STRUCTURE APPLICATION<br />
5.2.1 Continuation of the TGW Company Specific Risk Premium - 50 Basis Points<br />
In its October 2008 Revenue Requirements application, TGW applied to have its company<br />
specific risk premium increased from 60 basis points to 75 basis points. In the proceeding<br />
relating to that application the Commission considered the business risks of TGW and evidence<br />
relating to the appropriate TGW risk premium over the benchmark <strong>ROE</strong>. The Commission’s<br />
Decision of April 7, <strong>2009</strong> on that application, at page 57, said:<br />
“Accordingly, the Commission Panel orders that the <strong>ROE</strong> for TGW be established at 50<br />
bps over the benchmark low risk utility.”<br />
TGW is not seeking reconsideration of that Decision. The relative risk of TGW as compared to<br />
the benchmark utility (TGI) since the proceeding that led to the April <strong>2009</strong> Decision has not<br />
changed. TGW requests simply that the new Benchmark <strong>ROE</strong>, which will replace, at least for<br />
the <strong>Terasen</strong> <strong>Utilities</strong>, the generic benchmark <strong>ROE</strong> determined under the BCUC’s AAM, be<br />
substituted in the establishment of TGW’s allowed <strong>ROE</strong>.<br />
5.2.2 Continuation of the TGVI Company Specific Risk Premium – 70 Basis Points<br />
Similar to TGW, no request is being made in this <strong>Application</strong> to adjust the company specific<br />
premium for TGVI. Evidence was presented in the 2005 TGI and TGVI cost of capital<br />
proceeding that demonstrated that TGVI’s business risks were greater than TGI, the benchmark<br />
utility. Those risk differentiators continue to exist today. At page 57 of the 2006 Decision the<br />
Commission said:<br />
“The Commission Panel determines that a suitable premium to TGVI over the<br />
benchmark low-risk utility <strong>ROE</strong> is 70 basis points.”<br />
TGVI is not seeking any change from the Commission’s determination of 70 basis points as the<br />
appropriate company specific risk premium for TGVI. The relative risk of TGVI as compared to<br />
the benchmark utility (TGI) since the proceeding that led to the 2006 Decision has not changed.<br />
TGVI requests simply that the new Benchmark <strong>ROE</strong>, which will replace, at least for the <strong>Terasen</strong><br />
<strong>Utilities</strong>, the generic benchmark <strong>ROE</strong> determined under the BCUC’s AAM, be substituted in the<br />
establishment of TGVI’s allowed <strong>ROE</strong>.<br />
5.3 Changes to the Benchmark <strong>ROE</strong> Should Be Effective July 1, <strong>2009</strong>, and Interim<br />
Rates for TGI and TGW Should be Established as of that Date<br />
The evidence in this <strong>Application</strong> demonstrates that the return on equity currently allowed for the<br />
<strong>Terasen</strong> <strong>Utilities</strong> is inadequate and less than a fair return. The current benchmark <strong>ROE</strong> of<br />
8.47%, which is used in establishing the allowed <strong>ROE</strong>s of the three <strong>Terasen</strong> <strong>Utilities</strong>, does not<br />
allow them an opportunity to earn a fair return as required under the Act, and as a result the<br />
current rates which reflect the inadequate allowed <strong>ROE</strong>s are not fair, just or reasonable.<br />
A hearing to consider the matters addressed in this <strong>Application</strong> will not be completed at an early<br />
date, and the Commission decision on this <strong>Application</strong> will follow later. The <strong>Terasen</strong> <strong>Utilities</strong><br />
request interim relief effective July 1, <strong>2009</strong>. If interim relief is not granted, and if the relief<br />
requested in this <strong>Application</strong> is not effective until after the Commission decision on this<br />
Page 30
THE TERASEN UTILITIES<br />
<strong>2009</strong> <strong>ROE</strong> AND CAPITAL STRUCTURE APPLICATION<br />
<strong>Application</strong>, the <strong>Terasen</strong> <strong>Utilities</strong> would be denied the opportunity to earn a fair return on their<br />
investment in utility assets until subsequent to the date of that decision. Such a result would be<br />
unfair and unreasonable.<br />
TGI and TGW request, pursuant to section 89 of the Act, that their existing rates be made<br />
interim effective July 1, <strong>2009</strong> and be adjusted when permanent rates can be established<br />
incorporating the Commission' decision on this <strong>Application</strong>.<br />
TGVI requests, pursuant to section 89 of the Act, that effective July 1, <strong>2009</strong> its cost of service<br />
under the Special Direction be made interim, and subsequently be adjusted to reflect the<br />
increase in its allowed <strong>ROE</strong> resulting from the Commission’s determinations in this proceeding.<br />
Granting the interim relief requested will preserve the ability of intervenors to take issue with the<br />
evidence presented in this <strong>Application</strong> while providing the <strong>Terasen</strong> <strong>Utilities</strong> with the opportunity<br />
to earn a fair return. The <strong>Terasen</strong> <strong>Utilities</strong> respectfully submit that the requested interim relief<br />
should be granted.<br />
6.0 The Adjustment Mechanism Cannot Survive In Its Present Form<br />
In the past, TGI has supported the use of an automatic adjustment mechanism to adjust annual<br />
allowed <strong>ROE</strong>s between cost of capital reviews. TGI recognizes that cost of capital reviews<br />
entail considerable time, effort and money for testimony preparation, information requests, a<br />
hearing and submissions. An automatic adjustment mechanism can be an administratively<br />
efficient means of avoiding annual <strong>ROE</strong> reviews for utilities under the jurisdiction of the BCUC,<br />
while providing regular changes in the allowed return on equity. In addition to the reduction in<br />
regulatory burden, automatic adjustment mechanisms result in increased predictability of the<br />
allowed returns and limit the potential arbitrariness of the outcome.<br />
There are disadvantages to automatic adjustment mechanisms, however. Formulaic <strong>ROE</strong>s limit<br />
the regulator’s flexibility to address issues such as financing flexibility requirements. If the initial<br />
<strong>ROE</strong> is set either too high or too low, the operation of an automatic adjustment formula could<br />
simply compound the problem instigated by the initial <strong>ROE</strong>. Further, even if the initial <strong>ROE</strong> is<br />
set appropriately, if the formula does not track changes in the cost of equity (which the current<br />
BCUC formula does not), the AAM will not produce allowed <strong>ROE</strong>s that meet the Fair Return<br />
Standard. Finally, the formula may produce significant changes in the <strong>ROE</strong> from year to year,<br />
which in turn may result in unduly volatile customer rates. These disadvantages should be<br />
taken into account in determining if an AAM can continue to be used, and if an AAM is used, the<br />
design of the AAM and its <strong>ROE</strong> formula.<br />
In designing an automatic adjustment formula, there should be a balance among the following<br />
criteria. An automatic adjustment formula should:<br />
1. be relatively simple to understand and apply;<br />
2. be based on changes in one or more reasonably available and verifiable variables;<br />
3. exclude changes in variables due to abnormal market events;<br />
4. incorporate variables which vary in a quantifiable way with the utility cost of equity; and<br />
Page 31
THE TERASEN UTILITIES<br />
<strong>2009</strong> <strong>ROE</strong> AND CAPITAL STRUCTURE APPLICATION<br />
5. incorporate variables which are not vulnerable to changes caused by company-specific<br />
circumstances which may not impact on the cost of equity for the utilities to which the<br />
formula applies.<br />
The current BCUC AAM does not meet all these criteria, and does not result in a fair return for<br />
the utilities subject to it. The <strong>Terasen</strong> <strong>Utilities</strong> request that use of the current BCUC AAM be<br />
eliminated.<br />
6.1 Expert Testimony Suggests That 75% Elasticity Is Too High<br />
The evidence of Ms. McShane, Dr. Vander Weide and Mr. Carmichael all underscore the<br />
problems resulting from the current formula’s reliance on 75% of the movement in long-term<br />
GCB yields as the indicator of the appropriate return on equity. With the benefit of hindsight,<br />
including fifteen years of observations, it appears that the relationship is approximately 50% of<br />
the movement of long-term bond yields over a “normal” range. Recent experience shows that<br />
long-term GCB yields are driven by many factors including scarcity of supply, government fiscal<br />
and monetary policy, sovereign debt reduction and market turmoil such that GCB yields can<br />
move in a direction opposite of that of the cost of corporate debt and equity. In principle, an<br />
automatic adjustment formula should incorporate one or more variables that either track the<br />
utility cost of equity directly, or track it more directly than the yield on long-term GCBs. For<br />
example, the yields on an index of Canadian long-term public utility bonds would likely provide<br />
additional valuable information as an indicator of the trend in the utility cost of equity.<br />
Unfortunately no such publicly available index exists.<br />
6.2 Alternative Approaches<br />
As noted above, the NEB, AUC and OEB are currently undertaking or considering generic<br />
reviews of their <strong>ROE</strong> formula mechanisms. These proceedings are likely to attract considerably<br />
wider input than that of this proceeding before the BCUC and an acceptable alternative to the<br />
traditional <strong>ROE</strong> formulas may emerge from those proceedings.<br />
In the absence of an objective, independently created alternative index or variable, a pragmatic<br />
solution is to abandon the automatic adjustment mechanism and establish a return on equity as<br />
the allowed <strong>ROE</strong> for TGI and as the Benchmark <strong>ROE</strong>. The <strong>ROE</strong> so established would continue<br />
until one or more parties conclude it is no longer meeting the Fair Return Standard and seek to<br />
have the Commission review the Benchmark <strong>ROE</strong>. This approach has merit given that the cost<br />
of equity does not appear to swing dramatically from year to year in any event, and certainly<br />
does not change with the same degree of volatility as the “so-called” risk free GCB yield, from<br />
month to month let alone on an inter-year basis.<br />
Another alternative is to continue to rely on a formula based on the Consensus Forecast of GCB<br />
yields, as such a formula is simple to administer and is based on objective, easily accessible<br />
data. It also reflects at least a portion of the current financial market conditions at the time of<br />
annual reset. However, as discussed elsewhere in this <strong>Application</strong>, the GCB is influenced by<br />
factors (such as government policy) that do not directly relate to requirements of equity<br />
investors, and the GCB does not appropriately reflect all the factors that impact the business<br />
and financial circumstances of utilities. Furthermore, any continued reliance on a GCB-based<br />
formula would require explicit recognition of the shortcomings of the current formula and explicit<br />
Page 32
THE TERASEN UTILITIES<br />
<strong>2009</strong> <strong>ROE</strong> AND CAPITAL STRUCTURE APPLICATION<br />
recognition of the inadequate <strong>ROE</strong>s that have resulted from the formula; a major re-calibration<br />
would be required. Moreover, it would be difficult to address abnormal market conditions that<br />
affect long-term government bond yields with this approach.<br />
As noted in 6.1 above, the sensitivity of the utility cost of equity to long-term Canada bond yields<br />
is materially less than the 75% elasticity factor that currently underpins the formula; in fact it<br />
appears to be less than 50%. It is critical to recognize that it would not be reasonable to change<br />
the elasticity factor in the current formula to 50% and not simultaneously reset the allowed <strong>ROE</strong><br />
at a level which recognizes that the allowed <strong>ROE</strong>s that have been established in the past have<br />
reflected the presumed 75% relationship. Since long-term GCB yields have been on a fairly<br />
consistent downward trend since the time the formula was introduced in British Columbia in<br />
1994, the application of the formula over time has overstated the corresponding decline in the<br />
utility cost of equity. Implementation of a 50% elasticity factor would only be appropriate if it<br />
were applied to a starting allowed <strong>ROE</strong> which is fair, including the recognition that the operation<br />
of the existing formula has resulted in <strong>ROE</strong>s which are too low.<br />
For the reasons discussed in this Section, TGI is not prepared to propose or commit to an<br />
automatic adjustment mechanism at this time. The Company will continue to work towards<br />
developing a proposal for an adjustment mechanism in the future, ideally in time to establish<br />
rates for 2011. By that time the volatility in the capital markets may have eased and additional<br />
information may be available which would assist in developing a workable proposal. Moreover,<br />
the Company is not in a position to commit to a formula until it understands the base <strong>ROE</strong> that<br />
the formula would start from.<br />
Absent a material re-calibration of the starting point to establish a fair return for a revised<br />
formula, even a perfect adjustment mechanism will fail to produce fair returns.<br />
7.0 The <strong>Capital</strong> <strong>Structure</strong> Should Be Changed To Allow For A Higher Equity<br />
Component.<br />
A public utility must always have sufficient financial flexibility to meet the capital requirements<br />
imposed by customer growth, technological change or emergent situations. <strong>Utilities</strong> are large<br />
consumers of both equity and debt capital. Their fundamentals are watched carefully and<br />
scrutinized thoroughly by the financial analyst community for equity investors and by the debt<br />
rating agencies. The latter are very sensitive to the proportion of common equity in a utility’s<br />
capital structure as it provides security for investors lending money to a utility, and to the cash<br />
generated by the allowed returns to ensure that the interest on the debt of the utility can be<br />
serviced.<br />
With the downward trend in allowed <strong>ROE</strong>s, and as utility allowed returns and utility bond yields<br />
have converged recently (as described in Section 3), the financial flexibility for Canadian utilities<br />
in general and BC and the <strong>Terasen</strong> <strong>Utilities</strong> in particular, has been reduced. In addition, the<br />
capital structure under which TGI currently operates (35.01% equity component) makes it less<br />
attractive to investors of both equity and debt capital.<br />
Page 33
THE TERASEN UTILITIES<br />
<strong>2009</strong> <strong>ROE</strong> AND CAPITAL STRUCTURE APPLICATION<br />
This is why TGI submits that the equity component of TGI’s capital structure should be<br />
increased from the current 35.01% to 40%. 12<br />
A capital structure with 40% common equity ratio in addition to an <strong>ROE</strong> of 11%, will adequately<br />
reflect the increasing business risks facing TGI, and appropriately address the requirements that<br />
meet the Fair Return Standard from a capital structure perspective, ensuring that financial<br />
integrity and flexibility is maintained, as well as allow TGI to attract capital on a comparable<br />
basis with its Canadian and US peers.<br />
Ms. McShane, Dr. Vander Weide and Mr. Carmichael have put forth evidence that supports<br />
TGI’s belief that the current common equity ratio is too low and a 40% equity component is<br />
reasonable and justified.<br />
Ms. McShane has addressed the appropriateness of the requested equity ratio with respect to<br />
its role in meeting the Fair Return Standard, the trend in TGI’s business risk, the need to<br />
maintain existing credit ratings, and the stronger capital structures and credit metrics for TGI’s<br />
Canadian and US utility peers, with whom TGI needs to achieve comparability in competing for<br />
capital.<br />
Dr. Vander Weide provides an analysis of US electric and gas utilities’ equity ratios and states<br />
that TGI carries significantly higher financial risk than its US peers, who have an average equity<br />
ratio of approximately 49%, well above what is being sought by TGI.<br />
Mr. Carmichael addresses the weak financial metrics of TGI compared to its peers, its<br />
dependence on other factors to achieve it’s A category credit rating and the risk of loss of that<br />
credit rating, the increasing competition for capital facing TGI, the need to maintain an A<br />
category credit rating, and the need for comparability to its utility peer group.<br />
7.1 Increase in Equity Component Critical to Preserving Financial Flexibility<br />
TGI interprets the financial integrity standard to mean a capital structure and return on equity<br />
that in tandem will allow the utility to maintain a minimum credit rating in the A category, which<br />
will allow TGI access to the capital markets on reasonable terms and pricing in all economic<br />
conditions. This credit rating is critical if the utility is to maintain financial flexibility.<br />
TGI has a significant requirement for capital, stemming from its obligation to ensure system<br />
deliverability, reliability and safety, support customer growth, and meet both the challenges and<br />
opportunities from emerging situations. TGI does not have the ability to defer financing its<br />
existing or new assets, therefore, its need to access capital occurs during both strong and weak<br />
economic conditions and when financial markets are robust and when they are challenging.<br />
12 The current deemed capital structure of TGI reflects the effect of amalgamation of <strong>Terasen</strong> Gas (Squamish) Inc.<br />
increasing it from 35% to 35.01%. The capital structure proposed by TGI reflects and increase of 3% equity<br />
preserving the effect of the weighting of the two predecessor company capital structures pursuant to the Special<br />
Direction<br />
Page 34
THE TERASEN UTILITIES<br />
<strong>2009</strong> <strong>ROE</strong> AND CAPITAL STRUCTURE APPLICATION<br />
7.2 Decrease in Credit Worthiness would have Significant Repercussions<br />
One of the key elements to maintaining this financial flexibility is for TGI to carry a minimum<br />
credit rating of A from its rating agencies. A ratings downgrade to BBB would have adverse<br />
consequences on TGI with respect to its cost of debt (both short-term and long-term debt),<br />
potentially to its access to long-term debt, and to its gas supply procurement and hedging<br />
activities.<br />
Moody’s in its May 2008 rating report on TGI, notes that its rating methodology model for North<br />
American LDC’s would indicate a Baa1 credit rating for TGI, however, the A3 rating, which is<br />
one rating notch above Baa1, is achieved when qualitative factors such as supportive business<br />
and regulatory environment are considered.<br />
“TGI’s financial metrics are generally weaker than those of its A3 rated global LDC<br />
peers such as Piedmont Natural Gas Company, Inc., Northwest Natural Gas Company,<br />
Connecticut Natural Gas Corporation, Public Service Co. of North Carolina, UGI <strong>Utilities</strong><br />
and sister company, TGVI. Moody’s recognizes that TGI’s relatively weaker financial<br />
metrics are largely a function of the relatively low deemed equity and allowed <strong>ROE</strong><br />
permitted by the BCUC. In general, Canadian deemed equity ratios and allowed <strong>ROE</strong>s<br />
are low relative to those of other jurisdictions and TGI’s are among the lowest in<br />
Canada. However, TGI’s A3 senior unsecured rating reflect Moody’s view that TGI’s<br />
relatively weaker financial metrics are offset to a significant degree by the<br />
supportiveness of the business and regulatory environments in which TGI. Moody’s<br />
rating methodology model for North American LDCs indicates a Baa1 rating for TGI<br />
which is one notch below the company’s A3, senior unsecured published rating assigned<br />
by Moody’s rating committee. TGI’s published rating exceeds the methodology-implied<br />
rating because Moody’s rating committee places greater emphasis on the<br />
supportiveness of TGI’s regulatory and business environments than the rating<br />
methodology model does. The methodology-implied rating falls within the one to two<br />
notch band that Moody’s rating methodologies aim to achieve.” 13<br />
In addition, Moody’s has signified that a further weakening of its financial ratios, arising from<br />
among other causes an <strong>ROE</strong> below 8%, would likely lead to a ratings downgrade.<br />
“Notwithstanding TGI’s relatively low risk business profile, its financial profile is<br />
considered weak at the A3, senior unsecured rating level. Accordingly, further sustained<br />
weakening of TGI’s financial metrics, for instance <strong>ROE</strong> below 8%, EBIT to Interest below<br />
2x, RCF to Debt below 5% and/or Debt to Book <strong>Capital</strong>ization (Excluding Goodwill)<br />
above 65%, would likely lead to a downgrade of TGI’s rating.” ibid<br />
Therefore, further weakening of the financial metrics of TGI, or a determination of Moody’s that<br />
the regulatory or business environment is no longer as supportive, could result in a credit rating<br />
that is below the A category. As noted by Mr. Carmichael, with the TQM Decision and the<br />
expectations that it creates more broadly for improvements to allowed returns and capital<br />
13 Excerpt from Moody’s Investor Services Global Credit Research Credit Opinion for <strong>Terasen</strong> Gas Inc., dated May<br />
27, 2008.<br />
Page 35
THE TERASEN UTILITIES<br />
<strong>2009</strong> <strong>ROE</strong> AND CAPITAL STRUCTURE APPLICATION<br />
structures for Canadian utilities, should TGI be left behind it is difficult to see how the credit<br />
rating agencies could continue to view the regulatory environment in BC as being supportive.<br />
In the context of cost of debt, the credit spread associated with a BBB credit rating is<br />
significantly higher than that associated with an A credit rating. The chart below shows the<br />
incremental credit spread, expressed in basis points, between the average indicative new issue<br />
spreads, on a weekly basis, of six Canadian utilities (Fortis BC, Union Gas, Westcoast Energy,<br />
Newfoundland Power, Nova Scotia Power and Epcor) with, at a minimum a split rating, or a<br />
majority of their ratings in the BBB category and four Canadian utilities (Enbridge Gas, Fortis<br />
Alberta, Gaz Metro, TGI) with all or a majority of its ratings in the A category.<br />
Basis Points<br />
70<br />
60<br />
50<br />
40<br />
30<br />
20<br />
10<br />
0<br />
Jan-04<br />
Apr-04<br />
Indicative 30yr Credit Spread<br />
between select BBB rated and A rated <strong>Utilities</strong><br />
(source: Scotia <strong>Capital</strong>)<br />
Jul-04<br />
Oct-04<br />
Jan-05<br />
Apr-05<br />
Jul-05<br />
Oct-05<br />
Jan-06<br />
Apr-06<br />
Jul-06<br />
Oct-06<br />
Jan-07<br />
Apr-07<br />
Jul-07<br />
Oct-07<br />
Jan-08<br />
Apr-08<br />
Jul-08<br />
Oct-08<br />
Jan-09<br />
Apr-09<br />
When accessing debt markets, firms that are BBB rated are more constrained in issuing for<br />
terms in excess of 10 years, and in certain situations could be shut out of the debt markets for a<br />
period of time. As noted in Ms. McShane’s evidence, in the Canadian debt capital markets, the<br />
issuance by BBB rated parties between January 2006 and March <strong>2009</strong> has accounted for<br />
approximately 6% of the dollar value of corporate debt issuance, and since mid-2007 to March<br />
<strong>2009</strong>, of the 189 reported issues, less than 10 were of BBB rated entities, none of which<br />
exceeded 10 years in term. This demonstrates that while there is a market for BBB rated<br />
issuers in Canada, the demand is more robust in strong capital markets, but in more difficult<br />
times, as seen commencing in 2007, a BBB rated issuer will face market constraints, underlying<br />
the need for a frequent issuer, such as TGI, to maintain its A rating.<br />
Page 36
THE TERASEN UTILITIES<br />
<strong>2009</strong> <strong>ROE</strong> AND CAPITAL STRUCTURE APPLICATION<br />
From an operational perspective, an A rating plays a key role in TGI’s gas supply and hedging<br />
strategies. In a typical year, TGI will purchase in excess of $1 billion of natural gas depending<br />
on market prices. In addition, TGI utilizes commodity derivatives to hedge the price volatility of<br />
natural gas faced by consumers. Derivatives are placed on underlying gas supply for amounts<br />
in excess of $300 million in a typical year. Currently, counterparties to TGI do not require<br />
collateral in the form of letters of credit, nor has TGI experienced any restrictions on the amount<br />
of unsecured credit counterparties have extended to TGI. Such restrictions would limit TGI’s<br />
ability to pursue its gas supply and hedging strategies. This lack of restrictions to date is due in<br />
part to the counterparties’ view of TGI as a strong investment grade entity, based on the<br />
minimum A credit rating.<br />
A credit rating downgrade below the A rating category could lead to TGI being required to post<br />
letters of credit with its counterparties, which would incur a direct cost in the form of letter of<br />
credit fees. In addition, and of more concern, would be the potential restriction this could place<br />
on TGI’s hedging activities. The commodity hedges can extend out three years, and given the<br />
volatility in gas prices, the mark to market exposure on a derivative can vary significantly. TGI,<br />
when it enters into financial hedges, restricts its activities to A rated or higher counterparties. As<br />
a BBB rated entity, TGI could face similar restrictions and be constrained in pursuing its hedging<br />
activity, to the potential detriment of its customers.<br />
The need for an A rating is even more important when considering the increasing competition<br />
for capital. TGI, from an asset perspective, builds energy infrastructure and it competes for<br />
capital with other infrastructure to which investors can direct their investment funds. The<br />
American Society of Civil Engineers, in their <strong>2009</strong> Infrastructure Scorecard 14<br />
has estimated that<br />
over a five year period, the United States will require approximately $2.2 trillion dollars for<br />
infrastructure. In Canada, market commentators have estimated that $120 billion will be spent<br />
on public infrastructure (excluding privately owned infrastructure, such as energy) in the next 10<br />
years. The sheer magnitude of potential spending will give investors, from a global and North<br />
American perspective, significant options to invest in, and will increase the competition for debt<br />
and equity capital for TGI.<br />
7.3 Increase in Common Equity Ratio Improves Credit Metrics<br />
The primary determinant to TGI’s credit rating is its credit metrics, which are currently viewed by<br />
the rating agencies to be at the bottom end or below the range acceptable for an A rating. This<br />
is driven by a common equity ratio and allowed <strong>ROE</strong>, both of which are at the lower end of the<br />
range of comparable utilities. By increasing TGI’s common equity ratio the Commission will<br />
improve TGI’s credit metrics and increase the likelihood that it will maintain its A level rating.<br />
If no action is taken it is quite possible that TGI’s credit metrics will weaken further and<br />
jeopardize its credit rating. The interest coverage ratio is the ratio of earnings before interest<br />
and taxes (EBIT) to interest expense. TGI will face pressure on its interest coverage ratio if<br />
EBIT were to be reduced over time due to lower allowed <strong>ROE</strong>, as would result from the current<br />
<strong>ROE</strong> formula (the allowed <strong>ROE</strong>, if set in April would result in a sub 8% return), given the loss of<br />
incentive earnings from the cessation of performance based regulation and decreasing tax<br />
rates. As well, the denominator, interest expense, may increase over time due to higher debt<br />
14 Taken from the <strong>2009</strong> Report Card for America’s Infrastructure from www.asce.org<br />
Page 37
THE TERASEN UTILITIES<br />
<strong>2009</strong> <strong>ROE</strong> AND CAPITAL STRUCTURE APPLICATION<br />
costs as investors have repriced corporate and utility risk. TGI’s debt to capital ratio, with a 35%<br />
equity ratio, is also at the bottom end of the range acceptable for A rated utilities<br />
By increasing the common equity ratio to 40%, in tandem with an increase of the <strong>ROE</strong> to 11%,<br />
the pressure on credit metrics will be materially lessened and will positively contribute to TGI<br />
maintaining its A rating. An A rating will be a key factor in ensuring continued access to the<br />
debt capital markets through all economic cycles, will allow access to longer terms to maturity,<br />
and will ensure the credit spreads on debt will be reasonable. TGI does not believe it<br />
appropriate to continue a capital structure and <strong>ROE</strong> at levels that may result in TGI experiencing<br />
a downgrade in its rating to a level below that acceptable and required to address the financial<br />
integrity standard.<br />
An additional implication of weakening financial ratios is that TGI could be constrained at a<br />
future point, absent an increase in <strong>ROE</strong> and equity ratio, in issuing long-term debt under its<br />
Trust Indenture. In order to issue new long-term debt, TGI is required to meet a debt incurrence<br />
interest coverage test. The test requires that consolidated available net earnings (CANE) must<br />
be at least two times interest on funded obligations (interest on debentures). Failure to meet<br />
this test would restrict the ability to issue long-term debt.<br />
Historically, TGI has not been constrained by the new issue test. CANE is arrived at by starting<br />
with net income, and adding back income taxes, as well as interest on debentures. Historically,<br />
the achieved level of <strong>ROE</strong>, tax rates and the existence of incentive earnings combined to result<br />
in a level of CANE sufficient to allow TGI to issue long-term debt as required.<br />
However, in the face of continuing low equity thickness, declining allowed <strong>ROE</strong>s, decreasing tax<br />
rates, and the loss of incentive earnings, TGI may be constrained in its future ability to issue<br />
debt. To demonstrate this potential constraint, TGI back-cast its debt issue capacity under its<br />
Trust Indenture on each January 1 between 2005 and <strong>2009</strong>, using preceding year audited<br />
financial results and then adjusting CANE for each period by removing incentive earnings,<br />
lowering the tax rate to the current 30%, and reducing net income to reflect the impact of an 8%<br />
allowed <strong>ROE</strong> for each year.<br />
The first of the following two graphs below shows the approximate debt issuance capacity (the<br />
horizontal lines) at a range of interest rates (that is, the amount of debt at each interest rate that<br />
could have been issued as at January 1 each year) under the actual CANE. The graph also<br />
shows what TGI actually issued for long-term debt each year (the shaded bars). The second<br />
graph demonstrates debt issuance capacity, under the scenario where CANE has been<br />
adjusted to remove incentive earnings, lower the tax rate, and to reflect an 8% allowed <strong>ROE</strong><br />
consistent with that indicated by today’s forecast Long GCB yields. Under the conditions as<br />
illustrated, TGI would have had a material reduction in its debt issuance capacity and would<br />
have been unable to issue the debt that it did in all years covered except 2006.<br />
Page 38
THE TERASEN UTILITIES<br />
<strong>2009</strong> <strong>ROE</strong> AND CAPITAL STRUCTURE APPLICATION<br />
Issuance Capacity<br />
Issuance Capacity<br />
450,000<br />
400,000<br />
350,000<br />
300,000<br />
250,000<br />
200,000<br />
150,000<br />
100,000<br />
50,000<br />
0<br />
450,000<br />
400,000<br />
350,000<br />
300,000<br />
250,000<br />
200,000<br />
150,000<br />
100,000<br />
50,000<br />
0<br />
Actual TGI Debt Issues<br />
Issuance Capacity at 5%<br />
Issuance Capacity at 6%<br />
Issuance Capacity at 7%<br />
Issuance Capacity at 8%<br />
Historical Debt Issuance Capacity<br />
Basic Consolidated Available Net Earnings (CANE)<br />
As at January 1 Year of Issue<br />
2005 2006 2007 2008 <strong>2009</strong><br />
Actual TGI Debt Issues<br />
Issuance Capacity at 5%<br />
Issuance Capacity at 6%<br />
Issuance Capacity at 7%<br />
Issuance Capacity at 8%<br />
Year of Issue<br />
Adjusted Debt Issuance Capacity<br />
Basic CANE adjusted for 8.0% <strong>ROE</strong>, 35% Equity, 30% Tax and No Incentive Earnings<br />
As at January 1 Year of Issue<br />
2005 2006 2007 2008 <strong>2009</strong><br />
Year of Issue<br />
Page 39
THE TERASEN UTILITIES<br />
<strong>2009</strong> <strong>ROE</strong> AND CAPITAL STRUCTURE APPLICATION<br />
An increase in the common equity ratio to 40%, in conjunction with an increase in the allowed<br />
<strong>ROE</strong>, would alleviate the potential constraints on debt issuance capacity TGI may face in the<br />
future.<br />
7.4 Current <strong>ROE</strong> and <strong>Capital</strong> <strong>Structure</strong> Mean TGI does not Compare Well to Industry<br />
Peers as an Investment Opportunity<br />
In a financial market that is becoming more integrated on a North American basis, and facing<br />
significantly more competition for capital from both energy utilities and infrastructure entities, a<br />
lack of direct comparability on allowed <strong>ROE</strong> and capital structure will negatively impact TGI’s<br />
ability to attract capital on reasonable terms. TGI should have an allowed <strong>ROE</strong> and capital<br />
structure comparable to its peers of comparable risk to allow it to compete effectively for capital<br />
in all market conditions – yet it does not presently have either.<br />
Investors will examine the relative business and financial risks of comparable investment<br />
opportunities in making investment choices. TGI has business risks which are at least<br />
comparable to, if not greater than, its major Canadian and US gas distribution peers given its<br />
challenging competitive position with low cost hydroelectric generation and negative<br />
government policy implications; and TGI has higher financial leverage in its capital structure.<br />
The Commission, in its 2006 Decision, accepted that an increase to TGI’s equity ratio at that<br />
time was supported by comparisons to the approved capital structures of comparable risk<br />
utilities. Accepting that TGI's business risk is comparable to, or in some cases higher than that<br />
of the major Canadian energy utilities, and similar to that of US gas and electric distribution<br />
utilities, the financial risk, as measured by its approved capital structure, should also be<br />
comparable. The analysis in Table 7.4, compares the approved equity ratios and other credit<br />
metrics of a sample of Canadian utilities with those of TGI.<br />
Table 7.4<br />
Comparison of Industry Metrics<br />
Fiscal Year 05 06 07 08 05 06 07 08 05 06 07 08 05 06 07 08<br />
x x x x % % % % % % % % % % % %<br />
Enbridge Gas Distribution Inc. 1<br />
2.29 1.80 2.24 2.27 62.0 63.3 59.6 55.0 9.57 8.74 8.39 8.39 35.0 35.0 36.0 36.0<br />
FortisAlberta Inc. 2<br />
2.55 2.15 1.98 2.03 60.1 62.5 59.4 61.5 9.50 8.93 8.51 8.75 40.0 37.0 37.0 37.0<br />
<strong>FortisBC</strong> Inc. 2.20 2.11 2.04 n/a 62.5 61.6 61.7 n/a 9.43 9.20 8.77 9.02 40.0 40.0 40.0 40.0<br />
Gaz Metro inc. 2.65 2.45 2.30 2.21 60.1 60.8 64.8 66.1 11.64 9.33 9.57 9.52 38.5 38.5 38.5 38.5<br />
Hydro One Inc. 3<br />
2.78 2.77 2.83 2.68 52.6 53.3 54.2 55.2 9.88 9.50 8.63 8.44 36.0 36.0 40.0 40.0<br />
Newfoundland Power 2<br />
2.33 2.26 2.16 2.00 54.7 55.0 55.1 56.1 9.24 9.24 8.60 8.95 45.0 45.0 45.0 45.0<br />
TransCanada Pipelines Limited 4<br />
2.32 2.60 2.75 3.31 61.9 62.7 59.6 58.8 9.46 8.88 8.46 8.75 36.0 36.0 40.0 40.0<br />
Union Gas Limited 2<br />
2.09 1.91 2.24 2.28 64.9 64.5 62.4 58.3 9.62 9.63 8.54 8.54 35.0 35.0 36.0 36.0<br />
Composite Avg 2.40 2.26 2.32 2.40 59.9 60.5 59.6 58.7 9.79 9.18 8.68 8.80 38.2 37.8 39.1 39.1<br />
<strong>Terasen</strong> Gas Inc. 2<br />
1.94 2.00 1.95 1.96 67.6 64.7 66.5 65.8 9.03 8.80 8.37 8.62 33.0 35.0 35.0 35.0<br />
Difference to Industry Avg (0.46) (0.26) (0.37) (0.44) 7.8 4.2 6.9 7.1 (0.76) (0.38) (0.31) (0.18) (5.2) (2.8) (4.1) (4.1)<br />
1<br />
'08 data is for the 12 mos. ended June 2008<br />
2<br />
'08 data is for the 12 mos. ended March 31, 2008<br />
3<br />
Allowed <strong>ROE</strong> data is split between Distribution and Transmission 43/57<br />
4<br />
'08 data is for the 12 mos. ended September 2008; Equity Thickness and Allowed <strong>ROE</strong> relate to Canadian Mainline<br />
Source: DBRS Reports<br />
EBIT Interest Coverage Debt to Total <strong>Capital</strong> Allowed <strong>ROE</strong> Equity Thickness<br />
Page 40
THE TERASEN UTILITIES<br />
<strong>2009</strong> <strong>ROE</strong> AND CAPITAL STRUCTURE APPLICATION<br />
As can be seen, TGI currently has amongst the lowest common equity ratio and weaker credit<br />
metrics than the sample Canadian utilities, and is lower than the group average. The contrast is<br />
even more glaring when comparing TGI to US gas and electric distributors. In Exhibit 3 of his<br />
Evidence, Dr. Vander Weide lists the allowed returns granted to 101 US electric utilities<br />
between 2006 and 2008, which averaged 10.4% over the entire period and 10.5% for 2008.<br />
Over the same period the awards for 84 natural gas utilities averaged 10.3% and 10.4%<br />
respectively. Exhibit 4 of Dr. Vander Weide’s testimony lists the deemed equity in the related<br />
utilities capital structures over the period which averaged 48.35% for the electric utilities and<br />
49.07% for natural gas utilities. This imbalance in the capital structure and credit metrics, over<br />
time, will adversely affect TGI in comparisons with other utilities with which TGI competes for<br />
capital.<br />
7.5 Increasing Common Equity Ratio is Essential to Put TGI on Even Footing with<br />
North American <strong>Utilities</strong><br />
An increase in the TGI equity ratio to 40%, along with an increase to 11% in the <strong>ROE</strong> allowed<br />
for TGI (and as the Benchmark <strong>ROE</strong>), is a required response to address this imbalance.<br />
TGI is not unique in seeking such changes – and many precedents have been set that suggest<br />
these requests are warranted. In many regulatory jurisdictions in Canada, utilities have been or<br />
are anticipated to be involved in proceedings dealing with allowed <strong>ROE</strong> and capital structure<br />
matters. In the TQM Decision, the NEB granted TQM an after tax weighted average cost of<br />
capital and the freedom to set the capital structure that it deemed appropriate and move away<br />
from the 30% deemed equity component previously approved. TQM had applied for 11% <strong>ROE</strong><br />
on 40% equity which was a significant increase from the previously deemed common equity<br />
component of TQM of 30%. The net effect of the TQM Decision was to materially increase the<br />
overall allowed return on capital from what had been allowed by the <strong>ROE</strong> formula and deemed<br />
equity level under the formula. In addition, Union Gas, Enbridge Gas Distribution, Hydro One<br />
and TransCanada have all had their deemed equity thickness increased since 2006.<br />
The TQM Decision, together with widespread commentary by analysts that the <strong>ROE</strong> formula is<br />
broken, has led to the anticipation that other decisions will follow, resulting in substantive<br />
changes to allowed <strong>ROE</strong>s in the rest of Canada. If the BCUC and other regulatory bodies do<br />
not adequately address the low returns for utilities in Canada, and the disparity between the<br />
capital structure and returns in Canadian jurisdictions as compared to the U.S., it is quite<br />
possible that there will be negative credit rating implications for TGI and other Canadian utilities.<br />
Summary of Part 2: Proposed Solution<br />
The <strong>Terasen</strong> <strong>Utilities</strong> respectfully submit that the Commission must modify the <strong>ROE</strong> allowed for<br />
TGI, which will also serve as the Benchmark <strong>ROE</strong> for the other <strong>Terasen</strong> <strong>Utilities</strong>. It is also<br />
respectfully submitted that the equity component in the capital structure of TGI should be<br />
increased to 40%. These changes are critical if TGI and the other <strong>Terasen</strong> <strong>Utilities</strong> are to<br />
successfully compete for capital with other Canadian utilities, with utilities in the U.S., and with<br />
other participants in the capital markets.<br />
Page 41
THE TERASEN UTILITIES<br />
<strong>2009</strong> <strong>ROE</strong> AND CAPITAL STRUCTURE APPLICATION<br />
It is requested that:<br />
• The return on equity for TGI be set at 11.0% with effect from July 1, <strong>2009</strong> and that this<br />
rate be used effective July 1, <strong>2009</strong> as the Benchmark <strong>ROE</strong> for the other <strong>Terasen</strong><br />
<strong>Utilities</strong>, with the company specific <strong>ROE</strong> for TGVI continuing to be set at a 70 basis point<br />
premium over the Benchmark <strong>ROE</strong> and the company specific <strong>ROE</strong> for TGW continuing<br />
to be set at a 50 basis point premium over the Benchmark <strong>ROE</strong>;<br />
• The deemed common equity component in its capital structure of <strong>Terasen</strong> Gas Inc. for<br />
rate-setting purposes be 40%, with effect from January 1, 2010;<br />
• The current rates of TGI and TGW be made interim effective July 1, <strong>2009</strong> until a final<br />
determination in this proceeding is rendered by the Commission and permanent rates<br />
can be set that incorporate the Commission’s determinations; and<br />
• The increase in the <strong>ROE</strong> determined for TGVI, be treated as an increase in TGVI’s cost<br />
of service effective July 1, <strong>2009</strong> which will, pursuant to the Special Direction for TGVI, be<br />
an adjustment to the <strong>2009</strong> Deficiency or Surplus and will be reflected in the Revenue<br />
Deficiency Deferral Account balance.<br />
By taking these actions the Commission will provide TGI and the other <strong>Terasen</strong> <strong>Utilities</strong> with the<br />
opportunity to earn a fair return on the investment in their utility assets which meets the Fair<br />
Return Standard and will also ensure that the Commission satisfies its obligations under the<br />
<strong>Utilities</strong> Commission Act.<br />
Conclusion<br />
In 1994, when the Commission introduced its ground-breaking <strong>ROE</strong> adjustment mechanism for<br />
setting rates of returns, the starting allowed <strong>ROE</strong> reflected the economic climate and<br />
circumstances of the day, but the adjustment mechanism was really an experiment with little<br />
evidence to support the adjustment factor. The adjustment factor is entirely based on an equity<br />
risk premium approach to determining the appropriate return on equity. While the adjustment<br />
formula has been modified over the years its fundamental parameters have not changed; it<br />
continues to rely on the implicit conclusion that there is a year to year relationship between<br />
forecast GCB yields and the required return on equity investments in utility assets. The<br />
evidence now available throws into question any year to year relationship between bond yields<br />
and equity returns, particularly in times of market turbulence when utility required equity and<br />
debt costs are increasing but the formula is produced a decreased <strong>ROE</strong>. The evidence now<br />
available demonstrates that over time the relationship between GCB yields and the required<br />
utility equity returns is not 75% (as in the current BCUC formula) but rather has been<br />
approximately 50%. The formulaic approach that has been based on one test for determining<br />
equity returns, and which has made use of an approximate 75% relationship to the movements<br />
in the long GCB yields, has resulted in the mechanism veering off course, with the formula not<br />
producing appropriate, adequate or fair returns on utility investments.<br />
Page 42
THE TERASEN UTILITIES<br />
<strong>2009</strong> <strong>ROE</strong> AND CAPITAL STRUCTURE APPLICATION<br />
In British Columbia, in Canada and in North America, there is and will continue to be intense<br />
competition for capital in the future. Recent capital market conditions have led central<br />
governments and central banks around the world to take unprecedented steps to stabilize the<br />
financial markets, ease investor concerns and boost confidence. Market turbulence has led a<br />
flight to quality, with resultant abnormally low long-term government bond yields.<br />
Notwithstanding recent market conditions, the returns utility investors expect haven’t changed<br />
dramatically over time, although recent market conditions indicate a re-pricing of all corporate<br />
risk. The returns available on comparable investments have been and are expected to continue<br />
to be materially higher than those produced by the current <strong>ROE</strong> adjustment formula. The<br />
Commission should adopt a more balanced approach to establishing a fair return for utility<br />
equity investors in British Columbia.<br />
The Commission must recognize that a strong financial foundation is necessary to support<br />
healthy public utilities in the province. Debt investors require and demand adequate equity<br />
support in the capital structure of utilities to which they provide financing. It is not appropriate to<br />
subject investors in TGI to essentially the lowest allowed returns on equity in North America<br />
while at the same time failing to provide debt investors with adequate equity underpinning in the<br />
capital structure. The result is the lowest overall return from equity of the major gas/electric<br />
utilities in Canada.<br />
The Commission must recognize that British Columbia utilities compete for capital with other<br />
Canadian utilities and with utilities in the U.S. The Commission should recognize that the<br />
results of the current <strong>ROE</strong> formula are inappropriate. The Commission must award returns on<br />
equity, and establish capital structures, that are appropriate in today's financial markets and<br />
reflect the business and financial risks of the utilities in British Columbia.<br />
<strong>Terasen</strong> requests that the Commission acknowledge changed circumstances by allowing TGI a<br />
common equity component of 40% in its capital structure effective January 1, 2010, and the<br />
<strong>Terasen</strong> <strong>Utilities</strong> request that a return on equity of 11% be established effective July 1, <strong>2009</strong> for<br />
TGI, and as the Benchmark <strong>ROE</strong> for the other <strong>Terasen</strong> <strong>Utilities</strong>. This level of return as the <strong>ROE</strong><br />
for TGI and as the Benchmark <strong>ROE</strong> will apply until an application to the Commission at a future<br />
date for a change. The <strong>Terasen</strong> <strong>Utilities</strong> will pursue development of an appropriate <strong>ROE</strong><br />
adjustment mechanism with the goal of presenting a proposal to the Commission in time to be<br />
considered in setting final rates for 2011, if possible.<br />
Questions concerning this application may be directed to Scott Thomson (604) 443-6565 or<br />
Tom Loski (604) 592-7464.<br />
All of which is respectfully submitted,<br />
TERASEN GAS INC.<br />
TERASEN GAS (VANCOUVER ISLAND) INC. and<br />
TERASEN GAS (WHISTLER) INC.<br />
Original signed by:<br />
Scott A. Thomson<br />
Vice President, Regulatory Affairs & CFO<br />
Page 43
<strong>Terasen</strong> Gas Business Risks<br />
Introduction<br />
Page 1<br />
Tab 1<br />
Business Risks<br />
Business risk for TGI is the Company’s ability to recover (i) the capital investments it has<br />
made to serve customers over the long term and (ii) an appropriate return on those<br />
investments. The Company’s business risk continues to increase since the <strong>ROE</strong> decision<br />
made by the Commission in 2006.<br />
By their very nature, a gas utility’s primary investments have a useful life that extends over<br />
a long period of time. Therefore, when evaluating the business risk of a gas distribution<br />
utility, it is the longer-term fundamental business risks that must be given primary<br />
consideration.<br />
Historically, the elements that made up TGI business risk were: the competitiveness of<br />
natural gas to alternative energy sources, namely electricity; the ability to attract<br />
customers and retain its customer base. These two elements influence the volume of<br />
natural gas (throughput) flowing through the TGI system. Ultimately throughput is the<br />
vehicle, from variable rates charged to customers, by which almost all of TGI’s<br />
investments are recovered. All else equal, if throughput levels decline for whatever<br />
reason, TGI business risk increases.<br />
The business risks and related trends that TGI identified in the 2005 <strong>ROE</strong> proceeding<br />
have continued to materialize. As an example, TGI normalized use rate for Rate Schedule<br />
1 customers has declined. 1 This decline in use rate can be attributed to such factors as the<br />
price of natural gas compared to other energy prices and changes in housing mix within<br />
the residential sector. It is expected that these factors will continue to pose challenges to<br />
TGI into the future.<br />
In addition to historical business risk factors discussed in the 2005 <strong>ROE</strong> proceeding (which<br />
continue), TGI faces new business risks that were not foreseen at that time. These factors<br />
include government efforts and mandates to reduce energy consumption to mitigate the<br />
impacts of climate change and aboriginal rights. It is reasonable to conclude that these<br />
new risk factors have increased the Company’s business risk, and will increase TGI’s<br />
business risk into the future. TGI investments relate to transporting a fossil fuel to<br />
customers. Investments in assets to enable the use of a fossil fuel are perceived by some<br />
elements of society to be at odds with the expectations of governments and customers<br />
regarding climate change.<br />
Significant factors that have emerged since 2005 which increase the longer-term business<br />
risks of TGI are:<br />
1) BC Government Policies:<br />
1.1 BC Energy Plan 2007 – energy conservation and efficiency policies<br />
1.2 BC GHG reduction targets<br />
1.3 BC Carbon Tax<br />
1 TGI normalized annual usage rate for Rate Schedule 1 customers (residential customers) has declined from<br />
103.1 GJ’s in 2003 to 92.5 GJ’s in 2008. Projected annual use rate for Rate Schedule 1 for 2010 is 89.7<br />
GJ’s.
1.4 Climate Action Plan<br />
1.5 Climate Action Team Recommendations<br />
1.6 Province of British Columbia Strategic Plan <strong>2009</strong>/10 - 2011/12<br />
2) Aboriginal Rights Effects on BC <strong>Utilities</strong><br />
Page 2<br />
Tab 1<br />
Business Risks<br />
As discussed in Section 2.0 below, uncertainty of the nature and extent of<br />
aboriginal rights and title in B.C. and the lack of treaties, create operational and<br />
regulatory complexity, and a risk of litigation, that is greater than that faced by<br />
businesses in other jurisdictions. The Court of Appeal now requires that the<br />
Commission examine and determine the adequacy of aboriginal consultation, and<br />
possible accommodation. These factors contribute to TGI facing a higher degree<br />
of risk than utility operations in other provinces.<br />
These new business risks are layered over the risks identified in the 2005 <strong>ROE</strong><br />
application. These risks are:<br />
1) The Competitiveness of Natural Gas Is Declining.<br />
Natural gas no longer enjoys a substantial operating cost advantage over<br />
electricity. Electricity is a requirement for every home and business; adding a<br />
furnace and ducting for gas heating adds to the front end cost of building a home.<br />
As gas prices have risen over the past decade and electricity prices remained<br />
relatively flat (decreasing in real terms) natural gas has lost much of its competitive<br />
price advantage.<br />
2) TGI’s Ability to Attract and Retain Its Customer Base Is At Risk.<br />
TGI is being negatively affected by two trends: TGI’s declining rate of capture of<br />
the new construction market and the continued decline in annual use rates from<br />
existing customers.<br />
With housing affordability challenged in the Lower Mainland, a greater proportion of<br />
new housing in recent years has been, and into the future will be, multi-family<br />
dwellings for which electricity achieves the overwhelming heating market share.<br />
This is resulting in substantially lower customer additions at similar housing start<br />
levels. The impact is significant, particularly when new customer additions are<br />
required to assist in offsetting the declining use per account of TGI existing<br />
customer’s base due to energy conservation and efficiency efforts.<br />
At the same time TGI is seeing a shift (decline) in annual demand. A greater<br />
number of competitive alternative energy sources are available now to prospective<br />
customers (i.e. heat pumps). This is evident by incentives being offered to<br />
customers through such programs as LiveSmart BC.<br />
Collectively these fundamental business risk factors determine whether a utility will be able<br />
to recover its investments in rate base over time and an appropriate return on those<br />
investments. In addition these business risks contribute to shorter term risk associated<br />
with earnings volatility. These factors are discussed in detail below.
1.0 BC Government Policies Negatively Impact <strong>Terasen</strong>’s Competitiveness<br />
Page 3<br />
Tab 1<br />
Business Risks<br />
The British Columbia Throne Speech delivered on February 13, 2007 outlined the<br />
province’s Greenhouse Gas (“GHG”) reduction target, coupled with a second<br />
announcement on February 19, 2008 that introduced the BC Carbon Tax. Together these<br />
two policies and subsequent implementation into law have increased TGI’s business risk<br />
since the last <strong>ROE</strong> application that was before the BCUC in 2005.<br />
The aggressive GHG reduction targets send a strong message to consumers and<br />
businesses in BC that over the long term they must do things differently than in the past to<br />
reduce GHG emissions. This is evident from the Carbon Tax, which directly taxes the<br />
consumption of carbon based fuels within British Colombia. With natural gas providing<br />
over 20% of the energy consumed in the province, the new legislation and government<br />
policy create challenges to the longer term recovery of investment in gas delivery<br />
infrastructure in the province, and therefore to the level of business risk faced by TGI since<br />
the Commission last examined <strong>ROE</strong> and capital structure for the benchmark utility. 2<br />
Since 2007, with the announcement of “The BC Energy Plan: A Vision for Clean Energy<br />
Leadership” (“Energy Plan”), the BC Provincial Government has taken a leadership role in<br />
the fight against climate change/global warming. Page 1 of the Energy Plan states:<br />
“This plan outlines the steps that all of us – including industry,<br />
environmental agencies, communities, and citizens – must take to reach<br />
these goals for conservation, energy efficiency and clean energy so we can<br />
arrest the growth of greenhouse gases and reduce human impacts on the<br />
climate.”<br />
By taking this leadership role, many policy initiatives introduced by the BC provincial<br />
government on behalf of residents of BC have increased TGI business risk over the long<br />
term. These policies relate to the need for more energy conservation, the legislating of<br />
aggressive GHG emission reduction targets, and the introduction of the BC Carbon Tax.<br />
These policy items have the potential to reduce natural gas throughput levels or use per<br />
account, which in turn negatively impacts TGI’s competiveness and its ability to recover its<br />
investment over the long term.<br />
In moving the policy items outlined in the 2007 Energy Plan forward, the BC Provincial<br />
Government in the Spring 2008 Legislative Session introduced the following bills:<br />
1. Bill 15 – <strong>Utilities</strong> Commission Amendment Act<br />
2. Bill 16 – Greenhouse Gas Reduction (Renewable and Low Carbon Fuel<br />
Requirements) Act<br />
3. Bill 18 – Greenhouse Gas Reduction (Cap and Trade) Act<br />
4. Bill 31 – Greenhouse Gas Reduction (Emission Standards) Statutes Amendment<br />
Act<br />
5. Bill 27 – Local Government (Green Communities) Statutes Amendment Act, 2008<br />
6. Bill 37 – Carbon Tax Act<br />
2 http://www.oee.nrcan.gc.ca/corporate/statistics/neud/dpa/tabletrends2/res
Page 4<br />
Tab 1<br />
Business Risks<br />
These Bills enact policy items from the Energy Plan. Each of these bills was enacted by<br />
the end of the Spring 2008 Legislative Session and has received Royal Assent.<br />
As an example, the Local Government Act was amended by Bill 27 (Local Government<br />
Statues Amendment Act, 2008) to help ensure the 2020 GHG reduction target are met by<br />
amending Section 877 of the Act to state:<br />
“An official community plan must include targets for the reduction of<br />
greenhouse gas emissions in the area covered by the plan, and policies<br />
and actions of the local government proposed with respect to achieving<br />
those targets.” 3<br />
1.1 Energy Conservation and Efficiency Policies<br />
The Energy Plan was released on February 27, 2007 with many of the policies outlined in<br />
the Plan focused on the need for reduced energy use or energy conservation.<br />
Many of these policies will have the ultimate effect of reducing throughput on the TGI<br />
system.<br />
The relevant policies outlined in the Energy Plan:<br />
• Encourage utilities to pursue cost effective and competitive demand side<br />
management opportunities.<br />
• Explore with BC utilities new rate structures that encourage energy efficiency and<br />
conservation. 4<br />
• Implement Energy Efficiency Standards for Buildings by 2010.<br />
• Undertake a pilot project for energy performance labeling of homes and buildings<br />
in coordination with local and federal governments.<br />
• Require new provincial public sector buildings to integrate environmental design to<br />
achieve the highest standard for greenhouse gas emissions reductions, water<br />
conservations and other building performance results such as a certified standard.<br />
Supporting the goal of the government of BC being carbon neutral by 2010.<br />
• Develop an Industrial Energy Efficiency Program for British Columbia to address<br />
specific challenges faced by the British Columbia industrial sector.<br />
These policies are commendable, as they emphasize energy efficiency and conservation,<br />
objectives which TGI supports from a societal perspective. However, the overall result of<br />
these policies will be a reduction in natural gas average use per account which translates<br />
into less total throughput across the TGI distribution system. Over the long term, a<br />
decrease in throughput volume leads to high unit delivery costs for customers, which<br />
3 Bill 27 -2008 Local Government (Green Communities) Statutes Amendment Act, 2008 Legislative Session<br />
4 Notwithstanding the stated policy objective is sound, its application has been inconsistent. The 2008 BCUC<br />
decision on BC Hydro rate design relating to moving revenue to cost ratios toward parity was rolled back by<br />
the Provincial Government over concerns of customer rate impacts
Page 5<br />
Tab 1<br />
Business Risks<br />
makes natural gas less competitive, which in turn hinders TGI’s ability to recover its<br />
investments.<br />
Energy conservation and efficiency policies also fit well with helping to reach the primary<br />
goal of reduction GHGs. By using less energy derived from fossil fuels, less GHGs are<br />
produced.<br />
1.2 BC GHG Reduction Targets Will Hurt the Competitiveness of Natural Gas<br />
Of the policy items introduced by the Provincial government the one that presents the<br />
most significant business risk to TGI’s traditional business and rate base investment is the<br />
policy relating to the reduction of GHG emissions in the Province.<br />
For the year 2006, 12 per cent of BC’s total emissions came from the consumption of<br />
natural gas in the residential and commercial sectors 5 (see Figure 1.2 below).<br />
Additionally, 14 per cent of BC’s total emissions came from the “Other Industry” sector.<br />
Consumption of natural gas in the industrial sector is one of the sources of emissions<br />
embedded in the total emission from this sector. The final area of BC’s emission that<br />
comes from natural gas consumption is in the electricity sector at 2 per cent. It is<br />
estimated that the operating emissions of <strong>Terasen</strong> Gas Inc. and <strong>Terasen</strong> Gas (Vancouver<br />
Island) Inc. and the emissions of their customers from natural gas consumption make up<br />
approximately 17 per cent of BC total emissions for 2006.<br />
The Province passed Bill 44 (2007 Greenhouse Gas Reduction Target Act) in the 3 rd<br />
Session of the 2007 Legislative Session. Part 1 of Bill 44 outlines BC GHG emission<br />
targets levels as being:<br />
“By 2020 and for each subsequent calendar year, BC greenhouse gas<br />
emissions will be at least 33% less than the level of those emissions in<br />
2007; and by 2050 and for each subsequent year, BC greenhouse gas<br />
emissions will be at least 80% less than the level of those emissions in<br />
2007.” 6<br />
On November 25, 2008 GHG interim targets were set by Ministerial Order as follows:<br />
• 2012 – six per cent below 2007; and<br />
• 2016 – eighteen per cent below 2007 levels.<br />
As a further commitment to provincial GHG reduction targets, the Province and the Union<br />
of BC Municipalities on September 26, 2007 committed to a goal of becoming carbon<br />
neutral by 2012. 7 As of March 31, <strong>2009</strong>, 174 local governments have signed on to this<br />
agreement.<br />
These reduction targets ignore regional emissions impacts and focus on reducing<br />
consumption of carbon based fuels including natural gas in British Columbia even though<br />
5<br />
http://www.livesmartbc.ca/learn/emissions.html#Total<br />
6<br />
This means that GHG’s emissions within BC must be reduced by 33% from 2007 levels by 2020. This may<br />
come in the form of a physical reduction or purchasing an offset that qualifies under the regulations.<br />
7<br />
New Release, Government of BC, B.C. Communities Commit to Carbon Neutrality By 2012, September 26,<br />
2007
Page 6<br />
Tab 1<br />
Business Risks<br />
this can lead to a net increase in climate change impacts in the region through importation<br />
of electricity generated by fossil fuel combustion. The targets, which are enacted into law,<br />
have increased TGI business risk over the long term given that about 17% of BC GHG<br />
emissions come from the direct consumption of natural gas.<br />
Figure 1.2: Electricity Generates Few GHG Emissions in BC<br />
Source: British Columbia, Climate Action Plan, page 25<br />
What makes BC unique relative to other jurisdictions regarding the output of GHG is the<br />
sources of these emissions. As Figure 1.2 shows, BC has only 2 per cent of its GHG<br />
emissions coming from the electricity sector. This is a much lower proportion compared to<br />
many other jurisdictions where a much higher proportion of the provincial or state<br />
emissions come from the electricity sector. For example, Alberta produces over 20 per<br />
cent of its emissions from producing electricity (see Figure 1.2.1). The difference between<br />
the two provinces arises from the difference in the types of electricity production: most of<br />
BC electricity is produced from hydro sources while Alberta produces most of its electricity<br />
from a combination of coal and natural gas. This is recognized by TGI customers as<br />
recently indicated by the British Columbia Public Interest Advocacy Centre on behalf of the<br />
British Columbia Old Age Pensioners Organization et al (“BCOAPO”),<br />
“As a natural gas utility, they are in an admittedly more difficult position here<br />
in British Columbia than they would in many other jurisdictions, both in<br />
North America and internationally, because they are fighting to survive in a<br />
jurisdiction where they aren’t the clean generation option. That does not,<br />
however, justify overlooking the simple truth: we have cleaner options more<br />
in line with planetary imperatives and the public’s desire to take positive<br />
action to reduce their carbon footprint.” 8<br />
8 BCOAPO, Final Argument in BC Hydro 2008 LTAP, dated April 27, <strong>2009</strong>, page 8
Page 7<br />
Tab 1<br />
Business Risks<br />
Figure 1.2.1: GHG Emissions by Sector (BC, Washington State, Oregon, Alberta)<br />
Percentage of Total Emissions<br />
50%<br />
45%<br />
40%<br />
35%<br />
30%<br />
25%<br />
20%<br />
15%<br />
10%<br />
5%<br />
0%<br />
Transport Residential<br />
and<br />
Commercial<br />
Electricity<br />
Production<br />
Waste Agriculture Fossil Fuel<br />
Production<br />
BC Washington Oregon Alberta<br />
Industrial<br />
Process and<br />
Other<br />
Source: Data is available to the public from various provincial and state government web sites and<br />
documents. The data presented is for different years based on what was publicly available.<br />
Note: If a column is missing for a particular state/province it means the number is zero for the category for<br />
that state/province. In some cases the number being zero may have to do with how that state or<br />
province classifies and reports the GHG output.<br />
How GHG emissions are generated in each jurisdiction is important because it gives an<br />
indication of potential areas where emissions reductions will be targeted over time. In<br />
2006, BC produced 69 million tonnes of GHG emissions. 9 This relatively small total<br />
emissions output as compared to other jurisdictions makes BC’s aggressive reduction<br />
target of 33 per cent by 2020 a challenge. As a point of comparison, in 2005 Washington<br />
State produced an estimate of 88 million tonnes of GHG emission and its stated reduction<br />
target is by 2020 to reduce GHG emission to 1990 levels. This would be about an 11%<br />
reduction or 10 million tonnes in reduction based on 2005 output levels. 10<br />
With many policy items in the BC Energy Plan targeted at stimulating growth in the BC oil<br />
and gas sector, it will be a significant challenge for BC to reduce GHG emission from the<br />
fossil fuel production sector (21 per cent in Figure 1.2). This leaves the transportation<br />
sector at 36 per cent, other industry at 14 per cent, the residential and commercial sector<br />
at 12 per cent as the biggest areas for potential GHG reductions. By default this puts<br />
TGI’s natural gas business at risk from the Province’s GHG reduction targets policy.<br />
Given this backdrop, some customers groups and competitors, believe that BC-produced<br />
clean electricity should be used at a greater rate in applications that historically have been<br />
filled by natural gas, namely in such applications as space and water heating.<br />
9 British Columbia, Climate Action Plan, page 57<br />
10 Washington Climate Change Challenge, Executive Order 07-02, Office of the Governor, February 7, 2007
Page 8<br />
Tab 1<br />
Business Risks<br />
As an example, before the release of the Energy Plan, BC Hydro, one of TGI’s competitors<br />
for space and water heating, believed that natural gas was the best choice for space and<br />
water heating, as evidenced by the following public statement in 2006:<br />
“It is important to match your energy source to its best use. Electricity is<br />
best suited for lighting, and powering appliances and televisions, whereas<br />
natural gas is ideal for space and water heating.” 11 says Steve Hobson,<br />
Manager of Power Smart at BC Hydro.<br />
Also, in the past, BC Hydro had information on its company website that encouraged<br />
customers to use natural gas instead of electricity for space heating based on economic<br />
and environmental considerations. In the 2007 BC Hydro Rate Design <strong>Application</strong><br />
proceedings, BC Hydro commented on this website posting, stating: BC Hydro from time<br />
to time since the 1980’s, has encouraged natural gas for space heating, and that the<br />
referenced statement was first placed on its website in 2005. 12<br />
The provincial GHG reduction targets have the potential to adversely change people’s<br />
perception of natural gas over the long term. The targets will likely shift investment and<br />
consumption decisions of the consumer away from natural gas towards the consumption<br />
of electricity or other renewable energy alternatives (such as solar or geothermal). This<br />
focus on renewable energy may supersede historical decision criteria such as cost of<br />
product, ease of use, and reliability.<br />
Some customer groups and competitors have placed the need to reduce GHGs in the<br />
British Columbia above other decision criteria such as cost. This is demonstrated by<br />
BCOAPO’s recent statement in its final argument in the BC Hydro 2008 LTAP proceeding,<br />
which states:<br />
“As a result the world is a very different place than in the 1970’s when<br />
global warming was fodder for science fiction and fossil fuels were<br />
commonly thought to be our civilization’s salvation. How then, BCOAPO<br />
asks, are we to reconcile <strong>Terasen</strong>’s desire to increase natural gas use with<br />
the facts: we have very little time to effect large changes to cut GHG<br />
emission levels in order to make any sort of impact?<br />
British Columbia is blessed with a rich hydrology that lends itself well to<br />
hydroelectric generation projects, both large and small and as a result, we<br />
do not as a province rely on dirty coal or natural gas generation for our<br />
power as do most jurisdictions in the world. Why then, when governments<br />
across the continent and around the world are adopting strong messages to<br />
avoid a climate catastrophe, and our provincial government has set its own<br />
aggressive GHG emission reduction goals, and our population is concerned<br />
about air quality, pollution, and climate change, would we support our<br />
relatively clean hydroelectric utility embarking upon a program that would<br />
encourage their current and future customers to switch to natural gas? In<br />
short: we shouldn’t, we wouldn’t, and we don’t.” 13<br />
11 <strong>Terasen</strong> Gas, Service Line publication, Spring 2006<br />
12 BC Hydro Rate Design, Exhibit B-31, BC Hydro undertaking, July 12, 2007<br />
13 BCOAPO, Final Argument in BC Hydro 2008 LTAP, dated April 27, <strong>2009</strong>, page 7-8
Page 9<br />
Tab 1<br />
Business Risks<br />
Based on these statements it is clear that BCOAPO has placed a priority on climate<br />
change policy, erroneously considering only emissions in BC rather than net emissions<br />
affecting climate concerns, over historic considerations such as cost of product and ease<br />
of use. This is against a backdrop of a downturn in the economy and from an organization<br />
that represents low income groups. It is a strong example of how the provincial GHG<br />
targets, along with a lack of policy clarity respecting net emissions and general<br />
environmental concerns, can influence and shape customers perception against natural<br />
gas despite the direct economic benefits. Clearly, provincial GHG targets have changed<br />
customer’s views and are likely to contribute to the reduction of TGI throughput volumes<br />
over time.<br />
These statements made by BCOAPO in the BC Hydro 2008 LTAP proceeding are<br />
consistent with other opinions expressed by BCOAPO on the change in customer views<br />
towards natural gas.<br />
For example, in the November 28, 2008 final argument related to TGI Resource Plan 2008<br />
<strong>Application</strong>, BCOAPO stated:<br />
“It seems inevitable that climate change policies, carbon pricing, and the<br />
public drive for clean renewable energy will have some impact on <strong>Terasen</strong>’s<br />
future operations….” 14<br />
Further, in response to the arguments of the <strong>Terasen</strong> <strong>Utilities</strong> in the TGI and TGVI 2008<br />
Energy Efficiency and Conservation <strong>Application</strong>, BCOAPO submitted that,<br />
“the Commission may take notice of the general message of the provincial<br />
energy and GHG reduction policies as clear indication that a move from<br />
electricity generated in a province so rich in clean, renewable resources to<br />
any fossil fuel, including natural gas, is contrary to what is currently<br />
perceived as that optimal balance.” 15<br />
A final example of shift in perception comes in the form of BC Hydro changing its policy<br />
regarding supporting natural gas for space heating. During the 2007 Rate Design<br />
<strong>Application</strong> proceedings it stated that,<br />
“BC Hydro is reviewing this practice in light of the 2007 Energy Plan” 16 .<br />
BC Hydro has since removed its website messaging to customers, which had encouraged<br />
natural gas for space and water heating. A demonstration of how the GHG policies in BC<br />
have shaped BC Hydro actions and therefore messaging to customers in BC, was the<br />
position that BC Hydro took in the <strong>Terasen</strong> <strong>Utilities</strong> 2008 Energy Efficiency and<br />
Conservation Programs <strong>Application</strong> that was submitted to the BCUC on May 28, 2008. In<br />
its final argument dated November 28, 2008, BC Hydro stated:<br />
14 <strong>Terasen</strong> Gas Inc., Resource Plan 2008, BCOAPO final argument dated October 16, 2008<br />
15 <strong>Terasen</strong> Gas Inc., and <strong>Terasen</strong> Gas (Vancouver Island) Inc., Energy Efficiency and Conservation Program<br />
<strong>Application</strong>, BCOAPO final argument dated November 28, 2008<br />
16 BC Hydro Rate Design, Exhibit B-3, <strong>Terasen</strong> Gas Inc. IR #1.3.1
“…that part of the EEC <strong>Application</strong> expenditures targeting fuel switching<br />
from electricity to natural gas is not in the public interest at this time...” 17<br />
Page 10<br />
Tab 1<br />
Business Risks<br />
It is clear from the discussion above that the risk profile of TGI has increase substantially<br />
due to the climate change challenge, the provincial GHG reduction targets and how these<br />
targets have shaped customers view towards natural gas. There can be no doubt that this<br />
will have an impact on the use of natural gas, TGI’s opportunities, and TGI’s ability to<br />
recover its investment over the long term.<br />
1.3 BC Carbon Tax Will Make Natural Gas Even More Costly<br />
To help reach its GHG reduction targets, BC implemented the BC Carbon Tax, which<br />
came into effect in July 1, 2008. This tax reduces the competiveness of natural gas<br />
relative to alternative energy sources that are not subject to the carbon tax, and provides a<br />
direct pricing signal to customers in relation to GHG emissions.<br />
As the Province Strategic Plan <strong>2009</strong>/10 - 2011/12 emphasizes, the role of the carbon tax<br />
is to send appropriate price signals to enable customers to make choices with respect to<br />
energy consumption:<br />
“It gives British Columbia’s a choice on how they wish to adapt their<br />
behavior to reduce their consumption of fossil fuel.” 18<br />
As natural gas is a fossil fuel, and given the aggressive provincial GHG reductions targets,<br />
the BC Carbon Tax translates into an increase in the business risk profile for TGI.<br />
According to the British Columbia Climate Action Plan (page 14):<br />
“A carbon tax is usually defined as a tax based on GHG emissions<br />
generated from burning fossil fuels. It puts a price on each tonne of GHG<br />
emitted, sending a price signal that will, over time, elicit a powerful market<br />
response across the entire economy, resulting in reduced emissions. It has<br />
the advantage of providing an incentive without favoring any one way of<br />
reducing emissions over another. By reducing fuel consumption, increasing<br />
fuel efficiency, using cleaner fuels, and adopting new technology, business<br />
and individuals can reduce the amount they pay in carbon tax, or even<br />
offset it altogether.”<br />
The BC Carbon Tax started at $10/tonne of GHG and will increase by $5/tonne each year<br />
to $30/tonne by 2012. Figure 1.3 illustrates the cost per GJ on each fossil fuel based on<br />
their different GHG emissions profile at $10/tonne and $30/tonne. By 2012, natural gas<br />
consumers in BC will be paying $1.50/GJ in carbon tax. The carbon tax beyond 2012 is<br />
unknown at the present time. However, in its report entitled “Meeting British Columbia’s<br />
Targets: A report from the BC Climate Action Team”, the Climate Action Team<br />
recommends the following:<br />
17 <strong>Terasen</strong> Gas Inc., and <strong>Terasen</strong> Gas (Vancouver Island) Inc., Energy Efficiency and Conservation Program<br />
<strong>Application</strong>, BC Hydro, final submissions dated November 28, 2008, page 7<br />
18 The BC Strategic Plan <strong>2009</strong>/10-2011/12
“After 2012, if required to achieve the emissions targets, increase the<br />
British Columbia carbon tax in a manner that aligns with the policies of<br />
other jurisdictions and key economic facts.” 19<br />
Coal<br />
2008 $.80-$1.00 Cdn/GJ<br />
2012 $2.40-$3.00 Cdn/GJ<br />
Figure 1.3: GHG Emission Cost Profile<br />
Diesel<br />
Fuel Oil<br />
2008 $.70-$.75 Cdn/GJ<br />
2012 $2.10-$2.25 Cdn/GJ 2008 $.66 Cdn/GJ<br />
2012 $2.00 Cdn/GJ 2008 $.59 Cdn/GJ<br />
2012 $1.77 Cdn/GJ<br />
Cost of $10/tonne for GHG Emsssions for 2008<br />
Cost of $30/tonne for GHG Emsssions for 2012<br />
Gasoline Propane<br />
Page 11<br />
Tab 1<br />
Business Risks<br />
Natural Gas<br />
2008 $.50 Cdn/GJ<br />
2012 $1.50 Cdn/GJ<br />
The main energy source absent from the emission cost profile in Figure 1.3 is electricity.<br />
That is because the carbon tax imposed on electricity depends on the electricity’s<br />
production mix. In most jurisdictions electricity is produced from a variety of sources.<br />
Thus the unit cost associated with carbon tax would vary according to the production<br />
supply mix. In BC, most electricity production is from hydro sources, with up to 15% of the<br />
electricity consumed being imported electricity produced in other jurisdictions, which likely<br />
is produced from a fossil fuel. 20 At present, this imported electricity is not subject to the<br />
carbon tax and the rules of carbon tax are not consistent across all energy forms in BC. 21<br />
Therefore natural gas and other fossil fuel consumption in BC is disadvantaged from a<br />
price point of view as compared to electricity.<br />
The carbon tax reduces natural gas’ competiveness relative to alternative energy sources<br />
that are not subject to the carbon tax, and the carbon tax will help to sensitize customers<br />
to the level of GHG emissions they generate by sending them price signals. The<br />
provincial carbon tax increases the business risks of TGI.<br />
19<br />
Meeting British Columbia’s Targets, A Report from the B.C. climate Action Team, July 28, 2008, page 3<br />
20<br />
BC Hydro 2006 Integrated Electricity Plan, Section 3, Figure 3-3 BC Hydro’s Net Imports and Exports of<br />
Electricity<br />
21<br />
BC Hydro has implicitly acknowledged that offsets and the carbon tax provide alternative price signals for<br />
GHG emissions by requesting confirmation from the Province that it will not be necessary for BC Hydro to<br />
purchase offsets and pay the carbon tax after 2016. This statement is from the BC Hydro LTAP 2008,<br />
Transcript, Vol. 6, at 824; Transcript, Vol. 6, at 870 (confirming Ms. Van Ruyven's statement).
Page 12<br />
Tab 1<br />
Business Risks<br />
1.4 Climate Action Plan Continues the Provincial Government Message on<br />
Climate Change<br />
Both the 2007 Energy Plan and the more recent released Climate Action Plan 22 present<br />
the vision of the provincial Government and its resolve for BC to tackle climate change,<br />
and in doing so to change the way British Columbians think and act with respect to energy<br />
usage. As an example, the message from the government in the Climate Action Plan<br />
states:<br />
“Global warming is the challenge of our generation. How we respond will<br />
shape the future of not just our environment, but also our economy, our<br />
society, our communities, and our way of life. British Columbia is taking<br />
decisive action to ensure these changes are positive. Since 2007 we have<br />
built a solid framework that addresses climate action in four key ways:<br />
• We have entrenched greenhouse gas reduction in law, including a<br />
commitment to reduce B.C. emissions by one-third by 2020.<br />
• We are taking targeted action in all sectors of the B.C. economy to<br />
help reduce emissions and set the course for the new low-carbon<br />
economy of the future.<br />
• We are taking steps to help British Columbians adapt to the realities<br />
of climate change and its impact on the province.<br />
• We are beginning a process to educate and engage British<br />
Columbians. This includes holding public forums and developing our<br />
LiveSmart BC initiative to support individuals, families, communities,<br />
business and industry to make cleaner choices and help.”<br />
The Climate Action Plan maintains a consistent message from the provincial government<br />
about the commitment it has to reduction of GHGs and mitigation of climate change. As<br />
the summary of the Climate Action Plan suggests, “we are taking action in all sectors of<br />
the BC economy to help reduce emission”. Given that about 17% of BC GHG emissions<br />
come from the direct consumption of natural gas this will no doubt increase business risk<br />
for TGI.<br />
1.5 Climate Action Team Recommendations Likely To Increase TGI Risk<br />
To help the Province reach its goals relating to GHG, the British Columbia’s Climate Action<br />
Team (“CAT”) was established in November 2007. 23 On July 28, 2008, a report entitled:<br />
“Meeting British Columbia’s Targets, was released by the CAT. In this report the CAT<br />
outline 31 recommendations that may help the Province reach is GHG reduction targets.<br />
The specific policy recommendations that could have a direct impact to <strong>Terasen</strong> Gas<br />
business risk are:<br />
• Increase the British Columbia carbon tax after 2012 (if required to achieve the<br />
emission targets) in a manner that aligns with the policies of other jurisdictions<br />
and key economic factors.<br />
22 Climate Action Plan was released June 26, 2008<br />
23 Meeting British Columbia’s Targets, A Report from the B.C. Climate Action Team, July 28, 2008, page 2
Page 13<br />
Tab 1<br />
Business Risks<br />
• Develop a comprehensive, multidimensional public engagement and outreach<br />
campaign in collaboration with public and private partners. This campaign will:<br />
1) educate British Columbians about the importance of climate change and the<br />
policies that are necessary to address this issue and 2) help British Columbians<br />
reduce their own greenhouse gas emissions in the most efficient way possible,<br />
and 3) make British Columbia’s aware of the incentives and savings available<br />
by taking action on climate change.<br />
• Update B.C.’s Green Building Code at least every three years to ensure B.C.’s<br />
code is a leader among North American energy codes.<br />
• Require that, by 2016, all new publicly-funded buildings in the province have<br />
net-zero GHG emissions and that by 2020 all new houses and building have<br />
net-zero GHG emission.<br />
• Introduce an aggressive energy efficiency and renewable energy program for<br />
houses and buildings, combining incentives and regulatory approaches and<br />
coordinated across governments and utilities.<br />
An example of how these recommendations and other provincial policy objectives can<br />
influence customers choices around energy consumption comes in the form of the<br />
University of British Columbia (UBC) issuing a request for a proposal to explore alternative<br />
energies at UBC. According to the UBC web site, UBC <strong>Utilities</strong> currently produces steam<br />
on campus with four natural gas fed steam boilers. Two of the four steam boilers are<br />
scheduled to be replaced in the next seven years. That is why UBC <strong>Utilities</strong> is aggressively<br />
looking to alternative non-polluting technologies to heat campus and ancillary tenant<br />
buildings. 24 One of the reasons why UBC is exploring this avenue is, as stated on its web<br />
site, is to ensure carbon neutrality in all provincial public sector operations. Thus, the CAT<br />
recommendations appear to be influencing and shaping purchasing decisions of<br />
customers that were historically natural gas customers.<br />
All of the above recommendations have the intent of reducing fossil fuel use within homes<br />
and business, which by their nature threaten the <strong>Terasen</strong> franchise and increase business<br />
risk for TGI.<br />
1.6 Province of British Columbia Strategic Plan: Discourages Use of Natural Gas<br />
In February, <strong>2009</strong> the Province of BC released its “Strategic Plan <strong>2009</strong>/10 – 2011/12."<br />
This plan continues BC’s strong commitment to be a “champion for climate change” 25 .<br />
This commitment, while laudable, also challenges natural gas as a fuel source choice<br />
through government policy and by influencing public perception towards natural gas by<br />
lumping it in with all other fossil fuels.<br />
For example, the Plan says that,<br />
“B.C. has charted its course on climate change, with the establishment of<br />
its legislated goals for carbon emissions and greenhouse gas emissions.<br />
Our strategies developed over the last few years outline our plans and<br />
targets on everything from energy, bio-energy, agriculture, mountain pine<br />
24 http://climateaction.ubc.ca/<strong>2009</strong>/02/26/ubc-utilities-leads-alternative-energy-project-to-reduce-greenhouse-<br />
gas-emissions, dated Feb. 26, <strong>2009</strong><br />
25 Province of British Columbia, Strategic Plan <strong>2009</strong>/10 – 2011/12, February, <strong>2009</strong>, page 1
eetle, to water, air, transit, and construction. Over the coming years, we<br />
will be focusing our efforts on implementing these strategies in order to<br />
achieve our objectives. 26 ”<br />
Page 14<br />
Tab 1<br />
Business Risks<br />
Government policy that discourages consumers from using natural gas will have the effect<br />
of reducing throughput volumes on the TGI system and reducing the attachment of new<br />
customers. The recovery of fixed costs from a smaller customer base, and on lower<br />
throughput, leads to rate pressure for the remaining customers. Left unmitigated and<br />
unchecked, these effects can lead to loss of existing natural gas customers and a potential<br />
“downward spiral” in which the risk of non-recovery of invested capital increases and asset<br />
potentially become stranded.<br />
Policy changes and objectives, and changes in customers’ perception arising from those<br />
policies and objectives, and from general concerns respecting GHGs, climate change and<br />
fossil fuel consumption are new factors that have increased TGI’s business risks since the<br />
last <strong>ROE</strong> proceeding in 2005.<br />
2.0 Aboriginal Rights Effects on BC <strong>Utilities</strong><br />
With respect to aboriginal issues, there is a greater risk for utilities in BC as compared to<br />
other parts of Canada.<br />
BC has a disproportionately higher number of First Nations in British Columbia than in<br />
other provinces, with the Province recognizing approximately 285 different First Nations,<br />
Bands and Tribal Councils. The need to recognize and deal with Tribal Councils flows<br />
from the lack of treaties, as it is more difficult to identify the appropriate aboriginal<br />
representative. Ontario has approximately 150 aboriginal groups, Québec approximately<br />
68 and Alberta approximately 65, many of which are signatories to the treaties. The high<br />
number of aboriginal groups in British Columbia leads to overlapping territories and<br />
competing claims for aboriginal title, as well as strong differences in opinion as to the<br />
appropriate forum for reconciling aboriginal rights and title; there is a division amongst<br />
First Nations as to whether to enter the current treaty negotiation process. Since TGI’s<br />
activities span large parts of British Columbia, the large number of different aboriginal<br />
groups whose interests may overlap increases business risk.<br />
There are very few treaties in British Columbia. Historical treaties only cover a relatively<br />
small part of B.C. (portions of Vancouver Island and the northeast corner of the Province).<br />
There have been treaty negotiations in recent years but only three treaties have been<br />
completed. Due to the small number of treaties in B.C., there are many unestablished<br />
claims for aboriginal rights or title. This leads to uncertainty both as to the scope of the<br />
right, and the area in which it is exercised. The lack of treaties has also fostered a more<br />
litigious atmosphere than appears in other Provinces as First Nations in B.C. have sought<br />
to establish the existence of their rights through the courts. Further, there is the practical<br />
reality that the duty to consult with respect to aboriginal rights arises most clearly on<br />
Crown, as opposed to private, lands. In B.C. approximately 95 percent of the land is<br />
Crown land. In other provinces the proportion of crown land is generally less. Many of<br />
TGI’s facilities are located on land owned by the Crown. Recently the Court of Appeal has<br />
ruled that BCUC decisions could affect aboriginal rights, and that the BCUC must<br />
26 Province of British Columbia, Strategic Plan <strong>2009</strong>/10 – 2011/12, February, <strong>2009</strong>, page 38
Page 15<br />
Tab 1<br />
Business Risks<br />
determine the adequacy of aboriginal consultation and accommodation before making<br />
such decisions.<br />
Uncertainty of the nature and extent of aboriginal rights and title in B.C. and the lack of<br />
treaties, create operational and regulatory complexity, and a risk of litigation, that is<br />
greater than that faced by similar businesses in other jurisdictions. All of these factors<br />
contribute to TGI facing a higher degree of risk than utility operations in other provinces.<br />
3.0 The Competitiveness of Natural Gas is Declining<br />
As recently as 2005, as Figure 3.0 shows, both electricity and natural gas provided about<br />
the same amount of total energy in BC to end users in the residential, commercial and<br />
industrial sectors. The facts show conclusively that the competitiveness of natural gas has<br />
been declining since the early 1990s, and will likely continue to do so. This results in<br />
increased business risk to TGI.<br />
The energy mix that will be used in BC in the future will be determined by a combination of<br />
energy costs, government policy, and available technologies. Given the provincial<br />
government leadership on GHG emissions reduction targets and implementation of the<br />
carbon tax, customer perception of natural gas is being, and will be, negatively impacted.<br />
TGI’s market share of new energy requirement in its service area will decline compared to<br />
historical capture rates. With current customer use rates already on the decline, the<br />
combination of expected reduction in market share and reduced average usage leads to<br />
an increase the risk of non-recovery of, and appropriate return on, the capital invested<br />
over the long term.<br />
Figure 3.0: Annual Energy Consumption in BC across Energy Types<br />
Steam, 2.1 PJ<br />
0.2%<br />
Electricity, 228.2 PJ<br />
21.4%<br />
Wood, 162.5 PJ<br />
15.2%<br />
Natural Gas<br />
225.5 PJ<br />
21.1%<br />
Coal, Coke, Propane, 26.3<br />
PJ<br />
2.5%<br />
(Source: NRCan, BC Stats 2005)<br />
Petroleum Products<br />
422 PJ<br />
39.6%
Page 16<br />
Tab 1<br />
Business Risks<br />
The two main energy sources used in end use applications in the residential and<br />
commercial sectors in BC have historically been electricity and natural gas (see Figures<br />
3.1 and Figure 3.2). As these two Figures indicate, the fuel mix make up across the<br />
country is quite diverse from jurisdiction to jurisdiction. Some factors that drive these<br />
differences are: supply availability, established networks to deliver the product to<br />
customers, price of the product, size of the population to be served, and type of building<br />
stock being developed.<br />
% of Energy Use for Heating<br />
Figure 3.1: Fuel Mix for Total Residential Energy Use in Canada in 2006<br />
100%<br />
90%<br />
80%<br />
70%<br />
60%<br />
50%<br />
40%<br />
30%<br />
20%<br />
10%<br />
0%<br />
Fuel Mix for Total Residential Energy Use in<br />
Canada in 2006<br />
Atlantic<br />
Quebec<br />
Manitoba<br />
BC and Territories<br />
Ontario<br />
Saskatchewan<br />
Alberta<br />
Other<br />
Electricity<br />
Heating Oil<br />
Wood<br />
Natural Gas<br />
Note: TGI service territory would be embedded into the BC and Territories column.<br />
Source: http://www.oee.nrcan.gc.ca/corporate/statistics/neud/dpa/comprehensive_tables/index.cfm?attr=0
Page 17<br />
Tab 1<br />
Business Risks<br />
Figure 3.2: Fuel Mix for Total Energy Use in Commercial/Institutional End Use in<br />
Canada in 2006<br />
% of Energy Use for Heating<br />
100%<br />
80%<br />
60%<br />
40%<br />
20%<br />
0%<br />
Fuel Mix for Total Energy Use in Commerical/<br />
Institutional End Use in Canada in 2006<br />
Atlantic<br />
Quebec<br />
BC and Territories<br />
Ontario<br />
Saskatchewan<br />
Manitoba<br />
Alberta<br />
Other<br />
Steam<br />
Heavy Fuel oil<br />
Light Fuel Oil<br />
and Kerosene<br />
Electricity<br />
Natural Gas<br />
Note: TGI service territory would be embedded into the BC and Territories column.<br />
Source:<br />
http://www.oee.nrcan.gc.ca/corporate/statistics/neud/dpa/comprehensive_tables/index.cfm?fuseaction=Selector.showTree<br />
It is clear from the above figures that TGI’s business can be differentiated from the natural<br />
gas distribution business in a number of other Canadian jurisdictions in two ways: (1)<br />
natural gas has a lower penetration rate in the TGI service territory than in other Canadian<br />
jurisdictions including Ontario, Saskatchewan, Manitoba, and Alberta; (2) TGI faces similar<br />
competition from electricity to that of Quebec.<br />
Given this backdrop, three factors that influence natural gas use in space and water<br />
heating applications in the TGI service area are:<br />
1) Historical operating cost advantages of natural gas versus other energy sources<br />
(which is in decline).<br />
2) <strong>Terasen</strong>’s competitiveness with electricity versus other jurisdictions (which is in<br />
decline).<br />
3) Forward looking operating cost advantages of natural gas versus other energy<br />
sources (which are anticipated to decline).<br />
These factors are discussed below.<br />
3.1 Historical operating cost advantage of natural gas versus other energy<br />
sources is in decline:<br />
One of the challenges that TGI has faced in recent years, and which it will continue to<br />
face, is the relative price advantage vis-a-vis electricity (the difference between natural gas
Page 18<br />
Tab 1<br />
Business Risks<br />
rates and electricity rates) on an annual operating cost basis. Between 1998 and 2008,<br />
the price advantage of natural gas compared to electricity in B.C. declined from 63% to<br />
18% 27 .<br />
Annual operating costs for natural gas applications such as space and water heating may<br />
improve versus electrical alternatives for these applications in the coming years with the<br />
establishment of the BC Hydro Residential Inclining Block (“RIB”) rate that was<br />
implemented October 1, 2008. Natural gas requires an annual operating cost advantage<br />
compared to electricity to provide a payback on the up front equipment cost difference of a<br />
natural gas heated home and one that uses electric baseboards for space heating. As<br />
discussed above in Section 1.2, customers energy decision selection criteria is different<br />
than in the past and is evolving to the point where customers may be willing to forgo the<br />
potential economic benefit to them by using natural gas for space and water heating.<br />
Customers may select an energy alternative that cost more but is seen as helping to<br />
reduce the impacts of climate change.<br />
As shown in Figure 3.1.1, Figure 3.1.2 and Figure 3.1.3 below, natural gas enjoyed a<br />
substantial price advantage versus electricity in the late 1990’s throughout the three TGI<br />
regions (Lower Mainland, Inland and Columbia). In all three regions, the cost of natural<br />
gas to a customer in 1998 was less than half the cost of using electricity for the same<br />
applications.<br />
This price advantage relative to electricity has gradually declined as natural gas rates<br />
increased with rising commodity costs, while electricity rates remained relatively constant.<br />
The fundamental reasons for the increase in natural gas commodity prices relates to the<br />
tightening of the supply/demand balance over the last 15 years.<br />
In the 1990’s, the Western Canadian Sedimentary Basin (“WCSB”) experienced rapid<br />
growth in natural gas production capacity. This led to a “disconnect” in terms of lower<br />
prices in the WCSB as compared to other market prices in North America. The cause for<br />
this “disconnect” was that supply capacity growth in the WCSB outpaced the<br />
transportation capacity needed to move this new supply to market. This situation<br />
continued until new transportation pipelines were built with Foothills/Northern Border<br />
expansion projects in 1998 and the construction of the Alliance Pipeline in 2000. At this<br />
point, natural gas prices for the WCSB “reconnected” with prices in the rest of North<br />
America. This situation continues today as supply from WCSB lags behind the<br />
transportation capacity available to move gas out of this basin. In fact the WCSB is<br />
experiencing a decline in total natural gas supply.<br />
Historically gas supply from Northeast BC has been the supply source in BC and the US<br />
Pacific Northwest (“PNW”) region. Infrastructure has been built to move gas from<br />
Northern BC south via Westcoast Energy Inc. (“Westcoast”) to Northwest Pipeline and the<br />
I-5 corridor. In the late 1990s producers with production in Northeastern BC signed long<br />
term contracts with the Alliance pipeline which move natural gas into the US Midwest<br />
markets. Northeastern BC natural gas production is no longer dependent on BC and PNW<br />
markets, instead it can flow into Alberta, and then to eastern Canada and the US Midwest.<br />
See Figure 3.1 for details.<br />
27 Figures 3.1.1, Figures 3.1.2, and Figures 3.1.3, show <strong>2009</strong> but <strong>2009</strong> is not reflected in this calculation as<br />
the year is not complete and gas commodity may changes in the remaining months for <strong>2009</strong>.
MMcf/d<br />
4000<br />
3500<br />
3000<br />
2500<br />
2000<br />
1500<br />
1000<br />
500<br />
Page 19<br />
Tab 1<br />
Business Risks<br />
Figure 3.1: BC Production Increases Result in an Increase of BC Natural Gas<br />
Flowing into Alberta (MMcf/d)<br />
0<br />
BC Production and Flows into Alberta<br />
1996 1997 1998 1999 2000 2001 2002 2003 2004 2005 2006 2007 2008<br />
Year<br />
Deliveries to Alliance Deliveries to Nova & Ekwan<br />
Total BC Gas Production Deliveries into Alberta<br />
Natural gas production and processing in BC looks strong over the coming years with the<br />
recent discovery of shale and tight sands gas. In the past year Nova Gas Transmission<br />
Ltd. has announced three different proposals to move supply from BC into Alberta. These<br />
projects are projected, within five years, to transport as much natural gas as the<br />
Westcoast pipeline currently transports south. However, due to various pipeline<br />
expansion projects in the region that will move gas to Alberta and other eastern markets,<br />
there is a real danger that this new supply could bypass the Westcoast system. The<br />
resulting competition for commodity could lead to higher prices for the natural gas<br />
supplying BC and the US PNW.<br />
The decrease in the price advantage of natural gas also results from the relatively flat BC<br />
Hydro’s electricity rates over many years. Prior to 2004 BC Hydro was in an extended rate<br />
freeze period and its rates were not subject to BCUC oversight. During the rate freeze<br />
period BC Hydro was able to absorb its cost pressures with decreasing costs in other<br />
categories such as declining interest rates and with profits from electricity exports. In the<br />
meantime electric load has continued to grow beyond the supply capabilities of BC<br />
Hydro’s Heritage resources, necessitating the acquisition in recent years of new more<br />
costly supplies from independent power producers. However, BC Hydro’s rates are<br />
largely reflective of Heritage or historical costs of supply and continue to be among the<br />
lowest electricity rate in North America. With the establishment of the BC Hydro RIB rate,<br />
a customer’s electricity rates will be determined based on the consumption level at the<br />
particular residential dwelling. In principle the RIB is a splitting of the allocated historical<br />
costs for the residential class into two rates, with the rate for the second step being higher,<br />
in order to promote energy conservation.
Page 20<br />
Tab 1<br />
Business Risks<br />
Customers reaction and concern to the recent high and volatile natural gas prices can be<br />
demonstrated by BCOAPO’s recent statement in its final argument in the BC Hydro 2008<br />
LTAP proceeding, which states:<br />
“BCOAPO recognizes that <strong>Terasen</strong>’s current rate compares favorably<br />
against BC Hydro’s trailing residential rate. Right now, customers choosing<br />
natural gas for space and water heating are seeing a definite financial<br />
benefit as compared to their electricity-using counterparts. However, given<br />
the volatile natural gas prices, this could change at any time and customers<br />
would again find themselves in a situation where natural gas is no longer<br />
even the most economic choice.” 28<br />
This statement indicates that BCOAPO recognizes that its constituents could benefit from<br />
using natural gas in space and water heating now and possibly into the future but<br />
BCOAPO is worried about the long term cost and volatility of the natural gas prices.<br />
BCOAPO and other customers’ perceptions of future natural gas prices may have been<br />
altered recently with the oil pricing scenario that unfolded in 2008. On July 3, 2008 the<br />
NYNEX oil futures contract for August 2008 deliveries hit an all time high of $145<br />
US/barrel. This type of pricing event can shape customers perception of what the long<br />
term price for oil or natural gas may be and thus impact their investments and behavior<br />
towards energy choice.<br />
The steady erosion of the natural gas cost advantage relative to electricity increases TGI<br />
business risk because growth in the customer base and throughput is more challenging to<br />
achieve. Increases in natural gas prices incent customers to reduce their energy<br />
consumption or look for cheaper alternatives to meet their energy needs. Furthermore,<br />
gas commodity costs are market based and regularly adjusted in customer rates based on<br />
quarterly reviews. Both cases lead to reduced consumption levels on the natural gas<br />
system which negatively impacts TGI’s ability to recover its investment.<br />
As an example, the BC Energy Plan: A Vision for Clean Energy Leadership has a strong<br />
focus on energy conservation and efficiency. The province, as part of its efforts to<br />
implement the Energy Plan, has established the publicly funded LiveSmart BC program<br />
that provides incentives and rebates to residential and commercial customers who make<br />
investments in energy conservation equipment. Through such programs as LiveSmartBC,<br />
new energy alternatives such as air source heat pumps and ground source heat pumps<br />
are being introduced to consumers as alternatives to their traditional natural gas furnace<br />
for applications such as space heating. These types of programs are directed at helping<br />
consumers reduce their energy consumption and emissions, but they also change public<br />
perception and attitudes toward the mature service offering of natural gas. The changed<br />
public perception increases business risk as people increasingly turn to other alternatives<br />
to meet their space and water heating requirements over time.<br />
28 BCOAPO, Final Argument in BC Hydro 2008 LTAP, dated April 27, <strong>2009</strong>, page 8
Annual Bill<br />
$2,000<br />
$1,800<br />
$1,600<br />
$1,400<br />
$1,200<br />
$1,000<br />
$800<br />
$600<br />
$400<br />
$200<br />
$0<br />
Figure 3.1.1<br />
Residential Annual Natural Gas and Electric Energy Costs in the Lower Mainland<br />
1998 - <strong>2009</strong><br />
Assumes:<br />
Natural gas use of 95 GJ<br />
Efficiency of gas equipment is 90% relative to 100% for electricity<br />
<strong>Terasen</strong> Gas amount includes the basic charge<br />
BC Hydro amount does not include basic charge since a household already pays the basic electric charge for non-heating use<br />
*Calculated BC Hydro rate based on the F<strong>2009</strong>-2010 RRA approved increase of 8.74% (inclusive of the applicable 1% rate rider)<br />
Lower Mainland Residential Annual Bill History - Gas vs. Electric Comparison <strong>Terasen</strong> Gas Delivery and Commodity Charges<br />
Page 21<br />
Tab 1<br />
Business Risks<br />
Jan-98 Jan-99 Sep-99 Jan-00 Jul-00 Jan-01 Oct-01 Jan-02 Mar-03 Apr-03 Jan-04 Apr-04 Jul-04 Jan-05 Jul-05 Oct-05 Jan-06 Apr-06 Jul-06 Jan-07 Feb-07 Oct-07 Jan-08 Apr-08 Jul-08 Oct-08 Jan-09 Apr-09<br />
Delivery Midstream Cost Cost of Gas Carbon Tax BC Hydro Comparable Annual Bill BC Hydro Tier 1 BC Hydro Tier 2<br />
*
Annual Bill<br />
$1,600<br />
$1,400<br />
$1,200<br />
$1,000<br />
$800<br />
$600<br />
$400<br />
$200<br />
$0<br />
Assumes:<br />
Natural gas use of 75 GJ<br />
Efficiency of gas equipment is 90% relative to 100% for electricity<br />
<strong>Terasen</strong> Gas amount includes the basic charge<br />
BC Hydro amount does not include basic charge since a household already pays the basic electric charge for non-heating use<br />
*Calculated BC Hydro rate based on the F<strong>2009</strong>-2010 RRA approved increase of 8.74% (inclusive of the applicable 1% rate rider)<br />
Figure 3.1.2<br />
Residential Annual Natural Gas and Electric Energy Costs in the Interior<br />
1998 - <strong>2009</strong><br />
Inland Residential Annual Bill History - Gas vs. Electric Comparison <strong>Terasen</strong> Gas Delivery and Commodity Charges<br />
Page 22<br />
Tab 1<br />
Business Risks<br />
Jan-98 Jan-99 Sep-99 Jan-00 Jul-00 Jan-01 Oct-01 Jan-02 Mar-03 Apr-03 Jan-04 Apr-04 Jul-04 Jan-05 Jul-05 Oct-05 Jan-06 Apr-06 Jul-06 Jan-07 Feb-07 Oct-07 Jan-08 Apr-08 Jul-08 Oct-08 Jan-09 Apr-09<br />
Delivery Midstream Cost Cost of Gas Carbon Tax BC Hydro Comparable Annual Bill BC Hydro Tier 1 BC Hydro Tier 2<br />
*
Annual Bill<br />
$1,800<br />
$1,600<br />
$1,400<br />
$1,200<br />
$1,000<br />
$800<br />
$600<br />
$400<br />
$200<br />
$0<br />
Figure 3.1.3<br />
Residential Annual Natural Gas and Electric Energy Costs in the Columbia Region<br />
1998 – <strong>2009</strong><br />
Assumes:<br />
Natural gas use of 80 GJ<br />
Efficiency of gas equipment is 90% relative to 100% for electricity<br />
<strong>Terasen</strong> Gas amount includes the basic charge<br />
BC Hydro amount does not include basic charge since a household already pays the basic electric charge for non-heating use<br />
*Calculated BC Hydro rate based on the F<strong>2009</strong>-2010 RRA approved increase of 8.74% (inclusive of the applicable 1% rate rider)<br />
Columbia Residential Annual Bill History - Gas vs. Electric Comparison <strong>Terasen</strong> Gas Delivery and Commodity Charges<br />
Page 23<br />
Tab 1<br />
Business Risks<br />
Jan-98 Jan-99 Sep-99 Jan-00 Jul-00 Jan-01 Oct-01 Jan-02 Mar-03 Apr-03 Jan-04 Apr-04 Jul-04 Jan-05 Jul-05 Oct-05 Jan-06 Apr-06 Jul-06 Jan-07 Feb-07 Oct-07 Jan-08 Apr-08 Jul-08 Oct-08 Jan-09 Apr-09<br />
Delivery Midstream Cost Cost of Gas Carbon Tax BC Hydro Comparable Annual Bill BC Hydro Tier 1 BC Hydro Tier 2<br />
*
Page 24<br />
Tab 1<br />
Business Risks<br />
The continued decline in the operating cost advantage from 63% in 1998 to just 18% in<br />
2008 for natural gas versus its primary competition (electricity) combined with the lower<br />
capital and installation costs for electric baseboard heaters has created a challenging<br />
competitive market environment. The capital and installation costs for a new natural gas<br />
heating system typically range from three to four times higher than for electric baseboards.<br />
The difference in capital cost for heating equipment and ducting makes the simple payback<br />
to the potential natural gas customer extend over a long period of time or exceed the<br />
expected life of that equipment.<br />
As an example, in the BC Hydro Conservation Potential Review Summary Report (Fuel<br />
Switching: Residential Sector) dated November 20, 2007, BC Hydro determined that no fuel<br />
switching (electricity to natural gas) measures were achievable. 29 In other words, the<br />
measure payback period either exceeds the life of the measure or the measure never pays<br />
back the original investment. 30 Although TGI expressed some concerns with the study’s<br />
findings due to the methodology used in the study, BC Hydro has, in part due to the results<br />
contained in the study, changed its position on the use of natural gas for space and water<br />
heating. This is another example of how the actions and perceptions of others can increase<br />
business risk for TGI as the information provided to customers and potential customers<br />
affects how they perceive natural gas as an energy source.<br />
One of the reasons for the decline in the price advantage that natural gas has had against<br />
electricity is the manner in which these products are priced in BC. Natural gas commodity<br />
pricing for consumers in BC is market-based; in contrast a large percentage of the costs<br />
making up electricity rates are the low embedded costs of BC Hydro’s Heritage generation<br />
facilities. Please see Figure 3.1.4 below, which shows BC Hydro’s electrical rates are<br />
among the lowest in North America.<br />
29<br />
BC Hydro Conservation Potential Review 2007, Fuel Switching: Residential Sector, November 20, 2007, Page<br />
112, Achievable Potential is defined: The portion of savings identified in the Economic Potential that could<br />
realistically be achieved within the study period through government and utility-led interventions and programs<br />
given institutional, economic and market barriers.<br />
30<br />
BC Hydro Conservation Potential Review 2007, Fuel Switching: Residential Sector, November 20, 2007, page<br />
89, study was for new and existing measures.
cents per kWh (CAD)<br />
Page 25<br />
Tab 1<br />
Business Risks<br />
Figure 3.1.4: BC Hydro’s Electricity Rates are Among the Lowest In North America<br />
24<br />
20<br />
16<br />
12<br />
8<br />
4<br />
0<br />
Winnipeg<br />
Average Rate Comparison as of April 1, 2008 Across North America<br />
Seattle<br />
Montreal<br />
Vancouver<br />
Portland<br />
Rates are based on Hydro-Quebec's "Comparison of Electricity Prices in Major North American Cities"<br />
Seattle rates are based on Seattle City Light<br />
Miami<br />
Toronto<br />
Halifax<br />
Edmonton<br />
Residential Commercial Industrial<br />
San Francisco<br />
3.2 TGI competitiveness to electricity versus other jurisdictions in decline:<br />
Boston<br />
New York City<br />
TGI faces a higher level of price competition than other gas distribution utilities in Canada<br />
and the Pacific Northwest. Figure 3.2 below shows the natural gas versus electric price<br />
differential for TGI in the Lower Mainland and six other gas distribution companies, based on<br />
current residential customer rates. Other than Gaz Metro, the other gas distribution<br />
companies enjoyed a price advantage ranging from approximately 25% to 74% as<br />
compared with a 32% price differential for TGI. Of the comparison group, Gaz Metro has<br />
slightly lower rates than its electric counterpart. Similar to TGI and TGVI, Gaz Metro<br />
competes with a major hydro generation-based electric utility, but has higher allowed returns<br />
and equity thickness than does TGI.
Page 26<br />
Tab 1<br />
Business Risks<br />
Figure 3.2<br />
Comparison of Natural Gas versus Electric Price Advantage for Six Companies<br />
(<strong>2009</strong>)<br />
ANNUAL BILL -<br />
NATURAL GAS<br />
ANNUAL BILL -<br />
ELECTRIC<br />
*<br />
<strong>Terasen</strong> Gas (Lower Mainland) $1,118 $1,641 -32% lower<br />
Puget Sound Energy - Washington $1,476 $2,530 -42% lower<br />
Northwest Natural Gas - Oregon $1,604 $2,142 -25% lower<br />
Direct-Atco - Alberta $775 $2,979 -74% lower<br />
Union Gas - Ontario $1,010 $2,366 -57% lower<br />
Enbridge Gas - Ontario $875 $2,366 -63% lower<br />
Gaz Metro - Quebec $1,543 $1,574 -2% lower<br />
Notes:<br />
*Calculated BC Hydro rate based on the F<strong>2009</strong>-2010 RRA approved increase of 8.74% (inclusive of the<br />
applicable 1% rate rider)<br />
All rates are as at April 1, <strong>2009</strong>.<br />
All annual bills are best estimates based on the information available from each utility.<br />
GAS VS. ELECTRIC<br />
PRICE ADVANTAGE<br />
Annual Bills for natural gas and electric, for all territories, are based on an annual use rate of 95 GJ.<br />
The efficiency of gas equipment is assumed to be 90% relative to 100% for electricity to determine<br />
equivalent electricity. Lower gas efficiency appliances would result in lower gas price advantages than<br />
indicated above.<br />
The annual electric rates do not include the fixed monthly charges since it is assumed that a household<br />
already pays the basic electric charge for non-heating use.<br />
All rates are exclusive of applicable franchise fees and/or taxes (with the exception of the Carbon Tax).<br />
Interior BC community customers pay a franchise fee of approximately 3%, which would reduce the<br />
indicated price advantage of gas by a like amount.<br />
3.3 Forward looking operating cost advantage of natural gas versus other energy<br />
sources is likely to decline:<br />
Managing to remain competitive to the price of electricity in BC has become increasingly<br />
significant, particularly over the last few years with both increased natural gas prices and<br />
price volatility.<br />
Near term economic realities have improved the competitiveness of natural gas at this time.<br />
Market prices are currently depressed due to declining industrial demand, high storage<br />
balances and weaker crude oil prices.
Page 27<br />
Tab 1<br />
Business Risks<br />
Yet it is long-term factors that will have a greater influence on prices and volatility in years<br />
ahead, and such factors suggest that the competitiveness of natural gas will continue to<br />
erode. As mentioned in Section 3.1, one factor that will influence prices and volatility is the<br />
declining natural gas production in the WCSB. Other factors include: increasing demand for<br />
electricity produced from natural gas outside of BC, the potential for active hurricane<br />
seasons affecting the Gulf of Mexico producing region, and the possible greater reliance on<br />
imported liquefied natural gas (“LNG”) in the North American marketplace. Furthermore,<br />
future economic recovery and the associated increase in demand combined with the<br />
reduction in natural gas production forecast in <strong>2009</strong> could add to future market price<br />
volatility and potentially higher gas prices in the future. While the gap between forecast<br />
electricity rates and the current natural gas forward curve has widened in the short term,<br />
there is no guarantee that this widening gap will be permanent in nature, given the volatility<br />
in the North American energy markets and the fact that the actual costs of finding and<br />
development of new sources of natural gas exceeds current market prices.<br />
In the short term natural gas price compression with electricity has eased – but evidence<br />
suggests this improvement may be unsustainable. With the recent BC Hydro F<strong>2009</strong>/2010<br />
Revenue Requirements Decision, electricity rates have increased effective April 1, <strong>2009</strong>,<br />
improving natural gas’ competitive positioning with electricity, all else being equal. However,<br />
the magnitude of future electricity rate increases is uncertain as BC Hydro balances<br />
electricity self-sustainability and other government objectives going forward. Furthermore,<br />
while natural gas may be competitive with electricity rates on a variable basis, significantly<br />
higher capital costs for natural gas heating compared to electric space heating present a<br />
challenge for <strong>Terasen</strong> Gas in attracting new customers to offset the declining use rates of<br />
existing customers.<br />
The following graphs (Figure 3.3 and Figure 3.3.1) illustrate the recent volatility in natural<br />
gas commodity prices compared to the commodity component of the electric equivalent.
Figure 3.3: AECO Prices vs. Electric Equivalent Commodity Component<br />
Current Prices as of May 11, <strong>2009</strong><br />
Page 28<br />
Tab 1<br />
Business Risks<br />
Figure 3.3 indicates that at the current gas commodity price, and the current forecast gas<br />
commodity prices (forward curve), TGI has a competitive advantage against electricity on an<br />
operating cost basis over the next five years. However, the comparison in prices is absent<br />
any consideration of the required recovery of the up front capital cost difference between a<br />
natural gas heated home and a home heated by electricity.
Page 29<br />
Tab 1<br />
Business Risks<br />
Figure 3.3.1: AECO Prices vs. Electric Equivalent Commodity Component<br />
Prices as of July 2, 2008<br />
Figure 3.3.1 provides an indication of the volatility of natural gas commodity prices. The<br />
forward curve on July 2, 2008 was very different from and substantially higher than, the<br />
current forward curve. This graph illustrates the nature of the highly volatile natural gas<br />
marketplace in which <strong>Terasen</strong> Gas operates.<br />
Consumers’ energy sourcing decisions, and their perceptions of the relative merits of gas<br />
and electricity, are influenced by their views on price volatility and the possibility of<br />
significantly higher prices for fossil fuels in the future. This claim is support by BCOAPO’s<br />
statements referenced in Section 3.1. 31<br />
A comparison of the total delivered cost of gas for TGI versus electricity (but excluding<br />
capital cost considerations) over a 36 month period is illustrated in Figure 3.3.2 below<br />
31 “BCOAPO recognizes that <strong>Terasen</strong>’s current rate compares favorably against BC Hydro’s trailing residential<br />
rate. Right now, customers choosing natural gas for space and water heating are seeing a definite financial<br />
benefit as compared to their electricity-using counterparts. However, given the volatile natural gas prices, this<br />
could change at any time and customers would again find themselves in a situation where natural gas is no<br />
longer even the most economic choice.”
Page 30<br />
Tab 1<br />
Business Risks<br />
(based on current forward prices as of May 11, <strong>2009</strong> and standard market volatility<br />
assumptions). The gas cost projections in Figure 3.3.2 present the forecast cost of gas<br />
based on the current forward curve and reflect the existing hedged and un-hedged (floating)<br />
volumes in the portfolio for each gas year (Nov – Oct) shown. The chart provides two views<br />
for each gas year, the first bar in each pair (“With no market volatility”) reflects only the<br />
forward curve pricing and the second bar in each pair (“With upward market volatility”) adds<br />
a volatility adjustment factor of approximately 30 per cent to the floating volumes based on<br />
historical and current market conditions. As the graph illustrates, future market price<br />
volatility can have a significant impact on the unit cost of gas, as has been witnessed in the<br />
past, and therefore, adversely affect TGI’s competitiveness with electricity rates.<br />
$Cdn/GJ<br />
Figure 3.3.2: <strong>Terasen</strong> Gas Current Forecast Cost of Gas and Volatility Potential<br />
24<br />
20<br />
16<br />
12<br />
8<br />
4<br />
0<br />
With no<br />
market<br />
volatility<br />
<strong>Terasen</strong> Gas Forecasted Cost of Gas vs. Electric Equivalent<br />
With<br />
upward<br />
market<br />
volatility<br />
With no<br />
market<br />
volatility<br />
With<br />
upward<br />
market<br />
volatility<br />
With no<br />
market<br />
volatility<br />
Nov09-Oct10 Nov09-Oct10 Nov10-Oct11 Nov10-Oct11 Nov11-Oct12 Nov11-Oct12<br />
Unit Cost of Gas Carbon Tax<br />
Revenue Requirement Electric Equivalent Tier 1 Electric Equivalent<br />
Tier 2 Electric Equivalent<br />
With<br />
upward<br />
market<br />
volatility<br />
One might conclude from Figure 3.3.2 that at current forecast gas costs, TGI has a<br />
competitive advantage against the listed electricity equivalent rate comparisons on an<br />
operating cost basis.<br />
3.4 Natural Gas Needs an Operating Cost Advantage to Payback the Difference in<br />
Upfront <strong>Capital</strong> Costs<br />
As Figure 3.3 indicates TGI has a competitive advantage against electricity on an operating<br />
cost basis over the next five years using the current forward curve (as of May 11, <strong>2009</strong>).<br />
What is not apparent from Figure 3.3 is that TGI requires a significant operating cost
Page 31<br />
Tab 1<br />
Business Risks<br />
advantage to overcome the upfront capital cost differential for a natural gas versus an<br />
electrically heated home.<br />
As Figure 3.4 shows, the annual energy cost differential between a natural gas heated home<br />
and an electrically heated home must be more than $500 per year or $10.31 per GJ over the<br />
life of the asset, in order to offset the capital cost differential for natural gas equipment<br />
versus electric baseboards. These calculations are based on the assumptions outlined in<br />
Figure 3.4.<br />
Figure 3.4: Payback on <strong>Capital</strong> Costs Difference for a Natural Gas Heated Home 32<br />
Payback of <strong>Capital</strong> Costs (New Construction)<br />
Space Heating Requirement Only<br />
New Construction of home in Lower Mainland (2500 square feet in size)<br />
<strong>Capital</strong> Costs for High Efficent Furnace (90%) and ducting/installations $7,000.00<br />
<strong>Capital</strong> Cost for Electric Baseboards ($2,500.00)<br />
Difference in up front capital costs $4,500.00<br />
Interest Rate 0.06<br />
Measureable Life of Furnace (years) 18<br />
Amount that has to be recovered in operating cost annually to payoff difference in capital cost $415.60<br />
Add in furnace maintence costs per year $100.00<br />
Total ($) $515.60<br />
Energy consumptions for natural gas space heating (GJ's) 50<br />
Difference in cost that needs to exist between natural gas heated home and electricity heated<br />
home in $/GJ over 18 years<br />
$10.31<br />
When the capital cost differential of $10.31 per GJ is added to the numbers outlined in<br />
Figure 3.3, natural gas for space heating applications is not competitive relative to any of the<br />
electric rates outlined in Figure 3.3, even the Step 2 RIB rate. The disparity in the overall<br />
competitiveness of natural gas taking into account upfront capital costs is very concerning<br />
given that natural gas commodity prices are lower today than in recent years and are<br />
actually below the costs of finding and developing new natural gas supply resources which<br />
suggests that natural gas prices are bound to increase in the future.<br />
Natural gas used in space heating applications must have a significant operating cost<br />
advantage over a home heated with electricity, so that the difference in the up-front capital<br />
costs can be recovered. If natural gas does not have an operating cost advantage over<br />
electricity, natural gas will be challenged in being competitive with electricity over the long<br />
term.<br />
32 The 50 GJ used in this calculation relates to a new residential home located in lower mainland (2500 square<br />
feet). This 50 GJ is for space heating only and does not include other uses of natural gas in the home such as<br />
water heating or natural gas stoves. This 50 GJ is lower than the average Rate Schedule 1 use rate of 92.5<br />
GJ for 2008 because the 92.5 GJ is related to the total demand not just the space heating load. Also it<br />
reflects a decrease for the higher efficiencies of the new home and new furnace as compared to the existing<br />
stock of houses and furnaces.
4.0 Ability to Attach New Customers and Retain Customer Base At Risk<br />
Page 32<br />
Tab 1<br />
Business Risks<br />
A utility’s ability to manage risk is in part dependent on its ability to attach and retain<br />
customers. These factors are a significant influence on the throughput volume that will flow<br />
across the utility’s distribution system over the long term and will have a major effect on the<br />
long-term ability of the utility to recover its investment. In TGI’s case, the Company is<br />
capturing a declining percentage of the new housing starts in BC, TGI is also experiencing<br />
declining use rates for existing customers. These factors were occurring even before the<br />
provincial Energy Plan was announced, which has a strong focus on energy conservation,<br />
and therefore, this trend can reasonably be expected to accelerate.<br />
4.1 Housing Starts, Housing Mix, and Declining Net Customer Additions<br />
Throughput levels will be determined over the long term by the mix of customers and their<br />
use rates, any decline of which can only be offset by new customer additions.<br />
Customer additions are influenced by a number of factors, including the new construction<br />
market in British Columbia, and challenged by the shift in the housing market towards more<br />
higher-density housing types, and the price competitiveness trends discussed earlier.<br />
These factors contribute to the challenges TGI faces in maintaining its current customer<br />
base which contributes to an increased business risk.<br />
Despite relatively low mortgage rates and a population that continues to grow, the U.S.<br />
slowdown and ensuing collapse of the financial markets have resulted in a dramatic recent<br />
decline in the British Columbia housing market.<br />
Figure 4.1 below illustrates that housing starts declined steadily from 1993 to 2000, then<br />
began trending upward until reaching record levels in 2007. The decline in the US economy<br />
and global financial crisis that began in 2007 and accelerated during the latter half of 2008<br />
has certainly impacted British Columbia, and more specifically the housing market. The<br />
Canada Mortgage and Housing Corporation (“CMHC”) reported a 12% decline in housing<br />
starts from 2007 to 2008, and in the <strong>2009</strong> First Quarter Housing Market Outlook are<br />
projecting a one-third decline in housing starts for <strong>2009</strong> followed by an additional 9 per cent<br />
decline in 2010. In summary, the housing market has taken a significant turn for the worse,<br />
and a speedy recovery is not expected.<br />
The current projection for housing starts (<strong>2009</strong>) is 22,800 for British Columbia, and in 2010 a<br />
further decline is expected. Since 1994, the annual number of housing starts in British<br />
Columbia has averaged approximately 25,000 units. Therefore, current and future<br />
expectations for housing starts are lower than the long-term average. When the <strong>ROE</strong><br />
adjustment mechanism was introduced in BC in June 1994, annual new construction starts<br />
were in the 30,000 range (20% higher than the average experienced since 1994). And as<br />
noted, <strong>Terasen</strong>’s throughput retention is highly affected by housing start levels.
Housing Starts & Customer Additions<br />
40,000<br />
35,000<br />
30,000<br />
25,000<br />
20,000<br />
15,000<br />
10,000<br />
5,000<br />
0<br />
Figure 4.1<br />
New Construction Starts and <strong>Terasen</strong> Gas Net Customer Additions<br />
TGI/TGVI Combined: 1992 – 2008<br />
Page 33<br />
Tab 1<br />
Business Risks<br />
1992 1993 1994 1995 1996 1997 1998 1999 2000 2001 2002 2003 2004 2005 2006 2007 2008 <strong>2009</strong>F<br />
SFD MFD Customer Additions<br />
A shift in the housing market towards higher density housing types began in 1999, and<br />
multiple family dwellings have become the dominant housing type in BC (as illustrated in<br />
Figure 4.1 above). With high building material and land costs, and also declining<br />
affordability, the pool of potential single-detached new home buyers is shrinking. The<br />
average MLS price for the Greater Vancouver area is now almost $600,000 which puts this<br />
type of housing out of reach for many potential buyers, including first time buyers, especially<br />
in today’s challenging economy. First time homebuyers are typically purchasers with<br />
modest budgets that push them into the multiple family dwelling segments. Selection of<br />
electric space heating reduces upfront “non-visible” construction costs and allows higher<br />
expenditure allocations to aesthetic items. Code changes due to recently introduced safety<br />
requirements have resulted in approximately a doubling of costs for gas hot water tanks.<br />
This puts further pressure on natural gas as a fuel choice. Over the past five years,<br />
approximately two-thirds of all housing starts have been multiple units and <strong>Terasen</strong>’s<br />
capture rate in this segment is currently only 18%.
Figure 4.1.2<br />
New Construction Proportion of Single versus Multi Family Dwellings<br />
1999 – 2008<br />
Year Single Family Multi-Family<br />
1999 49% 51%<br />
2000 49% 51%<br />
2001 42% 58%<br />
2002 48% 52%<br />
2003 44% 56%<br />
2004 40% 60%<br />
2005 36% 64%<br />
2006 37% 63%<br />
2007 31% 69%<br />
2008 27% 73%<br />
Page 34<br />
Tab 1<br />
Business Risks<br />
In addition to price competitiveness, a significant driver of lower capture rates today versus<br />
the past is the higher proportion of new construction in multi-family versus single family<br />
units. While natural gas has experienced a high capture or penetration rate for single family<br />
units historically, electric baseboard heating has dominated multi-family construction units<br />
leading to lower capture rates in that market segment. With the supply of land on which to<br />
build new homes in urban centres diminishing, and with many single family dwellings being<br />
knocked down and replaced with multi-family dwellings (as they are demolished and rebuilt),<br />
there is a distinct trend towards more multiple family dwellings in the new construction<br />
housing mix (see Figure 4.1.2). Given this trend, it is reasonable to expect multiple family<br />
dwellings to become even more dominant in the future and with it further declines in<br />
customer capture rates.<br />
Declining customer attachments are problematic for existing customers because new<br />
customers mitigate part of the impact of declining use rates, as discussed below. With<br />
customer attachments falling combined with declining average use per customer, <strong>Terasen</strong> is<br />
facing increased competitive challenges on a delivered unit cost basis. Speaking more<br />
generally, over the past decade the challenge to mitigate declining use per customer and<br />
throughput loss has become more pronounced, and the business risk profile has increased.<br />
The price-driven competitive challenges are exacerbated by public policies such as the<br />
carbon tax and BC Energy Plan that, in the absence of comprehensive policies from<br />
government at all levels, discourage direct gas fired applications (even though they result in<br />
lower net emissions than applications where electricity is generated for space heating from<br />
far less efficient thermal generating stations). This also contributes to the increased<br />
business risk faced by the Company.<br />
4.2 Shift in Annual Demand (Declining Annual Use Rates)<br />
Even as <strong>Terasen</strong>’s overall capture rate of new potential customers is in decline, the<br />
Company is also experiencing declining use rates from the existing customer base.<br />
The annual use of natural gas by residential customers has declined steadily since the<br />
1990s and is forecast to continue to decline in the future. This decline is the result of a
Page 35<br />
Tab 1<br />
Business Risks<br />
combination of factors such as advances in gas appliance and construction technology,<br />
changes in housing and building space choice, increased volatility in the price of natural<br />
gas, and also customers increasing their awareness for the need of energy conservation.<br />
The chart below (Figure 4.2) shows the extent of this trend, where a reduction in TGI<br />
Residential use rates of 21.1% occurred between 1997 and 2008. A further decline of<br />
approximately 2% is forecast to occur by 2010. This decline in use rates places upward<br />
pressure on customers' delivery rates, and contributes to the compression of natural gas<br />
and electricity rates.<br />
Annual Use Rate (GJ/Customer)<br />
130<br />
120<br />
110<br />
100<br />
90<br />
80<br />
70<br />
60<br />
50<br />
Figure: 4.2: Residential Use Rate in Decline<br />
Residential Normalized Use Rates<br />
1997 1998 1999 2000 2001 2002 2003 2004 2005 2006 2007 2008<br />
As discussed above, the trend of declining use rates is expected to continue into the<br />
foreseeable future. The main drivers for this trend are the replacement of lower-efficiency<br />
natural gas furnaces with higher efficiency models and the evolution of building codes from<br />
an energy efficiency perspective. Changes to the building code in 1990 mandated midefficiency<br />
furnaces as the minimum requirement for homes, and recent changes to building<br />
code legislation now stipulate that high efficiency furnaces are required for new construction<br />
as of 2008 and for furnace replacements beginning in 2010. If all other variables are held<br />
constant, the effect of retrofitting less efficient furnaces with new high-efficiency units can be<br />
estimated to cause an annual decline in use per customer rates of approximately 0.9 GJ per<br />
year. The annual decline is anticipated to slow to 0.2 GJ per year beginning in 2020, once<br />
the bulk of the low-efficiency units have been phased out, absent any further efficiency<br />
improvements. Figure 4.2.1 below illustrates this impact.<br />
TGI<br />
TGVI
Avg Use Rate (GJ)<br />
65<br />
60<br />
55<br />
50<br />
45<br />
40<br />
<strong>2009</strong><br />
2010<br />
Figure: 4.2.1: Residential Use Rate Will Continue to Decline<br />
2011<br />
2012<br />
NG Furnace - 2005 B.C. Stock (SFD & Townhouses)<br />
2013<br />
2014<br />
0.9 GJ/yr decline<br />
2015<br />
End of Low Eff.<br />
Replacement<br />
2016<br />
2017<br />
2018<br />
2019<br />
Page 36<br />
2020<br />
2021<br />
2022<br />
0.2 GJ/yr decline<br />
Effect of Mid Eff.<br />
Replacement<br />
2023<br />
2024<br />
2025<br />
2026<br />
Tab 1<br />
Business Risks<br />
Consumers’ environmental awareness and their perceptions regarding fossil fuels and<br />
related climate change initiatives are also influencing energy choices. And these energy<br />
choices are being made by both the end users of natural gas and developers.<br />
For end users, as existing appliances reach the end of their lifecycle, customers are faced<br />
with a fuel choice. For developers of multi-family dwellings, there are strong capital cost<br />
incentives to install electric baseboard heating, as it is cheaper to install than natural gas<br />
infrastructure. In both instances, with no formal government policies regarding the right fuel<br />
for the right application, inappropriate decisions can be made which could significantly<br />
impact the demand for natural gas, thereby increasing business risk.<br />
TGI faces a considerable challenge in managing the effects of declining use rates that are<br />
caused by a combination of factors largely out of the direct control of TGI, such as market<br />
forces (i.e. commodity price movement) and customer behavior (i.e. lifestyle choice and<br />
environmental and pricing perceptions) as noted above. The long-term trend in declining<br />
use rates coupled with the desire of communities and consumers to move towards<br />
alternative, sustainable energy sources place an increasing pressure on TGI’s gas<br />
distribution business.<br />
While the revenue stabilization mechanism of TGI provides short term intra-year relief from<br />
declining use, it does not offset the fundamental competitive pressure that results from<br />
declining use, particularly when electricity pricing based on a very large historic hydro<br />
component is the primary alternative fuel. There appears to be no relief on the horizon<br />
available to TGI to mitigate the business risks from these factors.<br />
2027<br />
2028
Summary<br />
Page 37<br />
Tab 1<br />
Business Risks<br />
Climate change and energy consumption are subjects of enormous importance to British<br />
Columbians today and looking forward. In British Columbia the abundance and potential of<br />
renewable sources of electricity generation set the province apart from other jurisdictions<br />
where natural gas is distributed. Some have concluded by looking at BC in isolation that<br />
electricity should be used for space and water heating in the province and natural gas<br />
should be displaced from these applications. Based on structural changes in the<br />
marketplace and how customers and stakeholders perceive natural gas in this new<br />
environment, TGI’s competitive position and future prospects as a natural gas distributor<br />
have deteriorated as compared to 2005.<br />
British Columbians are presently not being encouraged by government policy or BC Hydro<br />
to use natural gas, and this increases business risks for TGI. Alternative energy sources<br />
such as ground source heat pumps and wind farm electricity generation, despite high capital<br />
costs, are being embraced by environmentally sensitive consumers and subsidized by<br />
governments. This is being done to reduce GHG emissions, and masks related costs to<br />
consumers through taxation. TGI supports sustainability initiatives through its Energy and<br />
Efficiency Conservation programs but sees a role for natural gas in the long term<br />
sustainability picture due to the advantages inherent in its physical properties, i.e. lowest<br />
emissions of the fossil fuels, no/low particulate matter, etc. Gas use should be encouraged,<br />
as the right fuel for the right application, but current government policies and initiatives<br />
provide consumers with a contrary message.<br />
So the gas distribution sector in British Columbia is adversely affected in two ways.<br />
Competition from BC Hydro erodes market share on price and lower capital costs, and<br />
competition from alternative energy sources is subsidized by government climate change<br />
initiatives. Consumer misperceptions and misinformation provided to consumers must be<br />
overcome by the gas sector in order to retain existing business and to continue attracting<br />
new customers to mitigate the impacts of customer use rate reductions.<br />
The competitive environment in which TGI operates today and expects to operate in the<br />
future, and the related business risks, are very different than those were when the automatic<br />
adjustment mechanism for <strong>ROE</strong> was introduced in 1994, and even since the business risks<br />
of TGI and the automatic adjustment mechanism were last reviewed by the Commission in<br />
2005. TGI believes that its business risks have increased over the period and warrant both<br />
a higher return on equity than the current formula produces and a more robust capital<br />
structure containing more equity. Even in the absence of the problems with the formula,<br />
<strong>Terasen</strong> Gas requires higher returns due to increased business risk. The lower than<br />
warranted returns related to the increase in TGI’s business risk are exacerbated by an<br />
automatic adjustment formula that has not produced appropriate results.
WRITTEN EVIDENCE<br />
OF<br />
DONALD A. CARMICHAEL<br />
for<br />
<strong>Terasen</strong> Gas Inc.<br />
May <strong>2009</strong>
1<br />
2<br />
3<br />
4<br />
5<br />
6<br />
7<br />
8<br />
9<br />
10<br />
11<br />
12<br />
13<br />
14<br />
15<br />
16<br />
17<br />
18<br />
19<br />
20<br />
21<br />
22<br />
23<br />
1) Introduction and Background:<br />
Written Testimony of<br />
Donald A. Carmichael<br />
Q1: Please state your name and business occupation.<br />
A1: My name is Donald A. Carmichael and I am a financial consultant and advisor.<br />
Prior to becoming a financial consultant, I worked in the investment banking<br />
industry for more than 30 years with Scotia <strong>Capital</strong> Inc., Richardson Greenshields<br />
Limited and McLeod Young Weir Limited. My work was principally focused on<br />
natural gas transmission and distribution companies as well as electricity generation,<br />
transmission and distribution companies in both the public and private sectors. I was<br />
responsible for advising clients on the appropriate terms and pricing of debt and<br />
equity securities, providing strategic advice regarding mergers and acquisitions and<br />
executing business on behalf of some of the firms’ most significant clients. This<br />
included advising both governments and corporations on strategic, regulatory and<br />
financing issues. I often participated in the marketing of debt and equity<br />
transactions to institutional investors, on behalf of my clients. I had extensive<br />
interaction with representatives of such lenders and investors in respect of the<br />
business profile of the issuer and the pricing of the issue.<br />
Since forming my consulting and advisory business, I have advised the following<br />
clients:<br />
In 2006, I appeared on behalf of the Coalition of Large Electricity Distributors (a<br />
group consisting of Toronto Hydro, Mississauga Hydro, Horizon <strong>Utilities</strong>,<br />
PowerStream <strong>Utilities</strong>, Ottawa Hydro and Veridian Corporation) before a Technical<br />
conference organized by the Ontario Energy Board (the “OEB”) to discuss new<br />
processes to regulate Ontario’s 90 local electricity distribution companies in a more<br />
1
1<br />
2<br />
3<br />
4<br />
5<br />
6<br />
7<br />
8<br />
9<br />
10<br />
11<br />
12<br />
13<br />
14<br />
15<br />
16<br />
17<br />
18<br />
19<br />
20<br />
21<br />
22<br />
23<br />
Written Testimony of<br />
Donald A. Carmichael<br />
streamlined fashion. I commented on the potential capital markets reaction to the<br />
OEB’s proposals to streamline the determination of the <strong>ROE</strong> as well as necessary<br />
levels of equity capital to finance utility investment.<br />
In 2007, I co-authored an expert report to the Nuclear Waste Management<br />
Organization regarding its long term funding program for the storage of nuclear<br />
waste produced by nuclear power reactors operating in Canada. In addition, I<br />
assisted Ontario Power Generation Inc. (“OPG”) in negotiating the financial<br />
parameters of a long term power purchase agreement between OPG and the Ontario<br />
Power Authority. I advised Toronto Hydro Corporation regarding the financing of<br />
certain non-regulated activities through subsidiary companies on a limited or non-<br />
recourse basis.<br />
During 2008, I advised OPG on various regulatory matters and strategies relating to<br />
its initial application to the OEB regarding the company’s regulated nuclear and<br />
hydraulic generating assets. I provided an opinion to OPG’s senior management<br />
team as to whether the applied for rate increase was reasonable in light of the risks<br />
which the regulated operations of the Company face and to provide on-going<br />
strategic and tactical input.<br />
Q2: What is your educational background?<br />
A2: I received my education at The University of Waterloo where I obtained an Honours<br />
Bachelor of Mathematics degree and at the Rotman School of Business at the<br />
University of Toronto where I achieved a Master of Business Administration with<br />
specializations in Finance and Operations Research.<br />
2
1<br />
2<br />
3<br />
4<br />
5<br />
6<br />
7<br />
8<br />
9<br />
10<br />
11<br />
12<br />
13<br />
14<br />
15<br />
16<br />
17<br />
18<br />
19<br />
20<br />
21<br />
22<br />
23<br />
Written Testimony of<br />
Donald A. Carmichael<br />
Q3: Have you appeared before regulatory boards in the past?<br />
A3: Over the course of my career, I have appeared before the National Energy Board<br />
(Interprovincial Pipe Lines Limited and Trans Mountain Pipe Line Inc.), the<br />
Canadian Radio-television and Telecommunications Commission (the BC<br />
Telephone Company Limited, Telesat and Teleglobe), the Alberta Energy and<br />
<strong>Utilities</strong> Board (AltaLink LLP), the OEB (Union Gas Inc., Ontario Hydro, Coalition<br />
of Large Distributors), the New Brunswick Public <strong>Utilities</strong> Board (New Brunswick<br />
Power Corporation) and the Board of Commissioners of Public <strong>Utilities</strong> of<br />
Newfoundland (Newfoundland and Labrador Hydro).<br />
Q4: What issues does your testimony address?<br />
A4: My evidence addresses the on-going concerns of debt and equity market participants<br />
regarding the method by which the return on common equity (“<strong>ROE</strong>”) of Canadian<br />
utilities such as <strong>Terasen</strong> Gas Inc. (“<strong>Terasen</strong> Gas” or the “Company”) is established.<br />
In particular, the determination of a utility’s <strong>ROE</strong> in many Canadian jurisdictions is<br />
based on a formulaic approach which adjusts a base <strong>ROE</strong>, usually set following a<br />
generic hearing, by a proportion of the difference between the forecast yields in long<br />
term Canada bonds during the utility’s test year to the forecast yield in the base year.<br />
In the case of utilities regulated by the British Columbia <strong>Utilities</strong> Commission (the<br />
“BCUC”), the formula is as follows:<br />
<strong>ROE</strong>T = 9.145% + .75 x (YLTCBT+ – 5.25%)<br />
Where<br />
<strong>ROE</strong>T is the return on deemed common equity in year T; and<br />
YLTCBT is the forecast yield on Long Term Canada bonds in year T.<br />
3
1<br />
2<br />
3<br />
4<br />
5<br />
6<br />
7<br />
8<br />
9<br />
10<br />
11<br />
12<br />
13<br />
14<br />
15<br />
16<br />
17<br />
18<br />
19<br />
20<br />
21<br />
22<br />
23<br />
Written Testimony of<br />
Donald A. Carmichael<br />
The BCUC adopted a formulaic approach in 1994 and has reviewed it periodically<br />
including 1997, 1999 and 2006 when it awarded an <strong>ROE</strong> of 9.145% to <strong>Terasen</strong> Gas<br />
based on a forecast long term Canada yield of 5.25%, an equity risk premium of<br />
approximately 390 basis points.<br />
Similar formulas have been employed by the Alberta <strong>Utilities</strong> Commission, the<br />
National Energy Board, and the Ontario Energy Board. The National Energy Board<br />
decided on the use of a formula in Decision RH-2-94 which when applied in 1995<br />
resulted in return on common equity of 12.25%. In concert with the almost<br />
continuous decline of yields on long Canada bonds, the RH-2-94 formula resulted in<br />
an <strong>ROE</strong> of 8.71% in 2008.<br />
Even prior to the major decline of long Canada yields in 2008 and <strong>2009</strong>, capital<br />
markets analysts and participants had commented that the <strong>ROE</strong>s resulting from the<br />
formulas and awarded in Canada have been at the lower end of the range of, or<br />
below, an acceptable rate of return on equity for utilities. This has resulted in less<br />
than adequate returns on common equity, insufficient equity risk premiums for<br />
common shareholders over the long term debt obligations of the utilities and weaker<br />
credit metrics for debt lenders. The erosion of the financial performance (lower<br />
returns on equity and cash flow generation) of Canadian utilities has been underway<br />
for an extended period of time without material changes to other important financial<br />
factors such as the degree of financial leverage.<br />
Recently credit rating agencies have high lighted their concerns regarding the weak<br />
state of credit metrics achieved by utilities such as <strong>Terasen</strong> Gas that are regulated<br />
with an <strong>ROE</strong> formula and have compared such utility’s lower metrics with those of<br />
4
1<br />
2<br />
3<br />
4<br />
5<br />
6<br />
7<br />
8<br />
9<br />
10<br />
11<br />
12<br />
13<br />
14<br />
15<br />
16<br />
17<br />
18<br />
19<br />
20<br />
21<br />
22<br />
23<br />
Written Testimony of<br />
Donald A. Carmichael<br />
U.S. utilities that the rating agencies believe to be comparable. Canadian utilities’<br />
financial performance lags the performance of U.S. based utilities. Analysis of<br />
utility <strong>ROE</strong>s in Canada and the U.S. indicates that Canadian utilities, on average, are<br />
awarded an <strong>ROE</strong> that is approximately 150 to 200 basis points lower than those of<br />
U.S. utilities of comparable business and financial risk, since the introduction of the<br />
formula approach in Canada.<br />
Q5: Is there a second issue which concerns capital market participants?<br />
A5: A second issue which has an impact on the utility’s ability to attract capital is that<br />
the “fair return” awarded to the utility is the product of the <strong>ROE</strong>, currently<br />
determined using a formula, and the common equity base of the utility judged to be<br />
appropriate from time-to-time by the regulator. According to a debt and equity<br />
analysts, <strong>Terasen</strong> Gas has a low <strong>ROE</strong> produced by the BCUC formula and one of<br />
the lowest awarded common equity base for regulated operations of any utility in<br />
Canada. These two factors combine to produce some of the lowest credit metrics of<br />
a major utility operating in Canada. These lower credit metrics such as earnings<br />
(EBIT and EBITDA) and cash flow (FFO) coverage of interest on long term debt<br />
obligations weaken the Company’s financial profile and can restrict its ability to<br />
access new long term debt and common equity capital. An increased common equity<br />
base would reduce the Company’s financial risk and could potentially offset the<br />
decline in the Company’s earnings and cash flow such that its access to debt funds<br />
remains relatively constant (i.e. earnings and cash flow coverage of interest<br />
obligations remain about the same and, with an increased common equity base, the<br />
debt to total capital and cash flow to total debt ratios may decline resulting in the<br />
5
1<br />
2<br />
3<br />
4<br />
5<br />
6<br />
7<br />
8<br />
9<br />
10<br />
11<br />
12<br />
13<br />
14<br />
15<br />
16<br />
17<br />
18<br />
19<br />
20<br />
21<br />
22<br />
23<br />
Written Testimony of<br />
Donald A. Carmichael<br />
Company likely maintaining its existing credit rating). Lenders and investors<br />
believe this process has moved too slowly for regulated utilities in Canada and,<br />
particularly in the last one to two years. Awarded <strong>ROE</strong>s have continued to fall<br />
directly with declining forecast long term Canada yields; however, the cost of utility<br />
debt and common equity have increased substantially resulting in weaker credit<br />
metrics for lenders and inadequate returns for shareholders.<br />
Utility equity bases in Canada have been consistently lower than those in the U.S.<br />
At this point, the financial performance of Canadian utilities, having lower <strong>ROE</strong>s<br />
and thinner common equity bases is significantly below the financial performance of<br />
U.S. based utilities. This puts Canadian utilities, such as <strong>Terasen</strong> Gas, at a distinct<br />
disadvantage in attracting funds as the Company must compete with these more<br />
highly equity capitalized U.S. and international utilities for debt and equity funding<br />
due to the globalization of and greater competition in the debt and equity capital<br />
markets.<br />
The recent re-pricing of corporate business and financial risks has increased the risk<br />
premiums required by both debt lenders and common equity investors; however,<br />
increased <strong>ROE</strong>s and improved coverage will not be generated by the formulas<br />
currently in use by regulators in Canada, as forecast yields on ten and thirty year<br />
Canada bonds have fallen quite significantly and the formulas incorrectly assume<br />
that utility <strong>ROE</strong>s should decline proportionately with the forecast Canada long bond<br />
yields. Meanwhile credit spreads for 30 year <strong>Terasen</strong> Gas bonds have ranged from<br />
285 to 420 basis points during <strong>2009</strong> compared to 113 to 128 basis points in 2005,<br />
dividend yields spreads for high quality preferred shares have increased from 150<br />
6
1<br />
2<br />
3<br />
4<br />
5<br />
6<br />
7<br />
8<br />
9<br />
10<br />
11<br />
12<br />
13<br />
14<br />
15<br />
16<br />
17<br />
18<br />
19<br />
20<br />
21<br />
22<br />
23<br />
Written Testimony of<br />
Donald A. Carmichael<br />
basis points to approximately 400 to 425 basis points over 5 year Canada bonds and<br />
trailing earnings and dividend yields have increased on the Toronto Stock Exchange<br />
and in other global equity markets.<br />
Certain equity analysts have suggested in the past that <strong>ROE</strong> formulas in use by<br />
regulators in Canada are “confiscatory and fail to meet the fair return standard”<br />
while others suggest that the formulas are now “broken”, in that under current<br />
financial market circumstances such formulas result in lower rates of return on<br />
common equity while all evidence indicates that capital markets require higher<br />
returns on corporate securities reflecting the re-pricing of risk which has taken place.<br />
Debt analysts have opined that <strong>ROE</strong> results produced by the formulas “have not<br />
reflected the real world increase in the cost of capital” and “the annual <strong>ROE</strong><br />
adjustment is not even yielding the right direction of change in the cost of capital”<br />
under current capital market circumstances (see Stephen Dafoe, Director Corporate<br />
Bond Research, Scotia <strong>Capital</strong> Inc. in a letter to the Ontario Energy Board dated<br />
April 17, <strong>2009</strong>).<br />
Q6: Have other regulators in Canada addressed the inadequate <strong>ROE</strong> and common<br />
equity base issue?<br />
A6: Yes. The recent National Energy Board decision regarding Trans Quebec and<br />
Maritimes Pipelines Inc. (RH-1-2008) reviewed the RH-2-94 formula, which is<br />
consistent with the BCUC formula, and addressed the issue of its continuing<br />
appropriateness. Under the RH-2-94 formula, TQM would have been awarded an<br />
<strong>ROE</strong> of 8.71% on a 30% common equity base for 2008. TQM applied to have the<br />
RH-2-94 formula set aside due to the fact that the formula produced unsatisfactory<br />
7
1<br />
2<br />
3<br />
4<br />
5<br />
6<br />
7<br />
8<br />
9<br />
10<br />
11<br />
12<br />
13<br />
14<br />
15<br />
16<br />
17<br />
18<br />
19<br />
20<br />
21<br />
22<br />
23<br />
Written Testimony of<br />
Donald A. Carmichael<br />
financial results for both lenders and shareholders. The resulting NEB decision<br />
states very clearly that:<br />
“In the Board’s view, changes that could potentially affect TQM’s cost<br />
of capital may not be captured by the long Canada bond yields and<br />
hence, may not be accounted for by the results of the RH-2-94<br />
Formula.”<br />
The NEB then chose to set aside the RH-2-1994 formula and adopt an after tax<br />
weighted average cost of capital (“ATWACC”) approach with no explicit common<br />
equity ratio assumed. However, based on a 40% common equity ratio (a 33.3%<br />
increase over TQM’s previously approved common equity component of 30%), the<br />
awarded 6.4 % ATWACC for 2007 and 2008 equated to <strong>ROE</strong>s of 9.85% and 9.75%,<br />
respectively. If the previously awarded common equity base of 30% is assumed, an<br />
ATWACC of 6.4% implies an <strong>ROE</strong> of 11.6%. The awarded ATWACC of 6.4%<br />
compares to a 5.5% ATWACC that would have been generated if the RH-2-1994<br />
formula had been applied for 2007 and 2008. The RH-2-1994 formula would have<br />
produced an <strong>ROE</strong> of 8.71% on a 30% common equity base or 289 basis points less<br />
than the implied 11.6% under the ATWACC methodology.<br />
Q7: Has the NEB or any other provincial regulatory body taken steps to review the<br />
appropriateness of continuing to apply a formula to determine a utility’s <strong>ROE</strong>?<br />
A7: Yes. In light of the NEB’s decision regarding TQM, it announced on March 23,<br />
<strong>2009</strong> that it was considering a review of the RH-2-94 decision and formula and<br />
asked that submission be made by May 25, <strong>2009</strong>. Similarly the OEB sought<br />
comments from interested parties regarding the cost of long term corporate utility<br />
8
1<br />
2<br />
3<br />
4<br />
5<br />
6<br />
7<br />
8<br />
9<br />
10<br />
11<br />
12<br />
13<br />
14<br />
15<br />
16<br />
17<br />
18<br />
19<br />
20<br />
21<br />
22<br />
Written Testimony of<br />
Donald A. Carmichael<br />
debt and the <strong>ROE</strong>s produced by its formula in a process which commenced on<br />
March 16, <strong>2009</strong> and was open for comment until April 17, <strong>2009</strong>. The OEB noted<br />
that its formula had produced results which suggested the spread between utility<br />
debt and common equity had declined from 247 basis points in 2008 to 39 basis<br />
points in <strong>2009</strong> and asked for submission to address adjustments which should be<br />
made to these results, if any.<br />
The Alberta <strong>Utilities</strong> Commission is undertaking a generic cost of capital hearing for<br />
2008 to review the review the continuing appropriateness of a formula based<br />
approach.<br />
Q8: Are there other financial issues related to a fair rate of return for <strong>Terasen</strong> Gas?<br />
A8: An additional and related issue which must be addressed by the BCUC is the<br />
deemed common equity base of <strong>Terasen</strong>’s utility operations, which at 35% is the<br />
lowest of major utilities in Canada, and which should be increased to at least 40%,<br />
as proposed by the Company, to reflect:<br />
• its very weak financial performance and substandard credit metrics which are<br />
currently rated by Moody’s as being below investment grade;<br />
• greater concern regarding the business environment in which <strong>Terasen</strong> Gas<br />
operates including more difficult market conditions, limiting of system<br />
throughput growth due to public policy initiatives favoring conservation and<br />
efficiency, competition from other sources of “green” energy and the likelihood<br />
of very much weaker economic conditions in the province due to the onset of a<br />
global economic slowdown;<br />
9
1<br />
2<br />
3<br />
4<br />
5<br />
6<br />
7<br />
8<br />
9<br />
10<br />
11<br />
12<br />
13<br />
14<br />
15<br />
16<br />
17<br />
18<br />
19<br />
Written Testimony of<br />
Donald A. Carmichael<br />
• the likelihood of a more negative view of the British Columbia regulatory<br />
environment developing particularly if a revised approach to the determination<br />
of an appropriate <strong>ROE</strong> and a significant increase in the Company’s common<br />
equity base are not adopted by the BCUC; and<br />
• heightened debt and equity capital market requirements including adequate<br />
returns and premiums for bearing risk, evidence of credit worthiness, financial<br />
strength (the ability to sustain unexpected events) and the stability of operating<br />
performance with adequate coverage for fixed obligations.<br />
The recommended increase in common equity base is not a substitute for an<br />
improved or revised mechanism to determine an appropriate <strong>ROE</strong> for the<br />
Company’s regulated operations. Both a higher <strong>ROE</strong> and a thicker common equity<br />
base are required for <strong>Terasen</strong> Gas in order to preserve its ability to attract capital on<br />
reasonable terms.<br />
Q9: How is your testimony organized?<br />
A9: My evidence is organized as follows:<br />
1) Introduction and Background<br />
2) Economic and <strong>Capital</strong> Market Conditions<br />
3) Discussion and Implications<br />
4) Conclusions<br />
10
1<br />
2<br />
3<br />
4<br />
5<br />
6<br />
7<br />
8<br />
9<br />
10<br />
11<br />
12<br />
13<br />
14<br />
15<br />
16<br />
17<br />
18<br />
19<br />
20<br />
21<br />
22<br />
23<br />
Written Testimony of<br />
Donald A. Carmichael<br />
Economic and <strong>Capital</strong> Market Conditions:<br />
Q10: Why is it necessary to review economic and capital market developments in<br />
order to consider the appropriateness of BCUC’s <strong>ROE</strong> formula?<br />
A10: The BCUC last considered the appropriateness of its <strong>ROE</strong> formula in the 2005 and<br />
rendered its decision in early 2006. Since then much has changed in the economic<br />
outlook, conditions in the capital markets and lenders’ and investors’ appetite for<br />
risk. These changes are significant and they are having a major impact on the capital<br />
market participants’ view of the appropriateness of the <strong>ROE</strong> adjustment mechanism,<br />
the credit implications for utilities in Canada and ultimately these utilities’ ability to<br />
access debt and equity capital on reasonable terms. In addition, capital markets have<br />
grown more competitive as Canadian investors have been given greater freedom to<br />
invest in the debt and equity securities of utilities based in foreign jurisdictions<br />
having the benefits of more liberal regulatory regimes and unregulated utility-like<br />
infrastructure companies offering higher returns and improved credit metrics.<br />
Q11: Please describe recent economic conditions?<br />
A11: Figure 1 overleaf presents Canada and U.S. real GDP quarter-over-quarter growth<br />
rates through 2008. Over the first half of the year, U.S. real GDP growth outpaced<br />
Canada’s growth, partly reflecting the impact of a temporary tax rebate in the U.S.<br />
Export growth also supported the U.S. economy over this period while Canadian<br />
exports declined significantly, reducing real GDP growth by approximately 1.4%.<br />
The weakness in Canadian exports stemmed from weak U.S. domestic demand and<br />
the impact of the appreciation of the Canadian dollar while the depreciation of the<br />
U.S. dollar lifted U.S. exports and reduced imports.<br />
11
1<br />
2<br />
3<br />
4<br />
5<br />
6<br />
7<br />
8<br />
9<br />
10<br />
11<br />
12<br />
13<br />
Written Testimony of<br />
Donald A. Carmichael<br />
However, over the second half of 2008, Canadian real GDP growth exceeded U.S.<br />
growth as consumer spending in the U.S. collapsed, U.S exports stalled and then<br />
declined in the third and fourth quarters, respectively. In the fourth quarter of 2008,<br />
Canada’s real GDP declined by 3.4% (its steepest decline since the first quarter of<br />
1991) and U.S. real GDP declined by 6.2% (its steepest decline since the first<br />
quarter of 1982).<br />
On a fourth-quarter-over-fourth-quarter (Q4/Q4) basis, which provides a better<br />
reflection of recent trend growth, Canadian real GDP declined by 0.7% and U.S. real<br />
GDP edged only slightly lower, declining by 0.8% in the final quarter of 2008.<br />
Thus, while the fourth quarter decline in the U.S was larger than Canada’s, the<br />
relatively stronger U.S. performance in the first half of the year narrowed the gap<br />
between Canada and U.S. real GDP on a Q4/Q4 basis.<br />
12
1<br />
2<br />
3<br />
4<br />
5<br />
6<br />
7<br />
8<br />
9<br />
10<br />
Written Testimony of<br />
Donald A. Carmichael<br />
Q12: What is the outlook for the Canadian economy in <strong>2009</strong>?<br />
A12: In January <strong>2009</strong>, private sector forecasters interviewed by the federal government<br />
expected that the Canadian economy would contract by 0.8 per cent in <strong>2009</strong>. This<br />
compares to a forecast of 0.3 per cent growth at the time of the November Economic<br />
and Fiscal Statement (Chart 2.21). Private sector forecasters believe that the<br />
Canadian economy entered a recession in the fourth quarter of 2008 (see Chart 2.22<br />
overleaf). Forecasters expect the recession to last three quarters with the deepest<br />
contraction occurring in the first quarter of <strong>2009</strong>. Output is expected to reach bottom<br />
in the second quarter of <strong>2009</strong> and to start recovering thereafter.<br />
13
1<br />
2<br />
3<br />
4<br />
5<br />
6<br />
7<br />
8<br />
9<br />
10<br />
Written Testimony of<br />
Donald A. Carmichael<br />
The recession was expected to be somewhat milder than the last two Canadian<br />
recessions and significantly less pronounced than the U.S. recession, which was<br />
forecast to be one of the deepest recessions in U.S. post-war history (see Chart 2.23<br />
overleaf). The outlook for GDP inflation in <strong>2009</strong> has been revised down to -0.4%.<br />
This mainly reflects downward revisions to the outlook for commodity prices<br />
stemming from the expected decline in global economic activity. The outlook for<br />
GDP inflation in 2010 has been revised down to 1.7%. Slower growth was expected<br />
to translate into an increase in the national unemployment rate to 7.5% and 7.7% in<br />
<strong>2009</strong> and 2010, respectively.<br />
14
1<br />
2<br />
3<br />
4<br />
5<br />
6<br />
Written Testimony of<br />
Donald A. Carmichael<br />
Q13: What economic conditions are expected in British Columbia?<br />
A13: Scotia Economics expects the BC economy to be weak with Real GDP growth<br />
declining to -0.3% and -2.2% in 2008 and <strong>2009</strong>, respectively while the<br />
unemployment rate increases from 4.6% in 2008 to 7.4% in <strong>2009</strong> (Global Forecast<br />
Update dated May 1, <strong>2009</strong>).<br />
15
1<br />
2<br />
3<br />
4<br />
5<br />
6<br />
7<br />
8<br />
9<br />
10<br />
11<br />
12<br />
13<br />
14<br />
15<br />
16<br />
17<br />
18<br />
19<br />
20<br />
21<br />
22<br />
23<br />
Written Testimony of<br />
Donald A. Carmichael<br />
Q14: Please describe developments in the debt capital markets since the Company’s<br />
last cost of capital application in 2005?<br />
A14: Since 2005, there have been two distinct phases of bond market trading. From the<br />
beginning of 2006 until September or October of 2008, the 30 year long Canada<br />
bond generally traded in a yield range of between 4.25% and 4.65%. These yields<br />
reflected a number of factors including experienced and anticipated low levels of<br />
inflation, a relatively strong Canadian dollar, continued improvement in the<br />
financial position and performance of the Government of Canada, actions taken by<br />
the Bank of Canada to improve the liquidity of the benchmark Canada bonds and the<br />
declining supply of such bonds due to the surpluses achieved by the federal<br />
government. In September and October 2008, yields on Canada bonds dropped<br />
significantly across the yield curve. This development in the bond market can be<br />
attributed to a so-called “flight to quality” as bond investors became substantially<br />
more pessimistic regarding the prospects for corporate credit. Lenders’ unease<br />
regarding corporate credit had first been indicated by widening interest rate spreads<br />
between government and corporate credit in the summer of 2007. Many debt market<br />
observers attribute the spread widening to falling values and prices in the U.S.<br />
housing market and the associated bad debt problems created for the sub-prime<br />
mortgage market in the United States. These credit issues were imported into<br />
Canada and caused the asset backed commercial paper market to collapse due to the<br />
suspicion that a number of asset portfolios were tainted with sub-prime loans of little<br />
or no value. Lenders were now confronted with growing uncertainties, greater risk<br />
in financial markets and the potential for a decline in global economic activity with<br />
16
1<br />
2<br />
3<br />
4<br />
5<br />
6<br />
7<br />
8<br />
9<br />
10<br />
11<br />
12<br />
13<br />
14<br />
15<br />
16<br />
17<br />
18<br />
19<br />
20<br />
21<br />
22<br />
Written Testimony of<br />
Donald A. Carmichael<br />
a corresponding negative impact on manufacturing activity and commodity prices.<br />
Lenders fled to more conservative investment vehicles.<br />
Chart 3.1<br />
30 Year Canada Bond Yield<br />
From 04/2005 to 04/<strong>2009</strong><br />
This flight to quality generated the sales of corporate bond portfolios and the re-<br />
investment in and increased demand for Canada treasury bills and bonds. As a<br />
result, yields on all Government of Canada bonds generally declined throughout the<br />
period as indicated in Chart 3.1 and in the table below:<br />
Average Canada Benchmark Yields<br />
5 Year 10 Year 30 Year<br />
Canada Canada Canada<br />
2005 3.57% 4.11% 4.46%<br />
2006 4.11 4.24 4.33<br />
2007 4.23 4.29 4.35<br />
2008 3.10 3.68 4.11<br />
<strong>2009</strong> (April 30) 1.82 2.92 3.70<br />
Source: Scotia <strong>Capital</strong> Inc.<br />
17
1<br />
2<br />
3<br />
4<br />
5<br />
6<br />
7<br />
8<br />
9<br />
10<br />
11<br />
12<br />
13<br />
14<br />
15<br />
16<br />
Written Testimony of<br />
Donald A. Carmichael<br />
Government of Canada benchmark bond yields have now approached 65 year lows<br />
in the face of low (or negative) economic growth expectations, extremely modest<br />
inflationary expectations and a reduction of Government of Canada investable bond<br />
product, given nine years of federal government surpluses and strong financial<br />
performance (Chart 3.2). As the federal government reduced its presence, the market<br />
experienced significant growth in the corporate bond market, bonds issued by<br />
foreign corporations in Canada and the growth of term securitizations over the<br />
period.<br />
Source: Public Works Canada<br />
Chart 3.2<br />
Dollar Value of Canada Bonds Outstanding<br />
And as a Percent of GDP<br />
Q15: Could you provide more details on the make-up of the Canadian bond market?<br />
A15: At December 31, 2007, Government of Canada bonds represented 22% of the total<br />
bonds outstanding, compared to Government of Canada bonds representing<br />
18
1<br />
2<br />
3<br />
4<br />
5<br />
6<br />
7<br />
8<br />
9<br />
10<br />
11<br />
12<br />
13<br />
Written Testimony of<br />
Donald A. Carmichael<br />
approximately 50% of total bonds outstanding in 1996. The corporate bond sector<br />
has grown consistently, as can be seen in Chart 2.<br />
Based on Statistics Canada surveys at December 31, 2007, life insurance companies<br />
and pension funds held about 24% of outstanding Canada bonds; other financial<br />
institutions, including investment dealers, mutual funds and property and liability<br />
insurance companies, held about 22%; followed by non-residents at 14% and<br />
chartered banks and near-banks at 12%. Non-resident holdings of Government of<br />
Canada bonds have declined by 10% in the period 1998 to 2007.<br />
Government of Canada bonds continue to be the most sought after and liquid<br />
investment in the market as 22% of the total bonds outstanding in the market<br />
account for approximately 80% of the secondary market trading (see Chart 18<br />
overleaf).<br />
19
1<br />
2<br />
3<br />
4<br />
5<br />
6<br />
7<br />
8<br />
9<br />
10<br />
11<br />
12<br />
13<br />
14<br />
15<br />
16<br />
Written Testimony of<br />
Donald A. Carmichael<br />
The share of secondary market trading of Government of Canada securities is highly<br />
concentrated, with primary dealers accounting for almost 90% of trading activity in<br />
2007–08. The ten most active participants in the federal securities secondary market<br />
represented over 94 per cent of trading activity.<br />
Q16: What has happened to corporate bond market conditions and spreads since<br />
2005 and, in particular, have utility bond spreads for <strong>Terasen</strong> Gas increased or<br />
decreased over the period?<br />
A16: Corporate bond spreads in Canada and the United States have widened particularly<br />
beginning in 2007 as the tightness in the credit markets began to develop reflecting<br />
major problems in the sub-prime mortgage market in the U.S. followed by lenders<br />
growing concern regarding a global economic slowdown and the slowdown’s<br />
impact on creditworthiness of borrowers. For well regarded issuers having a credit<br />
rating of at least A(low), the widening of credit spreads has more than fully offset<br />
the decline in government bond yields such that the new issue cost of longer term<br />
debt funds increased (see Chart 4 overleaf).<br />
20
1<br />
2<br />
3<br />
4<br />
5<br />
6<br />
7<br />
8<br />
9<br />
10<br />
11<br />
12<br />
13<br />
14<br />
15<br />
16<br />
17<br />
18<br />
Written Testimony of<br />
Donald A. Carmichael<br />
Chart 4<br />
Mid-Term Investment Grade<br />
Corporate Bond Spreads<br />
Corporate yield spreads in Canada were somewhat tighter than those in the U.S.<br />
during 2007 and 2008 as credit issues were a much greater concern in the U.S., due<br />
to sub-prime mortgage issues, the collapse of housing prices and the stronger<br />
performance of the Canadian economy in the first half of 2008 compared to the U.S.<br />
As exports to the United States collapsed, the Canadian manufacturing sector<br />
slowed significantly and many commodity prices collapsed in the second half of<br />
2008, credit spreads in Canada continued to escalate and market conditions became<br />
very difficult for lower grade credits. At times in late 2008 and early <strong>2009</strong>, the bond<br />
market was closed to issuers rated less than A- as credit concerns gripped the market<br />
and liquidity virtually disappeared.<br />
Utility bonds experienced a similar widening of credit spreads reflecting the re-<br />
pricing of risk by lenders. The following table sets out <strong>Terasen</strong> Gas average new<br />
issue credit spreads from 2005 to <strong>2009</strong>:<br />
21
1<br />
2<br />
3<br />
4<br />
5<br />
6<br />
7<br />
8<br />
9<br />
10<br />
11<br />
12<br />
13<br />
14<br />
15<br />
16<br />
17<br />
18<br />
19<br />
20<br />
21<br />
22<br />
23<br />
24<br />
25<br />
26<br />
27<br />
28<br />
29<br />
30<br />
31<br />
32<br />
33<br />
Written Testimony of<br />
Donald A. Carmichael<br />
<strong>Terasen</strong> Gas Inc.<br />
Indicative New Issue Credit Spreads<br />
5 Year 10 Year 30 Year<br />
(Basis points)<br />
2005 42 70 120<br />
2006 49 75 134<br />
2007 67 91 128<br />
2008 164 182 202<br />
<strong>2009</strong> (April 30) 274 283 305<br />
Source: Scotia <strong>Capital</strong> Inc.<br />
Each week, <strong>Terasen</strong> Gas obtains estimates of the prospective new issue spreads for its bonds<br />
from four of the primary investment dealers it utilizes for debt issuance. The banks provide<br />
estimates of the new issue credit spreads based on their analysis of the secondary trading<br />
spreads for existing issues and discussions with institutional investors who buy such debt to<br />
estimate the current credit spreads on new debt issuance by the major utilities including<br />
<strong>Terasen</strong> Gas. <strong>Terasen</strong> Gas relies on this information to time the launch of its credit issuance<br />
in the market as well as to set the offered yield.<br />
The interest rate spread on <strong>Terasen</strong> Gas bonds was relatively constant during 2005,<br />
2006 and 2007 but escalated in 2008. By <strong>2009</strong>, the spread on 10 year bonds had<br />
increased by more than 250% while the spread on <strong>Terasen</strong> Gas 30 year bonds<br />
increased by more than 140%.<br />
From 2005 to <strong>2009</strong>, <strong>Terasen</strong> Gas executed four long term debt financings. The first<br />
financing occurred on September 25, 2006 for an amount of $120 million at a yield<br />
of 5.55% or 136 basis points over the long Canada yield of 4.19% and a differential<br />
of 325 basis points between the awarded <strong>ROE</strong> of 8.80% and the yield on the<br />
debentures issued by <strong>Terasen</strong> Gas. The second 30 year debt financing occurred on<br />
October 2, 2007 for an amount of $250 million at a yield of 6.00% or 148 basis<br />
points over the long Canada yield and a differential of 237 basis points between the<br />
awarded <strong>ROE</strong> of 8.37%. An additional $250 million was raised on May 13, 2008 at<br />
a yield of 5.80% and a spread of 163 basis points over the 30 year long Canada yield<br />
and a differential of 282 basis points between it and the awarded <strong>ROE</strong> for 2008 of<br />
22
1<br />
2<br />
3<br />
4<br />
5<br />
6<br />
7<br />
8<br />
9<br />
10<br />
11<br />
12<br />
13<br />
14<br />
15<br />
16<br />
17<br />
18<br />
19<br />
20<br />
21<br />
22<br />
23<br />
24<br />
25<br />
Written Testimony of<br />
Donald A. Carmichael<br />
8.62%. The final long term debt financing occurred February 24, <strong>2009</strong> for an<br />
amount of $100 million with a yield of 6.55% or 285 basis points over the long<br />
Canada yield and a differential of only 192 basis points between the awarded <strong>ROE</strong><br />
and the new issue debt yield. Notwithstanding the fact that <strong>Terasen</strong> Gas had<br />
maintained it’s A- bond rating throughout the period, its borrowing spread over the<br />
long Canada bond increased by approximately 150 basis points (285 basis points<br />
versus 136 basis points), the new issue cost of its long term debt increased from<br />
5.55% in 2006 to 6.55% in <strong>2009</strong> and the differential between its awarded <strong>ROE</strong> and<br />
the long term debt new issue yield fell from 325 basis points to 192 basis points.<br />
The average required new issue yields for <strong>Terasen</strong> Gas increased over the 2005 to<br />
<strong>2009</strong> period as set out below:<br />
Average Required<br />
New Issue Yield<br />
5 Year 10 Year 30 Year<br />
2005 3.99% 4.81% 5.66%<br />
2006 4.60 4.99 5.67<br />
2007 4.90 5.20 5.63<br />
2008 4.74 5.50 6.13<br />
<strong>2009</strong> (April 30) 4.56 5.81 6.80<br />
Source: Scotia <strong>Capital</strong> Inc.<br />
At the long term end of the yield curve, the required average yield on 30 year debt<br />
financing has increased by approximately 114 basis points or 20% over the period<br />
2005 to <strong>2009</strong> while the <strong>Terasen</strong> Gas credit rating has remained constant. This<br />
reflects the re-pricing of risk by lenders.<br />
23
1<br />
2<br />
3<br />
4<br />
5<br />
6<br />
7<br />
8<br />
9<br />
10<br />
11<br />
12<br />
13<br />
14<br />
15<br />
16<br />
17<br />
18<br />
19<br />
20<br />
21<br />
22<br />
23<br />
Written Testimony of<br />
Donald A. Carmichael<br />
Q17: Does the flight to quality re-occur from time to time in the bond market?<br />
A17: Yes, such conditions occur with some regularity. A flight to quality occurred in<br />
1998 following the collapse of Long Term <strong>Capital</strong> Management, a United States<br />
based hedge fund and in 2002 following the sell off caused by the so-called tech<br />
bubble in Canada and the United States.<br />
Q18: Please describe conditions in the preferred share market, the direction of yields<br />
and the type of preferred share structures that have been issued in the period<br />
2006 to 2008?<br />
A18: There was a significant increase in the net new issuance of preferred shares in 2008<br />
compared to 2006 and 2007. In 2008, net new issuance amounted to $5.5 billion of<br />
preferred shares compared with $2.0 billion issued in 2007 and $2.2 billion in 2006.<br />
Virtually all preferred share financing in 2008 was carried out by financial<br />
institutions (banks and insurance companies) and, in the case of banks, such<br />
issuance was structured to increase their regulated Tier 1 capital without having to<br />
issue common shares. At the beginning of 2008, the preferred market was willing to<br />
accept perpetual preferred shares at increasing pre-tax equivalent spreads that<br />
reflected the growing concerns regarding the creditworthiness of the banking system<br />
in North America. As pre-tax equivalent spreads continued to widen throughout the<br />
year, the Rate Reset perpetual preferred share was re-introduced to the market. This<br />
structure offers investors an attractive dividend rate at the date of issue and an<br />
option at the call date if the shares are not called for redemption to convert to a new<br />
preferred share at a stated fixed reset rate expressed as a spread over the yield of a 5<br />
Year Canada bond on the reset/call date or to convert to a floating rate preferred<br />
24
1<br />
2<br />
3<br />
4<br />
5<br />
6<br />
7<br />
8<br />
9<br />
10<br />
11<br />
12<br />
13<br />
14<br />
15<br />
16<br />
17<br />
18<br />
19<br />
20<br />
21<br />
22<br />
Written Testimony of<br />
Donald A. Carmichael<br />
share. For the eighteen Rate Reset preferred share transactions carried out in 2008,<br />
Reset Rates ranged from 1.60% to 3.83% and averaged 2.40%, all over the 5 year<br />
Canada bond. By year end 2008, the initial preferred share coupons ranged from<br />
6.00% (Great West Lifeco, November 27, PFd1L to 6.50% (Bank of Montreal,<br />
December 11, PFD-1) with corresponding reset spreads of 3.07% and 3.83%,<br />
respectively. The most recently completed rate re-set preferred share transaction<br />
was carried out by Royal Bank of Canada (Pfd-1) at an initial dividend yield of<br />
6.1% for the initial 5 years of the transaction (a spread of 413 basis points over the 5<br />
year Canada bond) with an option to convert to a preferred share yielding 4.13%<br />
over the benchmark 5 year Canada bond, if the initial share is not called for<br />
redemption at that time.<br />
A key development in the preferred share market during 2008 was the widening of<br />
credit spreads in the bond market and a corresponding adjustment of offering and<br />
trading yields in the preferred share market. Preferred shares have historically been<br />
priced on a pre-tax equivalent yield, that is, on a pre-tax equivalent basis, does the<br />
yield on the new issue of preferred shares compensate the investor for the additional<br />
business and financial risk of the issuer when compared with the yield on equivalent<br />
term government of Canada bonds and when compared with the yield on similar<br />
term debt obligations of the issuer if such instruments are outstanding.<br />
In the past, investors in preferred shares of high quality issuers (Pfd-1) have required<br />
a spread of at least 150 basis points above the yield on similar term Canada bonds.<br />
During 2008, spreads have widened out materially to the 300 to 400 basis point<br />
25
1<br />
2<br />
3<br />
4<br />
5<br />
6<br />
7<br />
8<br />
9<br />
10<br />
11<br />
12<br />
13<br />
14<br />
15<br />
16<br />
17<br />
18<br />
19<br />
20<br />
21<br />
22<br />
23<br />
Written Testimony of<br />
Donald A. Carmichael<br />
range and currently utility preferred shares are trading to provide a yield to<br />
retraction of between 400 and 500 basis points.<br />
Another notable feature of the preferred share market in 2008 and <strong>2009</strong> was the fact<br />
that it was very credit sensitive allowing only highly rated issuers (Pfd-1 and Pfd-2)<br />
to attract new capital in the market place. These developments reflect investors’ re-<br />
pricing of the risk and are consistent with the widening of spreads in the bond<br />
market as well as the more junior position of preferred shares relative to the issuer’s<br />
debt securities.<br />
Q19: Please describe recent developments in Canadian and international stock<br />
markets?<br />
A19: The Toronto stock exchange enjoyed robust growth commencing in 2002, after<br />
correcting from the over-exuberant tech company valuations. In an environment of<br />
growing international trade, rising commodity prices, an appreciating Canadian<br />
dollar, historically low interest rates, excess capital markets liquidity, low inflation<br />
rates and stronger than expected corporate earnings growth, the S&P/TSX<br />
Composite Index rose from 7,648 on January 1, 2002 to a peak of 15,073 on June<br />
18, 2008, a compound annual growth rate of approximately 11%.<br />
The stock market then commenced a rapid and volatile collapse as the U.S. credit<br />
crisis which had emerged in early 2006 became much more serious, the outlook for<br />
the global economy diminished, commodity prices fell rapidly, international<br />
concerns regarding U.S. banks and financial institutions impacted the valuation of<br />
Canadian financial institutions and the Canadian industrial sector slowed<br />
dramatically reflecting a significant downturn in the economy of our largest trading<br />
26
1<br />
2<br />
3<br />
4<br />
5<br />
6<br />
7<br />
8<br />
9<br />
10<br />
11<br />
12<br />
13<br />
14<br />
15<br />
Written Testimony of<br />
Donald A. Carmichael<br />
partner. At March 26, the S&P/TSE Composite Index closed at 8,797, a decline<br />
from the peak of more than 41% in less than nine months (see Chart 5 below). The<br />
collapse of the market essentially erased the gains achieved over the previous six<br />
and one half years. The decline in the market was volatile and characterized by<br />
significant and sometimes record setting one and two day declines.<br />
Chart 5<br />
TSE Composite and Utility Index<br />
2004 to <strong>2009</strong><br />
Q20: Was the performance of the S&P/TSE Composite Index mirrored in the United<br />
States?<br />
A20: Yes; however, the loss of wealth has been greater in the U.S. as the S&P 500 Index<br />
has declined by approximately 25% over the 2004 to <strong>2009</strong> time frame (see Chart 6<br />
overleaf).<br />
27
1<br />
2<br />
3<br />
4<br />
5<br />
6<br />
7<br />
8<br />
9<br />
10<br />
11<br />
12<br />
13<br />
14<br />
Written Testimony of<br />
Donald A. Carmichael<br />
Chart 6<br />
TSE Composite versus S&P 500 Index<br />
2004 to <strong>2009</strong><br />
Q21: Has the volatility of stock markets increased with the declines experienced in<br />
the last nine months?<br />
A21: Yes. The volatility has clearly increased. The Chicago Board of Options Exchange<br />
Volatility Index (“VIX”) measures the implied market volatility of S&P 500 index<br />
options (see graph overleaf). "Implied Volatility" represents the volatility built into<br />
the price of an option in the market. Implied volatility is particularly important<br />
because it determines market consensus about the probable volatility of the<br />
underlying stock in the future. The higher the value of the index, greater the market<br />
volatility is implied and the higher the degree of market uncertainty.<br />
28
1<br />
2<br />
3<br />
4<br />
5<br />
6<br />
7<br />
8<br />
9<br />
10<br />
11<br />
12<br />
13<br />
14<br />
15<br />
16<br />
17<br />
18<br />
19<br />
20<br />
21<br />
Written Testimony of<br />
Donald A. Carmichael<br />
Weekly VIX Index Performance<br />
March 2005 to March <strong>2009</strong><br />
Source: Chicago Board of Options Exchange<br />
A significant escalation in the implied volatility has taken place in the last nine<br />
months with the index escalating from an average of approximately 15, during 2004<br />
to 2007, to a high of 89.5 in October 2008. This represents an increase of about 6<br />
times over the previous levels of implied volatility. Since the peak in October 2008,<br />
the implied volatility of the market has declined somewhat to approximately 45 or 3<br />
times the previous average.<br />
Q22: Is there a similar measure of volatility for the Toronto Stock Exchange?<br />
A22: The Montréal Exchange has introduced a new Implied Volatility Index (“MVX”)<br />
reflecting the market's expectation of how relatively volatile the stock market will be<br />
over the next month. MVX is calculated from current prices of at-the-money options<br />
on the iShares of the CDN S&P/TSX 60 Fund (XIU). The Montreal Exchange<br />
believes MVX is a good proxy of investor sentiment for the Canadian equity market:<br />
the higher the Index, the higher the risk of market turmoil. A rising Index therefore<br />
reflects the heightened fears of investors for the coming month.<br />
The MVX shows a very similar pattern as the VIX and, in particular, there is a<br />
significant upward move in implied volatility in September 2008 consistent with<br />
volatility in the United States.<br />
29
1<br />
2<br />
3<br />
4<br />
5<br />
6<br />
7<br />
8<br />
9<br />
10<br />
11<br />
12<br />
13<br />
14<br />
15<br />
16<br />
17<br />
18<br />
19<br />
20<br />
Written Testimony of<br />
Donald A. Carmichael<br />
Q23: Has the greater volatility in the markets effected investors’ valuations of<br />
common shares?<br />
A23: I believe that the increased volatility in the market and economic uncertainty has<br />
resulted in the decline of the market price/earnings ratio in Canada and the<br />
corresponding increase of the earnings yield (earnings/market price) over the last<br />
five years. The price/earnings ratio indicates what investors are willing to pay for a<br />
company’s earnings. Conversely the earnings yield indicates a stock’s return on<br />
market value. As the earnings yield increases, the cost of common equity increases.<br />
Conversely, as the earnings yield declines, the cost of common equity declines. The<br />
graph below indicates the earnings yield and the dividend yield for the S&P/TSE<br />
500 Composite Index have generally been rising since 2003 with marked increases<br />
in 2003 (following the collapse of the tech bubble), 2006 and 2008 (after the<br />
emergence of credit concerns, the broad decline of commodity prices and the<br />
outlook for global economic growth became decidedly negative). This trend<br />
indicates investors’ greater uncertainty regarding the economic outlook and the<br />
perception that companies are facing greater business and financial risks. For TSE<br />
composite companies, business risks have increased with greater global competition<br />
in the manufacturing sector, the rising value of the Canadian dollar which has<br />
impacted profitability in many industries and the rising cost of doing business in<br />
Canada.<br />
30
1<br />
2<br />
3<br />
4<br />
5<br />
6<br />
7<br />
8<br />
9<br />
10<br />
11<br />
12<br />
Yield (%)<br />
7.00<br />
6.00<br />
5.00<br />
4.00<br />
3.00<br />
2.00<br />
1.00<br />
-<br />
Written Testimony of<br />
Donald A. Carmichael<br />
S&P/TSE 300 Earnings Yield and Dividend Yields<br />
S&P/TSE 300 Dividend Yield S&P/TSE 300 Earnings Yield<br />
Weekly Values January 2004 to March <strong>2009</strong><br />
Q24: Even with the rising cost of common equity capital, valuations in the stock<br />
market continued to increase until mid-2008. Why did the increase in value<br />
continue?<br />
A24: A number of factors lead to higher valuations in Canada including continuously<br />
rising commodity prices for oil, gas, potash, base metals and precious metals (see<br />
Chart 2.20 on next page). Companies involved in these industries make up more<br />
than 45% of the value of the 300 Composite Index. Continued merger and<br />
acquisition activity in Canada based on the consolidation of various industries and<br />
hedge fund and private equity purchases funded by the liquidity of the domestic and<br />
international banking system (in particular, the proposed purchase of Bell Canada by<br />
the Teachers Pension Fund and others at a price that was substantially above the<br />
31
1<br />
2<br />
3<br />
4<br />
5<br />
6<br />
7<br />
8<br />
9<br />
10<br />
11<br />
12<br />
Written Testimony of<br />
Donald A. Carmichael<br />
public market price of BCE). Prior to 2008, the strong growth of earnings of<br />
Canada’s financial sector and other success stories such as the world wide<br />
acceptance of the “BlackBerry” also contributed to expanded valuations.<br />
Q25: Have any other major changes impacted Canadian investors and domestic<br />
capital markets in the last five years?<br />
A25: The globalization of Canadian capital markets and the removal of various personal<br />
and institutional restrictions on foreign investment have caused the Canadian and<br />
international capital markets to become substantially more integrated than in the<br />
past. Canadian institutional and retail investors have been freed from restrictions<br />
regarding their ability to invest in foreign securities as a result of pension fund<br />
legislation passed in 2005.<br />
32
1<br />
2<br />
3<br />
4<br />
5<br />
6<br />
7<br />
8<br />
9<br />
10<br />
11<br />
12<br />
13<br />
14<br />
15<br />
16<br />
17<br />
18<br />
19<br />
20<br />
21<br />
22<br />
23<br />
Written Testimony of<br />
Donald A. Carmichael<br />
Foreign property restrictions for Canadian pension funds, pension real estate and<br />
investment corporations, deferred income plans (including individual registered<br />
retirement savings plans) and other tax-exempt entities were introduced in 1971.<br />
Such restrictions limited the amount of “foreign property” these tax exempts could<br />
hold. Foreign property generally consists of shares, units and debt issued by non-<br />
resident entities, investments in most trusts and investments in most partnerships.<br />
The foreign property limit, which was originally set at 10%, was raised to 20% in<br />
1994 and then to 30% in 2001. The Income Tax Act (Canada) provided that tax<br />
exempts holding assets in excess of these foreign property limits were subject to a<br />
1% per month penalty tax.<br />
Following the changes in 2005, many of Canada’s largest institutional investors<br />
could invest in foreign securities without limit and, as a result, have become major<br />
players on international stock markets and non-Canadian private equity situations.<br />
Investors, such as the Ontario Teachers Pension Fund (“Teachers”), The Ontario<br />
Municipal Employee Retirement System (“OMERS”), The British Columbia<br />
Investment Management Corporation (“BCIMC”), the Canada Pension Plan<br />
Investment Board (“CPP”) and Alberta Investment Management (“AIM”), have bid<br />
for and won private equity opportunities in regulated utilities and utility-like but<br />
non-regulated situations in the U.S. and Europe. OMERS has announced its<br />
intention to diversify into private equity to reduce its exposure to the volatility of<br />
public stock markets and to increase its exposure to long term investments in utility-<br />
like infrastructure projects. To date, many of these infrastructure investment<br />
opportunities have been outside of Canada and have included assets such as gas and<br />
33
1<br />
2<br />
3<br />
4<br />
5<br />
6<br />
7<br />
8<br />
9<br />
10<br />
11<br />
12<br />
13<br />
14<br />
15<br />
16<br />
17<br />
18<br />
19<br />
20<br />
Written Testimony of<br />
Donald A. Carmichael<br />
electricity transmission, gas and electricity distribution systems in the United States,<br />
Europe and South America, airports in the United Kingdom, regulated drinking<br />
water and sewage water utilities in the U.K., container terminals in the United States<br />
and Canada and the Ontario land registry system.<br />
Retail investors were also granted much greater freedom to invest their self managed<br />
retirement savings plans in foreign equities under the same legislation.<br />
Greater competition has also emerged in the Canadian bond market as foreign<br />
issuers increased their issuance activity following the removal of limitations on<br />
foreign investments. The market in Canada for the new issuance of foreign bonds<br />
and debentures has grown rapidly reflecting the Canadians lenders desire to<br />
diversify their portfolios with new issuers and to achieve higher returns with similar<br />
or, in some cases, stronger credit metrics than those available from domestic issuers.<br />
Foreign issuance in the Canadian bond market has represented approximately 18.9%<br />
of the domestic new issue market from 2005 to 2008.<br />
In 2007, foreign issuance in the Canadian domestic bond market peaked at<br />
approximately 29%. The market was driven by Canadian lenders willingness to<br />
invest in these issues to broaden the diversification of their fixed income portfolios<br />
with new foreign names and by attractive Canadian dollar U.S. dollar swap spreads<br />
which made the transaction economic for treasurers of U.S. issuers to issue in<br />
Canadian dollars.<br />
34
1<br />
2<br />
3<br />
4<br />
5<br />
6<br />
7<br />
8<br />
Written Testimony of<br />
Donald A. Carmichael<br />
Q26: Is there another issue that may affect regulated utilities access to long term<br />
funding going forward?<br />
A26: The funding requirements for announced infrastructure projects in Canada will be<br />
massive and will compete with utility funding going forward. It is reasonable to<br />
anticipate that projects such as toll roads, bridges and urban transportation systems<br />
will be privately debt financed with some limited support by governments and will<br />
be directly competitive with debt and equity financing for utilities.<br />
35
1<br />
2<br />
3<br />
4<br />
5<br />
6<br />
7<br />
8<br />
9<br />
10<br />
11<br />
12<br />
13<br />
14<br />
15<br />
16<br />
17<br />
18<br />
19<br />
20<br />
21<br />
22<br />
23<br />
24<br />
25<br />
26<br />
2) Discussion and Implications:<br />
Written Testimony of<br />
Donald A. Carmichael<br />
Q27: Given current and expected capital market conditions, please discuss the<br />
appropriateness of the BCUC’s current approach to setting <strong>ROE</strong>s for <strong>Terasen</strong><br />
Gas Inc?<br />
A27: The formula used to determine <strong>Terasen</strong> Gas’s <strong>ROE</strong> for test year T is the <strong>ROE</strong> in the<br />
base year of 9.145% plus 75% of the difference of the forecast yields for a 30 year<br />
long term Canada bond in test year T minus the yield of the same 30 year bond in<br />
the base year (5.25%) or:<br />
<strong>ROE</strong>T = 9.145% + .75 x (YLTCT – 5.25%)<br />
Where,<br />
<strong>ROE</strong>T is the return on utility common equity in year T, and<br />
YLTCT is the forecast yield on a 30 year long Canada bond in year<br />
T.<br />
The initial <strong>ROE</strong> for <strong>Terasen</strong> Gas under the current formula was based on a 3.895%<br />
equity risk premium and a long term Canada yield of 5.25% for the test year 2006<br />
and was 9.145%. Since the March 2006 BCUC decision, the <strong>ROE</strong> has declined<br />
further to 8.47% in <strong>2009</strong> reflecting the decline of forecast long Canada yields of<br />
approximately 90 basis points over the period. However, since the <strong>2009</strong> <strong>ROE</strong> was<br />
set in November 2008, long Canada yields have declined significantly beyond the<br />
forecast yield of 4.35% for <strong>2009</strong> and are currently in the range of 3.60% to 3.65%<br />
(average of 3.67% in April <strong>2009</strong>). This yield on 30 year Canada bonds would result<br />
in the BCUC formula producing an <strong>ROE</strong> ranging from 7.90% to 7.95% under<br />
current market conditions.<br />
Meanwhile returns required on corporate securities have risen significantly<br />
reflecting the substantial increase in corporate interest rate spreads over Government<br />
36
1<br />
2<br />
3<br />
4<br />
5<br />
6<br />
7<br />
8<br />
9<br />
10<br />
11<br />
12<br />
13<br />
14<br />
15<br />
16<br />
17<br />
18<br />
19<br />
20<br />
21<br />
22<br />
23<br />
Written Testimony of<br />
Donald A. Carmichael<br />
of Canada bonds and a major increase in earnings yield experienced on the Toronto<br />
Stock Exchange and other major exchanges in the second half of 2008. These higher<br />
returns are required by utility investors and lenders in order to attract capital on<br />
reasonable terms. <strong>Terasen</strong> Gas long bond interest rate spreads peaked in January<br />
<strong>2009</strong> at approximately 390 to 400 basis points over the 30 year long term Canada<br />
bond. This interest rate spread was roughly equivalent to the equity risk premium<br />
judged to be appropriate by the BCUC in its <strong>ROE</strong> decision for <strong>Terasen</strong> Gas in 2006.<br />
Interest rate spreads have eased recently to the area of 280 to 290 basis points over<br />
the long Canada bond or about 150 basis points more than interest rate spreads in<br />
2006. The increase in corporate utility bond spreads has more than fully offset the<br />
decline in long Canada yields resulting in <strong>Terasen</strong> Gas having to pay 100 to 125<br />
basis points more for long term debt capital at the present time (<strong>Terasen</strong> Gas issued<br />
a thirty year bond in 2006 at a yield of 5.55% and completed a similar term<br />
financing in <strong>2009</strong> at a yield of 6.55%).<br />
High quality preferred share yields have increased from a pre-tax equivalent spread<br />
of 150 basis points over appropriate term Canada bonds in 2006 to a pre-tax<br />
equivalent spread of 400 to 425 basis points under current conditions. Investors’<br />
return requirements for common equity investments have also escalated reflecting<br />
economic developments over the past year including the credit crisis, the diminished<br />
outlook for growth in the global economy, the collapse of commodity prices and the<br />
much higher volatility of and the dramatic sell-off in global equity markets. The<br />
S&P/TSE 300 price/earnings ratio has declined substantially (from approximately<br />
21 times in 2006 to approximately 12.5 times in <strong>2009</strong>, or about 40%) and the<br />
37
1<br />
2<br />
3<br />
4<br />
5<br />
6<br />
7<br />
8<br />
9<br />
10<br />
11<br />
12<br />
13<br />
14<br />
15<br />
16<br />
17<br />
18<br />
19<br />
20<br />
21<br />
Written Testimony of<br />
Donald A. Carmichael<br />
required earning yield for the S&P/TSE 300 common stocks has increased from<br />
4.75% to approximately 8.00%. The S&P/TSE 300 dividend yield has risen from a<br />
low of 1.93% in 2006 to a current level of 3.7%. These developments demonstrate<br />
that the cost of common equity capital is rising.<br />
With regard to the BCUC’s <strong>ROE</strong> formula, there have been concerns for some time<br />
that the formulistic approach, employed by regulators in British Columbia and other<br />
jurisdictions in Canada, has been producing results that have not been high enough<br />
to preserve the financial integrity of utilities being regulated. BMO <strong>Capital</strong><br />
Markets, in a research analysis dated December 7, 2006 entitled “2007 <strong>ROE</strong>s<br />
Decline to Unprecedented Levels” commented that an <strong>ROE</strong> produced by the<br />
formula based <strong>ROE</strong> adjustment mechanism likely “violates the Fair Return Standard<br />
and is confiscatory”. The author of this report, Karen Taylor of BMO <strong>Capital</strong><br />
Markets, has recently become an executive advisor to the Chair of the Ontario<br />
Energy Board.<br />
Q28: Do the credit rating agencies and lenders in the debt capital markets have<br />
similar views regarding the financial performance of utilities regulated under<br />
an <strong>ROE</strong> formula?<br />
A28: Yes. Credit rating agencies have characterized the resulting <strong>ROE</strong>s as lower than<br />
comparable investments in other jurisdictions. Moody’s published the following<br />
table in 2008 reflecting the achieved financial performance of gas distribution<br />
companies that Moody’s rates as A3 in North America:<br />
38
1<br />
2<br />
3<br />
4<br />
5<br />
6<br />
7<br />
8<br />
9<br />
10<br />
11<br />
12<br />
13<br />
14<br />
15<br />
16<br />
17<br />
18<br />
19<br />
20<br />
21<br />
Written Testimony of<br />
Donald A. Carmichael<br />
Over the past three years, <strong>Terasen</strong> Gas has averaged an FFO (Funds from<br />
Operations) to Debt Ratio of 9.5%, an (FFO + Interest) to Interest ratio of 2.4x and<br />
an RCF (Retained Cash Flow) to Capex (<strong>Capital</strong> expenditures) ratio of 70%, which<br />
are clearly substantially below the levels achieved by other A3 utilities. Moody’s<br />
classifies <strong>Terasen</strong> Gas financial performance in the Ba credit category and indicates<br />
its methodology implied credit rating is Baa1. In its most recent credit rating report<br />
(dated May 27, 2008), Moody’s made the following comments regarding the<br />
financial performance of <strong>Terasen</strong> Gas:<br />
“TGI’s financial metrics are generally weaker than those of its A3 rated<br />
global LDC peers such as Piedmont Natural Gas Company, Inc., Northwest<br />
Natural Gas Company, Connecticut Natural Gas Corporation, Public<br />
Service Co. of North Carolina, UGI <strong>Utilities</strong> and sister Company, TGVI.<br />
Moody’s recognizes that TGI’s relatively weaker financial metrics are largely<br />
a function of the relatively low deemed equity and allowed <strong>ROE</strong> permitted by<br />
the BCUC. In general, Canadian deemed equity ratios and allowed <strong>ROE</strong>s are<br />
low relative to those of other jurisdictions and TGI’s are among the lowest in<br />
Canada. However, TGI’s A3 senior unsecured rating reflect Moody’s view<br />
that TGI’s relatively weaker financial metrics are offset to a significant<br />
degree by the supportiveness of the business and regulatory environments<br />
39
1<br />
2<br />
3<br />
4<br />
5<br />
6<br />
7<br />
8<br />
9<br />
10<br />
11<br />
12<br />
13<br />
14<br />
15<br />
16<br />
17<br />
18<br />
19<br />
20<br />
21<br />
22<br />
23<br />
Written Testimony of<br />
Donald A. Carmichael<br />
in which TGI operates. Moody’s rating methodology model for North<br />
American LDCs indicates a Baa1 rating for TGI which is one notch below<br />
the company’s A3, senior unsecured published rating assigned by Moody’s<br />
rating committee. TGI’s published rating exceeds the methodology-implied<br />
rating because Moody’s rating committee places greater emphasis on the<br />
supportiveness of TGI’s regulatory and business environments than the<br />
rating methodology model does. The methodology-implied rating falls<br />
within the one to two notch band that Moody’s rating methodologies aim to<br />
achieve.”(Emphasis added)<br />
Q29: Is a credit downgrading a significant risk for <strong>Terasen</strong> Gas and, if it did occur,<br />
what would be the consequences to the company?<br />
A29: The potential for a credit downgrading is an increasing risk for <strong>Terasen</strong> Gas, given<br />
its weak financial metrics and the heavy reliance by Moody’s and other analysts and<br />
credit rating agencies on the regulatory environment and the supportive business<br />
environment in British Columbia. Credit rating agencies and sophisticated lenders<br />
rank changes to the regulatory environment as the single largest risk faced by a<br />
utility. Therefore, major changes to regulatory methodologies which have been used<br />
for some time, whether such changes are positive or negative, often give rise to<br />
credit rating agencies and lenders doing a full review of the regulatory environments<br />
and policies used in different jurisdictions across the country. Moody’s and other<br />
debt market participants would likely question the regulatory supportiveness of a<br />
jurisdiction that would allow utility <strong>ROE</strong>s to decline below 8.00% as currently<br />
suggested by the BCUC formula, particularly if utilities in other jurisdictions in<br />
40
1<br />
2<br />
3<br />
4<br />
5<br />
6<br />
7<br />
8<br />
9<br />
10<br />
11<br />
12<br />
13<br />
14<br />
15<br />
16<br />
17<br />
18<br />
19<br />
20<br />
21<br />
22<br />
Written Testimony of<br />
Donald A. Carmichael<br />
Canada of similar risk are awarded <strong>ROE</strong>s, consistent with the TQM decision,<br />
ranging from 10.00% to 11.00% with substantially greater common equity under a<br />
different model. In particular, the British Columbia regulatory environment and the<br />
potentially weak credit metrics that could be awarded <strong>Terasen</strong> Gas will be viewed<br />
by lenders and credit rating agencies in light of the National Energy Board’s<br />
decision to set aside the RH-2-94 formula in determining the rates for TQM in its<br />
decision. The implied 9.75% <strong>ROE</strong> on a common equity base of 40% awarded to<br />
TQM indicates to investors and lenders how apparently out-of-touch with current<br />
realities the application of BCUC’s formula would be. Following the National<br />
Energy Board decision on TQM and the likely recognition by the NEB, OEB and<br />
AUC of the financially unacceptable results of the formulaic approach, credit rating<br />
agencies, lenders and investors would look for similar regulatory innovation and<br />
commensurate regulatory awards in British Columbia. If such innovation and<br />
increased awards are not forthcoming, the possibility of a credit downgrading for<br />
<strong>Terasen</strong> Gas and the migration of utility debt and equity capital from British<br />
Columbia to other more investor friendly jurisdictions increases.<br />
If, concurrent with questions arising about the quality of the regulatory environment,<br />
the business environment in British Columbia deteriorated significantly, as it has in<br />
the past two major recessions and as is currently forecast for 2010, credit rating<br />
agencies and lenders could re-consider the supportiveness of the business<br />
environment in British Columbia and could potentially reduce the credit rating of<br />
<strong>Terasen</strong> Gas or demand a higher interest rate spread.<br />
41
1<br />
2<br />
3<br />
4<br />
5<br />
6<br />
7<br />
8<br />
9<br />
10<br />
11<br />
12<br />
13<br />
14<br />
15<br />
16<br />
17<br />
18<br />
19<br />
20<br />
21<br />
22<br />
23<br />
Written Testimony of<br />
Donald A. Carmichael<br />
The loss of even one-third of a credit rating grade (i.e. one notch) would reduce<br />
<strong>Terasen</strong> Gas to a Baa1 credit category and, under current credit market conditions,<br />
its new issue spread would expand significantly (the ten year spread would increase<br />
by approximately 50 to 75 basis points), the available term to maturity would likely<br />
decline from thirty years to ten years and, even with the more onerous terms (shorter<br />
term to maturity and higher new issue yield), the availability of debt funds would<br />
likely be reduced. Many institutional lenders are restricted from investing in Baa<br />
credits or simply chose not to, as a matter of investment policy.<br />
Prior to the globalization of the capital markets, Canadian lenders, wanting long<br />
term utility bonds, had limited investment choices and were obliged to accept the<br />
weaker financial performance of <strong>Terasen</strong> Gas. Now the range of choices for<br />
Canadian lenders is much broader and includes, according to Moody’s, many<br />
utilities operating in the U.S. Canadian lenders’ now have an unlimited ability to<br />
invest in utility bonds issued by companies from the United States, many of which<br />
have much stronger credit metrics than utilities in Canada.<br />
Q30: Is there a similar dilemma for common equity investors in Canada?<br />
A30: Yes, there is. Utility rates of return on common equity in Canada have generally<br />
been less than those in the United States since the late 1990s, following the adoption<br />
of a formula based on long term Canada bond yields to determine utility rates of<br />
return by regulatory bodies in Canada. In a recent study commissioned by the OEB<br />
in June 2007, Concentric Energy Advisors (“Concentric”) reported that “the<br />
current <strong>ROE</strong> differential between Canada and the U.S. is in the range of 1.5%<br />
to 2.0% (i.e. 150 to 200 basis points).” Concentric found that, prior to the shift to a<br />
42
1<br />
2<br />
3<br />
4<br />
5<br />
6<br />
7<br />
8<br />
9<br />
10<br />
11<br />
12<br />
Written Testimony of<br />
Donald A. Carmichael<br />
formula derived <strong>ROE</strong> in Canada beginning in 1997 (Chart 2), Ontario and American<br />
“<strong>ROE</strong>s were in approximate parity” and that “while the specific characteristics<br />
of individual gas utilities and their respective regulatory environments can lead<br />
to differences in allowed returns, there are no apparent fundamental<br />
differences between gas utilities in Ontario and those in the U.S. that would<br />
cause the sizeable gap in <strong>ROE</strong>s. U.S. gas utilities are not demonstrably riskier<br />
than Canadian gas utilities.”<br />
These findings strongly suggest that utility common share investors in Canada, if<br />
acting prudently, should choose to invest in gas distribution utilities in the U.S.<br />
rather than similar utilities in Canada so long as their <strong>ROE</strong> is determined by a<br />
formula based only on forecast long term Canada yields.<br />
43
1<br />
2<br />
3<br />
4<br />
5<br />
6<br />
7<br />
8<br />
9<br />
10<br />
11<br />
12<br />
13<br />
14<br />
15<br />
16<br />
17<br />
18<br />
Written Testimony of<br />
Donald A. Carmichael<br />
Q31: Do recent changes in Canadian capital markets improve or exacerbate the<br />
problems with the BCUC’s formula?<br />
A31: Under current market circumstances, the BCUC’s return on equity formula would<br />
result in a further decline in the rate of return on common equity for <strong>Terasen</strong> Gas<br />
from 8.47% to a range of 7.90% to 7.95% (based on Q1 <strong>2009</strong> Consensus Forecasts<br />
of Long Canada bond yields) while all factual information from the capital markets<br />
indicates that investment risk has been re-priced at a higher level by investors. The<br />
re-pricing has resulted in credit spreads on high quality utility corporate bonds and<br />
high quality preferred shares increasing substantially. Investors are demanding<br />
higher returns in the form of higher earnings and dividend yields and lower<br />
price/earnings multiples to attract new common share investments. Stock markets<br />
have sold off dramatically to achieve investors’ escalated return requirements. These<br />
developments all indicate that the cost of common equity capital for <strong>Terasen</strong> Gas<br />
has risen.<br />
Q32: Please discuss the trend of the differential between the <strong>ROE</strong> awarded to<br />
<strong>Terasen</strong> Gas since 2006 and its cost of long term debt funds?<br />
A32: The table below sets out the trend of the differential between the <strong>ROE</strong> of <strong>Terasen</strong><br />
Gas and it debt new issue cost for thirty year long term debentures:<br />
44
1<br />
2<br />
3<br />
4<br />
5<br />
6<br />
7<br />
8<br />
9<br />
10<br />
11<br />
12<br />
13<br />
14<br />
15<br />
16<br />
17<br />
18<br />
19<br />
20<br />
21<br />
22<br />
23<br />
24<br />
Written Testimony of<br />
Donald A. Carmichael<br />
<strong>ROE</strong> Debt New<br />
Year Awarded Issue Yield Differential<br />
2006 9.15% 5.55% 3.60%<br />
2007 8.37 6.00 2.37<br />
2008 8.62 5.80 2.82<br />
<strong>2009</strong> 8.47 6.55 1.92<br />
2010F<br />
_________<br />
7.95(1) 6.40(2) 1.55<br />
(1) Based on long Canada yield of 3.60% to 3.65% (average yield of 3.67 in April<br />
<strong>2009</strong>).<br />
(2) Based on long Canada yield of 3.67% and <strong>Terasen</strong> Gas spread of 273 bps<br />
(average for April <strong>2009</strong>).<br />
If used to determine the <strong>ROE</strong> for <strong>Terasen</strong> Gas under current market conditions, the<br />
BCUC formula would require common share investors to accept a dramatically<br />
reduced differential of approximately 155 basis points between the yield on newly<br />
issued <strong>Terasen</strong> Gas debt (currently requiring a new issue yield in the range of 6.35%<br />
to 6.40%) and the <strong>ROE</strong> on its regulated equity (based on current long Canada yields,<br />
the return on equity would be 7.90% to 7.95%). This infers that long term debenture<br />
holders, at a more senior position in the capital structure compared to common<br />
shareholders, are able to negotiate a higher yield and risk premium (increasing from<br />
135 basis points to approximately 275 basis points) while the rate of return and risk<br />
premium for common shareholders over utility bond investors is contracting, as<br />
demonstrated in the following chart.<br />
45
1<br />
2<br />
3<br />
4<br />
5<br />
6<br />
7<br />
8<br />
9<br />
10<br />
11<br />
12<br />
13<br />
14<br />
15<br />
Written Testimony of<br />
Donald A. Carmichael<br />
The prospect of declining <strong>ROE</strong>s, declining spreads between debt and equity<br />
securities of the same utility issuers and the associated weakened financial<br />
performance of utility issuers during a period of difficult capital markets and<br />
restricted liquidity in the financial system, likely caused the National Energy Board<br />
to conclude in RH-1-2008:<br />
“In the Board’s view, changes that could potentially affect TQM’s cost of<br />
capital may not be captured by the long Canada bond yields and hence,<br />
may not be accounted for by the results of the RH-2-94 Formula.”<br />
The NEB then set aside the results of the RH-2-94 formula and accepted an entirely<br />
different regulatory framework for TQM.<br />
Q33: Is the formulaic approach supported by debt and equity analysts in the capital<br />
markets?<br />
A33: <strong>Capital</strong> markets observers and analysts have reached similar conclusions regarding<br />
the inadequacies of determining utility <strong>ROE</strong>s on the basis of formulas.<br />
46
1<br />
2<br />
3<br />
4<br />
5<br />
6<br />
7<br />
8<br />
9<br />
10<br />
11<br />
12<br />
13<br />
14<br />
15<br />
16<br />
17<br />
18<br />
19<br />
20<br />
21<br />
22<br />
23<br />
Written Testimony of<br />
Donald A. Carmichael<br />
RBC <strong>Capital</strong> Markets has published three different recent comments on <strong>ROE</strong>s<br />
expected to be derived from the return on equity formulas. RBC expects a 14 to 15<br />
basis point decline in awarded <strong>ROE</strong>s for <strong>2009</strong> followed by a much larger decline of<br />
approximately 67 basis points in 2010. RBC has stated that in its view “The<br />
Formula is Broken” and it recommends that investors should focus their<br />
investments in companies with the least exposure to an <strong>ROE</strong> that is derived from a<br />
formula based on changes to the forecast long Canada yield from a risk-reward<br />
perspective (January 16, <strong>2009</strong>).<br />
Scotia <strong>Capital</strong> has written extensively (five separate commentaries commencing in<br />
June 2008) regarding what it considers to be the drawbacks of the existing<br />
formulistic approach. Scotia <strong>Capital</strong> has called for changes due to the weak credit<br />
metrics produced by the formula and has pointed out the narrowing of the<br />
differential between utilities’ <strong>ROE</strong>s and their new issuance costs of long term debt<br />
financing. Scotia <strong>Capital</strong> points to the reduction of long Canada yields, in part, being<br />
caused by the reduction in the supply of ten and thirty year Canada bonds. In a<br />
letter to the OEB dated April 17, <strong>2009</strong>, Scotia <strong>Capital</strong> commented that the <strong>ROE</strong>s<br />
formulas “have not reflected the real world increase in the cost of capital” and<br />
“the annual <strong>ROE</strong> adjustment is not even yielding the right directional change<br />
in the cost of capital”.<br />
Q34: Has there been additional capital markets commentary regarding the<br />
appropriateness of formula derived <strong>ROE</strong>s?<br />
A34: BMO <strong>Capital</strong> Markets commented positively on the recent National Energy Board<br />
ruling for Trans Quebec and Maritimes Pipeline Inc. (March 23) as follows:<br />
47
1<br />
2<br />
3<br />
4<br />
5<br />
6<br />
7<br />
8<br />
9<br />
10<br />
11<br />
12<br />
13<br />
14<br />
15<br />
16<br />
17<br />
18<br />
19<br />
20<br />
Written Testimony of<br />
Donald A. Carmichael<br />
“The NEB’s decision equates to 9.85% and 9.75% returns on 40% deemed<br />
equity in 2007 and 2008, respectively.”<br />
“We view the NEB’s decision as positive from a corporate debt perspective,<br />
as it increases the company’s return on equity to 9.75% on 40% deemed<br />
equity. The increase in <strong>ROE</strong> should strengthen the financial profile of<br />
companies operating under this methodology, as cash flow generation<br />
should improve.”<br />
“We applaud the NEB for acknowledging that the RH-2-94 formula is no<br />
longer applicable given changes in business risk, financial markets and<br />
economic conditions.” and finally,<br />
“Overall, we view the NEB’s decision as positive from a corporate debt<br />
perspective, as it increases the company’s return on equity to 9.75% on<br />
40% deemed common equity or 11.6% on 30% deemed equity, which is<br />
significantly above the 8.71% (on a 30% common equity base) it would have<br />
obtained under the historical formula in 2008. The new methodology takes<br />
into account changes in economic and industry conditions and does not<br />
depend solely on the forecast of the Government of Canada bond yield.<br />
Furthermore, the increase in <strong>ROE</strong> should strengthen the financial profile of<br />
companies operating under this methodology over the medium term, as<br />
cash flow generation should improve.”<br />
48
1<br />
2<br />
3<br />
4<br />
5<br />
6<br />
7<br />
8<br />
9<br />
10<br />
11<br />
12<br />
13<br />
14<br />
15<br />
16<br />
17<br />
18<br />
19<br />
20<br />
21<br />
22<br />
23<br />
Written Testimony of<br />
Donald A. Carmichael<br />
Q35: Have other capital market concerns been identified for utilities subject to<br />
determination of their <strong>ROE</strong> based on a formula?<br />
A35: Yes. With the continuing decline of long Canada yields and resulting decline of<br />
awarded <strong>ROE</strong>s, the utilities’ cash flow has fallen due, in part, to the fact that<br />
common equity bases for regulatory purposes have increased only slightly when<br />
compared to the decline in <strong>ROE</strong>s. The decline in cash flow generated by the utility<br />
leads to weaker credit metrics (in particular, ratios based on Funds Flows from<br />
Operations) and the value of the business as the discounted value of future cash<br />
flows declines as well.<br />
Dominion Bond Rating Service (“DBRS”) made the following comment (March 20,<br />
<strong>2009</strong>) following the release of the recent TQM decision:<br />
“In the Decision, the NEB deviated from its previous methodology (see<br />
below), by setting a 6.4% after-tax weighted-average cost of capital<br />
(ATWACC) return (with no explicit deemed capital structure) for each of<br />
2007 and 2008. This compares to the 6.9% ATWACC return requested by<br />
TQM and the 5.5% ATWACC return that would have resulted if the NEB<br />
had retained its previous methodology. TQM agreed to assume the risk that<br />
the imbedded cost of debt could exceed the market-based cost of debt,<br />
which is relatively small at this time.<br />
Under the previous methodology, the Company had a relatively weak<br />
financial profile largely due to its low deemed equity component (30%) and<br />
low allowed return on equity (<strong>ROE</strong>) (8.46% in 2007 and 8.71% in 2008). In its<br />
application, TQM requested an increase in its deemed equity component to<br />
49
1<br />
2<br />
3<br />
4<br />
5<br />
6<br />
7<br />
8<br />
9<br />
10<br />
11<br />
12<br />
13<br />
14<br />
15<br />
16<br />
17<br />
18<br />
19<br />
20<br />
21<br />
22<br />
23<br />
Written Testimony of<br />
Donald A. Carmichael<br />
40%, which is in line with other Canadian pipelines regulated by the NEB,<br />
as well as an increase in allowed <strong>ROE</strong> to 11%, translating into a 6.9%<br />
ATWACC return.” (Emphasis added)<br />
At a deemed common equity base of 35%, <strong>Terasen</strong> Gas suffers from these same<br />
problems, namely a low <strong>ROE</strong> and an inadequate common equity base. This results<br />
in some of the lowest credit metrics for a major utility in Canada and a very wide<br />
discrepancy between utilities in the U.S. and <strong>Terasen</strong>, as noted by Moody’s analysis.<br />
In its 2005 Decision, the BCUC commented that an appropriate equity base for<br />
<strong>Terasen</strong> Gas fell in the range of 35% to 38% and determined that an appropriate<br />
level was 35% based on an awarded return of 8.80%. This decision has produced<br />
credit metrics equivalent to a Ba credit rating according to Moody’s and with a 35%<br />
common equity ratio, <strong>Terasen</strong> is the thinnest equity capitalized major utility in<br />
Canada. The BCUC should consider increasing <strong>Terasen</strong> Gas’s deemed equity base<br />
to at least 40% to achieve an appropriate stand alone financing structure for <strong>Terasen</strong><br />
Gas. Such an increase would be consistent with decisions in other Canadian<br />
regulatory jurisdictions (in particular, Ontario) which have chosen to increase the<br />
common equity bases of gas (36% common equity bases for Union Gas and<br />
Enbridge plus additional total equity in the form of preferred shares) and electric<br />
distribution companies (40%) for Toronto Hydro and other major LDCs). The<br />
increase would also recognize that <strong>Terasen</strong> Gas must compete for debt and equity<br />
funds against more thickly equity capitalized gas distribution companies from the<br />
U.S.<br />
50
1<br />
2<br />
3<br />
4<br />
5<br />
6<br />
7<br />
8<br />
9<br />
10<br />
11<br />
12<br />
13<br />
14<br />
15<br />
16<br />
17<br />
18<br />
19<br />
20<br />
21<br />
22<br />
3) Conclusions:<br />
Written Testimony of<br />
Donald A. Carmichael<br />
Q36: What conclusions have you drawn regarding the <strong>ROE</strong> formula employed by<br />
the BCUC?<br />
A36: Under current market conditions, the formula results are directionally incorrect. It<br />
would suggest that the <strong>ROE</strong> for <strong>Terasen</strong> Gas should be reduced to below 8.00%,<br />
notwithstanding the re-pricing of risk which the capital markets have carried out<br />
over the past twelve to eighteen months. The re-pricing of risk has increased<br />
corporate costs of capital in the corporate bond market, the preferred share market<br />
and the market for common stock investments. While corporate costs of capital<br />
increased, yields on long term Canada bonds have declined reflecting the general<br />
scarcity of such bonds and lenders eagerness to cut their risk exposure by selling<br />
corporate bonds and buying Canada bonds.<br />
The resulting declining yields in the long Canada market result in the BCUC’s<br />
formula producing a declining <strong>ROE</strong>. The difference between the formula derived<br />
<strong>ROE</strong> and the cost of newly issued debt by <strong>Terasen</strong> Gas has been reduced from<br />
approximately 360 basis points in 2006 (9.145% - 5.55%) to approximately 192<br />
basis points in <strong>2009</strong> (8.47% - 6.55%), a reduction of almost 47%. The notion<br />
suggested by the formula that the debt risk premium for a particular issuer can be<br />
rising while at the same time the issuer’s cost of common equity capital is falling<br />
would cause the capital markets to re-examine the proposition that <strong>Terasen</strong> Gas is<br />
subject to fair and stable regulation, particularly in light of the recent TQM decision<br />
by the National Energy Board, the anticipated broader application of the NEB<br />
51
1<br />
2<br />
3<br />
4<br />
5<br />
6<br />
7<br />
8<br />
9<br />
10<br />
11<br />
12<br />
13<br />
14<br />
15<br />
16<br />
17<br />
Written Testimony of<br />
Donald A. Carmichael<br />
approach to other utilities subject to its jurisdiction and expected changes to the<br />
calculation of an appropriate <strong>ROE</strong> in Alberta and Ontario by the capital markets.<br />
Q37: What are your conclusions regarding an appropriate common equity base for<br />
<strong>Terasen</strong> Gas?<br />
A37: I believe that the common equity base of <strong>Terasen</strong> Gas should be increased to at least<br />
40% in order to achieve reasonable credit metrics and maintain the current A- credit<br />
rating. This equity capitalization is still well below comparable gas distribution<br />
utilities in the U.S. with which the Company competes for debt and equity funding.<br />
Investors and credit rating agencies have historically been willing to accept the<br />
weaker financial performance of <strong>Terasen</strong> Gas due to relatively strong business<br />
conditions in British Columbia and a regulatory environment viewed to be<br />
somewhat supportive. With the likely decline in the BC economy in <strong>2009</strong> and 2010<br />
and the adoption of new and increased <strong>ROE</strong>s and capital structure levels by<br />
regulators in other Canadian jurisdictions to bring Canadian utilities more in line<br />
with U.S. based utilities as reflected in the NEB’s TQM decision, providers of long<br />
term capital and analysts will expect similar changes in the British Columbia<br />
regulatory regime.<br />
52
Opinion<br />
on<br />
<strong>Capital</strong> <strong>Structure</strong> and<br />
Fair Return on Equity<br />
Prepared for<br />
TERASEN GAS INC.<br />
Prepared by<br />
KATHLEEN C. McSHANE<br />
FOSTER ASSOCIATES, INC.<br />
May <strong>2009</strong>
TABLE OF CONTENTS<br />
I. INTRODUCTION AND EXECUTIVE SUMMARY 1<br />
A. INTRODUCTION 1<br />
B. EXECUTIVE SUMMARY 2<br />
II. TIME FOR A NEW BENCHMARK <strong>ROE</strong> 5<br />
III. THE FAIR RETURN STANDARD 18<br />
IV. FRAMEWORK FOR EVALUATION OF CAPITAL STRUCTURES AND<br />
<strong>ROE</strong>S FOR TGI 20<br />
A. RELATIONSHIP BETWEEN CAPITAL STRUCTURE AND <strong>ROE</strong> 20<br />
B. CONCEPT OF BENCHMARK UTILITY AND BENCHMARK <strong>ROE</strong> 22<br />
V. CAPITAL STRUCTURES FOR TGI 25<br />
A. PROPOSED CAPITAL STRUCTURE OF TGI 25<br />
B. PRINCIPLES FOR CAPITAL STRUCTURE DETERMINATION 25<br />
C. TRENDS IN BUSINESS RISK AND RELATIVE BUSINESS<br />
RISK OF TGI 31<br />
D. CHANGES IN REGULATED CAPITAL STRUCTURES OF<br />
CANADIAN UTILITIES 32<br />
E. BOND RATINGS AND CREDIT METRICS 33<br />
F. REASONABLENESS OF PROPOSED CAPITAL STRUCTURES 39<br />
VI. FAIR RETURN ON EQUITY 42<br />
A. APPROACH TO ESTIMATION OF RETURN ON EQUITY 42<br />
B. EQUITY RISK PREMIUM TESTS 43<br />
C. DISCOUNTED CASH FLOW TEST 63<br />
D. ALLOWANCE FOR FINANCING FLEXIBILITY 66<br />
E. COMPARABLE EARNINGS TEST 67<br />
F. FAIR RETURN ON EQUITY FOR TGI 72<br />
G. THE FAIR RETURN FOR TGI WITHIN THE ATWACC<br />
FRAMEWORK 72<br />
VII. AUTOMATIC ADJUSTMENT MECHANISM 78<br />
Page
1<br />
2<br />
3<br />
4<br />
5<br />
6<br />
7<br />
8<br />
9<br />
10<br />
11<br />
12<br />
13<br />
14<br />
15<br />
16<br />
17<br />
18<br />
19<br />
20<br />
21<br />
22<br />
23<br />
24<br />
I. INTRODUCTION AND EXECUTIVE SUMMARY<br />
A. INTRODUCTION<br />
My name is Kathleen C. McShane and my business address is 4550 Montgomery Avenue,<br />
Suite 350N, Bethesda, Maryland 20814. I am President of Foster Associates, Inc., an<br />
economic consulting firm. I hold a Masters in Business Administration with a concentration<br />
in Finance from the University of Florida (1980) and the Chartered Financial Analyst<br />
designation (1989).<br />
I have testified on issues related to cost of capital and various ratemaking issues on behalf of<br />
local gas distribution utilities, pipelines, electric utilities and telephone companies, in more<br />
than 190 proceedings in Canada and the U.S. My professional experience is provided in<br />
Appendix G.<br />
I have been asked by <strong>Terasen</strong> Gas Inc. (TGI) to: (1) assess the reasonableness of the<br />
Company’s proposed capital structure; and (2) recommend an allowed return on equity for<br />
TGI; and (3) to address the reasonableness of TGI’s proposal to fix the <strong>ROE</strong> for a period of<br />
time rather than propose an automatic adjustment mechanism at this time.<br />
3091 <strong>Terasen</strong> Foster Associates, Inc.<br />
Page | 1
25<br />
26<br />
27<br />
28<br />
29<br />
30<br />
31<br />
32<br />
33<br />
34<br />
35<br />
36<br />
37<br />
38<br />
39<br />
40<br />
41<br />
42<br />
43<br />
44<br />
45<br />
46<br />
47<br />
48<br />
49<br />
50<br />
51<br />
52<br />
53<br />
54<br />
55<br />
B. EXECUTIVE SUMMARY<br />
My conclusions are as follows:<br />
1. The existing automatic adjustment formula is clearly not producing returns that meet<br />
the fair return standard. The fair return and any automatic adjustment mechanism<br />
which is adopted for setting the allowed return on equity both need to be<br />
recalibrated.<br />
2. The sensitivity of the cost of equity to government bond yields is materially lower<br />
than the existing automatic adjustment mechanism implies. In addition, the cost of<br />
equity moves in the same direction as the utility cost of debt; this relationship has not<br />
been reflected in the automatic adjustment mechanism. As a result, the allowed<br />
<strong>ROE</strong>s have decreased over time to a much greater extent than is justified and<br />
recently have moved in the wrong direction. The application of the formula in<br />
current circumstances would produce a lower <strong>ROE</strong> at the same time that the utility<br />
debt costs and required credit premiums have increased, an outcome which is<br />
illogical.<br />
3. The allowed return for TGI must meet all three criteria of the fair return standard,<br />
including the comparable return standard. The fair return extends to both the capital<br />
structure and return on equity, that is, the overall return allowed must satisfy the fair<br />
return standard.<br />
4. Satisfying the comparable return standard requires consideration of returns available<br />
to comparable utilities in the U.S., given the similarity of operating and regulatory<br />
environments, the integration of the two capital markets, the small number of<br />
Canadian utilities with equity market data and the obvious circularity of comparisons<br />
limited to utilities that are all subject to the same <strong>ROE</strong> automatic adjustment<br />
mechanism.<br />
3091 <strong>Terasen</strong> Foster Associates, Inc.<br />
Page | 2
56<br />
57<br />
58<br />
59<br />
60<br />
61<br />
62<br />
63<br />
64<br />
65<br />
66<br />
67<br />
68<br />
69<br />
70<br />
71<br />
72<br />
73<br />
74<br />
75<br />
76<br />
77<br />
78<br />
79<br />
80<br />
81<br />
5. The capital structure and the return on equity are inextricably linked; the fair return<br />
on equity cannot be established without reference to the level of financial risk<br />
inherent in the capital structure adopted for regulatory purposes.<br />
6. TGI has proposed a capital structure with a common equity ratio of 40.0%. The<br />
proposed capital structure is reasonable in light of the increase in the Company’s<br />
business risks, the importance of maintaining the existing credit ratings, the trend<br />
toward stronger capital structures among other Canadian utilities, and the stronger<br />
capital structures and credit metrics of TGI’s U.S. peers, with whom TGI competes<br />
for capital and whose total returns form a basis for satisfying the comparable returns<br />
standard.<br />
7. The fair return on equity for TGI is estimated at 11.0%. The fair return for TGI<br />
reflects the following:<br />
a. The return on equity is based on the results of three tests, equity risk<br />
premium, discounted cash flow and comparable earnings.<br />
b. The equity risk premium test results are based on three separate approaches.<br />
The equity risk premium tests indicate the following costs of equity before<br />
adjustment for financing flexibility:<br />
Risk Premium Test Cost of Equity<br />
Risk-Adjusted Equity Market 8.75%<br />
DCF-Based 10.00%<br />
Historic Utility 10.5%<br />
Average 9.75%<br />
c. The discounted cash flow test, applied to a sample of benchmark low risk<br />
U.S. utilities, supports a cost of equity of 10.5-11.0% (midpoint of 10.75%).<br />
3091 <strong>Terasen</strong> Foster Associates, Inc.<br />
Page | 3
82<br />
83<br />
84<br />
85<br />
86<br />
87<br />
88<br />
89<br />
90<br />
91<br />
92<br />
93<br />
94<br />
95<br />
96<br />
97<br />
98<br />
99<br />
100<br />
101<br />
102<br />
103<br />
d. The allowance for financing flexibility should be, at a minimum, 0.5%. The<br />
addition of a 0.5% financing flexibility adjustment results in a cost of equity<br />
based on the market-based equity risk premium and DCF tests of<br />
approximately 10.25-11.25%.<br />
e. The comparable earnings test shows that, based on the achievable earnings<br />
returns of low risk competitive unregulated Canadian firms, whose<br />
reasonableness was corroborated by the returns of a sample of unregulated<br />
U.S. firms, a fair return applicable to a benchmark utility would be<br />
approximately 11.5-11.75%.<br />
f. With primary weight given to the capital market-based tests, equity risk<br />
premium and discounted cash flow, the fair return on equity for TGI is<br />
11.0%.<br />
8. TGI is proposing not to implement an automatic adjustment mechanism at this time.<br />
This proposal is reasonable given (1) the abnormally low Government of Canada<br />
bond yields and (2) the critical importance of the relationship between the base <strong>ROE</strong><br />
and the construction of the formula.<br />
3091 <strong>Terasen</strong> Foster Associates, Inc.<br />
Page | 4
104<br />
105<br />
106<br />
107<br />
108<br />
109<br />
110<br />
111<br />
112<br />
113<br />
114<br />
115<br />
116<br />
117<br />
118<br />
119<br />
120<br />
121<br />
122<br />
123<br />
124<br />
125<br />
126<br />
127<br />
128<br />
129<br />
130<br />
131<br />
132<br />
II. TIME FOR A NEW BENCHMARK <strong>ROE</strong><br />
For 15 years, the allowed <strong>ROE</strong>s for the utilities regulated by the BCUC have been set using<br />
an automatic adjustment formula. While the formula has been amended several times, its<br />
defining element has consistently been its reliance on long-term Canada bond yields to set<br />
allowed <strong>ROE</strong>s. As most recently amended in March 2006, the automatic adjustment<br />
formula changes the allowed <strong>ROE</strong> by 75% of the change in forecast long-term Canada bond<br />
yields. If the formula were applied using the long-term government of Canada bond yield of<br />
3.6% based on the March <strong>2009</strong> Consensus Forecast, the benchmark low risk utility allowed<br />
<strong>ROE</strong> would be 7.9%. In its <strong>ROE</strong> and <strong>Capital</strong> <strong>Structure</strong> Decision dated March 2006, the<br />
BCUC concluded that, should the automatic adjustment mechanism result in an <strong>ROE</strong> for the<br />
low risk benchmark utility of less than 8%, the Commission would canvass the views of the<br />
parties on whether the automatic adjustment mechanism should be reviewed.<br />
Since the inception of the formula in Canada in the mid-1990s, 1 the allowed <strong>ROE</strong>s for BC<br />
utilities, as well as for utilities in other Canadian jurisdictions, have tracked the downward<br />
trend in long-term Canada bond yields. Although the formula has been reviewed three<br />
times, comprehensively, by the British Columbia <strong>Utilities</strong> Commission (BCUC) since the<br />
formula was originally adopted (in 1997, 1999 and 2006), the overriding factor determining<br />
the allowed <strong>ROE</strong> has been the downward trend in long-term Canada bond yields, rather than<br />
factors which directly drive equity return requirements. Between 1995 and <strong>2009</strong>, the<br />
forecast long-term Canada bond yield has fallen by 475 basis points; the corresponding<br />
allowed <strong>ROE</strong> for the benchmark BC utility has fallen by 350 basis points, that is, by<br />
approximately 75% of the decline in long-term Canada bond yields. With the widespread<br />
adoption of similar automatic adjustment formulas, allowed <strong>ROE</strong>s in Canada have<br />
converged to a relatively narrow range. Moreover, with virtually all major Canadian utilities<br />
1 The British Columbia <strong>Utilities</strong> Commission introduced the first formula (Order G-35-94, In the Matter of<br />
Return on Common Equity BC Gas Utility, Pacific Northern Gas, West Kootenay Power, June 1994).<br />
3091 <strong>Terasen</strong> Foster Associates, Inc.<br />
Page | 5
133<br />
134<br />
135<br />
136<br />
137<br />
138<br />
139<br />
140<br />
141<br />
142<br />
143<br />
144<br />
145<br />
146<br />
147<br />
148<br />
149<br />
150<br />
151<br />
152<br />
153<br />
154<br />
155<br />
156<br />
157<br />
158<br />
159<br />
160<br />
161<br />
subject to a similar formula, comparisons among the <strong>ROE</strong>s as a “reasonableness check” are<br />
subject to such an extensive degree of circularity as to make such comparisons of little or no<br />
value.<br />
The decline in long-term Canada bond yields experienced during the past 15 years reflects in<br />
large part a sea change in the Canadian economy characterized by a shift from huge<br />
government deficits and indebtedness to an unbroken string of government surpluses<br />
(commencing in 1997) and a steady reduction in the relative (to the size of the economy)<br />
amount of debt outstanding. 2 With the vast improvement in the government’s finances and<br />
the reduction in government debt outstanding relative to the size of the economy came the<br />
decline in long-term Canada bond yields. The secular decline in long-term Canada bond<br />
yields reflects three factors: a reduction in the expected rate of inflation over the longer-<br />
term, the waning of investors’ fear that inflation would reignite to levels experienced in the<br />
1980s decade, and a declining supply of long-term government debt relative to demand.<br />
Of these three factors, only the decline in the expected rate of inflation over the longer-term<br />
would directly translate into a corresponding decline in the cost of equity. The fear that<br />
inflation would reignite had taken the form of a premium that investors required to “lock in”<br />
investment in long-term bonds with fixed coupon rates. Investors in equities, in contrast, are<br />
not similarly locked in and thus equity investors did not demand the same “lock in”<br />
premium. In contrast to the fixed rates on debt, corporate earnings, which ultimately<br />
determine the returns to equity investors, are better able to keep pace with the rate of<br />
inflation. The elimination of the “lock in” premium as inflationary fears waned lowered the<br />
risk associated with investment in long-term government bond yields. In the absence of a<br />
commensurate decline in the cost of equity, the result was an increase in the market equity<br />
risk premium.<br />
With respect to the third factor, strong demand for long-term government debt by<br />
institutions, particularly those seeking to match the duration of their assets and liabilities,<br />
2 The Federal government is anticipating budget deficits for fiscal years <strong>2009</strong>/10-2012/13.<br />
3091 <strong>Terasen</strong> Foster Associates, Inc.<br />
Page | 6
162<br />
163<br />
164<br />
165<br />
166<br />
167<br />
168<br />
169<br />
170<br />
171<br />
172<br />
173<br />
174<br />
175<br />
176<br />
177<br />
178<br />
179<br />
180<br />
181<br />
182<br />
183<br />
184<br />
185<br />
186<br />
187<br />
188<br />
creates an imbalance in the supply of and demand for long-term government securities. The<br />
scarcity factor, in turn, leads to abnormally low long-term government bond yields. The<br />
reduction in long-term government bond yields arising from a demand/supply imbalance has<br />
no bearing on the cost of equity.<br />
Layered over the secular decline in long-term Canada bond yields have been periodic<br />
“flights to quality” throughout the period the formulas have been in effect. A “flight to<br />
quality” occurs when investors flee from risky securities to the safe haven of the safest<br />
securities, long-term government securities. A “flight to quality” puts downward pressure<br />
on the yields of default-free securities, e.g. long-term government bond yields, and a<br />
corresponding increase in the cost of risky forms of capital. Since the introduction of<br />
automatic adjustment formulas, the capital markets have been characterized by multiple<br />
crises of varying proportions, including the “Asian Contagion” and ensuing Russian<br />
sovereign debt default in 1997-1998, the dot.com bust in 2000, the Enron bankruptcy in<br />
2001, 9/11, the run-up to and the outbreak of the Iraq War in March 2003, and the global<br />
financial crisis dating from August 2007. The series of market crises and flights to quality<br />
during the period the formulas have been in operation has kept downward pressure on the<br />
level of long-term Canada bond yields, which in turn has suppressed the level of allowed<br />
<strong>ROE</strong>s. 3<br />
As a result of reliance on a formula which has been governed solely by changes in the long-<br />
term Canada bond yield, rather than the composite of factors that bear on equity return<br />
requirements, the allowed <strong>ROE</strong>s have fallen below levels commensurate with a fair return.<br />
The extent to which the formula <strong>ROE</strong>s have diverged off course from a fair and reasonable<br />
level over time can be assessed by a comparison of the allowed <strong>ROE</strong>s of Canadian and U.S.<br />
utilities.<br />
3 To put this in some perspective, Consensus Economics, Consensus Forecasts estimates the long-run average<br />
yield on 10-year Canada bonds twice annually, in April and October. Since 1997, the forecast yield in October<br />
for the subsequent 11 year period has averaged 5.5%. By comparison, the actual yields on 10-year Canada<br />
bonds during 1998 to 2008 have averaged 4.8%, or approximately 0.7 percentage points lower than the longterm<br />
forecast yield.<br />
3091 <strong>Terasen</strong> Foster Associates, Inc.<br />
Page | 7
189<br />
190<br />
191<br />
192<br />
193<br />
194<br />
195<br />
196<br />
197<br />
198<br />
199<br />
200<br />
201<br />
202<br />
203<br />
204<br />
205<br />
206<br />
207<br />
208<br />
This comparison is germane given (1) the significant integration of the Canadian and U.S.<br />
capital markets, (2) the similarity in the business (or operating environments) for distribution<br />
utilities in Canada and the U.S., and (3) the similarity in the regulatory models in the two<br />
countries.<br />
Figure 1 below compares the allowed <strong>ROE</strong>s in Canada and the U.S. since 1990.<br />
Source: Schedule 22<br />
Figure 1<br />
Figure 1 shows that allowed returns in the U.S. and Canada were comparable until automatic<br />
adjustment formulas tied to government bond yields became the norm (approximately 1997-<br />
1998) in Canada. With the widespread adoption of automatic adjustment formulas in<br />
Canada, a significant gap between the allowed <strong>ROE</strong>s in the two countries emerged, a gap<br />
which has persisted through 2008. Between 1998 and 2008, Canadian utilities’ allowed<br />
<strong>ROE</strong>s have averaged close to 1.4 percentage points lower than those of their U.S. peers,<br />
whose allowed <strong>ROE</strong>s continue to be set using various tests and informed judgment. The<br />
average yield on long-term government bonds in the two countries over the same period<br />
differed by less than 0.1% (10 basis points).<br />
3091 <strong>Terasen</strong> Foster Associates, Inc.<br />
Page | 8
209<br />
210<br />
211<br />
212<br />
213<br />
214<br />
215<br />
216<br />
217<br />
218<br />
219<br />
220<br />
221<br />
222<br />
223<br />
224<br />
225<br />
226<br />
227<br />
228<br />
229<br />
230<br />
231<br />
232<br />
233<br />
234<br />
235<br />
236<br />
As of 2008, the differential between the allowed <strong>ROE</strong> for the benchmark BC utility (8.47%)<br />
and the average <strong>ROE</strong> adopted for U.S. gas distributors (10.37%) was 1.9 percentage points<br />
despite a differential between long-term government bond yields in the two countries of less<br />
than 0.2%. The magnitude of the differential of the overall return in favour of the U.S gas<br />
distributors is substantially greater given the difference between the allowed common equity<br />
ratios: currently 35.01% for TGI versus 50% for its U.S. LDC peers. In the absence of<br />
compelling evidence that TGI faces a materially lower level of business risk than its U.S.<br />
peers, the significantly lower financial risk (higher common equity ratios) of the U.S. gas<br />
distributors relative to that of TGI requires a higher <strong>ROE</strong> for TGI to result in an allowed<br />
return which satisfies the fair return standard.<br />
Since allowed <strong>ROE</strong>s in the U.S. are determined using various cost of equity tests, they can<br />
be used, retrospectively, to test the sensitivity of the utility cost of equity to changes in long-<br />
term government bond yields. When the quarterly allowed <strong>ROE</strong>s from 1994 (the year the<br />
formula was first introduced in Canada) to 2008 are regressed against long-term Treasury<br />
bond yields and utility/Treasury bond yield spreads lagged by six months, 4 the result<br />
indicates that the allowed <strong>ROE</strong>s changed by approximately 55 basis points for every one<br />
percentage point change in long-term government bond yields and was positively related to<br />
the utility/government bond yield spread. By comparison, the typical automatic adjustment<br />
formula relied upon in Canada assumes that the <strong>ROE</strong> changes by 75 basis points for every<br />
one percentage point change in long-term government bond yields and includes no other<br />
explanatory variables. The analysis strongly indicates that, with the benefit of hindsight, the<br />
cost of equity is significantly less sensitive to changes in long-term government bond yields<br />
than the automatic adjustment formulas assume.<br />
The evidence that the formulas have not been producing returns that meet the fair return<br />
standard has been mounting for some time.<br />
4 To take account of the fact that the date of the decision lags the period covered by the market data on which<br />
the <strong>ROE</strong> decision was based. Excluding the spread as a second explanatory variable, the regression indicates<br />
that the allowed <strong>ROE</strong>s changed by approximately 40 basis points for every one percentage point change in<br />
long-term government bond yields.<br />
3091 <strong>Terasen</strong> Foster Associates, Inc.<br />
Page | 9
237<br />
238<br />
239<br />
240<br />
241<br />
242<br />
243<br />
244<br />
245<br />
246<br />
247<br />
248<br />
249<br />
250<br />
251<br />
252<br />
253<br />
254<br />
255<br />
256<br />
257<br />
258<br />
259<br />
260<br />
261<br />
262<br />
263<br />
264<br />
265<br />
266<br />
As long ago as December 2001, CIBC World Markets Report entitled “Pipelines and<br />
<strong>Utilities</strong>: Time to Lighten Up”, stated, in reference to the then recent formulaic reduction in<br />
Newfoundland Power’s allowed return (from 9.59% to 9.05% year over year):<br />
The magnitude of the reduction in the case of Newfoundland Power illustrates the<br />
flaw in using a brief snapshot of existing rates rather than a forecast of rates that are<br />
expected to persist during the upcoming year. More importantly, however, it shows<br />
the shortcoming of the formula approach itself. Mechanically tying allowed returns<br />
on equity to long bond yields is an approach that is simple for regulators to apply;<br />
however, in recent years, with a steady decline in bond yields, it has producedallowed<br />
returns that are out of sync with the cost of capital, and returns that are being<br />
achieved with comparable nonregulated companies or regulated returns that are<br />
achievable in the U.S.<br />
At the time of the report, the allowed returns for Canadian utilities were approximately<br />
9.6%, compared to just over 11% for U.S. utilities.<br />
In its June 2006 Canadian Hydrocarbon Transportation System report, the National Energy<br />
Board (NEB) reported that a number of analysts felt that the <strong>ROE</strong> generated by the NEB<br />
formula and by other Canadian regulators’ formulas “were a little too low” and not<br />
supportive of dividend growth or credit metrics. A number of analysts commented that<br />
where they had “Buy” recommendations on utility stocks, the recommendations tended to<br />
reflect the prospects of the unregulated operations. Analysts also commented that<br />
companies had reduced costs and taken other steps to improve profitability and dividend<br />
growth for several years, and wondered how long that could continue. The 2007 Report<br />
expressed similar views. 5 Some market participants expressed concern that the stand-alone<br />
pipelines might have difficulty attracting capital given low <strong>ROE</strong>s. Others felt the regulated<br />
entities would be able to attract capital, but that the terms under which they did so would be<br />
more costly than for the consolidated entity. In addition, the report stated that,<br />
5 The NEB did not consult with analysts for the purpose of their 2008 report, in light of its then ongoing cost of<br />
capital proceeding for TransQuébec and Maritimes Pipeline.<br />
3091 <strong>Terasen</strong> Foster Associates, Inc.<br />
Page | 10
267<br />
268<br />
269<br />
270<br />
271<br />
272<br />
273<br />
274<br />
275<br />
276<br />
277<br />
278<br />
279<br />
280<br />
281<br />
282<br />
283<br />
284<br />
285<br />
286<br />
287<br />
288<br />
289<br />
290<br />
291<br />
292<br />
293<br />
294<br />
295<br />
Many analysts expressed support for a formulaic approach to determining <strong>ROE</strong>s<br />
because of the transparency, stability and predictability that this method provides.<br />
However, a number expressed the view that the <strong>ROE</strong> resulting from the formula was<br />
too low, and contend that they are much lower than regulated <strong>ROE</strong>s in the U.S. and<br />
U.K. While views ranged widely on this issue, some felt that the typically lower<br />
<strong>ROE</strong>s in Canada were not justified by the differences in risk for Canadian companies<br />
compared to FERC-regulated pipelines. Some parties suggested it was time for the<br />
Board to revisit the <strong>ROE</strong> Formula.<br />
In Pipelines/Gas & Electric <strong>Utilities</strong>, dated December 7, 2006, Karen Taylor, then equity<br />
analyst for BMO <strong>Capital</strong> Markets, concluded, “We believe on a collective basis, that the<br />
allowed returns as established by the formulas highlighted above [referring to the NEB,<br />
EUB, 6 BCUC and OEB 7 formulas] are confiscatory and likely violate the Fair Return<br />
Standard.” 8<br />
With the application of the formula for <strong>2009</strong>, the resulting allowed <strong>ROE</strong>s were not only too<br />
low to be fair to investors, they had clearly moved in the wrong direction. While flight to<br />
quality had pushed the actual yields and forecast yields on long-term government bonds<br />
lower during 2008, other indicators were signalling a higher cost of capital. Between<br />
November 2007 and November 2008, the yield on long-term TGI bonds had jumped over<br />
150 basis points, from approximately 5.6% to 7.2%. 9 Over the same period, the yield on the<br />
TSX Composite had also risen by more than 1.5 percentage points as the equity market<br />
plunged. The higher dividend yield, similar to the increase in corporate debt yields, points<br />
to a higher cost of capital. Yet the application of the formula, tied solely to government<br />
bond yields resulted in a lower allowed <strong>ROE</strong> for TGI <strong>2009</strong> than in 2008 (8.47% versus<br />
8.62%).<br />
Were the BCUC to set the allowed <strong>ROE</strong> using the March <strong>2009</strong> consensus forecast, it would<br />
be lower still, at 7.9%. Yet the cost of debt for TGI remains a full percentage point above<br />
6 Alberta Energy and <strong>Utilities</strong> Board<br />
7 Ontario Energy Board<br />
8 Studies commissioned by the Canadian Gas Association and the Canadian Energy Pipeline Association<br />
published in 2008 also came to the conclusion that the <strong>ROE</strong>s produced by the automatic adjustment formulas<br />
did not meet the fair return standard.<br />
9 Yield on <strong>Terasen</strong> Gas 6.95% coupon bond due September 2029; data provided by RBC <strong>Capital</strong> Markets.<br />
3091 <strong>Terasen</strong> Foster Associates, Inc.<br />
Page | 11
296<br />
297<br />
298<br />
299<br />
300<br />
301<br />
302<br />
303<br />
304<br />
305<br />
306<br />
307<br />
308<br />
309<br />
310<br />
311<br />
312<br />
313<br />
314<br />
315<br />
316<br />
317<br />
318<br />
319<br />
320<br />
321<br />
322<br />
323<br />
324<br />
325<br />
the yield prevailing when the Commission last reviewed the formula and set the benchmark<br />
utility allowed <strong>ROE</strong> at 8.8% for 2006. In March 2006, the cost of new long-term debt for<br />
TGI was approximately 5.5%; at the end of March <strong>2009</strong>, it was 6.5%. It makes no logical<br />
sense that equity investors, who are subordinate to debt investors in terms of their claims on<br />
the assets of the utility, would demand a lower return when debt investors are demanding a<br />
higher return. The divergence between the observed trends in the cost of utility long-term<br />
debt and the automatic adjustment formula <strong>ROE</strong> result provides a strong signal that the<br />
automatic adjustment formula is not working properly.<br />
As a further perspective, an allowed <strong>ROE</strong> of 7.9% would represent a significant narrowing<br />
of the premium between the allowed <strong>ROE</strong> and the coincident cost of new 30-year debt to<br />
TGI. An allowed <strong>ROE</strong> of 7.9% would equate to a premium of only 1.4 percentage points<br />
above the prevailing cost of new long-term debt. By comparison, when the BCUC reviewed<br />
the formula in 1999 and 2006, the allowed <strong>ROE</strong>s were approximately 2.4 and 2.7 percentage<br />
points respectively higher than the corresponding cost of long-term utility debt. There is no<br />
logical reason that the differential between the returns required by investors to invest in the<br />
common equity of utilities like TGI rather than the Company’s long-term debt would have<br />
declined between 2006 and <strong>2009</strong> as the operation of the automatic adjustment formula<br />
implies. The material narrowing of the spread between the cost of new utility long-term<br />
debt and the automatic adjustment formula <strong>ROE</strong> result provides further support for the<br />
conclusion that the automatic adjustment formula is not producing reasonable results.<br />
In March 2006, the yield on the TSX Composite Index was 2.3%; at the end of March <strong>2009</strong><br />
it was 4.2%. It makes no logical sense that utility equity investors would demand a lower<br />
return when the virtual doubling of the market dividend yield (reflecting a 30% price<br />
decline) is signalling an increase in the cost of equity and the equity risk premium. The<br />
divergence between the observed trends in the market cost of equity and the automatic<br />
adjustment formula <strong>ROE</strong> result is provides an additional strong signal that the automatic<br />
adjustment formula is not working properly.<br />
3091 <strong>Terasen</strong> Foster Associates, Inc.<br />
Page | 12
326<br />
327<br />
328<br />
329<br />
330<br />
331<br />
332<br />
333<br />
334<br />
335<br />
336<br />
337<br />
338<br />
339<br />
340<br />
341<br />
342<br />
343<br />
In addition to the increase in the market dividend yield, the increase in the cost of equity,<br />
and the widening of the equity risk premium, is reflected in the significant increase in the<br />
volatility in the equity markets, as represented by Implied Volatility Index (“MVX”)<br />
introduced by the Montréal Exchange in 2002. The Montréal Exchange states that the<br />
“MVX is a good proxy of investor sentiment for the Canadian equity market: the higher the<br />
Index, the higher the risk of market turmoil. A rising Index therefore reflects the heightened<br />
fears of investors for the coming month.” 10 In other words a rising MVX is an indicator of<br />
rising investor risk aversion and a rising market risk premium.<br />
As shown in Figure 1 below, during much of 2002-2007, prior to the onset of the financial<br />
crisis, the MVX was relatively stable, trading within a range of 8 to 24, and averaging 15.<br />
During 2008, the MVX rose sharply, peaking at almost 90 in November 2008, its highest<br />
level since inception, and averaging close to 60 during the 4 th quarter. While volatility has<br />
declined, the MVX has continued to trade substantially above its 2002-2007 levels,<br />
averaging over 40 in the first quarter of <strong>2009</strong>. To put this in perspective, the MVX never<br />
exceeded 25 prior to August 2007. Since mid-2008, the MVX has signaled higher risk<br />
aversion and, therefore, an increase in the equity risk premium. 11<br />
10 www.m-x.ca/indicesmx_mvx_en.php<br />
11 Similarly, in the U.S. the VIX index, an equity volatility index introduced in 1993 by the Chicago Board<br />
Options Exchange (often referred to as the “Fear Gauge”), is an indicator of investor risk aversion. The index<br />
indicates that, during much of 2004-2006, the equity market was perceived as unusually stable; trading within<br />
a range of 10 to 19, and averaging 13.5. The VIX index rose steadily throughout much of 2007, averaging<br />
100% higher during the 4 th quarter than during the 4 th quarter of 2006. During the fourth quarter of 2008, as<br />
the depth of the financial crisis was revealed, the index jumped sharply, peaking at almost 80 in October 2008,<br />
its highest level since inception, and averaging close to 60 during the entire 4 th quarter. At the end of March<br />
<strong>2009</strong>, it was trading around 45, levels not experienced previously. On only six days prior to the current<br />
financial market crisis, four during the 1998 global market crisis and two times in 2001-2002 in the wake of<br />
the recession in the U.S., has the index traded at or above 40. However, at no time prior to this financial crisis<br />
has it touched 45.<br />
3091 <strong>Terasen</strong> Foster Associates, Inc.<br />
Page | 13
344<br />
345<br />
346<br />
347<br />
348<br />
349<br />
350<br />
351<br />
352<br />
353<br />
354<br />
355<br />
356<br />
357<br />
358<br />
359<br />
360<br />
361<br />
362<br />
363<br />
364<br />
Source: Montréal Exchange<br />
Figure 2<br />
The unambiguous divergence between the trends in long-term government bond yields on<br />
the one hand and utility bond yields and the market cost of equity on the other has led equity<br />
analysts to reach the conclusion that the formula is broken. In RBC <strong>Capital</strong> Markets’<br />
January 16, <strong>2009</strong> Industry Comment entitled “Allowed <strong>ROE</strong>s: The Formula Is Broken, but<br />
Will Regulators Fix It?”, analyst Robert Kwan commented,<br />
With higher equity risk premiums and higher long bond yields for Energy<br />
Infrastructure companies that are trading at levels close to the allowed <strong>ROE</strong>s, it<br />
appears that the formula is broken. Forgetting the magnitude of change, it appears<br />
that the formula is producing a result that is directionally incorrect (i.e., <strong>ROE</strong>s<br />
declining yet corporate bond yields and equity risk premiums are rising).<br />
Mr. Kwan recommended from a risk/reward perspective<br />
We would focus on companies with the least exposure to the formula.<br />
3091 <strong>Terasen</strong> Foster Associates, Inc.<br />
Page | 14
365<br />
366<br />
367<br />
368<br />
369<br />
370<br />
371<br />
372<br />
373<br />
374<br />
375<br />
376<br />
377<br />
378<br />
379<br />
380<br />
381<br />
382<br />
383<br />
384<br />
385<br />
386<br />
387<br />
388<br />
389<br />
390<br />
391<br />
392<br />
393<br />
394<br />
395<br />
396<br />
397<br />
398<br />
399<br />
400<br />
401<br />
402<br />
403<br />
A February 23, <strong>2009</strong> report by Macquarie Research entitled <strong>ROE</strong> Formula May Finally Bite<br />
the Dust concluded that government bond yields bear little resemblance to any private<br />
company’s cost of capital. The report also concluded that:<br />
Lack of comparability between allowed utility <strong>ROE</strong>s and returns on similar<br />
investments is driving the emerging capital access problem. In support of the<br />
argument the comparability criterion is not being met, utility customers and their<br />
expert witnesses like to point out that allowed returns for U.S. utilities are<br />
considerably higher than allowed returns in Canada. No matter how we slice the<br />
data, we concur with this opinion.<br />
On March 19, <strong>2009</strong> the National Energy Board released its cost of capital decision for<br />
TransQuébec and Maritimes Pipeline (TQM). In that decision, the NEB expressed the view<br />
that<br />
there have been significant changes since 1994 in the financial markets as well as in<br />
general economic conditions. More specifically, Canadian financial markets have<br />
experienced greater globalization, the decline in the ratio of government debt to GDP<br />
has put downward pressure on Government of Canada bond yields, and the<br />
Canada/US exchange rate has appreciated and subsequently fallen. In the Board’s<br />
view, one of the most significant changes since 1994 is the increased globalization of<br />
financial markets which translates into a higher level of competition for capital.<br />
When taken together, the Board is of the view that these changes cast doubt on some<br />
of the fundamentals underlying the RH-2-94 Formula as it relates to TQM.<br />
The NEB also noted that<br />
The RH-2-94 Formula relies on a single variable which is the long Canada bond<br />
yield. In the Board’s view, changes that could potentially affect TQM’s cost of<br />
capital may not be captured by the long Canada bond yields and hence, may not be<br />
accounted for by the results of the RH-2-94 Formula. Further, the changes discussed<br />
above regarding the new business environment are examples of changes that, since<br />
1994, may not have been captured by the RH-2-94 Formula. Over time, these<br />
omissions have the potential to grow and raise further doubt as to the applicability of<br />
the RH-2-94 Formula result for TQM for 2007 and 2008.<br />
The NEB’s decision for TQM replaced the automatic adjustment formula <strong>ROE</strong> and deemed<br />
capital structure with an after-tax weighted average cost of capital (ATWACC) of 6.4%.<br />
Although the decision specified neither a capital structure nor allowed <strong>ROE</strong>, it provided<br />
some alternative combinations of common equity ratio and <strong>ROE</strong> equivalent to the 6.4%<br />
3091 <strong>Terasen</strong> Foster Associates, Inc.<br />
Page | 15
404<br />
405<br />
406<br />
407<br />
408<br />
409<br />
410<br />
411<br />
412<br />
413<br />
414<br />
415<br />
416<br />
417<br />
418<br />
419<br />
420<br />
421<br />
422<br />
423<br />
424<br />
425<br />
426<br />
427<br />
428<br />
429<br />
430<br />
431<br />
432<br />
433<br />
434<br />
435<br />
ATWACC so as to facilitate comparisons. The 2007/2008 <strong>ROE</strong> at the TQM and Intervenor<br />
recommended equity ratios of 40% and 32% would be 9.7% and 11.2%, respectively. At the<br />
same common equity ratio last approved for TQM of 30%, the return adopted by the NEB<br />
for TQM is more than 250 basis points higher than the corresponding 2007 and 2008 <strong>ROE</strong>s<br />
of 8.46% and 8.71% if determined by the NEB’s multi-pipeline formula. In coming to its<br />
decision, the NEB concluded that market returns of U.S. companies were relevant to the cost<br />
of capital of Canadian firms, as U.S. market returns can be a useful proxy for investment<br />
opportunities in the increasingly integrated global capital markets. Following its decision<br />
for TQM specifically, the NEB has decided to consider whether it should initiate a full<br />
review of its RH-2-94 decision which adopted the automatic adjustment formula. 12<br />
BMO <strong>Capital</strong> Markets analyst George Lazarevski in Pipelines and <strong>Utilities</strong> (March 30,<br />
<strong>2009</strong>) stated,<br />
We applaud the NEB for acknowledging that the RH-2-94 formula is no longer<br />
applicable given the changes in business risk, financial markets and economic<br />
conditions. In particular, the globalization of financial markets made it difficult for<br />
Canadian operators to compete for capital with such low <strong>ROE</strong>.<br />
On April 24, <strong>2009</strong>, Scotia <strong>Capital</strong> commented,<br />
The turmoil in financial markets over the last 18 months has had a material knock-on<br />
effect on a sector typically seen as a safe haven from adverse equity market volatility<br />
and valuations. Energy utilities across Canada have seen their regulated returns on<br />
equity squeezed by falling Government of Canada bond yields, even as the realworld<br />
cost of equity capital has risen dramatically.<br />
Beginning with the National Energy Board in early 1995, 13 Canadian energy<br />
regulators have largely adopted formula-based annual adjustments to utilities’<br />
allowed return on equity. These formula have been based on the capital asset pricing<br />
model. A base “risk-free” rate, represented by long Canada bond yields, is<br />
augmented by an equity risk premium, chosen to represent the business and financial<br />
12<br />
The potential NEB review is part of a broader movement to address the failings of the existing automatic<br />
adjustment formulas. The Alberta <strong>Utilities</strong> Commission is in the process of reviewing the automatic<br />
adjustment formula, the Ontario Energy Board has initiated a more limited review of the reasonableness of the<br />
<strong>2009</strong> values produced by its formulaic approach to setting the cost of capital for electricity distributors, and<br />
Gaz Metro is applying to the Régie for a change in cost of capital methodology.<br />
13<br />
As noted earlier, the BCUC was actually the first Canadian regulator to adopt an automatic adjustment<br />
mechanism in 1994.<br />
3091 <strong>Terasen</strong> Foster Associates, Inc.<br />
Page | 16
436<br />
437<br />
438<br />
439<br />
440<br />
441<br />
442<br />
443<br />
444<br />
445<br />
446<br />
447<br />
448<br />
449<br />
450<br />
451<br />
452<br />
453<br />
454<br />
455<br />
456<br />
457<br />
458<br />
459<br />
460<br />
461<br />
462<br />
463<br />
464<br />
465<br />
risk of the utilities. The NEB’s formula was created in 1994 and 1995, when Canada<br />
long bond yields reached over 9% at times, due to a range of factors, including<br />
ratings downgrades, large public sector deficits, and bearish domestic and<br />
international market sentiment towards Canadian government debt.<br />
As Canada’s public sector reformed its finances, long Canada yields have come<br />
down, gradually but steadily, since early 1995. This led to a gradual decline in utility<br />
allowed <strong>ROE</strong>s, which has been a challenge for equity holders, and a challenge for<br />
utility management to offset by trying to “over-earn” the regulatory target, which is<br />
used to set rates.<br />
The onset of economic and financial market turmoil in late 2007 led to a further,<br />
more rapid decline in Canada yields, mimicking the global flight to the safety of topquality<br />
sovereign debt, and reflecting widespread investor aversion to risk of all<br />
kinds. This triggered a decrease in Canadian utility regulators’ formula-driven <strong>ROE</strong>s,<br />
to unprecedented low levels. However, utility bond spreads, and their cost of equity<br />
capital, were rising.<br />
Very recently, the NEB recognized these adverse and undesirable results, in what we<br />
view as a very significant Decision in the case of Trans Québec & Maritimes<br />
Pipeline. The NEB varied from its formula, which it had applied virtually universally<br />
to utilities in its jurisdiction since 1995. The <strong>ROE</strong> relief was material, lifting TQM’s<br />
<strong>ROE</strong> from the formula-set 8.46% and 8.71% in 2007 and 2008 (on the NEB’s<br />
deemed equity capitalization of 30%) to roughly 11.6% to 11.8%, based on the same<br />
capital structure and the embedded cost of debt. 14<br />
With this backdrop, it is apparent that a review from first principles of the cost of capital<br />
(capital structure and <strong>ROE</strong>) for TGI is warranted and the allowed return rebased at a level<br />
which satisfies the fair return standard.<br />
14 Stephen Dafoe, “Falling Canada Yields and Utility <strong>ROE</strong>s”, <strong>Capital</strong> Points, ScotiaBank Group, April 24,<br />
<strong>2009</strong>.<br />
3091 <strong>Terasen</strong> Foster Associates, Inc.<br />
Page | 17
466<br />
467<br />
468<br />
469<br />
470<br />
471<br />
472<br />
473<br />
474<br />
475<br />
476<br />
477<br />
478<br />
479<br />
480<br />
481<br />
482<br />
483<br />
484<br />
485<br />
486<br />
III. THE FAIR RETURN STANDARD<br />
The standards for a fair return arise from legal precedents 15 which are echoed in numerous<br />
regulatory decisions across North America, including the BCUC’s August 26, 1999 decision<br />
entitled In the Matter of Return on Equity for a Benchmark Utility. 16 A fair return gives a<br />
regulated utility the opportunity to:<br />
1. earn a return on investment commensurate with that of comparable risk<br />
enterprises;<br />
2. maintain its financial integrity; and,<br />
3. attract capital on reasonable terms.<br />
The legal precedents make it clear that the three requirements are separate and distinct.<br />
Moreover, none of the three requirements is given priority over the others. The fair return<br />
standard is met only if all three requirements are satisfied. In other words, the fair return<br />
standard is only satisfied if the utility can attract capital on reasonable terms and conditions,<br />
15 The principal court cases in Canada and the U.S. establishing the standards include Northwestern <strong>Utilities</strong><br />
Ltd. v. Edmonton (City), [1929] S.C.R. 186; Bluefield Water Works & Improvement Co. v. Public Service<br />
Commission of West Virginia,(262 U.S. 679, 692 (1923)); and, Federal Power Commission v. Hope Natural<br />
Gas Company (320 U.S. 591 (1944)).<br />
16 The three requirements were summarized by the National Energy Board (RH-2-2004, Phase II) as follows:<br />
“The Board is of the view that the fair return standard can be articulated by having reference to three<br />
particular requirements. Specifically, a fair or reasonable return on capital should:<br />
• be comparable to the return available from the application of the invested capital to<br />
other enterprises of like risk (the comparable investment standard);<br />
• enable the financial integrity of the regulated enterprise to be maintained (the<br />
financial integrity standard); and<br />
• permit incremental capital to be attracted to the enterprise on reasonable terms and<br />
conditions (the capital attraction standard).”<br />
The three requirements were reiterated in the March 19, <strong>2009</strong> TQM decision (pages 6-7).<br />
In EB-2005-0421(Toronto Hydro), dated April 12, 2006, the Ontario Energy Board stated, “And, as a matter of<br />
law, utilities are entitled to earn a rate of return that not only enables them to attract capital on reasonable terms<br />
but is comparable to the return granted other utilities with a similar risk profile.” (pages 32-33)<br />
3091 <strong>Terasen</strong> Foster Associates, Inc.<br />
Page | 18
487<br />
488<br />
489<br />
490<br />
491<br />
492<br />
493<br />
494<br />
495<br />
496<br />
497<br />
498<br />
499<br />
500<br />
501<br />
502<br />
503<br />
504<br />
505<br />
506<br />
507<br />
508<br />
509<br />
510<br />
511<br />
512<br />
its financial integrity can be maintained and the return allowed is comparable to the returns<br />
of enterprises of similar risk. 17<br />
In Commission Order G-14-06 (March 2, 2006) the BCUC recognized “the relevance of two<br />
separate standards namely the capital attraction standard and the comparable returns<br />
standard in establishing a fair return on equity for a benchmark low-risk utility. One<br />
standard does not trump the other, neither is one subsumed by the other.”<br />
A fair return on the capital provided by investors not only compensates the investors who<br />
have put up, and continue to commit, the funds necessary to deliver service, but benefits all<br />
stakeholders, including ratepayers. A fair and reasonable return on the capital invested<br />
provides the basis for attraction of capital for which investors have alternative investment<br />
opportunities. A fair return preserves the financial integrity of the utility, that is, it permits<br />
the utility to maintain its creditworthiness, as demonstrated by the level of its credit metrics<br />
and debt ratings. Fair compensation on the capital committed to the utility provides the<br />
financial means to pursue technological innovations and build the infrastructure required to<br />
support long-term growth in the underlying economy.<br />
An inadequate return, on the other hand, undermines the ability of a utility to compete for<br />
investment capital. Moreover, inadequate returns act as a disincentive to expansion, may<br />
potentially degrade the quality of service or deprive existing customers from the benefit of<br />
lower unit costs that might be achieved from growth. In short, if the utility is not provided<br />
the opportunity to earn a fair and reasonable return, it may be prevented from making the<br />
requisite level of investments in the existing infrastructure in order to reliably provide utility<br />
services for its customers.<br />
17 See Appendix A for further discussion of the distinction between the capital attraction and comparable<br />
returns standards.<br />
3091 <strong>Terasen</strong> Foster Associates, Inc.<br />
Page | 19
513<br />
514<br />
515<br />
516<br />
517<br />
518<br />
519<br />
520<br />
521<br />
522<br />
523<br />
524<br />
525<br />
526<br />
527<br />
528<br />
529<br />
530<br />
531<br />
532<br />
533<br />
534<br />
535<br />
536<br />
537<br />
538<br />
539<br />
540<br />
541<br />
542<br />
543<br />
544<br />
IV. FRAMEWORK FOR EVALUATION OF CAPITAL<br />
STRUCTURE AND <strong>ROE</strong> FOR TGI<br />
A. RELATIONSHIP BETWEEN CAPITAL STRUCTURE AND <strong>ROE</strong><br />
The overall cost of capital to a firm depends, in the first instance, on business risk. Business<br />
risk comprises the fundamental characteristics of the business (e.g., demand, supply and<br />
operating factors) that together determine the probability that future returns to investors will<br />
fall short of their expected and required returns. Business risk thus relates largely to the<br />
assets of the firm. For utilities, the business risks also include regulatory risks, i.e., the<br />
regulatory framework under which the utility operates. The prevailing regulatory<br />
framework effectively represents the current allocation of the fundamental business risks<br />
between investors and ratepayers. Regulatory risk can be considered either as a component<br />
of business risk or as a separate risk category along with business and financial risk.<br />
The cost of capital is also a function of financial risk. Financial risk refers to the additional<br />
risk that is borne by the equity shareholder because the firm is using fixed income securities<br />
– debt and preferred shares – to finance a portion of its assets. The capital structure,<br />
comprised of debt, preferred shares and common equity, can be viewed as a summary<br />
measure of the financial risk of the firm. The use of debt in a firm’s capital structure creates<br />
a class of investors whose claims on the cash flows of the firm take precedence over those of<br />
the equity holder. Since the issuance of debt carries unavoidable servicing costs which must<br />
be paid before the equity shareholder receives any return, the potential variability of the<br />
equity shareholder’s return rises as more debt is added to the capital structure. Thus, as the<br />
debt ratio rises, the cost of equity rises.<br />
There are effectively two approaches that can be used to determine the fair return. The first<br />
approach entails acceptance of the utility’s actual capital structure for regulatory purposes or<br />
deeming a capital structure that adequately protects bondholders but does not necessarily<br />
3091 <strong>Terasen</strong> Foster Associates, Inc.<br />
Page | 20
545<br />
546<br />
547<br />
548<br />
549<br />
550<br />
551<br />
552<br />
553<br />
554<br />
555<br />
556<br />
557<br />
558<br />
559<br />
560<br />
561<br />
562<br />
563<br />
564<br />
565<br />
566<br />
567<br />
568<br />
569<br />
570<br />
571<br />
equate the total (fundamental business, regulatory and financial) risk of the regulated<br />
company to those of the proxy companies used to estimate the cost of equity. If the total<br />
risk of the proxy companies is higher or lower than that of the specific utility, the proxies’<br />
estimated cost of equity needs to be adjusted upward or downward to arrive at the cost of<br />
equity of the specific utility.<br />
The first approach, varying both capital structures and <strong>ROE</strong>s, is used by the BCUC. The<br />
combination of capital structures and <strong>ROE</strong>s is also used by the OEB and the Régie de<br />
l’Énergie de Québec (Régie).<br />
The second approach assesses the utility’s fundamental business and regulatory risks, and<br />
then establish a capital structure that is both compatible with those risks and that permits the<br />
application of a cost of equity determined by reference to proxy companies, with no<br />
adjustment to that cost. This approach can be applied to a spectrum of regulated companies<br />
within a range of combined fundamental business and regulatory risks.<br />
The NEB employed the second approach when it established its automatic adjustment<br />
mechanism for a number of oil and gas pipelines in 1995. 18 It is also the approach that was<br />
adopted by the former Alberta EUB in its Generic Cost of <strong>Capital</strong> Decision 2004-052 in<br />
2004. In that decision, the EUB set different capital structures for eleven electric and gas<br />
distribution and transmission entities, based on their different business risk profiles, and then<br />
established a common return on equity to be applied to each of the utilities under its<br />
jurisdiction.<br />
In summary, the various components of the cost of capital are inextricably linked; it is<br />
impossible to determine if the return on equity is fair without reference to the capital<br />
structure of the utility. Thus, the determination of a fair return must take into account all of<br />
18 In its Reasons for Decision RH-1-2008 (March <strong>2009</strong>), the NEB recognized the inextricable link between<br />
<strong>ROE</strong> and capital structure. However, it did not specify either an <strong>ROE</strong> or a capital structure for TQM. Instead,<br />
it adopted an overall cost of capital and left it to TQM to choose its optimal capital structure. The NEB also<br />
noted that the overall cost of capital approach enables comparisons of returns on an equal footing between<br />
companies of comparable risk.<br />
3091 <strong>Terasen</strong> Foster Associates, Inc.<br />
Page | 21
572<br />
573<br />
574<br />
575<br />
576<br />
577<br />
578<br />
579<br />
580<br />
581<br />
582<br />
583<br />
584<br />
585<br />
586<br />
587<br />
588<br />
589<br />
590<br />
591<br />
592<br />
593<br />
594<br />
595<br />
596<br />
597<br />
598<br />
599<br />
600<br />
the elements of the cost of capital, including the capital structure and the cost rates for each<br />
of the types of financing. It is the overall return on capital which must meet the<br />
requirements of the fair return standard. Both approaches used by Canadian regulators are<br />
equally valid as long as the combination of capital structure and return on equity result in an<br />
overall return which satisfies all three fair return standards.<br />
B. CONCEPT OF BENCHMARK UTILITY AND BENCHMARK<br />
<strong>ROE</strong><br />
The concepts of a benchmark utility and benchmark return on equity have been used by the<br />
BCUC to establish allowed <strong>ROE</strong>s for each of the utilities under its jurisdiction. Essentially,<br />
this approach (1) designates one of the utilities as the “benchmark” utility, (2) estimates that<br />
utility’s cost of equity, and then (3) establishes the cost of equity for the other BCUC-<br />
regulated utilities by reference to the benchmark utility’s cost of equity. With regard to (3),<br />
the costs of equity (and allowed <strong>ROE</strong>s) for the utilities other than the designated benchmark<br />
have been estimated and expressed as a premium above the benchmark <strong>ROE</strong>. TGI has<br />
historically been designated the benchmark utility and each of the other BC utilities’ allowed<br />
<strong>ROE</strong>s, have reflected a premium to TGI’s allowed <strong>ROE</strong>.<br />
The approach taken by the BCUC, as noted in Section A, has also adopted different deemed<br />
capital structures for the utilities, ranging from a 35% common equity ratio for TGI to 40%<br />
common equity ratios for <strong>Terasen</strong> Gas (Vancouver Island), <strong>FortisBC</strong>, and Pacific Northern<br />
Gas-West. To assess whether the utilities’ allowed returns are fair returns, i.e., ones that<br />
meet all three criteria of capital attraction, financial integrity and comparability, both the<br />
capital structure and <strong>ROE</strong> have to be taken into account. To illustrate, assume that Utility A<br />
and Utility B have similar business and regulatory risks, which means their costs of capital<br />
should be similar. Both utilities are allowed the same <strong>ROE</strong>. However, Utility A has a lower<br />
deemed common equity ratio than Utility B and thus is being allowed an overall return<br />
which is lower than that of Utility B. As both utilities are of similar business risk, this<br />
3091 <strong>Terasen</strong> Foster Associates, Inc.<br />
Page | 22
601<br />
602<br />
603<br />
604<br />
605<br />
606<br />
607<br />
608<br />
609<br />
610<br />
611<br />
612<br />
613<br />
614<br />
615<br />
616<br />
617<br />
618<br />
619<br />
620<br />
621<br />
622<br />
623<br />
624<br />
625<br />
626<br />
outcome would not be fair and reasonable. Consequently it is critical to ensure that the<br />
overall allowed returns for each utility meet the fair return standard.<br />
It is perhaps obvious that the same is true when establishing the allowed return for the utility<br />
which is to be designated as the benchmark. The <strong>ROE</strong> applicable to the benchmark utility<br />
(i.e., the benchmark <strong>ROE</strong>) is derived from market data which includes utilities from various<br />
industries (electric, gas distribution and gas pipeline). The cost of equity, as estimated using<br />
tests applied to samples of proxy companies, reflects the composite of those proxy<br />
companies’ business, regulatory and financial risks. For the proxy companies’ cost of equity<br />
to be equivalent to the “benchmark cost of equity” applicable to the “benchmark utility”, the<br />
benchmark utility’s total risk needs to be similar to that of the proxy companies. If it is not,<br />
the solutions include (1) changing the benchmark utility’s capital structure; (2) making an<br />
adjustment to the proxy companies’ cost of equity to reflect the relative total risk of the<br />
benchmark utility; or (3) some combination of (1) and (2).<br />
To minimize the extent to which such adjustments are required, the point of departure<br />
should be the selection of companies that are of relatively similar total risk to the benchmark<br />
utility. In the Canadian context, there are only seven 19 publicly-traded Canadian utilities.<br />
These companies are relatively heterogeneous in terms of both operations 20 and size. 21<br />
While the Canadian utilities provide some perspective, a more accurate assessment of the<br />
cost of capital for the benchmark utility can be made by reliance on a sample of comparable<br />
risk U.S. utilities drawn from a much broader universe. The selection of the sample relies<br />
on criteria designed to (1) identify companies that are of relatively similar risk to the<br />
benchmark utility and (2) produce a large enough sample of companies to ensure reliable<br />
cost of equity test results.<br />
19 AltaGas Utility Group (spun off from AltaGas Income Trust in late 2005), Canadian <strong>Utilities</strong>, Emera,<br />
Enbridge, Fortis, Pacific Northern Gas and TransCanada Corporation.<br />
20 Their operations span all the major utility industries, including electricity distribution, transmission and<br />
power generation, natural gas distribution and transmission, and liquids pipeline transmission, as well as<br />
unregulated activities in varying proportions of their consolidated activities.<br />
21 Ranging from an equity market capitalization of approximately $40 million (AltaGas) to $20 billion<br />
(TransCanada).<br />
3091 <strong>Terasen</strong> Foster Associates, Inc.<br />
Page | 23
627<br />
628<br />
629<br />
630<br />
631<br />
632<br />
Further, it is important to recognize that, while it may be administratively efficient to<br />
designate one utility as the “benchmark”, it does not necessarily follow that (1) the<br />
designated benchmark is the lowest risk utility, or (2) that the risk of the designated<br />
benchmark utility does not change over time relative to its peers.<br />
3091 <strong>Terasen</strong> Foster Associates, Inc.<br />
Page | 24
633<br />
634<br />
635<br />
636<br />
637<br />
638<br />
639<br />
640<br />
641<br />
642<br />
643<br />
644<br />
645<br />
646<br />
647<br />
648<br />
649<br />
650<br />
651<br />
652<br />
653<br />
654<br />
655<br />
656<br />
657<br />
658<br />
659<br />
660<br />
661<br />
662<br />
663<br />
V. CAPITAL STRUCTURE FOR TGI<br />
A. PROPOSED CAPITAL STRUCTURE OF TGI<br />
TGI is requesting that the Commission approve a regulated common equity ratio of 40.0%.<br />
B. PRINCIPLES FOR CAPITAL STRUCTURE DETERMINATION<br />
The following principles should be respected when establishing both the cost of capital<br />
generally and a reasonable capital structure for TGI:<br />
1. The Stand-Alone Principle<br />
2. Compatibility of <strong>Capital</strong> <strong>Structure</strong> with Business Risks<br />
3. Maintenance of Creditworthiness/Financial Integrity<br />
4. Ability to Attract <strong>Capital</strong> on Reasonable Terms and Conditions<br />
5. Comparability of Returns<br />
Each of these five principles is defined below. The five principles which apply to the<br />
determination of a reasonable capital structure include the three standards (Principles 3 to 5)<br />
which govern a fair return identified in Section III above, reflecting the interdependence<br />
between capital structure and <strong>ROE</strong>.<br />
B.1. The Stand-Alone Principle<br />
The stand-alone principle encompasses the notion that the cost of capital incurred by a<br />
utility should be equivalent to that which would be faced if it was raising capital in the<br />
public markets on the strength of its own business and financial parameters; in other words,<br />
as if it were operating as an independent entity. The cost of capital for the company should<br />
3091 <strong>Terasen</strong> Foster Associates, Inc.<br />
Page | 25
664<br />
665<br />
666<br />
667<br />
668<br />
669<br />
670<br />
671<br />
672<br />
673<br />
674<br />
675<br />
676<br />
677<br />
678<br />
679<br />
680<br />
681<br />
682<br />
683<br />
684<br />
685<br />
686<br />
687<br />
688<br />
689<br />
690<br />
reflect neither subsidies given to, nor taken from, other activities of the firm. 22 Respect for<br />
the stand-alone principle is intended to promote efficient allocation of capital resources<br />
among the various activities of the firm. As TGI is a stand-alone regulated entity which<br />
raises its own debt on the strength of its own business and financial risk profile, the<br />
application of the stand-alone principle is not an issue.<br />
B.2. Compatibility of <strong>Capital</strong> <strong>Structure</strong> with Business Risks<br />
The capital structure of a utility should be consistent with the business and regulatory risks<br />
of the specific entity for which the capital structure is being set. The business risk of a<br />
utility is the risk of not earning a compensatory return on the invested capital and of a failure<br />
to recover the capital that has been invested. The fundamental business risks of a utility<br />
include demand, competitive, supply, operating, technology-related and political risks.<br />
Regulatory risk relates to the framework that determines how the fundamental business risks<br />
are allocated between the utility’s customers and its investors.<br />
B.3. Maintenance of Creditworthiness/Financial Integrity<br />
A reasonable capital structure for TGI, in conjunction with the returns allowed on the<br />
various sources of capital, should provide the basis for stand-alone investment grade debt<br />
ratings in the A category. Debt ratings in the A category assure that the utility would be able<br />
to access the capital markets on reasonable terms and conditions during both robust and<br />
difficult, or weak, capital market conditions. In contrast to unregulated companies, utilities<br />
do not have the same flexibility to defer financing new assets. <strong>Utilities</strong> are required to<br />
provide service on demand, and must access the capital markets when service requirements<br />
demand it.<br />
22 In a similar vein, in setting the allowed return, the availability of incentives through a performance-based<br />
regulation plan should not be viewed as an “offset”. Performance-based regulation is intended to provide the<br />
basis for incenting the utility to achieve efficiencies in order to benefit customers and to be able to earn a return<br />
in excess of the cost of capital. Setting the allowed return below the cost of capital with the expectation that<br />
incentive returns will be achieved undermines the objective of performance-based regulation.<br />
3091 <strong>Terasen</strong> Foster Associates, Inc.<br />
Page | 26
691<br />
692<br />
693<br />
694<br />
695<br />
696<br />
697<br />
698<br />
699<br />
700<br />
701<br />
702<br />
703<br />
704<br />
705<br />
706<br />
707<br />
708<br />
709<br />
710<br />
711<br />
712<br />
713<br />
714<br />
715<br />
716<br />
717<br />
718<br />
719<br />
720<br />
721<br />
The critical nature of maintaining credit ratings in the A category arises from two factors:<br />
market access and cost. Even a utility with split-ratings (that is, one debt rating in the A<br />
category and one rating in BBB category) would face a higher cost of debt and lesser market<br />
access relative to a utility with all debt ratings in the A category. Regulated issuers with<br />
BBB ratings can be closed out of the market at times, particularly at the longer end (20-30<br />
year term) of the debt market. TGI is principally financing long-term assets. Thus the<br />
Company needs to maintain the financing flexibility required to be able to access debt with<br />
terms to maturity in the range of 10 to 30 years in both strong and weak capital market<br />
conditions.<br />
If a utility experiences a downgrade, the downgrade would not only result in an increase in<br />
the cost of the additional debt that the company needs to raise, but it will affect all of the<br />
outstanding debt. An increase in the cost of debt to a utility increases the required yield on<br />
the outstanding debt and reduces the value of that debt. Since existing debt holders are the<br />
most likely purchasers of future issues, a debt rating downgrade, with the resulting negative<br />
impact on the value of their existing holdings, would likely make them less willing to<br />
purchase future issues.<br />
B.4. Ability to Attract <strong>Capital</strong> on Reasonable Terms and Conditions<br />
A higher cost of debt to the utility translates into a higher cost of debt to ratepayers. The<br />
relative cost of A rated debt versus BBB rated debt varies with market conditions, but<br />
ratings in the BBB category can be very costly to ratepayers. As the recent global market<br />
crisis has demonstrated, capital markets can deteriorate rapidly.<br />
In September 2006, TGI issued 30-year debt at a spread of 123 basis points over the<br />
benchmark long-term Government of Canada bond yield. When spreads peaked in early<br />
January <strong>2009</strong>, the indicated spread for a new 30-year TGI debt issue was 380 basis points,<br />
close to 260 basis points higher than the spread that prevailed when the <strong>ROE</strong> was last<br />
calibrated by the BCUC. Since the beginning of 2007, spreads for companies with ratings in<br />
the BBB category had increased by an even greater amount, as shown in the table below.<br />
3091 <strong>Terasen</strong> Foster Associates, Inc.<br />
Page | 27
722<br />
723<br />
724<br />
725<br />
726<br />
727<br />
728<br />
729<br />
730<br />
731<br />
732<br />
733<br />
734<br />
735<br />
736<br />
737<br />
738<br />
739<br />
The lack of an indicated 30-year new issue spread in January <strong>2009</strong> for TransAlta in that<br />
table signifies that TransAlta would likely not have been able to raise 30-year debt at that<br />
time.<br />
Debt Ratings<br />
DBRS/Moody’s/S&P<br />
Term<br />
of<br />
Issue<br />
Table 1<br />
Indicated<br />
Spread at<br />
1/1/2007<br />
Indicated<br />
Spread at<br />
1/8/2008<br />
Indicated<br />
Spread at<br />
1/5/<strong>2009</strong><br />
Change in<br />
Indicated<br />
Spread<br />
<strong>2009</strong>/2007<br />
TGI A/ A3 / A<br />
10 yr<br />
30 yr<br />
70<br />
130<br />
100<br />
125<br />
355<br />
380<br />
+285<br />
+250<br />
Epcor<br />
<strong>Utilities</strong><br />
A(low) / - / BBB+<br />
10 yr<br />
30 yr<br />
75<br />
135<br />
140<br />
195<br />
480<br />
505<br />
+405<br />
+370<br />
Nova Scotia<br />
Power<br />
A(low) / Baa1 / BBB<br />
10 yr<br />
30 yr<br />
75<br />
138<br />
140<br />
170<br />
420<br />
445<br />
+345<br />
+307<br />
TransAlta BBB / Baa2 / BBB<br />
10 yr<br />
30 yr<br />
135<br />
300<br />
355<br />
380<br />
600<br />
N/A<br />
+465<br />
N/A<br />
Union Gas A/ - /BBB+ 10 yr 57 130 370 +313<br />
30 yr 107 150 395 +288<br />
Westcoast A(low)/ - /BBB+ 10 yr 63 135 410 +347<br />
30 yr 118 155 435 +317<br />
Source: RBC <strong>Capital</strong> Markets, Indicative New Issue Pricing, various issues.<br />
While credit spreads have narrowed since January, 23 this table underscores the potential<br />
magnitude of the incremental costs that are associated with being a BBB rated issuer, and<br />
the importance from both a cost and market access perspective of maintaining ratings in the<br />
A category. It bears noting that, in the case of a downgrade, the increased cost of debt<br />
would be borne by ratepayers over the full life of the issues.<br />
In assessing the importance of maintaining strong A ratings, it is important to consider the<br />
relatively small size of the BBB market in Canada. As reported in “Back to Basics” by<br />
Marlene K. Puffer, Canadian Investment Review, Fall 2006, the BBB corporate debt market<br />
is only 4% of the total market and it is mainly limited to issues with terms under 10 years.<br />
Many institutional investors such as pension funds face limits on the proportion of BBB<br />
23 In early February <strong>2009</strong>, TGI issued 30-year debt at a spread of 285 basis points, or more than 160 basis<br />
points higher than the spread of its 2006 debt issue.<br />
3091 <strong>Terasen</strong> Foster Associates, Inc.<br />
Page | 28
740<br />
741<br />
742<br />
743<br />
744<br />
745<br />
746<br />
747<br />
748<br />
749<br />
750<br />
751<br />
752<br />
753<br />
754<br />
755<br />
756<br />
757<br />
758<br />
759<br />
760<br />
761<br />
762<br />
rated debt they are allowed to hold in their portfolios or cannot invest in BBB rated debt at<br />
all. 24 The small size of the Canadian market for BBB rated debt and the limitations on the<br />
ability of BBB issuers to raise debt in the long-term end of the debt market underscore the<br />
importance of A credit ratings.<br />
From January 2006 to March <strong>2009</strong>, RBC <strong>Capital</strong> Markets 25 recorded $164 billion (452<br />
issues) of corporate debt financing in Canada. Of that amount, companies all of whose<br />
ratings were in the BBB category or below accounted for approximately 6% and 9% of the<br />
total dollar value and number of issues respectively. Even including companies with one<br />
rating in the A category (i.e., split-rated A/BBB category or lower) are included, those issues<br />
account for only 13% and 17% of the total value and number of issues respectively. From<br />
mid-2007 to March <strong>2009</strong>, during which the credit markets have been experiencing various<br />
degrees of turmoil, of 189 reported issues, only seven were by companies with all ratings in<br />
the BBB category or lower, none of which was for a term in excess of 10 years.<br />
<strong>Utilities</strong> need to be able to raise capital on demand. While the capital markets were very<br />
robust and open to new utility issues at the time of the last Commission decision on TGI’s<br />
capital structure in early 2006, the current financial crisis underscores how quickly markets<br />
can change.<br />
TGI will be competing for capital in markets that may be characterized by an unprecedented<br />
requirement for regulated infrastructure capital. Its peers are increasingly global, not solely<br />
Canadian. 26 In its 2008 World Energy Outlook, the International Energy Agency estimated<br />
24 The NEB reported in its August 2005 Canadian HydroCarbon Transportation System Report that Canadian<br />
bonds are an important revenue source to pension funds and other institutional investors, and a downgrade<br />
could require institutional holders to sell a large percentage of their bonds at discounted prices.<br />
25 RBC <strong>Capital</strong> Markets, Credit Weekly, various issues.<br />
26 Comparisons among utilities across borders, particularly by the bond rating agencies, are common. For<br />
example, S&P’s peer comparison for AltaLink includes American Transmission Company and International<br />
Transmission Company, both U.S. companies (Standard and Poor’s, Research: Peer Comparison: North<br />
American Stand-Alone Transmission Companies Deliver Electricity… and Profits, April 26, 2006). Hydro<br />
One’s peers include Consolidated Edison and National Grid, one a U.S. company and one a U.K. company<br />
with extensive U.S. holdings (Standard & Poor’s Peer Comparison: Consolidated Edison Inc., Hydro One Inc.<br />
and National Grid PLC – Same Ratings, Different Basis, October 11, 2005). TransAlta Corporation’s peers<br />
include PPL Corporation and Constellation Energy, both U.S. electric utilities (Standard and Poor’s, TransAlta<br />
Corp, October 22, 2008). Ontario Power Generation’s peers have included two Canadian companies<br />
3091 <strong>Terasen</strong> Foster Associates, Inc.<br />
Page | 29
763<br />
764<br />
765<br />
766<br />
767<br />
768<br />
769<br />
770<br />
771<br />
772<br />
773<br />
774<br />
775<br />
776<br />
777<br />
778<br />
779<br />
780<br />
781<br />
782<br />
that between 2007 and 2030 close to $4.3 trillion in investment would be required by the gas<br />
transmission and distribution ($1.6 trillion) and electricity ($2.6 trillion) industries in North<br />
America. 27 To compete successfully for the required capital, that is, to continue to be able to<br />
attract capital on flexible terms and conditions, TGI will require financial metrics (which<br />
reflect the combination of capital structure and <strong>ROE</strong>) that are competitive with those of their<br />
peers. Competition for capital to address infrastructure investment requirements in North<br />
America (and globally) supports a strengthening of TGI’s financial parameters.<br />
B.5. Comparability of Returns<br />
The combination of the adopted capital structure and return on capital should be comparable<br />
to the returns of comparable risk companies.<br />
In order to be competitive in the capital markets, a regulated utility’s financial parameters –<br />
which encompass both capital structure and <strong>ROE</strong> – need to be comparable to those of its<br />
peers. In this regard, it is important to recognize that TGI competes for capital not only with<br />
other Canadian regulated companies, but with regulated companies globally, as well as with<br />
unregulated companies, both within Canada and globally. The achievement of<br />
comparability requires explicit recognition of the financial parameters of the companies of<br />
comparable risk to TGI, including regulated companies throughout North America. 28<br />
(TransAlta and Emera) and a U.S. company, Exelon (Standard and Poor’s, Research: Ontario Power<br />
Generation Inc., December 9, 2005).<br />
27 Approximately $19 trillion world-wide (Table 2.4).<br />
28 The Conference Board of Canada has pointed out the importance of comparable returns for electric<br />
transmission in Canada. In its May 2004 Briefing entitled, “Electricity Restructuring: Opening Power<br />
Markets”, the Conference Board stated,<br />
“Investors are discouraged by limitations on the regulated cost recovery for transmission upgrading.<br />
Transmission companies are simply not seeing favourable risk/return ratios on their investments, and<br />
know that they can realize better returns in the United States, where regulated rates of return are<br />
much higher. Rates of return to Canadian firms for transmission projects are around 9 to 10 per<br />
cent, well below the 13 to 14 per cent available to U.S. companies. These lower rates discourage<br />
investment in Canadian utilities. Moreover, investors are additionally deterred by the fact that<br />
existing cost-of-service rates do not reflect the economic value of the transmission grid.”<br />
The comments of the Conference Board with respect to electric transmission are no less true of other utility<br />
sectors, including natural gas distribution.<br />
3091 <strong>Terasen</strong> Foster Associates, Inc.<br />
Page | 30
783<br />
784<br />
785<br />
786<br />
787<br />
788<br />
789<br />
790<br />
791<br />
792<br />
793<br />
794<br />
795<br />
796<br />
797<br />
798<br />
799<br />
800<br />
801<br />
802<br />
803<br />
804<br />
805<br />
806<br />
807<br />
808<br />
809<br />
810<br />
C. TRENDS IN BUSINESS RISK AND RELATIVE BUSINESS RISK<br />
OF TGI<br />
In the last cost of capital proceeding in 2005-2006, TGI applied for a common equity ratio<br />
of 38%, in part based on the increased longer-term risks that it was facing, largely related to<br />
a more competitive business environment. Since that proceeding, the competitive<br />
environment in which TGI operates has continued to evolve. As described in more detail in<br />
the Company’s testimony:<br />
(1) The provincial energy policy introduced in early 2007 discourages the use of fossil<br />
fuels, including natural gas, and has imposed a carbon tax on the consumption of<br />
natural gas;<br />
(2) The competitive advantage of natural gas in British Columbia has been eroding over<br />
the past 15 years (since the BCUC first introduced the automatic adjustment<br />
formula);<br />
(3) The new construction market has been shifting from single-family to multi-family<br />
dwellings, for which electricity is the energy source of choice;<br />
(4) Alternative energy sources have become increasingly available to customers (e.g.,<br />
ground source heat pumps);<br />
(5) Per customer usage has continued to decline.<br />
The increased longer-term business risk which TGI faces supports an increase to the 35%<br />
common equity ratio which the BCUC approved in 2006. 29<br />
29 The current allowed equity ratio of 35.01% incorporates the impact of the amalgamation of TGI and<br />
Squamish Gas effective January 1, 2007.<br />
3091 <strong>Terasen</strong> Foster Associates, Inc.<br />
Page | 31
811<br />
812<br />
813<br />
814<br />
815<br />
816<br />
817<br />
818<br />
819<br />
820<br />
821<br />
822<br />
823<br />
824<br />
825<br />
826<br />
827<br />
828<br />
829<br />
830<br />
831<br />
832<br />
833<br />
834<br />
D. CHANGES IN REGULATED CAPITAL STRUCTURES OF<br />
CANADIAN UTILITIES<br />
Since the Commission last reviewed the appropriate capital structures for TGI, there have<br />
been a number of changes in the deemed capital structures adopted for other Canadian<br />
regulated companies with which the <strong>Terasen</strong> utilities would have been compared.<br />
Since the Commission’s last review, the allowed common equity ratios for a number of the<br />
NEB-regulated pipelines have increased. Both Foothills and TCPL-BC System have since<br />
negotiated common equity ratios of 36%, or six percentage points higher than they were<br />
when the Commission conducted its analysis of TGI in 2005. 30 In May 2007, the NEB<br />
approved a multi-year settlement between TCPL and shippers that increased TCPL’s<br />
deemed common equity ratio from the 36% which existed in 2005 to 40%. Westcoast has<br />
also negotiated increases in its deemed common equity ratio for its transmission mainline<br />
since the Commission last reviewed TGI’s capital structure. In 2005, the deemed common<br />
equity ratio was 31%. For 2007, the deemed common equity ratio was 36%. Westcoast<br />
filed a negotiated settlement with the NEB in August 2008 which would maintain the<br />
transmission mainline common equity ratio at 36% from 2008-2010. 31<br />
In isolation, the increases in the deemed common equity ratios of the NEB regulated<br />
pipelines (and maintaining the same differential with TGI) would increase the common<br />
equity ratio for TGI by approximately five percentage points, i.e., to 40%.<br />
30<br />
Foothills Pipe Lines Ltd., Order TG-08-2005, December 21, 2005; TransCanada PipeLines Limited, Order<br />
TG-02-2006, February 22, 2006.<br />
31<br />
As noted earlier, in its Reasons for Decision RH-1-2008 (March <strong>2009</strong>), the NEB did not specify a capital<br />
structure for TQM. Instead, it left it to TQM to choose its optimal capital structure, concluding “The Board is<br />
of the view that while estimating the equity ratio based on business risk, separately from the determination of<br />
the return on equity, can be useful in a regulatory context, it does not reflect the way that much of the business<br />
world approaches capital structure and capital budgeting decisions.” (page 17) TQM had specified a common<br />
equity ratio of 40% in its tolls application.<br />
3091 <strong>Terasen</strong> Foster Associates, Inc.<br />
Page | 32
835<br />
836<br />
837<br />
838<br />
839<br />
840<br />
841<br />
842<br />
843<br />
844<br />
845<br />
846<br />
847<br />
848<br />
849<br />
850<br />
851<br />
852<br />
The Ontario Energy Board has also approved increases for a number of the gas and electric<br />
utilities under its jurisdiction since the Commission’s last review.<br />
Table 2<br />
Decision Equity Change in<br />
Company<br />
Date Ratio Equity Ratio<br />
Union Gas 5/06 36% +1%<br />
Toronto Hydro 12/06 40% +5%<br />
Enbridge Gas Distribution 7/07 36% +1%<br />
Hydro One Transmission 8/07 40% +4%<br />
Consideration of all the increases in the allowed common equity ratios for other Canadian<br />
regulated companies with which TGI would be compared supports an increase in the<br />
common equity ratio of TGI of approximately four percentage points.<br />
E. BOND RATINGS AND CREDIT METRICS<br />
TGI’s debt is currently rated by all three major debt rating agencies, DBRS, Moody’s and<br />
Standard & Poor’s. 32 TGI’s Moody’s debt rating, at A3 for senior unsecured debentures, is<br />
only one notch from the Baa rating category. Since bond investors are more likely to focus<br />
on the lowest rating, it is appropriate to focus on the Moody’s ratings and guidelines.<br />
Moody’s ratings from highest to lowest are as follows:<br />
32 TGI’s S&P ratings are unsolicited ratings.<br />
3091 <strong>Terasen</strong> Foster Associates, Inc.<br />
Page | 33
853<br />
854<br />
855<br />
856<br />
857<br />
858<br />
859<br />
860<br />
861<br />
862<br />
863<br />
864<br />
865<br />
866<br />
867<br />
868<br />
869<br />
870<br />
Table 3<br />
Rating Rating Definition<br />
Aaa Highest quality with minimal credit risk<br />
Aa High quality with very low credit risk<br />
A Upper medium credit with low credit risk<br />
Baa Medium grade with moderate credit risk; may possess certain<br />
speculative elements<br />
Ba Have speculative elements and are subject to substantial credit<br />
risk<br />
B Speculative and subject to high credit risk<br />
Caa Of poor standing and subject to very high credit risk<br />
To ratings within each major category, a modifier of 1 to 3 is appended, with 1 meaning that<br />
the obligation ranks in the upper end of its generic rating category and 3 means that the<br />
obligation ranks at the lower end of its generic rating category. Ratings of Baa3 or higher<br />
are considered investment grade.<br />
Moody’s quantitative methodology for rating North American natural gas distributors<br />
considers four main factors: sustainable profitability (20% weight); regulatory support (10%<br />
weight); ring-fencing (10% weight); and financial strength and flexibility (60% weight).<br />
The sustainable profitability and financial strength and flexibility factors are divided into<br />
sub-categories with individual weights assigned to the sub-categories. The table below<br />
shows where TGI scored 33 in each of the categories in the most recent Moody’s Credit<br />
Opinions and compares them to the median indicated ratings of the natural gas distribution<br />
utilities which are included in my sample of low risk U.S. utilities used to estimate the cost<br />
of equity for TGI.<br />
33 Based on expected implied ratings levels where different from historic levels.<br />
3091 <strong>Terasen</strong> Foster Associates, Inc.<br />
Page | 34
871<br />
872<br />
873<br />
874<br />
875<br />
876<br />
877<br />
878<br />
879<br />
880<br />
881<br />
882<br />
883<br />
884<br />
885<br />
886<br />
887<br />
Table 4<br />
Rating on Factor<br />
Proxy LDCs<br />
Factor Weight TGI<br />
1/<br />
Sustainable Profitability:<br />
(Median)<br />
<strong>ROE</strong> 15% Baa A<br />
EBIT/Customer Base 5% A A<br />
Regulatory Support 10% Aa Aaa/Aa<br />
Ring-Fencing<br />
Financial Strength and<br />
Flexibility:<br />
10% Aa A<br />
EBIT Interest Coverage 15% Ba Aa/A<br />
Retained Cash Flow/Debt 15% Ba Baa<br />
Debt/Book <strong>Capital</strong>ization 15% Ba A<br />
Free Cash Flow/Funds from<br />
Operations<br />
15% Aa Aa/A<br />
Actual Rating A3 A3<br />
1/<br />
AGL Resources, Indiana Gas, New Jersey Resources (New Jersey Natural Gas), Northwest<br />
Natural Gas, Piedmont Natural Gas, Vectren Corporation (Indiana Gas) and WGL Holdings.<br />
Sources: Moody’s, Rating Methodology: North American Regulated Gas Distribution<br />
Industry (Local Distribution Companies), October 2006 and Credit Opinion:<br />
<strong>Terasen</strong> Gas Inc., May 27, 2008.<br />
Table 4 shows that TGI’s implied ratings in three of four of the Financial Strength and<br />
Flexibility categories, including capital structure, are below investment grade; on average, it<br />
is Baa rated on Financial Strength and Flexibility.<br />
Moody’s noted with respect to TGI that “Notwithstanding TGI's relatively low risk business<br />
profile, its financial profile is considered weak at the A3, senior unsecured rating level.<br />
Accordingly, further sustained weakening of TGI's financial metrics, for instance <strong>ROE</strong><br />
below 8%, EBIT/Interest below 2x, RCF/Debt below 5% and/or Debt/Book <strong>Capital</strong>ization<br />
(Excluding Goodwill) above 65%, would likely lead to a downgrade of TGI's rating.” 34<br />
34<br />
Both DBRS and Standard & Poor’s consider the equity ratios adopted for Canadian utilities to be thin (and<br />
the allowed equity returns relatively low).<br />
For example, in reference to FortisAlberta, DBRS commented that:<br />
3091 <strong>Terasen</strong> Foster Associates, Inc.<br />
Page | 35
888<br />
889<br />
890<br />
891<br />
892<br />
893<br />
894<br />
895<br />
896<br />
897<br />
898<br />
899<br />
900<br />
901<br />
TGI’s weak financial profile for the rating, with all four factors already at the lower limits<br />
cited by Moody’s, warrants an increase in the common equity ratio, which in turn, would<br />
improve the EBIT Coverage and Retained Cash Flow/Debt ratios.<br />
With its existing approved regulated capital structure of 64.99% debt and 35.01% common<br />
equity ratio, TGI falls below Moody’s investment grade guideline range (50-65% for a Baa<br />
rating on the Debt/Book <strong>Capital</strong>ization factor). 35 An increase to the common equity ratio to<br />
40.0% (debt ratio of 60.0%) would, in isolation, place TGI within the investment grade<br />
guidelines.<br />
With respect to EBIT interest coverage, Moody’s guideline ranges for A and Baa ratings are<br />
3-5X and 2-3X times respectively. TGI’s EBIT interest coverage has been just at or below<br />
2X since 2000, i.e., in the Ba guideline range (below investment grade). Since the<br />
Company’s embedded cost of debt has declined by close to 1.3 percentage points since<br />
In Alberta, as well as in many other jurisdictions in Canada, the rates of return and equity<br />
capitalization for ratemaking purposes allowed by regulators have been low in recent years, largely as<br />
a result of the low interest rate environment. This has had a negative impact on earnings and cash<br />
flows. FortisAlberta’s equity thickness at 37% and low <strong>ROE</strong>’s directly impact shareholder returns,<br />
hindering the ability to attract capital for capital expenditure purposes. In addition, the allowed <strong>ROE</strong>s<br />
are significantly below those allowed for similar operations in the U.S. This acts as a disincentive for<br />
investors to allocate capital to Canadian utilities because they can earn higher rates of return in the<br />
U.S. from businesses having similar business risk profiles. (DBRS, Credit Rating Report:<br />
FortisAlberta, November 25, 2005).<br />
In general, S&P considers that Canadian utility financial policies tend to be aggressive with leverage, and<br />
regulators parsimonious with returns. (Standard & Poor’s, Industry Report Card: Regulatory Rulings, M&A,<br />
and Fuel Cost Recovery Dominate Global <strong>Utilities</strong> Credit Environment, November 21, 2006. The “aggressive<br />
leverage” is largely a result of regulatory directives, as noted by S&P in its March 2003 report entitled<br />
Canadian Regulation Reassessed as a Ratings Factor. In that report S&P had noted that Canadian utilities are<br />
among the most highly levered utilities in their global ratings universe, and that the highly leveraged financial<br />
profiles generally stem from regulatory directives.<br />
As a specific example, in its report for Union Gas issued subsequent to the utility’s 2006 settlement raising the<br />
allowed common equity ratio to 36%, the two weaknesses referred to were the high leverage associated with<br />
company's regulated capital structure and the relatively low allowed <strong>ROE</strong> compared with global peers.(S&P,<br />
Research: Union Gas, August 24, 2006).<br />
35 In calculating the debt ratio for debt rating purposes, Moody’s, and Standard & Poor’s, make adjustments to<br />
the reported amounts of debt and equity on the financial statements to capture debt-like elements of balance<br />
sheet items. Moody’s for example adjusts the reported debt and equity amounts for operating leases. The<br />
adjustments typically result in an adjusted debt ratio for debt rating purposes that is higher than the ratio<br />
deemed for regulatory purposes.<br />
3091 <strong>Terasen</strong> Foster Associates, Inc.<br />
Page | 36
902<br />
903<br />
904<br />
905<br />
906<br />
907<br />
908<br />
909<br />
910<br />
911<br />
912<br />
913<br />
914<br />
915<br />
916<br />
917<br />
918<br />
919<br />
920<br />
921<br />
922<br />
923<br />
924<br />
925<br />
1999/2000, it would have been reasonable to expect a “natural” improvement in interest<br />
coverage as interest rates fell and older higher cost debt was retired. Instead, the interest<br />
coverage has remained essentially flat, despite the increase in the allowed common equity<br />
ratio in 2006. In part the lack of improvement in the interest coverage ratio reflects the<br />
decline in allowed <strong>ROE</strong>, which has fallen close to 1% between 1999/2000 and <strong>2009</strong>.<br />
The level of pre-tax interest coverage is also a function of the corporate income tax rate. All<br />
other things equal, the lower corporate income tax rates reduce pre-tax interest coverage.<br />
Since the automatic adjustment formula has been in place, the combined provincial/federal<br />
corporate income tax rate has declined from over 45% in the mid-1990s to 28.5% in 2010.<br />
In 2005, the last time the BCUC reviewed the capital structure for TGI, the combined rate<br />
was 34.1%. At the <strong>2009</strong> allowed <strong>ROE</strong> of 8.47%, the approved capital structure and<br />
embedded debt costs, the reduction in the corporate income tax rate from 33.97% to 28.5%<br />
lowers the pre-tax interest coverage by approximately 0.08 times. 36 In isolation, the lower<br />
corporate income tax rate in 2010 indicates that an increase in common equity ratio from the<br />
current 35.01% would be warranted simply to maintain the same level of pre-tax coverage<br />
ratios achievable at the 2005 corporate income tax rate. 37<br />
In comparison to the U.S. gas distribution utilities which are included in the proxy sample of<br />
U.S. utilities used to estimate the cost of equity (See Chapter VI), TGI compares<br />
unfavourably in Moody’s Financial Strength and Flexibility Factors. On average, the<br />
implied Financial Strength and Flexibility rating for the proxy LDCs is A, compared to the<br />
Baa implied ratings of TGI. It is also of note that, while superior regulatory support is<br />
frequently cited as the reason Canadian utilities are rated higher than their U.S. peers, the<br />
36 The lower tax rate also raises the potential variability in after-tax equity returns. Effectively, a taxable utility<br />
can share downside business risk with the Canada Revenue Agency (CRA). The lower the corporate income<br />
tax rate, the larger will be the decline in the achieved return for a given percentage decline in operating income.<br />
In the Alberta Generic Cost of <strong>Capital</strong> Decision 2004-052, the EUB recognized this principle when it adopted a<br />
higher deemed common equity ratio for non-taxable than taxable utilities. The reduction in the corporate<br />
income tax rate in British Columbia from approximately 34% in 2006 to 28.5% in 2010 and to 25% by 2012<br />
increases the variability of after-tax <strong>ROE</strong>s marginally.<br />
37 By 2012, the combined federal/provincial corporate income tax rate is expected to decline to 25%, which, all<br />
other things equal, would further reduce EBIT interest coverage.<br />
3091 <strong>Terasen</strong> Foster Associates, Inc.<br />
Page | 37
926<br />
927<br />
928<br />
929<br />
930<br />
931<br />
932<br />
933<br />
934<br />
935<br />
936<br />
937<br />
938<br />
939<br />
940<br />
941<br />
942<br />
943<br />
944<br />
945<br />
946<br />
947<br />
948<br />
949<br />
950<br />
951<br />
median regulatory support rating of the proxy U.S. LDCs, at Aaa/Aa, is higher than the Aa<br />
implied rating of TGI.<br />
The table below compares key credit metrics of TGI with those of the universe of Canadian<br />
utilities with rated debt and with those of A rated U.S. electric and gas utilities.<br />
Company/Sample<br />
Table 5<br />
Ratings<br />
DBRS/Moody’s/S&P<br />
Common<br />
Equity<br />
Ratio<br />
(2008)<br />
EBIT<br />
Interest<br />
Coverage<br />
(2005-<br />
2007)<br />
FFO to<br />
Total<br />
Debt<br />
(2005-<br />
2007)<br />
FFO<br />
Interest<br />
Coverage<br />
(2005-<br />
2007)<br />
TGI A/A2/AA- 34.8% 1/ 2.0x 9.1% 2.4x<br />
All Canadian <strong>Utilities</strong><br />
with Rated Debt A/A3/A- 40.4% 2.5x 14.5% 3.2x<br />
U.S. A-Rated Gas<br />
Distribution (All) -/A3/A 46.7% 3.7x 20.2% 4.5x<br />
U.S. Proxy Utility<br />
Sample -/A3/A 41.9% 3.6x 21.3% 4.4x<br />
U.S. Proxy Utility<br />
Sample-LDC Only -/ A3 / A 45.3% 3.8x 21.7% 4.7x<br />
Definitions:<br />
Earnings before Interest and<br />
Taxes (EBIT) Interest Coverage: Operating income divided by interest<br />
expense.<br />
Funds from Operations (FFO) to<br />
Total Debt: FFO equals net income plus<br />
depreciation, amortization and deferred<br />
taxes. FFO to debt equals FFO divided<br />
by total debt.<br />
Funds from Operations (FFO)<br />
Interest Coverage: FFO plus interest expense divided by<br />
interest expense.<br />
1/<br />
The 2008 common equity ratio of 34.8% includes Construction Work In Progress financed 100% with debt.<br />
Source: Schedules 4, 5, 6 and 15<br />
As the table above demonstrates, the credit metrics of TGI and Canadian utilities generally<br />
compare unfavourably to their U.S. peers. In other words, they are competing for capital<br />
with U.S. utilities with stronger financial metrics. Moreover, as utility debt yield spreads<br />
3091 <strong>Terasen</strong> Foster Associates, Inc.<br />
Page | 38
952<br />
953<br />
954<br />
955<br />
956<br />
957<br />
958<br />
959<br />
960<br />
961<br />
962<br />
963<br />
964<br />
965<br />
966<br />
967<br />
968<br />
969<br />
970<br />
971<br />
972<br />
973<br />
974<br />
975<br />
976<br />
977<br />
978<br />
between Canada and the U.S have converged, Canadian utilities no longer have a built-in<br />
domestic cost advantage in raising capital. 38 In setting the allowed return, (the capital<br />
structure as well as the <strong>ROE</strong>), the BCUC needs to recognize that Canadian utilities generally<br />
and TGI specifically should be allowed to achieve a degree of financing flexibility which is<br />
comparable to that of its North American peers.<br />
The actual credit metrics of U.S. utilities reflect the returns (a combination of the <strong>ROE</strong> and<br />
capital structure) that are awarded by regulators. From 2006-March <strong>2009</strong>, the average<br />
common equity ratio adopted by U.S. regulators for gas distribution utilities with weather<br />
normalization clauses and/or decoupling was approximately 48% with corresponding<br />
awarded <strong>ROE</strong>s averaging 10.2%.<br />
F. REASONABLENESS OF PROPOSED CAPITAL STRUCTURE<br />
Within a reasonable range, the capital structure for a particular utility is appropriately a<br />
decision for management, because management is in the best position to assess its business<br />
risks, financing requirements and access to debt and equity capital. In my opinion, the<br />
capital structure proposed by TGI, containing 40.0% common equity, is within a reasonable<br />
range, albeit at the lower end, for the reasons summarized below.<br />
1. The level of business risk to which TGI is exposed has risen since the BCUC set the<br />
allowed common equity ratio at 35% in 2006.<br />
2. There have been material increases in the allowed common equity ratios of some of<br />
TGI’s Canadian utility peers, in particular the NEB-regulated gas pipelines, with<br />
whom TGI competes for capital.<br />
38 Over the ten year period ending December 2005, for example, the average yield spread between long-term A<br />
rated Canadian utility and long-term Canada bonds was approximately 40 basis points lower than the<br />
corresponding yield spread between U.S. long-term A rated utility and Treasury bonds. Since the elimination<br />
of the Foreign Property Rule (FPR) in 2005, the spreads have converged. From January 2006 to the end of<br />
March <strong>2009</strong>, on average the spreads in Canada and the U.S. have been virtually identical (differential less than<br />
10 basis points).<br />
3091 <strong>Terasen</strong> Foster Associates, Inc.<br />
Page | 39
979<br />
980<br />
981<br />
982<br />
983<br />
984<br />
985<br />
986<br />
987<br />
988<br />
989<br />
990<br />
991<br />
992<br />
993<br />
994<br />
995<br />
996<br />
997<br />
998<br />
999<br />
1000<br />
1001<br />
1002<br />
1003<br />
1004<br />
1005<br />
1006<br />
1007<br />
1008<br />
1009<br />
3. TGI’s credit metrics are weak for its credit ratings, and in isolation fall below<br />
investment grade guidelines;<br />
4. Lower allowed <strong>ROE</strong>s and lower corporate income tax rates have placed downward<br />
pressure on what otherwise would be improving interest coverage ratios; further<br />
expected reductions in income tax rates will continue to lower coverage ratios, all<br />
other things equal.<br />
5. The debt rating agencies continue to view the capital structure ratios of Canadian<br />
utilities as weak. A 40.0% common equity ratio for TGI lies at lower end of<br />
Moody’s guideline range for an investment grade rating on this credit metric.<br />
6. The further global integration of the Canadian capital markets, particularly with the<br />
termination of the Foreign Property Rule warrants a strengthening of TGI’s financial<br />
parameters to provide the ability to offer a return compensatory with its risk and<br />
comparable to those of its global peers.<br />
7. The forecast North American and global investment requirements for infrastructure<br />
point to significant competition for capital going forward. TGI should be positioned<br />
so that it can compete successfully, that is, continue to obtain capital as required on<br />
reasonable terms and conditions. At the existing capital structure, TGI’s credit<br />
metrics compare unfavourably to those of its U.S. peers.<br />
While the proposed increase in common equity ratio will lower TGI’s financial risks, a<br />
40.0% common equity ratio is still materially lower than that maintained by its U.S. peers.<br />
The lower common equity exposes TGI to higher financial risks, which need to be<br />
recognized when setting the allowed <strong>ROE</strong>.<br />
The recommended <strong>ROE</strong> which is developed in Section VI is premised on a deemed common<br />
equity ratio for TGI of 40.0%. If a lower common equity ratio were approved, the required<br />
<strong>ROE</strong> would be higher to compensate for the higher financial risks. At the existing common<br />
3091 <strong>Terasen</strong> Foster Associates, Inc.<br />
Page | 40
1010<br />
1011<br />
1012<br />
1013<br />
1014<br />
1015<br />
equity ratio of 35%, the recommended <strong>ROE</strong> would be approximately 55-90 basis points<br />
higher than the <strong>ROE</strong> at a 40.0% common equity ratio. 39<br />
39 It bears noting that the proposed increase in the common equity ratio is predicated on TGI being awarded a<br />
fair return. Investors have no incentive to commit further equity to any enterprise if the expected return is<br />
inadequate.<br />
3091 <strong>Terasen</strong> Foster Associates, Inc.<br />
Page | 41
1016<br />
1017<br />
1018<br />
1019<br />
1020<br />
1021<br />
1022<br />
1023<br />
1024<br />
1025<br />
1026<br />
1027<br />
1028<br />
1029<br />
1030<br />
1031<br />
1032<br />
1033<br />
1034<br />
1035<br />
1036<br />
1037<br />
1038<br />
VI. FAIR RETURN ON EQUITY<br />
A. APPROACH TO ESTIMATION OF RETURN ON EQUITY<br />
The key to determining the fair return on equity (i.e., ensuring that all three requirements of<br />
the fair return standard are met) is reliance on multiple tests. There are three different types<br />
of tests that have traditionally been used to estimate the fair return on equity: equity risk<br />
premium, discounted cash flow and comparable earnings tests. Each of the tests is based on<br />
different premises and brings a different perspective to the fair return on equity. None of the<br />
individual tests is, on its own, a sufficient means of estimating the fair return; each of the<br />
tests has its own strengths and weaknesses. Individually, each of the tests can be<br />
characterized as a relatively inexact instrument; no single test can pinpoint the fair return. 40<br />
Moreover, different tests may be more or less reliable depending on prevailing economic<br />
and capital market conditions. 41 These considerations not only emphasize the importance of<br />
reliance on multiple tests, but also of benchmarking, or testing the reasonableness of the test<br />
results themselves against other relevant information.<br />
Moreover, the criteria that define a fair return, set forth in Chapter II, give rise to separate<br />
standards of capital attraction and comparable returns. A fair and reasonable return gives<br />
weight to both the cost of attracting capital standard and comparable returns standard. 42 The<br />
40 For example, Bonbright states, “No single or group test or technique is conclusive. Therefore, it is generally<br />
accepted that commissions may apply their own judgment in arriving at their decisions.” (James C. Bonbright,<br />
Albert L. Danielsen, David R. Kamerschen, Principles of Public Utility Rates, 2 nd Ed., page 317, Arlington,<br />
VA.: Public Utility Reports, Inc., March 1988).<br />
41<br />
For example, see Federal Communications Commission, Report and Order 42-43, CC Docket No. 92-133<br />
(1995).<br />
“Equity prices are established in highly volatile and uncertain capital markets... Different forecasting<br />
methodologies compete with each other for eminence, only to be superseded by other methodologies<br />
as conditions change... In these circumstances, we should not restrict ourselves to one methodology,<br />
or even a series of methodologies, that would be applied mechanically. Instead, we conclude that we<br />
should adopt a more accommodating and flexible position.”<br />
42<br />
Appendix A discusses the distinctions between the two standards.<br />
3091 <strong>Terasen</strong> Foster Associates, Inc.<br />
Page | 42
1039<br />
1040<br />
1041<br />
1042<br />
1043<br />
1044<br />
1045<br />
1046<br />
1047<br />
1048<br />
1049<br />
1050<br />
1051<br />
1052<br />
1053<br />
1054<br />
1055<br />
1056<br />
1057<br />
1058<br />
1059<br />
1060<br />
1061<br />
1062<br />
1063<br />
1064<br />
1065<br />
1066<br />
requirements of the two standards are met using different types of tests. The equity risk<br />
premium and discounted cash flow tests establish the cost of attracting capital. The<br />
comparable earnings test is one measure of the comparable returns standard. To establish a<br />
fair return on equity for TGI, I have applied all three. The application of each of the tests is<br />
discussed in the sections below.<br />
B. EQUITY RISK PREMIUM TESTS<br />
B.1. Conceptual Underpinnings<br />
An equity risk premium test is derived from the basic concept of finance that there is a direct<br />
relationship between the level of risk assumed and the return required. Since an investor in<br />
common equity takes greater risk than an investor in bonds, the former requires a premium<br />
above bond yields in compensation for the greater risk. Equity risk premium tests are a<br />
measure of the market-related cost of attracting capital, i.e., a return on the market value of<br />
the common stock, not the book value.<br />
Equity risk premium tests, similar to the other tests used to arrive at a fair return, are<br />
forward-looking, that is, they are intended to estimate investors’ future equity return<br />
requirements. The magnitude of the differential between the required/expected return on<br />
equities and the risk-free rate is a function of investors’ willingness to take risks 43 and their<br />
views of such key factors as inflation, productivity and profitability. Because equity risk<br />
premium tests are forward-looking, historic risk premium data need to be evaluated in light<br />
of prevailing economic/capital market conditions. If available, direct estimates of the<br />
forward-looking risk premium should supplement estimates of the risk premium made using<br />
historic data as the point of departure.<br />
43 To illustrate, as discussed in Section II above, as demonstrated by the MVX index in Canada, equity market<br />
volatility has picked up significantly and investor risk aversion has increased in the period since TGI last<br />
appeared before the BCUC as investors have become less sanguine about the future of the equity market.<br />
3091 <strong>Terasen</strong> Foster Associates, Inc.<br />
Page | 43
1067<br />
1068<br />
1069<br />
1070<br />
1071<br />
1072<br />
1073<br />
1074<br />
1075<br />
1076<br />
1077<br />
1078<br />
1079<br />
1080<br />
1081<br />
1082<br />
1083<br />
1084<br />
1085<br />
1086<br />
1087<br />
1088<br />
1089<br />
1090<br />
1091<br />
1092<br />
1093<br />
B.2. Risk-Free Rate<br />
The application of equity risk premium tests require a forecast of the risk-free rate to which<br />
the equity risk premium is applied. Reliance on a long-term government bond yield as the<br />
risk-free rate recognizes (1) the administered nature of short-term rates; and (2) the long-<br />
term nature of the assets to which the equity return is applicable.<br />
For the purpose of applying the equity risk premium tests, the estimated long-term Canada<br />
bond yield is 4.25%. The estimate relies as a point of departure on the April <strong>2009</strong><br />
Consensus Forecasts’ 3.1% 10-year Canada bond yield forecast for April 2010, 44 which,<br />
with a current 0.75% spread between 10-year and 30-year Canada bond yields, results in a<br />
yield of 3.85%. It is reasonable to expect that long-term Canada bond yields will rise during<br />
2010 as the economy strengthens. A 4.25% long-term Canada bond yield forecast for 2010<br />
reflects increases in yield of approximately 0.2% per quarter throughout the year, and is<br />
consistent with a gradual upward trend toward the forecast yield expected to prevail over the<br />
longer term of approximately 5.25%. 45<br />
B.3. Risk-Adjusted Equity Market Risk Premium Test<br />
B.3.a. Conceptual and Empirical Considerations<br />
The risk-adjusted equity market risk premium approach to estimating the required utility<br />
equity risk premium entails (1) estimating the equity risk premium for the equity market as a<br />
whole; (2) estimating the relative risk adjustment; and (3) applying the relative risk<br />
adjustment to the equity market risk premium, to arrive at the required utility equity risk<br />
premium. The cost of equity is thus estimated as:<br />
44 Consensus Economics does not provide a forecast of the 30-year Canada bond yield, nor does it provide a<br />
forecast of 10-year Canada bond yields for all of 2010.<br />
45 Consensus Economics, Consensus Forecasts, April <strong>2009</strong> forecast the average 10-year Canada bond yield<br />
from 2011-2019 at approximately 5.0%. The spread between 10-year and 30-year long term Canada bond<br />
yields has historically averaged approximately 35 basis points.<br />
3091 <strong>Terasen</strong> Foster Associates, Inc.<br />
Page | 44
1094<br />
1095<br />
1096<br />
1097<br />
1098<br />
1099<br />
1100<br />
1101<br />
1102<br />
1103<br />
1104<br />
1105<br />
1106<br />
1107<br />
1108<br />
1109<br />
1110<br />
1111<br />
1112<br />
1113<br />
1114<br />
1115<br />
1116<br />
1117<br />
1118<br />
1119<br />
1120<br />
1121<br />
Risk-Free<br />
Rate<br />
+ {<br />
Relative Risk<br />
Adjustment<br />
3091 <strong>Terasen</strong> Foster Associates, Inc.<br />
Page | 45<br />
x<br />
Market Risk<br />
Premium }<br />
The risk-adjusted equity market risk premium test is a variant of the <strong>Capital</strong> Asset Pricing<br />
Model (CAPM). The CAPM attempts to measure, within the context of a diversified<br />
portfolio, what return an equity investor should require (in contrast to what the investor<br />
does require). Its focus is on the minimum return that will allow a company to attract equity<br />
capital.<br />
In the CAPM, risk is measured using the beta. Theoretically, the beta is a forward looking<br />
estimate of the contribution of a particular stock to the overall risk of a portfolio. In<br />
practice, the beta is a calculation of the historical correlation between the overall equity<br />
market returns, as proxied in Canada by the returns on S&P/TSX Composite, and the returns<br />
on individual stocks or portfolios of stocks.<br />
The CAPM, framed in an elegant, simple construct, has an intuitive appeal. However, in<br />
addition to its restrictive premises, the CAPM does have disadvantages that caution against<br />
placing sole reliance on it for purposes of determining a fair return on equity. The<br />
disadvantages are summarized in Appendix B.<br />
B.3.b. Equity Market Risk Premium<br />
B.3.b.(1) Globalization and Relevance of U.S. Equity Market Experience<br />
My estimate of the expected/required equity market risk premium was made by reference to<br />
an analysis of historic (experienced) market risk premiums. Analysis of historic risk<br />
premiums should not be limited to the Canadian experience, but should also take into<br />
account the U.S. equity market as a relevant benchmark for estimating the equity risk<br />
premium from the perspective of Canadian investors.
1122<br />
1123<br />
1124<br />
1125<br />
1126<br />
1127<br />
1128<br />
1129<br />
1130<br />
1131<br />
1132<br />
1133<br />
1134<br />
1135<br />
1136<br />
1137<br />
1138<br />
1139<br />
1140<br />
1141<br />
1142<br />
1143<br />
1144<br />
1145<br />
1146<br />
The historic Canadian equity and government bond returns incorporate various factors that<br />
make them questionable as a realistic representation of expected risk premiums (e.g., capital<br />
held captive in Canada as a matter of policy, lack of equity market liquidity and diversity,<br />
and the higher risk of the Government of Canada bond market historically, which has since<br />
dissipated). These factors are set out in Appendix B.<br />
Of particular importance has been the historic impact of the Foreign Property Rule (FPR),<br />
which capped the proportion of foreign investment that could be held by individuals (in<br />
RRSPs) and by pension funds. The combination of mediocre returns and small size of the<br />
Canadian market relative to the total global market (approximately 2%) put pressure on the<br />
government to increase and finally eliminate the cap on foreign investment that could be<br />
held in RRSPs and pension funds. This cap had been as low as 10% of the book value of<br />
assets (from 1971 to 1990) and was at 30% when it was removed entirely in 2005. 46<br />
Historic Canadian equity returns therefore are likely to understate investor return<br />
requirements.<br />
Investor reaction to the increasingly less restrictive FPR supports that conclusion. Equity<br />
investment outside of Canada grew rapidly as the barriers to foreign investment (in terms of<br />
transactions and information costs as well as the foreign investment cap) declined. Foreign<br />
stock purchases by Canadians increased almost ten-fold between 1995 and 2007. Purchases<br />
of foreign stocks in 1995 were $83 billion; in 2007, they were $915 billion. Although<br />
purchases declined in 2008, they were still almost $750 billion during the first eleven<br />
months of the year. In mid-2008, although the total percentage of foreign assets in trusteed<br />
pension funds was less than 30%, the percentage of foreign equity to total equity was close<br />
47 48<br />
to 45%.<br />
46 From 1957 to 1971 no more than 10% of income could come from foreign sources.<br />
47 Based on market value. On a book value basis, the proportion of foreign assets in the pension funds is closer<br />
to 33% and over 50% of all equity investment is foreign. Statistics Canada, Table 280-0003.<br />
48 Pension funds are increasingly investing in infrastructure assets outside of Canada. For example, a<br />
consortium of investors including the British Columbia Investment Management Corporation, the Alberta<br />
Investment Management Corporation and the Canada Pension Plan Investment Board are in the process of<br />
acquiring Puget Energy, an electric and gas utility serving northern Washington state. The most recent allowed<br />
returns for Puget Sound Energy (both electric and gas) were 10.15% on a 46% common equity ratio, adopted<br />
in October 2008.<br />
3091 <strong>Terasen</strong> Foster Associates, Inc.<br />
Page | 46
1147<br />
1148<br />
1149<br />
1150<br />
1151<br />
1152<br />
1153<br />
1154<br />
1155<br />
1156<br />
1157<br />
1158<br />
1159<br />
1160<br />
1161<br />
1162<br />
1163<br />
1164<br />
1165<br />
1166<br />
1167<br />
1168<br />
1169<br />
1170<br />
1171<br />
1172<br />
1173<br />
1174<br />
The relevance of the U.S. experience to the estimation of the risk premium from a Canadian<br />
perspective has increased as the relationship between Canadian and U.S. interest rates has<br />
changed. Historically, much of the difference between the achieved risk premiums in<br />
Canada and the U.S. arises from higher interest rates in Canada. With the vastly improved<br />
economic fundamentals in Canada (e.g., lower inflation, balanced budgets), the relative risk<br />
of investing in Canadian government bonds has declined. Consequently, the differential<br />
between Canadian and U.S. government bond yields and returns that existed historically has<br />
been substantially reduced. Over the period 1926-1996, the difference between long-term<br />
government bond yields in Canada and the U.S. averaged close to 100 basis points.<br />
Between 1997 and 2008, the difference was approximately -20 basis points.<br />
The most recent consensus of long-term forecasts of government bond yields anticipates that<br />
10-year government bond yields will be virtually identical in the two countries, at<br />
approximately 5.0% for Canada and 5.2% for the U.S. over the period 2011-2019<br />
(Consensus Economics, Consensus Forecasts, April <strong>2009</strong>). 49 With similar interest rates in<br />
the two countries going forward, the U.S. historic equity market risk premium is a relevant<br />
benchmark in the estimation of the forward-looking equity market risk premium for<br />
Canadian investors.<br />
On the equity side of the equation, the Canadian equity market composite is dominated by<br />
two sectors, financial services and energy. These two sectors alone accounted for<br />
approximately 57% of the total market capitalization of the S&P/TSX Composite at the end<br />
of December 2008. In contrast to the S&P/TSX Composite, the historic U.S. equity returns<br />
have been generated by a more diversified and liquid market. In addition, the U.S. equity<br />
market has historically been the principal alternative for Canadian investors to domestic<br />
equity investments. Approximately 47% of Canadian portfolio investment in foreign<br />
equities at the end of 2007 was in the U.S. 50 The diversified nature of the U.S. equity<br />
49 Blue Chip Economic Indicators (March <strong>2009</strong>), which canvasses economic forecasters at 50 financial<br />
institutions, anticipates a 10-year U.S. Treasury yield of 5.25% from 2011-2020.<br />
50 Statistics Canada, Canada’s International Investment Position – Fourth Quarter 2008. Of the remaining<br />
53%, the next largest allocation of foreign portfolio equity investment is the U.K., which accounted for 11%.<br />
3091 <strong>Terasen</strong> Foster Associates, Inc.<br />
Page | 47
1175<br />
1176<br />
1177<br />
1178<br />
1179<br />
1180<br />
1181<br />
1182<br />
1183<br />
1184<br />
1185<br />
1186<br />
1187<br />
1188<br />
1189<br />
1190<br />
1191<br />
1192<br />
1193<br />
1194<br />
1195<br />
1196<br />
1197<br />
market and the close relationship between the Canadian and U.S. capital markets and<br />
economies warrant giving significant weight to U.S. historical equity risk premiums in the<br />
estimation of the required equity risk premium for Canadian utilities, e.g., TGI.<br />
B.3.b.(2) The Post-World War II Period<br />
The estimation of the expected/required market risk premium from achieved market risk<br />
premiums is premised on the notion that investors’ return expectations and requirements are<br />
linked to their past experience. Basing calculations of achieved risk premiums on the<br />
longest periods available reflects the notion that it is necessary to reflect as broad a range of<br />
event types as possible to avoid overweighting periods that represent “unusual”<br />
circumstances. On the other hand, the objective of the analysis is to assess investor<br />
expectations in the current economic and capital market environment. Consequently, I<br />
focused on post-World War II returns, that is, 1947-2008, a period more closely aligned with<br />
what today’s investors are likely to anticipate over the longer-term. 51 I have also taken<br />
account of achieved returns and risk premiums over longer periods.<br />
B.3.b.(3) Historic Risk Premiums from 1947-2008<br />
As previously indicated, in arriving at an estimation of the market risk premium, my point of<br />
departure was both Canadian and U.S. historic returns and risk premiums during the post-<br />
World War II period. The average U.S. and Canadian historic risk premiums during that<br />
period were as follows:<br />
51 Key structural economic changes have occurred since the end of World War II, including:<br />
1. The globalization of the North American economies, which has been facilitated by the reduction in<br />
trade barriers of which GATT (1947) was a key driver;<br />
2. Demographic changes, specifically suburbanization and the rise of the middle class, which have<br />
impacted on the patterns of consumption;<br />
3. Transition from a resource-oriented/manufacturing economy to a service-oriented economy;<br />
4. Technological change, particularly in the areas of telecommunications and computerization, which<br />
have facilitated both market globalization and rising productivity.<br />
3091 <strong>Terasen</strong> Foster Associates, Inc.<br />
Page | 48
1198<br />
1199<br />
1200<br />
1201<br />
1202<br />
1203<br />
1204<br />
1205<br />
1206<br />
1207<br />
1208<br />
1209<br />
1210<br />
1211<br />
1212<br />
1213<br />
1214<br />
1215<br />
1216<br />
1217<br />
1218<br />
1219<br />
1220<br />
1221<br />
1222<br />
Table 6<br />
Historic Risk Premiums<br />
Arithmetic Averages<br />
(1947-2008)<br />
Versus Bond<br />
Total Returns<br />
Versus Bond<br />
Income Returns<br />
Canada 4.6% 4.4%<br />
U.S. 5.6% 6.2%<br />
Source: Schedule 8.<br />
B.3.b.(4) Superiority of Arithmetic Averages<br />
When historic risk premiums are used as a basis for estimating the expected risk premium,<br />
arithmetic averages, not geometric (compound) averages, should be used. The geometric<br />
average, which is appropriate for use in describing historic portfolio performance, represents<br />
the achieved return as if it had been a constant average annual return. Using the arithmetic<br />
average of all past returns recognizes the probability distribution of future outcomes based<br />
on past variations in annual returns. Expressed simply, the arithmetic average recognizes<br />
the uncertainty in the stock market; the geometric average removes the uncertainty by<br />
smoothing over annual differences. (See Appendix B for further discussion).<br />
B.3.b.(5) Income Returns versus Total Bond Returns<br />
The application of the CAPM requires the estimation of the market return in relation to the<br />
risk-free rate. While government bonds are considered default-free, they are not risk-free;<br />
they are subject to interest rate risk. The total bond returns experienced include capital gains<br />
and losses resulting from changes in interest rates over time. The bond income return, in<br />
contrast, reflects only the bond coupon payment portion of the total bond return; it<br />
represents the riskless component of the bond return. In principle, using the bond income<br />
return more accurately measures the historic equity risk premium above the risk-free rate.<br />
3091 <strong>Terasen</strong> Foster Associates, Inc.<br />
Page | 49
1223<br />
1224<br />
1225<br />
1226<br />
1227<br />
1228<br />
1229<br />
1230<br />
1231<br />
1232<br />
1233<br />
1234<br />
1235<br />
1236<br />
1237<br />
1238<br />
1239<br />
1240<br />
1241<br />
1242<br />
1243<br />
1244<br />
1245<br />
1246<br />
1247<br />
1248<br />
1249<br />
1250<br />
1251<br />
B.3.b.(6) Historic Risk Premiums and Price/Earnings Ratios<br />
The 1998-2002 equity market “bubble and bust” spawned a number of studies of the equity<br />
market risk premium that have speculated that the U.S. market risk premium will be lower in<br />
the future than in the past. The speculation stems in part from the hypothesis that the<br />
magnitude of the achieved risk premiums is due to an increase in price/earnings (P/E) ratios.<br />
That is, the historic U.S. equity market returns reflect appreciation in the value of stocks in<br />
excess of that supported by the underlying growth in earnings or dividends. The increase in<br />
P/E ratios, it has been argued, reflects a decline in the rate at which investors are discounting<br />
future earnings, i.e., a lower cost of capital.<br />
I have analyzed the trends in P/E ratios, equity market returns, and bond returns. 52 That<br />
analysis demonstrates:<br />
(1) The increase in price/earnings ratios experienced during the market bubble of<br />
the 1990s has not resulted in a higher and unsustainable level of equity<br />
market returns. The arithmetic average equity returns in both Canada and the<br />
U.S. from 1947-1988 (prior to the increase in P/E ratios commencing in<br />
1989) are actually higher than the average returns for the full 1947-2008<br />
period.<br />
(2) An analysis of rolling 10-year average equity returns reveals no upward or<br />
downward trend in equity market returns in Canada or the U.S. over the post<br />
World War II period.<br />
(3) The observed decline in the experienced risk premium over the 1947-2008<br />
period, particularly in Canada, is due largely to an increase in bond returns,<br />
not a decline in equity returns. The historic bond returns in Canada (both<br />
total and income returns) are significantly higher (at approximately 7.0%)<br />
52 See Appendix B for further discussion.<br />
3091 <strong>Terasen</strong> Foster Associates, Inc.<br />
Page | 50
1252<br />
1253<br />
1254<br />
1255<br />
1256<br />
1257<br />
1258<br />
1259<br />
1260<br />
1261<br />
1262<br />
1263<br />
1264<br />
1265<br />
1266<br />
1267<br />
1268<br />
1269<br />
1270<br />
1271<br />
1272<br />
1273<br />
1274<br />
1275<br />
1276<br />
1277<br />
1278<br />
1279<br />
than the forecast yields on long-term Canada bonds of 4.25% for 2010 and<br />
5.25% over the longer-term.<br />
In summary, the historic equity market returns in both Canada and the U.S. provide a<br />
reasonable estimate of the forward looking equity market return. In contrast, the Canadian<br />
historic bond returns are materially higher than the expected returns. Thus, the historic<br />
measured risk premium in Canada understates a reasonable estimate of the forward-looking<br />
equity market risk premium.<br />
B.3.b.(7) Comparison of Longer-Period Returns to Post-World War II Returns<br />
A comparison of the longer-term returns and equity risk premiums in Canada and the U.S. to<br />
the post-World War II returns demonstrates that the average returns for the equity markets<br />
have not changed materially. Over the long-term, on average, the equity market return in<br />
both countries has been in the range of 11.0%-12.0%.<br />
Table 7<br />
Canada U.S.<br />
1924-2008 1947-2008 1926-2008 1947-2008<br />
Equity Market Return 11.3% 11.6% 11.7% 12.2%<br />
Source: Schedule 8.<br />
B.3.b.(8) Estimate of Equity Market Risk Premium<br />
Given the absence of any material upward or downward trend in the historic equity market<br />
returns, a reasonable expected value of the future equity market return is a range of 11.0%-<br />
12.0%, based on both the Canadian and U.S. equity market returns. Based on both the near-<br />
term (2010) and the longer-term forecasts for long-term Canada bond yields of 4.25% and<br />
5.25% respectively, and an expected equity market return in the range of 11.0%-12.0%, the<br />
indicated equity market risk premium is approximately 6.75%.<br />
3091 <strong>Terasen</strong> Foster Associates, Inc.<br />
Page | 51
1280<br />
1281<br />
1282<br />
1283<br />
1284<br />
1285<br />
1286<br />
1287<br />
1288<br />
1289<br />
1290<br />
1291<br />
1292<br />
1293<br />
1294<br />
1295<br />
1296<br />
1297<br />
1298<br />
1299<br />
1300<br />
1301<br />
1302<br />
1303<br />
1304<br />
1305<br />
1306<br />
1307<br />
B.3.c. Relative Risk Adjustment<br />
B.3.c.(1) Total Market Risk<br />
The market risk premium result needs to be adjusted to recognize the relatively lower risk of<br />
utilities. My analysis of the relative risk adjustment starts with a recognition that investors<br />
are not perfectly diversified, do look at the risks of individual investments, and require<br />
compensation for assuming company-specific or investment-specific risk. It also recognizes<br />
that, while investors can diversify their portfolios, the stand-alone utility to which the<br />
allowed return is applied cannot. Thus, a risk measurement that reflects those considerations<br />
is relevant for estimating the utility equity risk premium. These considerations support<br />
focusing on total market risk, as well as on beta, which is intended to measure solely non-<br />
diversifiable risk. The drawbacks of beta as the sole measure of risk, as well as the absence<br />
of an observable relationship between “raw” betas 53 and the achieved market returns on<br />
equity in the Canadian market, provide further support for reliance on other measures of risk<br />
to estimate the required equity return (see Appendix B).<br />
The standard deviation of market returns is the principal measurement of total market risk.<br />
To compare the relative total risk of Canadian utilities, I calculated the standard deviations<br />
of monthly total market returns for each of the 10 major Sectors of the S&P/TSX Index,<br />
over five-year periods ending 1997 through 2008 (Schedule 10).<br />
To translate the standard deviation of market returns into a relative risk adjustment, utility<br />
standard deviations must be related to those of the overall market. The relative market<br />
volatility of Canadian utility stocks was measured by comparing the standard deviations of<br />
the <strong>Utilities</strong> Index to the simple mean and median of the standard deviations of the 10<br />
Sectors. Schedule 10 shows the ratios of the standard deviations of the <strong>Utilities</strong> Index to<br />
those of the 10 S&P/TSX Sectors. The ratio of the standard deviation of the <strong>Utilities</strong> Index<br />
53 The “raw” beta refers to the simple regression between the monthly percentage changes in the price of a<br />
utility or utility index and the corresponding percentage change in the price of the equity market index (the<br />
S&P/TSX Composite).<br />
3091 <strong>Terasen</strong> Foster Associates, Inc.<br />
Page | 52
1308<br />
1309<br />
1310<br />
1311<br />
1312<br />
1313<br />
1314<br />
1315<br />
1316<br />
1317<br />
1318<br />
1319<br />
1320<br />
1321<br />
1322<br />
1323<br />
1324<br />
1325<br />
1326<br />
1327<br />
1328<br />
1329<br />
1330<br />
1331<br />
1332<br />
to the mean and median standard deviations of the 10 major Sector Indices suggests a<br />
relative risk adjustment for a Canadian utility in the range of 0.55-0.85, with a central<br />
tendency of approximately 0.65-0.70.<br />
B.3.c.(2) Historic Raw Betas<br />
Since beta is the risk measure that underpins the application of the CAPM, I also took<br />
account of utility betas to estimate the relative risk adjustment. Schedule 11 summarizes the<br />
“raw” betas I calculated for individual publicly-traded Canadian regulated gas and electric<br />
companies, the TSE Gas/Electric Index, and the S&P/TSX <strong>Utilities</strong> Sector using monthly<br />
price data calculated over five-year periods ending 1993 through 2008. 54<br />
As Schedule 11 indicates, there was a significant decline in the calculated “raw” betas of the<br />
individual Canadian utilities between 1993-1998 and 1999-2005 (from approximately 0.50-<br />
0.60 to 0.0 and slightly negative). Following an increase in 2007 to 0.50, the utility betas<br />
again declined in 2008 to approximately 0.25. The observed levels and pattern of the<br />
calculated “raw” utility betas in 1999-2008 can be traced to four factors: (1) the technology<br />
sector bubble and subsequent bust; (2) the dominance in the TSE 300 of two firms during<br />
the early part of the “bubble and bust” period, Nortel Networks and BCE; (3) the fallout of<br />
the subprime mortgage crisis; and (4) the greater sensitivity of utility stock prices relative to<br />
the equity market composite to rising and falling interest rates (e.g., during the equity market<br />
“bubble” of 1999 and early 2000 and during the first half of 2006). Over the longer-term<br />
(1970-2008), the “raw” beta of the TSX <strong>Utilities</strong> Index was 0.50, as indicated below.<br />
54 The S&P/TSX <strong>Utilities</strong> Sector was created in 2002 (with historic data calculated from year-end 1987), when<br />
the TSE 300 was revamped to create the S&P/TSX Composite. The <strong>Utilities</strong> Sector was essentially an<br />
amalgamation of the former TSE 300 Gas/Electric and Pipeline sub-indices. In May 2004, the pipelines were<br />
moved to the Energy Sector, and no longer comprise a separate sub-index.<br />
3091 <strong>Terasen</strong> Foster Associates, Inc.<br />
Page | 53
1333<br />
1334<br />
1335<br />
1336<br />
1337<br />
1338<br />
1339<br />
1340<br />
1341<br />
1342<br />
1343<br />
1344<br />
1345<br />
1346<br />
1347<br />
1348<br />
1349<br />
1350<br />
1351<br />
1352<br />
B.3.c.(3) Canadian Utility Returns and “Raw” Betas<br />
The equity betas of traded Canadian utility shares and of the utility index explains a<br />
relatively small percentage of the actual achieved market returns over time. A regression of<br />
the monthly returns on the TSX <strong>Utilities</strong> Index against the returns on the TSX Composite,<br />
for example, over the period 1970-2008 55 shows the following:<br />
Monthly TSX<br />
<strong>Utilities</strong> Index<br />
Return<br />
{Monthly = 0.0056 + 0.50 TSE<br />
}<br />
Composite<br />
Return<br />
t-statistic = 14.9<br />
R 2 = 32%<br />
The relationship quantified in the above equation suggests a beta of close to 0.50. However,<br />
the R 2 , which measures how much of the variability in utility stock prices is explained by<br />
volatility in the equity market as a whole, is only 32%. That means 68% of the monthly<br />
volatility in share prices remain unexplained.<br />
Since utility shares are interest sensitive, the regression was expanded to capture the impact<br />
of movements in long-term Canada bond prices on utility returns. The addition of monthly<br />
long-term Canada bond returns to the analysis indicates the following:<br />
Monthly TSX<br />
<strong>Utilities</strong> Index<br />
Return<br />
{Monthly = 0.00185 + .42 TSE<br />
Composite }+ Return .53 {<br />
t-statistics = 13.3 9.3<br />
R 2 = 43%<br />
Monthly<br />
Long Canada<br />
Bond Return }<br />
When government bond returns are added as a further explanatory variable, somewhat more<br />
of the observed volatility in utility stock prices is explained (43% versus 32%). The second<br />
55 The Monthly TSX <strong>Utilities</strong> Index Returns are comprised of the monthly returns on the TSE Gas & Electric<br />
Index for period January 1970 to April 2003 and the monthly returns on the S&P/TSX <strong>Utilities</strong> Index for the<br />
period May 2003 to December 2008.<br />
3091 <strong>Terasen</strong> Foster Associates, Inc.<br />
Page | 54
1353<br />
1354<br />
1355<br />
1356<br />
1357<br />
1358<br />
1359<br />
1360<br />
1361<br />
1362<br />
1363<br />
1364<br />
1365<br />
1366<br />
1367<br />
1368<br />
1369<br />
1370<br />
1371<br />
1372<br />
1373<br />
1374<br />
1375<br />
1376<br />
1377<br />
1378<br />
1379<br />
1380<br />
regression equation suggests that utility shares have had approximately 40% of the volatility<br />
of the equity market and over 50% of the volatility of the bond market, the latter consistent<br />
with utility common stocks’ interest sensitivity. Nevertheless, the equation still leaves more<br />
than half of the utility shares’ volatility unexplained. To provide some perspective, the<br />
average actual annual return for the index over the 1970-2008 period was 12.2%. Of this<br />
average annual return, 2.25 percentage points was explained neither by volatility in the<br />
equity market nor returns of the government bond market.<br />
Using an expected annual equity market return of 11.5%, an annual long-term Canada bond<br />
return equal to the forecast longer-term 30-year Canada yield of 5.25%, and a annual<br />
“unexplained” 56 return component equal to that achieved in the past (2.25 percentage<br />
points), the indicated utility return going forward is 10.0%. If, instead, the “unexplained”<br />
return component is assumed to be equal to the same proportion of the total return as was the<br />
case historically (18.5%), the expected utility return is approximately 9.3%. When the<br />
average of the two utility returns (9.6%) is expressed as an equity risk premium above the<br />
5.25% forecast long-term Canada bond yield, the indicated relative risk adjustment is<br />
approximately 0.70. 57<br />
B.3.c.(4) Use of Adjusted Betas<br />
From the calculated “raw” betas, the inference can readily be made that utilities are less<br />
risky than the equity market composite, which by construction has a beta of 1.0. The more<br />
difficult task is determining how the “raw” beta translates into a relative risk adjustment that<br />
captures utility investors’ return requirements. In order to arrive at a reasonable relative risk<br />
adjustment, the normative (“what should happen”) CAPM needs to be integrated with what<br />
has been empirically observed (“what does or has happened”). Empirical studies have<br />
shown that stocks with low betas (less than the equity market beta of 1.0) have achieved<br />
returns higher than predicted by the single variable (i.e., equity beta) CAPM. Conversely,<br />
56 Represented by the intercept in the equation.<br />
57<br />
9.<br />
6%<br />
− 5.<br />
25%<br />
= .70<br />
11.<br />
5%<br />
− 5.<br />
25%<br />
3091 <strong>Terasen</strong> Foster Associates, Inc.<br />
Page | 55
1381<br />
1382<br />
1383<br />
1384<br />
1385<br />
1386<br />
1387<br />
1388<br />
1389<br />
1390<br />
1391<br />
1392<br />
1393<br />
1394<br />
1395<br />
1396<br />
1397<br />
1398<br />
1399<br />
1400<br />
1401<br />
1402<br />
stocks with betas higher than the equity market beta of 1.0 have achieved lower returns than<br />
the model predicts.<br />
The use of betas that are adjusted toward the equity market beta of 1.0, rather than the<br />
calculated “raw” betas, takes account of the observed tendency of low (high) beta stocks to<br />
achieve higher (lower) returns than predicted by the simple CAPM. Adjusted betas are a<br />
standard means of estimating betas, and are widely disseminated to investors by investment<br />
research firms, including Bloomberg, Value Line and Merrill Lynch. All three of these firms<br />
use a similar methodology to adjust “raw” betas toward the equity market beta of 1.0. Their<br />
methodologies give approximately 2/3 weight to the calculated “raw” beta and 1/3 weight to<br />
the equity market beta of 1.0.<br />
The following table compares the three-year Bloomberg betas ending March 27, <strong>2009</strong> for<br />
the five major Canadian utilities to the calculated “raw” betas for the same three-year period.<br />
The Bloomberg betas suggest that the relative risk adjustment based on recent Canadian<br />
utility betas would be approximately 0.65. The application of the same adjustment formula<br />
to the recent three-year raw betas and the long-term calculated “raw” beta of 0.50 for<br />
Canadian utilities estimated above results in a similar relative risk adjustment of 0.67. 58<br />
Table 8<br />
Company “Raw” Beta Bloomberg Beta<br />
Canadian <strong>Utilities</strong> 0.41 0.61<br />
Emera 0.38 0.59<br />
Enbridge 0.56 0.71<br />
Fortis 0.49 0.66<br />
TransCanada 0.47 0.65<br />
Average 0.47 0.65<br />
Source: Schedule 11 and Bloomberg<br />
A comparison of the reported Value Line betas for the sample of low risk U.S. utilities relied<br />
upon in the application of the discounted cash flow (DCF) and DCF-based risk premium test<br />
58 Adjusted beta = 0.67 x “Raw” Beta + 0.33 x Market Beta of 1.0.<br />
3091 <strong>Terasen</strong> Foster Associates, Inc.<br />
Page | 56
1403<br />
1404<br />
1405<br />
1406<br />
1407<br />
1408<br />
1409<br />
1410<br />
1411<br />
1412<br />
1413<br />
1414<br />
1415<br />
1416<br />
1417<br />
1418<br />
1419<br />
1420<br />
1421<br />
1422<br />
1423<br />
1424<br />
1425<br />
1426<br />
1427<br />
1428<br />
1429<br />
1430<br />
1431<br />
1432<br />
shows a similar relationship. The “raw” calculated betas for the five-year period ending<br />
March <strong>2009</strong> averaged 0.41; the average reported Value Line beta for the sample, and the<br />
beta more likely to be relied upon by analysts and investors, was 0.66 (Schedule 15).<br />
B.3.c.(5) Relative Risk Adjustment<br />
The preceding analysis of standard deviations of market returns and betas supports a relative<br />
risk adjustment in the range of 0.65-0.70.<br />
B.3.d. Utility Risk Premium and Cost Of Equity<br />
I previously estimated the equity market risk premium at the 2010 forecast long Canada<br />
yield of 4.25% and at the longer-term yield of approximately 5.25% at approximately<br />
6.75%. At an equity market risk premium of 6.75% and a relative risk adjustment of 0.65-<br />
0.70, the indicated utility equity risk premium is approximately 4.5%. The cost of equity<br />
based on the risk-adjusted equity market risk premium test at the 2010 forecast long-term<br />
Canada bond yield of 4.25% is 8.75%, before any adjustment for financing flexibility.<br />
B.4. DCF-Based Equity Risk Premium Test<br />
The risk-adjusted equity market risk premium test discussed above estimates the required<br />
utility equity risk premium indirectly. That is, it estimates an equity risk premium for the<br />
equity market as a whole, and then adjusts it for the relative risk of the utility. The DCF-<br />
based risk premium test, discussed in this section and the equity risk premium test discussed<br />
in Section B.5, estimate the utility equity risk premium directly, by analyzing utility equity<br />
return data.<br />
The DCF-based equity risk premium is a forward-looking test which uses the discounted<br />
cash flow model (DCF) and long-term government bond yields to estimate expected utility<br />
returns and risk premiums over time. Monthly cost of equity estimates were constructed for<br />
3091 <strong>Terasen</strong> Foster Associates, Inc.<br />
Page | 57
1433<br />
1434<br />
1435<br />
1436<br />
1437<br />
1438<br />
1439<br />
1440<br />
1441<br />
1442<br />
1443<br />
1444<br />
1445<br />
1446<br />
1447<br />
1448<br />
1449<br />
1450<br />
1451<br />
1452<br />
1453<br />
the period 1991-March <strong>2009</strong> 59 using the DCF model and a sample of low risk U.S. gas and<br />
electric utilities as a proxy for TGI. 60 The reasons for choosing U.S. utilities are as follows:<br />
First, there are only six publicly-traded Canadian utilities with conventional corporate<br />
structures and with a long-term stock trading history. Second, there are insufficient forward-<br />
looking estimates of long-term growth rates for these companies that would permit the<br />
creation of a consistent series of DCF costs of equity and corresponding risk premiums. A<br />
consensus estimate of investors’ growth expectations is critical to the application of the<br />
discounted cash flow model. The availability of a consensus of analysts’ forecasts means<br />
that the resulting growth estimate reflects the market view.<br />
Third, U.S. utilities are reasonable proxies for estimating the cost of equity for TGI. As<br />
noted in Section II, the operating environments are similar, the regulatory model in the U.S.<br />
is similar to the Canadian model, 61 and the Canadian and U.S. capital markets are<br />
significantly integrated. 62 Only relatively pure-play U.S. utilities were selected; these<br />
utilities are in the same business risk category as TGI (as well as of the typical Canadian<br />
utility) 63 and have S&P debt ratings of A- or better, similar to those of TGI and the universe<br />
of Canadian utilities with rated debt (Schedules 6, 7 and 15). The sample contains 13<br />
utilities, and is the same sample of companies used to perform the discounted cash flow test<br />
(Section VI.C.).<br />
59<br />
The period 1991-March <strong>2009</strong> encompasses both a full business cycle (1991-2007) as well as data through<br />
the most recent full quarter available.<br />
60<br />
The selection criteria for the proxy utilities and the construction of the DCF estimates are described in<br />
Appendix C.<br />
61<br />
As noted earlier, the LDCs which are included in the proxy sample are considered by Moody’s to have<br />
slightly better regulatory support, on average, than TGI.<br />
62<br />
A June 2007 study prepared on behalf of the Ontario Energy Board entitled A Comparative Analysis of<br />
Return on Equity of Natural Gas <strong>Utilities</strong> by Concentric Energy Advisors compared the gas distribution<br />
industry and capital markets in Canada and the U.S. and concluded (1) taken as a whole, U.S. gas utilities are<br />
not demonstrably riskier than Canadian gas utilities; and (2) As a result of the interplay between the Canadian<br />
and U.S. markets, Canadian utilities compete for capital essentially on the same basis as utilities in the U.S. In<br />
the current market environment, no fundamental differences were identified that would indicate a significant<br />
difference in investor required returns between the two markets.<br />
63<br />
S&P considers TGI to have an “Excellent” business profile; all of the utilities in the proxy sample of U.S.<br />
utilities also have an “Excellent” business profile.<br />
3091 <strong>Terasen</strong> Foster Associates, Inc.<br />
Page | 58
1454<br />
1455<br />
1456<br />
1457<br />
1458<br />
1459<br />
1460<br />
1461<br />
1462<br />
1463<br />
1464<br />
1465<br />
1466<br />
1467<br />
1468<br />
1469<br />
1470<br />
1471<br />
1472<br />
1473<br />
1474<br />
1475<br />
1476<br />
1477<br />
1478<br />
1479<br />
1480<br />
The monthly DCF costs of equity were estimated as the sum of the consensus of analysts’<br />
forecasts of long-term normalized earnings growth, 64 plus the expected dividend yield. The<br />
equity risk premium is equal to the difference between the sample average DCF cost of<br />
equity and the corresponding month-end 30-year Treasury bond yield.<br />
For the sample of U.S. utilities, the DCF-based risk premium test indicates an average risk<br />
premium over the full 1991-March <strong>2009</strong> period of 4.3% (Schedule 12); the corresponding<br />
average long-term government bond yield was 5.9%, approximately 175 basis points higher<br />
than the 2010 forecast long-term Canada bond yield of 4.25%.<br />
The data suggest that there has been an inverse relationship between the long-term<br />
government bond yield and utility equity risk premiums over the 1991-March <strong>2009</strong> period.<br />
A simple regression analysis between the monthly 30-year Treasury bond yields and the<br />
corresponding equity risk premiums over the entire 1991-March <strong>2009</strong> period indicates that,<br />
on average, over the full period, the equity risk premium rose by 70 basis points when the<br />
long-term government bond yield fell by 100 basis points and, conversely, the equity risk<br />
premium fell by 70 basis points when the long-term government bond yield rose by 100<br />
basis points. Expressed in terms of <strong>ROE</strong>, the equity return rose by 30 basis points when the<br />
long-term government bond yield rose by 100 basis points. Conversely, the equity return<br />
fell by 30 basis points when the long-term government bond yield fell by 100 basis points.<br />
This analysis indicates that the <strong>ROE</strong> is much less sensitive to changes in the long-term<br />
Canada bond yield that the existing formula assumes. The existing formula assumes that the<br />
<strong>ROE</strong> increases or decreases by 75% of the increase or decrease in the long-term Canada<br />
bond yield. The DCF-based risk premium analysis indicates that the increase or decrease in<br />
<strong>ROE</strong> has been only 30% of the increase or decrease in long-term Canada bond yields.<br />
64 The consensus forecasts are obtained from I/B/E/S, a leading provider of earnings expectations data. The<br />
data are collected from over 7,000 analysts at over 1,000 institutions worldwide, and cover companies in more<br />
than 60 countries.<br />
3091 <strong>Terasen</strong> Foster Associates, Inc.<br />
Page | 59
1481<br />
1482<br />
1483<br />
1484<br />
1485<br />
1486<br />
1487<br />
1488<br />
1489<br />
1490<br />
1491<br />
1492<br />
1493<br />
1494<br />
1495<br />
1496<br />
1497<br />
1498<br />
1499<br />
1500<br />
1501<br />
1502<br />
1503<br />
1504<br />
1505<br />
At the 2010 forecast 30-year government bond yield of 4.25%, the indicated utility equity<br />
risk premium is approximately 5.4%. The indicated cost of equity would be 9.7%.<br />
However, this analysis does not incorporate other factors which impact on the cost of equity.<br />
The magnitude of the spread between corporate bond yields and government bond yields is<br />
frequently used as a proxy for changes in investors’ perception of risk. 65 To capture this<br />
factor, I tested the relationship among utility equity risk premiums 66 and the spreads<br />
between long-term utility 67 and government bond yields in conjunction with the change in<br />
the yield on long-term government bond yields. To estimate this relationship, I performed a<br />
second regression analysis over the same 1991-March <strong>2009</strong> period (Schedule 12, page 2).<br />
The analysis indicated that, while the utility risk premium has been negatively related to the<br />
level of government bond yields, it has been positively related to the spread between utility<br />
bond yields and government bond yields. Specifically, the analysis showed that the equity<br />
risk premium has increased or decreased by approximately 40 basis points when the<br />
government bond yield has decreased or increased by 100 basis points and has increased or<br />
decreased by 12 basis points for every 10 basis point increase or decrease in the<br />
utility/government bond yield spread. The inclusion of the spread as a second explanatory<br />
variable also supports the conclusion that the utility cost of equity changes by significantly<br />
less than 75% of the change in long-term government bond yields. 68<br />
As of the end of March <strong>2009</strong>, the spread between the yields on a sample of long-term A<br />
rated Canadian utility bonds and 30-year Government of Canada bonds was approximately<br />
345 basis points. Although the spreads had narrowed since their December peak of 390<br />
basis points, 69 the spreads remain well in excess of their historic averages as well as in<br />
excess of their historic peaks. As spreads vary over the business/interest rate cycle, spreads<br />
65 Or, alternatively, risk aversion i.e., willingness to take risks.<br />
66 Measured, as in the prior analysis, as the DCF cost of equity minus the long-term government bond yield.<br />
67 Based on Moody’s long-term A-rated utility bond index.<br />
68 Similar regressions using allowed <strong>ROE</strong>s for U.S. utilities, long-term government bond yields and spreads, as<br />
discussed on page 9, also demonstrated that the <strong>ROE</strong> is less sensitive to the change in the government bond<br />
yield than implied by the current formula.<br />
69 In mid-February <strong>2009</strong>, TGI raised 30-year debt at a spread of approximately 285 basis points.<br />
3091 <strong>Terasen</strong> Foster Associates, Inc.<br />
Page | 60
1506<br />
1507<br />
1508<br />
1509<br />
1510<br />
1511<br />
1512<br />
1513<br />
1514<br />
1515<br />
1516<br />
1517<br />
1518<br />
1519<br />
1520<br />
1521<br />
1522<br />
1523<br />
1524<br />
1525<br />
1526<br />
1527<br />
1528<br />
1529<br />
1530<br />
1531<br />
should narrow further as the economy improves, as has been observed historically.<br />
However, three factors suggest that the spreads will remain above their historic levels.<br />
First, historically, the existence of the FPR and the high demand in Canada for a relatively<br />
limited supply of high quality issues kept high grade Canadian bond spreads relatively<br />
low. 70 With the elimination of the FPR, spreads on domestic bond issues will tend to<br />
converge with those of global issuers of similar risk. 71 Second, while the consensus forecast<br />
anticipates that the economy will improve in 2010 compared to <strong>2009</strong>, the first year of<br />
recovery is expected to be relatively weak, pointing to the persistence of higher than average<br />
spreads. Third, the financial crisis has led to a global repricing of risk across various types<br />
of securities, including A rated Canadian utility bonds.<br />
As of the beginning of April <strong>2009</strong>, the cost of a new 30-year debt issue for a Canadian A<br />
rated utility e.g., TGI, was approximately 6.5-6.75%. While the spread with long-term<br />
Canada bonds should decline as long-term Canada bond yields rise, there is no basis for<br />
concluding that the absolute cost of new A-rated long-term debt will retreat significantly<br />
from current levels. 72 At a 2010 forecast long Canada yield of 4.25% and assuming that the<br />
absolute cost of long-term debt for an A-rated utility remains in the range of 6.50% to<br />
6.75%, the A rated utility bond/long-term Canada bond yield spread will be approximately<br />
225-250 basis points. The indicated utility equity risk premium at a long-term Canada bond<br />
yield of 4.25% and a yield spread of 225-250 basis points is approximately 6.0%. The<br />
indicated utility cost of equity before any adjustment for financing flexibility is 10.25%.<br />
The average cost of equity based on both the single and two variable DCF-based equity risk<br />
premium approaches is 10.0%.<br />
70<br />
Prior to the elimination of the FPR, the Canadian bond market was largely a domestic market. As long as<br />
there was a cap on foreign investment, pension funds limited their foreign investments primarily to equities,<br />
and allocated their bond investments to Canadian bonds, which constrained yield spreads.<br />
71<br />
Utility bond yields in Canada and the U.S. have already exhibited convergence as discussed in footnote 20<br />
above.<br />
72<br />
Blue Chip Financial Forecasts, December 2008 anticipates that, although credit spreads with Treasury<br />
bonds will decline, the absolute yields on AAA rated U.S. corporate bonds will remain essentially flat between<br />
<strong>2009</strong> and 2010 and then gradually rise by approximately 50 basis points between 2010 and 2014.<br />
3091 <strong>Terasen</strong> Foster Associates, Inc.<br />
Page | 61
1532<br />
1533<br />
1534<br />
1535<br />
1536<br />
1537<br />
1538<br />
1539<br />
1540<br />
1541<br />
1542<br />
1543<br />
1544<br />
1545<br />
1546<br />
1547<br />
1548<br />
1549<br />
1550<br />
1551<br />
1552<br />
1553<br />
1554<br />
B.5. Historic Utility Equity Risk Premiums<br />
The historic experienced returns for utilities provide an additional perspective on a<br />
reasonable expectation for the forward-looking utility equity risk premium. Reliance on<br />
achieved equity risk premiums for utilities as an indicator of what investors expect for the<br />
future is based on the proposition that over the longer term, investors’ expectations and<br />
experience converge. The more stable an industry, the more likely it is that this convergence<br />
will occur.<br />
Over the longer-term (1956-2008), 73 the average achieved utility equity risk premium was<br />
4.1% for Canadian electric and gas utilities in relation to total bond returns and 4.2% in<br />
relation to bond income returns respectively. 74 For U.S. gas utilities, the corresponding<br />
average historic equity risk premiums over the entire post-World War II period (1947-2008)<br />
were 5.5% and 6.1% respectively. For U.S. electric utilities, the 1947-2008 average risk<br />
premiums were 4.2% and 4.8% (See Schedule 13).<br />
Similar to the risk premiums for the market composite, the magnitude of achieved utility risk<br />
premiums is a function of both the equity returns and the bond returns, as summarized for<br />
the three utility indices in the table below.<br />
Table 9<br />
Utility Equity Bond Total Bond Income<br />
Returns Returns Returns<br />
Canadian <strong>Utilities</strong> 12.0% 7.9% 7.8%<br />
U.S. Gas <strong>Utilities</strong> 12.1% 6.6% 6.0%<br />
U.S. Electric <strong>Utilities</strong> 10.8% 6.6% 6.0%<br />
Source: Schedule 13.<br />
73 The longest period for which Canadian utility data are available from the TSE.<br />
74 Based on the Gas/Electric Index of the TSE 300 (from 1956 to 1987) and on the S&P/TSX <strong>Utilities</strong> Index<br />
from 1988-2008.<br />
3091 <strong>Terasen</strong> Foster Associates, Inc.<br />
Page | 62
1555<br />
1556<br />
1557<br />
1558<br />
1559<br />
1560<br />
1561<br />
1562<br />
1563<br />
1564<br />
1565<br />
1566<br />
1567<br />
1568<br />
1569<br />
1570<br />
1571<br />
1572<br />
1573<br />
1574<br />
1575<br />
1576<br />
1577<br />
1578<br />
1579<br />
An analysis of the underlying data indicates there has been no upward or downward trend in<br />
the utility equity returns (Schedule 14); the utility returns in both the U.S. and Canada have<br />
clustered in the range of 11.0-12.0%, with a mid-point of approximately 11.5%. However,<br />
as noted in Section B.3.b(6) above and in Appendix B, the achieved bond returns (both total<br />
and income returns), particularly in Canada, are well above the levels forecast over the<br />
longer-term. The forecast long-term Canada bond yield for the longer-term is approximately<br />
5.25%. Compared to a utility return of approximately 11.5%, the indicated utility equity<br />
risk premium is approximately 6.25%. Using the forecast 2010 long-term Canada bond<br />
yield of 4.25% and a utility risk premium of 6.25%, the indicated utility cost of equity,<br />
before adjustment for financing flexibility, is 10.5%.<br />
B.6. Cost of Equity Based on Equity Risk Premium Tests<br />
The estimated utility costs of equity based on the three equity risk premium methodologies<br />
are as follows:<br />
Table 10<br />
Risk Premium Test Cost of Equity<br />
Risk-Adjusted Equity Market 8.75%<br />
DCF-Based 10.0%<br />
Historic Utility 10.5%<br />
The three risk premium tests indicate a utility cost of equity of approximately 9.75% before<br />
any allowance for financing flexibility.<br />
C. DISCOUNTED CASH FLOW TEST 75<br />
The discounted cash flow approach proceeds from the proposition that the price of a<br />
common stock is the present value of the future expected cash flows to the investor,<br />
75 See Appendix D for a more detailed discussion.<br />
3091 <strong>Terasen</strong> Foster Associates, Inc.<br />
Page | 63
1580<br />
1581<br />
1582<br />
1583<br />
1584<br />
1585<br />
1586<br />
1587<br />
1588<br />
1589<br />
1590<br />
1591<br />
1592<br />
1593<br />
1594<br />
1595<br />
1596<br />
1597<br />
1598<br />
1599<br />
1600<br />
1601<br />
1602<br />
1603<br />
1604<br />
1605<br />
1606<br />
discounted at a rate that reflects the risk of those cash flows. If the price of the security is<br />
known (can be observed), and if the expected stream of cash flows can be estimated, it is<br />
possible to approximate the investor’s required return (or capitalization rate) as the rate that<br />
equates the price of the stock to the discounted value of future cash flows.<br />
Although the DCF test, like the equity risk premium test, has flaws, it has one distinct<br />
advantage over risk premium estimates, particularly those made using the CAPM. It allows<br />
the analyst to directly estimate the utility cost of equity. In contrast, the CAPM indirectly<br />
estimates the cost of equity. In addition, the DCF model is a positive model; that is, it deals<br />
with “what is” as opposed to “what should be”. The DCF model provides a widely used<br />
alternative to the CAPM; it is the principal model utilized by U.S. regulators.<br />
There are multiple versions of the discounted cash flow model available to estimate the<br />
investor’s required return. An analyst can employ a constant growth model or a multiple<br />
period model to estimate the cost of equity. The constant growth model rests on the<br />
assumption that investors expect cash flows to grow at a constant rate throughout the life of<br />
the stock. Similarly, a multiple period model rests on the assumption that growth rates will<br />
change over the life of the stock. To estimate the DCF cost of equity, I utilized both a<br />
constant growth and a two-stage model. 76 In both cases, the discounted cash flow test was<br />
applied to a sample of low risk U.S. “pure-play” electric and gas distributors that are<br />
intended to serve as a proxy for TGI. 77<br />
The growth component of the DCF model is an estimate of what investors expect over the<br />
longer-term. For a regulated utility, whose growth prospects are tied to allowed returns, the<br />
estimate of growth expectations is subject to circularity because the analyst is, in some<br />
measure, attempting to project what returns the regulator will allow, and the extent to which<br />
the utilities will exceed or fall short of those returns. To mitigate that circularity, it is<br />
76 The two-stage model is a form of multiple period model; please see Appendix D for discussion of the DCF<br />
models used; the criteria for the low risk U.S. utility sample selection are described in Appendix C.<br />
77 Reliance on U.S. utilities was explained in the discussion of the DCF-based equity risk premium test in<br />
Section VI.B.4.<br />
3091 <strong>Terasen</strong> Foster Associates, Inc.<br />
Page | 64
1607<br />
1608<br />
1609<br />
1610<br />
1611<br />
1612<br />
1613<br />
1614<br />
1615<br />
1616<br />
1617<br />
1618<br />
1619<br />
1620<br />
1621<br />
1622<br />
1623<br />
1624<br />
1625<br />
1626<br />
1627<br />
1628<br />
1629<br />
1630<br />
1631<br />
1632<br />
1633<br />
important to rely on a sample of proxies, rather than the subject company. (When the<br />
subject company does not have traded shares, a sample of proxies is required.)<br />
Further, to the extent feasible, one should rely on estimates of longer-term growth readily<br />
available to investors, rather than superimpose on the analysis one’s own view of what<br />
growth should be. Thus, in applying the DCF test, I relied solely on published forecast<br />
growth rates that are readily available to investors. In applying the constant growth model, I<br />
relied primarily on the consensus (mean) of analysts’ earnings growth rate forecasts as the<br />
proxy for investors’ long-term growth expectations.<br />
In the application of the DCF test, the reliability of the earnings growth forecasts as a<br />
measure of investor expectations has been questioned by some Canadian regulators. The<br />
issue of reliability arises because of the documented optimism of analysts’ forecasts<br />
historically. However, as long as investors have believed the forecasts, and have priced the<br />
securities accordingly, the resulting DCF costs of equity are an unbiased estimate of<br />
investors’ expected returns. That proposition can be tested indirectly. For the sample of low<br />
risk utilities used in the DCF test (as well as the DCF-based equity risk premium test), the<br />
average expected long-term growth rate, as estimated using analysts’ forecasts, for the entire<br />
1991-March <strong>2009</strong> period of analysis was 5.0%. That growth rate is lower than the expected<br />
long-term nominal growth in the economy as a whole has been over the same period. 78 An<br />
expected growth rate that is close to that of the economy as a whole would not be out-of-line<br />
with the level of growth investors could reasonably expect in the relatively mature utility<br />
industries over the longer-term.<br />
In addition, I incorporated Value Line forecasts of earnings growth in addition to the I/B/E/S<br />
consensus forecasts. As an independent research firm, Value Line has no incentive to<br />
“inflate” its estimates of earnings growth in an attempt to make stocks more attractive to<br />
78 The average expected long-term nominal rate of growth in the U.S. economy, based on consensus forecasts<br />
(Blue Chip Economic Indicators, March editions, 1991-<strong>2009</strong>), has been 5.4% over the same period covered by<br />
the DCF-based equity risk premium test.<br />
3091 <strong>Terasen</strong> Foster Associates, Inc.<br />
Page | 65
1634<br />
1635<br />
1636<br />
1637<br />
1638<br />
1639<br />
1640<br />
1641<br />
1642<br />
1643<br />
1644<br />
1645<br />
1646<br />
1647<br />
1648<br />
1649<br />
1650<br />
1651<br />
1652<br />
1653<br />
1654<br />
1655<br />
1656<br />
1657<br />
1658<br />
1659<br />
1660<br />
1661<br />
1662<br />
investors. Incorporating Value Line estimates of earnings growth is a means of assessing the<br />
reasonableness of the results obtains through use of the I/B/E/S consensus estimates. 79<br />
The mean and median Value Line expected long-term earnings growth rate for the utility<br />
sample were both 6.0%; the corresponding I/B/E/S forecasts were 5.7% and 5.4%. This<br />
comparison suggests no upward bias in the I/B/E/S forecasts. The constant growth models<br />
indicate a cost of equity of approximately 11.0% (Schedules 16 and 17).<br />
The two-stage model is based on the premise that investors expect the growth rate for the<br />
utilities to be equal to the analysts’ forecasts (which are five year projections) for the first<br />
five years, but, in the longer-term (from year 6 onward) to migrate to the expected long-run<br />
rate of nominal growth in the economy. The two-stage model indicates a cost of equity of<br />
approximately 10.4% (Schedule 18).<br />
The two DCF models support a cost of equity, before adjustment for financing flexibility in<br />
the range of 10.5-11.0%.<br />
It is important to recognize that the 10.5-11.0% DCF cost represents the return investors<br />
expect to earn on the current market value of their utility common equity investments. It is<br />
not, however, the return that investors expect the utilities to earn on the book value of their<br />
common equity. Value Line, which publishes its projections of utility <strong>ROE</strong>s quarterly,<br />
anticipates that the return on average common equity for the sample of low risk U.S. utilities<br />
over the period 2012-2014 will be approximately 11.6-12.3% (Schedule 15).<br />
D. ALLOWANCE FOR FINANCING FLEXIBILITY 80<br />
The financing flexibility allowance is an integral part of the cost of capital as well as a<br />
required element of the concept of a fair return. The allowance is intended to cover three<br />
distinct aspects: (1) flotation costs, comprising financing and market pressure costs arising<br />
79 The BCUC found, in Order G-14-06, “The Commission Panel is more persuaded by Ms. McShane’s<br />
evidence which compares Value Line and I/B/E/S forecasts and finds no upward bias in the latter.”<br />
80 See Appendix E for a more complete discussion.<br />
3091 <strong>Terasen</strong> Foster Associates, Inc.<br />
Page | 66
1663<br />
1664<br />
1665<br />
1666<br />
1667<br />
1668<br />
1669<br />
1670<br />
1671<br />
1672<br />
1673<br />
1674<br />
1675<br />
1676<br />
1677<br />
1678<br />
1679<br />
1680<br />
1681<br />
1682<br />
1683<br />
1684<br />
1685<br />
1686<br />
1687<br />
1688<br />
1689<br />
1690<br />
1691<br />
at the time of the sale of new equity; (2) a margin, or cushion, for unanticipated capital<br />
market conditions; and (3) a recognition of the "fairness" principle.<br />
In the absence of an adjustment for financial flexibility, the application of a “bare-bones”<br />
cost of equity to the book value of equity, if earned, in theory, limits the market value of<br />
equity to its book value. The fairness principle recognizes the ability of competitive firms to<br />
maintain the real value of their assets in excess of book value and thus would not preclude<br />
utilities from achieving a degree of financial integrity that would be anticipated under<br />
competition. The market/book ratio of the S&P/TSX Composite has averaged 2.0 times<br />
over the full business cycle (1991-2007); the corresponding average market/book ratio of the<br />
S&P 500 has been 3.1 times.<br />
At a minimum, the financing flexibility allowance should be adequate to allow a utility to<br />
maintain its market value, notionally, at a slight premium to book value, i.e., in the range of<br />
1.05-1.10. At this level, a utility would be able to recover actual financing costs, as well as<br />
be in a position to raise new equity (under most market conditions) without impairing its<br />
financial integrity. A financing flexibility allowance adequate to maintain a market/book in<br />
the range of 1.05-1.10 is approximately 50 basis points. 81 As this financing flexibility<br />
adjustment is minimal, it does not fully address the comparable returns standard.<br />
The addition of an allowance for financing flexibility of 50 basis points to the “bare-bones”<br />
return on equity estimate of 9.75%-10.75% derived from both the DCF and equity risk<br />
premium tests, results in an estimate of the fair return on equity of 10.25%-11.25%.<br />
E. COMPARABLE EARNINGS TEST<br />
The comparable earnings test provides a measure of the fair return based on the concept of<br />
opportunity cost. Specifically, the test arises from the notion that capital should not be<br />
committed to a venture unless it can earn a return commensurate with that available<br />
81 Based on the DCF model; see Appendix E for calculation.<br />
3091 <strong>Terasen</strong> Foster Associates, Inc.<br />
Page | 67
1692<br />
1693<br />
1694<br />
1695<br />
1696<br />
1697<br />
1698<br />
1699<br />
1700<br />
1701<br />
1702<br />
1703<br />
1704<br />
1705<br />
1706<br />
1707<br />
1708<br />
1709<br />
1710<br />
1711<br />
1712<br />
1713<br />
1714<br />
1715<br />
1716<br />
1717<br />
1718<br />
1719<br />
1720<br />
1721<br />
1722<br />
prospectively in alternative ventures of comparable risk. Since regulation is a surrogate for<br />
competition, the opportunity cost principle entails permitting utilities the opportunity to earn<br />
a return commensurate with the levels achievable by competitive firms facing similar risk.<br />
The comparable earnings test, which measures returns in relation to book value, is the only<br />
test that can be directly applied to the equity component of an original cost rate base without<br />
an adjustment to correct for the discrepancy between book values and current market values.<br />
Neither the equity risk premium results nor the DCF results, if left without adjustment,<br />
recognizes the discrepancy. The 50 basis point financing flexibility adjustment only<br />
minimally addresses the discrepancy.<br />
The comparable earnings test is an implementation of the comparable returns standard, as<br />
distinguished from the cost of attracting capital standard. The comparable earnings test<br />
recognizes that utility costs are measured in vintaged dollars and that rates are based on<br />
accounting costs, not economic costs. In contrast, the tests for estimating the cost of<br />
attracting capital rely on costs expressed in dollars of current purchasing power, i.e., a<br />
market-related cost of capital. In the absence of experienced inflation, the two concepts<br />
would be quite similar, but the impact of inflation has rendered them dissimilar and distinct.<br />
The concept that regulation is a surrogate for competition may be interpreted to mean that<br />
the combination of an original cost rate base and a fair return should result in a value to<br />
investors commensurate with that of competitive ventures of similar risk. The fact that an<br />
original cost rate base provides a starting point for the application of a fair return does not<br />
mean that the original cost of the assets is a measure of their fair value. The concept that<br />
regulation is a surrogate for competition implies that the regulatory application of a fair<br />
return to an original cost rate base should result in a value to investors commensurate with<br />
that of similar risk competitive ventures. The comparable returns standard, as well as the<br />
principle of fairness, suggests that, if competitive firms facing a level of total risk similar to<br />
utilities are able to maintain the value of their assets considerably above book value, the<br />
return allowed to utilities should not seek to maintain the value of utility assets at book<br />
value. It is critical that the regulator recognize the comparable returns standard when setting<br />
a just and reasonable return.<br />
3091 <strong>Terasen</strong> Foster Associates, Inc.<br />
Page | 68
1723<br />
1724<br />
1725<br />
1726<br />
1727<br />
1728<br />
1729<br />
1730<br />
1731<br />
1732<br />
1733<br />
1734<br />
1735<br />
1736<br />
1737<br />
1738<br />
1739<br />
1740<br />
1741<br />
1742<br />
1743<br />
1744<br />
1745<br />
1746<br />
1747<br />
1748<br />
1749<br />
The comparable earnings test remains the only test that explicitly recognizes that, in the<br />
North American regulatory framework, the return is applied to an original cost (book value)<br />
rate base. The persistence of moderate inflation continues to create systematic deviations<br />
between book and market values. <strong>Application</strong> of a market-derived cost of capital to book<br />
value ignores that distinction. To illustrate, if the market value of an investment is $15 and<br />
the required return is 10%, the return, in dollars, expected by investors is $1.50. However,<br />
regulatory convention applies the market-derived return to the book value of the investment.<br />
If the book value of the investment is $10.00, application of a 10% return to the book value<br />
will result in a return, in dollars, of only $1.00. The application of the results of the cost of<br />
attracting capital tests, i.e., equity risk premium and discounted cash flow to the book value<br />
of equity, unless adjusted, do not make any allowance for the discrepancy between the<br />
return on market value and the corresponding fair return on book value. 82 The comparable<br />
earnings test, however, does. It applies “apples to apples”, i.e., a book value-measured<br />
return is applied to a book value-measured equity investment.<br />
The principal issues in the application of the comparable earnings test are: 83<br />
♦ The selection of a sample of unregulated companies of reasonably comparable total<br />
risk to a Canadian utility.<br />
♦ The selection of an appropriate time period over which returns are to be measured in<br />
order to estimate prospective returns.<br />
♦ The need for any adjustment to the "raw" comparable earnings results if the selected<br />
unregulated companies are not of precisely equivalent risk to a utility.<br />
♦ The need for a downward adjustment for the unregulated companies’ market/book<br />
ratios.<br />
82 As previously noted, the 50 basis point financing flexibility adjustment is only a minimal recognition of the<br />
discrepancy.<br />
83 Full discussion in Appendix F.<br />
3091 <strong>Terasen</strong> Foster Associates, Inc.<br />
Page | 69
1750<br />
1751<br />
1752<br />
1753<br />
1754<br />
1755<br />
1756<br />
1757<br />
1758<br />
1759<br />
1760<br />
1761<br />
1762<br />
1763<br />
1764<br />
1765<br />
1766<br />
1767<br />
1768<br />
1769<br />
1770<br />
1771<br />
1772<br />
1773<br />
1774<br />
1775<br />
1776<br />
1777<br />
1778<br />
1779<br />
The application of the comparable earnings test first requires the selection of a sample of<br />
unregulated companies of reasonably comparable risk to a Canadian utility. The selection<br />
should conform to investor perceptions of the risk characteristics of utilities, which are<br />
generally characterized by relative stability of earnings, dividends and market prices. These<br />
were the principal criteria for the selection of a sample of unregulated companies (from<br />
consumer-oriented industries). The criteria for selecting comparable unregulated low risk<br />
companies include industry, size, dividend history, stock and bond ratings and betas (See<br />
Appendix F).<br />
Since the universe of Canadian unregulated companies is sufficiently large to produce a<br />
representative sample of sufficient size, the focus of the comparable earnings analysis was<br />
on Canadian firms. The application of the selection criteria to the Canadian universe<br />
produced a sample of 27 companies.<br />
Next, since unregulated companies’ returns on equity tend to be cyclical, the selection of an<br />
appropriate period for measuring their returns must be determined. The period selected<br />
should encompass an entire business cycle, covering years of both expansion and decline.<br />
That cycle should be representative of a future normal cycle, e.g., the historic and forecast<br />
cycles should be similar in terms of inflation and real economic growth. The full business<br />
cycle 1991-2007 provides an appropriate proxy for the next business cycle, as the average<br />
experienced rates of inflation and economic growth were reasonably similar to the rates<br />
projected by economists over the next business cycle. The experienced returns on equity of<br />
the sample of 27 Canadian low risk unregulated companies over this period were in the<br />
range of 12.5%-12.75% (see Appendix F and Schedule 20).<br />
The next step is to assess whether or not there is a need to adjust the “raw” comparable<br />
earnings results to reflect the differential risk of a Canadian utility relative to the selected<br />
unregulated companies. The comparative risk data (including betas and stock and bond<br />
ratings) indicate, on balance, the unregulated Canadian companies are of modestly higher<br />
risk than the typical Canadian utility, e.g., TGI. To recognize the unregulated companies’<br />
3091 <strong>Terasen</strong> Foster Associates, Inc.<br />
Page | 70
1780<br />
1781<br />
1782<br />
1783<br />
1784<br />
1785<br />
1786<br />
1787<br />
1788<br />
1789<br />
1790<br />
1791<br />
1792<br />
1793<br />
1794<br />
1795<br />
1796<br />
1797<br />
1798<br />
1799<br />
1800<br />
1801<br />
1802<br />
1803<br />
1804<br />
1805<br />
1806<br />
1807<br />
somewhat higher risk, a downward adjustment of 75-100 basis points 84 to their returns on<br />
equity was made, resulting in a comparable earnings result in the range of 11.5%-11.75%.<br />
While the focus of the comparable earnings analysis is on the Canadian sample, I also<br />
selected a sample of low risk unregulated U.S. companies to corroborate the reasonableness<br />
of the Canadian results. The selection criteria were similar to those used for the Canadian<br />
unregulated company sample. The greater breadth of the U.S. market allowed the selection<br />
of a sample of 81 companies in the same stable industries used to select the Canadian<br />
unregulated companies. The experienced returns of the U.S. unregulated companies were<br />
approximately 15.5%. (see Appendix F and Schedule 21 ). The comparative risk data<br />
indicate that the U.S. unregulated companies are of somewhat higher risk than the<br />
benchmark sample of U.S. utilities (see Appendix F and Schedules 19 and 21). The <strong>ROE</strong><br />
adjusted for the U.S. unregulated companies’ higher risk relative to utilities is approximately<br />
14%. The returns of the significantly larger U.S. unregulated company sample underscore<br />
the reasonableness of the comparable earnings results for the sample of unregulated<br />
Canadian companies.<br />
The final step is to assess the need for a market/book adjustment to the comparable earnings<br />
results. The sample results would warrant such an adjustment if their market/book ratios<br />
relative to the overall market indicated an ability to exert market power. In other words, a<br />
high market/book ratio (relative to that of the overall market) could suggest returns on<br />
equity that were higher than the levels achievable if market power were not present. The<br />
average market/book ratio of the sample of Canadian comparable unregulated companies<br />
over the 1991-2007 period was 2.1 times, virtually identical to the market/book ratio of the<br />
S&P/TSX composite over the same period and substantially lower than the 3.1 times<br />
recorded by the S&P 500 (see Appendix F). The similar to lower average market/book ratio<br />
of the Canadian proxy sample relative to both the Canadian and U.S. equity market<br />
composites indicates no evidence of market power. Thus there is no rationale for making an<br />
84 Based on the typical spread between Moody’s BBB rated long-term industrial bond yields and long-term Arated<br />
utility bond yields and the relative betas of the unregulated companies and the Canadian and U.S. utility<br />
samples.<br />
3091 <strong>Terasen</strong> Foster Associates, Inc.<br />
Page | 71
1808<br />
1809<br />
1810<br />
1811<br />
1812<br />
additional downward adjustment to the unregulated Canadian companies’ returns on equity<br />
due to their market/book ratios. As a result, a fair return on equity based on the comparable<br />
earnings test is approximately 11.5% to 11.75%.<br />
3091 <strong>Terasen</strong> Foster Associates, Inc.<br />
Page | 72
1813<br />
1814<br />
1815<br />
1816<br />
1817<br />
1818<br />
1819<br />
1820<br />
1821<br />
1822<br />
1823<br />
1824<br />
1825<br />
1826<br />
1827<br />
1828<br />
1829<br />
1830<br />
1831<br />
1832<br />
1833<br />
1834<br />
1835<br />
1836<br />
F. FAIR RETURN ON EQUITY FOR TGI<br />
The results of the three tests used to estimate a fair return on equity for TGI are summarized<br />
below:<br />
Table 11<br />
Test Cost of Equity<br />
Fair<br />
Return on Equity<br />
Equity Risk Premium 9.75% 10.25%<br />
Discounted Cash Flow 10.5-11.0% 11.0-11.5%<br />
Comparable Earnings N/A 11.5-11.75%<br />
In arriving at a reasonable return for a benchmark utility, I have given primary weight to the<br />
cost of attracting capital, as measured by both the equity risk premium and DCF tests. The<br />
“bare-bones” cost of attracting capital based on these two tests is approximately 9.75-<br />
10.75%. Including the allowance for financing flexibility, the indicated return on equity is<br />
10.25-11.25%. However, the results of the comparable earnings test are also entitled to<br />
significant weight when setting a fair return. A fair <strong>ROE</strong> for TGI, at its proposed common<br />
equity ratio of 40.0%, based on all three tests is approximately 11.0%.<br />
G. THE FAIR RETURN FOR TGI WITHIN THE ATWACC<br />
FRAMEWORK<br />
In its May 19, <strong>2009</strong> Reasons for Decision for TQM, the NEB adopted the after-tax weighted<br />
average cost of capital (ATWACC) methodology for setting the allowed return for TQM for<br />
2007 and 2008. The following section is intended to translate my recommendations to an<br />
ATWACC framework.<br />
3091 <strong>Terasen</strong> Foster Associates, Inc.<br />
Page | 73
1837<br />
1838<br />
1839<br />
1840<br />
1841<br />
1842<br />
1843<br />
1844<br />
1845<br />
1846<br />
1847<br />
1848<br />
1849<br />
1850<br />
1851<br />
1852<br />
1853<br />
1854<br />
1855<br />
1856<br />
1857<br />
1858<br />
1859<br />
1860<br />
1861<br />
1862<br />
1863<br />
1864<br />
ATWACC is equal to:<br />
[(% Debt) x (Cost of Debt) x (1-tax rate)] + [(% Equity) x (Cost of Equity)]<br />
Where,<br />
(1) the cost of debt is the current cost of debt, and<br />
(2) the debt and equity components are measured on a market value basis,<br />
rather than on a book value basis.<br />
The rationale for using market value capital structures recognizes that estimates of the cost<br />
of capital reflects the market value of the firms’ capital, both debt and equity. To provide<br />
for an income tax allowance, the ATWACC must be adjusted to a before tax value as<br />
follows:<br />
ATWACC/ (1-corporate income tax rate) 85<br />
For example, in Brealey, Myers and Allen, Principles of Corporate Finance, Eighth Edition<br />
(McGraw-Hill/Irwin, 2006, p. 504), the authors state the following in reference to the<br />
calculation of the weighted average cost of capital:<br />
“Why did we show the book balance sheet? Only so you could draw a big X<br />
through it. Do so now.<br />
When estimating the weighted-average cost of capital, you are not interested<br />
in past investments but in current values and expectations for the future.”<br />
The market value capital structures may be quite different from the book value capital<br />
structures. When the market value common equity ratio is higher (lower) than the book<br />
85 For utilities which are regulated on a flow-through income tax methodology, the indicated income tax<br />
allowance must be adjusted for timing differences.<br />
3091 <strong>Terasen</strong> Foster Associates, Inc.<br />
Page | 74
1865<br />
1866<br />
1867<br />
1868<br />
1869<br />
1870<br />
1871<br />
1872<br />
1873<br />
1874<br />
1875<br />
1876<br />
1877<br />
1878<br />
1879<br />
1880<br />
1881<br />
1882<br />
1883<br />
1884<br />
1885<br />
1886<br />
1887<br />
1888<br />
1889<br />
1890<br />
1891<br />
1892<br />
value common equity ratio, the market is attributing less (more) financial risk to the firm<br />
than is “on the books” as measured by the book value capital structure. Higher financial risk<br />
leads to a higher cost of common equity, all other things equal. Schedules 24 and 25<br />
provide the market and book value capital structures for both the Canadian utilities and the<br />
benchmark sample of U.S. gas and electric utilities used to develop the cost of equity for<br />
TGI. 86<br />
To put this concept in common sense terms, assume that I purchased my home 10 years ago<br />
for $100,000 and took out a mortgage for the full amount. My home is currently worth<br />
$250,000 and my mortgage is now $85,000. If I were applying for a loan, the bank would<br />
consider my net worth (equity) to be $165,000 (market value of $250,000 less the $85,000<br />
unpaid mortgage), not the “book value” of the equity in my home of $15,000, which reflects<br />
the original purchase price less the unpaid mortgage loan amount. It is the market value of<br />
my home that determines my financial risk to the bank, not the original purchase price. The<br />
same principle applies when the cost of common equity is estimated. The book value of the<br />
common equity shares is not the relevant measure of financial risk to equity investors; it is<br />
their market value, that is, the value at which the shares could be sold.<br />
Regulatory convention applies the allowed equity return to a book value capital structure.<br />
When the market value equity ratios of the proxy utilities deviate from the book value<br />
common equity ratios, application of an unadjusted market-derived cost of equity to the<br />
book value capital structure fails to recognize the differences in financial risk between<br />
market value and book value capital structures and the corresponding difference in the cost<br />
of equity implied by the book value capital structures.<br />
In opting for the ATWACC approach rather than the approach which it and other Canadian<br />
regulators have historically relied upon, the NEB concluded that it:<br />
86 For purposes of estimating the market value capital structures, the simplifying assumptions were made that<br />
(a) the market value of debt is equal to the book value and (b) the small average preferred share component of<br />
the samples’ capital structures was assigned to debt.<br />
3091 <strong>Terasen</strong> Foster Associates, Inc.<br />
Page | 75
1893<br />
1894<br />
1895<br />
1896<br />
1897<br />
1898<br />
1899<br />
1900<br />
1901<br />
1902<br />
1903<br />
1904<br />
1905<br />
1906<br />
1907<br />
1908<br />
1909<br />
1910<br />
1911<br />
1912<br />
1913<br />
1914<br />
(1) “is more aligned with the way capital budgeting decision making takes place<br />
in the business world as compared to an approach by component that would<br />
include a stand-alone cost of equity estimate; ”<br />
(2) enables better comparisons of return on capital between companies that have<br />
similar risk, whereas the approach by component requires a determination of<br />
both <strong>ROE</strong> and capital structure, which are inextricably linked; and<br />
(3) provides an ease of comparison which leads to fewer errors and enhanced<br />
clarity.<br />
To apply the ATWACC methodology, only the market-based cost of equity tests would be<br />
considered. The comparable earnings test, which estimates returns related to book value,<br />
would not be considered in the ATWACC framework. In addition, since the market value<br />
capital structures for the proxy samples are in excess of book value, the financing flexibility<br />
adjustment is partly subsumed by reliance on market value capital structures. 87<br />
The table below summarizes the ATWACCs based on the CAPM using the market value<br />
capital structures of the Canadian utilities, and the DCF-based risk premium test and the<br />
88 89<br />
DCF test using the market value capital structures of the U.S benchmark utility sample.<br />
The average ATWACC based on these three tests is approximately 7.4%.<br />
87 In principle, the component of financing flexibility which represents actual flotation costs, i.e., out of pocket<br />
expenses and the new issue pricing discount would be added to the cost of equity when estimating the<br />
ATWACC. For simplicity, I have estimated the ATWACC using the “bare-bones” costs of debt and equity.<br />
88 The ATWACC was not estimated using the historical utility equity risk premium test as the test was<br />
developed using aggregate data for the gas and electric utility industries in Canada and the U.S. over the longterm.<br />
The data necessary to develop the market value capital structure which prevailed over the entire historic<br />
period are not readily available.<br />
89 The corporate income tax used in all cases is the 2010 combined federal/BC rate of 28.5%.<br />
3091 <strong>Terasen</strong> Foster Associates, Inc.<br />
Page | 76
1915<br />
1916<br />
1917<br />
1918<br />
1919<br />
1920<br />
1921<br />
1922<br />
1923<br />
1924<br />
1925<br />
1926<br />
1927<br />
1928<br />
1929<br />
1930<br />
1931<br />
1932<br />
1933<br />
1934<br />
1935<br />
1936<br />
1937<br />
1938<br />
1939<br />
1940<br />
1941<br />
Table 12<br />
Debt Cost of<br />
After-tax<br />
Cost of Equity Cost of<br />
Test (%) Debt 1-t Debt (%) Equity ATWACC<br />
CAPM 50.5% 6.625% 0.715 4.74% 49.5% 8.75% 6.7%<br />
DCF-RP 45% 6.625% 0.715 4.74% 55% 10.0% 7.6%<br />
DCF 45% 6.625% 0.715 4.74% 55% 10.5% 7.9%<br />
Source: Schedules 24, page 1 of 3, Schedule 25, page 1 of 3 and Sections VI B.6 and VI.C. of testimony.<br />
To translate these ATWACCs into an equivalent <strong>ROE</strong> and capital structure, two approaches,<br />
or theories of capital structure, can be used that quantify the impact of a change in financial<br />
risk on the cost of equity.<br />
Theory 1 posits that income taxes and the deductibility of interest for corporate income tax<br />
purposes have no impact on the cost of capital. Under this theory, the overall cost of capital<br />
stays constant when the capital structure changes, although the costs of the debt and equity<br />
components change (i.e., the cost of equity rises when the equity ratio declines).<br />
Theory 2 posits that income taxes and the corporate deductibility of interest expense cause<br />
the overall cost of capital to continually decline as the equity ratio declines and the debt ratio<br />
increases.<br />
The actual impact on the cost of capital most likely lies in between the results of the two<br />
theories; income taxes and the deductibility of interest do tend to decrease the cost of capital<br />
(as the income trust market has demonstrated), but as the debt ratio rises, there are<br />
increasing costs in terms of loss of financing flexibility and potential bankruptcy. Moreover,<br />
in the case of regulated companies, the benefit of the tax deductibility of interest is to the<br />
benefit of ratepayers, while in the unregulated sector, the benefit goes to the shareholder.<br />
Since both theories have merit, both were applied to estimate the impact of a change in<br />
return on equity on capital structure and to present the equivalent <strong>ROE</strong>s at TGI’s proposed<br />
book value common equity ratio of 40.0%. Schedules 24 and 25 present the methodology<br />
and illustrative calculations.<br />
3091 <strong>Terasen</strong> Foster Associates, Inc.<br />
Page | 77
1942<br />
1943<br />
1944<br />
1945<br />
1946<br />
1947<br />
1948<br />
1949<br />
Table 13<br />
Test ATWACC<br />
Equivalent <strong>ROE</strong> at 40.0%<br />
Common Equity Ratio 1/<br />
CAPM 6.7% 9.5%<br />
DCF-Based RP 7.6% 11.5%<br />
DCF 7.9% 12.25%<br />
1/ Average of Theory 1 and Theory 2 Results<br />
Based solely on these three tests, the equivalent <strong>ROE</strong> using the ATWACC approach would<br />
be approximately 11.1%, compared to the 11.0% recommended. 90<br />
90 The average ATWACC equivalent <strong>ROE</strong>s and the <strong>ROE</strong> indicated using the traditional <strong>ROE</strong>/capital structure<br />
approach would have been virtually identical had the <strong>ROE</strong>s estimated using the DCF-based risk premium test<br />
and the DCF test been adjusted for the difference between TGI’s proposed book value common equity ratio<br />
and the benchmark U.S. utility sample’s average book value common equity ratio.<br />
3091 <strong>Terasen</strong> Foster Associates, Inc.<br />
Page | 78
1950<br />
1951<br />
1952<br />
1953<br />
1954<br />
1955<br />
1956<br />
1957<br />
1958<br />
1959<br />
1960<br />
1961<br />
1962<br />
1963<br />
1964<br />
1965<br />
1966<br />
1967<br />
1968<br />
1969<br />
1970<br />
1971<br />
1972<br />
1973<br />
1974<br />
1975<br />
1976<br />
1977<br />
1978<br />
1979<br />
1980<br />
VII. AUTOMATIC ADJUSTMENT MECHANISM<br />
TGI is proposing to fix the benchmark <strong>ROE</strong> for a period of time longer than one year, or<br />
until one or more parties conclude it is no longer meeting the Fair Return Standard and seeks<br />
to have the BCUC review the allowed <strong>ROE</strong>. In principle, the proposal to fix the benchmark<br />
<strong>ROE</strong> until such time as stakeholders consider that the <strong>ROE</strong> is no longer meeting the fair<br />
return standard is not unreasonable, as the fair return does not typically fluctuate widely<br />
from year to year.<br />
The proposal to fix the <strong>ROE</strong> for a period of time under the current circumstances is<br />
reasonable for two other reasons. First, it is difficult at the present time, given the unusually<br />
volatile capital market conditions and the abnormally low levels of long-term Government<br />
of Canada bond yields, to specify a simple, objective and transparent formula that will, with<br />
some degree of certainty, be equally applicable when the capital markets return to more<br />
normal conditions.<br />
Second, the empirical evidence shows that, with the benefit of hindsight, it is clear that the<br />
cost of equity has not tracked the downward trend in long-term Canada bond yields nearly to<br />
the extent implied by the existing automatic adjustment formula. A 50% elasticity factor<br />
would be more closely aligned with the correlation between the utility cost of equity and<br />
long-term government bond yields.<br />
However, it is critical to recognize that the implementation of a 50% elasticity factor is only<br />
appropriate if the allowed <strong>ROE</strong> is set at a level that meets the fair return standard. The<br />
allowed <strong>ROE</strong>s for BC utilities, as well as for other Canadian utilities subject to a similar<br />
formula, have been persistently declining since the formulas’ inception, by approximately<br />
75% of the decline in long-term Canada bond yields. The implementation of a formula still<br />
tied to long-term Canada bond yields and a lower sliding scale factor would be unfair and<br />
3091 <strong>Terasen</strong> Foster Associates, Inc.<br />
Page | 79
1981<br />
1982<br />
1983<br />
1984<br />
1985<br />
unreasonable without an explicit recognition that the operation of the existing formulas has<br />
overstated the decline in the cost of equity. Consequently, it is reasonable for TGI not to<br />
propose an alternative automatic adjustment mechanism until such time as the level of the<br />
benchmark return has been determined by the Commission.<br />
3091 <strong>Terasen</strong> Foster Associates, Inc.<br />
Page | 80
Appendices<br />
<strong>Capital</strong> <strong>Structure</strong> and<br />
Fair Return on Equity<br />
Prepared for<br />
TERASEN GAS INC.<br />
Prepared by<br />
KATHLEEN C. McSHANE<br />
FOSTER ASSOCIATES, INC.<br />
May <strong>2009</strong>
A THE FAIR RETURN STANDARD<br />
APPENDICES<br />
B. RISK-ADJUSTED EQUITY MARKET RISK PREMIUM TEST<br />
C. DCF-BASED RISK PREMIUM TEST<br />
D. DISCOUNTED CASH FLOW TEST<br />
E. FINANCING FLEXIBILITY ADJUSTMENT<br />
F. COMPARABLE EARNINGS TEST<br />
G. QUALIFICATIONS OF KATHLEEN C. McSHANE
APPENDIX A<br />
THE FAIR<br />
RETURN STANDARD<br />
Three standards for a fair return have arisen from the legal precedents for establishing a fair<br />
return, the capital attraction, financial integrity and comparable returns, or comparable<br />
investment, standard. The principal Court cases in Canada and the U.S. establishing the<br />
standards include Northwestern <strong>Utilities</strong> Ltd. v. Edmonton (City), [1929] S.C.R. 186; Bluefield<br />
Water Works & Improvement Co. v. Public Service Commission of West Virginia, 262 U.S. 679,<br />
692 (1923); and, Federal Power Commission v. Hope Natural Gas Company (320 U.S. 591<br />
(1944)).<br />
In Northwestern, Mr. Justice Lamont stated<br />
The duty of the Board was to fix fair and reasonable rates; rates which, under the<br />
circumstances, would be fair to the consumer on the one hand, and which, on the other<br />
hand, would secure to the company a fair return for the capital invested. By a fair return<br />
is meant that the company will be allowed as large a return on the capital invested in its<br />
enterprise (which will be net to the company) as it would receive if it were investing the<br />
same amount in other securities possessing an attractiveness, stability and certainty equal<br />
to that of the company's enterprise.<br />
In Bluefield, the criteria for a fair return were described as follows:<br />
A public utility is entitled to such rates as will permit it to earn a return on the value of<br />
the property which it employs for the convenience of the public equal to that generally<br />
being made at the same time and in the same general part of the country on investments<br />
in other business undertakings which are attended by corresponding risks and<br />
uncertainties; but it has no constitutional right to profits such as are realized or<br />
anticipated in highly profitable enterprises or speculative ventures. The return should be<br />
reasonably sufficient to assure confidence in the financial soundness of the utility and<br />
should be adequate, under efficient and economical management, to maintain and support<br />
its credit and enable it to raise the money necessary for the proper discharge of its public<br />
duties.<br />
Appendix A Foster Associates, Inc.<br />
Page A - 1
In Hope, Justice Douglas stated,<br />
By that standard the return on equity owner should be commensurate with returns on<br />
investments in other enterprises having corresponding risks. That return, moreover,<br />
should be sufficient to assure confidence in the financial integrity of the enterprise, so as<br />
to maintain its credit and to attract capital.<br />
The fact that the allowed return is applied to an original cost rate base is key to distinguishing<br />
between the capital attraction/financial integrity standards and the comparable returns standards.<br />
The base to which the return is applied determines the dollar earnings stream to the utility,<br />
which, in turn, generates the return to the shareholder (dividends plus capital appreciation). In<br />
the early years of rate of return regulation in North America, there was considerable debate over<br />
how to measure the investment base. The controversy arose from the objective that the price for<br />
a public utility service should allow a fair return on the fair value of the capital invested in the<br />
business. The debate focused on what constituted fair value: Was it historic cost, reproduction<br />
cost, or market value? Ultimately, Hope opted for the “reasonableness of the end result” rather<br />
than the specification of a particular method of rate base determination. The use of a historic<br />
cost rate base became the norm because it provided an objective, measurable point of departure<br />
to which the return would be applied. There is no prescription, however, that the historic cost<br />
rate base itself constitutes the “fair value” of the investment.<br />
Nevertheless, regulators’ application of a capital market-derived “cost of attracting capital” to a<br />
historic rate base in principle will result in the market value of the investment trending toward<br />
the historic cost based on the erroneous assumption that this equates to “fair value”. The “fair<br />
value equals original cost” result arises from the way “cost” has typically been interpreted and<br />
applied in determining other cost elements in the regulation of North American utilities. For<br />
most utilities, rates are set on the basis of book costs; that concept has been applied to the cost of<br />
debt and depreciation expense, as well as to all operating and maintenance expenses.<br />
Appendix A Foster Associates, Inc.<br />
Page A - 2
For economists, the theoretically appropriate definition of cost is marginal or incremental cost.<br />
For regulated utilities historic costs have been substituted for marginal or incremental costs for<br />
two reasons: first, as a practical matter, long-run incremental costs are difficult to measure;<br />
second, for the capital intensive utility industries, pricing on the basis of short-run marginal costs<br />
would not cover total costs incurred.<br />
The determination of the return on common equity for regulated companies has traditionally<br />
been a “hybrid” concept. The cost of equity is a forward-looking measure of the equity<br />
investors’ required return. It is, therefore, an incremental cost concept. The required equity<br />
return is not, however, applied to a similarly determined rate base (that is, current cost). It is<br />
applied to an original cost rate base. When there is a significant difference between the historic<br />
original cost rate base and the corresponding current cost of the investment, application of a<br />
current cost of attracting capital to an original cost rate base produces an earnings stream that is<br />
significantly lower than that which is implied by the application of that same cost rate to market<br />
value. The divergence between the earnings stream implied by the application of the return to<br />
book value rather than market value is magnified as a result of the long lives of utility assets.<br />
The current cost of attracting capital is measured by reference to market values. The discounted<br />
cash flow test, for example, measures the return that investors require on the market value of the<br />
equity. For a utility regulated on the basis of original cost book value, the current cost of<br />
attracting equity capital is only equivalent to the return investors require on book value when the<br />
market value of the common stock is equal to its book value. As the market value of the equity<br />
of regulated utilities increases above its book value, the application of a market-value derived<br />
cost of equity to the book value of that equity increasingly understates investors’ return<br />
requirements (in dollar terms).<br />
Some would argue that the market value of utility shares should be equal to book value.<br />
However, economic principles do not support that conclusion. A basic economic principle<br />
establishes the expected relationship between market value and replacement cost which provides<br />
support for market prices in excess of original cost book value. That economic principle holds<br />
Appendix A Foster Associates, Inc.<br />
Page A - 3
that, in the longer-run, in the aggregate for an industry, market value should equal replacement<br />
cost of the assets. The principle is based on the notion that, if the market value of firms exceeds<br />
the replacement cost of the productive capacity, there is an incentive to establish new firms. The<br />
existence of additional firms would lower prices of goods and services, lower profits and thus<br />
reduce market values of all the firms in the industry. In the opposite circumstance, there is an<br />
incentive to disinvest, i.e., to not replace depreciated assets. The disappearance of firms would<br />
push up prices of goods and services; raise the profits of the remaining firms, thereby raising the<br />
market values of the remaining firms. In equilibrium, market value should equal replacement<br />
cost. In the presence of inflation, even at moderate levels, absent significant technological<br />
advances, replacement cost should exceed the original cost book value of assets. Consequently,<br />
the market value of utility shares should be expected to exceed their book value.<br />
Therefore, when the allowed return on original cost book value is set, a market-derived cost of<br />
attracting capital must be converted to a fair and reasonable return on book equity. The<br />
conversion of a market-derived cost of capital to a fair return on book value ensures that the<br />
stream of dollar earnings on book value equates to the investors’ dollar return requirements on<br />
market value.<br />
Appendix A Foster Associates, Inc.<br />
Page A - 4
APPENDIX B<br />
RISK-ADJUSTED<br />
EQUITY MARKET RISK PREMIUM TEST<br />
1. CONCEPTUAL UNDERPINNINGS OF THE CAPITAL ASSET<br />
PRICING MODEL<br />
The <strong>Capital</strong> Asset Pricing Model (CAPM) is a theoretical, formal model of the equity risk<br />
premium test which posits that the investor requires a return on a security equal to:<br />
Where:<br />
RF + β(RM – RF),<br />
RF = risk-free rate<br />
β = covariability of the security with the market (M)<br />
RM = return on the market.<br />
The model is based on restrictive assumptions, including:<br />
a. Perfect, or efficient, markets exist where,<br />
(1) each investor assumes he has no effect on security prices;<br />
(2) there are no taxes or transaction costs;<br />
(3) all assets are publicly traded and perfectly divisible;<br />
(4) there are no constraints on short-sales; and,<br />
(5) the same risk-free rate applies to both borrowing and lending.<br />
Appendix B Foster Associates, Inc.<br />
Page B-1
. Investors are identical with respect to their holding period, their expectations and the fact<br />
that all choices are made on the basis of risk and return.<br />
The CAPM relies on the premise that an investor requires compensation for non-diversifiable<br />
risks only. Non-diversifiable risks are those risks that are related to overall market factors (e.g.,<br />
interest rate changes, economic growth). Company-specific risks, according to the CAPM, can<br />
be diversified away by investing in a portfolio of securities whose expected returns are not<br />
perfectly correlated. Therefore, a shareholder requires no compensation to bear companyspecific<br />
risks.<br />
In the CAPM, non-diversifiable risk is captured in the beta, which, in principle, is a forwardlooking<br />
(expectational) measure of the volatility of a particular stock or portfolio of stocks,<br />
relative to the market. Specifically, the beta is equal to:<br />
Covariance (RE,RM)<br />
Variance (RM)<br />
The variance of the market return is intended to capture the uncertainty related to economic<br />
events as they impact the market as a whole. The covariance between the return on a particular<br />
stock and that of the market reflects how responsive the required return on an individual security<br />
is to changes in events that also change the required return on the market.<br />
The CAPM is a normative model, that is, it estimates the equity return that an investor should<br />
require under the restrictive assumptions outlined above, based on the relative systematic risk of<br />
the stock.<br />
Appendix B Foster Associates, Inc.<br />
Page B-2
2. RISK-FREE RATE<br />
a. The theoretical CAPM assumes that the risk-free rate is uncorrelated with the return on<br />
the market. In other words, the assumption is that there is no relationship between the<br />
risk-free rate and the equity market return (i.e., the risk-free rate has a zero beta).<br />
However, the application of the model frequently assumes that the return on the market is<br />
highly correlated with the risk-free rate, that is, that the equity market return and the riskfree<br />
rate move in tandem.<br />
b. The theoretical CAPM calls for using a risk-free rate, whereas the typical application of<br />
the model in the regulatory context employs a long-term government bond yield as a<br />
proxy for the risk-free rate. Long-term government bond yields may reflect various<br />
factors that render them problematic as an estimate of the “true” risk-free rate, including:<br />
(1) The yield on long-term government bonds reflects the impact of monetary and<br />
fiscal policy; e.g., the potential existence of a scarcity premium. The Canadian<br />
federal government has been in a surplus position since 1997/1998 (eleven years),<br />
which has reduced its financing requirements. 1 However, the demand for longterm<br />
government securities by institutions (e.g., pension funds) that match assets<br />
and liabilities has not declined. The pension funds, key purchasers of long-term<br />
government bonds, are typically buy and hold investors which means that the<br />
government bonds in their portfolios do not trade. Thus, there is the potential not<br />
only for a scarcity premium in prices due to the demand for long-term<br />
government bonds, but also potential illiquidity in the market.<br />
(2) Yields on long-term government bonds may reflect shifting degrees of investors’<br />
risk aversion; e.g., “flight to quality”. An increase in the equity risk premium<br />
arising from a reduction in bond yields due to a “flight to quality” is not likely to<br />
1 The Federal government is anticipating budget deficits for fiscal years <strong>2009</strong>/10 to 2012/13.<br />
Appendix B Foster Associates, Inc.<br />
Page B-3
e captured in the typical application of the CAPM which focuses on a long-term<br />
average market risk premium. Particularly in periods of capital market upheaval,<br />
e.g., the “Asian contagion” in the fall of 1998, during the technology sector sell-<br />
off beginning in mid-2000, the post 9/11 period, and most recently, in the wake of<br />
the subprime mortgage crisis commencing in late 2007, investors have shifted to<br />
the safe haven of government securities, pushing down government bond yields<br />
and increasing the required equity risk premium. The typical application of the<br />
CAPM captures the lower government bond yields, but not the increase in the<br />
equity risk premium.<br />
(3) Long-term government bond yields are not risk-free; they are subject to interest<br />
rate risk. The size of the equity market risk premium at a given point in time<br />
depends in part on how risky long-term government bond yields are relative to the<br />
overall equity market. The need to capture and measure changes in the risk of the<br />
so-called risk-free security introduces a further complication in the application of<br />
the CAPM, particularly as the changes impact the measurement of the equity<br />
market risk premium.<br />
(4) The radical change in Canada’s fiscal performance over the past decade has<br />
contributed to a steady decline in long-term government bond yields and a<br />
corresponding increase in total returns achieved by investors in long-term<br />
government securities. As a result, the achieved equity market risk premiums in<br />
Canada have been squeezed by the performance of the government bond market.<br />
The low prevailing and forecast long-term Government of Canada bond yields<br />
relative to both the historic yields and total returns on those securities indicate that<br />
the historic yields and returns on long-term Government of Canada bonds<br />
overstate the forward looking risk-free rate.<br />
Appendix B Foster Associates, Inc.<br />
Page B-4
3. THE CANADIAN EQUITY MARKET<br />
Several factors inherent in the Canadian equity market make historic Canadian equity risk<br />
returns problematic in estimating the forward-looking expected equity market return. First and<br />
foremost, the Canadian equity market has been, and continues to be dominated by a relatively<br />
small number of sectors; the returns do not reflect those of a fully diversified portfolio.<br />
Historically, the Canadian equity market composite has been dominated by resource-based<br />
stocks. At the end of 1980, no less than 46% of the market value of the TSX Composite Index<br />
(previously the TSE 300), was resource-based stocks. 2 The next largest sector, financial<br />
services, at less than 15% of the total market value of the composite, was a distant second. With<br />
the rise of the technology-based sectors and the increasing market presence of financial services,<br />
at the end of 2000, resource-based stocks had dropped to less than 20% of the total market value<br />
of the TSX Composite Index. By comparison, as indicated in Table B-1 below, the technologybased<br />
and financial service sectors accounted for over half of the market value of the index.<br />
Table B-1<br />
1980 2000<br />
Information Technology 0.9% 24.1%<br />
Telecommunication Services 4.8% 6.5%<br />
Financial Services 13.5% 24.1%<br />
Total 19.2% 54.7%<br />
Source: TSE Review, December 1980 and December 2000.<br />
With the technology sector bust in 2000-2001, and the run-up in commodity prices commencing<br />
in 2004, the resource-based sectors reclaimed dominance. At the end of 2007, the energy and<br />
materials (largely mining) sectors accounted for close to 45% of the total market value of the<br />
composite. Including the financial services sector, three sectors accounted for close to 75% of<br />
the total market value of the composite. Despite the sharp decline in commodity prices in 2008<br />
2 As measured by the oil and gas, gold and precious minerals, metals/minerals, and pulp and paper products sectors.<br />
Excludes “the conglomerates sector”, which also contained stocks with significant commodity exposure.<br />
Appendix B Foster Associates, Inc.<br />
Page B-5
and the fall-out of the sub-prime mortgage crisis, at the end of 2008, the same three sectors<br />
continued to represent close to three-quarters of the value of the S&P/TSX Composite Index.<br />
By comparison, the U.S. market has been significantly more diversified among industry sectors.<br />
A comparison of market weights in Canada and the U.S. of the major sectors at December 2008<br />
demonstrates the difference.<br />
Table B-2<br />
S&P/TSX S&P 500<br />
Sector<br />
Canada U.S.<br />
Consumer Discretionary 4.7% 8.4%<br />
Consumer Staples 3.4% 12.9%<br />
Energy 27.4% 13.3%<br />
Financials 29.2% 13.3%<br />
Health Care 0.4% 14.8%<br />
Industrials 6.1% 11.1%<br />
Information Technology 3.3% 15.3%<br />
Materials 17.6% 3.0%<br />
Telecommunication Services 6.0% 3.8%<br />
<strong>Utilities</strong> 1.9% 4.2%<br />
Source: TSX Review December 2008 and Standardandpoors.com.<br />
Even within the remaining 25% of the Canadian market (the non-resource and non-financial<br />
sectors); there are various sectors of the economy that are relatively underrepresented, e.g.,<br />
pharmaceuticals, health care and retailing.<br />
Further, the performance of the Canadian equity market as the “market portfolio” has been, at<br />
different periods of time, unduly influenced by a small number of companies. In mid-2000,<br />
before the debacle in Nortel Networks’ stock value, Nortel shares alone accounted for almost<br />
35% of the total market value of the TSX Composite Index as compared to the largest stock in<br />
the S&P 500 at that time (General Electric) which accounted for only 4% of total market value.<br />
In 2007, two stocks, Potash Corporation and Research in Motion, were responsible for<br />
Appendix B Foster Associates, Inc.<br />
Page B-6
approximately half of the gain in the S&P/TSX Composite Index. The undue influence of a<br />
small number of stocks requires caution in drawing conclusions from the history of the<br />
Composite regarding the forward-looking market risk premium.<br />
Criticism of the former TSE 300 Index cited the lack of liquidity as well as questioned the<br />
quality and size of the stocks which comprised the index. In a speech in early 2002, Joseph<br />
Oliver, President and CEO of the Investment Dealers Association of Canada stated,<br />
Over the last 25 years, the TSE 300 has steadily declined as a relevant benchmark index.<br />
Part of the problem relates to the illiquidity of the smaller component companies and part<br />
to the departure of larger companies that were merged or acquired. Over the last two<br />
years, 120 Canadian companies have been deleted from the TSE 300.<br />
When a company disappears from a US index due to a merger or acquisition, that doesn’t<br />
affect the U.S. market’s liquidity. An ample supply of large cap, liquid U.S. companies<br />
can take its place. In Canada, when a company merges or is acquired by another<br />
company, it leaves the index and is replaced by a smaller, less liquid Canadian company.<br />
We have seen this over the last two years, -- notably in the energy sector. Over the next<br />
few years, we are likely to see it in financial services, where further consolidation is<br />
inevitable. Over time, Canada’s senior index has become less diversified, with more<br />
smaller component companies. As a result, as many as 75 of the TSE 300 will not<br />
qualify for inclusion in the new S&P/TSE Composite Index.<br />
Standard & Poor’s and the TSX addressed some these concerns when it overhauled the TSE 300<br />
in May 2002, creating the S&P/TSX Composite Index. The overhaul of the index, which<br />
included more stringent criteria for inclusion, did not require that a specific number of<br />
companies be included in the index. As a result, only 275 companies were initially included<br />
instead of the previous 300. At December 31, 2008 there were 220 companies in the S&P/TSX<br />
Composite Index, including 53 income trusts.<br />
The addition of income trusts in 2005 represented a significant change in the make-up of the<br />
Composite Index. From the beginning of the decade to their peak in late 2006, the market value<br />
of income trusts grew rapidly, from a market capitalization of approximately $20 billion, to more<br />
than $200 billion. At the end of September 2006, prior to the announced change in tax treatment<br />
Appendix B Foster Associates, Inc.<br />
Page B-7
for income trusts, they accounted for over 11.5% of the total market value of the S&P/TSX<br />
Composite. At the end of 2008, income trusts continued to be a significant component of the<br />
S&P/TSX, accounting for approximately 25% of the issues and 7% of the value of the index.<br />
Despite the change to the income tax treatment of income trusts announced in October 2006,<br />
income trusts significantly outperformed “conventional” equities during the period for which<br />
income trust market data are readily available. The annual total return for the S&P/TSX Capped<br />
Income Trust Index over the 1998-2008 period averaged 10.8%, compared to 4.7% for the<br />
S&P/TSX Composite Index. The exclusion of income trust returns from the S&P/TSX<br />
Composite Index prior to 2005 means that the measured equity returns using the Composite<br />
Index understate the actual equity market returns achieved by Canadian investors.<br />
A further complication is created by the existence of restrictions on the foreign content of assets<br />
held in pension plans and tax deferred savings plans such as Registered Retirement Savings<br />
Plans (RRSPs) for approximately five decades (1957-2005). The restrictions on the ability of<br />
Canadians to invest globally negatively impacted their achieved returns. In 1957, when tax<br />
deferred savings plans were first established, no more than 10% of the income in pension plans<br />
or RRSPs could come from foreign sources. The Foreign Property Rule was instated in 1971<br />
and limited foreign content to 10% of the book value of assets in the funds. The limit was raised<br />
to 20% in 2% increments between 1990 and 1994.<br />
In 1999, the Investment Funds Institute of Canada (IFIC) estimated that raising the cap to 20%<br />
had increased annual returns by 1% and that a 30% limit would increase returns a further 0.5%. 3<br />
The limit was raised to 30% in 5% increments between 2000 and 2001. In 2002, the Pension<br />
Investment Association of Canada (PIAC) and the Association of Canadian Pension<br />
Management (ACPM) published a report entitled The Foreign Property Rule: A Cost-Benefit<br />
Analysis, 4 which supported the removal of the cap. 5 The Globe and Mail reported that the<br />
3<br />
Tom Hockin, President and CEO IFIC, Paving the Way for Change to RRSP Foreign Content Rules, January 31,<br />
2000.<br />
4<br />
David Burgess and Joel Fried, The Foreign Property Rule: A Cost-Benefit Analysis, The University of Western<br />
Ontario, November 2002.<br />
5<br />
The IFIC’s report Year 2002 in Review stated,<br />
Appendix B Foster Associates, Inc.<br />
Page B-8
emoval of the foreign content cap is expected to “have the broadest long-term impact of any<br />
personal finance measure in the budget. Global stock markets, accessible to any investor through<br />
global equity mutual funds, have historically made higher returns than the Canadian market,<br />
which only accounts for just over 2 per cent of the world’s stock market value.” 6 The Foreign<br />
Property Rule was finally eliminated in 2005.<br />
4. USE OF ARITHMETIC AVERAGES OF HISTORIC RETURNS TO<br />
ESTIMATE THE EXPECTED EQUITY MARKET RISK PREMIUM<br />
a. Rationale for the Use of Arithmetic Averages<br />
In Robert F. Bruner, Kenneth M. Eades, Robert S. Harris, and Robert C. Higgins, “Best<br />
Practices in Estimating the Cost of <strong>Capital</strong>: Survey and Synthesis”, Financial Practice<br />
and Education, Spring/Summer 1998, pp. 13-28, the authors found that 71% of the texts<br />
and tradebooks in their survey supported use of an arithmetic mean for estimation of the<br />
cost of equity. One such textbook, Richard A. Brealey, Stewart C. Myers and Franklin<br />
Allen, Principles of Corporate Finance, Boston: Irwin/McGraw Hill, 2006 (p. 151),<br />
states, “Moral: If the cost of capital is estimated from historical returns or risk premiums,<br />
use arithmetic averages, not compound annual rates of return.”<br />
The appropriateness of using arithmetic averages, as opposed to geometric averages, for<br />
this purpose is succinctly explained in Ibbotson Associates; Stocks, Bonds, Bills and<br />
Inflation, 1998 Yearbook, pp. 157-159:<br />
During the period of 1991-1998, the percentage of sales in equity mutual funds that were comprised of nondomestic<br />
equities has hovered around the 41-58% range. This has significantly increased in 1999 and<br />
onwards. While performance in the markets is the major factor affecting such an increase, these figures can<br />
also be attributed to increases in foreign content limits in registered retirement savings plans as well as<br />
increased interest and availability of foreign clone funds.<br />
6 Rob Carrick, Finance: Your Bottom Line, Globeandmail.com, February 23, 2005.<br />
Appendix B Foster Associates, Inc.<br />
Page B-9
The expected equity risk premium should always be calculated using the<br />
arithmetic mean. The arithmetic mean is the rate of return which when<br />
compounded over multiple periods, gives the mean of the probability distribution<br />
of ending wealth values . . . in the investment markets, where returns are<br />
described by a probability distribution, the arithmetic mean is the measure that<br />
accounts for uncertainty, and is the appropriate one for estimating discount rates<br />
and the cost of capital. 7<br />
Triumph of the Optimists: 101 Years of Global Investment Returns by Elroy Dimson,<br />
Paul Marsh and Mike Staunton, Princeton: Princeton University Press, 2002 (p. 182),<br />
stated,<br />
The arithmetic mean of a sequence of different returns is always larger than the<br />
geometric mean. To see this, consider equally likely returns of +25 and –20<br />
percent. Their arithmetic mean is 2½ percent, since (25 – 20)/2 = 2½. Their<br />
geometric mean is zero, since (1 + 25/100) x (1 – 20/100) – 1 = 0. But which<br />
mean is the right one for discounting risky expected future cash flows? For<br />
forward-looking decisions, the arithmetic mean is the appropriate measure.<br />
To verify that the arithmetic mean is the correct choice, we can use the 2½<br />
percent required return to value the investment we just described. A $1 stake<br />
would offer equal probabilities of receiving back $1.25 or $0.80. To value this,<br />
we discount the cash flows at the arithmetic mean rate of 2½ percent. The present<br />
values are respectively $1.25/1.025 = $1.22 and $0.80/1.025 = $0.78, each with<br />
equal probability, so the value is $1.22 x ½ + $0.80 x ½ = $1.00. If there were a<br />
sequence of equally likely returns of +25 and –20 percent, the geometric mean<br />
return will eventually converge on zero. The 2½ percent forward-looking<br />
arithmetic mean is required to compensate for the year-to-year volatility of<br />
returns.<br />
7 An illustration from Ibbotson Associates demonstrating why the arithmetic average is more appropriate than the<br />
geometric average for estimating the expected risk premium is presented on pages B11 and B12.<br />
Appendix B Foster Associates, Inc.<br />
Page B-10
. Illustration of Why Arithmetic Average Should be Used<br />
In Ibbotson Associates, Stocks, Bonds, Bills and Inflation: Valuation Edition, 2008, the<br />
following discussion was included:<br />
To illustrate how the arithmetic mean is more appropriate than the geometric<br />
mean in discounting cash flows, suppose the expected return on a stock is 10<br />
percent per year with a standard deviation of 20 percent. Also assume that only<br />
two outcomes are possible each year: +30 percent and -10 percent (i.e., the mean<br />
plus or minus one standard deviation). The probability of occurrence for each<br />
outcome is equal. The growth of wealth over a two-year period is illustrated in<br />
Graph 5-4.<br />
The most common outcome of $1.17 is given by the geometric mean of 8.2<br />
percent. Compounding the possible outcomes as follows derives the geometric<br />
mean:<br />
[(1+0.30)x(1-0.10)] ½ - 1 = 0.082<br />
However, the expected value is predicted by compounding the arithmetic, not the<br />
geometric, mean. To illustrate this, we need to look at the probability-weighted<br />
average of all possible outcomes:<br />
(0.25 x $1.69) = $0.4225<br />
+ (0.50 x $1.17) = $0.5850<br />
+ (0.25 x $0.81) = $0.2025<br />
Total $1.2100<br />
Appendix B Foster Associates, Inc.<br />
Page B-11
Therefore, $1.21 is the probability-weighted expected value. The rate that must<br />
be compounded to achieve the terminal value of $1.21 after 2 years is 10 percent,<br />
the arithmetic mean.<br />
$1 x (1+0.10) 2 = $1.21<br />
The geometric mean, when compounded, results in the median of the distribution:<br />
$1 x (1+0.0.082) 2 = $1.17<br />
The arithmetic mean equates the expected future value with the present value; it is<br />
therefore the appropriate discount rate.<br />
c. Randomness of Annual Equity Market Risk Premiums<br />
The use of arithmetic averages is premised on the unpredictability of future risk<br />
premiums. The following figures illustrate the uncertainty in the future risk premiums by<br />
reference to the historic annual risk premiums. The figures for both Canada and the U.S.<br />
suggest that each year’s actual risk premium has been random, that is, not serially<br />
correlated with the preceding year’s risk premium. 8<br />
8 A test for serial correlation between the year-to-year equity risk premiums shows that the serial correlation<br />
between the current year’s risk premium and that of the prior year for the period 1947-2008 is 0.06 for Canada and -<br />
0.02 for the U.S. If the current year’s risk premium were predictable based on the prior year’s risk premium, the<br />
serial correlation would be close to positive or negative 1.0.<br />
Appendix B Foster Associates, Inc.<br />
Page B-12
Figure B-1<br />
Source: Canadian Institute of Actuaries, Report on Canadian Economic Statistics, 1924-2006;<br />
Ibbotson Canadian Risk Premia Over Time 2008, TSX Review and Bank of Canada<br />
Figure B-2<br />
Source: Ibbotson Associates, Stocks, Bonds, Bills & Inflation, <strong>2009</strong> Yearbook,<br />
www.standardandpoors.com and the Federal Reserve<br />
Appendix B Foster Associates, Inc.<br />
Page B-13
5. FUTURE vs. HISTORIC RISK PREMIUMS<br />
a. Trends in Canadian Equity and Government Bond Returns<br />
Figures B-3 and B-4 compare historic Canadian stock returns, long-term government<br />
bond total and income 9 returns and equity risk premiums, over rolling 10-year periods<br />
ending 1956-2008.<br />
Source: Schedule 9.<br />
Figure B-3<br />
9 The income return reflects only the bond coupon portion of the total bond return. The other components are the<br />
reinvestment return and the capital gain or loss. The bond coupon payment represents the riskless portion of the<br />
bond total return.<br />
Appendix B Foster Associates, Inc.<br />
Page B-14
Source: Schedule 9.<br />
Figure B-4<br />
The rolling ten-year averages in both Figures B-3 and B-4 suggest that there has been no<br />
upward or downward trend over time in equity returns over time. On average, equity<br />
market returns in Canada have been approximately 11.5% from 1947-2008. By<br />
comparison, bond returns (both Total and Income returns) exhibited an increase<br />
throughout much of the period, before beginning to decline in the early to mid-1990s.<br />
The pattern in the bond returns results from:<br />
♦ rising bond yields in the 1950s through the mid-1980s, which produced capital<br />
losses on bonds and low bond total return;<br />
♦ high bond income and income returns in the 1980s, reflecting the high rates of<br />
inflation; and,<br />
Appendix B Foster Associates, Inc.<br />
Page B-15
♦ high bond total returns in the 1990s and first half of the 2000s, reflecting the<br />
decline in long-term government bond yields, resulting in capital gains and total<br />
returns well in excess of the yields. 10<br />
The resulting average income and total return on long-term government bonds in Canada<br />
has been approximately 7.0% during the post-World War II period (1947-2008), well in<br />
excess of the long-term Canada bond yields which are forecast to prevail going forward.<br />
Given the absence of any upward or downward trend in the historic equity market<br />
returns, a reasonable expected value of the future equity market return, based solely on<br />
the post-World War II Canadian equity market returns, is approximately 11.5%. Based<br />
on a 2010 forecast long-term Canada bond yields of 4.25%, and an expected equity<br />
market return over the long-term of 11.5%, the indicated equity market risk premium is<br />
approximately 7.25%. Based on the longer-term (<strong>2009</strong>-2019) forecast for long-term<br />
Canada bond yields of approximately 5.25%, 11 the indicated equity market risk premium<br />
is 6.25%.<br />
b. Trends in Price/Earnings Ratios<br />
Several studies of historic and equity risk premiums conclude that the equity returns<br />
generated historically are unsustainable, since they were achieved through an increase in<br />
price/earnings ratios that cannot be perpetuated.<br />
With respect to the U.S. equity market, the preponderance of the increase in<br />
price/earnings ratios occurred during the 1990s. The P/E ratio 12 of the S&P 500 averaged<br />
13.25 times from 1936-1988, with no discernible upward trend. 13 From 11.7 times in<br />
10<br />
The bond yield is, in fact, an estimate of the expected return.<br />
11<br />
Consensus Economics, Consensus Forecasts, April <strong>2009</strong> anticipates the 10-year Canada bond yield to average<br />
approximately 5.0% from <strong>2009</strong> to 2019. The average spread between 10- and 30-year Canada bond yields has<br />
historically averaged approximately 0.30%.<br />
12<br />
Price to trailing earnings.<br />
13<br />
The average from 1947-1988 was 13 times.<br />
Appendix B Foster Associates, Inc.<br />
Page B-16
1988, the P/E ratio gradually rose, peaking at over 46 times in late 2001. At the height of<br />
the equity market (1998 to mid-2000), frequently described as a “speculative bubble”,<br />
investors believed the only risk they faced was not being in the equity market. In mid-<br />
2000, the bubble burst, as the U.S. economy began to lose steam. The events of<br />
September 11, 2001, the threat of war, the loss of credibility on Wall Street, accounting<br />
misrepresentations and outright fraud, led to a loss of confidence in the market and a<br />
sense of pessimism about the equity market. These events led to a heightened<br />
appreciation of the inherent risk of investing in the equity market, all of which translated<br />
into a “bearish” outlook for the U.S. equity market and sent retail investors to the<br />
sidelines. 14 By mid-2006, the P/E ratio had fallen to 17 times; in mid-February <strong>2009</strong>,<br />
with the sell-off in the market which commenced in mid-2007, it was 15 times (based on<br />
estimated 2008 operating earnings), compared to the long-term (1936-2008) average of<br />
approximately 16 times.<br />
To assess the impact of rising P/E ratios on achieved returns, I analyzed the equity returns<br />
of the S&P 500 achieved between 1936 and 1988, that is, prior to the observed upward<br />
trend in P/E ratios. The analysis indicates that the achieved arithmetic average equity<br />
return for the S&P 500 was 12.3% from 1936-1988. The corresponding average return<br />
from 1936-2008 was 11.8%. Hence, despite the increase in P/E ratios experienced during<br />
the 1990s, the average equity market returns were actually lower over the entire 1936-<br />
2008 period than over the 1936-1988 period. The results are similar for the post-World<br />
War II period. The average returns from 1947-1988, at 13.1%, are higher than the<br />
average of 12.2% over the entire 1947-2008 period. Stated differently, the increase in<br />
P/E ratios during the 1990s has not resulted in a higher and unsustainable level of equity<br />
market returns. Consequently, based on history, an expected value for the U.S. equity<br />
market return equal to the historic level of approximately 12.0% is not unreasonable.<br />
Relative to the consensus forecast yield for 30-year Treasury bonds for 2010 of<br />
14<br />
Weakness in the equity markets was partly responsible (along with low interest rates) for the burgeoning income<br />
trust market in Canada.<br />
Appendix B Foster Associates, Inc.<br />
Page B-17
approximately 4.25% and for the longer term of approximately 5.4%, 15 the risk premium<br />
would be approximately 6.5-7.75%.<br />
My review of equity returns in Canada indicates similar results. The 1936-1988<br />
arithmetic average return for the Canadian equity market was 11.8%, identical to the<br />
average U.S. equity market return for the same period, and higher than the average 1936-<br />
2008 return of 11.0%. Similarly, the 1947-1988 return of 12.9% is higher than the 1947-<br />
2008 return of 11.6%. There is no indication that rising P/E ratios during the bull market<br />
of the 1990s have produced returns that are unsustainable going forward.<br />
c. Equity Market Risk Premium<br />
The analysis of stock and bond returns in Canada and the U.S. during the post World War<br />
II period reveals no upward or downward trend in market equity returns. Nevertheless,<br />
the achieved risk premiums have declined. The arithmetic average achieved risk<br />
premium in Canada (in relation to bond total returns) from 1947-1988 was 7.7%; in the<br />
U.S., it was 8.4%. By comparison, the corresponding 1947-2008 achieved risk premiums<br />
(in relation to the total returns on bonds) were 4.6% and 5.6% for Canada and the U.S.<br />
respectively. An analysis of the data shows that high bond returns have been the<br />
principal reason for the decline in experienced risk premiums, not a downward trend in<br />
equity returns. The average bond total return (income plus capital appreciation) in<br />
Canada from 1989-2008 was 10.7%.<br />
Over the entire 1947-2008 period, the average income total return on long-term Canada<br />
bonds was approximately 7.0%. With interest rates currently at historically low levels<br />
(approximately 3.75% at mid-April <strong>2009</strong>), and more likely to increase rather than<br />
decrease further, the 1947-2008 average bond returns of approximately 7.0% overstate<br />
the forward-looking expected bond return indicated by current and forecast 30-year<br />
Canada bond yields. A reasonable expected value of the long-term Canada bond return<br />
15 Blue Chip Financial Forecasts, December 1, 2008.<br />
Appendix B Foster Associates, Inc.<br />
Page B-18
for the purpose of estimating the forward-looking equity market risk premium is the<br />
forecast long-term Canada bond yields, rather than the historic average bond returns.<br />
Thus a reasonable estimate of the forward-looking equity market risk premium is<br />
approximately 6.75%, based on historic equity market returns in Canada and the U.S. in<br />
the range of 11.0% to 12.0% 16 and a risk-free rate of 4.25% (2010 forecast of 30-year<br />
Canada bond yield) to 5.25% (forecast of 30-year Canada bond yield over the longer<br />
term).<br />
6. RELATIVE RISK ADJUSTMENT<br />
a. Beta<br />
Impediments to reliance on beta as the sole relative risk measure, as the CAPM indicates,<br />
include:<br />
(1) The assumption that all risk for which investors require compensation can be<br />
captured and expressed in a single risk variable;<br />
(2) The only risk for which investors expect compensation is non-diversifiable equity<br />
market risk; no other risk is considered (and priced) by investors; and,<br />
(3) The assumption that the observed calculated betas (which are simply a calculation<br />
of how closely a stock’s or portfolio’s price changes have mirrored those of the<br />
overall equity market) 17 are a good measure of the relative return requirement.<br />
16 Over the three-month period, January <strong>2009</strong>-March <strong>2009</strong>, the average dividend yield on the S&P/TSX was 2.6%.<br />
The expected long-term growth rate for the index based on available analysts’ forecasts for the companies in the<br />
Composite, is 9.9%, indicating an expected return (based on a discounted cash flow approach) of approximately<br />
12.8%.<br />
17 The beta is equal to:<br />
Covariance (RE,RM)<br />
Variance (RM)<br />
Appendix B Foster Associates, Inc.<br />
Page B-19
(4) Use of beta as the relative risk adjustment allows for the conclusion that the cost<br />
of equity capital for a firm can be lower than the risk-free rate, since stocks that<br />
have moved counter to the rest of the equity market could be expected to have<br />
betas that are negative. Gold stocks, for example, which are regarded as a<br />
quintessential counter-cyclical investment, could reasonably be expected to<br />
exhibit negative betas. In that case, the CAPM would posit that the cost of equity<br />
capital for a gold mining firm would be less than the risk-free rate, despite the fact<br />
that, on a total risk basis, the company’s stock could be very volatile.<br />
The body of evidence on CAPM leads to the conclusion that, while betas do<br />
measure relative volatility, the proportionate relationship between beta and return<br />
posited by the CAPM has not been established. A summary of various studies,<br />
published in a guide for practitioners, concluded,<br />
Empirical tests of the CAPM have, in retrospect, produced results that are<br />
often at odds with the theory itself. Much of the failure to find empirical<br />
support for the CAPM is due to our lack of ex ante, expectational data.<br />
This, combined with our inability to observe or properly measure the<br />
return on the true, complete, market portfolio, has contributed to the body<br />
of conflicting evidence about the validity of the CAPM. It is also possible<br />
that the CAPM does not describe investors’ behavior in the marketplace.<br />
Theoretically and empirically, one of the most troubling problems for<br />
academics and money managers has been that the CAPM’s single source<br />
of risk is the market. They believe that the market is not the only factor<br />
that is important in determining the return an asset is expected to earn.<br />
(Diana R. Harrington, Modern Portfolio Theory, The <strong>Capital</strong> Asset Pricing<br />
Model & Arbitrage Pricing Theory: A User’s Guide, Second Edition,<br />
Prentice-Hall, Inc., 1987, page 188.)<br />
Betas are typically calculated by reference to historical relative volatility using simple regression analysis of the<br />
change in the market portfolio return and the corresponding change in an individual stock or portfolio of stock<br />
returns.<br />
Appendix B Foster Associates, Inc.<br />
Page B-20
Fama and French in “The CAPM: Theory and Evidence”, Journal of Economic<br />
Perspectives, Volume 18, Number 3 (Summer 2004), pp. 25-26:<br />
The attraction of the CAPM is that it offers powerful and intuitively<br />
pleasing predictions about how to measure risk and the relation between<br />
expected return and risk. Unfortunately, the empirical record of the model<br />
is poor – poor enough to invalidate the way it is used in applications. The<br />
CAPM’s empirical problems may reflect theoretical failings, the result of<br />
many simplifying assumptions. But they may also be caused by<br />
difficulties in implementing valid tests of the model. For example, the<br />
CAPM says that the risk of a stock should be measured relative to a<br />
comprehensive ‘market portfolio’ that in principle can include not just<br />
traded financial assets, but also consumer durables, real estate and human<br />
capital. Even if we take a narrow view of the model and limit its purview<br />
to traded financial assets, is it legitimate to limit further the market<br />
portfolio to U.S. common stocks (a typical choice), or should the market<br />
be expanded to include bonds, and other financial assets, perhaps around<br />
the world? In the end, we argue that whether the model’s problems reflect<br />
weaknesses in the theory or in its empirical implementation, the failure of<br />
the CAPM in empirical tests implies that most applications of the model<br />
are invalid.<br />
Fama and French have developed an alternative model which incorporates two<br />
additional explanatory factors in an attempt to overcome the problems inherent in<br />
the single variable CAPM. 18<br />
To quote Burton Malkiel in A Random Walk Down Wall Street, New York: W. W.<br />
Norton & Co., 2003:<br />
18 The additional factors are size and book to market.<br />
Beta, the risk measure from the capital-asset pricing model, looks nice on<br />
the surface. It is a simple, easy-to-understand measure of market<br />
sensitivity. Alas, beta also has its warts. The actual relationship between<br />
beta and rate of return has not corresponded to the relationship predicted<br />
in theory during long periods of the twentieth century. Moreover, betas<br />
for individual stocks are not stable from period to period, and they are<br />
very sensitive to the particular market proxy against which they are<br />
measured.<br />
Appendix B Foster Associates, Inc.<br />
Page B-21
I have argued here that no single measure is likely to capture adequately<br />
the variety of systematic risk influences on individual stocks and<br />
portfolios. Returns are probably sensitive to general market swings, to<br />
changes in interest and inflation rates, to changes in national income, and,<br />
undoubtedly, to other economic factors such as exchange rates. And if the<br />
best single risk estimate were to be chosen, the traditional beta measure is<br />
unlikely to be everyone’s first choice. The mystical perfect risk measure<br />
is still beyond our grasp. (page 240)<br />
One of the key developers of the Arbitrage Pricing Model, Dr. Stephen Ross, has<br />
stated,<br />
Beta is not very useful for determining the expected return on a stock, and<br />
it actually has nothing to say about the CAPM. For many years, we have<br />
been under the illusion that the CAPM is the same as finding that beta and<br />
expected returns are related to each other. That is true as a theoretical and<br />
philosophical tautology, but pragmatically, they are miles apart. 19<br />
b. Relationship between Beta and Return in the Canadian Equity Market<br />
To test the actual relationship between beta and return in a Canadian context, the betas<br />
(using monthly total return data) were calculated for various periods for each of the 15<br />
major sub-indices of the “old” TSE 300 as were the corresponding actual geometric<br />
average total returns. Simple regressions of the betas on the achieved market returns<br />
were then conducted to determine if there was indeed the expected positive relationship.<br />
The regressions covered (a) 1956-2003, the longest period for which data for the TSE<br />
300 and its sub-index components are available; (b) 1956-1997, which eliminates the<br />
major effects of the “technology bubble”, and (c) all potential non-overlapping 10-year<br />
periods from 2003 backwards.<br />
19<br />
Dr. Stephen A. Ross, “Is Beta Useful?” The CAPM Controversy: Policy and Strategy Implications for Investment<br />
Management, AIMR, 1993.<br />
Appendix B Foster Associates, Inc.<br />
Page B-22
The analysis showed the following:<br />
Table B-3<br />
Returns Coefficient on<br />
Measured Over: Beta<br />
R 2<br />
1956-2003 -.088 47%<br />
1956-1997<br />
-.082 44%<br />
1964-1973 -.020 1%<br />
1974-1983 -.008 1%<br />
1984-1993 -.056 11%<br />
1994-2003 -.053 9%<br />
Source: Schedule 11, page 1 of 2.<br />
The analysis suggests that, over the longer term, the relationship between beta and return<br />
has been negative, rather than the positive relationship posited by the CAPM. For<br />
example, as indicated in Table B-3 above, for the period 1956-2003, the R 2 of 47%<br />
means that the betas explained 47% of the variation in returns among the key sectors of<br />
the TSE 300 index. However, since the coefficient on the beta was negative, this means<br />
that the higher beta companies actually earned lower returns than the low beta companies.<br />
A series of regressions was also performed on the 10 major sectors of the S&P/TSX<br />
Composite. These regressions covered (a) 1988-2008, the longest period for which data<br />
for the new Composite and its sector components are available; (b) 1988-1997, 20 and (c)<br />
the most recent 10-year period ending 2008.<br />
20 The use of this sub-period was intended to ensure elimination of the impacts of any anomalous market behavior<br />
during the technology “bubble and bust”, which occurred mainly from 1999 through mid-2002.<br />
Appendix B Foster Associates, Inc.<br />
Page B-23
That analysis showed the following:<br />
Table B-4<br />
Returns Measured Coefficient on<br />
Over:<br />
Beta<br />
R 2<br />
1988-2008 -.047 26%<br />
1988-1997<br />
-.017 1%<br />
1999-2008 -.084 32%<br />
Source: Schedule 11, page 2 of 3.<br />
These analyses indicate that, historically, the relationship between beta and return in the<br />
Canadian equity market has been the reverse (higher beta = lower return) than the posited<br />
relationship. The results strongly suggest that, at a minimum, adjusted betas, rather than<br />
“raw” betas, should be relied upon in the application of the CAPM. Adjusting betas<br />
toward the equity market mean beta of 1.0 takes account of the empirically observed<br />
tendency of stocks with “raw” betas below 1.0 to achieve returns higher than implied by<br />
the theoretical single variable CAPM and vice versa.<br />
Appendix B Foster Associates, Inc.<br />
Page B-24
APPENDIX C<br />
DCF-BASED RISK PREMIUM TEST<br />
1. SELECTION OF LOW RISK BENCHMARK U.S. UTILITIES<br />
For the estimation of the benchmark return, a sample of low risk U.S. utilities was selected,<br />
comprised of all electric utilities and gas distributors satisfying the following criteria:<br />
a. Classified by Value Line as a gas distributor or an electric utility;<br />
b. Value Line Safety Rank of “2” or better;<br />
c. Standard & Poor’s business risk profile of “Excellent”;<br />
d. Standard & Poor’s debt rating of A- or higher;<br />
e. Not presently being acquired; and,<br />
f. Consistent history of analysts’ forecasts.<br />
The 13 utilities that met these criteria are listed on Schedule 15.<br />
Appendix C Foster Associates, Inc.<br />
Page C - 1
2. CONSTRUCTION OF THE DCF-BASED EQUITY RISK PREMIUM<br />
TEST<br />
The constant growth DCF model was used to construct a monthly series of expected utility<br />
returns for each of the 13 utilities in the sample over the period 1991-2008. The monthly DCF<br />
cost for each utility was estimated as the sum of the utilities’ I/B/E/S mean earnings growth<br />
forecast (published monthly) (g) and the corresponding expected monthly dividend yield (DYe).<br />
The dividend yield (DY) was calculated as the most recent quarterly dividend paid, annualized,<br />
divided by the monthly closing price. The expected dividend yield was then calculated by<br />
adjusting the monthly dividend yield for the I/B/E/S mean earnings growth forecast<br />
(DYe=DY*(1+g)). The individual utilities’ monthly DCF estimates (DYe + g) were then<br />
averaged to produce a time series of monthly DCF estimates (DCFs) for the sample. The<br />
monthly equity risk premium (ERP) for the sample was calculated by subtracting the<br />
corresponding 30-year Treasury yield (TY) from the average DCF cost of equity (ERPs=DCFs–<br />
TY) (Schedule 12). The monthly sample average ERPs were used to estimate the regression<br />
equations found on Schedule 12, page 2 of 2.<br />
Appendix C Foster Associates, Inc.<br />
Page C - 2
1. DCF MODELS<br />
a. Constant Growth Model<br />
APPENDIX D<br />
DISCOUNTED CASH FLOW TEST<br />
The constant growth model rests on the assumption that investors expect cash flows to<br />
grow at a constant rate throughout the life of the stock. The assumption that investors<br />
expect a stock to grow at a constant rate over the long-term is most applicable to stocks in<br />
mature industries. Growth rates in these industries will vary from year to year and over<br />
the business cycle, but will tend to deviate around a long-term expected value.<br />
The constant growth model is expressed as follows:<br />
where,<br />
Cost of Equity (k) = D1 + g,<br />
Appendix D Foster Associates, Inc.<br />
Page D - 1<br />
Po<br />
D1 = next expected dividend 21<br />
Po = current price<br />
g = constant growth rate<br />
21 Alternatively expressed as Do (1 + g), where Do is the most recently paid dividend.
This model, as set forth above, reflects a simplification of reality. First, it is based on the<br />
notion that investors expect all cash flows to be derived through dividends. Second, the<br />
underlying premise is that dividends, earnings, and price all grow at the same rate.<br />
However, it is likely that, in the near-term, investors expect growth in dividends to be<br />
lower than growth in earnings.<br />
The model can be adapted to account for the potential disparity between earnings and<br />
dividend growth by recognizing that all investor returns must ultimately come from<br />
earnings. Hence, focusing on investor expectations of earnings growth will encompass<br />
all of the sources of investor returns (e.g., dividends and retained earnings).<br />
b. Two-Stage Model<br />
The two-stage model is based on the premise that investors expect the growth rate for the<br />
utilities to be equal to the company-specific growth rates for the near-term (Stage 1<br />
Growth), but, in the longer-term (from Year 6 onward) to migrate to the expected longrun<br />
rate of growth in the economy (GDP Growth). All industries go through various<br />
stages in their life cycle. <strong>Utilities</strong> are considered to be the quintessential mature industry.<br />
Mature industries are those whose growth parallels that of the overall economy.<br />
The use of forecast GDP growth as the long-term growth component is a widely utilized<br />
approach. For example, the Merrill Lynch discounted cash flow model for valuation<br />
utilizes nominal GDP growth as a proxy for long-term growth expectations. The Federal<br />
Energy Regulatory Commission relies on GDP growth to estimate expected long-term<br />
nominal GDP growth for conventional corporations in its standard DCF models for gas<br />
and oil pipelines.<br />
Appendix D Foster Associates, Inc.<br />
Page D - 2
Using the two-stage DCF model, the DCF cost of equity is estimated as the internal rate<br />
of return that causes the price of the stock to equal the present value of all future cash<br />
flows to the investor.<br />
The cash flow per share in Year 1 is equal to:<br />
Last Paid Annualized Dividend x (1 + Stage 1 Growth)<br />
For Years 2 through 5, cash flow is defined as:<br />
Cash Flow t-1 x (1 + Stage 1 Growth)<br />
Cash flows from Year 6 onward are estimated as:<br />
Cash Flow t-1 x (1 + GDP Growth)<br />
3. SELECTION OF PROXY BENCHMARK UTILITIES<br />
The same sample of benchmark utilities was used as for the DCF-based risk premium test. The<br />
selection criteria for these low risk utilities are described in Appendix C.<br />
4. INVESTOR GROWTH EXPECTATIONS<br />
The application of the constant growth model relies principally on the consensus of investment<br />
analysts’ forecasts of long-term earnings growth compiled by I/B/E/S. The application of the<br />
two-stage model relies upon the I/B/E/S consensus earnings forecasts as the estimate of investor<br />
growth expectations during Stage 1. In the second stage, the investor growth expectations are<br />
proxied by the expected nominal long-run rate of growth in the economy (GDP) based on the<br />
consensus of economists’ long-term forecasts (published twice annually) found in Blue Chip<br />
Financial Forecasts (December 1, 2008). The consensus forecast rate of growth in the long-term<br />
(2010-2019) is 5.0%.<br />
Appendix D Foster Associates, Inc.<br />
Page D - 3
5. APPLICATION OF THE DCF MODELS<br />
a. Constant Growth Model<br />
The constant growth DCF model was applied to the sample of U.S. low risk gas and<br />
electric utilities using the following inputs to calculate the dividend yield:<br />
(1) the most recent annualized dividend paid as of March 31, <strong>2009</strong> as Do; and,<br />
(2) the average of the high and low monthly prices for the period January 1, <strong>2009</strong> to<br />
March 31, <strong>2009</strong> as Po.<br />
For the expected growth rates, the March <strong>2009</strong> I/B/E/S consensus (mean) earnings<br />
growth forecasts and the most recent Value Line forecasts of earnings growth 22 were used<br />
to estimate “g” in the growth component for each utility and to adjust the current<br />
dividend yield to the expected dividend yield.<br />
Table D-1 below summarizes the results of the constant growth model.<br />
Table D-1<br />
DCF Cost of Equity<br />
Earnings Growth Forecast Mean Median<br />
I/B/E/S 11.0% 10.9%<br />
Value Line<br />
Source: Schedules 16 and 17.<br />
11.3% 11.0%<br />
22 Estimates issued in November and December 2008.<br />
Appendix D Foster Associates, Inc.<br />
Page D - 4
. Two-Stage Model<br />
The two-stage model relies on the I/B/E/S consensus of analysts’ earnings forecasts for<br />
the first five years (Stage 1), and forecast growth in the economy thereafter (Stage 2).<br />
The consensus long-run (2010-2019) expected nominal rate of growth in GDP, as noted<br />
above, is 5.0%.<br />
The two-stage DCF model estimates of the cost of equity for the benchmark low risk U.S.<br />
utility sample (Schedule 18) are as follows:<br />
Mean 10.3%<br />
Median 10.5%<br />
c. Results of the Constant Growth and Two-Stage Models<br />
The results of the two models indicate a required “bare-bones” return on equity of<br />
approximately 10.4% (two-stage model) to 11.0% (constant growth model).<br />
Appendix D Foster Associates, Inc.<br />
Page D - 5
APPENDIX E<br />
FINANCING FLEXIBILITY ADJUSTMENT<br />
An adjustment to the equity risk premium and discounted cash flow test results for financing<br />
flexibility is required because the measurement of the return requirement based on market data<br />
results in a "bare-bones" cost. It is “bare-bones” in the sense that, theoretically, if this return is<br />
applied to (and earned on) the book equity of the rate base (assuming the expected return<br />
corresponds to the approved return), the market value of the utility would be kept close to book<br />
value.<br />
The financing flexibility allowance is an integral part of the cost of capital as well as a required<br />
element of the concept of a fair return. The allowance is intended to cover three distinct aspects:<br />
(1) flotation costs, comprising financing and market pressure costs arising at the time of the sale<br />
of new equity; (2) a margin, or cushion, for unanticipated capital market conditions; and (3) a<br />
recognition of the "fairness" principle. Fairness dictates that regulation should not seek to keep<br />
the market value of a utility stock close to book value when unregulated companies of<br />
comparable investment risk have been able to consistently maintain the real value of their assets<br />
considerably above book value.<br />
The financing flexibility allowance recognizes that return regulation remains, fundamentally, a<br />
surrogate for competition. Competitive unregulated companies of reasonably similar risk to<br />
utilities have consistently been able to maintain the real value of their assets significantly in<br />
excess of book value, consistent with the proposition that, under competition, market value will<br />
tend to equal the replacement cost, not the book value, of assets.<br />
Utility return regulation should not seek to target the market/book ratios achieved by such<br />
unregulated companies, but, at the same time, it should not preclude utilities from achieving a<br />
level of financial integrity that gives some recognition to the longer run tendency for the market<br />
Appendix E Foster Associates, Inc.<br />
Page E - 1
value of unregulated companies to equate to the replacement cost of their productive capacity.<br />
This is warranted not only on grounds of fairness, but also on economic grounds, to avoid<br />
misallocation of capital resources. To ignore these principles in determining an appropriate<br />
financing flexibility allowance is to ignore the basic premise of regulation. The adjustment for<br />
financing flexibility recognizes that the market return derived from the equity risk premium test<br />
needs to be translated into a return that is fair and reasonable when applied to book value. The<br />
concept of a financing flexibility or flotation cost allowance has been accepted by most Canadian<br />
regulators.<br />
This premise was recognized by the Independent Assessment Team (IAT), retained by the<br />
Alberta Department of Resource Development to determine the cost parameters for the Power<br />
Purchase Arrangement (PPAs) for existing regulated generating plants, concluded in its 1999<br />
report, regarding flotation costs,<br />
This is sometimes associated with flotation costs but is more properly regarded as<br />
providing a financial cushion which is particularly applicable given the use of historic<br />
cost book values in traditional rate of return regulation in Canada. No such adjustment<br />
has ever been made in UK utility regulation cases which tend to use market values or<br />
current cost values. 23<br />
The Report of the IAT was accepted by the Alberta Energy and <strong>Utilities</strong> Board in Decision<br />
U99113 (December 1999).<br />
Further, the financing flexibility allowance should also recognize that both the equity risk<br />
premium and DCF cost of equity estimates are derived from market values of equity capital. The<br />
cost of capital reflects the market value of the firms’ capital, both debt and equity. The market<br />
value capital structures may be quite different from the book value capital structures. When the<br />
market value common equity ratio is higher (lower) than the book value common equity ratio,<br />
the market is attributing less (more) financial risk to the firm than is “on the books” as measured<br />
by the book value capital structure. Higher financial risk leads to a higher cost of common<br />
equity, all other things equal.<br />
23 Independent Assessment Team Power Purchase Arrangement Report, July 1999, page XLV, footnote 99.<br />
Appendix E Foster Associates, Inc.<br />
Page E - 2
Regulatory convention applies the allowed equity return to a book value capital structure. When<br />
the market value equity ratios of the proxy utilities are well in excess of their book value<br />
common equity ratios, application of an unadjusted market-derived cost of equity to the book<br />
value capital structure fails to recognize the higher financial risk and the higher cost of equity<br />
implied by the book value capital structures.<br />
Two approaches can be used to quantify the range of the impact of a change in financial risk on<br />
the cost of equity. The first approach is based on the theory that the overall cost of capital does<br />
not change materially over a relatively broad range of capital structures. The second approach is<br />
based on the theoretical model which assumes that the overall cost of capital declines as the debt<br />
ratio rises due to the income tax shield on interest expense. 24<br />
Schedules 24 and 25 provide the formulas and inputs for estimating the change in the cost of<br />
equity under each of the two approaches. The schedules show that a recognition of the<br />
difference in financial risk between the market value and book value capital structures of the<br />
publicly-traded Canadian utilities and the low risk U.S. utilities results in an increase in the cost<br />
of equity of approximately 100 basis points. A minimal recognition of the higher financial risk<br />
in the book value capital structures supports a financing flexibility adjustment of no less than 50<br />
basis points.<br />
At a minimum, the financing flexibility allowance should be adequate to allow a utility to<br />
maintain its market value, notionally, at a slight premium to book value, i.e., in the range of 1.05-<br />
1.10. At this level, a utility will be able to recover actual financing costs, as well as be in a<br />
position to raise new equity (under most market conditions) without impairing its financial<br />
24 The second approach does not account for any of the factors that offset the corporate income tax advantage of<br />
debt, including the costs of bankruptcy/loss of financing flexibility, the impact of personal income taxes on the<br />
attractiveness of issuing debt, or the flow-through of the benefits of interest expense deductibility to ratepayers.<br />
Thus, the results of applying the second approach will over-estimate the impact of leverage on the overall cost of<br />
capital and understate the impact of increasing financial leverage on the cost of equity.<br />
Appendix E Foster Associates, Inc.<br />
Page E - 3
integrity. A financing flexibility allowance adequate to maintain a market/book in the range of<br />
1.05-1.10 is approximately 50 basis points. 25<br />
The financing flexibility allowance should be, at a minimum, 50 basis points. As this financing<br />
flexibility adjustment is minimal, it does not fully address the comparable earnings standard.<br />
25<br />
The financing flexibility allowance is estimated using the following formula developed from the discounted cash<br />
flow formula:<br />
Return on Book Equity = Market/Book Ratio x “bare-bones” Cost of Equity<br />
1 + [retention rate (M/B – 1.0)]<br />
For a market/book ratio of 1.075 (mid-point of 1.05 and 1.10), assuming a dividend payout ratio of 65% and a cost<br />
of equity of 10.5%, the indicated <strong>ROE</strong> is:<br />
<strong>ROE</strong> = 1.075 x 10.5%<br />
1+<br />
[.35 (1.075 -1.0)]<br />
<strong>ROE</strong> = 11.0%<br />
The difference of 50 basis points between the <strong>ROE</strong> and the “bare-bones” cost of equity is the financing flexibility<br />
allowance.<br />
Appendix E Foster Associates, Inc.<br />
Page E - 4
APPENDIX F<br />
COMPARABLE EARNINGS TEST<br />
1. SELECTION OF CANADIAN UNREGULATED COMPANIES<br />
The selection process starts with the recognition that unregulated companies generally are<br />
exposed to higher business risk, but lower financial risk, than the typical utility. The selection of<br />
unregulated companies focuses on total investment risk, i.e., the combined business and financial<br />
risks. The unregulated companies’ higher business risks are offset by a more conservative<br />
capital structure, i.e., higher equity ratios, thus permitting the selection of samples of reasonably<br />
comparable investment risk to utilities.<br />
As a point of departure, the selection was limited to industries that are characterized by relatively<br />
stable demand characteristics, as well as consistent dividend payments and relatively low<br />
earnings and share price volatility. The initial universe consisted of all firms on the TSX in<br />
Global Industry Classification Standard (GICS) sectors 20-30. The sectors represented by the<br />
GICS codes in this range are: Industrials, Consumer Discretionary and Consumer Staples. 26 The<br />
resulting universe contained 490 firms. Companies were removed which:<br />
• Had 2007 equity less than $100 million,<br />
• Had missing or negative common equity during 1991-2007,<br />
• Were income trusts,<br />
• Had less than five years of market data,<br />
• Paid no dividends in any year 2004-2008,<br />
• Traded fewer than 5% of their outstanding shares in 2007,<br />
26 Included in these sectors are major industries such as: Food Retail, Food Distributors, Tobacco, Packaged Foods,<br />
Soft Drinks, Distillers, Household Appliances, Aerospace and Defense, Electrical Components & Equipment,<br />
Industrial Machinery, Publishing & Printing, Department Stores, and General Merchandise.<br />
Appendix F Foster Associates, Inc.<br />
Page F - 1
• Had stock ranked “higher risk” or “speculative by the Canadian Business<br />
Service (CBS)<br />
• Had debt rated non-investment grade, i.e., BB+ or below by either DBRS<br />
or Standard & Poor’s, or for which none of the agencies report a rating,<br />
• Had average five-year “raw” betas ending December 2007 and December<br />
2008 in excess of 1.0.<br />
The final sample of low risk Canadian unregulated companies is comprised of 27 companies<br />
(Schedule 19).<br />
2. TIME PERIOD FOR MEASURING RETURNS<br />
Since unregulated companies’ returns on equity tend to be cyclical, the appropriate period for<br />
measuring unregulated company returns should encompass an entire business cycle, covering<br />
years of both expansion and decline. The cycle should be representative of a future normal<br />
cycle, e.g., relatively similar in terms of inflation and real economic growth. The period 1991-<br />
2007 constitutes a full business cycle including the recession of 1991-1992. Over the period<br />
1991-2007, the experienced returns on equity of the sample of 27 low risk unregulated Canadian<br />
companies were as follows.<br />
Table F-1<br />
<strong>ROE</strong>s<br />
for Low Risk Canadian Unregulated<br />
Companies<br />
(1991-2007)<br />
Average 12.5%<br />
Median 12.7%<br />
Average of Annual Medians 12.8%<br />
Source: Schedule 20.<br />
Appendix F Foster Associates, Inc.<br />
Page F - 2
Based on these data, the <strong>ROE</strong>s for the low risk Canadian unregulated companies are in the<br />
approximate range of 12.5-12.75%.<br />
The average nominal economic growth for Canada during the 1991-2007 business cycle was<br />
4.9%, compared to the consensus forecast for real growth of 2.7%, and for inflation (CPI) of<br />
approximately 2.1% for the period (2010-2019) 27 , which suggests nominal long-term GDP<br />
growth of approximately 4.8%. Since nominal growth is expected to be virtually identical to the<br />
experienced rate during the past full business cycle, the experienced returns on book equity,<br />
absent extraordinary events, provide a reasonable proxy for the future.<br />
3. RELATIVE RISK COMPARISON<br />
With respect to the investment risk of the Canadian unregulated companies relative to Canadian<br />
utilities, comparisons of the various risk measures indicate that they are in a similar risk class.<br />
The median CBS stock rating for the unregulated companies is “Very Conservative”, the same as<br />
that of the investor-owned Canadian utilities with publicly-traded stock. The median S&P and<br />
DBRS debt ratings for the unregulated companies are BBB and BBB/BBB(high) respectively,<br />
compared to Canadian utilities’ median ratings of A- and A (See Schedules 3 and 19). The<br />
median adjusted beta for the unregulated companies averaged 0.71 for the two five-year periods<br />
ending December 2007 and 2008 (see Schedule 19), compared to the adjusted betas for Canadian<br />
utilities over the same time period of 0.59 (Schedule 11).<br />
The estimate of a normal cycle average level of returns for low risk Canadian unregulated<br />
companies is in the approximate range of 12.5-12.75%. The comparative risk data indicate, on<br />
balance, the Canadian unregulated companies are somewhat riskier than utilities. The somewhat<br />
higher risk of the unregulated companies relative to the typical Canadian utility requires a<br />
27 Consensus Economics, Consensus Forecasts, April <strong>2009</strong>.<br />
Appendix F Foster Associates, Inc.<br />
Page F - 3
modest downward adjustment. A downward adjustment of 75-100 basis points 28 reduces the<br />
<strong>ROE</strong> to a range of 11.5-11.75%.<br />
4. U.S. UNREGULATED COMPANY SAMPLE<br />
To ensure a sample of adequate size to provide reliable results, an additional sample of U.S.<br />
unregulated companies was selected to corroborate the reasonableness of the Canadian<br />
unregulated company results.<br />
The U.S. unregulated sample was selected as follows: The initial universe consisted of all<br />
companies actively traded in the U.S. from S&P’s Research Insight database in Global Industry<br />
Classification Standard (GICS) sectors 20-30. The resulting universe contained 2,585<br />
companies. Companies were removed which:<br />
• Are not incorporated in the U.S.<br />
• Had 2007 equity less than $100 million.<br />
• Had missing or negative common equity during 1991-2007.<br />
• Had less than five years of market data.<br />
• Paid no dividends in any year 2004-2008.<br />
• Traded fewer than 5% of their outstanding shares in 2007.<br />
• Had an S&P rating below BBB-.<br />
• Had a Value Line Rank of “4” or “5”.<br />
• Had a Value Line beta of 1.0 or higher<br />
• Had 1996-2007 returns outside one standard deviation of the sample average<br />
The returns for the sample of 81 U.S. companies are summarized in Table F-2 below.<br />
28 Based on the typical spread between Moody’s BBB rated long-term industrial bond yields and long-term A rated<br />
utility bond yields and the relative betas of the unregulated companies and the Canadian and U.S. utility samples.<br />
Appendix F Foster Associates, Inc.<br />
Page F - 4
Table F-2<br />
<strong>ROE</strong>s<br />
for Low Risk U.S. Unregulated Companies<br />
(1991-2007)<br />
Average: 15.9%<br />
Median 14.9%<br />
Average of Annual Medians: 15.7%<br />
Source: Schedule 21.<br />
The sample of unregulated U.S. companies has the following risk measures, compared to the<br />
benchmark sample of U.S. utilities.<br />
Table F-3<br />
Unregulated U.S,<br />
Companies<br />
Benchmark<br />
Sample of U.S.<br />
<strong>Utilities</strong><br />
Median Mean Median Mean<br />
S&P Debt Ratings<br />
Value Line Risk Measures:<br />
A- A- A A<br />
Safety<br />
3 2 1 1<br />
Beta<br />
0.80 0.80 0.65 0.67<br />
Source: Schedules 15and 21<br />
The comparative risk data indicate that the U.S. unregulated companies are of somewhat lower<br />
risk than the benchmark sample of U.S. utilities. Using the relative betas of the unregulated U.S.<br />
companies and the utilities to adjust for the unregulated companies’ higher risk, the indicated<br />
return on equity is approximately 14%. Used as a check on the returns on equity of the sample<br />
of unregulated Canadian firms, the <strong>ROE</strong>s of the significantly larger U.S. sample underscore the<br />
Appendix F Foster Associates, Inc.<br />
Page F - 5
easonableness of the comparable earnings results for the sample of Canadian unregulated<br />
companies.<br />
5. MARKET/BOOK RATIOS<br />
In arriving at its decision for TGI and TGVI in March 2006, the British Columbia <strong>Utilities</strong><br />
Commission stated that it did not believe comparable earnings had outlived its usefulness, and<br />
that it may yet play a role in future <strong>ROE</strong> hearings. Nevertheless, the BCUC concluded that there<br />
was insufficient evidence before it regarding whether or not a market/book ratio adjustment was<br />
merited and, if so, how it might be accomplished.<br />
The argument that a downward adjustment to the comparable earnings test results for<br />
market/book ratios has been made on the following bases:<br />
a. The market/book ratio of utility common shares should be approximately 1.0<br />
times, i.e., that the fair market value of utility shares is equal to their book value.<br />
b. Market/book ratios of unregulated firms well in excess of 1.0 times is evidence<br />
that the companies are earning returns in excess of their cost of capital, and thus<br />
are exerting market power.<br />
Both of these arguments are without merit. With respect to the notion that the market/book ratio<br />
of utility shares should be approximately 1.0 times, that conclusion is incompatible with the<br />
standard of comparable returns. The comparable returns standard requires that a utility have the<br />
opportunity to earn a return commensurate with returns on investments in other enterprises<br />
having corresponding risks.<br />
Regulation is intended to be a surrogate for competition. If unregulated competitive enterprises<br />
of corresponding risks to utilities are able to maintain market/book ratios in excess of 1.0, it<br />
would be patently contrary to the to the objective of regulation and to the comparable earnings<br />
Appendix F Foster Associates, Inc.<br />
Page F - 6
standard to reduce the returns of unregulated comparable firms in order to target a particular<br />
market/book ratio for a utility.<br />
With respect to the second rationale, the question that needs to be addressed is whether the<br />
market/book ratios of the sample of comparable unregulated companies are evidence of market<br />
power.<br />
To address this question, the first issue is whether the market/book ratios of competitive<br />
companies should, in principle, trend toward 1.0. Regulation is intended to be a surrogate for<br />
competition. The competitive model indicates that equity market values tend to gravitate toward<br />
the replacement cost of the underlying assets. This is due to the economic proposition that, if the<br />
discounted present value of expected returns (market value) exceeds the cost of adding capacity,<br />
firms will expand until an equilibrium is reached, i.e., when the market value equals the<br />
replacement cost of the productive capacity of the assets.<br />
The ratio of market value to replacement cost is called the “Q Ratio”, a term coined by the Nobel<br />
Prize winning economist James Tobin in the late 1960s. 29 Essentially, the economic theory is<br />
that the market value of assets in the aggregate should equate to their replacement cost, that is,<br />
the “Q Ratio” (market value/replacement cost) should trend toward 1.0.<br />
The “Q Ratio” has since gained stature as an investment tool, 30 whose importance was<br />
underscored in a March 2002 New York Times article which stated, referring to Tobin’s<br />
obituaries:<br />
Great emphasis was placed on how revolutionary his insights were three, four or five<br />
decades ago. Yet most were relatively silent on how those insights can lead us to be<br />
more successful investors today. It is a shame. Investors greatly handicap themselves if<br />
they ignore Dr. Tobin’s work.<br />
29 The general idea had been expressed decades earlier by the economist John Keynes.<br />
30 The Federal Reserve Board tracks the “Q Ratio” of the U.S. equity market. It was the level of the “Q Ratio”,<br />
along with the price/dividend ratio, that led Fed Chairman Alan Greenspan to warn of a speculative bubble in the<br />
equity market as early as 1996.<br />
Appendix F Foster Associates, Inc.<br />
Page F - 7
Consider Tobin’s Q, the ratio for which Dr. Tobin, at least at one time, was most famous<br />
among investors. This is the ratio of a company’s total market capitalization to the<br />
replacement value of that company’s total assets. While the Q ratio – as Tobin’s Q is<br />
often called – is conceptually similar to the price-to-book ratio, it avoids the myriad<br />
accounting difficulties associated with book value. For example, while book value<br />
carries assets at depreciated original cost, replacement value focuses on how much it<br />
would cost to buy those assets today. [emphasis added]<br />
Absent inflation and technological change, the market value and replacement cost of firms<br />
operating in a competitive environment would tend to equal their book value or cost. However,<br />
the fact that inflation has occurred, and continues to occur, renders that relationship invalid.<br />
With inflation, under competition, the market value of a firm trends toward the current cost of its<br />
assets. The book value of the assets, in contrast, reflects the historic depreciated cost of the<br />
assets. Since there have been moderate to relatively high levels of inflation over the past twentyfive<br />
years, it is reasonable to expect market values to exceed the book value of those assets.<br />
As indicated in Figure F-1 below, market/replacement cost ratios, as derived from the flow of<br />
funds accounts, have been systematically lower than the market to original cost ratios. For the<br />
U.S., the market/replacement cost ratio for corporations 31 has averaged approximately 45%<br />
lower than the market/book ratio over the business cycle 1991-2007.<br />
31 Based on non-farm, non-financial corporate businesses.<br />
Appendix F Foster Associates, Inc.<br />
Page F - 8
Figure F-1<br />
Source: US Federal Reserve Flow of Funds (B102).<br />
To test the potential for market power in the achieved returns of the sample of low risk<br />
unregulated Canadian firms used in the comparable earnings test, their market/book ratios were<br />
compared to those of Canadian and U.S. equity market composites. The figure below tracks the<br />
market/book values for the S&P/TSX Composite and the S&P 500 from 1980-2008.<br />
Appendix F Foster Associates, Inc.<br />
Page F - 9
Figure F-2<br />
Source: RBC <strong>Capital</strong> Markets Quantitative Research<br />
The data from which the table was created indicate that the market/book ratio for the overall<br />
Canadian equity market has averaged approximately 1.8 times from 1980-2008, and<br />
approximately 2.0 times from 1991-2007, the period over which the comparable earnings test<br />
was conducted. Based on almost three decades of data, the market/book ratio for the Canadian<br />
equity market has varied around an average of close to 1.8 times, not 1.0 times. For the S&P<br />
500, the market/book ratios were approximately 2.5 and 3.1 times, respectively, over the same<br />
two periods. Over the period 1991-2007 the market/book ratio for the sample of comparable<br />
Canadian unregulated companies averaged 2.1 times, approximately equal to the average for the<br />
S&P/TSX Composite and considerably lower than the market/book ratio of the S&P 500. The<br />
similar to lower average market/book ratio of the low risk unregulated Canadian companies<br />
relative to the Canadian and U.S. equity market composites permit the inference that the sample<br />
average returns are not characterized by market power. Thus, the comparable earnings results do<br />
not warrant an adjustment for market/book ratios.<br />
Appendix F Foster Associates, Inc.<br />
Page F - 10
APPENDIX G<br />
QUALIFICATIONS OF KATHLEEN C. McSHANE<br />
Kathleen McShane is President and senior consultant with Foster Associates, Inc., where she has<br />
been employed since 1981. She holds an M.B.A. degree in Finance from the University of<br />
Florida, and M.A. and B.A. degrees from the University of Rhode Island. She has been a CFA<br />
charterholder since 1989.<br />
Ms. McShane worked for the University of Florida and its Public Utility Research Center,<br />
functioning as a research and teaching assistant, before joining Foster Associates. She taught<br />
both undergraduate and graduate classes in financial management and assisted in the preparation<br />
of a financial management textbook.<br />
At Foster Associates, Ms. McShane has worked in the areas of financial analysis, energy<br />
economics and cost allocation. Ms. McShane has presented testimony in more than 190<br />
proceedings on rate of return and capital structure before federal, state, provincial and territorial<br />
regulatory boards, on behalf of U.S. and Canadian gas distributors and pipelines, electric utilities<br />
and telephone companies. These testimonies include the assessment of the impact of business<br />
risk factors (e.g., competition, rate design, contractual arrangements) on capital structure and<br />
equity return requirements. She has also testified on various ratemaking issues, including<br />
deferral accounts, rate stabilization mechanisms, excess earnings accounts, cash working capital,<br />
and rate base issues. Ms. McShane has provided consulting services for numerous U.S. and<br />
Canadian companies on financial and regulatory issues, including financing, dividend policy,<br />
corporate structure, cost of capital, automatic adjustments for return on equity, form of regulation<br />
(including performance-based regulation), unbundling, corporate separations, stand-alone cost of<br />
debt, regulatory climate, income tax allowance for partnerships, change in fiscal year end,<br />
Appendix G Foster Associates, Inc.<br />
Page G - 1
treatment of inter-corporate financial transactions, and the impact of weather normalization on<br />
risk.<br />
Ms. McShane was principal author of a study on the applicability of alternative incentive<br />
regulation proposals to Canadian gas pipelines. She was instrumental in the design and<br />
preparation of a study of the profitability of 25 major U.S. gas pipelines, in which she developed<br />
estimates of rate base, capital structure, profit margins, unit costs of providing services, and<br />
various measures of return on investment. Other studies performed by Ms. McShane include a<br />
comparison of municipal and privately owned gas utilities, an analysis of the appropriate<br />
capitalization and financing for a new gas pipeline, risk/return analyses of proposed water and<br />
gas distribution companies and an independent power project, pros and cons of performancebased<br />
regulation, and a study on pricing of a competitive product for the U.S. Postal Service.<br />
She has also conducted seminars on cost of capital for regulated utilities, with focus on the<br />
Canadian regulatory arena.<br />
PUBLICATIONS, PAPERS AND PRESENTATIONS<br />
■ Utility Cost of <strong>Capital</strong>: Canada vs. U.S., presented at the CAMPUT Conference, May<br />
2003.<br />
■ The Effects of Unbundling on a Utility’s Risk Profile and Rate of Return, (co-authored<br />
with Owen Edmondson, Vice President of ATCO Electric), presented at the Unbundling<br />
Rates Conference, New Orleans, Louisiana sponsored by Infocast, January 2000.<br />
■ Atlanta Gas Light’s Unbundling Proposal: More Unbundling Required? presented at the<br />
24 th Annual Rate Symposium, Kansas City, Missouri, sponsored by several commissions<br />
and universities, April 1998.<br />
■ Incentive Regulation: An Alternative to Assessing LDC Performance, (co-authored with<br />
Dr. William G. Foster), presented at the Natural Gas Conference, Chicago, Illinois<br />
sponsored by the Center for Regulatory Studies, May 1993.<br />
■ Alternative Regulatory Incentive Mechanisms, (co-authored with Stephen F. Sherwin),<br />
prepared for the National Energy Board, Incentive Regulation Workshop, October 1992.<br />
Appendix G Foster Associates, Inc.<br />
Page G - 2
EXPERT TESTIMONY/OPINIONS<br />
ON<br />
RATE OF RETURN AND CAPITAL STRUCTURE<br />
Client Date<br />
Alberta Natural Gas 1994<br />
AltaGas <strong>Utilities</strong> 2000<br />
Ameren (Central Illinois Public Service) 2000, 2002, 2005, 2007 (2 cases)<br />
Ameren (Central Illinois Light Company) 2005, 2007 (2 cases)<br />
Ameren (Illinois Power) 2004, 2005, 2007 (2 cases)<br />
Ameren (Union Electric) 2000 (2 cases), 2002 (2 cases), 2003, 2006 (2 cases)<br />
ATCO Electric 1989, 1991, 1993, 1995, 1998, 1999, 2000, 2003<br />
ATCO Gas 2000, 2003, 2007<br />
ATCO Pipelines 2000, 2003, 2007<br />
ATCO <strong>Utilities</strong> 2008<br />
Bell Canada 1987, 1993<br />
Benchmark Utility Cost of Equity (British Columbia) 1999<br />
Canadian Western Natural Gas 1989, 1996, 1998, 1999<br />
Centra Gas B.C. 1992, 1995, 1996, 2002<br />
Centra Gas Ontario 1990, 1991, 1993, 1994, 1995<br />
Direct Energy Regulated Services 2005<br />
Dow Pool A Joint Venture 1992<br />
Edmonton Water/EPCOR Water Services 1994, 2000, 2006, 2008<br />
Enbridge Gas Distribution 1988, 1989, 1991-1997, 2001, 2002<br />
Enbridge Gas New Brunswick 2000<br />
Enbridge Pipelines (Line 9) 2007<br />
Enbridge Pipelines (Southern Lights) 2007<br />
<strong>FortisBC</strong> 1995, 1999, 2001, 2004<br />
Appendix G Foster Associates, Inc.<br />
Page G - 3
Gas Company of Hawaii 2000, 2008<br />
Gaz Metropolitain 1988<br />
Gazifère 1993, 1994, 1995, 1996, 1997, 1998<br />
Generic Cost of <strong>Capital</strong>, Alberta (ATCO and AltaGas <strong>Utilities</strong>) 2003<br />
Heritage Gas 2004, 2008<br />
Hydro One 1999, 2001, 2006 (2 cases)<br />
Insurance Bureau of Canada (Newfoundland) 2004<br />
Laclede Gas Company 1998, 1999, 2001, 2002, 2005<br />
Laclede Pipeline 2006<br />
Mackenzie Valley Pipeline 2005<br />
Maritimes NRG (Nova Scotia) and (New Brunswick) 1999<br />
Multi-Pipeline Cost of <strong>Capital</strong> Hearing (National Energy Board) 1994<br />
Natural Resource Gas 1994, 1997, 2006<br />
New Brunswick Power Distribution 2005<br />
Newfoundland & Labrador Hydro 2001, 2003<br />
Newfoundland Power 1998, 2002, 2007<br />
Newfoundland Telephone 1992<br />
Northland <strong>Utilities</strong> 2008 (2 cases)<br />
Northwestel, Inc. 2000, 2006<br />
Northwestern <strong>Utilities</strong> 1987, 1990<br />
Northwest Territories Power Corp. 1990, 1992, 1993, 1995, 2001, 2006<br />
Nova Scotia Power Inc. 2001, 2002, 2005, 2008<br />
Ontario Power Generation 2007<br />
Ozark Gas Transmission 2000<br />
Pacific Northern Gas 1990, 1991, 1994, 1997, 1999, 2001, 2005<br />
Plateau Pipe Line Ltd. 2007<br />
Platte Pipeline Co. 2002<br />
St. Lawrence Gas 1997, 2002<br />
Southern Union Gas 1990, 1991, 1993<br />
Stentor 1997<br />
Appendix G Foster Associates, Inc.<br />
Page G - 4
Tecumseh Gas Storage 1989, 1990<br />
Telus Québec 2001<br />
<strong>Terasen</strong> Gas 1992, 1994, 2005<br />
<strong>Terasen</strong> Gas (Whistler) 2008<br />
TransCanada PipeLines 1988, 1989, 1991 (2 cases), 1992, 1993<br />
TransGas and SaskEnergy LDC 1995<br />
Trans Québec & Maritimes Pipeline 1987<br />
Union Gas 1988, 1989, 1990, 1992, 1994, 1996, 1998, 2001<br />
Westcoast Energy 1989, 1990, 1992 (2 cases), 1993, 2005<br />
Yukon Electrical Company 1991, 1993, 2008<br />
Yukon Energy 1991, 1993<br />
Appendix G Foster Associates, Inc.<br />
Page G - 5
EXPERT TESTIMONY/OPINIONS<br />
ON<br />
OTHER ISSUES<br />
Client Issue Date<br />
New Brunswick Power Distribution Interest Coverage/<strong>Capital</strong> <strong>Structure</strong> 2007<br />
Heritage Gas Revenue Deficiency Account 2006<br />
Hydro Québec Cash Working <strong>Capital</strong> 2005<br />
Nova Scotia Power Cash Working <strong>Capital</strong> 2005<br />
Ontario Electricity Distributors Stand-Alone Income Taxes 2005<br />
Caisse Centrale de Réassurance Collateral Damages 2004<br />
Hydro Québec Cost of Debt 2004<br />
Enbridge Gas New Brunswick AFUDC 2004<br />
Heritage Gas Deferral Accounts 2004<br />
ATCO Electric Carrying Costs on Deferral Account 2001<br />
Newfoundland & Labrador Hydro Rate Base, Cash Working <strong>Capital</strong> 2001<br />
Gazifère Inc. Cash Working <strong>Capital</strong> 2000<br />
Maritime Electric Rate Subsidies 2000<br />
Enbridge Gas Distribution Principles of Cost Allocation 1998<br />
Enbridge Gas Distribution Unbundling/Regulatory Compact 1998<br />
Maritime Electric Form of Regulation 1995<br />
Northwest Territories Power Rate Stabilization Fund 1995<br />
Canadian Western Natural Gas Cash Working <strong>Capital</strong>/<br />
Compounding Effect<br />
1989<br />
Gaz Metro/<br />
Province of Québec<br />
Cost Allocation/<br />
Incremental vs. Rolled-In Tolling<br />
1984<br />
Appendix G Foster Associates, Inc.<br />
Page G - 6
Schedule 22<br />
Average Average<br />
Allowed Long Canada Equity Risk Allowed Long Treasury Equity Risk Allowed Equity Risk Allowed Equity Risk<br />
Year <strong>ROE</strong> 1/<br />
Yield Premium <strong>ROE</strong> Yield Premium <strong>ROE</strong> Premium <strong>ROE</strong> Premium<br />
1990 13.68 10.69 2.99 12.69 8.62 4.07 12.67 4.05 12.70 4.08<br />
1991 13.56 9.72 3.85 12.51 8.09 4.43 12.46 4.38 12.55 4.47<br />
1992 12.94 8.68 4.26 12.06 7.68 4.39 12.01 4.34 12.09 4.42<br />
1993 12.16 7.86 4.30 11.37 6.58 4.79 11.35 4.77 11.41 4.83<br />
1994 11.50 8.69 2.81 11.34 7.41 3.93 11.35 3.94 11.34 3.93<br />
1995 12.13 8.41 3.72 11.51 6.81 4.70 11.43 4.62 11.55 4.74<br />
1996 11.36 7.75 3.62 11.29 6.72 4.57 11.19 4.47 11.39 4.67<br />
1997 10.84 6.66 4.18 11.34 6.57 4.77 11.29 4.72 11.40 4.83<br />
1998 10.15 5.59 4.56 11.59 5.53 6.06 11.51 5.98 11.66 6.13<br />
1999 9.50 5.72 3.78 10.74 5.91 4.83 10.66 4.75 10.77 4.86<br />
2000 9.79 5.71 4.08 11.41 5.88 5.53 11.39 5.51 11.43 5.55<br />
2001 9.68 5.77 3.92 11.05 5.47 5.58 10.95 5.48 11.09 5.62<br />
2002 9.62 5.67 3.95 11.10 5.41 5.69 11.03 5.62 11.16 5.75<br />
2003 9.73 5.31 4.42 10.98 5.03 5.95 10.99 5.96 10.97 5.94<br />
2004 9.59 5.11 4.48 10.66 5.09 5.56 10.59 5.50 10.73 5.64<br />
2005 9.51 4.38 5.13 10.50 4.52 5.98 10.46 5.94 10.54 6.02<br />
2006 9.02 4.26 4.76 10.39 4.87 5.52 10.44 5.57 10.36 5.49<br />
2007 8.66 4.30 4.37 10.30 4.80 5.51 10.24 5.44 10.36 5.56<br />
2008 8.77 4.04 4.73 10.42 4.22 6.20 10.37 6.15 10.46 6.24<br />
Means:<br />
1990-1993 13.08 9.24 3.85 12.16 7.74 4.42 12.12 4.38 12.19 4.45<br />
1994-1997 11.46 7.88 3.58 11.37 6.88 4.49 11.32 4.44 11.42 4.54<br />
1998-2008 9.46 5.08 4.38 10.83 5.16 5.67 10.78 5.63 10.87 5.71<br />
1/ 2008 <strong>ROE</strong> represents results for the entire year.<br />
COMPARISON BETWEEN ALLOWED EQUITY RISK PREMIUMS<br />
FOR CANADIAN AND U.S. UTILITIES<br />
Canadian <strong>Utilities</strong> U.S. <strong>Utilities</strong> U.S. Gas <strong>Utilities</strong> U.S. Electric <strong>Utilities</strong><br />
Note: For U.S. Treasury yields, 30-year maturities used through January 2002; theoretical 30-year yield from<br />
February 2002 to January 2005; 30-year maturities February 2002 forward.<br />
Sources: Regulatory Research Associates; www.snl.com; Various Canadian Regulatory Decisions;<br />
Bank of Canada; Federal Reserve; U.S. Treasury.
5<br />
4.5<br />
4<br />
3.5<br />
3<br />
2.5<br />
2<br />
1.5<br />
1<br />
0.5<br />
0<br />
Jan 1988<br />
Jan 1989<br />
Jan 1990<br />
TREND IN S&P/TSX UTILITIES AND S&P/TSX PRICE INDICES<br />
(January 1988 to March <strong>2009</strong>)<br />
Jan 1991<br />
S&P/TSX <strong>Utilities</strong><br />
S&P/TSX Composite<br />
Jan 1992<br />
Jan 1993<br />
Jan 1994<br />
Jan 1995<br />
Jan 1996<br />
Jan 1997<br />
Jan 1998<br />
Jan 1999<br />
Jan 2000<br />
Jan 2001<br />
Jan 2002<br />
Jan 2003<br />
Jan 2004<br />
Jan 2005<br />
Jan 2006<br />
Jan 2007<br />
Jan 2008<br />
Chart1<br />
Jan <strong>2009</strong>
Year Canadian U.S. 1/<br />
T-Bills<br />
Annual<br />
Canadian U.S. Canadian U.S. 2/<br />
10 Year Long-Term<br />
Schedule 1<br />
Page 1 of 2<br />
Canada Bonds Canadian Canadian Canadian Moody's U.S. Utility Exchange Rates<br />
Over 10 Inflation A-Rated A-Rated Spread Long-Term (Canadian dollars<br />
Years 3/<br />
Indexed Bonds Utility Bonds 4/<br />
Over Long Canadas A-Rated Bonds in U.S. funds)<br />
1990 12.81 7.49 10.76 8.55 10.69 8.61 10.85 12.13 1.44 9.86 0.86<br />
1991 8.73 5.38 9.42 7.86 9.72 8.14 9.76 11.00 1.28 9.36 0.84<br />
1992 6.59 3.43 8.05 7.01 8.68 7.67 8.77 4.62 10.01 1.33 8.64 0.82<br />
1993 4.84 3.02 7.22 5.87 7.86 6.59 7.85 4.28 9.08 1.22 7.59 0.77<br />
1994 5.54 4.34 8.43 7.08 8.69 7.39 8.63 4.41 9.81 1.12 8.30 0.73<br />
1995 6.89 5.44 8.08 6.58 8.41 6.85 8.28 4.68 9.29 0.88 7.89 0.73<br />
1996 4.21 5.04 7.20 6.44 7.75 6.73 7.50 4.61 8.38 0.63 7.75 0.73<br />
1997 3.26 5.11 6.11 6.32 6.66 6.58 6.42 4.14 7.19 0.53 7.60 0.72<br />
1998 4.73 4.79 5.30 5.26 5.59 5.54 5.47 4.02 6.38 0.79 7.04 0.68<br />
1999 4.69 4.71 5.55 5.68 5.72 5.91 5.69 4.07 6.92 1.20 7.62 0.67<br />
2000 5.45 5.85 5.89 5.98 5.71 5.88 5.89 3.69 7.02 1.31 8.24 0.67<br />
2001 3.78 3.34 5.49 4.99 5.77 5.50 5.76 3.59 7.25 1.48 7.73 0.65<br />
2002 2.55 1.63 5.27 4.56 5.67 5.41 5.65 3.49 7.22 1.55 7.35 0.64<br />
2003 2.86 1.03 4.78 4.02 5.31 5.03 5.26 3.04 6.78 1.46 6.54 0.72<br />
2004 2.21 1.44 4.55 4.27 5.11 5.08 5.05 2.34 6.28 1.17 6.14 0.77<br />
2005 2.73 3.29 4.04 4.27 4.38 4.52 4.36 1.81 5.53 1.16 5.62 0.83<br />
2006 4.05 4.86 4.21 4.79 4.26 4.87 4.28 1.67 5.47 1.21 6.06 0.89<br />
2007 4.13 4.42 4.25 4.58 4.30 4.80 4.31 1.95 5.61 1.31 6.06 0.94<br />
2008 2.26 1.28 3.56 3.61 4.04 4.22 4.03 1.90 6.41 2.37 6.54 0.94<br />
1/<br />
Rates on new issues.<br />
2/<br />
30-year maturities through January 2002. Theoretical 30-year yield, February 2002 to January 2006.<br />
3/<br />
Terms to maturity of l0 years or more.<br />
4/<br />
Series is comprised of the CBRS <strong>Utilities</strong> Index through 1995; CBRS 30-year <strong>Utilities</strong> Index from 1996- August 2000;<br />
a series of liquid long-term utility bonds maintained by Foster Associates from September 2000 forward.<br />
Source: www.bankofcanada.ca; Globe and Mail; www.federalreserve.gov<br />
www.ustreas.gov<br />
Government Securities<br />
TREND IN INTEREST RATES AND OUTSTANDING BOND YIELDS<br />
(Percent Per Annum)
Year Canadian U.S. 1/<br />
T-BILLS<br />
Canadian U.S. Canadian U.S. 2/<br />
10 Year Long-Term<br />
Schedule 1<br />
Page 2 of 2<br />
Canada Bonds Canadian Canadian Canadian Moody's U.S. Utility Exchange Rates<br />
Over 10 Inflation A-Rated A-Rated Spread Long-Term (Canadian dollars<br />
Years 3/<br />
Indexed Bonds Utility Bonds 5/<br />
Over Long Canadas A-Rated Bonds in U.S. funds)<br />
2004 q1 2.12 0.94 4.41 4.00 5.09 4.96 4.99 2.50 6.17 1.08 6.06 0.76<br />
q2 1.98 1.13 4.74 4.60 5.29 5.35 5.22 2.38 6.48 1.19 6.45 0.74<br />
q3 2.23 1.58 4.66 4.26 5.14 5.08 5.13 2.29 6.37 1.23 6.11 0.77<br />
q4 2.53 2.11 4.40 4.22 4.92 4.93 4.87 2.18 6.09 1.17 5.95 0.83<br />
2005 q1 2.47 2.67 4.27 4.33 4.72 4.70 4.69 2.05 5.86 1.13 5.72 0.82<br />
q2 2.46 3.01 3.93 4.05 4.39 4.36 4.35 1.86 5.59 1.21 5.43 0.81<br />
q3 2.73 3.50 3.88 4.21 4.20 4.39 4.19 1.75 5.32 1.12 5.49 0.84<br />
q4 3.25 4.00 4.07 4.49 4.19 4.63 4.21 1.59 5.36 1.17 5.82 0.85<br />
2006 q1 3.70 4.57 4.18 4.65 4.23 4.70 4.25 1.53 5.43 1.20 5.92 0.87<br />
q2 4.17 4.84 4.51 5.11 4.54 5.19 4.57 1.81 5.75 1.21 6.41 0.90<br />
q3 4.14 5.00 4.14 4.79 4.21 4.91 4.23 1.67 5.45 1.23 6.09 0.89<br />
q4 4.16 5.04 4.00 4.59 4.07 4.70 4.08 1.68 5.27 1.20 5.82 0.87<br />
2007 q1 4.17 5.11 4.10 4.68 4.17 4.82 4.18 1.77 5.36 1.19 5.92 0.86<br />
q2 4.29 4.82 4.39 4.85 4.35 4.98 4.38 1.94 5.61 1.25 6.08 0.92<br />
q3 4.17 4.26 4.43 4.64 4.45 4.86 4.46 2.09 5.79 1.34 6.19 0.97<br />
q4 3.90 3.48 4.09 4.16 4.21 4.53 4.21 2.01 5.68 1.47 6.05 1.02<br />
2008 q1 2.76 1.73 3.65 3.55 4.07 4.35 4.03 1.80 5.75 1.68 6.16 0.99<br />
q2 2.60 1.74 3.68 3.94 4.10 4.58 4.07 1.60 5.99 1.89 6.30 0.99<br />
q3 2.23 1.44 3.66 3.89 4.11 4.44 4.13 1.78 6.33 2.21 6.58 0.95<br />
q4 1.45 0.19 3.26 3.06 3.88 3.50 3.91 2.42 7.56 3.69 7.13 0.82<br />
<strong>2009</strong> q1 0.61 0.24 2.99 2.87 3.68 3.62 3.65 2.13 7.28 3.60 6.44 0.80<br />
2006 Jan 3.51 4.47 4.17 4.53 4.26 4.69 4.26 1.53 5.43 1.17 5.84 0.88<br />
Feb 3.74 4.62 4.12 4.55 4.17 4.51 4.17 1.47 5.37 1.20 5.77 0.88<br />
Mar 3.86 4.61 4.26 4.86 4.26 4.89 4.32 1.58 5.49 1.23 6.14 0.86<br />
Apr 4.04 4.65 4.51 5.07 4.52 5.17 4.57 1.72 5.70 1.18 6.37 0.89<br />
May 4.18 4.86 4.45 5.12 4.50 5.21 4.51 1.83 5.68 1.18 6.43 0.91<br />
Jun 4.30 5.01 4.58 5.15 4.61 5.19 4.63 1.88 5.86 1.25 6.43 0.90<br />
Jul 4.15 5.10 4.31 4.99 4.37 5.07 4.39 1.73 5.62 1.25 6.29 0.88<br />
Aug 4.12 5.02 4.11 4.74 4.19 4.88 4.20 1.62 5.42 1.23 6.07 0.90<br />
Sep 4.16 4.89 3.99 4.64 4.08 4.77 4.09 1.67 5.30 1.22 5.90 0.89<br />
Oct 4.17 5.08 4.02 4.61 4.08 4.72 4.10 1.69 5.28 1.20 5.84 0.89<br />
Nov 4.17 5.03 3.90 4.46 3.99 4.56 4.00 1.60 5.18 1.19 5.68 0.88<br />
Dec 4.15 5.02 4.08 4.71 4.14 4.81 4.15 1.75 5.34 1.20 5.95 0.86<br />
2007 Jan 4.17 5.12 4.17 4.83 4.22 4.93 4.23 1.79 5.41 1.19 6.01 0.85<br />
Feb 4.19 5.16 4.03 4.56 4.09 4.68 4.10 1.75 5.28 1.19 5.78 0.85<br />
Mar 4.16 5.04 4.11 4.65 4.20 4.84 4.21 1.77 5.39 1.19 5.97 0.87<br />
Apr 4.16 4.91 4.14 4.63 4.19 4.81 4.20 1.76 5.45 1.26 5.90 0.90<br />
May 4.29 4.73 4.49 4.90 4.38 5.01 4.42 1.99 5.62 1.24 6.10 0.93<br />
Jun 4.43 4.82 4.55 5.03 4.49 5.12 4.51 2.08 5.75 1.26 6.24 0.94<br />
Jul 4.56 4.96 4.52 4.78 4.45 4.92 4.48 2.07 5.78 1.33 6.18 0.94<br />
Aug 3.99 4.01 4.42 4.54 4.46 4.83 4.47 2.14 5.76 1.30 6.17 0.95<br />
Sep 3.96 3.82 4.34 4.59 4.44 4.83 4.44 2.07 5.83 1.39 6.22 1.01<br />
Oct 3.96 3.94 4.31 4.48 4.38 4.74 4.39 2.05 5.73 1.35 6.07 1.06<br />
Nov 3.91 3.15 3.98 3.97 4.16 4.40 4.15 2.07 5.69 1.53 6.00 1.00<br />
Dec 3.82 3.36 3.99 4.04 4.10 4.45 4.10 1.91 5.62 1.52 6.07 1.01<br />
2008 Jan 3.38 1.96 3.88 3.67 4.18 4.35 4.16 1.96 5.81 1.63 6.07 1.00<br />
Feb 3.04 1.85 3.64 3.53 4.09 4.41 4.04 1.85 5.73 1.64 6.22 1.02<br />
Mar 1.87 1.38 3.43 3.45 3.94 4.30 3.88 1.60 5.71 1.77 6.20 0.97<br />
Apr 2.68 1.43 3.58 3.77 4.08 4.49 4.02 1.72 5.97 1.89 6.22 0.99<br />
May 2.64 1.89 3.71 4.06 4.13 4.72 4.09 1.61 5.98 1.85 6.36 0.99<br />
Jun 2.48 1.90 3.74 3.99 4.08 4.53 4.10 1.47 6.02 1.94 6.32 0.98<br />
Jul 2.39 1.68 3.70 3.99 4.10 4.59 4.11 1.54 6.08 1.98 6.44 0.98<br />
Aug 2.40 1.72 3.53 3.83 4.01 4.43 4.02 1.57 6.25 2.24 6.32 0.94<br />
Sep 1.89 0.92 3.75 3.85 4.23 4.31 4.25 2.23 6.65 2.42 6.98 0.94<br />
Oct 1.85 0.46 3.76 4.01 4.28 4.35 4.33 2.51 7.86 3.58 8.01 0.82<br />
Nov 1.67 0.01 3.32 2.93 3.90 3.45 3.96 2.65 7.47 3.57 7.18 0.81<br />
Dec 0.83 0.11 2.69 2.25 3.45 2.69 3.45 2.10 7.36 3.91 6.20 0.82<br />
<strong>2009</strong> Jan 0.86 0.24 3.06 2.87 3.77 3.58 3.80 2.27 7.57 3.80 6.52 0.81<br />
Feb 0.59 0.26 3.12 3.02 3.70 3.71 3.70 2.32 7.26 3.56 6.38 0.79<br />
Mar 0.39 0.21 2.79 2.71 3.57 3.56 3.46 1.81 7.01 3.44 6.41 0.79<br />
1/ Rates on new issues.<br />
2/ 20-year constant maturities for 1974-1978; 30-year maturities, 1978-January 2002. Theoretical 30-year yield, February 2002 to January 2006.<br />
3/<br />
Terms to maturity of l0 years or more.<br />
4/<br />
Series discontinued June 2007.<br />
5/<br />
Series is comprised of the CBRS <strong>Utilities</strong> Index through 1995; CBRS 30-year <strong>Utilities</strong> Index from 1996- August 2000;<br />
a series of liquid long-term utility bonds maintained by Foster Associates from September 2000 forward.<br />
Note: Monthly data reflect rate in effect at end of month.<br />
Source: www.bankofcanada.ca; Globe and Mail; www.federalreserve.gov<br />
RBC <strong>Capital</strong> Markets, www.ustreas.gov<br />
Government Securities<br />
TREND IN INTEREST RATES AND OUTSTANDING BOND YIELDS<br />
(Percent Per Annum)
Canada United States<br />
Gross Domestic Product GDP Consumer Gross Domestic Product<br />
Implicit Consumer<br />
Constant Current Industrial Deflator Price Constant Current Industrial Price Price<br />
Year Dollars Dollars Production Index Index Dollars Dollars Production Index Index<br />
(1) (2) (3) (4) (5) (6) (7) (8) (9) (l0)<br />
1989 100.0 100.0 100.0 100.0 100.0 100.0 100.0 100.0 100.0 100.0<br />
1990 100.2 103.4 97.2 103.2 104.8 101.9 105.8 101.0 103.9 105.4<br />
1991 98.1 104.2 93.5 106.2 110.7 101.7 109.3 99.5 107.5 109.8<br />
1992 99.0 106.5 94.5 107.6 112.3 105.1 115.6 102.4 110.0 113.2<br />
1993 101.3 110.6 98.8 109.2 114.4 107.9 121.4 105.8 112.5 116.5<br />
1994 106.1 117.2 105.1 110.4 114.6 112.2 129.0 111.6 114.9 119.5<br />
1995 109.1 122.7 109.9 112.9 117.1 115.0 134.9 117.2 117.2 122.9<br />
1996 110.9 126.8 111.8 114.7 118.9 119.3 142.5 122.2 119.5 126.5<br />
1997 115.6 133.5 118.0 116.1 120.8 124.7 151.4 131.1 121.5 129.5<br />
1998 120.3 139.2 122.2 115.6 122.0 129.9 159.5 139.1 122.8 131.5<br />
1999 127.0 149.4 129.8 117.6 124.2 135.7 169.0 145.6 124.6 134.4<br />
2000 133.6 163.5 139.6 122.5 127.5 140.6 179.0 152.2 127.3 138.9<br />
2001 136.0 168.5 134.6 123.9 130.8 141.7 184.7 146.9 130.4 142.8<br />
2002 140.0 175.3 137.5 125.2 133.7 143.9 190.9 144.8 132.6 145.1<br />
2003 142.6 184.4 137.7 129.4 137.4 147.6 199.9 146.6 135.4 148.4<br />
2004 147.0 196.3 139.8 133.5 139.9 152.9 213.1 150.2 139.3 152.3<br />
2005 151.3 208.7 142.0 138.0 143.0 157.4 226.5 155.2 143.9 157.5<br />
2006 156.0 220.5 142.3 141.4 145.9 161.8 240.3 158.6 148.5 162.6<br />
2007 160.2 233.5 142.6 145.8 149.0 165.1 251.8 161.3 152.5 167.2<br />
2008 160.9 243.6 136.7 151.4 152.6 167.2 260.4 158.5 155.8 173.6<br />
2004 1Q 144.7 190.5 139.2 131.7 138.5 151.0 208.0 148.8 137.7 150.2<br />
2Q 146.4 195.4 139.7 133.5 140.0 152.3 211.7 149.5 139.0 152.4<br />
3Q 148.0 198.5 139.9 134.2 140.3 153.7 214.8 150.2 139.8 152.9<br />
4Q 149.0 200.6 140.5 134.7 140.9 154.6 217.9 152.4 140.9 153.8<br />
2005 1Q 149.3 202.5 140.5 135.7 141.4 155.8 221.6 154.4 142.3 154.8<br />
2Q 150.4 205.5 141.3 136.7 142.7 156.8 224.2 155.1 143.0 156.9<br />
3Q 151.9 211.1 142.5 139.1 144.0 158.3 228.6 155.0 144.4 158.8<br />
4Q 153.5 215.6 143.7 140.6 144.1 158.8 231.5 156.4 145.8 159.6<br />
2006 1Q 155.1 217.8 143.7 140.4 144.8 160.7 236.3 157.6 147.1 160.4<br />
2Q 155.7 219.7 142.2 141.2 146.4 161.7 239.5 158.6 148.1 163.1<br />
3Q 156.1 221.7 141.9 142.1 146.5 162.1 241.6 159.4 149.1 164.1<br />
4Q 157.0 223.0 141.2 142.1 146.0 162.7 243.8 159.0 149.9 162.7<br />
2007 1Q 158.5 228.6 142.6 144.3 147.4 162.7 246.4 159.6 151.4 164.3<br />
2Q 160.0 233.6 143.6 146.1 149.6 164.6 250.5 160.8 152.2 167.5<br />
3Q 161.0 234.4 143.1 145.7 149.6 166.5 254.4 162.3 152.8 167.9<br />
4Q 161.3 237.2 140.9 147.1 149.5 166.5 255.8 162.4 153.7 169.1<br />
2008 1Q 160.9 240.1 138.4 149.2 150.0 166.8 258.0 162.6 154.7 171.0<br />
2Q 161.2 246.3 137.3 152.8 153.1 168.0 260.6 161.2 155.2 174.8<br />
3Q 161.5 248.5 137.4 153.8 154.7 167.8 262.8 157.5 156.7 176.8<br />
4Q 160.1 239.7 133.5 149.7 152.4 166.1 260.1 152.7 156.6 171.8<br />
Note: Data are based on Chain Weighted Indexes.<br />
Source: www.cansim2.statcan.ca, www.bea.gov , www.federalreserve.gov<br />
SELECTED INDICATORS OF ECONOMIC ACTIVITY<br />
(1989 = 100)<br />
Schedule 2
DBRS Moody's S&P CBS<br />
Company Debt Rated Bond Rating Bond Rating Bond Rating Stock Ranking<br />
Gas Distributors<br />
Enbridge Gas Distribution Senior Unsecured A A- Very conservative<br />
Gaz Metropolitain Senior Secured A A<br />
Pacific Northern Gas Senior Secured BBB(low) NR 2/<br />
Average<br />
<strong>Terasen</strong> Gas Senior Secured A A2 AA-<br />
Senior Unsecured A A3 A<br />
<strong>Terasen</strong> Gas (Vancouver Is.) Senior Unsecured A3<br />
Union Gas Limited Senior Unsecured A BBB+<br />
Electric <strong>Utilities</strong><br />
AltaLink L.P. Senior Secured A A-<br />
CU Inc. Senior Unsecured A(high) A Very conservative<br />
Enersource Issuer A<br />
ENMAX Unsecured Debentures A(low) BBB+<br />
EPCOR <strong>Utilities</strong> Inc Senior Unsecured A(low) BBB+<br />
FortisAlberta Inc. Senior Unsecured A(low) Baa1 A- Very conservative<br />
<strong>FortisBC</strong> Inc Secured Debentures BBB(high) Baa2 Very conservative<br />
Hamilton <strong>Utilities</strong> Senior Unsecured A+<br />
Hydro One Senior Unsecured A(high) Aa3 A+<br />
Hydro Ottawa Holding Inc. Senior Unsecured A(low) A<br />
London Hydro Issuer A<br />
Maritime Electric Senior Secured A Very conservative<br />
Newfoundland Power Senior Secured A Baa1 NR 1/<br />
Very conservative<br />
Nova Scotia Power Senior Unsecured A(low) Baa1 BBB Very conservative<br />
Toronto Hydro Senior Unsecured A A<br />
Veridian Issuer A<br />
Pipelines<br />
Enbridge Pipelines Senior Unsecured A(high) A- Very conservative<br />
NOVA Gas Transmission Senior Unsecured A A3 A- Very conservative<br />
Trans Quebec & Maritimes Senior Unsecured A(low) BBB+<br />
TransCanada PipeLines Senior Unsecured A A3 A- Very conservative<br />
Westcoast Energy Senior Unsecured A(low) BBB+<br />
Medians<br />
Gas Distributors A A3 A Very conservative<br />
Electric T&D A Baa1 A Very conservative<br />
Electric Integrated A(low) Baa2 A- Very conservative<br />
All Electric A(low) Baa1 A Very conservative<br />
Pipelines A A3 A- Very conservative<br />
All Companies A A3 A- Very conservative<br />
1/ Withdrawn by company; BBB+ prior to withdrawal.<br />
2/ Withdrawn by company; BBB- prior to withdrawal.<br />
Note: Debt ratings are for utility; Stock rankings are for parent.<br />
DEBT AND COMMON STOCK QUALITY RATINGS<br />
OF CANADIAN UTILITIES<br />
Source: DBRS Bond Ratings, Moodys.com, Standard & Poor's, The Blue Book of CBS Stock Reports.<br />
Schedule 3
Long-Term Debt 1/ Short-Term Debt Preferred Stock 2/<br />
Schedule 4<br />
Common Stock<br />
Equity 3/<br />
Gas Distributors<br />
Enbridge Gas Distribution 44.2% 18.1% 1.9% 35.8%<br />
Gaz Metro 64.0% 2.0% 0.0% 34.0%<br />
Pacific Northern Gas 45.6% 1.8% 3.0% 49.6%<br />
<strong>Terasen</strong> Gas 55.7% 9.5% 0.0% 34.8%<br />
<strong>Terasen</strong> Gas (Vancouver Is.) 46.3% 18.2% 0.0% 35.5%<br />
Union Gas 56.1% 8.1% 2.6% 33.2%<br />
Electric <strong>Utilities</strong><br />
Altalink LP 61.7% 0.0% 0.0% 38.3%<br />
CU Inc 56.6% 0.0% 5.2% 38.3%<br />
Enersource 4/<br />
57.5% 0.0% 0.0% 42.5%<br />
ENMAX Corp. 37.3% 4.6% 0.0% 58.1%<br />
EPCOR <strong>Utilities</strong> Inc. 50.3% 2.6% 2.3% 44.8%<br />
FortisAlberta 60.0% 0.5% 0.0% 39.4%<br />
<strong>FortisBC</strong> 59.1% 0.0% 0.0% 40.9%<br />
Hamilton <strong>Utilities</strong> 4/<br />
35.4% 0.0% 0.0% 64.6%<br />
Hydro One Inc. 54.5% 0.0% 2.9% 42.6%<br />
Hydro Ottawa Holding Inc. 4/<br />
43.8% 4.3% 0.0% 51.9%<br />
London Hydro 4/<br />
36.5% 0.0% 0.0% 63.5%<br />
Maritime Electric 53.6% 6.2% 0.0% 40.2%<br />
Newfoundland Power 53.4% 0.0% 1.1% 45.5%<br />
Nova Scotia Power 54.3% 0.8% 4.7% 40.1%<br />
Toronto Hydro 55.2% 0.0% 0.0% 44.8%<br />
Veridian 4/<br />
40.4% 0.0% 0.0% 59.6%<br />
Pipelines<br />
Enbridge Pipelines 52.7% 7.0% 0.0% 40.4%<br />
Nova Gas Transmission Ltd. 61.4% 0.6% 0.0% 38.0%<br />
Trans Quebec & Maritimes 4/<br />
69.8% 0.0% 0.0% 30.2%<br />
TransCanada Pipelines 54.1% 5.0% 1.2% 39.7%<br />
Westcoast Energy 52.6% 1.2% 4.9% 41.3%<br />
Medians<br />
Gas Distributors 51.0% 8.8% 1.0% 35.2%<br />
Electric T&D 53.4% 0.0% 0.0% 45.5%<br />
Electric Integrated 54.3% 0.8% 2.3% 40.2%<br />
All Electric 54.0% 0.0% 0.0% 43.7%<br />
Pipelines 54.1% 1.2% 0.0% 39.7%<br />
All Companies 54.1% 0.8% 0.0% 40.4%<br />
1/ Includes current portion of long-term debt and preferred securities classified as debt.<br />
2/ Includes minority interest in preferred shares of subsidiary companies and preferred securities .<br />
3/ Includes minority interest in common shares of subsidiary companies.<br />
4/ <strong>Capital</strong> structures for 2007.<br />
Source: Annual Reports to Shareholders<br />
CAPITAL STRUCTURE RATIOS<br />
OF CANADIAN UTILITIES WITH RATED DEBT<br />
(2008)
Schedule 5<br />
EBIT FFO/ FFO<br />
Company Coverage Total Debt Coverage 1/<br />
Gas Distributors<br />
Enbridge Gas Distribution 2.1 11.5 2.6<br />
Gaz Metropolitain 2.5 20.9 5.0<br />
Pacific Northern Gas 2.4 12.5 2.5<br />
<strong>Terasen</strong> Gas 2.0 9.1 2.4<br />
<strong>Terasen</strong> Gas (Vancouver Is.) 2.8 10.3 3.1<br />
Union Gas 2.1 12.4 2.8<br />
Electric <strong>Utilities</strong><br />
AltaLink L.P. 1.9 12.6 3.1<br />
CU Inc. 2.5 17.1 3.4<br />
Enersource 2.2 14.9 3.2<br />
ENMAX Corp. 8.2 18.0 3.9<br />
EPCOR <strong>Utilities</strong> Inc. 2.8 20.3 3.6<br />
FortisAlberta Inc. 2.2 14.3 4.2<br />
<strong>FortisBC</strong> Inc. 2.1 10.4 2.7<br />
Hamilton <strong>Utilities</strong> 3.2 32.2 4.9<br />
Hydro One Inc. 2.8 14.5 3.4<br />
Hydro Ottawa Holding Inc. 3.5 22.3 5.3<br />
London Hydro 2.9 20.9 4.0<br />
Maritime Electric 2.7 13.5 2.8<br />
Newfoundland Power 2.3 14.1 2.7<br />
Nova Scotia Power 2.5 13.8 3.4<br />
Toronto Hydro 2.3 17.7 3.5<br />
Veridian 3.4 29.5 4.2<br />
Pipelines<br />
Enbridge Pipelines 3.3 16.9 3.5<br />
Nova Gas Transmission Ltd. 2.4 19.0 3.2<br />
Trans Quebec & Maritimes 2.4 10.4 2.7<br />
TransCanada PipeLines Ltd. 2.5 14.3 2.8<br />
Westcoast Energy Inc. 2.2 17.0 3.2<br />
Medians<br />
Gas Distributors 2.3 12.0 2.7<br />
Electric T&D 2.8 17.7 3.9<br />
Electric Integrated 2.5 13.8 3.4<br />
All Electric 2.6 16.0 3.5<br />
Pipelines 2.4 16.9 3.2<br />
All Companies 2.5 14.5 3.2<br />
Source: Annual Reports to Shareholders and Standard and Poor's<br />
FINANCIAL METRICS<br />
FOR CANADIAN UTILITIES WITH RATED DEBT<br />
2005-2007<br />
1/ S&P defines Funds from Operations as follows:<br />
FFO = (income from continuing operations + depreciation & amortization + deferred income taxes – AFUDC).
Debt Business Financial<br />
Name Rating Profile Profile Debt Ratio EBIT Coverage FFO/Debt FFO Coverage<br />
Moody's<br />
Debt Rating<br />
Schedule 6<br />
AGL Resources Inc. A- Excellent Intermediate 58.2 3.7 19.6 4.4 A3 39.4 13.2<br />
Indiana Gas Co. Inc. A- Excellent Intermediate 48.0 2.8 16.4 3.6 Baa1 na na<br />
Laclede Gas Co. A Excellent Intermediate 60.0 2.3 13.8 3.1 Baa1 34.0 9.7<br />
Laclede Group A Excellent Intermediate 57.9 3.0 17.7 3.6 na 44.5 13.9<br />
New Jersey Natural Gas A Excellent Intermediate 42.8 5.4 24.2 5.5 A1 51.2 13.9<br />
Nicor Inc. AA Excellent Intermediate 45.3 3.9 28.3 6.0 A3 44.0 14.2<br />
Nicor Gas AA Excellent Intermediate 47.1 2.7 19.7 4.7 na na na<br />
North Shore Gas A- Excellent Intermediate 45.6 4.5 20.6 4.9 A2 54.8 7.1<br />
Northwest Natural Gas Co. AA- Excellent Intermediate 53.4 3.6 21.2 4.4 A3 45.3 11.5<br />
Piedmont Natural Gas Co. Inc. A Excellent Intermediate 50.5 3.9 24.9 4.9 A3 41.9 11.8<br />
Public Service (North Carolina) 4/ A- Excellent Aggressive 42.1 2.9 14.3 3.3 A3 58.3 5.3<br />
Southern California Gas Co. A Excellent Intermediate 56.2 4.6 30.6 6.4 A2 50.9 16.0<br />
Vectren Corp. A- Excellent Intermediate 58.4 2.8 17.1 4.0 na 42.2 10.4<br />
Vectren Utility Holdings Inc. A- Excellent Intermediate 53.7 2.9 19.0 4.1 Baa1 48.2 9.4<br />
Washington Gas Light Co. AA- Excellent Intermediate 50.8 4.6 24.1 5.5 A2 49.9 10.9<br />
WGL Holdings Inc. AA- Excellent Intermediate 52.8 4.6 22.2 5.3 na 51.7 10.8<br />
Mean A Excellent Intermediate 51.4 3.6 20.9 4.6 A3 46.9 11.3<br />
Median A Excellent Intermediate 51.8 3.7 20.2 4.5 A3 46.7 11.2<br />
1/ S&P Credit Stats<br />
2/ Equity ratio based on total capital.<br />
3/ <strong>ROE</strong> and equity ratio for New Jersey Resources Corp.<br />
4/ Common equity ratio is 2007, and average <strong>ROE</strong> is for 2005-2007.<br />
DEBT RATINGS AND FINANCIAL METRICS FOR U.S. NATURAL GAS UTILITIES RATED A- OR HIGHER<br />
Source: S&P: Issuer Ranking: U.S. Natural Gas Distributors and Integrated Gas Companies, Strongest to Weakest, March 10, <strong>2009</strong> and S&P, Credit Stats, September 2008 and<br />
www.moodys.com<br />
S&P<br />
Average 2005-2007 1/<br />
Common<br />
Equity Ratio<br />
(2008) 2/<br />
Average<br />
<strong>ROE</strong><br />
2006-2008
Debt Business Financial<br />
Name Rating Profile Profile Debt Ratio EBIT Coverage FFO/Debt FFO Coverage<br />
Schedule 7<br />
Alabama Power Co. A Excellent Intermediate 52.7 4.2 21.8 5.3 A2 42.5 13.4<br />
Central Hudson Gas & Electric Corp. A Excellent Intermediate 61.4 4.5 16.1 4.5 A2 43.7 9.3<br />
Florida Power & Light Co. A Excellent Intermediate 43.3 5.0 30.3 6.3 A1 56.0 10.9<br />
FPL Group Inc. A Excellent Intermediate 51.4 2.9 25.8 5.3 A2 40.6 13.7<br />
Georgia Power Co. A Excellent Intermediate 49.7 4.8 23.3 5.5 A2 46.5 13.7<br />
Gulf Power Co. A Excellent Intermediate 53.2 3.8 20.1 4.6 A2 42.9 12.4<br />
Mississippi Power Co. A Excellent Intermediate 47.0 6.9 44.7 11.3 A1 57.5 14.0<br />
San Diego Gas & Electric Co. A Excellent Intermediate 51.5 3.4 30.5 4.6 A2 53.3 14.0<br />
Southern Co. A Excellent Intermediate 56.4 3.6 21.3 5.1 A3 40.5 14.1<br />
Consolidated Edison Co. of New York Inc. A- Excellent Intermediate 54.1 3.0 15.5 3.6 A1 48.8 10.1<br />
Consolidated Edison Inc. A- Excellent Intermediate 57.1 2.9 14.7 3.6 A2 48.5 11.1<br />
Dominion Resources A- Excellent Aggressive 60.3 2.5 13.0 3.1 Baa2 36.3 18.3<br />
Duke Energy Carolinas LLC A- Excellent Intermediate 47.9 4.1 31.3 9.9 A3 na na<br />
Duke Energy Corp. A- Excellent Intermediate 44.3 3.6 22.4 4.5 Baa2 59.2 7.1<br />
Duke Energy Indiana Inc. 3/ A- Excellent Intermediate 55.0 3.1 17.4 4.4 Baa1 46.7 9.1<br />
Duke Energy Kentucky A- Excellent Intermediate 69.0 1.3 8.2 2.7 Baa1 na na<br />
Duke Energy Ohio Inc. A- Excellent Intermediate 32.1 3.9 24.0 5.4 Baa1 na na<br />
MidAmerican Energy Co. A- Excellent Aggressive 53.0 4.2 23.3 5.3 A2 43.4 14.6<br />
Northern States Power (Wisconsin) A- Excellent Intermediate 44.9 3.4 24.0 4.9 A3 51.3 9.3<br />
PacifiCorp A- Excellent Aggressive 55.6 2.8 16.8 3.8 Baa1 51.1 7.1<br />
PPL Electric <strong>Utilities</strong> Corp. A- Excellent Intermediate 52.3 3.4 20.4 4.1 Baa1 38.3 12.5<br />
SCANA Corp. A- Excellent Aggressive 57.5 2.4 19.6 4.3 Baa1 39.3 11.2<br />
South Carolina Electric & Gas Co. A- Excellent Aggressive 49.1 2.6 27.3 5.3 A3 44.9 9.5<br />
Southern Indiana Gas & Electric A- Excellent Intermediate 46.1 3.7 23.5 4.8 Baa1 na na<br />
Virginia Electric Power 3/ A- Excellent Aggressive 52.5 3.2 20.0 4.4 Baa1 47.1 6.5<br />
Wisconsin Electric Power Co. A- Excellent Intermediate 46.4 3.7 28.3 5.3 A1 46.7 11.1<br />
Wisconsin Power & Light Co. A- Excellent Intermediate 50.8 3.8 20.2 4.8 A2 53.7 10.0<br />
Wisconsin Public Service Corp. A- Excellent Aggressive 55.5 3.1 18.7 4.1 A1 54.2 10.1<br />
NSTAR A+ Excellent Intermediate 62.4 3.5 23.2 5.3 A2 36.8 13.5<br />
Madison Gas & Electric Co. AA- Excellent Intermediate 50.8 4.6 20.5 5.4 Aa3 53.6 11.1<br />
Mean A- Excellent Intermediate 52.1 3.6 22.2 5.1 A3 47.1 11.4<br />
Median A- Excellent Intermediate 52.4 3.6 21.6 4.8 A2/A3 46.7 11.1<br />
1/ S&P Credit Stats<br />
2/ Equity ratio based on total capital.<br />
3/ Common equity ratio is 2007, and average <strong>ROE</strong> is for 2005-2007.<br />
DEBT RATINGS AND FINANCIAL METRICS FOR U.S. ELECTRIC UTILITIES RATED A- or HIGHER<br />
Source: S&P: Research Insight; Issuer Ranking: U.S. Regulated Electric <strong>Utilities</strong>, Strongest to Weakest, March 31, <strong>2009</strong>;<br />
S&P, Credit Stats, September 2008 and www.moodys.com<br />
S&P<br />
Average 2005-2007 1/<br />
Moody's<br />
Debt Rating<br />
Common<br />
Equity Ratio<br />
(2008) 2/<br />
Average<br />
<strong>ROE</strong><br />
2006-2008
HISTORIC EQUITY MARKET<br />
RISK PREMIUMS<br />
(ARITHMETIC AVERAGES)<br />
Canada<br />
(1947-2008)<br />
Stock Return Bond Total Return Risk Premium<br />
11.6 7.0 4.6<br />
Stock Return Bond Income Return Risk Premium<br />
11.6 7.2 4.4<br />
United States<br />
(1947-2008)<br />
Stock Return Bond Total Return Risk Premium<br />
12.2 6.6 5.6<br />
Stock Return Bond Income Return Risk Premium<br />
12.2 6.0 6.2<br />
Source: Ibbotson Associates, Stocks, Bonds, Bills and Inflation: <strong>2009</strong> Yearbook;<br />
Ibbotson Associates, Canadian Risk Premia Over Time Report 2008; Canadian Institute of Actuaries,<br />
Report on Canadian Economic Statistics 1924-2006; www.standardandpoors.com, TSX Review<br />
www.federalreserve.gov<br />
Schedule 8<br />
Page 1 of 2
HISTORIC EQUITY MARKET<br />
RISK PREMIUMS<br />
(Arithmetic Averages)<br />
Canada<br />
(1924-2008)<br />
Stock Return Bond Total Return Risk Premium<br />
11.3 6.6 4.7<br />
Stock Return Bond Income Return Risk Premium<br />
11.3 6.3 5.0<br />
United States<br />
(1926-2008)<br />
Stock Return Bond Total Return Risk Premium<br />
11.7 6.1 5.6<br />
Stock Return Bond Income Return Risk Premium<br />
11.7 5.2 6.5<br />
Source: Ibbotson Associates, Stocks, Bonds, Bills and Inflation: <strong>2009</strong> Yearbook;<br />
Ibbotson Associates, Canadian Risk Premia Over Time Report 2008; Canadian Institute of Actuaries,<br />
Report on Canadian Economic Statistics 1924-2006; www.standardandpoors.com, TSX Review<br />
www.federalreserve.gov<br />
Schedule 8<br />
Page 2 of 2
Canadian Stock<br />
Returns<br />
10-YEAR ROLLING AVERAGE CANADIAN MARKET RETURNS<br />
Canadian Bond<br />
Total Returns<br />
Canadian Risk<br />
Premium Bond<br />
Total Returns<br />
Canadian Bond<br />
Income Returns<br />
Canadian Risk<br />
Premium Bond<br />
Income Returns<br />
1947-1956 18.94% 1.40% 17.53% 3.21% 15.72%<br />
1948-1957 16.84% 1.68% 15.17% 3.37% 13.47%<br />
1949-1958 18.76% 1.35% 17.41% 3.50% 15.26%<br />
1950-1959 16.95% 0.42% 16.54% 3.72% 13.23%<br />
1951-1960 12.29% 1.14% 11.15% 3.96% 8.32%<br />
1952-1961 13.16% 2.43% 10.73% 4.15% 9.01%<br />
1953-1962 12.49% 2.54% 9.96% 4.31% 8.18%<br />
1954-1963 13.84% 2.60% 11.24% 4.46% 9.38%<br />
1955-1964 12.48% 2.30% 10.18% 4.67% 7.81%<br />
1956-1965 10.36% 2.43% 7.94% 4.88% 5.48%<br />
1957-1966 8.33% 2.94% 5.39% 5.10% 3.24%<br />
1958-1967 12.20% 2.14% 10.07% 5.29% 6.91%<br />
1959-1968 11.32% 2.62% 8.70% 5.57% 5.76%<br />
1960-1969 10.78% 2.87% 7.92% 5.83% 4.95%<br />
1961-1970 10.25% 4.35% 5.89% 6.12% 4.13%<br />
1962-1971 7.77% 4.53% 3.24% 6.32% 1.45%<br />
1963-1972 11.22% 4.34% 6.88% 6.55% 4.67%<br />
1964-1973 9.69% 4.08% 5.60% 6.81% 2.88%<br />
1965-1974 4.55% 3.22% 1.33% 7.20% -2.65%<br />
1966-1975 5.73% 3.40% 2.33% 7.61% -1.88%<br />
1967-1976 7.54% 5.15% 2.39% 7.99% -0.45%<br />
1968-1977 6.80% 5.97% 0.84% 8.28% -1.48%<br />
1969-1978 7.53% 6.18% 1.35% 8.55% -1.03%<br />
1970-1979 12.09% 6.11% 5.97% 8.84% 3.25%<br />
1971-1980 15.46% 4.12% 11.33% 9.34% 6.12%<br />
1972-1981 13.63% 2.67% 10.97% 10.26% 3.37%<br />
1973-1982 11.45% 6.85% 4.59% 11.03% 0.42%<br />
1974-1983 14.97% 7.64% 7.33% 11.49% 3.48%<br />
1975-1984 17.32% 9.32% 8.00% 11.92% 5.40%<br />
1976-1985 17.98% 11.56% 6.42% 12.14% 5.84%<br />
1977-1986 17.77% 11.42% 6.36% 12.18% 5.60%<br />
1978-1987 17.29% 10.86% 6.43% 12.31% 4.98%<br />
1979-1988 15.43% 11.78% 3.65% 12.41% 3.01%<br />
1980-1989 13.09% 13.67% -0.58% 12.38% 0.71%<br />
1981-1990 8.59% 13.80% -5.20% 12.20% -3.61%<br />
1982-1991 10.82% 16.54% -5.72% 11.59% -0.77%<br />
1983-1992 10.12% 13.55% -3.43% 10.98% -0.85%<br />
1984-1993 9.83% 14.88% -5.05% 10.55% -0.72%<br />
1985-1994 10.05% 12.33% -2.27% 10.09% -0.04%<br />
1986-1995 9.00% 12.43% -3.43% 9.79% -0.79%<br />
1987-1996 10.94% 12.10% -1.17% 9.57% 1.36%<br />
1988-1997 11.85% 13.80% -1.96% 9.19% 2.65%<br />
1989-1998 10.58% 14.17% -3.59% 8.68% 1.90%<br />
1990-1999 11.61% 11.83% -0.21% 8.23% 3.38%<br />
1991-2000 13.83% 12.86% 0.98% 7.69% 6.14%<br />
1992-2001 11.38% 10.81% 0.57% 7.27% 4.11%<br />
1993-2002 10.28% 10.51% -0.23% 6.93% 3.34%<br />
1994-2003 9.69% 9.03% 0.67% 6.65% 3.04%<br />
1995-2004 11.16% 10.92% 0.24% 6.26% 4.90%<br />
1996-2005 12.12% 9.79% 2.32% 5.86% 6.25%<br />
1997-2006 11.01% 8.69% 2.32% 5.50% 5.51%<br />
1998-2007 10.47% 7.27% 3.20% 5.24% 5.23%<br />
1999-2008 7.33% 7.22% 0.12% 5.09% 2.24%<br />
Source: Ibbotson Associates, Canadian Risk Premia Over Time Report 2008;<br />
Institute of Actuaries, Report on Canadian Economic Statistics 1924-2006, TSX Review<br />
Schedule 9<br />
Page 1 of 2
US Stock Returns<br />
10-YEAR ROLLING AVERAGE U.S. MARKET RETURNS<br />
US Bond Total<br />
Returns<br />
US Risk Premium<br />
Bond Total Returns<br />
US Bond Income<br />
Returns<br />
US Risk Premium<br />
Bond Income<br />
Returns<br />
1947-1956 19.38% 0.85% 18.54% 2.53% 16.85%<br />
1948-1957 17.74% 1.86% 15.88% 2.66% 15.07%<br />
1949-1958 21.52% 0.91% 20.62% 2.75% 18.77%<br />
1950-1959 20.84% 0.04% 20.80% 2.93% 17.91%<br />
1951-1960 17.71% 1.41% 16.31% 3.14% 14.58%<br />
1952-1961 18.00% 1.90% 16.10% 3.28% 14.72%<br />
1953-1962 15.29% 2.47% 12.82% 3.42% 11.87%<br />
1954-1963 17.67% 2.23% 15.44% 3.52% 14.15%<br />
1955-1964 14.06% 1.86% 12.20% 3.66% 10.40%<br />
1956-1965 12.15% 2.06% 10.09% 3.80% 8.34%<br />
1957-1966 10.48% 2.98% 7.50% 3.95% 6.53%<br />
1958-1967 13.96% 1.32% 12.64% 4.07% 9.89%<br />
1959-1968 10.73% 1.90% 8.83% 4.29% 6.44%<br />
1960-1969 8.68% 1.62% 7.06% 4.49% 4.20%<br />
1961-1970 9.04% 1.45% 7.58% 4.73% 4.30%<br />
1962-1971 7.78% 2.68% 5.10% 4.98% 2.80%<br />
1963-1972 10.55% 2.56% 7.99% 5.17% 5.38%<br />
1964-1973 6.80% 2.33% 4.48% 5.43% 1.37%<br />
1965-1974 2.51% 2.41% 0.10% 5.74% -3.23%<br />
1966-1975 4.98% 3.26% 1.72% 6.12% -1.14%<br />
1967-1976 8.37% 4.57% 3.80% 6.46% 1.91%<br />
1968-1977 5.26% 5.42% -0.16% 6.72% -1.46%<br />
1969-1978 4.81% 5.33% -0.52% 6.96% -2.15%<br />
1970-1979 7.50% 5.71% 1.79% 7.25% 0.25%<br />
1971-1980 10.34% 4.11% 6.24% 7.57% 2.77%<br />
1972-1981 8.42% 2.97% 5.45% 8.10% 0.33%<br />
1973-1982 8.67% 6.44% 2.23% 8.86% -0.19%<br />
1974-1983 12.38% 6.61% 5.77% 9.25% 3.14%<br />
1975-1984 15.66% 7.73% 7.93% 9.69% 5.96%<br />
1976-1985 15.15% 9.90% 5.25% 10.02% 5.13%<br />
1977-1986 14.61% 10.68% 3.93% 10.13% 4.49%<br />
1978-1987 15.86% 10.48% 5.38% 10.21% 5.65%<br />
1979-1988 16.88% 11.56% 5.32% 10.31% 6.57%<br />
1980-1989 18.19% 13.50% 4.69% 10.31% 7.88%<br />
1981-1990 14.63% 14.51% 0.12% 10.13% 4.50%<br />
1982-1991 18.17% 16.25% 1.92% 9.80% 8.38%<br />
1983-1992 16.80% 13.02% 3.78% 9.17% 7.63%<br />
1984-1993 15.55% 14.78% 0.76% 8.85% 6.70%<br />
1985-1994 15.05% 12.46% 2.59% 8.34% 6.71%<br />
1986-1995 15.58% 12.53% 3.05% 7.97% 7.61%<br />
1987-1996 16.04% 9.98% 6.06% 7.69% 8.35%<br />
1988-1997 18.85% 11.84% 7.01% 7.56% 11.29%<br />
1989-1998 20.03% 12.18% 7.85% 7.25% 12.78%<br />
1990-1999 18.98% 9.47% 9.51% 6.93% 12.06%<br />
1991-2000 18.39% 11.00% 7.39% 6.76% 11.63%<br />
1992-2001 14.15% 9.44% 4.71% 6.49% 7.66%<br />
1993-2002 11.17% 10.42% 0.75% 6.32% 4.85%<br />
1994-2003 13.04% 8.74% 4.30% 6.08% 6.96%<br />
1995-2004 14.00% 10.37% 3.63% 5.93% 8.07%<br />
1996-2005 10.74% 7.98% 2.76% 5.64% 5.11%<br />
1997-2006 10.02% 8.19% 1.82% 5.49% 4.53%<br />
1998-2007 7.23% 7.60% -0.37% 5.31% 1.92%<br />
1999-2008 0.67% 8.88% -8.21% 5.17% -4.50%<br />
Source: Ibbotson Associates, Stocks, Bonds, Bills and Inflation: <strong>2009</strong> Yearbook,<br />
www.federalreserve.gov, www.standardandpoors.com<br />
Schedule 9<br />
Page 2 of 2
Schedule 10<br />
Page 1 of 2<br />
1997 1998 1999 2000 2001 2002 2003 2004 2005 2006 2007 2008 Average<br />
(%) (%) (%) (%) (%) (%) (%) (%) (%) (%) (%) (%) (%)<br />
S&P / TSX Composite 3.57 4.68 4.84 5.40 5.87 5.83 4.97 4.59 4.04 3.24 2.86 4.35 4.52<br />
10 Sector Indices<br />
Consumer Discretionary 3.69 4.36 4.62 4.99 5.38 5.73 5.35 5.00 4.35 3.69 3.08 3.84 4.51<br />
Consumer Staples 3.57 4.01 3.70 4.04 4.17 4.76 4.45 4.37 4.05 3.88 2.97 3.24 3.94<br />
Energy 5.60 6.16 7.31 7.97 8.30 8.10 6.98 5.72 5.56 5.46 5.40 7.04 6.63<br />
Financials 4.27 5.89 5.92 6.22 6.17 6.06 4.58 4.23 3.77 3.36 2.97 3.99 4.78<br />
Health Care 6.62 7.73 8.19 9.38 9.00 9.39 8.93 8.68 6.98 6.57 5.45 4.92 7.65<br />
Industrials 4.13 4.93 4.69 5.12 6.50 7.18 6.92 6.87 6.48 5.16 4.08 4.87 5.58<br />
Information Technology 7.99 9.17 10.35 12.27 15.16 17.12 16.64 17.09 15.81 13.36 10.20 11.82 13.08<br />
Materials 5.87 6.98 7.22 7.29 7.40 7.25 5.89 5.65 5.67 5.88 5.59 7.96 6.55<br />
Telecommunication Services 3.66 5.82 7.37 7.87 8.46 8.71 7.54 5.74 4.97 4.64 4.18 5.08 6.17<br />
<strong>Utilities</strong> 3.12 3.80 4.00 4.80 5.06 4.88 4.49 4.09 3.36 3.13 3.49 4.04 4.02<br />
Mean 4.85 5.89 6.34 7.00 7.56 7.92 7.18 6.75 6.10 5.51 4.74 5.68 6.29<br />
Median 4.20 5.85 6.57 6.76 6.95 7.21 6.41 5.68 5.27 4.90 4.13 4.90 5.74<br />
S&P/TSX <strong>Utilities</strong> Index as a Percent of:<br />
10 Sector Indices (Mean) 0.64 0.65 0.63 0.69 0.67 0.62 0.63 0.61 0.55 0.57 0.74 0.71 0.64<br />
10 Sector Indices (Median) 0.74 0.65 0.61 0.71 0.73 0.68 0.70 0.72 0.64 0.64 0.85 0.82 0.71<br />
Source: TSX Review<br />
FIVE-YEAR STANDARD DEVIATIONS OF MARKET RETURNS<br />
FOR 10 SECTOR INDICES OF S&P/TSX COMPOSITE<br />
FOR FIVE YEAR PERIODS ENDING:<br />
Ratios of Standard Deviations
Consumer<br />
Discretionary<br />
Consumer<br />
Staples Energy Financials Health Care Industrials<br />
Information<br />
Technology Materials<br />
Telecommunication<br />
Services <strong>Utilities</strong><br />
1997 0.82 0.62 0.97 0.94 0.60 0.97 1.57 1.32 0.64 0.53<br />
1998 0.80 0.60 0.85 1.12 1.01 0.93 1.41 1.12 0.92 0.55<br />
1999 0.73 0.44 0.90 1.00 1.00 0.78 1.55 1.04 1.11 0.30<br />
2000 0.69 0.23 0.66 0.78 1.09 0.72 1.78 0.74 0.92 0.14<br />
2001 0.68 0.10 0.49 0.66 0.98 0.82 2.13 0.60 0.94 -0.03<br />
2002 0.73 0.08 0.43 0.66 0.99 0.86 2.28 0.57 0.93 -0.06<br />
2003 0.74 -0.08 0.26 0.38 0.85 0.91 2.74 0.43 0.83 -0.25<br />
2004 0.80 -0.07 0.17 0.39 0.82 1.05 2.87 0.41 0.58 -0.13<br />
2005 0.83 0.07 0.48 0.56 0.72 1.13 2.68 0.77 0.74 0.00<br />
2006 0.86 0.37 1.03 0.68 0.85 1.06 2.07 1.32 0.52 0.25<br />
2007 0.73 0.54 1.44 0.51 0.54 0.96 1.12 1.45 0.62 0.46<br />
2008 0.59 0.32 1.43 0.61 0.48 0.81 1.43 1.30 0.55 0.49<br />
Source: TSX Review<br />
5-YEAR PRICE BETAS FOR S&P/TSX SECTOR INDICES<br />
Schedule 10<br />
Page 2 of 2
Schedule 11<br />
Page 1 of 3<br />
Compound Returns Betas<br />
56-03 56-97 64-73 74-83 84-93 94-03 56-03 56-97 64-73 74-83 84-93 94-03<br />
Metals/Minerals 0.08 0.08 0.07 0.11 0.07 0.07 1.15 1.23 1.14 1.22 1.37 0.87<br />
Gold/Precious Metals 0.10 0.10 0.16 0.16 0.11 -0.03 0.85 0.96 0.36 1.31 1.24 0.64<br />
Oil and Gas 0.10 0.08 0.15 0.12 0.05 0.15 1.06 1.20 1.25 1.40 0.98 0.52<br />
Paper/Forest Products 0.07 0.07 0.05 0.12 0.10 0.03 1.02 1.07 1.15 1.00 1.27 0.85<br />
Consumer Products 0.11 0.12 0.10 0.14 0.11 0.10 0.83 0.86 0.84 0.90 0.89 0.73<br />
Industrial Products 0.07 0.10 0.08 0.11 0.06 0.01 1.17 1.02 1.11 0.87 1.08 1.69<br />
Real Estate 1/<br />
0.05 0.05 0.01 0.17 -0.02 0.01 1.00 1.18 1.21 1.28 1.06 0.46<br />
Transportation/Environmental 0.10 0.11 0.13 0.18 0.03 0.09 0.94 1.04 0.94 1.08 1.22 0.62<br />
Pipelines 0.12 0.12 0.05 0.14 0.14 0.13 0.68 0.85 0.80 0.92 0.76 0.02<br />
<strong>Utilities</strong> 0.11 0.11 0.03 0.18 0.11 0.16 0.54 0.48 0.50 0.47 0.40 0.79<br />
Communications/Media 0.13 0.15 0.19 0.15 0.13 0.07 0.77 0.77 0.96 0.69 0.95 0.80<br />
Merchandising 0.10 0.11 0.11 0.12 0.09 0.07 0.78 0.86 0.93 0.84 0.83 0.46<br />
Finance 0.12 0.13 0.12 0.12 0.12 0.18 0.83 0.85 0.95 0.71 0.93 0.77<br />
Conglomerates 0.11 0.11 0.13 0.15 0.09 0.14 0.94 1.03 1.26 0.97 1.20 0.68<br />
Intercept 0.18 0.18 0.12 0.15 0.14 0.12<br />
Adjusted R Square 47% 44% 1% 1% 11% 9%<br />
Beta -0.088 -0.082 -0.020 -0.008 -0.056 -0.053<br />
1/ Data only available starting July 1961<br />
Source: TSX Review<br />
TSE 300 SUB-INDEX COMPOUND RETURNS AND BETAS
Compound Returns<br />
88-08 88-97 99-08 88-08 88-97 99-08<br />
1/<br />
Betas<br />
Consumer Discretionary 0.058 0.102 0.009 0.761 0.904 0.676<br />
Consumer Staples 0.116 0.127 0.092 0.351 0.727 0.105<br />
Energy 0.099 0.084 0.165 0.774 0.765 0.767<br />
Financials 0.119 0.183 0.067 0.761 1.039 0.471<br />
Health Care 0.016 0.155 -0.104 0.806 0.807 0.698<br />
Industrials 0.050 0.083 0.033 0.947 1.131 0.863<br />
Information Technology 0.050 0.218 -0.097 1.746 1.213 2.189<br />
Materials 0.057 0.034 0.102 0.970 1.257 0.814<br />
Telecommunication Services 0.124 0.154 0.084 0.720 0.578 0.698<br />
<strong>Utilities</strong> 0.098 0.115 0.088 0.300 0.624 0.065<br />
Intercept 0.12 0.14 0.11<br />
Adjusted R Square 26% 1% 32%<br />
Beta -0.047 -0.017 -0.084<br />
1/ Data only available starting December 1987<br />
Source: TSX Review<br />
S&P/TSX COMPOSITE SECTOR COMPOUND RETURNS AND BETAS<br />
Schedule 11<br />
Page 2 of 3
COMPANY 1993 1994 1995 1996 1997 1998 1999 2000 2001 2002 2003 2004 2005 2006 2007 2008 <strong>2009</strong><br />
Canadian <strong>Utilities</strong> 0.46 0.54 0.48 0.55 0.63 0.62 0.54 0.38 0.27 0.19 0.05 0.03 0.20 0.32 0.58 0.19 0.41<br />
Emera na na na 0.52 0.40 0.55 0.41 0.27 0.20 0.15 -0.05 0.01 0.07 0.12 0.24 0.17 0.38<br />
Enbridge 0.35 0.53 0.46 0.44 0.43 0.48 0.26 0.07 -0.10 -0.18 -0.37 -0.32 -0.19 0.22 0.54 0.30 0.56<br />
Fortis 0.35 0.44 0.51 0.37 0.30 0.49 0.33 0.23 0.14 0.13 -0.06 0.01 0.21 0.48 0.65 0.21 0.49<br />
PNG 0.51 0.56 0.42 0.30 0.39 0.55 0.47 0.44 0.42 0.44 0.37 0.49 0.54 0.54 0.35 0.26 0.21<br />
1/<br />
<strong>Terasen</strong> Inc<br />
0.40 0.53 0.59 0.53 0.46 0.48 0.36 0.25 0.18 0.12 0.02 -0.02 0.06 na na na na<br />
TransCanada Pipelines 0.40 0.57 0.56 0.52 0.36 0.55 0.21 0.15 -0.08 -0.09 -0.38 -0.16 -0.15 0.34 0.52 0.38 0.47<br />
Mean 0.41 0.53 0.50 0.46 0.42 0.53 0.37 0.26 0.14 0.11 -0.06 0.01 0.11 0.34 0.48 0.25 0.42<br />
Median 0.40 0.54 0.50 0.52 0.40 0.55 0.36 0.25 0.18 0.13 -0.05 0.01 0.07 0.33 0.53 0.24 0.44<br />
TSE Gas/Electric Index 0.42 0.48 0.52 0.52 0.46 0.55 0.38 0.21 0.17 0.14 NA NA NA NA NA NA NA<br />
S&P/TSX <strong>Utilities</strong> 0.55 0.63 0.67 0.65 0.53 0.55 0.30 0.14 -0.03 -0.06 -0.25 -0.13 0.00 0.25 0.46 0.49 0.56<br />
COMPANY 1993 1994 1995 1996 1997 1998 1999 2000 2001 2002 2003 2004 2005 2006 2007 2008 <strong>2009</strong><br />
Canadian <strong>Utilities</strong> 0.64 0.69 0.65 0.70 0.75 0.75 0.69 0.58 0.51 0.46 0.37 0.35 0.47 0.54 0.72 0.45 0.61<br />
Emera NA NA NA 0.68 0.60 0.70 0.60 0.51 0.46 0.43 0.29 0.33 0.38 0.41 0.49 0.44 0.59<br />
Enbridge 0.56 0.69 0.64 0.62 0.62 0.65 0.50 0.38 0.26 0.21 0.08 0.12 0.21 0.48 0.69 0.53 0.70<br />
Fortis 0.57 0.62 0.67 0.58 0.53 0.66 0.55 0.48 0.42 0.41 0.29 0.34 0.47 0.65 0.77 0.47 0.66<br />
PNG 0.67 0.71 0.61 0.53 0.59 0.70 0.65 0.63 0.61 0.63 0.58 0.66 0.69 0.69 0.56 0.50 0.47<br />
<strong>Terasen</strong> Inc 0.60 0.69 0.72 0.69 0.64 0.65 0.57 0.50 0.45 0.41 0.35 0.32 0.37 na na na na<br />
TransCanada Pipelines 0.60 0.71 0.71 0.68 0.57 0.70 0.47 0.43 0.28 0.27 0.08 0.22 0.23 0.56 0.68 0.58 0.65<br />
Mean 0.61 0.68 0.67 0.64 0.61 0.69 0.58 0.50 0.43 0.40 0.29 0.33 0.40 0.56 0.65 0.50 0.61<br />
Median 0.60 0.69 0.66 0.68 0.60 0.70 0.57 0.50 0.45 0.41 0.29 0.33 0.38 0.55 0.68 0.49 0.63<br />
TSE Gas/Electric Index 0.61 0.65 0.68 0.68 0.64 0.70 0.59 0.47 0.44 0.42 NA NA NA NA NA NA NA<br />
S&P/TSX <strong>Utilities</strong> 0.70 0.76 0.78 0.77 0.69 0.70 0.53 0.42 0.31 0.29 0.16 0.24 0.33 0.50 0.64 0.66 0.71<br />
1/ Due to its purchase by Kinder Morgan, <strong>Terasen</strong> betas are calculated through November 2005.<br />
2/ Adjusted beta = "raw" beta * 67% + market beta of 1.0 * 33%.<br />
3/ Three-year beta based on weekely data calculated through March <strong>2009</strong>.<br />
Source: Standard and Poor's Research Insight and TSX Review .<br />
BETAS FOR REGULATED CANADIAN UTILITIES<br />
" Raw" Betas<br />
Five Year Period Ending:<br />
Adjusted Betas<br />
Five Year Period Ending:<br />
2/<br />
Schedule 11<br />
Page 3 of 3<br />
3/<br />
3/
DCF-BASED EQUITY RISK PREMIUM STUDY FOR<br />
BENCHMARK U.S. GAS AND ELECTRIC UTILITIES<br />
(Annual Averages of Monthly Data)<br />
Expected<br />
Dividend<br />
Yield 1/<br />
I/B/E/S EPS<br />
Growth<br />
Forecast DCF Cost<br />
Schedule 12<br />
Page 1 of 2<br />
Long Treasury<br />
Yield Risk Premium<br />
1991 7.0 4.6 11.6 8.1 3.6<br />
1992 6.4 4.4 10.8 7.7 3.1<br />
1993 5.6 4.6 10.1 6.6 3.6<br />
1994 6.3 4.1 10.4 7.4 3.0<br />
1995 6.1 3.9 9.9 6.8 3.1<br />
1996 5.7 4.0 9.7 6.7 3.0<br />
1997 5.5 4.2 9.8 6.6 3.2<br />
1998 4.7 4.6 9.4 5.5 3.8<br />
1999 5.1 5.0 10.2 5.9 4.3<br />
2000 5.2 5.7 11.0 5.9 5.1<br />
2001 4.8 6.6 11.4 5.5 6.0<br />
2002 4.8 6.4 11.2 5.4 5.8<br />
2003 4.9 5.2 10.1 5.0 5.1<br />
2004 4.5 4.6 9.1 5.1 4.0<br />
2005 4.1 4.7 8.8 4.5 4.3<br />
2006 4.2 5.3 9.6 4.9 4.7<br />
2007 4.1 5.3 9.4 4.8 4.6<br />
2008 4.5 5.7 10.2 4.2 6.0<br />
<strong>2009</strong> (Through March) 5.3 5.7 11.0 3.6 7.4<br />
Means for Long Treasury Yields:<br />
Under 5.0 4.4 5.3 9.7 4.6 5.1<br />
5.0-5.99 4.8 5.5 10.3 5.5 4.8<br />
6.0-6.99 5.6 4.4 10.0 6.5 3.5<br />
7.0 and above 6.5 4.3 10.8 7.7 3.1<br />
Means:<br />
1991 - <strong>2009</strong>Q1 5.2 5.0 10.2 5.9 4.3<br />
1993 - <strong>2009</strong>Q1 5.0 5.0 10.0 5.6 4.4<br />
1998 - <strong>2009</strong>Q1 4.7 5.4 10.1 5.1 4.9<br />
1/<br />
Dividend Yield is adjusted for I/B/E/S/ growth<br />
Source: Standard & Poor's Research Insight, I/B/E/S and www.federalreserve.gov
Equation 1:<br />
Equity Risk Premium at Long-Term Bond<br />
Yield of 4.25%<br />
Equation 2:<br />
Equity Risk Premium = 8.40 - 0.70 (30-Year Treasury Yield)<br />
t-statistics:<br />
Long-term Bond Yield = -15.81<br />
R 2 = 53%<br />
Schedule 12<br />
Page 2 of 2<br />
Equity Risk Premium = 4.97 - 0.42 (30-Year Treasury Yield) + 1.23 (Spread)<br />
Where Spread<br />
Equity Risk Premium at Long-term Bond<br />
Yield of 4.25% and Spread of 2.25-2.50<br />
DCF-BASED EQUITY RISK PREMIUM STUDY FOR<br />
BENCHMARK U.S. GAS AND ELECTRIC UTILITIES<br />
Regression Analysis Results<br />
= 5.42<br />
= Spread between A-rated Utility Bond Yields and 30-year<br />
Treasury Yields<br />
t-statistics:<br />
Long-term Bond Yield = -13.55<br />
Utility/government bond yield spread = 19.21<br />
R 2 = 83%<br />
= 6.1
<strong>Utilities</strong> Index Return Bond Total Return Risk Premium<br />
12.0 7.9 4.1<br />
<strong>Utilities</strong> Index Return Bond Income Return Risk Premium<br />
12.0 7.8 4.2<br />
S&P / Moody's Gas<br />
Distribution Index Return Bond Total Return Risk Premium<br />
12.1 6.6 5.5<br />
S&P / Moody's Gas<br />
Distribution Index Return Bond Income Return Risk Premium<br />
12.1 6.0 6.1<br />
S&P/Moody's<br />
Electric Index Return Bond Total Return Risk Premium<br />
10.8 6.6 4.2<br />
S&P/Moody's<br />
HISTORIC UTILITY EQUITY RISK PREMIUMS<br />
Canada<br />
(1956-2008)<br />
United States<br />
(1947-2008)<br />
Electric Index Return Bond Income Return Risk Premium<br />
10.8 6.0 4.8<br />
Notes:<br />
The Canadian <strong>Utilities</strong> Index is based on the Gas/Electric Index of the TSE 300 (from 1956 to 1987) and on the S&P/TSX <strong>Utilities</strong> Index from<br />
The S&P/Moody's Gas Distribution Index reflects S&P's Natural Gas Distributors Index from 1947 to 1984, when S&P eliminated its gas<br />
distribution index. The 1985-2001 data are for Moody's Gas index. The index was terminated in July 2002. The 2002-2008 returns were<br />
estimated using simple averages of the prices and dividends for the utilities that were included in Moody's Gas Index as of the end of 2001.<br />
These LDCs include AGL Resources, Keyspan Corp., Laclede Group, Northwest Natural, Peoples Energy and WGL Holdings.<br />
The S&P/Moody's Electric Index reflects S&P's Electric Index from 1947 to 1998 and Moody's Electric Index from 1999 to 2001. The 2002 to<br />
2008 data were estimated using simple average of the prices and dividends for the utilities included in Moody's Electric Index as of the end of<br />
2001. These utilities include American Electric Power, Centerpoint Energy, CH Energy, Cinergy, Consolidated Edison, Constellation, Dominion<br />
Resources, DPL, DTE Energy, Duke Energy, Energy East, Exelon, FirstEnergy, IDACORP, Nisource, OGE Energy, Pepco Holdings, PPL,<br />
Progress Energy, Public Service Enterprise Grp., Southern Co., Teco and Xcel Energy.<br />
Schedule 13<br />
Source: Ibbotson Associates, Stocks, Bonds, Bills and Inflation: <strong>2009</strong> Yearbook;<br />
Ibbotson Associates, Canadian Risk Premia Over Time Report 2008; Canadian Institute of Actuaries,<br />
Report on Canadian Economic Statistics 1924-2006; www.standardandpoors.com, TSX Review<br />
Mergent Corporate News Reports, www.federal reserve.com
S&P/TSX <strong>Utilities</strong><br />
Returns<br />
10-YEAR ROLLING AVERAGE RETURNS FOR<br />
CANADIAN UTILITIES AND GOVERNMENT BONDS<br />
Canadian Bond<br />
Total Returns<br />
Canadian Risk<br />
Premium Bond<br />
Total Returns<br />
Canadian Bond<br />
Income Returns<br />
Canadian Risk<br />
Premium Bond<br />
Income Returns<br />
1956-1965 14.3% 2.4% 11.9% 4.9% 9.4%<br />
1957-1966 10.1% 2.9% 7.1% 5.1% 5.0%<br />
1958-1967 11.3% 2.1% 9.2% 5.3% 6.0%<br />
1959-1968 10.8% 2.6% 8.2% 5.6% 5.2%<br />
1960-1969 7.9% 2.9% 5.0% 5.8% 2.1%<br />
1961-1970 7.2% 4.4% 2.8% 6.1% 1.0%<br />
1962-1971 6.9% 4.5% 2.4% 6.3% 0.6%<br />
1963-1972 9.2% 4.3% 4.9% 6.5% 2.7%<br />
1964-1973 6.9% 4.1% 2.8% 6.8% 0.1%<br />
1965-1974 6.1% 3.2% 2.8% 7.2% -1.1%<br />
1966-1975 4.7% 3.4% 1.3% 7.6% -2.9%<br />
1967-1976 9.3% 5.1% 4.1% 8.0% 1.3%<br />
1968-1977 9.6% 6.0% 3.6% 8.3% 1.3%<br />
1969-1978 9.2% 6.2% 3.1% 8.6% 0.7%<br />
1970-1979 13.6% 6.1% 7.5% 8.8% 4.8%<br />
1971-1980 13.8% 4.1% 9.7% 9.3% 4.5%<br />
1972-1981 12.2% 2.7% 9.5% 10.3% 1.9%<br />
1973-1982 15.4% 6.9% 8.5% 11.0% 4.3%<br />
1974-1983 17.2% 7.6% 9.6% 11.5% 5.7%<br />
1975-1984 19.5% 9.3% 10.2% 11.9% 7.6%<br />
1976-1985 19.7% 11.6% 8.1% 12.1% 7.5%<br />
1977-1986 17.3% 11.4% 5.9% 12.2% 5.2%<br />
1978-1987 15.9% 10.9% 5.1% 12.3% 3.6%<br />
1979-1988 15.4% 11.8% 3.7% 12.4% 3.0%<br />
1980-1989 12.8% 13.7% -0.9% 12.4% 0.4%<br />
1981-1990 11.1% 13.8% -2.7% 12.2% -1.1%<br />
1982-1991 12.1% 16.5% -4.5% 11.6% 0.5%<br />
1983-1992 8.9% 13.6% -4.7% 11.0% -2.1%<br />
1984-1993 10.4% 14.9% -4.5% 10.5% -0.1%<br />
1985-1994 9.2% 12.3% -3.1% 10.1% -0.9%<br />
1986-1995 7.2% 12.4% -5.2% 9.8% -2.6%<br />
1987-1996 8.8% 12.1% -3.3% 9.6% -0.7%<br />
1988-1997 12.0% 13.8% -1.8% 9.2% 2.8%<br />
1989-1998 11.2% 14.2% -2.9% 8.7% 2.5%<br />
1990-1999 8.2% 11.8% -3.6% 8.2% 0.0%<br />
1991-2000 12.8% 12.9% -0.1% 7.7% 5.1%<br />
1992-2001 13.7% 10.8% 2.9% 7.3% 6.4%<br />
1993-2002 13.7% 10.5% 3.1% 6.9% 6.7%<br />
1994-2003 14.0% 9.0% 5.0% 6.7% 7.3%<br />
1995-2004 14.2% 10.9% 3.3% 6.3% 8.0%<br />
1996-2005 17.7% 9.8% 7.9% 5.9% 11.9%<br />
1997-2006 16.0% 8.7% 7.3% 5.5% 10.5%<br />
1998-2007 13.5% 7.3% 6.2% 5.2% 8.3%<br />
1999-2008 11.1% 7.2% 3.9% 5.1% 6.0%<br />
Source:<br />
Ibbotson Associates, Canadian Risk Premia Over Time Report 2008; Canadian Institute of Actuaries,<br />
Report on Canadian Economic Statistics 1924-2006' TSX Review<br />
Schedule 14<br />
Page 1 of 2
S&P/Moody's Gas<br />
Distributors<br />
Returns<br />
S&P/Moody's<br />
Electric Returns<br />
US Bond Total<br />
Returns<br />
US Gas Risk<br />
Premium Bond<br />
Total Returns<br />
US Electric Risk<br />
Premium Bond<br />
Total Returns<br />
US Bond Income<br />
Returns<br />
US Gas Risk<br />
Premium Bond<br />
Income Returns<br />
Schedule 14<br />
Page 2 of 2<br />
US Electric Risk<br />
Premium Bond<br />
Income Returns<br />
1947-1956 12.4% 10.4% 0.8% 11.5% 9.5% 2.5% 9.8% 7.8%<br />
1948-1957 12.6% 12.6% 1.9% 10.8% 10.8% 2.7% 10.0% 10.0%<br />
1949-1958 15.7% 16.3% 0.9% 14.8% 15.4% 2.7% 12.9% 13.6%<br />
1950-1959 12.6% 14.3% 0.0% 12.6% 14.3% 2.9% 9.7% 11.4%<br />
1951-1960 14.6% 16.0% 1.4% 13.2% 14.6% 3.1% 11.5% 12.9%<br />
1952-1961 15.9% 17.2% 1.9% 14.0% 15.3% 3.3% 12.6% 13.9%<br />
1953-1962 14.3% 15.4% 2.5% 11.9% 12.9% 3.4% 10.9% 11.9%<br />
1954-1963 15.0% 15.5% 2.2% 12.8% 13.2% 3.5% 11.5% 12.0%<br />
1955-1964 13.5% 14.7% 1.9% 11.6% 12.8% 3.7% 9.8% 11.0%<br />
1956-1965 12.4% 13.7% 2.1% 10.4% 11.7% 3.8% 8.6% 9.9%<br />
1957-1966 9.9% 13.0% 3.0% 6.9% 10.0% 4.0% 6.0% 9.1%<br />
1958-1967 10.8% 11.7% 1.3% 9.5% 10.4% 4.1% 6.7% 7.6%<br />
1959-1968 8.6% 8.7% 1.9% 6.7% 6.8% 4.3% 4.3% 4.5%<br />
1960-1969 6.9% 6.9% 1.6% 5.2% 5.3% 4.5% 2.4% 2.4%<br />
1961-1970 7.9% 6.0% 1.5% 6.4% 4.6% 4.7% 3.2% 1.3%<br />
1962-1971 4.7% 3.3% 2.7% 2.1% 0.7% 5.0% -0.3% -1.6%<br />
1963-1972 6.5% 3.6% 2.6% 4.0% 1.0% 5.2% 1.4% -1.6%<br />
1964-1973 3.8% 0.7% 2.3% 1.4% -1.6% 5.4% -1.7% -4.7%<br />
1965-1974 2.7% -3.4% 2.4% 0.3% -5.8% 5.7% -3.0% -9.1%<br />
1966-1975 5.1% 1.4% 3.3% 1.9% -1.9% 6.1% -1.0% -4.8%<br />
1967-1976 11.4% 4.1% 4.6% 6.8% -0.4% 6.5% 4.9% -2.3%<br />
1968-1977 11.4% 5.3% 5.4% 6.0% -0.1% 6.7% 4.7% -1.4%<br />
1969-1978 9.4% 4.1% 5.3% 4.1% -1.2% 7.0% 2.4% -2.9%<br />
1970-1979 14.6% 5.5% 5.7% 8.9% -0.2% 7.2% 7.4% -1.8%<br />
1971-1980 14.7% 4.9% 4.1% 10.6% 0.8% 7.6% 7.1% -2.7%<br />
1972-1981 13.6% 6.7% 3.0% 10.6% 3.8% 8.1% 5.5% -1.4%<br />
1973-1982 12.0% 9.9% 6.4% 5.6% 3.4% 8.9% 3.2% 1.0%<br />
1974-1983 17.1% 13.1% 6.6% 10.5% 6.5% 9.2% 7.9% 3.8%<br />
1975-1984 18.7% 18.1% 7.7% 11.0% 10.4% 9.7% 9.0% 8.4%<br />
1976-1985 18.2% 15.6% 9.9% 8.3% 5.7% 10.0% 8.2% 5.6%<br />
1977-1986 15.9% 16.0% 10.7% 5.3% 5.4% 10.1% 5.8% 5.9%<br />
1978-1987 14.0% 14.4% 10.5% 3.6% 3.9% 10.2% 3.8% 4.2%<br />
1979-1988 16.4% 16.5% 11.6% 4.8% 4.9% 10.3% 6.1% 6.2%<br />
1980-1989 17.1% 19.8% 13.5% 3.6% 6.3% 10.3% 6.8% 9.4%<br />
1981-1990 13.9% 19.3% 14.5% -0.6% 4.8% 10.1% 3.8% 9.2%<br />
1982-1991 17.0% 20.3% 16.3% 0.7% 4.0% 9.8% 7.2% 10.5%<br />
1983-1992 19.0% 17.3% 13.0% 5.9% 4.3% 9.2% 9.8% 8.2%<br />
1984-1993 17.2% 17.3% 14.8% 2.5% 2.5% 8.9% 8.4% 8.4%<br />
1985-1994 14.2% 13.5% 12.5% 1.8% 1.0% 8.3% 5.9% 5.1%<br />
1986-1995 15.3% 14.0% 12.5% 2.8% 1.5% 8.0% 7.3% 6.1%<br />
1987-1996 13.9% 11.2% 10.0% 3.9% 1.2% 7.7% 6.2% 3.5%<br />
1988-1997 16.8% 14.6% 11.8% 5.0% 2.8% 7.6% 9.3% 7.0%<br />
1989-1998 14.5% 15.2% 12.2% 2.3% 3.0% 7.2% 7.2% 8.0%<br />
1990-1999 10.0% 10.2% 9.5% 0.5% 0.7% 6.9% 3.1% 3.2%<br />
1991-2000 12.7% 15.8% 11.0% 1.7% 4.8% 6.8% 5.9% 9.1%<br />
1992-2001 11.0% 12.3% 9.4% 1.6% 2.9% 6.5% 4.6% 5.8%<br />
1993-2002 9.8% 10.6% 10.4% -0.6% 0.2% 6.3% 3.5% 4.3%<br />
1994-2003 10.1% 11.2% 8.7% 1.3% 2.5% 6.1% 4.0% 5.1%<br />
1995-2004 12.8% 14.1% 10.4% 2.4% 3.7% 5.9% 6.8% 8.2%<br />
1996-2005 9.6% 11.9% 8.0% 1.6% 3.9% 5.6% 3.9% 6.2%<br />
1997-2006 10.7% 13.7% 8.2% 2.5% 5.5% 5.5% 5.2% 8.2%<br />
1998-2007 8.8% 12.4% 7.6% 1.2% 4.8% 5.3% 3.5% 7.1%<br />
1999-2008 9.6% 7.4% 8.9% 0.8% -1.4% 5.2% 4.5% 2.3%<br />
Source: Ibbotson Associates, Stocks, Bonds, Bills and Inflation: <strong>2009</strong> Yearbook;<br />
www.standardandpoors.com, Mergent Corporate News Reports,<br />
www.federal reserve.com<br />
10-YEAR ROLLING AVERAGE RETURNS FOR<br />
U.S. UTILITIES AND GOVERNMENT BONDS
Schedule 15<br />
Moody's Average<br />
Forecast Forecast Return Market/<br />
Common Equity On Average Dividend Payout Research<br />
Common<br />
Business Book<br />
Ratio Common Equity Forecast Insight Equity Ratio Risk Debt Debt Ratio<br />
Safety 2012-2014 2012-2014 2012-2014 Beta Beta 1/<br />
2008 Profile Rating Rating 2/<br />
AGL Resources 2 55.0% 15.2% 58.8% 0.75 0.312 39.4% Excellent A- Baa1 1.36<br />
Consolidated Edison 1 53.5% 9.0% 64.2% 0.65 0.339 48.5% Excellent A- A2 1.08<br />
Dominion Resources 2 47.5% 15.0% 55.0% 0.65 0.565 36.3% Excellent A- Baa2 1.89<br />
Duke Energy 2 53.5% 8.4% 73.3% NMF 0.395 59.2% Excellent A- Baa2 0.87<br />
FPL 1 45.0% 14.6% 38.3% 0.75 0.683 40.6% Excellent A A2 1.70<br />
New Jersey Resources 1 67.0% 11.4% 49.1% 0.65 0.200 51.2% Excellent A A1 2.12<br />
Northwest Nat. Gas 1 53.0% 11.6% 58.0% 0.60 0.395 45.3% Excellent AA- A3 1.79<br />
NSTAR 1 51.5% 15.0% 60.0% 0.65 0.351 36.8% Excellent A+ A2 1.95<br />
Piedmont Natural Gas 2 53.0% 14.0% 58.1% 0.65 0.328 41.9% Excellent A A3 2.14<br />
Scana 2 42.0% 10.9% 60.0% 0.65 0.630 39.3% Excellent A- Baa1 1.24<br />
Southern Co. 1 44.0% 13.8% 66.7% 0.55 0.465 40.5% Excellent A A3 1.88<br />
Vectren 2 52.0% 10.5% 64.3% 0.75 0.358 42.2% Excellent A- Baa1 1.37<br />
WGL Holdings Inc. 1 64.5% 10.6% 58.2% 0.65 0.323 51.7% Excellent AA- A2 1.53<br />
Mean 1 52.4% 12.3% 58.8% 0.66 0.41 44.1% Excellent A A3 1.61<br />
Median 1 53.0% 11.6% 58.8% 0.65 0.36 41.9% Excellent A A3 1.70<br />
1/ Calculated using monthly data against the S&P 500 (60 months ending March <strong>2009</strong>).<br />
2/ Rating for WGL Holdings is Washington Gas Light.<br />
INDIVIDUAL COMPANY RISK DATA FOR BENCHMARK SAMPLE OF<br />
U.S. GAS AND ELECTRIC UTILITIES<br />
Value Line S & P<br />
Source: Standard and Poor's Research Insight, Value Line (February and March <strong>2009</strong>), www.Moodys.com,<br />
Standard and Poor's, Issuer Ranking: U.S. Regulated Electric <strong>Utilities</strong>, Strongest To Weakest (March 31, <strong>2009</strong>) and<br />
Standard and Poor's, Issuer Ranking: U.S. Natural Gas Distributors And Integrated Gas Companies, Strongest To Weakest (March 10, <strong>2009</strong>).<br />
2008
Schedule 16<br />
Annualized Average Monthly DCF<br />
Last Paid High/Low Prices Expected Average I/B/E/S Cost of<br />
Company Dividend Jan <strong>2009</strong>-Mar <strong>2009</strong> Dividend Yield 1/<br />
Long-Term EPS Forecasts Equity 2/<br />
(1) (2) (3) (4) (5)<br />
AGL Resources 1.72 29.30 6.1 4.3 10.4<br />
Consolidated Edison 2.36 38.41 6.3 2.5 8.8<br />
Dominion Resources 1.75 32.69 5.8 7.8 13.5<br />
Duke Energy 0.92 14.35 6.7 4.5 11.1<br />
FPL 1.89 48.70 4.3 9.6 13.9<br />
New Jersey Resources 1.24 36.57 3.6 7.0 10.6<br />
Northwest Nat. Gas 1.58 42.36 3.9 4.8 8.7<br />
NSTAR 1.50 32.61 4.9 6.0 10.9<br />
Piedmont Natural Gas 1.08 25.89 4.5 7.1 11.6<br />
Scana 1.88 32.05 6.1 4.6 10.7<br />
Southern Co. 1.68 32.11 5.5 5.4 10.9<br />
Vectren 1.34 22.87 6.3 7.2 13.5<br />
WGL Holdings Inc. 1.42 32.05 4.6 4.0 8.6<br />
Mean 1.57 32.30 5.3 5.7 11.0<br />
Median 1.58 32.11 5.5 5.4 10.9<br />
1/ Expected Dividend Yield = (Col (1) / Col (2)) * (1 + Col (4))<br />
2/ Expected Dividend Yield (Col (3)) + I/B/E/S Growth Forecast (Col (4))<br />
DCF COST OF EQUITY FOR BENCHMARK SAMPLE OF<br />
U.S. GAS AND ELECTRIC UTILITIES<br />
(BASED ON ANALYSTS' EARNINGS GROWTH FORECASTS)<br />
Source: Standard and Poor's Research Insight, Yahoo.com and I/B/E/S (March <strong>2009</strong>)
Schedule 17<br />
Annualized Average Monthly DCF<br />
Last Paid High/Low Prices Expected Value Line Cost of<br />
Company Dividend Jan <strong>2009</strong>-Mar <strong>2009</strong> Dividend Yield 1/<br />
EPS Growth Equity 2/<br />
(1) (2) (3) (4) (5)<br />
AGL Resources 1.72 29.30 6.0 3.0 9.0<br />
Consolidated Edison 2.36 38.41 6.2 1.0 7.2<br />
Dominion Resources 1.75 32.69 5.9 10.5 16.4<br />
Duke Energy 0.92 14.35 6.9 7.0 13.9<br />
FPL 1.89 48.70 4.3 10.5 14.8<br />
New Jersey Resources 1.24 36.57 3.6 5.5 9.1<br />
Northwest Nat. Gas 1.58 42.36 4.0 7.0 11.0<br />
NSTAR 1.50 32.61 4.9 7.5 12.4<br />
Piedmont Natural Gas 1.08 25.89 4.5 7.5 12.0<br />
Scana 1.88 32.05 6.1 4.0 10.1<br />
Southern Co. 1.68 32.11 5.5 4.5 10.0<br />
Vectren 1.34 22.87 6.2 6.0 12.2<br />
WGL Holdings Inc. 1.42 32.05 4.6 4.0 8.6<br />
Mean 1.57 32.30 5.3 6.0 11.3<br />
Median 1.58 32.11 5.5 6.0 11.0<br />
1/ Expected Dividend Yield = (Col (1) / Col (2)) * (1 + Col (4))<br />
2/ Expected Dividend Yield (Col (3)) + I/B/E/S Growth Forecast (Col (4))<br />
DCF COST OF EQUITY FOR BENCHMARK SAMPLE OF<br />
U.S. GAS AND ELECTRIC UTILITIES<br />
(BASED ON VALUE LINE LONG TERM EPS GROWTH RATES)<br />
Source: Standard and Poor's Research Insight and Value Line (Issue 1, February 27, <strong>2009</strong>; Issue 3, March 13, <strong>2009</strong>; Issue 5, March 27, <strong>2009</strong>)
DCF COSTS OF EQUITY FOR BENCHMARK SAMPLE OF<br />
U.S. GAS AND ELECTRIC UTILITIES<br />
(TWO-STAGE MODEL)<br />
Schedule 18<br />
Annualized Average Monthly Stage 1 Stage 2 DCF<br />
Last Paid High/Low Prices I/B/E/S GDP Cost of<br />
Company Dividend Jan <strong>2009</strong>-Mar <strong>2009</strong> EPS Forecasts Growth 1/<br />
(1) (2) (3) (4) (5)<br />
AGL Resources 1.72 29.30 4.3 5.0 10.9<br />
Consolidated Edison 2.36 38.41 2.5 5.0 10.8<br />
Dominion Resources 1.75 32.69 7.8 5.0 11.3<br />
Duke Energy 0.92 14.35 4.5 5.0 11.6<br />
FPL 1.89 48.70 9.6 5.0 9.9<br />
New Jersey Resources 1.24 36.57 7.0 5.0 8.8<br />
Northwest Nat. Gas 1.58 42.36 4.8 5.0 8.8<br />
NSTAR 1.50 32.61 6.0 5.0 10.0<br />
Piedmont Natural Gas 1.08 25.89 7.1 5.0 9.7<br />
Scana 1.88 32.05 4.6 5.0 11.0<br />
Southern Co. 1.68 32.11 5.4 5.0 10.5<br />
Vectren 1.34 22.87 7.2 5.0 11.7<br />
WGL Holdings Inc. 1.42 32.05 4.0 5.0 9.4<br />
Mean 1.57 32.30 5.7 5.0 10.3<br />
Median 1.58 32.11 5.4 5.0 10.5<br />
1/ Forecast nominal rate of GDP growth, 2010-19<br />
2/ Internal Rate of Return: average I/B/E/S EPS forecast growth rate applies for first 5 years; GDP growth thereafter.<br />
Source: Standard & Poor's Research Insight; www.yahoo.com; Blue Chip Economic Indicators (March <strong>2009</strong>); I/B/E/S (March <strong>2009</strong>)<br />
Equity 2/
Schedule 19<br />
Beta<br />
2007<br />
Equity Ratio 1991-2007<br />
Debt Ratings CBS Stock 2003-2007 2004-2008<br />
Based On Average Market<br />
Company Name S&P DBRS Rating Raw Adjusted Raw Adjusted Total <strong>Capital</strong> To Book Ratio<br />
ANDREW PELLER LTD Average 0.55 0.70 0.56 0.70 47.9% 1.33<br />
ASTRAL MEDIA INC -CL A Very Conservative 0.60 0.73 0.56 0.70 100.0% 1.65<br />
CANADIAN NATIONAL RAILWAY CO A- A (low) Very Conservative 0.97 0.98 0.46 0.64 64.4% 2.02<br />
CANADIAN PACIFIC RAILWAY LTD BBB BBB Very Conservative 0.70 0.80 0.69 0.79 55.3% 1.46<br />
CANADIAN TIRE CORP -CL A BBB+ A (low) Very Conservative 0.84 0.89 0.53 0.68 65.9% 1.64<br />
COGECO INC -SUB VTG Very Conservative 0.60 0.73 1.01 1.01 27.0% 1.13<br />
FINNING INTERNATIONAL INC BBB+ A (low) Conservative 0.83 0.88 1.03 1.02 57.6% 1.95<br />
JEAN COUTU GROUP Very Conservative 0.59 0.73 0.33 0.55 89.6% 2.72<br />
LEON'S FURNITURE LTD Average 0.59 0.72 0.71 0.80 99.9% 2.41<br />
LINAMAR CORP Conservative 0.69 0.79 1.22 1.15 65.3% 2.35<br />
LOBLAW COMPANIES LTD BBB BBB Very Conservative 0.73 0.82 0.22 0.48 54.1% 2.96<br />
MAGNA INTERNATIONAL -CL A BBB A Conservative 0.99 0.99 0.80 0.87 91.5% 1.62<br />
MAPLE LEAF FOODS INC Very Conservative 0.30 0.53 0.09 0.39 56.8% 2.02<br />
METRO INC -CL A BBB BBB Very Conservative 0.80 0.86 0.29 0.52 64.9% 2.15<br />
NEWFOUNDLAND CAP CORP -CL A Average 0.03 0.35 0.04 0.36 62.8% 1.41<br />
REITMANS (CANADA) -CL A Average 1.12 1.08 0.85 0.90 97.0% 1.61<br />
RICHELIEU HARDWARE LTD Average 0.41 0.60 0.39 0.59 96.8% 2.47<br />
SAPUTO INC Very Conservative 0.37 0.58 0.31 0.54 78.3% 3.14<br />
SHAW COMMUNICATIONS INC-CL B BBB- BBB (low) Very Conservative 0.40 0.59 0.41 0.60 39.4% 2.61<br />
SNC-LAVALIN GROUP INC BBB+ BBB (high) Very Conservative 0.55 0.70 0.97 0.98 30.6% 2.85<br />
THOMSON-REUTERS CORP (CDN) A- A (low) Very Conservative 0.46 0.64 0.34 0.56 73.0% 2.53<br />
TOROMONT INDUSTRIES LTD BBB Average 0.79 0.86 0.74 0.83 74.0% 2.62<br />
TORSTAR CORP -CL B BBB Conservative 0.28 0.52 0.50 0.66 58.4% 2.10<br />
TRANSCONTINENTAL INC -CL A BBB BBB (high) Very Conservative 0.88 0.92 0.76 0.84 68.7% 1.51<br />
TVA GROUP INC -CL B Average 0.55 0.70 0.95 0.97 78.5% 2.06<br />
UNI-SELECT INC Average 0.42 0.61 0.43 0.62 70.4% 2.14<br />
WESTON (GEORGE) LTD BBB BBB Very Conservative 0.59 0.73 -0.22 0.18 32.7% 2.52<br />
Mean BBB BBB(high) Conservative 0.61 0.74 0.55 0.70 66.7% 2.11<br />
Median BBB BBB/BBB(high) Very Conservative 0.59 0.73 0.53 0.68 65.3% 2.10<br />
Source: Standard and Poor's Research Insight, DBRS and The Blue Book of CBS Stock Reports.<br />
RISK MEASURES FOR 27 LOW RISK UNREGULATED CANADIAN COMPANIES
Schedule 20<br />
Company Name 1991 1992 1993 1994 1995 1996 1997 1998 1999 2000 2001 2002 2003 2004 2005 2006 2007<br />
Average<br />
1991-2007<br />
ANDREW PELLER LTD 10.1 9.3 9.0 10.0 12.3 13.8 13.1 10.3 18.7 6.2 7.9 9.8 12.4 10.1 6.9 10.2 11.5 10.7<br />
ASTRAL MEDIA INC -CL A 6.3 4.8 5.8 7.0 1.3 -9.5 7.1 7.8 6.4 4.4 8.2 10.0 10.0 10.9 12.1 13.1 13.0 7.0<br />
CANADIAN NATIONAL RAILWAY CO -0.4 -33.4 -3.2 9.7 -43.7 6.1 13.9 2.8 12.6 14.4 12.5 8.9 11.2 18.8 18.8 21.9 21.6 5.4<br />
CANADIAN PACIFIC RAILWAY LTD -12.6 -7.4 -3.1 6.1 -13.0 13.5 18.0 10.3 7.3 20.2 6.6 15.2 11.3 10.8 13.0 17.2 18.3 7.7<br />
CANADIAN TIRE CORP -CL A 11.9 6.4 6.9 0.5 10.2 10.4 11.4 13.0 11.2 10.6 11.5 11.9 12.8 13.6 13.9 13.4 14.2 10.8<br />
COGECO INC -SUB VTG -2.4 0.7 21.9 6.8 3.0 0.0 10.8 11.3 25.1 3.5 25.3 12.5 2.9 -3.1 -6.3 7.4 21.0 8.3<br />
FINNING INTERNATIONAL INC 1.1 0.7 6.5 14.9 16.3 16.0 16.2 0.5 8.7 10.5 14.1 15.5 14.0 10.1 12.0 13.4 17.2 11.0<br />
JEAN COUTU GROUP 20.3 18.5 10.1 17.0 15.2 16.2 15.3 15.5 15.7 14.9 15.7 16.6 16.2 8.9 6.6 8.0 -14.3 12.7<br />
LEON'S FURNITURE LTD 14.6 11.4 16.4 15.3 14.0 13.4 15.1 16.7 21.1 19.3 17.3 17.1 16.5 18.9 19.2 19.6 19.2 16.8<br />
LINAMAR CORP 14.1 18.1 20.5 27.7 22.3 29.0 36.9 21.9 14.7 15.7 7.8 9.7 6.5 14.0 13.6 12.3 12.6 17.5<br />
LOBLAW COMPANIES LTD 13.2 8.7 9.6 12.4 13.3 14.2 15.3 12.8 13.7 15.7 16.8 18.9 19.1 19.1 13.2 -3.9 6.0 12.8<br />
MAGNA INTERNATIONAL -CL A 6.6 22.8 19.6 21.7 21.8 15.8 21.6 12.3 12.0 15.9 14.7 11.8 9.5 13.3 10.5 7.7 7.8 14.4<br />
MAPLE LEAF FOODS INC 8.8 7.9 7.3 7.5 -6.7 14.8 14.7 -6.3 17.9 8.0 10.3 12.2 4.8 13.0 9.9 0.5 19.2 8.5<br />
METRO INC -CL A 6.1 7.3 13.0 16.2 22.6 22.8 24.7 20.5 20.8 22.8 24.1 23.9 23.8 21.0 16.1 15.6 15.1 18.6<br />
NEWFOUNDLAND CAP CORP -CL A -21.0 -39.8 17.7 19.4 8.6 9.0 62.1 45.1 4.7 3.3 -5.6 12.7 7.9 12.2 7.1 13.8 20.7 10.5<br />
REITMANS (CANADA) -CL A 9.4 15.4 11.1 9.0 6.2 0.8 8.9 9.4 30.1 10.2 12.6 10.5 15.4 22.0 23.5 20.0 24.7 14.1<br />
RICHELIEU HARDWARE LTD NA NA NA 17.4 10.9 11.6 15.5 16.5 17.4 19.8 19.9 21.8 21.2 20.5 18.4 18.3 17.2 17.6<br />
SAPUTO INC NA NA NA NA NA 37.3 18.9 19.3 18.6 16.0 19.4 18.1 19.5 18.8 14.1 16.2 18.3 19.5<br />
SHAW COMMUNICATIONS INC-CL B 12.9 11.5 11.5 10.2 6.2 11.8 2.9 -0.1 1.9 5.5 -8.4 -14.1 -4.5 2.8 7.7 27.2 20.4 6.2<br />
SNC-LAVALIN GROUP INC 3.2 5.6 8.9 13.1 13.8 15.8 14.5 14.3 10.7 6.7 6.6 38.9 13.8 15.1 17.2 18.7 16.7 13.7<br />
THOMSON-REUTERS CORP (CDN) 9.9 6.0 10.0 14.6 22.4 14.2 12.9 34.7 8.0 17.9 10.2 7.3 8.8 10.3 9.3 11.0 31.1 14.0<br />
TOROMONT INDUSTRIES LTD 14.0 13.6 20.7 30.6 27.1 24.3 47.5 22.5 16.6 15.4 16.4 12.7 16.9 17.8 17.6 19.0 20.0 20.8<br />
TORSTAR CORP -CL B -0.6 8.4 -1.7 7.9 6.7 11.3 38.4 -0.7 12.8 5.4 -14.6 21.3 17.8 14.6 14.5 9.2 11.3 9.5<br />
TRANSCONTINENTAL INC -CL A 0.3 8.1 9.3 8.1 9.3 0.8 10.6 11.2 11.4 13.7 4.0 18.9 17.5 13.9 13.3 12.2 10.3 10.2<br />
TVA GROUP INC -CL B -17.9 2.1 9.4 0.3 9.2 10.4 15.0 20.5 19.8 16.4 -49.5 27.0 23.7 20.9 12.9 -1.7 19.4 8.1<br />
UNI-SELECT INC NA NA NA 24.7 21.4 19.9 20.7 20.6 18.7 15.2 16.1 16.7 19.2 15.5 16.3 15.4 13.7 18.2<br />
WESTON (GEORGE) LTD 7.0 3.2 4.5 8.7 12.9 15.1 14.5 37.3 14.0 17.4 18.5 18.3 19.4 10.2 16.2 1.6 12.7 13.6<br />
Mean 4.8 4.6 10.1 12.9 9.4 13.3 19.1 14.8 14.5 12.8 8.8 15.0 13.6 13.9 12.9 12.5 15.5 12.5<br />
Median 6.8 7.6 9.5 11.3 11.6 13.8 15.1 13.0 14.0 14.9 12.5 15.2 14.0 13.9 13.3 13.4 17.2 12.7<br />
Average of Annual Medians 12.8<br />
Source: Standard and Poor's Research Insight.<br />
RETURNS ON AVERAGE COMMON STOCK EQUITY FOR<br />
27 LOW RISK UNREGULATED CANADIAN COMPANIES
RISK MEASURES AND RETURNS ON EQUITY FOR 81 LOW RISK UNREGULATED U.S. COMPANIES<br />
Schedule 21<br />
Page 1 of 2<br />
Value Line<br />
Return on<br />
Average Value Line Forecast<br />
Equity Ratio Equity Ratio Common Return on Average 1991-2007<br />
Earnings Financial (Total <strong>Capital</strong>) (Total <strong>Capital</strong>) Equity Common Equity Average Market<br />
Company Name S&P Debt Rating Safety Predictability Strength Beta 2006 2007 1991-2007 2011-2013 To Book Ratio<br />
3M CO AA 1 80 A++ 0.75 73% 70% 26.9 31.5 5.5<br />
AARON RENTS INC 3 65 B++ 0.80 82% 78% 13.1 2.0<br />
ABM INDUSTRIES INC 3 90 B++ 0.95 100% 100% 13.4 11.9 1.9<br />
ACETO CORP 3 60 B++ 0.85 100% 100% 10.1 1.4<br />
ARDEN GROUP INC -CL A 3 65 B++ 0.55 98% 99% 15.7 2.3<br />
BOB EVANS FARMS 3 55 B++ 0.90 77% 67% 11.4 12.2 1.8<br />
BROWN-FORMAN -CL B A 1 100 A+ 0.70 57% 63% 24.0 20.1 4.5<br />
CASEYS GENERAL STORES INC 3 70 B 0.75 70% 75% 11.9 12.9 2.1<br />
CATO CORP -CL A 3 65 B++ 0.95 100% 100% 18.1 18.8 2.6<br />
CLARCOR INC 3 100 B++ 0.95 97% 97% 17.2 13.7 2.7<br />
COCA-COLA ENTERPRISES INC A 3 5 B 0.90 31% 38% 4.9 12.8 2.8<br />
CONAGRA FOODS INC BBB+ 2 75 A 0.65 57% 57% 17.1 16.4 3.4<br />
COURIER CORP 3 65 B+ 0.95 91% 92% 11.9 1.5<br />
CSS INDUSTRIES INC 3 75 B+ 0.95 90% 93% 13.2 1.4<br />
CVS CAREMARK CORP BBB+ 2 95 A 0.80 65% 75% 10.4 11.7 3.2<br />
ENNIS INC 3 95 B++ 0.95 78% 79% 19.8 2.5<br />
FAMILY DOLLAR STORES 3 90 A 0.60 83% 82% 19.0 15.9 3.5<br />
FARMER BROS CO 3 10 B++ 0.95 100% 100% 8.2 1.4<br />
FEDEX CORP BBB+ 2 80 B++ 0.85 83% 88% 11.7 14.5 2.3<br />
FLEXSTEEL INDUSTRIES INC 3 45 B+ 0.40 77% 80% 7.8 1.1<br />
FLOWERS FOODS INC BBB- 3 60 B 0.70 87% 96% 9.4 16.6 2.7<br />
FORTUNE BRANDS INC BBB+ 2 85 B++ 0.95 45% 56% 13.1 10.3 2.3<br />
FRISCH'S RESTAURANTS INC 3 70 B++ 0.65 73% 77% 9.5 1.4<br />
G&K SERVICES INC -CL A 3 90 B+ 0.85 72% 73% 12.8 7.2 2.7<br />
GENERAL DYNAMICS CORP A 1 100 A++ 0.90 78% 81% 24.6 18.0 2.8<br />
GENUINE PARTS CO 1 100 A++ 0.80 84% 84% 17.9 21.2 2.9<br />
HASBRO INC BBB+ 3 40 B++ 0.80 75% 62% 10.9 21.0 2.2<br />
HAVERTY FURNITURE 3 40 B 0.75 85% 91% 8.9 1.2<br />
HEALTHCARE SERVICES GROUP 3 90 B++ 0.75 100% 100% 9.4 2.0<br />
HEARTLAND EXPRESS INC 3 75 B++ 0.85 100% 100% 19.8 16.9 4.1<br />
HOME DEPOT INC BBB+ 1 75 A++ 0.95 68% 57% 19.7 15.1 5.8<br />
HORMEL FOODS CORP A 1 100 A 0.70 84% 82% 16.8 13.5 2.8<br />
ILLINOIS TOOL WORKS AA- 1 100 A++ 0.95 86% 80% 18.6 22.2 3.5<br />
INTL SPEEDWAY CORP -CL A BBB+ 3 85 B+ 0.90 76% 75% 17.1 10.6 3.4<br />
KIMBERLY-CLARK CORP A 1 100 A++ 0.55 63% 49% 25.2 35.9 5.2<br />
LANCASTER COLONY CORP 1 90 A+ 0.75 98% 90% 21.1 19.8 3.1<br />
LANCE INC 3 55 B+ 0.75 82% 83% 11.6 14.2 2.7<br />
LOCKHEED MARTIN CORP A- 1 90 A++ 0.80 61% 69% 14.4 32.6 2.9<br />
MATTEL INC BBB- 3 80 B++ 0.85 78% 71% 19.7 29.7 4.2<br />
MATTHEWS INTL CORP -CL A 3 100 B+ 0.90 73% 72% 19.3 17.3 3.3<br />
MCCORMICK & COMPANY INC A- 2 100 A 0.60 59% 60% 24.8 23.4 5.1
RISK MEASURES AND RETURNS ON EQUITY FOR 81 LOW RISK UNREGULATED U.S. COMPANIES<br />
Schedule 21<br />
Page 2 of 2<br />
Return on Value Line<br />
Value Line<br />
Average Forecast Return on<br />
Equity Ratio Equity Ratio Common Average Common 1991-2007<br />
Earnings Financial (Total <strong>Capital</strong>) (Total <strong>Capital</strong>) Equity<br />
Equity<br />
Average Market<br />
Company Name S&P Debt Rating Safety Predictability Strength Beta 2006 2007 1991-2007 2011-2013 To Book Ratio<br />
MCDONALD'S CORP A 1 90 A++ 0.75 65% 62% 17.9 30.2 3.6<br />
MEREDITH CORP 2 80 B++ 0.90 55% 64% 18.7 12.9 3.7<br />
MOLSON COORS BREWING CO BBB+ 3 NMF B+ 0.55 73% 76% 8.2 9.6 1.6<br />
MULTI-COLOR CORP 3 75 B+ 0.95 93% 48% 8.1 3.0<br />
NIKE INC -CL B A+ 1 95 A+ 0.90 93% 93% 21.2 23.4 3.9<br />
NORTHROP GRUMMAN CORP BBB+ 1 85 A+ 0.75 79% 80% 10.9 12.4 1.5<br />
OMNICOM GROUP A- 2 100 B++ 0.95 56% 57% 24.3 28.3 5.6<br />
OTTER TAIL CORP BBB- 2 75 A 0.90 61% 53% 14.1 9.6 2.1<br />
PEPSIAMERICAS INC A 3 85 B 0.85 49% 46% 11.8 13.5 2.9<br />
PEPSICO INC A+ 1 100 A++ 0.60 85% 79% 29.4 31.1 7.0<br />
PROCTER & GAMBLE CO AA- 1 100 A++ 0.55 62% 65% 26.7 17.9 6.2<br />
RAYTHEON CO A- 1 65 A+ 0.70 74% 85% 9.8 14.6 1.7<br />
ROLLINS INC 3 90 B++ 0.80 100% 99% 23.1 28.0 6.4<br />
ROSS STORES INC BBB+ 3 85 A 0.90 86% 87% 25.9 29.2 3.7<br />
RUDDICK CORP 3 95 B+ 0.60 73% 73% 11.3 11.8 1.7<br />
SEABOARD CORP 3 5 B++ 0.90 82% 86% 11.8 1.1<br />
SHERWIN-WILLIAMS CO A- 2 95 A 0.75 69% 65% 19.7 23.9 3.2<br />
SMITH (A O) CORP 3 60 B+ 0.90 61% 66% 12.2 10.5 1.5<br />
SMUCKER (JM) CO 2 90 A 0.65 81% 70% 11.7 11.1 2.2<br />
SOUTHWEST AIRLINES BBB+ 3 55 B+ 0.90 79% 77% 12.4 9.7 2.7<br />
STANDEX INTERNATIONAL CORP 3 70 B+ 0.95 63% 55% 16.1 13.9 2.2<br />
SYSCO CORP AA- 1 95 A++ 0.65 63% 65% 26.1 37.5 6.2<br />
TANDY BRANDS ACCESSORIES INC 3 10 B+ 0.65 88% 95% 9.3 1.3<br />
TOOTSIE ROLL INDUSTRIES INC 1 90 A+ 0.70 99% 99% 15.1 7.3 3.5<br />
UNIFIRST CORP 3 90 B+ 0.80 68% 71% 11.3 10.2 1.7<br />
UNITED PARCEL SERVICE INC AA- 1 95 A 0.75 79% 53% 20.5 37.2 5.9<br />
UNITED TECHNOLOGIES CORP A 1 100 A++ 0.95 69% 70% 18.1 17.1 3.4<br />
UNIVERSAL CORP/VA BBB- 3 50 B++ 0.75 47% 55% 15.5 11.2 1.9<br />
VF CORP A- 2 100 A 0.95 80% 74% 17.0 16.9 2.3<br />
VILLAGE SUPER MARKET -CL A 3 90 B++ 0.75 82% 86% 7.3 0.7<br />
WALGREEN CO A+ 1 100 A+ 0.75 94% 90% 19.0 15.1 5.7<br />
WAL-MART STORES INC AA 1 100 A++ 0.60 61% 59% 21.9 18.9 5.0<br />
WASHINGTON POST -CL B A+ 1 55 A+ 0.85 88% 87% 14.9 7.1 3.1<br />
WASTE MANAGEMENT INC BBB+ 2 100 A 0.85 43% 41% 10.8 21.1 3.4<br />
WD-40 CO 3 85 B++ 0.80 71% 76% 34.8 19.8 5.9<br />
WEIS MARKETS INC 1 80 A 0.65 100% 100% 9.7 9.1 1.7<br />
WERNER ENTERPRISES INC 3 80 B++ 0.90 90% 100% 12.1 12.8 2.0<br />
WEYCO GROUP INC 3 80 B++ 0.90 93% 100% 14.0 1.5<br />
WILEY (JOHN) & SONS -CL A 3 95 B+ 0.90 35% 45% 21.8 19.5 4.7<br />
WOLVERINE WORLD WIDE 3 100 A 0.80 96% 98% 11.5 16.8 2.2<br />
Mean A- 2 79 A 0.80 77% 76% 15.9 17.8 3.0<br />
Median A- 3 85 B++ 0.80 78% 77% 14.9 16.4 2.7<br />
Average of Annual Medians 15.7<br />
Source: Standard and Poor's Research Insight, Value Line (www.valueline.com, February 27, <strong>2009</strong> and various issues)
Order/ Common Forecast<br />
Decision File Preferred Stock Equity 30-Year<br />
Date Regulator Number Debt Stock Equity Return Bond Yield<br />
(1) (2) (3) (4) (5) (6) (7) (8)<br />
Gas Distributors<br />
ATCO Gas 7/04; 11/07 EUB 2004-052; U2007-347 55.10 6.90 38.00 8.75 4.55<br />
Enbridge Gas Distribution Inc 1/04; 7/07; 2/08 OEB RP-2002-0158; EB-2006-0034; EB-2007-0615 61.33 2.67 36.00 8.39 4.23<br />
Gazifere 2/01; 12/08 Régie D-2008-153; D-2001-55 60.00 0.00 40.00 8.82 4.13<br />
Gaz Metropolitain 11/08 Régie D-2008-140 54.00 7.50 38.50 8.76 4.56<br />
Pacific Northern Gas 5/07; 11/08 BCUC G-55-07; L-55-08 56.20 3.80 40.00 9.12 4.35<br />
<strong>Terasen</strong> Gas 1/<br />
3/06; 11/08 BCUC G-14-06; L-55-08 64.99 0.00 35.01 8.47 4.35<br />
<strong>Terasen</strong> Gas (Vancouver Island) 3/06; 11/08 BCUC G-14-06; L-55-08 65.00 0.00 40.00 9.17 4.35<br />
Union Gas 1/04; 6/06; 1/08 OEB RP-2002-0158; EB-2005-0520; EB-2007-0606 60.60 3.40 36.00 8.54 4.23<br />
Electric <strong>Utilities</strong><br />
AltaLink 7/04; 11/07 EUB 2004-052; U2007-347 67.00 0.00 33.00 8.75 4.55<br />
ATCO Electric EUB<br />
Transmission 7/04; 11/07 2004-052; U2007-347 61.00 6.00 33.00 8.75 4.55<br />
Distribution 7/04; 11/07 2004-052; U2007-347 56.10 6.90 37.00 8.75 4.55<br />
EPCOR EUB<br />
Transmission 7/04; 11/07 2004-052; U2007-347 65.00 0.00 35.00 8.75 4.55<br />
Distribution 7/04; 11/07 2004-052; U2007-347 61.00 0.00 39.00 8.75 4.55<br />
FortisAlberta Inc. 7/04; 11/07 EUB 2004-052; U2007-347 63.00 0.00 37.00 8.75 4.55<br />
<strong>FortisBC</strong> Inc. 3/06; 11/08 BCUC G-14-06; L-55-08 60.00 0.00 40.00 8.87 4.35<br />
Hydro One Transmission 8/07 OEB EB-2006-0501 60.00 0.00 40.00 8.35 4.16<br />
Maritime Electric 2/09 IRAC UE-09-02 59.50 0.00 40.50 9.75 na<br />
Newfoundland Power 12/07 NLPub P.U.32 (2007) 54.01 1.15 44.84 8.95 4.60<br />
Nova Scotia Power 1/05;11/08 NSUARB 2005 NSUARB 27; 2008 NSUARB 140 53.30 9.20 37.50 9.35 na<br />
Ontario Electricity Distributors 12/06;2/09 OEB Report of the Board 60.00 0.00 40.00 8.01 2/<br />
3.71<br />
Ontario Power Generation 11/08 OEB EB-2007-0905 53.00 0.00 47.00 8.65 4.75<br />
Gas Pipelines<br />
Foothills Pipe Lines (Yukon) Ltd. 12/05; 11/08 NEB RH-2-94;TG-08-2005 64.00 0.00 36.00 8.57 4.35<br />
TCPL-BC System 2/06; 11/08 NEB RH-2-94;TG-02-2006 64.00 0.00 36.00 8.57 4.35<br />
TransCanada PipeLines 11/08; 5/07 NEB RH-2-94/RH-2-2004/TG-06-2007 60.00 0.00 40.00 8.57 4.35<br />
Trans Quebec & Maritimes Pipeline 3/<br />
3/09 NEB RH-1-2008 60.00 0.00 40.00 9.70 4.35<br />
Westcoast Energy 12/06; 11/08 NEB RH-2-94;TG-05-2006 64.00 0.00 36.00 8.57 4.35<br />
1/ The equity ratio reflect the impact of the amalgamation of TGI and Squamish Gas.<br />
2/ The OEB has initiated a process to review the reasonableness of the <strong>2009</strong> cost of capital values.<br />
3/ The NEB approved an after-tax weighted average cost of capital of 6.4%. The <strong>ROE</strong> of 9.7% and 40% equity ratio represent equivalent values cited by the NEB to facilitate comparisons.<br />
Source: Board Decisions.<br />
EQUITY RETURN AWARDS AND CAPITAL STRUCTURES ADOPTED BY<br />
REGULATORY BOARDS FOR CANADIAN UTILITIES<br />
(Percentages)<br />
Schedule 23<br />
Page 1 of 2
Gas Distributors<br />
Schedule 23<br />
Page 2 of 2<br />
1990 1991 1992 1993 1994 1995 1996 1997 1998 1999 2000 2001 2002 2003 2004 2005 2006 2007 2008 <strong>2009</strong><br />
ATCO Gas 13.25 13.25 12.25 12.25 NA NA NA 10.50 9.38 NA NA 9.75 9.75 9.50 9.50 9.50 8.93 8.51 8.75 na<br />
Enbridge Gas Distribution 13.25 13.13 13.13 12.30 11.60 11.65 11.88 11.50 10.30 9.51 9.73 9.54 9.66 9.69 NA 9.57 8.74 8.39 8.39 8.39<br />
Gaz Metro 14.25 14.25 14.00 12.50 12.00 12.00 12.00 11.50 10.75 9.64 9.72 9.60 9.67 9.89 9.45 9.69 8.95 8.73 9.05 8.76<br />
Pacific Northern Gas 15.00 14.00 13.25 NA 11.50 12.75 11.75 11.00 10.75 10.00 10.25 10.00 9.88 10.17 9.80 9.68 9.45 9.02 9.27 9.12<br />
<strong>Terasen</strong> Gas NA NA 12.25 NA 10.65 12.00 11.00 10.25 10.00 9.25 9.50 9.25 9.13 9.42 9.15 9.03 8.80 8.37 8.62 8.47<br />
Union Gas 13.75 13.50 13.50 13.00 12.50 11.75 11.75 11.00 10.44 9.61 9.95 9.95 9.95 9.95 9.62 9.62 8.89 8.54 8.54 8.54<br />
Mean of Gas Distributors 13.90 13.63 13.06 12.51 11.65 12.03 11.68 10.96 10.27 9.60 9.83 9.68 9.67 9.77 9.50 9.52 8.96 8.59 8.77 8.66<br />
Electric <strong>Utilities</strong><br />
AltaLink NA NA NA NA NA NA NA NA NA NA NA NA NA 9.40 9.60 9.50 8.93 8.51 8.75 na<br />
ATCO Electric 13.50 13.50 13.25 11.88 NA NA 11.25<br />
1/ 1/ 1/ 1/ 1/ 1/<br />
9.40 9.60 9.50 8.93 8.51 8.75 na<br />
FortisAlberta Inc. NA NA NA NA NA NA NA NA NA NA NA NA 9.50 9.50 9.60 9.50 8.93 8.51 8.75 na<br />
<strong>FortisBC</strong> Inc. 13.50 NA 11.75 11.50 11.00 12.25 11.25 10.50 10.25 9.50 10.00 9.75 9.53 9.82 9.55 9.43 9.20 8.77 9.02 8.87<br />
Newfoundland Power 13.95 13.25 NA NA NA NA 11.00 NA 9.25 9.25 9.59 9.59 9.05 9.75 9.75 9.24 9.24 8.60 8.95 8.95<br />
Nova Scotia Power NA NA NA 11.75 NA NA 10.75 NA NA NA NA NA 10.15 NA NA 9.55 9.55 9.55 na 9.35<br />
Ontario Electricity Distributors NA NA NA NA NA NA NA NA NA 9.35 9.88 9.88 9.88 9.88 9.88 9.88 9.00 9.00 8.57 8.01<br />
TransAlta <strong>Utilities</strong> 13.50 13.50 13.25 11.88 NA 12.25 11.25<br />
1/ 2/<br />
9.25 9.25 NA 9.40 NA NA NA NA NA na na<br />
Mean of Electric <strong>Utilities</strong> 13.61 13.42 12.75 11.75 11.00 12.25 11.10 10.50 9.75 9.34 9.68 9.74 9.59 9.63 9.66 9.51 9.11 8.78 8.80 8.80<br />
Gas Pipelines (NEB)<br />
TransCanada PipeLines 13.25 13.50 13.25 12.25 11.25 12.25 11.25 10.67 10.21 9.58 9.90 9.61 9.53 9.79 9.56 9.46 8.88 8.46 8.71 8.57<br />
Westcoast Energy 13.25 13.75 12.50 12.25 11.50 12.25 11.25 10.67 10.21 9.58 9.90 9.61 9.53 9.79 9.56 9.46 8.88 8.46 8.71 8.57<br />
Mean of Gas Pipelines 13.25 13.63 12.88 12.25 11.38 12.25 11.25 10.67 10.21 9.58 9.90 9.61 9.53 9.79 9.56 9.46 8.88 8.46 8.71 8.57<br />
Mean of All Companies 13.68 13.56 12.94 12.16 11.50 12.13 11.36 10.84 10.15 9.50 9.79 9.68 9.62 9.71 9.59 9.51 9.02 8.66 8.77 8.69<br />
1/ Negotiated settlement, details not available.<br />
2/ Negotiated settlement, implicit <strong>ROE</strong> made public is 10.5%.<br />
Source: Regulatory Decisions<br />
RATES OF RETURN ON COMMON EQUITY ADOPTED BY<br />
REGULATORY BOARDS FOR CANADIAN UTILITIES
ESTIMATE OF MARKET VALUE CAPITAL STRUCTURES FOR CANADIAN UTILITIES<br />
Schedule 24<br />
Page 1 of 3<br />
Stock Price<br />
Book Value<br />
Total <strong>Capital</strong> Market Value Market Value<br />
(Average Monthly<br />
High/Low Jan <strong>2009</strong>-<br />
Book Value Per Share Common Equity Ratio Common Equity Ratio Debt Ratio<br />
Company Mar <strong>2009</strong>)<br />
Year End 2008 Market/Book Ratio Year End 2008 (Debt at Par)<br />
(1) (2) (3) = (1)/(2) (4) (5)=[(4)*(3)]/[(4)*(3)+(1-(4))] 1.0-Col.( 7)<br />
CANADIAN UTILITIES -CL A 39.39 21.92 1.80 41.2% 55.8% 44.2%<br />
EMERA INC 20.79 13.78 1.51 40.7% 50.9% 49.1%<br />
ENBRIDGE INC 39.28 17.41 2.26 34.4% 54.1% 45.9%<br />
FORTIS INC 23.44 18.00 1.30 31.6% 37.6% 62.4%<br />
TRANSCANADA CORP 32.01 20.92 1.53 39.1% 49.5% 50.5%<br />
Mean 37.4% 49.6% 50.4%<br />
Sources: Standard & Poor's Research Insight
Formula for After-Tax Weighted Average Cost of <strong>Capital</strong>:<br />
WACC AT = (Debt Cost)(1-tax rate)(Debt Ratio) + (Equity Cost)(Equity Ratio)<br />
APPROACH 1:<br />
The after-tax weighted average cost of capital (WACCAT) is invariant to changes in the capital structure. The cost of equity increases as leverage (debt ratio) increases, but the<br />
WACCAT stays the same.<br />
ASSUMPTIONS:<br />
STEPS:<br />
QUANTIFICATION OF IMPACT ON EQUITY RETURN REQUIREMENT FOR DIFFERENCE<br />
BETWEEN MARKET VALUE AND BOOK VALUE CAPITAL STRUCTURES:<br />
CANADIAN UTILITIES<br />
WACC AT(LL) = WACC AT(ML)<br />
Where LL = less levered (lower debt ratio)<br />
ML = more levered (higher debt ratio)<br />
Debt Cost = Current Cost of Long Term Debt for A rated utility<br />
= 6.625%<br />
Equity Cost = CAPM Cost of Equity<br />
= 8.75%<br />
Tax Rate = 28.5%<br />
CEQ Ratio (1) 49.6%<br />
Debt Ratio (1) 50.4%<br />
CEQ Ratio (2) 37.4%<br />
Debt Ratio (2) 62.6%<br />
1. Estimate WACCAT for the less levered sample (common equity ratio of 49.6%)<br />
WACCAT = (6.625%)(1-.285)(50.4%) + (8.75%)(49.6%)<br />
= 6.73%<br />
2. Estimate Cost of Equity for sample at 37.4% common equity ratio with WACCAT unchanged at 6.73%<br />
WACC AT = (Debt Cost)(1-tax rate)(Debt Ratio) + (Equity Cost)(Equity Ratio)<br />
6.73% = (6.6%)(1-.285)(62.6%) + (X)(37.4%)<br />
Cost of Equity at 37.4% Equity Ratio = 10.06%<br />
3. Difference between Equity Return at 49.6% and 37.4% common equity ratios:<br />
10.06% - 8.75% = 1.31% (131 basis points)<br />
Schedule 24<br />
Page 2 of 3
APPROACH 2:<br />
ASSUMPTIONS:<br />
STEPS:<br />
After-Tax Cost of <strong>Capital</strong> Falls as Debt Ratio Increases; Cost of Equity Increases<br />
WACC AT(LL) = WACC AT(ML) x (1-tD LL)<br />
Where LL,ML as before<br />
t = tax rate<br />
D = debt ratio<br />
(1-tD ML)<br />
Debt Cost = Current Cost of Long Term Debt for A rated utility<br />
= 6.625%<br />
Equity Cost = Cost of Equity<br />
= 8.75%<br />
Tax Rate = 28.5%<br />
CEQ Ratio (1) 49.6%<br />
Debt Ratio (1) 50.4%<br />
CEQ Ratio (2) 37.4%<br />
Debt Ratio (2) 62.6%<br />
1. Estimate WACCAT for less levered sample (common equity ratio of 49.6%)<br />
WACCAT = (6.625%)(1-.285)(50.4%) + (8.75%)(49.6%)<br />
= 6.73%<br />
2. Estimate WACCAT for more levered firm (common equity ratio of 37.4%)<br />
WACCAT(ML) = WACCAT(LL) x (1-t x Debt RatioML)/(1-t x Debt RatioLL) WACC AT(ML) = 6.73% x (1-.285 x 62.6%)<br />
(1-.285 x 50.4%)<br />
WACC AT(ML) = 6.45%<br />
3. Estimate Cost of Equity at new WACCAT for more levered firm:<br />
WACCAT(ML) = (Debt Cost)(1-tax rate)(Debt RatioML) + (Equity Cost)(Equity RatioML) 6.45% = (6.625%)(1-.285)(62.6%) + (X)(37.4%)<br />
Cost of Equity at 37.4% Equity Ratio = 9.33%<br />
4. Difference between Equity Return at 49.6% and 37.40% common equity ratios:<br />
9.33% - 8.75% = 0.58% (58 basis points)<br />
ESTIMATE OF IMPACT OF CHANGE IN CAPITAL STRUCTURE ON COST OF EQUITY<br />
60-130 Basis Points (Midpoint of 100)<br />
Schedule 24<br />
Page 3 of 3
ESTIMATE OF MARKET VALUE CAPITAL STRUCTURES FOR BENCHMARK SAMPLE OF U.S. GAS AND ELECTRIC UTILITIES<br />
Schedule 25<br />
Page 1 of 3<br />
Book Value<br />
Average Monthly Total <strong>Capital</strong> Market Value Market Value<br />
High/Low Prices Book Value Per Share Common Equity Ratio Common Equity Ratio Debt Ratio<br />
Company Jan <strong>2009</strong>-Mar <strong>2009</strong> Year End 2008 Market/Book Ratio 2008 (Debt at Par)<br />
(2) (2) (3) = (1)/(2) (4) (5)=[(4)*(3)]/[(4)*(3)+(1-(4))] 1.0-Col.( 7)<br />
AGL RESOURCES INC 29.30 21.48 1.36 39.4% 47.0% 53.0%<br />
CONSOLIDATED EDISON INC 38.41 35.43 1.08 48.5% 50.5% 49.5%<br />
DOMINION RESOURCES INC 32.69 17.28 1.89 36.3% 51.9% 48.1%<br />
DUKE ENERGY CORP 14.35 16.50 0.87 59.2% 55.8% 44.2%<br />
FPL GROUP INC 48.70 28.57 1.70 40.6% 53.8% 46.2%<br />
NEW JERSEY RESOURCES CORP 36.57 17.29 2.12 51.2% 68.9% 31.1%<br />
NORTHWEST NATURAL GAS CO 42.36 23.71 1.79 45.3% 59.6% 40.4%<br />
NSTAR 32.61 16.74 1.95 36.8% 53.2% 46.8%<br />
PIEDMONT NATURAL GAS CO 25.89 12.11 2.14 41.9% 60.6% 39.4%<br />
SCANA CORP 32.05 25.81 1.24 39.3% 44.6% 55.4%<br />
SOUTHERN CO 32.11 17.07 1.88 40.5% 56.2% 43.8%<br />
VECTREN CORP 22.87 16.69 1.37 42.2% 50.1% 49.9%<br />
WGL HOLDINGS INC 32.05 20.99 1.53 51.7% 62.0% 38.0%<br />
Mean 44.1% 54.9% 45.1%<br />
Sources: Schedule 16 for stock prices, Standard & Poor's Research Insight
Formula for After-Tax Weighted Average Cost of <strong>Capital</strong>:<br />
WACC AT = (Debt Cost)(1-tax rate)(Debt Ratio) + (Equity Cost)(Equity Ratio)<br />
APPROACH 1:<br />
The after-tax weighted average cost of capital (WACCAT) is invariant to changes in the capital structure. The cost of equity increases as leverage (debt ratio) increases, but the<br />
WACCAT stays the same.<br />
ASSUMPTIONS:<br />
STEPS:<br />
QUANTIFICATION OF IMPACT ON EQUITY RETURN REQUIREMENT FOR DIFFERENCE<br />
BETWEEN MARKET VALUE AND BOOK VALUE CAPITAL STRUCTURES:<br />
U.S. UTILITIES<br />
WACC AT(LL) = WACC AT(ML)<br />
Where LL = less levered (lower debt ratio)<br />
ML = more levered (higher debt ratio)<br />
Debt Cost = Current Cost of Long Term Debt for A rated utility<br />
= 6.625%<br />
Equity Cost = Midpoint of DCF-Based Risk Premium and DCF Cost of Equity Test Results<br />
= 10.25%<br />
Tax Rate = 28.5%<br />
CEQ Ratio (1) 54.9%<br />
Debt Ratio (1) 45.1%<br />
CEQ Ratio (2) 44.1%<br />
Debt Ratio (2) 55.9%<br />
1. Estimate WACC AT for the less levered sample (common equity ratio of 54.9%)<br />
WACC AT = (6.625%)(1-.285)(45.1%) + (10.25%)(54.9%)<br />
= 7.76%<br />
2. Estimate Cost of Equity for sample at 44.1% common equity ratio with WACC AT unchanged at 7.76%<br />
Tax Rate Declines to Canadian Level<br />
WACC AT = (Debt Cost)(1-tax rate)(Debt Ratio) + (Equity Cost)(Equity Ratio)<br />
7.76% = (6.625%)(1-.285)(55.9%) + (X)(44.1%)<br />
Cost of Equity at 44.1% Equity Ratio = 11.60%<br />
3. Difference between Equity Return at 54.9% and 44.1% common equity ratios:<br />
11.60% - 10.25% = 1.35% (135 basis points)<br />
Schedule 25<br />
Page 2 of 3
APPROACH 2:<br />
ASSUMPTIONS:<br />
STEPS:<br />
After-Tax Cost of <strong>Capital</strong> Falls as Debt Ratio Increases; Cost of Equity Increases<br />
WACC AT(LL) = WACC AT(ML) x (1-tD LL)<br />
Where LL,ML as before<br />
t = tax rate<br />
D = debt ratio<br />
(1-tD ML)<br />
Debt Cost = Current Cost of Long Term Debt for A rated utility<br />
= 6.625%<br />
Equity Cost = Cost of Equity<br />
= 10.25%<br />
Tax Rate = 28.5%<br />
CEQ Ratio (1) 54.9%<br />
Debt Ratio (1) 45.1%<br />
CEQ Ratio (2) 44.10%<br />
Debt Ratio (2) 55.90%<br />
1. Estimate WACCAT for less levered sample (common equity ratio of 54.9%)<br />
WACCAT = (6.625%)(1-.285)(45.1%) + (10.25%)(54.9%)<br />
= 7.76%<br />
2. Estimate WACC AT for more levered firm (common equity ratio of 44.1%)<br />
Tax Rate Declines to Canadian Level<br />
WACC AT(ML) = WACC AT(LL) x (1-t x Debt Ratio ML)/(1-t x Debt Ratio LL)<br />
WACC AT(ML) = 7.76% x (1-.285 x 55.9%)<br />
(1-.285 x 45.1%)<br />
WACC AT(ML) = 7.49%<br />
3. Estimate Cost of Equity at new WACCAT for more levered firm:<br />
WACCAT(ML) = (Debt Cost)(1-tax rate)(Debt RatioML) + (Equity Cost)(Equity RatioMLL) 7.49% = (6.625%)(1-.29)(55.9%) + (X)(44.1%)<br />
Cost of Equity at 44.10% Equity Ratio = 10.98%<br />
4. Difference between Equity Return at 54.9% and 44.1% common equity ratios:<br />
10.98% - 10.25% = 0.73% (73 basis points)<br />
ESTIMATE OF IMPACT OF CHANGE IN CAPITAL STRUCTURE AND TAX RATE ON COST OF EQUITY<br />
Approximately 75 to 135 basis points (Midpoint of 105)<br />
Schedule 25<br />
Page 3 of 3
BRITISH COLUMBIA UTILITIES COMMISSION<br />
WRITTEN EVIDENCE<br />
OF<br />
JAMES H. VANDER WEIDE, PH.D.<br />
FOR<br />
TERASEN GAS INC.<br />
MAY <strong>2009</strong>
Written Evidence of James H. Vander Weide, Ph.D.<br />
Page 1 of 87<br />
WRITTEN EVIDENCE OF<br />
JAMES H. VANDER WEIDE<br />
TABLE OF CONTENTS<br />
I. Introduction .............................................................................................. 3<br />
II. The Fair Return Standard ........................................................................ 4<br />
III. The AAM <strong>ROE</strong> Formula Is Not Valid. ...................................................... 8<br />
A. The AAM <strong>ROE</strong> Formula ................................................................................... 8<br />
B. Six Tests of the Validity of the AAM <strong>ROE</strong> Formula ......................................... 8<br />
1. Evidence on Experienced Equity Risk Premiums on Investments<br />
in Canadian Utility Stocks ........................................................................ 10<br />
2. Evidence on Recent Allowed Rates of Return on Equity for U.S.<br />
<strong>Utilities</strong> ..................................................................................................... 15<br />
3. Evidence on the Sensitivity of the Forward-looking Required<br />
Equity Risk Premium on Utility Stocks to Changes in Interest<br />
Rates ....................................................................................................... 17<br />
4. Evidence on the Sensitivity of the Allowed Equity Risk Premium<br />
for U.S. <strong>Utilities</strong> to Changes in Interest Rates ......................................... 21<br />
5. Evidence on the Relative Risk of Returns on Canadian Utility<br />
Stocks Compared to the Canadian Market Index .................................... 22<br />
6. Evidence that the AAM <strong>ROE</strong> Formula Produces Lower Results in<br />
a Period of Increased Risk and Uncertainty in the Economic and<br />
<strong>Capital</strong> Markets ........................................................................................ 24<br />
IV. The Cost of Equity for Companies whose Risk is Similar to TGI<br />
Is Significantly Higher than the Cost of Equity Implied by the<br />
AAM <strong>ROE</strong> Formula. ................................................................................ 26<br />
A. Comparable Companies ................................................................................ 26<br />
B. Estimating the Cost of Equity ........................................................................ 29<br />
1. Equity Risk Premium Method .................................................................. 29<br />
a) Ex Post Risk Premium ....................................................................... 30<br />
b) Ex Ante Risk Premium Method .......................................................... 32<br />
2. Discounted Cash Flow Model .................................................................. 33<br />
V. Comparable Risk <strong>Utilities</strong> Have Significantly Higher Allowed<br />
Equity Ratios than TGI. ......................................................................... 35<br />
VI. Summary and Recommendations ........................................................ 36
Written Evidence of James H. Vander Weide, Ph.D.<br />
Page 2 of 87<br />
Exhibit 1 Experienced Risk Premiums on S&P/TSX <strong>Utilities</strong> Stock Index<br />
1956—2008<br />
Exhibit 2 Experienced Risk Premiums on BMO <strong>Capital</strong> Markets <strong>Utilities</strong> Stock<br />
Data Set 1983—2008<br />
Exhibit 3 Allowed Returns on Equity for U.S. Electric and Natural Gas <strong>Utilities</strong><br />
Exhibit 4 Allowed Equity Ratios for U.S. Electric and Natural Gas <strong>Utilities</strong><br />
Exhibit 5 Comparison of the DCF Expected Return on an Investment in<br />
Electric <strong>Utilities</strong> to the Interest Rate on Long-Term Government<br />
Bonds<br />
Exhibit 6 Comparison of the DCF Expected Return on an Investment in<br />
Natural Gas <strong>Utilities</strong> to the Interest Rate on Long-Term Government<br />
Bonds<br />
Exhibit 7 Implied Allowed Equity Risk Premium<br />
Exhibit 8 Summary of Discounted Cash Flow Analysis for Value Line Electric<br />
Companies<br />
Exhibit 9 Summary of Discounted Cash Flow Analysis for Value Line Natural<br />
Gas Companies<br />
Exhibit 10 Market Value Equity Ratios for U.S. Electric and Natural Gas<br />
Companies at December 2008<br />
Exhibit 11 Appendix 1 Qualifications of James H. Vander Weide<br />
Exhibit 12 Appendix 2 Estimating the Expected Return on Utility Stocks<br />
Using the DCF Model<br />
Exhibit 13 Appendix 3 The Sensitivity of the Forward-looking Required Equity<br />
Risk Premium on Utility Stocks to Changes in Interest<br />
Rates
1<br />
2<br />
3<br />
4<br />
5<br />
6<br />
7<br />
8<br />
9<br />
10<br />
11<br />
12<br />
13<br />
14<br />
15<br />
16<br />
17<br />
18<br />
19<br />
20<br />
21<br />
22<br />
23<br />
24<br />
25<br />
26<br />
27<br />
28<br />
29<br />
30<br />
31<br />
32<br />
I. Introduction<br />
Written Evidence of James H. Vander Weide, Ph.D.<br />
Page 3 of 87<br />
WRITTEN EVIDENCE OF<br />
JAMES H. VANDER WEIDE<br />
Q 1 What is your name, occupation, and business address?<br />
A 1 My name is James H. Vander Weide. I am Research Professor of<br />
Finance and Economics at Duke University, Fuqua School of<br />
Business. I am also President of Financial Strategy Associates, a<br />
firm that provides strategic and financial consulting services to<br />
corporate clients. My business address is 3606 Stoneybrook Drive,<br />
Durham, North Carolina 27705.<br />
Q 2 Please summarize your qualifications.<br />
A 2 I received a Bachelor’s Degree in Economics from Cornell University<br />
and a Ph.D. in Finance from Northwestern University. After joining<br />
the faculty of the School of Business at Duke University, I was named<br />
Assistant Professor, Associate Professor, and then Professor. I have<br />
published research in the areas of finance and economics and taught<br />
courses in these fields at Duke for more than 35 years.<br />
Q 3 Have you previously testified on financial and economic issues?<br />
A 3 Yes. As an expert on financial and economic theory and practice, I<br />
have participated in more than 400 regulatory and legal proceedings<br />
before the U.S. Congress, the Canadian Radio-Television and<br />
Telecommunications Commission, the National Energy Board, the<br />
Alberta <strong>Utilities</strong> Commission, the Federal Communications<br />
Commission, the National Telecommunications and Information<br />
Administration, the Federal Energy Regulatory Commission, the<br />
public service commissions of 42 states, the insurance commissions<br />
of five states, the Iowa State Board of Tax Review, the National<br />
Association of Securities Dealers, and the North Carolina Property<br />
Tax Commission. In addition, I have provided expert testimony in<br />
proceedings before the U.S. District Court for the District of<br />
Nebraska; the U.S. District Court for the District of New Hampshire;<br />
the U.S. District Court for the Eastern District of North Carolina; the
1<br />
2<br />
3<br />
4<br />
5<br />
6<br />
7<br />
8<br />
9<br />
10<br />
11<br />
12<br />
13<br />
14<br />
15<br />
16<br />
17<br />
18<br />
19<br />
20<br />
21<br />
22<br />
23<br />
24<br />
25<br />
26<br />
27<br />
28<br />
29<br />
30<br />
31<br />
Written Evidence of James H. Vander Weide, Ph.D.<br />
Page 4 of 87<br />
U.S. District Court for the Northern District of California; Montana<br />
Second Judicial District Court, Silver Bow County; the Superior Court,<br />
North Carolina; the U.S. Bankruptcy Court for the Southern District of<br />
West Virginia; and the U. S. District Court for the Eastern District of<br />
Michigan. My resume is shown in Appendix 1.<br />
Q 4 What is the purpose of your testimony?<br />
A 4 I have been asked by <strong>Terasen</strong> Gas Inc. (“TGI”) to: (1) assess the<br />
validity of the Automatic Adjustment Mechanism (“AAM”) adopted by<br />
the British Columbia <strong>Utilities</strong> Commission (“BC <strong>Utilities</strong> Commission”)<br />
in Order G-14-06 dated March 2, 2006; (2) conduct an analysis of the<br />
cost of equity for TGI; and (3) recommend an appropriate fair <strong>ROE</strong><br />
and deemed equity ratio for TGI.<br />
II. The Fair Return Standard<br />
Q 5 What is a fair return?<br />
A 5 A fair return is a return that is: (i) equal to the returns investors<br />
expect to earn on other investments of comparable risk; (ii) sufficient<br />
to allow the regulated firm to attract capital on reasonable terms; and<br />
(iii) sufficient to allow the regulated firm to maintain its financial<br />
integrity.<br />
Q 6 What is the economic definition of the required rate of return, or cost<br />
of capital, associated with particular investment decisions, such as<br />
the decision to invest in natural gas distribution facilities?<br />
A 6 The economic definition of the cost of capital is identical to the<br />
definition of the fair return, namely, the cost of capital is the return<br />
investors expect to receive on alternative investments of comparable<br />
risk.<br />
Q 7 How does the cost of capital affect a firm’s investment decisions?<br />
A 7 A central goal of a firm is to maximize the value of the firm. This goal<br />
can be accomplished by accepting all investments in plant and<br />
equipment with an expected rate of return greater than the cost of<br />
capital. Thus, from an economic perspective, a firm should continue
1<br />
2<br />
3<br />
4<br />
5<br />
6<br />
7<br />
8<br />
9<br />
10<br />
11<br />
12<br />
13<br />
14<br />
15<br />
16<br />
17<br />
18<br />
19<br />
20<br />
21<br />
22<br />
23<br />
24<br />
25<br />
26<br />
27<br />
28<br />
Written Evidence of James H. Vander Weide, Ph.D.<br />
Page 5 of 87<br />
to invest in plant and equipment only so long as the return on its<br />
investment is greater than or equal to its cost of capital.<br />
Q 8 How does the cost of capital affect investors’ willingness to invest in a<br />
company?<br />
A 8 The cost of capital measures the return investors can expect on<br />
investments of comparable risk. The cost of capital also measures<br />
the investor’s required rate of return on investment because rational<br />
investors will not invest in a particular investment opportunity if the<br />
expected return on that opportunity is less than the cost of capital.<br />
Thus, the cost of capital is a hurdle rate for both investors and the<br />
firm.<br />
Q 9 Do all investors have the same position in the firm?<br />
A 9 No. Bond investors have a fixed claim on a firm’s assets and income<br />
that must be paid prior to any payment to the firm’s equity investors.<br />
Since the firm’s equity investors have a residual claim on the firm’s<br />
assets and income, equity investments are riskier than bond<br />
investments. Thus, the cost of equity exceeds the cost of debt.<br />
Q 10 What is the overall or average cost of capital?<br />
A 10 The overall or average cost of capital is a weighted average of the<br />
cost of debt and cost of equity, where the weights are<br />
the percentages of debt and equity in a firm’s capital structure.<br />
Q 11 Can you illustrate the calculation of the overall or weighted average<br />
cost of capital?<br />
A 11 Yes. Assume that the cost of debt is 6 percent, the cost of equity is<br />
11 percent, and the percentages of debt and equity in the firm’s<br />
capital structure are 50 percent and 50 percent, respectively. Then<br />
the weighted average cost of capital is expressed by .50 times<br />
6 percent plus .50 times 11 percent, or 8.5 percent. [1]<br />
[1] The weighted average cost of capital may be calculated on either an after-tax<br />
or a before-tax basis. The difference between these calculations is that the<br />
after-tax cost of debt is used to calculate the weighted average cost of capital<br />
in an after-tax calculation. For simplicity, I present a before-tax calculation of<br />
the weighted average cost of capital in this example.
1<br />
2<br />
3<br />
4<br />
5<br />
6<br />
7<br />
8<br />
9<br />
10<br />
11<br />
12<br />
13<br />
14<br />
15<br />
16<br />
17<br />
18<br />
19<br />
20<br />
21<br />
22<br />
23<br />
24<br />
25<br />
26<br />
27<br />
28<br />
29<br />
30<br />
31<br />
32<br />
Written Evidence of James H. Vander Weide, Ph.D.<br />
Page 6 of 87<br />
Q 12 What is the economic definition of the cost of equity?<br />
A 12 The cost of equity is the return investors expect to receive on<br />
alternative equity investments of comparable risk. Since the return<br />
on an equity investment of comparable risk is not a contractual return,<br />
the cost of equity is more difficult to measure than the cost of debt.<br />
However, as I have already noted, the cost of equity is greater than<br />
the cost of debt. The cost of equity, like the cost of debt, is both<br />
forward looking and market based.<br />
Q 13 How do economists measure the percentages of debt and equity in a<br />
firm’s capital structure?<br />
A 13 Economists measure the percentages of debt and equity in a firm’s<br />
capital structure by first calculating the market value of the firm’s debt<br />
and the market value of its equity. The percentage of debt is then<br />
calculated by the ratio of the market value of debt to the combined<br />
market value of debt and equity, and the percentage of equity by the<br />
ratio of the market value of equity to the combined market values of<br />
debt and equity. For example, if a firm’s debt has a market value of<br />
$25 million and its equity has a market value of $75 million, then its<br />
total market capitalization is $100 million, and its capital structure<br />
contains 25 percent debt and 75 percent equity.<br />
Q 14 Why do economists measure a firm’s capital structure in terms of the<br />
market values of its debt and equity?<br />
A 14 Economists measure a firm’s capital structure in terms of the market<br />
values of its debt and equity because: (1) the weighted average cost<br />
of capital is defined as the return investors expect to earn on a<br />
portfolio of the company’s debt and equity securities; (2) investors<br />
measure the expected return and risk on their portfolios using market<br />
value weights, not book value weights; and (3) market values are the<br />
best measures of the amounts of debt and equity investors have<br />
invested in the company on a going forward basis.<br />
Q 15 Why do investors measure the return on their investment portfolios<br />
using market value weights rather than book value weights?
1<br />
2<br />
3<br />
4<br />
5<br />
6<br />
7<br />
8<br />
9<br />
10<br />
11<br />
12<br />
13<br />
14<br />
15<br />
16<br />
17<br />
18<br />
19<br />
20<br />
21<br />
22<br />
23<br />
24<br />
25<br />
26<br />
27<br />
28<br />
29<br />
30<br />
31<br />
32<br />
33<br />
34<br />
Written Evidence of James H. Vander Weide, Ph.D.<br />
Page 7 of 87<br />
A 15 Investors measure the return on their investment portfolios using<br />
market value weights because market value weights are the best<br />
measure of the amounts the investors currently have invested in each<br />
security in the portfolio. From the point of view of investors, the<br />
historical cost or book value of their investment is entirely irrelevant to<br />
the current risk and return on their portfolios because if they were to<br />
sell their investments, they would receive market value, not historical<br />
cost. Thus, the return can only be measured in terms of market<br />
values.<br />
Q 16 Does the required rate of return on an investment vary with the risk of<br />
that investment?<br />
A 16 Yes. Since investors are averse to risk, they require a higher rate of<br />
return on investments with greater risk.<br />
Q 17 Do investors consider future industry changes when they estimate the<br />
risk of a particular investment?<br />
A 17 Yes. Investors consider all the risks that a firm might incur over the<br />
future life of the company.<br />
Q 18 Are these economic principles regarding the fair return for capital<br />
recognized in any Supreme Court cases?<br />
A 18 Yes. These economic principles, relating to the supply of and<br />
demand for capital, are recognized in at least one Canadian and two<br />
United States Supreme Court cases: (1) Northwestern <strong>Utilities</strong> Ltd. v.<br />
Edmonton, [1929]; (2) Bluefield Water Works and Improvement Co. v.<br />
Public Service Commission; and (3) Federal Power Commission v.<br />
Hope Natural Gas Co. In Northwestern <strong>Utilities</strong> Ltd. v. Edmonton,<br />
Mr. Justice Lamont states:<br />
The duty of the Board was to fix fair and reasonable rates;<br />
rates which, under the circumstances, would be fair to the<br />
consumer on the one hand, and which, on the other hand,<br />
would secure to the company a fair return for the capital<br />
invested. By a fair return is meant that the company will be<br />
allowed as large a return on the capital invested in its<br />
enterprise (which will be net to the company) as it would<br />
receive if it were investing the same amount in other
1<br />
2<br />
3<br />
4<br />
5<br />
6<br />
7<br />
8<br />
9<br />
10<br />
11<br />
12<br />
13<br />
14<br />
15<br />
16<br />
17<br />
18<br />
19<br />
20<br />
21<br />
22<br />
23<br />
24<br />
25<br />
26<br />
27<br />
28<br />
29<br />
Written Evidence of James H. Vander Weide, Ph.D.<br />
Page 8 of 87<br />
securities possessing an attractiveness, stability and certainty<br />
equal to that of the company’s enterprise. [Northwestern<br />
<strong>Utilities</strong> Ltd. v. Edmonton, [1929] S.C.R. 186.]<br />
The Court clearly recognizes here that a regulated utility must be<br />
allowed to earn a return on the value of its property that is at least<br />
equal to its cost of capital.<br />
III. The AAM <strong>ROE</strong> Formula Is Not Valid.<br />
A. The AAM <strong>ROE</strong> Formula<br />
Q 19 Are you familiar with the BC <strong>Utilities</strong> Commission’s automatic<br />
adjustment mechanism (AAM) <strong>ROE</strong> formula for the regulated electric<br />
and natural gas companies under its jurisdiction?<br />
A 19 Yes. The AAM <strong>ROE</strong> Formula is given by the equation:<br />
<strong>ROE</strong>t<br />
where:<br />
YLDt<br />
= 9.145% - [0.75 x (5.25% - YLDt)]<br />
= the forecast long-term Canada bond yield for year t.<br />
Q 20 What is the current forecast yield on long-term Canada bonds?<br />
A 20 As of April <strong>2009</strong>, the Consensus Economics forecast yield on long-<br />
term Canada bonds is equal to 3.69 percent.<br />
Q 21 Using a 3.69 percent forecast yield on long-term Canada bonds, what<br />
<strong>ROE</strong> is obtained using the AAM <strong>ROE</strong> Formula?<br />
A 21 The AAM <strong>ROE</strong> Formula produces an <strong>ROE</strong> equal to 7.98 percent.<br />
This result is calculated as follows: 7.98 = 9.145 + [0.75 x (5.25 –<br />
3.69)].<br />
Q 22 What equity risk premium is implied by the AAM <strong>ROE</strong> Formula?<br />
A 22 The AAM <strong>ROE</strong> Formula implies an equity risk premium equal to<br />
4.29 percent (7.98 – 3.69 = 4.29).<br />
B. Six Tests of the Validity of the AAM <strong>ROE</strong> Formula<br />
Q 23 Have you performed any tests of the validity of the AAM <strong>ROE</strong><br />
Formula?
1<br />
2<br />
3<br />
4<br />
5<br />
6<br />
7<br />
8<br />
9<br />
10<br />
11<br />
12<br />
13<br />
14<br />
15<br />
16<br />
17<br />
18<br />
19<br />
20<br />
21<br />
22<br />
23<br />
24<br />
25<br />
26<br />
27<br />
28<br />
29<br />
30<br />
31<br />
32<br />
Written Evidence of James H. Vander Weide, Ph.D.<br />
Page 9 of 87<br />
A 23 Yes. I have performed six tests of the validity of the AAM <strong>ROE</strong><br />
Formula. First, I have examined evidence on the experienced returns<br />
achieved by equity investors in two groups of Canadian utilities<br />
compared to interest rates on long-term Canada bonds. My studies<br />
indicate that the average experienced equity risk premium on an<br />
investment in Canadian utility stocks is approximately 5.5 percent.<br />
Second, I have examined evidence on the allowed rates of return<br />
on equity and allowed common equity ratios for U.S. electric and<br />
natural gas utilities. My studies indicate that allowed rates of return<br />
on equity and allowed equity ratios for U.S. utilities average<br />
approximately 10.4 percent and 49 percent, respectively. Since the<br />
AAM <strong>ROE</strong> Formula currently produces a 7.98 percent <strong>ROE</strong> on an<br />
allowed equity ratio of 35 percent, this evidence supports the<br />
conclusion that the AAM <strong>ROE</strong> Formula fails to provide returns that<br />
are commensurate with returns on other investments of comparable<br />
risk.<br />
Third, I have examined evidence on the sensitivity of the forward-<br />
looking, or ex ante, required equity risk premium on utility stocks to<br />
changes in interest rates. Specifically, while the <strong>ROE</strong> adjustment<br />
formula implies that the cost of equity for TGI declines by 75 basis<br />
points for every 100-basis-point decline in the yield to maturity on<br />
long Canada bonds, my evidence supports the conclusion that the<br />
cost of equity declines by less than 50 basis points for every 100-<br />
basis-point decline in the yield to maturity on long Canada bonds.<br />
From my ex ante risk premium studies, I find that the forward-looking<br />
required equity risk premium on utility stocks is in the range<br />
7.5 percent to 8.0 percent. Since the risk premium implied by the<br />
AAM <strong>ROE</strong> Formula is currently 4.29 percent, this evidence supports<br />
the conclusion that the AAM <strong>ROE</strong> Formula is not working.<br />
Fourth, I have examined evidence on the sensitivity of the equity<br />
risk premium implied by U.S. utility allowed rates of return on equity<br />
to changes in the interest rate on long-term government bonds. My
1<br />
2<br />
3<br />
4<br />
5<br />
6<br />
7<br />
8<br />
9<br />
10<br />
11<br />
12<br />
13<br />
14<br />
15<br />
16<br />
17<br />
18<br />
19<br />
20<br />
21<br />
22<br />
23<br />
24<br />
25<br />
26<br />
27<br />
28<br />
29<br />
30<br />
31<br />
32<br />
Written Evidence of James H. Vander Weide, Ph.D.<br />
Page 10 of 87<br />
studies indicate that U.S. utility allowed equity risk premiums are<br />
significantly less sensitive to changes in interest rates on long-term<br />
government bonds than the allowed equity risk premium implied by<br />
the AAM <strong>ROE</strong> Formula. Specifically, while the <strong>ROE</strong> adjustment<br />
formula reduces the allowed <strong>ROE</strong> by 75 basis points when the yield<br />
to maturity on long-term government bonds declines by 100 basis<br />
points, U.S. regulators typically reduce the allowed <strong>ROE</strong> by less than<br />
50 basis points when the yield to maturity on long-term government<br />
bonds declines by 100 basis points. This evidence also supports the<br />
conclusion that the AAM <strong>ROE</strong> Formula is not working.<br />
Fifth, I have examined evidence on the volatility of returns on<br />
Canadian utility stocks compared to the volatility of returns on the<br />
Canadian market index. My studies indicate that the volatility of<br />
returns on Canadian utility stocks exceeds or approximates the<br />
volatility of returns on the Canadian market index. Because investors<br />
demand a higher return for bearing more risk, this evidence also<br />
supports the conclusion that the equity risk premium on Canadian<br />
utility stocks is higher than the equity risk premium implied by the<br />
AAM <strong>ROE</strong> Formula.<br />
Sixth, I have examined whether the AAM <strong>ROE</strong> Formula produces<br />
an <strong>ROE</strong> result that is consistent with the increased risk associated<br />
with today’s highly uncertain economic and capital market conditions.<br />
I conclude that, contrary to a reasonable expectation, the AAM <strong>ROE</strong><br />
Formula produces a lower <strong>ROE</strong> estimate at a time when the<br />
increased risks of highly uncertain economic and capital market<br />
conditions are causing capital costs to increase dramatically.<br />
1. Evidence on Experienced Equity Risk Premiums on<br />
Investments in Canadian Utility Stocks<br />
Q 24 How do you measure the experienced equity risk premium on an<br />
investment in Canadian utility stocks?<br />
A 24 I measure the experienced equity risk premium on an investment in<br />
Canadian utility stocks from data on returns earned by investors in
1<br />
2<br />
3<br />
4<br />
5<br />
6<br />
7<br />
8<br />
9<br />
10<br />
11<br />
12<br />
13<br />
14<br />
15<br />
16<br />
17<br />
18<br />
19<br />
20<br />
21<br />
22<br />
23<br />
24<br />
25<br />
Written Evidence of James H. Vander Weide, Ph.D.<br />
Page 11 of 87<br />
Canadian utility stocks compared to interest rates on long-term<br />
Canada bonds.<br />
Q 25 How do you measure the return experienced by investors in<br />
Canadian utility stocks?<br />
A 25 I measure the return experienced by investors in Canadian utility<br />
stocks from historical data on returns earned by investors in: (1) the<br />
S&P/TSX utilities stock index [2]<br />
; and (2) a basket of Canadian utility<br />
stocks created by BMO <strong>Capital</strong> Markets (“BMO CM”).<br />
Q 26 What companies are currently included in these indices of Canadian<br />
utility stock performance?<br />
A 26 The companies included in the S&P/TSX utilities stock index are<br />
Algonquin Power Income Fund, ATCO Ltd., Canadian <strong>Utilities</strong> Ltd.,<br />
Emera Inc., Energy Savings Income Fund, EPCOR Power L.P.,<br />
Fortis Inc., Northland Power Income Fund, and TransAlta<br />
Corporation. The index also included Calpine Power Units until<br />
February 2007 and TransAlta Power, L.P., until December 2007. In<br />
addition, Canadian Hydro Developers, Inc. was added to the index in<br />
March 2008.<br />
The BMO CM basket of utility and pipeline companies includes<br />
Canadian <strong>Utilities</strong> Ltd., Emera Inc., Enbridge Inc., Fortis Inc., Pacific<br />
Northern Gas, and TransCanada Corporation. The BMO CM basket<br />
also includes return data for Westcoast Energy Inc. until December<br />
2001 and <strong>Terasen</strong> Inc. through July 2005.<br />
Q 27 What time periods do your experienced Canadian utility stock return<br />
data cover?<br />
[2] The legacy S&P/TSX utilities index was discontinued by Standard & Poor’s in<br />
Spring 2002 when Standard & Poor’s introduced a new S&P/TSX Composite<br />
utilities index that included the GICs 5500 utilities. Standard & Poor’s<br />
provided total return index value data going back to 1999. The historical data<br />
on returns earned by investors in the S&P/TSX utilities index therefore<br />
includes total returns on the S&P/TSX legacy utilities index through 1998 and<br />
total returns on the new S&P/TSX composite utilities index from 1999 through<br />
2008.
1<br />
2<br />
3<br />
4<br />
5<br />
6<br />
7<br />
8<br />
9<br />
10<br />
11<br />
12<br />
13<br />
14<br />
15<br />
16<br />
17<br />
18<br />
19<br />
20<br />
21<br />
22<br />
23<br />
24<br />
25<br />
26<br />
27<br />
28<br />
29<br />
30<br />
31<br />
32<br />
Written Evidence of James H. Vander Weide, Ph.D.<br />
Page 12 of 87<br />
A 27 The S&P/TSX utilities stock return data covers the period 1956<br />
through 2008, and the BMO CM stock return data covers the period<br />
1983 through 2008.<br />
Q 28 Why do you analyze investors’ experienced returns over such long<br />
time periods?<br />
A 28 I analyze investors’ experienced returns over long time periods<br />
because experienced returns over short periods can deviate<br />
significantly from expectations. However, I also recognize that<br />
experienced returns over long periods may also deviate from<br />
expected returns if the data in some portion of the long time period<br />
are unreliable.<br />
Q 29 Would your study provide different risk premium results if you had<br />
included different time periods?<br />
A 29 Yes. The risk premium results do vary somewhat depending on the<br />
historical time period chosen. My policy was to go back as far in<br />
history as I could get reliable data. With regard to the S&P/TSX<br />
utilities index, the data began in 1956, and for the BMO CM utility<br />
stock basket, the data began in 1983.<br />
Q 30 Why do you choose two sets of Canadian utilities stock return<br />
performance data rather than simply relying on the S&P/TSX utilities<br />
stock index data?<br />
A 30 I choose two sets of Canadian utility stock return performance data<br />
because each data set provides different information on Canadian<br />
utility stock returns. The S&P/TSX utilities index is valuable because<br />
it provides information on the returns experienced by investors in a<br />
portfolio of Canadian utility stocks over a relatively long period of<br />
time. However, six of the nine companies included in the S&P/TSX<br />
utility index operate mainly in non-traditional utility markets. The<br />
BMO CM utility stock return database is valuable because it provides<br />
information on the experienced returns for a sample of Canadian<br />
companies that receive a significantly higher percentage of revenues<br />
from traditional utility operations than the companies in the S&P/TSX
1<br />
2<br />
3<br />
4<br />
5<br />
6<br />
7<br />
8<br />
9<br />
10<br />
11<br />
12<br />
13<br />
14<br />
15<br />
16<br />
17<br />
18<br />
19<br />
20<br />
21<br />
22<br />
23<br />
24<br />
Written Evidence of James H. Vander Weide, Ph.D.<br />
Page 13 of 87<br />
index. However, the time period covered is not as long as the period<br />
covered by the S&P/TSX utility index.<br />
Q 31 How are the experienced returns on an investment in each utility data<br />
set calculated?<br />
A 31 The experienced returns on an investment in each utility data set are<br />
calculated from the historical record of stock prices and dividends for<br />
the companies in the data set. From the historical record of stock<br />
prices and dividends, the index sponsors construct an index of<br />
investors’ wealth at the end of each period, assuming a $100<br />
investment in the index at the time the index was constructed. An<br />
annual rate of return is calculated from the wealth index by dividing<br />
the wealth index at the end of each period by the wealth index at the<br />
beginning of the period and subtracting one [rt = (Wt ÷ Wt-1) – 1].<br />
Q 32 How do you measure the interest rate earned on long-term Canada<br />
bonds in your experienced, or ex post, risk premium studies?<br />
A 32 I use the interest rate data on long-term Canada bonds reported by<br />
the Canadian Institute of Actuaries.<br />
Q 33 What average risk premium results do you obtain from your analysis<br />
of returns experienced by investors in Canadian utility stocks?<br />
A 33 As shown in Table 1 below, I obtain an average experienced risk<br />
premium equal to 5.5 percent (the annual data that produce these<br />
results are shown in Exhibit 1 and Exhibit 2).<br />
COMPARABLE GROUP<br />
TABLE 1<br />
EX POST RISK PREMIUM RESULTS<br />
PERIOD OF<br />
STUDY<br />
AVERAGE<br />
STOCK<br />
RETURN<br />
AVERAGE<br />
BOND<br />
YIELD<br />
RISK<br />
PREMIUM<br />
S&P/TSX <strong>Utilities</strong> 1956 – 2008 11.84 7.54 4.3<br />
BMO CM <strong>Utilities</strong> Stock Data Set 1983 – 2008 14.31 7.66 6.6<br />
Average 5.5
1<br />
2<br />
3<br />
4<br />
5<br />
6<br />
7<br />
8<br />
9<br />
10<br />
11<br />
12<br />
13<br />
14<br />
15<br />
16<br />
17<br />
18<br />
19<br />
20<br />
21<br />
22<br />
23<br />
24<br />
25<br />
26<br />
27<br />
28<br />
Written Evidence of James H. Vander Weide, Ph.D.<br />
Page 14 of 87<br />
Q 34 What conclusions do you draw from your experienced, or ex post, risk<br />
premium studies about the required risk premium on an investment in<br />
Canadian utility stocks?<br />
A 34 My ex post risk premium studies provide evidence that investors<br />
require an equity return that is at least 5.5 percentage points above<br />
the interest rate on long-term Canada bonds.<br />
Q 35 Do you have any evidence that the required equity risk premium may<br />
actually be greater than 5.5 percentage points?<br />
A 35 Yes. I provide evidence below that the required equity risk premium<br />
increases when interest rates decline and decreases when interest<br />
rates rise. Since the expected 3.69 percent yield on long Canada<br />
bonds is significantly less than the 7.6 percent average yield on long<br />
Canada bonds over the period of my ex post risk premium studies,<br />
the current required equity risk premium should be significantly higher<br />
than the average 5.5 percent equity risk premium I obtain from my ex<br />
post risk premium studies.<br />
Q 36 What equity risk premium is implied by the AAM <strong>ROE</strong> Formula?<br />
A 36 The AAM <strong>ROE</strong> Formula produces an <strong>ROE</strong> equal to 7.98 percent<br />
based on a 3.69 percent forecast yield to maturity on long Canada<br />
bonds. Thus, the AAM <strong>ROE</strong> Formula implies an equity risk premium<br />
of 429 basis points.<br />
Q 37 How does your evidence on the experienced equity risk premium<br />
support your conclusion that the AAM <strong>ROE</strong> Formula is not working?<br />
A 37 My analysis supports the conclusion that investors require an equity<br />
risk premium on Canadian utility stocks equal to at least 5.5 percent.<br />
Thus, my evidence supports the conclusion that the AAM <strong>ROE</strong><br />
Formula understates the required equity risk premium on Canadian<br />
utility stocks.
1<br />
2<br />
3<br />
4<br />
5<br />
6<br />
7<br />
8<br />
9<br />
10<br />
11<br />
12<br />
13<br />
14<br />
15<br />
16<br />
17<br />
18<br />
19<br />
20<br />
21<br />
22<br />
23<br />
24<br />
25<br />
26<br />
27<br />
28<br />
29<br />
30<br />
31<br />
32<br />
Written Evidence of James H. Vander Weide, Ph.D.<br />
Page 15 of 87<br />
2. Evidence on Recent Allowed Rates of Return on<br />
Equity for U.S. <strong>Utilities</strong><br />
Q 38 Do you have evidence on recent allowed rates of return on equity for<br />
U.S. <strong>Utilities</strong>?<br />
A 38 Yes. I have evidence on recent allowed rates of return on equity for<br />
U.S. electric and natural gas utilities from January 2006 through<br />
December 2008. Since January 2006, the average allowed <strong>ROE</strong> for<br />
electric utilities is 10.4 percent, and for natural gas utilities,<br />
10.3 percent. In 2008, the average allowed <strong>ROE</strong> for electric utilities<br />
is 10.5 percent, and for natural gas utilities, 10.4 percent (see<br />
Exhibit 3).<br />
Q 39 Why do you examine data on allowed rates of return on equity for<br />
U.S. utilities rather than Canadian utilities?<br />
A 39 I examine data on allowed rates of return on equity for U.S. utilities<br />
rather than Canadian utilities because allowed rates of return on<br />
equity for U.S. utilities are based on cost of equity studies for utilities<br />
at the time of each case rather than on an <strong>ROE</strong> formula such as the<br />
AAM <strong>ROE</strong> Formula. Thus, recent allowed rates of return on equity<br />
for U.S. utilities are an independent test of whether the AAM <strong>ROE</strong><br />
Formula is valid.<br />
Q 40 Are allowed rates of return on equity the best measure of the cost of<br />
equity at each point in time?<br />
A 40 No. Since the cost of equity is determined by investors in the<br />
marketplace, not by regulators, the cost of equity is best measured<br />
using market models such as the equity risk premium and the<br />
discounted cash flow model. However, as noted above, because<br />
allowed rates of return in non-formula jurisdictions are based on<br />
regulators’ judgments regarding the cost of equity and fair rate of<br />
return, they provide additional information on the validity of the AAM<br />
<strong>ROE</strong> Formula.<br />
Q 41 How do the average allowed <strong>ROE</strong>s for U.S. electric and natural gas<br />
utilities compare to the <strong>ROE</strong> implied by the AAM <strong>ROE</strong> Formula?
1<br />
2<br />
3<br />
4<br />
5<br />
6<br />
7<br />
8<br />
9<br />
10<br />
11<br />
12<br />
13<br />
14<br />
15<br />
16<br />
17<br />
18<br />
19<br />
20<br />
21<br />
22<br />
23<br />
24<br />
25<br />
26<br />
27<br />
28<br />
29<br />
30<br />
31<br />
32<br />
Written Evidence of James H. Vander Weide, Ph.D.<br />
Page 16 of 87<br />
A 41 The average allowed rates of return on equity for U.S. utilities are<br />
approximately 10.4 percent. As noted above, the AAM <strong>ROE</strong> Formula<br />
currently implies an <strong>ROE</strong> equal to 7.98 percent. Thus, the average<br />
allowed returns for the U.S. utilities exceed the generic <strong>ROE</strong> by<br />
approximately 250 basis points [10.4 – 7.9 = 250].<br />
Q 42 Can the difference between allowed <strong>ROE</strong>s for U.S. utilities and the<br />
<strong>ROE</strong> implied by the AAM <strong>ROE</strong> Formula be explained by differences<br />
in business risk?<br />
A 42 No. The business risk of electric and natural gas utilities is<br />
approximately the same in the U.S. as it is in Canada.<br />
Q 43 Why is the business risk of electric and natural gas utilities<br />
approximately the same in the U.S. as it is in Canada?<br />
A 43 The business risk of electric and natural gas utilities is similar in the<br />
U.S. and Canada because: (1) U.S. electric and natural gas utilities<br />
rely on essentially the same electric and natural gas technologies to<br />
deliver their services to the public as electric and gas utilities in<br />
Canada; (2) the economics of electric and natural gas transmission<br />
and distribution is similar in the U.S. and Canada; and (3) U.S.<br />
electric and gas utilities are regulated under similar cost-based<br />
regulatory structures and fair rate of return principles as Canadian<br />
utilities.<br />
Q 44 Some observers have argued that Canadian utilities have lower<br />
regulatory risk than U.S. utilities because Canadian regulators<br />
generally make greater use of deferral accounts than U.S. regulators.<br />
Do you agree with this argument?<br />
A 44 No. Regulatory risk is associated with the possibility that a utility will<br />
be unable to earn its required rate of return as a result of regulation.<br />
Although deferral accounts generally reduce the gap between a<br />
utility’s actual and allowed returns, they do not necessarily reduce the<br />
gap between a utility’s actual and required returns. Canadian utilities<br />
face greater regulatory risk than U.S. utilities because Canadian<br />
utilities are generally regulated through formula <strong>ROE</strong>s such as the
1<br />
2<br />
3<br />
4<br />
5<br />
6<br />
7<br />
8<br />
9<br />
10<br />
11<br />
12<br />
13<br />
14<br />
15<br />
16<br />
17<br />
18<br />
19<br />
20<br />
21<br />
22<br />
23<br />
24<br />
25<br />
26<br />
27<br />
28<br />
29<br />
30<br />
31<br />
32<br />
Written Evidence of James H. Vander Weide, Ph.D.<br />
Page 17 of 87<br />
AAM <strong>ROE</strong> Formula, and formula <strong>ROE</strong>s are more likely to differ from<br />
the market cost of equity than <strong>ROE</strong>s based on market evidence in<br />
each rate proceeding.<br />
Q 45 How does the financial risk of Canadian utilities compare to the<br />
financial risk of U.S. utilities?<br />
A 45 Canadian utilities have greater financial risk than U.S. utilities<br />
because U.S. utilities generally have allowed equity ratios in the<br />
range 45 percent to 50 percent (see Exhibit 4), whereas Canadian<br />
utilities generally have allowed equity ratios in the range 30 percent to<br />
40 percent.<br />
Q 46 What conclusions do you draw from your evidence that allowed <strong>ROE</strong>s<br />
for comparable U.S. utilities are significantly higher than the <strong>ROE</strong><br />
implied by the AAM <strong>ROE</strong> Formula?<br />
A 46 My evidence on allowed <strong>ROE</strong>s for U.S. utilities provides further<br />
support for the conclusion that the AAM <strong>ROE</strong> Formula is not working.<br />
3. Evidence on the Sensitivity of the Forward-looking<br />
Required Equity Risk Premium on Utility Stocks to<br />
Changes in Interest Rates<br />
Q 47 How do you study the sensitivity of the forward-looking required<br />
equity risk premium on utility stocks to changes in interest rates?<br />
A 47 I study the sensitivity of the forward-looking required equity risk<br />
premium on utility stocks to changes in interest rates in two steps.<br />
First, I estimate the forward-looking required equity risk premium on<br />
utility stocks in each month of my study period. Second, I perform a<br />
statistical regression analysis of the relationship between changes in<br />
the required equity risk premium and changes in interest rates.<br />
Q 48 Please describe how you measure the forward-looking required<br />
equity risk premium on an equity investment in utility stocks in each<br />
month of your study period.<br />
A 48 My estimate of the required equity risk premium is based on studies<br />
of the discounted cash flow (“DCF”) expected return on comparable<br />
groups of utilities in each month of my study period compared to the
1<br />
2<br />
3<br />
4<br />
5<br />
6<br />
7<br />
8<br />
9<br />
10<br />
11<br />
12<br />
13<br />
14<br />
15<br />
16<br />
17<br />
18<br />
19<br />
20<br />
21<br />
22<br />
23<br />
24<br />
25<br />
26<br />
27<br />
28<br />
29<br />
30<br />
31<br />
32<br />
Written Evidence of James H. Vander Weide, Ph.D.<br />
Page 18 of 87<br />
interest rate on long-term government bonds. Specifically, for each<br />
month in my study period, I calculate the risk premium using the<br />
equation,<br />
where:<br />
RPCOMP = DCFCOMP – IB<br />
RPCOMP = the required risk premium on an equity investment<br />
in the comparable companies,<br />
DCFCOMP = average DCF expected rate of return on a portfolio<br />
of comparable companies; and<br />
IB = the yield to maturity on an investment in long-term<br />
U.S. Treasury bonds.<br />
Q 49 Please describe the DCF model you used to estimate the forward-<br />
looking, or ex ante, required risk premium on an equity investment in<br />
utility stocks.<br />
A 49 The DCF model is based on the assumption that investors value an<br />
asset on the basis of the future cash flows they expect to receive<br />
from owning the asset. Under the assumption that future cash flows<br />
grow at a constant rate, g, the resulting cost of equity equation is k =<br />
D1/Ps + g, where k is the cost of equity, D1 is the equivalent future<br />
value of the next four quarterly dividends at the end of the year, Ps is<br />
the current price of the stock, and g is the constant annual growth<br />
rate in earnings, dividends, and book value per share. A complete<br />
description of my approach to calculating the DCF-estimated cost of<br />
equity for my comparable group of utilities is contained in Appendix 2.<br />
Q 50 What comparable companies do you use in your forward-looking<br />
equity risk premium studies?<br />
A 50 I use two sets of comparable U.S. utilities, an electric utilities<br />
company group and a natural gas utilities company group. For my<br />
electric group, I use the Moody’s group of 24 electric companies<br />
because they are a widely-followed group of utilities, and the use of<br />
this constant group greatly simplified the data collection task required<br />
to estimate the ex ante risk premium over the months of my study.
1<br />
2<br />
3<br />
4<br />
5<br />
6<br />
7<br />
8<br />
9<br />
10<br />
11<br />
12<br />
13<br />
14<br />
15<br />
16<br />
17<br />
18<br />
19<br />
20<br />
21<br />
22<br />
23<br />
24<br />
25<br />
26<br />
Written Evidence of James H. Vander Weide, Ph.D.<br />
Page 19 of 87<br />
Simplifying the data collection task is desirable because my forward-<br />
looking equity risk premium studies require that the DCF model be<br />
estimated for every company in every month of the study period. For<br />
my natural gas company group, I select all the utilities in Value Line’s<br />
natural gas company groups that: (1) paid dividends during every<br />
quarter and did not decrease dividends during any quarter of the past<br />
two years; (2) have at least three analysts included in the I/B/E/S<br />
mean growth forecast; (3) are not in the process of being acquired;<br />
(4) have a Value Line Safety Rank of 1, 2, or 3; and (5) have<br />
investment grade S&P bond ratings.<br />
Q 51 Why do you use U.S. utilities rather than Canadian utilities in your<br />
forward-looking, or ex ante, risk premium studies?<br />
A 51 My ex ante risk premium studies rely on the DCF model to determine<br />
the expected risk premium on utility stocks. As noted above, the DCF<br />
model requires estimates of investors’ growth expectations, which are<br />
best measured from the average of analysts’ growth forecasts for<br />
each company. The difficulty with using Canadian utilities is that<br />
there are very few, if any, analysts’ growth forecasts available for<br />
each Canadian utility over the 10-year time period of my study.<br />
Q 52 How do you test whether your forward-looking required equity risk<br />
premium estimates are sensitive to changes in interest rates?<br />
A 52 To test whether my estimated monthly equity risk premiums are<br />
sensitive to changes in interest rates, I perform a regression analysis<br />
of the relationship between the forward-looking equity risk premium<br />
and the yield to maturity on 20-year U.S. Treasury bonds using the<br />
equation:
1<br />
2<br />
3<br />
4<br />
5<br />
6<br />
7<br />
8<br />
9<br />
10<br />
11<br />
12<br />
13<br />
14<br />
15<br />
16<br />
17<br />
18<br />
19<br />
20<br />
21<br />
22<br />
23<br />
24<br />
25<br />
26<br />
27<br />
28<br />
where:<br />
RPCOMP<br />
IB<br />
Written Evidence of James H. Vander Weide, Ph.D.<br />
Page 20 of 87<br />
RPCOMP = a + (b x IB) + e<br />
= risk premium on comparable company group;<br />
= yield to maturity on long-term U.S. Treasury bonds;<br />
e = a random residual; and<br />
a, b = coefficients estimated by the regression procedure.<br />
Q 53 What does your regression analysis reveal regarding the sensitivity of<br />
the forward-looking required equity risk premium to changes in<br />
interest rates?<br />
A 53 My regression analysis reveals that the forward-looking required<br />
equity risk premium increases by more than 50 basis points when the<br />
yield to maturity on long-term government bonds declines by 100<br />
basis points. These results suggest that, contrary to the AAM <strong>ROE</strong><br />
Formula, the cost of equity for utilities declines by less than 50 basis<br />
points when the yield on long-term government bonds declines by<br />
100 basis points, rather than the 75-basis point decline in the cost of<br />
equity that is implied by the AAM <strong>ROE</strong> Formula. A more detailed<br />
description of my regression analysis is contained in Appendix 3. The<br />
risk premium data used in the regression analysis is shown in Exhibit<br />
5 and Exhibit 6.<br />
Q 54 What risk premium estimates do you obtain from your forward-looking<br />
risk premium studies?<br />
A 54 For my electric utility comparable group, I obtain a forward-looking<br />
risk premium equal to approximately 8.0 percent; and for my natural<br />
gas comparable group, I obtain a forward-looking risk premium equal<br />
to 7.5 percent.<br />
Q 55 What do your forward-looking equity risk premium studies imply about<br />
the validity of the AAM <strong>ROE</strong> Formula?
1<br />
2<br />
3<br />
4<br />
5<br />
6<br />
7<br />
8<br />
9<br />
10<br />
11<br />
12<br />
13<br />
14<br />
15<br />
16<br />
17<br />
18<br />
19<br />
20<br />
21<br />
22<br />
23<br />
24<br />
25<br />
26<br />
27<br />
28<br />
29<br />
30<br />
31<br />
32<br />
Written Evidence of James H. Vander Weide, Ph.D.<br />
Page 21 of 87<br />
A 55 Like my studies of experienced risk premiums on Canadian utility<br />
stocks, my forward-looking equity risk premium studies imply that the<br />
AAM <strong>ROE</strong> Formula is not valid.<br />
4. Evidence on the Sensitivity of the Allowed Equity<br />
Risk Premium for U.S. <strong>Utilities</strong> to Changes in Interest<br />
Rates<br />
Q 56 How do you define the allowed equity risk premium for U.S. utilities?<br />
A 56 I define the allowed equity risk premium as the difference between<br />
the average allowed return on equity for U.S. utilities and the yield to<br />
maturity on long-term U.S. Treasury bonds.<br />
Q 57 How do you test whether the allowed equity risk premium is sensitive<br />
to changes in interest rates?<br />
A 57 I test whether the allowed equity risk premium is sensitive to changes<br />
in interest rates by performing a regression analysis of the<br />
relationship between the allowed equity risk premium and the yield to<br />
maturity on 20-year U.S. Treasury bonds over the period 1988<br />
through 2008.<br />
Q 58 What are the results of your regression analysis?<br />
A 58 My allowed equity risk premium analysis confirms the results of my ex<br />
ante risk premium analysis; namely, my results confirm that there is<br />
an inverse relationship between equity risk premiums and the yield to<br />
maturity on long-term government bonds. Specifically, I find that<br />
when the yield to maturity on long-term government bonds increases<br />
by 100 basis points, the allowed equity risk premium tends to<br />
decrease by approximately 55 basis points; and when the yield to<br />
maturity on long-term government bonds decreases by 100 basis<br />
points, the allowed equity risk premium tends to increase by<br />
approximately 55 basis points. These results imply that the allowed<br />
return on equity for U.S. utilities declines by less than 50 basis points<br />
when the yield to maturity on long-term government bonds declines<br />
by 100 basis points. The allowed equity risk premium data in my<br />
study and my regression results are shown in Exhibit 7.
1<br />
2<br />
3<br />
4<br />
5<br />
6<br />
7<br />
8<br />
9<br />
10<br />
11<br />
12<br />
13<br />
14<br />
15<br />
16<br />
17<br />
18<br />
19<br />
20<br />
21<br />
22<br />
23<br />
24<br />
25<br />
26<br />
27<br />
Written Evidence of James H. Vander Weide, Ph.D.<br />
Page 22 of 87<br />
Q 59 What forecast allowed equity risk premium results do you obtain from<br />
your allowed equity risk premium studies?<br />
A 59 I obtain a forecast allowed equity risk premium equal to 5.6 percent.<br />
This forecast allowed equity risk premium for U.S. utilities is 129 basis<br />
points higher than the 4.29 percent basis point equity risk premium<br />
implied by the AAM <strong>ROE</strong> Formula at April <strong>2009</strong>..<br />
Q 60 What conclusions do you reach from your analysis of the sensitivity of<br />
allowed U.S. equity risk premiums to changes in interest rates?<br />
A 60 I conclude that the AAM <strong>ROE</strong> Formula is not working.<br />
5. Evidence on the Relative Risk of Returns on<br />
Canadian Utility Stocks Compared to the Canadian<br />
Market Index<br />
Q 61 What data do you examine on the relative risk of Canadian utility<br />
stocks compared to the risk of the Canadian stock market as a<br />
whole?<br />
A 61 I examine the standard deviation, or volatility, of utility stock returns<br />
compared to the standard deviation, or volatility, of the returns on the<br />
TSX market index. In addition, I examine the realized returns on<br />
Canadian utility stocks compared to the realized returns on the<br />
Canadian stock market index.<br />
Q 62 What has been the standard deviation, or volatility, of returns on<br />
Canadian utility stocks compared to the standard deviation of returns<br />
on the Canadian market index?<br />
A 62 As shown below, over comparable annual time periods, the standard<br />
deviation of returns for Canadian utility stocks has exceeded or<br />
approximated the standard deviation of returns for the Canadian<br />
market index.
1<br />
2<br />
3<br />
4<br />
5<br />
6<br />
7<br />
8<br />
9<br />
10<br />
11<br />
12<br />
13<br />
14<br />
15<br />
16<br />
17<br />
18<br />
19<br />
20<br />
21<br />
22<br />
23<br />
PERIOD<br />
Written Evidence of James H. Vander Weide, Ph.D.<br />
Page 23 of 87<br />
TABLE 2<br />
STANDARD DEVIATION OF ANNUAL RETURNS<br />
BMO CM UTILITIES STOCK DATA SET,<br />
S&P/TSX UTILITIES, AND TSX MARKET INDEX<br />
BMO CM<br />
UTILITIES<br />
STOCK<br />
DATA SET<br />
S&P/TSX<br />
UTILITIES<br />
INDEX<br />
TSX<br />
CANADIAN<br />
MARKET<br />
1983 – 2008 17.29 18.64 16.67<br />
1956 – 2008 15.76 16.72<br />
Q 63 What have been the realized returns on Canadian utility stocks<br />
compared to realized returns on the Canadian market index?<br />
A 63 As shown below, the realized returns on Canadian utility stocks have<br />
exceeded realized returns on the Canadian market index over the<br />
periods 1956–2008 and 1983–2008.<br />
PERIOD<br />
TABLE 3<br />
AVERAGE ANNUAL RETURNS<br />
BMO CM UTILITIES STOCK DATA SET,<br />
S&P/TSX UTILITIES, AND TSX MARKET INDEX<br />
BMO CM<br />
UTILITIES<br />
STOCK<br />
DATA SET<br />
S&P/TSX<br />
UTILITIES<br />
INDEX<br />
TSX<br />
CANADIAN<br />
MARKET<br />
1983 – 2008 14.31 15.18 10.13<br />
1956 – 2008 11.84 10.30<br />
Q 64 What conclusions do you draw from your evidence that the standard<br />
deviation of annual returns on Canadian utility stocks has exceeded<br />
or approximated the standard deviation of returns on the Canadian<br />
market as a whole?<br />
A 64 I conclude that the risk of Canadian utility stocks compared to the risk<br />
of the Canadian stock market as a whole is greater than is implied by<br />
the AAM <strong>ROE</strong> Formula. Specifically, while the AAM <strong>ROE</strong> Formula<br />
implies that Canadian utility stocks are only half as risky as the<br />
Canadian stock market as a whole (the Formula assumes a beta<br />
equal to 0.50 for Canadian utility stocks), [3]<br />
my evidence indicates<br />
[3] See Commission Order No. G-14-06, March 2, 2006, at 53.
1<br />
2<br />
3<br />
4<br />
5<br />
6<br />
7<br />
8<br />
9<br />
10<br />
11<br />
12<br />
13<br />
14<br />
15<br />
16<br />
17<br />
18<br />
19<br />
20<br />
21<br />
22<br />
23<br />
24<br />
25<br />
26<br />
27<br />
28<br />
29<br />
30<br />
31<br />
32<br />
Written Evidence of James H. Vander Weide, Ph.D.<br />
Page 24 of 87<br />
that Canadian utility stocks have approximately the same risk as the<br />
Canadian stock market as a whole.<br />
Q 65 What conclusions do you draw from your evidence that the realized<br />
returns on Canadian utility stocks have exceeded realized returns on<br />
the Canadian stock market index over the periods 1956 – 2008 and<br />
1983 – 2008?<br />
A 65 This evidence corroborates my conclusion that Canadian utility stocks<br />
are more risky relative to the Canadian stock market as a whole than<br />
is implied by the AAM <strong>ROE</strong> Formula.<br />
6. Evidence that the AAM <strong>ROE</strong> Formula Produces Lower<br />
Results in a Period of Increased Risk and Uncertainty in<br />
the Economic and <strong>Capital</strong> Markets<br />
Q 66 Does an investor’s required rate of return on investment depend on<br />
investment risk?<br />
A 66 Yes. Since investors are risk averse, their required rate of return on<br />
an investment increases with the risk of the investment. That is, the<br />
greater the risk, the higher the required rate of return.<br />
Q 67 Does greater uncertainty in economic and capital market conditions<br />
produce greater risk for investors?<br />
A 67 Yes. It is widely recognized that investment risk is related to<br />
uncertainty, with higher uncertainty indicating higher investment risk.<br />
Q 68 Do you have any evidence that investors’ required rates of return on<br />
utility stock investments have increased in response to the greater<br />
uncertainty in current economic and capital market conditions?<br />
A 68 Yes. During periods of greater uncertainty in economic and capital<br />
market conditions, the required rate of return on utility stock<br />
investments generally moves in the same direction as the required<br />
rate of return on utility bond investments. The required rate of return<br />
on utility bond investments is measured by the yield on utility bonds.<br />
Since the yield on utility bonds has increased in response to greater<br />
uncertainty in economic and capital market conditions, it is highly<br />
likely that the required rate of return on utility stock investments has
1<br />
2<br />
3<br />
4<br />
5<br />
6<br />
7<br />
8<br />
9<br />
10<br />
11<br />
12<br />
13<br />
14<br />
15<br />
16<br />
17<br />
18<br />
19<br />
20<br />
21<br />
22<br />
23<br />
24<br />
25<br />
26<br />
27<br />
28<br />
29<br />
Written Evidence of James H. Vander Weide, Ph.D.<br />
Page 25 of 87<br />
increased as well. (I provide a direct estimate of the required return<br />
on utility stock investments in Section IV.)<br />
Q 69 What evidence do you have that interest rates on utility bond<br />
investments have increased in response to greater uncertainty in<br />
economic and capital market conditions?<br />
A 69 In the United States, for example, interest rates on A-rated utility<br />
bonds have increased from 6.0 percent in January 2008 to<br />
6.4 percent in March <strong>2009</strong>. The increase in interest rates on Baa-<br />
rated utility bonds has been even greater, increasing from 6.4 percent<br />
in January 2008, to 7.9 percent in March <strong>2009</strong>. In Canada, the<br />
indicated yield on <strong>Terasen</strong>’s 30-year bonds has increased from<br />
approximately 5.7 percent at year end 2007 to approximately<br />
6.7 percent in February <strong>2009</strong>. [4]<br />
As further evidence that the yield<br />
on Canadian utility bonds has increased, I note that TransCanada<br />
has recently issued long-term debt securities with a nominal yield to<br />
maturity equal to 7.625 percent.<br />
Q 70 Have interest rates on long-term government bonds increased in line<br />
with interest rates on long-term utility bonds?<br />
A 70 No. Interest rates on medium-term and long-term government bonds<br />
have declined. In the United States, for example, the interest rate on<br />
10-year U.S. Treasury bonds declined from 4.5 percent in October<br />
2007 to 2.8 percent in March <strong>2009</strong>; and interest rates on 30-year U.S.<br />
Treasury bonds declined from 4.8 percent in October 2007 to<br />
3.6 percent in March <strong>2009</strong>. Similarly, the yield on 10-year Canada<br />
bonds declined from 4.4 percent in October 2007 to 3.0 percent in<br />
March <strong>2009</strong>, and the yield on long Canada bonds declined from<br />
4.4 percent to 3.7 percent.<br />
Q 71 Has the AAM <strong>ROE</strong> Formula estimated <strong>ROE</strong> increased in line with<br />
greater uncertainty in economic and capital market conditions?<br />
[4] Data provided by <strong>Terasen</strong>.
1<br />
2<br />
3<br />
4<br />
5<br />
6<br />
7<br />
8<br />
9<br />
10<br />
11<br />
12<br />
13<br />
14<br />
15<br />
16<br />
17<br />
18<br />
19<br />
20<br />
21<br />
22<br />
23<br />
24<br />
25<br />
26<br />
27<br />
28<br />
29<br />
30<br />
31<br />
Written Evidence of James H. Vander Weide, Ph.D.<br />
Page 26 of 87<br />
A 71 No. Because the AAM <strong>ROE</strong> Formula estimated <strong>ROE</strong> depends on the<br />
yield on long Canada bonds rather than the yield on corporate bonds,<br />
and the yield on long Canada bonds has declined, the formula-<br />
estimated <strong>ROE</strong> has declined at the same time that there is greater<br />
uncertainty in economic and capital market conditions.<br />
Q 72 What conclusions do you draw from the evidence that the AAM <strong>ROE</strong><br />
Formula estimated <strong>ROE</strong> has declined during this period of greater<br />
uncertainty and risk in economic and capital markets?<br />
A 72 I conclude that a AAM <strong>ROE</strong> Formula based on government bonds<br />
produces unreasonable results. While the costs of utility capital have<br />
increased in line with increased risk and uncertainty in economic and<br />
capital markets, the AAM <strong>ROE</strong> Formula based on long Canada bonds<br />
indicates that the required return on an equity investment in Canadian<br />
utilities has declined.<br />
IV. The Cost of Equity for Companies whose Risk is Similar to TGI Is<br />
Significantly Higher than the Cost of Equity Implied by the AAM<br />
<strong>ROE</strong> Formula.<br />
A. Comparable Companies<br />
Q 73 What methods did you use to estimate the cost of equity for your<br />
comparable companies?<br />
A 73 I estimated the cost of equity for these companies by first identifying<br />
companies of similar risk to TGI and then applying several standard<br />
cost of equity methodologies to data for these companies.<br />
Q 74 What criteria did you use to select companies whose risk is similar to<br />
that of TGI?<br />
A 74 I used the following criteria to select groups of similar risk companies:<br />
(1) must have stock that is publicly traded; (2) must have sufficient<br />
available data to reasonably apply standard cost of equity estimation<br />
techniques; (3) must be comparable in risk; and (4) taken together,<br />
must constitute a relatively large sample of companies.<br />
Q 75 Why must comparable companies be publicly traded?
1<br />
2<br />
3<br />
4<br />
5<br />
6<br />
7<br />
8<br />
9<br />
10<br />
11<br />
12<br />
13<br />
14<br />
15<br />
16<br />
17<br />
18<br />
19<br />
20<br />
21<br />
22<br />
23<br />
24<br />
25<br />
26<br />
27<br />
28<br />
29<br />
30<br />
31<br />
Written Evidence of James H. Vander Weide, Ph.D.<br />
Page 27 of 87<br />
A 75 Comparable companies must be publicly traded because information<br />
on a company’s stock price is a key input in standard cost of equity<br />
estimation methods. If the company is not publicly traded, the<br />
information required to estimate the cost of equity will not be<br />
available.<br />
Q 76 Why is data availability a concern in estimating the cost of equity for<br />
TGI?<br />
A 76 Data availability is a concern because standard cost of equity<br />
estimation methods like the equity risk premium and the DCF require<br />
estimates of inputs, such as the required risk premium and the<br />
expected growth rate, that are inherently uncertain. If there is<br />
insufficient data available to estimate these inputs, there is little basis<br />
for arriving at a reasonable estimate of the cost of equity for the<br />
comparable risk companies.<br />
Q 77 Is there any way to assure that the companies used to estimate the<br />
cost of equity have exactly the same risk as TGI?<br />
A 77 No. First, TGI is a regulated natural gas distribution utility, and there<br />
are few regulated natural gas distribution utilities that have publicly-<br />
traded stock. Second, it is not possible to measure the risk of TGI<br />
precisely because most generally accepted risk measures require<br />
that a company have publicly-traded stock. Third, there is no single<br />
generally agreed upon measure of risk.<br />
Q 78 Recognizing the difficulty in identifying companies with exactly the<br />
same risk as TGI, what companies did you consider as potential<br />
comparables for the purpose of estimating the cost of equity for TGI?<br />
A 78 I considered two groups of Canadian utilities and two groups of US<br />
utilities.<br />
Q 79 What two groups of Canadian utilities did you consider?<br />
A 79 I considered the small group of Canadian utilities included in the BMO<br />
CM’s basket of utility and pipeline companies and a larger group<br />
consisting of the companies in the S&P/TSX utilities index.
1<br />
2<br />
3<br />
4<br />
5<br />
6<br />
7<br />
8<br />
9<br />
10<br />
11<br />
12<br />
13<br />
14<br />
15<br />
16<br />
17<br />
18<br />
19<br />
20<br />
21<br />
22<br />
23<br />
24<br />
25<br />
26<br />
27<br />
28<br />
29<br />
30<br />
31<br />
32<br />
Written Evidence of James H. Vander Weide, Ph.D.<br />
Page 28 of 87<br />
Q 80 What are the advantages of using the BMO CM basket of Canadian<br />
utilities as comparables for the purpose of estimating the cost of<br />
equity for TGI?<br />
A 80 The primary advantage of the BMO CM basket of Canadian utilities is<br />
that it only includes companies that receive a significant portion of<br />
their revenues from traditional utility operations.<br />
Q 81 What are the advantages of using the S&P/TSX utilities index as<br />
comparables in this proceeding?<br />
A 81 The primary advantage of using the S&P/TSX utilities index is that<br />
there are more companies in the index and return data for this index<br />
is available for a longer period of time than for the BMO CM basket of<br />
utility stocks.<br />
Q 82 What are the advantages of using your two U.S. utilities groups as<br />
comparables for the purpose of estimating the cost of equity for TGI?<br />
A 82 The primary advantages of my U.S. utilities groups are that: (1) they<br />
include a significantly larger sample of companies with traditional<br />
utility operations than my Canadian groups; (2) reasonable estimates<br />
of expected growth rates are available for these companies, whereas<br />
the same data are not available for the Canadian utilities; and<br />
(3) historical data for the U.S. utilities are available for a much greater<br />
length of time than for the Canadian utilities.<br />
Q 83 What conclusions do you draw from your investigation of alternative<br />
groups of comparable companies?<br />
A 83 I conclude that the BC <strong>Utilities</strong> Commission should give significantly<br />
greater weight to the cost of equity results for the U.S. utilities groups<br />
than it has previously. The U.S. utilities are more involved in<br />
traditional utility operations than the companies included in the<br />
Canadian utilities indices. In addition, the sample of U.S. regulated<br />
utilities is significantly larger than the sample of Canadian regulated<br />
utilities, and the data required to estimate the cost of equity is more<br />
readily available for the U.S. utilities than for the Canadian utilities.<br />
Furthermore, Canadian investors have greater access to international
1<br />
2<br />
3<br />
4<br />
5<br />
6<br />
7<br />
8<br />
9<br />
10<br />
11<br />
12<br />
13<br />
14<br />
15<br />
16<br />
17<br />
18<br />
19<br />
20<br />
21<br />
22<br />
23<br />
24<br />
25<br />
26<br />
27<br />
28<br />
29<br />
30<br />
31<br />
32<br />
Written Evidence of James H. Vander Weide, Ph.D.<br />
Page 29 of 87<br />
stock market investments, including investments in the U.S., than<br />
they did prior to the elimination of the foreign property rule in 2005.<br />
For these reasons, the U.S. data provide important information on the<br />
cost of equity for TGI.<br />
Q 84 Did the National Energy Board (“NEB”) recently determine that cost of<br />
equity evidence for U.S. utilities is useful in determining the cost of<br />
equity for Trans Québec & Maritimes Pipeline Inc. (“TQM”)?<br />
A 84 Yes. In Decision RH-1-2008 the Board finds:<br />
In light of the Board's views expressed above on the<br />
integration of U.S. and Canadian financial markets, the<br />
problems with comparisons to either Canadian negotiated or<br />
litigated returns, and the Board’s view that risk differences<br />
between Canada and the U.S. can be understood and<br />
accounted for, the Board is of the view that U.S. comparisons<br />
are very informative for determining a fair return for TQM for<br />
2007 and 2008. [RH-1-2008 at 71.]<br />
B. Estimating the Cost of Equity<br />
Q 85 What methods did you use to estimate the cost of equity for TGI?<br />
A 85 I used two generally accepted methods: the equity risk premium and<br />
the discounted cash flow (“DCF”). The equity risk premium method<br />
assumes that the investor’s required rate of return on an equity<br />
investment is equal to the interest rate on a long-term bond plus an<br />
additional equity risk premium to compensate the investor for the<br />
risks of investing in equities compared to bonds. The DCF method<br />
assumes that the current market price of a firm’s stock is equal to the<br />
discounted value of all expected future cash flows.<br />
1. Equity Risk Premium Method<br />
Q 86 Please describe the equity risk premium method.<br />
A 86 The equity risk premium method is based on the principle that<br />
investors expect to earn a return on an equity investment that reflects<br />
a “premium” over and above the return they expect to earn on an<br />
investment in a portfolio of bonds. This equity risk premium
1<br />
2<br />
3<br />
4<br />
5<br />
6<br />
7<br />
8<br />
9<br />
10<br />
11<br />
12<br />
13<br />
14<br />
15<br />
16<br />
17<br />
18<br />
19<br />
20<br />
21<br />
22<br />
23<br />
24<br />
25<br />
26<br />
27<br />
28<br />
29<br />
30<br />
31<br />
32<br />
Written Evidence of James H. Vander Weide, Ph.D.<br />
Page 30 of 87<br />
compensates equity investors for the additional risk they bear in<br />
making equity investments versus bond investments.<br />
Q 87 How did you measure the required risk premium on an equity<br />
investment in your comparable risk companies?<br />
A 87 I used two methods to estimate the required risk premium on an<br />
equity investment in my comparable risk companies. The first is<br />
called the ex post risk premium method and the second is called the<br />
ex ante risk premium method.<br />
a) Ex Post Risk Premium<br />
Q 88 Please describe your ex post risk premium method for measuring the<br />
required risk premium on an equity investment.<br />
A 88 My ex post risk premium method measures the required risk premium<br />
on an equity investment in TGI from historical data on the returns<br />
experienced by investors in Canadian utility stocks compared to<br />
investors in long-term Canada bonds.<br />
Q 89 How do you measure the return experienced by investors in<br />
Canadian utility stocks?<br />
A 89 I measure the return experienced by investors in Canadian utility<br />
stocks from historical data on returns earned by investors in: (1) the<br />
S&P/TSX utilities stock index; and (2) a basket of Canadian utility<br />
stocks created by the BMO CM.<br />
Q 90 Does your ex post risk premium cost of equity study use the same<br />
investor experienced return data that you discussed above when you<br />
described your tests of the validity of the AAM <strong>ROE</strong> Formula?<br />
A 90 Yes, it does.<br />
Q 91 How do you measure the forecast bond yield for your ex post risk<br />
premium studies?<br />
A 91 I measure the forecast bond yield from information on the forecast<br />
yield on long-term Canada bonds as reported by Consensus<br />
Economics.<br />
Q 92 What risk premium results do you obtain from your ex post risk<br />
premium method?
1<br />
2<br />
3<br />
4<br />
5<br />
6<br />
7<br />
8<br />
9<br />
10<br />
11<br />
12<br />
13<br />
14<br />
15<br />
16<br />
17<br />
18<br />
19<br />
20<br />
21<br />
22<br />
23<br />
24<br />
25<br />
26<br />
27<br />
Written Evidence of James H. Vander Weide, Ph.D.<br />
Page 31 of 87<br />
A 92 As shown below, for the S&P/TSX utilities index, I obtain an<br />
experienced risk premium of 4.3 percent; and for the BMO CM utility<br />
stock data set, an experienced risk premium of 6.6 percent, with an<br />
average experienced risk premium of 5.5 percent (as noted above,<br />
the annual data that produce these results are shown in Exhibit 1 and<br />
Exhibit 2).<br />
TABLE 4<br />
EX POST RISK PREMIUM RESULTS<br />
AVERAGE<br />
STOCK<br />
RETURN<br />
AVERAGE<br />
BOND<br />
YIELD<br />
COMPARABLE GROUP<br />
PERIOD OF<br />
STUDY<br />
S&P/TSX <strong>Utilities</strong> 1956 – 2008 11.84 7.54 4.3<br />
BMO CM <strong>Utilities</strong> Stock Data Set 1983 – 2008 14.31 7.66 6.6<br />
Average 5.5<br />
Q 93 What conclusions do you draw from your ex post risk premium<br />
analyses about your comparable companies’ cost of equity?<br />
A 93 My studies provide evidence that investors in these companies<br />
RISK<br />
PREMIUM<br />
require an equity return equal to at least 5.5 percentage points above<br />
the interest rate on long-term Canada bonds. The Consensus<br />
Economics forecast interest rate on long-term Canada bonds for<br />
2010 as of April <strong>2009</strong> is 3.69 percent. Adding a 5.5 percentage point<br />
risk premium to an expected yield of 3.69 percent on long-term<br />
Canada bonds and including a 50-basis allowance for flotation costs<br />
and financial flexibility produces an expected return on equity equal to<br />
9.7 percent from my ex post risk premium studies.<br />
Q 94 Do you have any evidence that 9.7 percent is a conservative estimate<br />
of the required return on utility stocks based on experienced risk<br />
premiums?<br />
A 94 Yes. During periods of greater uncertainty in economic and capital<br />
market conditions such as we have experienced in recent months, the<br />
return on utility stocks moves more in line with utility bond yields than<br />
with government bond yields. My studies indicate that the required<br />
risk premium on utility stocks compared to utility bonds based on
1<br />
2<br />
3<br />
4<br />
5<br />
6<br />
7<br />
8<br />
9<br />
10<br />
11<br />
12<br />
13<br />
14<br />
15<br />
16<br />
17<br />
18<br />
19<br />
20<br />
21<br />
22<br />
23<br />
24<br />
25<br />
26<br />
27<br />
28<br />
29<br />
30<br />
31<br />
Written Evidence of James H. Vander Weide, Ph.D.<br />
Page 32 of 87<br />
experienced risk premium studies is in the range 4.2 percent to<br />
4.5 percent. Adding a 4.2 percent to 4.5 percent risk premium to an<br />
approximate yield of 6.0 percent on Canadian utility bonds, and<br />
including 50 basis point allowance for flotation costs and financial<br />
flexibility produces a required return on equity in the range<br />
10.7 percent to 11.0 percent.<br />
In addition, my ex ante risk premium studies indicate that the<br />
required equity risk premium increases when interest rates on long-<br />
term government bonds decline. Since the interest rate on long<br />
Canada bonds is significantly below the average interest rate on long<br />
Canada bonds over my ex post risk premium study period, the<br />
required equity risk premium can reasonably be expected to be<br />
greater than the 5.5 percent equity risk premium I obtain from my ex<br />
post risk premium studies.<br />
b) Ex Ante Risk Premium Method<br />
Q 95 Please describe your ex ante risk premium approach for measuring<br />
the required risk premium on an equity investment in TGI.<br />
A 95 My ex ante risk premium method is based on studies of the expected<br />
return on comparable groups of utilities in each month of my study<br />
period compared to the interest rate on long-term government bonds.<br />
Q 96 Does your ex ante risk premium cost of equity study use the same<br />
forward looking, or ex ante, risk premium data that you discussed<br />
above when you described your analysis of the sensitivity of the<br />
forward looking required equity risk premium on utility stocks to<br />
changes in interest rates?<br />
A 96 Yes, it does.<br />
Q 97 What risk premium estimates do you obtain from your ex ante risk<br />
premium studies?<br />
A 97 For my electric utility comparable group, I obtain an ex ante risk<br />
premium equal to 8.0 percent, and for my natural gas comparable<br />
group, I obtain an ex ante risk premium equal to 7.5 percent.
1<br />
2<br />
3<br />
4<br />
5<br />
6<br />
7<br />
8<br />
9<br />
10<br />
11<br />
12<br />
13<br />
14<br />
15<br />
16<br />
17<br />
18<br />
19<br />
20<br />
21<br />
22<br />
23<br />
24<br />
25<br />
26<br />
27<br />
28<br />
29<br />
30<br />
31<br />
32<br />
Written Evidence of James H. Vander Weide, Ph.D.<br />
Page 33 of 87<br />
Q 98 What cost of equity results do you obtain from your ex ante risk<br />
premium studies?<br />
A 98 As described above, in the ex ante risk premium approach, one must<br />
add the expected interest rate on long-term government bonds to the<br />
estimated risk premium to calculate the cost of equity. Since TGI is a<br />
Canadian utility, I estimated the expected yield on long-term<br />
government bonds using the forecast interest rate on long-term<br />
Canada bonds, 3.69 percent. Adding this 3.69 percent interest rate<br />
to my 8.0 percent and 7.5 percent ex ante risk premium estimates, I<br />
obtain cost of equity estimates of 11.7 percent and 11.2 percent (3.7<br />
+ 8.0 = 11.7 and 3.7 + 7.5 = 11.2), with an average estimate of<br />
11.4 percent. A more detailed description of my ex ante risk premium<br />
approach and results is described in Exhibit 5, Exhibit 6, and Exhibit<br />
14, Appendix 3.<br />
2. Discounted Cash Flow Model<br />
Q 99 How do you use the DCF model to estimate the cost of equity on an<br />
investment in your comparable risk companies?<br />
A 99 I apply the DCF model to the Value Line electric and natural gas<br />
utilities shown in Exhibit 8 and Exhibit 9.<br />
Q 100 How do you select your comparable groups of Value Line utilities?<br />
A 100 I select all the utilities in Value Line’s electric and natural gas industry<br />
groups that: (1) paid dividends during every quarter and did not<br />
decrease dividends during any quarter of the past two years; (2) have<br />
at least three analysts included in the I/B/E/S mean growth forecast;<br />
(3) are not in the process of being acquired; (4) have a Value Line<br />
Safety Rank of 1, 2, or 3; and (5) have investment grade S&P bond<br />
ratings.<br />
Q 101 Why do you eliminate companies that have either decreased or<br />
eliminated their dividend during the past two years?<br />
A 101 The DCF model requires the assumption that dividends will grow at a<br />
constant positive rate into the indefinite future. If a company has<br />
decreased its dividend in recent years, an assumption that the
1<br />
2<br />
3<br />
4<br />
5<br />
6<br />
7<br />
8<br />
9<br />
10<br />
11<br />
12<br />
13<br />
14<br />
15<br />
16<br />
17<br />
18<br />
19<br />
20<br />
21<br />
22<br />
23<br />
24<br />
25<br />
26<br />
27<br />
28<br />
29<br />
30<br />
31<br />
Written Evidence of James H. Vander Weide, Ph.D.<br />
Page 34 of 87<br />
company’s dividend will grow at the same positive rate into the<br />
indefinite future is questionable.<br />
Q 102 Why do you eliminate companies that have fewer than three analysts’<br />
estimates included in the I/B/E/S mean forecast?<br />
A 102 The DCF model also requires a reliable estimate of a company’s<br />
expected future growth. For most companies, the I/B/E/S mean<br />
growth forecast is the best available estimate of the growth term in<br />
the DCF Model. However, the I/B/E/S estimate may be less reliable if<br />
the mean estimate is based on the inputs of very few analysts. On<br />
the basis of my professional judgment, I believe that at least three<br />
analysts’ estimates are a reasonable minimum number.<br />
Q 103 Why do you eliminate companies that are in the process of being<br />
acquired?<br />
A 103 I eliminate companies that are in the process of being acquired<br />
because announcement of an acquisition frequently has a significant<br />
impact on a company’s stock price as a result of anticipated merger-<br />
related cost savings and new market opportunities. Analysts’ growth<br />
forecasts, on the other hand, are necessarily related to companies as<br />
they currently exist, and do not reflect investors’ views of the potential<br />
cost savings and new market opportunities associated with mergers.<br />
The use of a stock price that includes the value of potential mergers<br />
in conjunction with growth forecasts that do not include the growth<br />
enhancing prospects of potential mergers produces DCF results that<br />
tend to distort a company’s cost of equity.<br />
Q 104 Please summarize the results of your application of the DCF model to<br />
your comparable groups of companies.<br />
A 104 My application of the DCF model to my comparable group of natural<br />
gas companies produces a result of 11.5 percent, and to my<br />
comparable group of electric companies, 12.4 percent (see Exhibit 8<br />
and Exhibit 9). The average DCF result for my two comparable<br />
groups is 11.9 percent.
1<br />
2<br />
3<br />
4<br />
5<br />
6<br />
7<br />
8<br />
9<br />
10<br />
11<br />
12<br />
13<br />
14<br />
15<br />
16<br />
17<br />
18<br />
19<br />
20<br />
21<br />
22<br />
23<br />
24<br />
25<br />
26<br />
27<br />
Written Evidence of James H. Vander Weide, Ph.D.<br />
Page 35 of 87<br />
Q 105 Based on your application of the equity risk premium and DCF<br />
methods to your comparable risk companies, what is your conclusion<br />
regarding your comparable risk companies’ cost of equity?<br />
A 105 I conservatively conclude that my comparable companies’ cost of<br />
equity is 11.0 percent. As shown below, 11.0 percent is the simple<br />
average of the cost of equity results I obtain from my cost of equity<br />
models. However, my comparable companies’ cost of equity is likely<br />
to be above 11.0 percent because, as noted above, the results of my<br />
ex post risk premium method very likely understate the cost of equity<br />
for my comparable companies.<br />
TABLE 5<br />
SUMMARY OF COST OF EQUITY RESULTS<br />
METHOD COST OF<br />
EQUITY<br />
Ex Post Risk Premium 9.7<br />
Ex Ante Risk Premium 11.4<br />
Discounted Cash Flow 11.9<br />
Average 11.0<br />
V. Comparable Risk <strong>Utilities</strong> Have Significantly Higher Allowed<br />
Equity Ratios than TGI.<br />
Q 106 What common equity ratio did the BC <strong>Utilities</strong> Commission approve<br />
for TGI in its 2006 cost of capital order?<br />
A 106 The BC <strong>Utilities</strong> Commission approved a 35 percent equity ratio for<br />
TGI.<br />
Q 107 How does the approved equity ratio for TGI compare to approved<br />
equity ratios for U.S. utilities?<br />
A 107 As noted above and as shown in Exhibit 4, the average approved<br />
equity ratio for U.S. electric utilities during the period 2006 through<br />
2008 is 48 percent and for U.S. natural gas utilities, 49 percent.<br />
Thus, the average approved equity ratio for U.S. utilities is<br />
significantly higher than the approved equity ratio for TGI.<br />
Q 108 How does the approved equity ratio for TGI compare to market value<br />
equity ratios for U.S. utilities at March <strong>2009</strong>?
1<br />
2<br />
3<br />
4<br />
5<br />
6<br />
7<br />
8<br />
9<br />
10<br />
11<br />
12<br />
13<br />
14<br />
15<br />
16<br />
17<br />
18<br />
19<br />
20<br />
21<br />
22<br />
23<br />
24<br />
25<br />
26<br />
27<br />
28<br />
29<br />
30<br />
31<br />
Written Evidence of James H. Vander Weide, Ph.D.<br />
Page 36 of 87<br />
A 108 The average market value equity ratio for U.S. electric utilities at<br />
March <strong>2009</strong> is 55 percent, and 63 percent for natural gas utilities<br />
(See Exhibit 10).<br />
Q 109 Why do you present evidence on market value equity ratios for U.S.<br />
utilities as well as book value equity ratios?<br />
A 109 I present evidence on market value equity ratios as well as book<br />
value equity ratios because financial risk depends on the market<br />
value percentages of debt and equity in a company’s capital structure<br />
rather than on the book value percentages of debt and equity in the<br />
company’s capital structure.<br />
Q 110 How does the business risk of TGI compare to the average business<br />
risk of U.S. electric and natural gas utilities?<br />
A 110 As discussed above, the business risk of TGI is approximately equal<br />
to the average business risk of U.S. electric and natural gas utilities.<br />
Q 111 How does the financial risk of TGI compare to the average financial<br />
risk of U.S. electric and natural gas utilities?<br />
A 111 Since TGI has an allowed equity ratio of 35 percent, and the U.S.<br />
electric and natural gas utilities have average allowed equity ratios of<br />
48 percent and 49 percent, the financial risk of U.S. electric and<br />
natural gas utilities is significantly less than the financial risk of TGI.<br />
This conclusion is further supported by the observation that the<br />
average market value equity ratio for U.S. electric utilities is<br />
55 percent, and for natural gas utilities, 63 percent. This observation<br />
is important because financial risk is best measured using market<br />
value equity ratios rather than book value equity ratios.<br />
VI. Summary and Recommendations<br />
Q 112 Please summarize your written evidence in this proceeding.<br />
A 112 My written evidence may be summarized as follows:<br />
1. Experienced equity risk premiums on investments in Canadian<br />
utility stocks average 5.5 percent, whereas the AAM <strong>ROE</strong> Formula<br />
implies an equity risk premium of only 4.29 percent.
1<br />
2<br />
3<br />
4<br />
5<br />
6<br />
7<br />
8<br />
9<br />
10<br />
11<br />
12<br />
13<br />
14<br />
15<br />
16<br />
17<br />
18<br />
19<br />
20<br />
21<br />
22<br />
23<br />
24<br />
25<br />
26<br />
27<br />
28<br />
29<br />
30<br />
31<br />
32<br />
Written Evidence of James H. Vander Weide, Ph.D.<br />
Page 37 of 87<br />
2. Recent average allowed returns for U.S. utilities are in the range<br />
10.3 percent to 10.4 percent, whereas the AAM <strong>ROE</strong> Formula<br />
implies an <strong>ROE</strong> equal to 7.9 percent (based on capital market data<br />
at March <strong>2009</strong>).<br />
3. The forward-looking required equity risk premium on utility stocks is<br />
less sensitive to changes in government bond yields than is implied<br />
by the AAM <strong>ROE</strong> Formula.<br />
4. The allowed equity risk premium for U.S. utilities is less sensitive to<br />
changes in government bond yields than is implied by the AAM<br />
<strong>ROE</strong> Formula.<br />
5. The risk of investing in Canadian utility stocks is higher relative to<br />
the Canadian stock market as a whole than is implied by the AAM<br />
<strong>ROE</strong> Formula.<br />
6. The cost of equity for investments in comparable risk utilities is<br />
11.0 percent based on ex post risk premium, ex ante risk premium,<br />
and discounted cash flow studies.<br />
7. Allowed equity ratios for U.S. utilities are in the range 48 percent to<br />
49 percent, whereas the allowed equity ratio for TGI is 35 percent.<br />
8. The business risk of TGI is approximately equal to the average<br />
business risk of U.S. utilities, whereas the average financial risk of<br />
TGI is significantly greater than the average financial risk of U.S.<br />
utilities.<br />
Q 113 What conclusion do you reach from this evidence?<br />
A 113 I conclude that the allowed rate of return on rate base, or overall rate<br />
of return, obtained by applying the AAM <strong>ROE</strong> Formula to TGI’s<br />
deemed equity ratio is significantly less than the overall return that<br />
investors could earn on other investments of similar risk.<br />
Q 114 Based on your evidence regarding average allowed <strong>ROE</strong>s and equity<br />
ratios for U.S. utilities, what is your estimate of the average allowed<br />
rate of return on rate base for comparable risk U.S. utilities?<br />
A 114 I estimate that the average allowed rate of return on rate base for<br />
U.S. utilities is approximately 8 percent (see Table 6).
1<br />
2<br />
3<br />
4<br />
5<br />
6<br />
7<br />
8<br />
9<br />
10<br />
11<br />
12<br />
13<br />
14<br />
15<br />
16<br />
17<br />
18<br />
19<br />
20<br />
21<br />
22<br />
23<br />
Written Evidence of James H. Vander Weide, Ph.D.<br />
Page 38 of 87<br />
TABLE 6<br />
ESTIMATE OF AVERAGE ALLOWED RETURN ON RATE BASE<br />
FOR U.S. UTILITIES<br />
CAPITAL<br />
COMPONENT<br />
% TOTAL COST<br />
RATE<br />
WEIGHTED<br />
COST<br />
Debt 52.00% 6.00% 3.12%<br />
Equity 48.00% 10.30% 4.94%<br />
Total 100.00% 8.06%<br />
Q 115 Does TGI need to be allowed an <strong>ROE</strong> of 10.30 percent on an equity<br />
base of 48.0 percent in order to have the same allowed rate of return<br />
on rate base as comparable risk U.S. utilities?<br />
A 115 No. TGI could be allowed any combination of <strong>ROE</strong> and deemed<br />
equity ratio that produces an overall rate of return of at least<br />
8 percent. As noted above, one such combination is an <strong>ROE</strong> of<br />
10.3 percent and a deemed equity ratio of 48 percent. An allowed<br />
<strong>ROE</strong> of 11 percent and a deemed equity ratio of 40 percent also<br />
produces an overall return of 8 percent (see Table 7).<br />
TABLE 7<br />
ALTERNATIVE COST OF EQUITY AND EQUITY RATIO<br />
THAT PRODUCES AN 8.0 PERCENT<br />
ALLOWED RETURN ON RATE BASE<br />
CAPITAL<br />
COMPONENT<br />
% TOTAL COST<br />
RATE<br />
WEIGHTED<br />
COST<br />
Debt 60.00% 6.00% 3.60%<br />
Equity 40.00% 11.00% 4.40%<br />
Total 100.00% 8.00%<br />
Q 116 What is your specific recommendation regarding the rate of return on<br />
equity and equity percentage for TGI?<br />
A 116 I conservatively recommend that TGI be awarded an allowed <strong>ROE</strong> of<br />
11.0 percent on an equity base of 40 percent, that is five percent<br />
above its last allowed deemed equity ratio.<br />
Q 117 Does this conclude your written evidence?<br />
A 117 Yes, it does.
Written Evidence of James H. Vander Weide, Ph.D.<br />
Page 39 of 87<br />
EXHIBIT 1<br />
EXPERIENCED RISK PREMIUMS ON<br />
S&P/TSX CANADIAN UTILITIES STOCK INDEX<br />
1956—2008<br />
S&P/TSX<br />
CANADIAN<br />
UTILITIES<br />
STOCK<br />
INDEX<br />
TOTAL<br />
RETURN<br />
YIELD<br />
LONG-<br />
TERM<br />
CANADA<br />
BOND<br />
LINE<br />
RISK<br />
NO. YEAR<br />
PREMIUM<br />
1 1956 0.17 3.63 -3.45<br />
2 1957 -3.43 4.11 -7.54<br />
3 1958 9.81 4.15 5.66<br />
4 1959 0.21 5.08 -4.86<br />
5 1960 26.81 5.19 21.62<br />
6 1961 19.17 5.05 14.12<br />
7 1962 -0.72 5.11 -5.83<br />
8 1963 6.19 5.09 1.10<br />
9 1964 21.59 5.18 16.41<br />
10 1965 4.23 5.21 -0.98<br />
11 1966 -13.17 5.69 -18.86<br />
12 1967 5.07 5.94 -0.87<br />
13 1968 7.41 6.75 0.66<br />
14 1969 -8.62 7.58 -16.20<br />
15 1970 23.34 7.91 15.43<br />
16 1971 4.29 6.95 -2.66<br />
17 1972 -0.44 7.23 -7.68<br />
18 1973 -4.14 7.56 -11.70<br />
19 1974 14.38 8.90 5.48<br />
20 1975 5.75 9.04 -3.28<br />
21 1976 15.02 9.18 5.84<br />
22 1977 19.00 8.70 10.30<br />
23 1978 27.28 9.27 18.01<br />
24 1979 12.61 10.21 2.40<br />
25 1980 5.74 12.48 -6.74<br />
26 1981 -0.55 15.22 -15.77<br />
27 1982 35.90 14.26 21.65<br />
28 1983 40.97 11.79 29.17<br />
29 1984 24.31 12.75 11.56<br />
30 1985 10.04 11.04 -1.00<br />
31 1986 11.48 9.52 1.96<br />
32 1987 1.07 9.95 -8.88<br />
33 1988 5.63 10.22 -4.59<br />
34 1989 22.07 9.92 12.15<br />
35 1990 0.58 10.85 -10.28
Written Evidence of James H. Vander Weide, Ph.D.<br />
Page 40 of 87<br />
S&P/TSX<br />
CANADIAN<br />
UTILITIES<br />
STOCK<br />
INDEX<br />
TOTAL<br />
RETURN<br />
YIELD<br />
LONG-<br />
TERM<br />
CANADA<br />
BOND<br />
LINE<br />
RISK<br />
NO. YEAR<br />
PREMIUM<br />
36 1991 27.02 9.76 17.25<br />
37 1992 -2.24 8.77 -11.00<br />
38 1993 23.52 7.85 15.67<br />
39 1994 -6.04 8.63 -14.68<br />
40 1995 18.44 8.28 10.16<br />
41 1996 32.68 7.50 25.18<br />
42 1997 37.33 6.42 30.91<br />
43 1998 36.55 5.47 31.09<br />
44 1999 -27.14 5.69 -32.83<br />
45 2000 50.06 5.89 44.17<br />
46 2001 10.83 5.78 5.05<br />
47 2002 6.33 5.66 0.67<br />
48 2003 24.94 5.28 19.66<br />
49 2004 9.42 5.08 4.34<br />
50 2005 38.29 4.39 33.90<br />
51 2006 7.01 4.30 2.71<br />
52 2007 11.89 4.34 7.55<br />
53 2008 -20.46 4.05 -24.50<br />
54 Average 11.84 7.54 4.29
Written Evidence of James H. Vander Weide, Ph.D.<br />
Page 41 of 87<br />
EXHIBIT 2<br />
EXPERIENCED RISK PREMIUMS ON BMO CAPITAL MARKETS<br />
UTILITIES STOCK DATA SET<br />
1983—2008<br />
LINE NO. YEAR<br />
BMO<br />
CAPITAL<br />
MARKETS<br />
UTILITIES<br />
TOTAL<br />
RETURN<br />
YIELD LONG-<br />
TERM CANADA<br />
BOND<br />
RISK<br />
PREMIUM<br />
1 1983 25.63 11.79 13.84<br />
2 1984 5.46 12.75 -7.29<br />
3 1985 18.95 11.04 7.90<br />
4 1986 -3.48 9.52 -13.00<br />
5 1987 9.97 9.95 0.02<br />
6 1988 7.84 10.22 -2.38<br />
7 1989 18.36 9.92 8.44<br />
8 1990 6.31 10.85 -4.54<br />
9 1991 4.01 9.76 -5.75<br />
10 1992 -0.36 8.77 -9.12<br />
11 1993 31.52 7.85 23.68<br />
12 1994 -2.64 8.63 -11.27<br />
13 1995 14.73 8.28 6.45<br />
14 1996 30.56 7.50 23.05<br />
15 1997 48.52 6.42 42.10<br />
16 1998 4.06 5.47 -1.40<br />
17 1999 -24.03 5.69 -29.72<br />
18 2000 57.77 5.89 51.89<br />
19 2001 14.72 5.78 8.93<br />
20 2002 13.93 5.66 8.27<br />
21 2003 27.75 5.28 22.47<br />
22 2004 15.00 5.08 9.92<br />
23 2005 32.02 4.39 27.64<br />
24 2006 16.61 4.30 12.31<br />
25 2007 3.88 4.34 -0.45<br />
26 2008 -5.17 4.05 -9.22<br />
27 Average 14.31 7.66 6.64
Written Evidence of James H. Vander Weide, Ph.D.<br />
Page 42 of 87<br />
EXHIBIT 3<br />
ALLOWED RETURNS ON EQUITY FOR<br />
U.S. ELECTRIC AND NATURAL GAS UTILITIES<br />
2006 – 2008 [5]<br />
ELECTRIC UTILITIES<br />
LINE<br />
NO.<br />
DATE COMPANY STATE <strong>ROE</strong><br />
1 5-Jan-06 Northern States Power (WI) WI 11.00<br />
2 27-Jan-06 United Illuminating (CT) CT 9.75<br />
3 3-Mar-06 Interstate Power & Light (MN) MN 10.39<br />
4 17-Apr-06 PacifiCorp (WA) WA 10.20<br />
5 18-Apr-06 MidAmerican Energy IA 11.90<br />
6 26-Apr-06 Sierra Pacific Power NV 10.60<br />
7 12-May-06 Idaho Power ID 10.60<br />
8 6-Jun-06 Delmarva Power & Light DE 10.00<br />
9 27-Jun-06 Upper Penninsula Power MI 10.75<br />
10 6-Jul-06 Maine Public Service ME 10.20<br />
11 24-Jul-06 Central Hudson Gas & Electric NY 9.60<br />
12 26-Jul-06 Appalachian Power WV 10.50<br />
13 28-Jul-06 Commonwealth Edison IL 10.05<br />
14 23-Aug-06 NY State Electric & Gas NY 9.55<br />
15 1-Sep-06 Northern States Power MN 10.54<br />
16 14-Sep-06 PacifiCorp OR 10.00<br />
17 6-Oct-06 Unitil Energy Systems NH 9.67<br />
18 21-Nov-06 Central Illinois Public Service IL 10.08<br />
19 21-Nov-06 Central Illinois Light IL 10.08<br />
20 21-Nov-06 Illinois Power IL 10.12<br />
21 1-Dec-06 PacifiCorp UT 10.25<br />
22 1-Dec-06 Public Service Colorado CO 10.50<br />
23 7-Dec-06 Central Vermont Public Service VT 10.75<br />
24 21-Dec-06 Empire District Electric Co. MO 10.90<br />
25 21-Dec-06 Kansas City Power & Light MO 11.25<br />
26 22-Dec-06 Green Mountain Power VT 10.25<br />
27 5-Jan-07 Oklahoma G & E AR 10.00<br />
28 5-Jan-07 Puget Sound Energy WA 10.40<br />
29 11-Jan-07 Metropolitan Edison PA 10.10<br />
30 11-Jan-07 Pennsylvania Electric PA 10.10<br />
31 11-Jan-07 Wisconsin Public Service WI 10.90<br />
32 12-Jan-07 Portland General Electric OR 10.10<br />
33 19-Jan-07 Wisconsin Power & Light WI 10.80<br />
34 22-Mar-07 Rockland Electric NJ 9.75<br />
35 15-May-07 Appalachian Power VA 10.00<br />
36 17-May-07 Aquila MPS MO 10.25<br />
37 17-May-07 Aquila LP MO 10.25<br />
[5] Regulatory Research Associates, Inc., “Major Rate Case Decisions–January 2006–<br />
December 2007,” January 8, 2008; “Major Rate Case Decisions–January 2007-December<br />
2008,” January 12, <strong>2009</strong>.
Written Evidence of James H. Vander Weide, Ph.D.<br />
Page 43 of 87<br />
LINE<br />
NO.<br />
DATE COMPANY STATE <strong>ROE</strong><br />
38 22-May-07 Union Electric MO 10.20<br />
39 22-May-07 Monongahela WV 10.50<br />
40 23-May-07 Nevada Power NV 10.70<br />
41 25-May-07 Public Service NH NH 9.67<br />
42 15-Jun-07 Entergy AR AR 9.90<br />
43 21-Jun-07 PacifiCorp WA 10.20<br />
44 22-Jun-07 Appalachian Power WV 10.50<br />
45 28-Jun-07 AZ Public Service AZ 10.75<br />
46 12-Jul-07 Granite State Electric NH 9.67<br />
47 19-Jul-07 DelMarva P & L MD 10.00<br />
48 19-Jul-07 Potomac Electric Power MD 10.00<br />
49 15-Aug-07 Southern Indiana G & E IN 10.40<br />
50 9-Oct-07 Public Service Oklahoma OK 10.00<br />
51 18-Oct-07 Orange and Rockland NY 9.10<br />
52 31-Oct-07 Electric Transmission Texas TX 9.96<br />
53 29-Nov-07 Cheyenne Light WY 10.90<br />
54 6-Dec-07 Kansas City Power & Light MO 10.75<br />
55 13-Dec-07 AEP Texas TX 9.96<br />
56 14-Dec-07 South Carolina Electric & Gas SC 10.70<br />
57 14-Dec-07 Madison Gas and Electric WI 10.80<br />
58 19-Dec-07 Avista Corporation WA 10.20<br />
59 20-Dec-07 Bangor Hydro-Electric ME 10.20<br />
60 20-Dec-07 Duke Energy Carolinas NC 11.00<br />
61 21-Dec-07 San Diego Gas & Electric CA 11.10<br />
62 21-Dec-07 Pacific Gas and Electric CA 11.35<br />
63 21-Dec-07 Southern California Edison CA 11.50<br />
64 28-Dec-07 PacifiCorp ID 10.25<br />
65 31-Dec-07 Georgia Power GA 11.25<br />
66 8-Jan-08 Northern States Power WI 10.75<br />
67 17-Jan-08 Wisconsin Electric Power WI 10.75<br />
68 28-Jan-08 Connecticut Light & Power CT 9.40<br />
69 30-Jan-08 Potomac Electric Power DC 10.00<br />
70 31-Jan-08 Central Vermont VT 10.71<br />
71 6-Feb-08 Interstate Power & Light IA 11.70<br />
72 29-Feb-08 Fitchburg Gas & Electric MA 10.25<br />
73 12-Mar-08 PacifiCorp WY 10.25<br />
74 25-Mar-08 Consolidated Edison NY 9.10<br />
75 31-Mar-08 Virginia Electric Power VA 12.12<br />
76 22-Apr-08 MDU Resources MT 10.25<br />
77 24-Apr-08 Public Service Co. New Mexico NM 10.10<br />
78 1-May-08 Hawaiian Electric Company HI 10.70<br />
79 27-May-08 UNS Electric AZ 10.00<br />
80 10-Jun-08 Consumers Energy MI 10.70<br />
81 16-Jun-08 MidAmerican Energy IA 11.70<br />
82 27-Jun-08 Appalachian Power WV 10.50<br />
83 10-Jul-08 Otter Tail Corporation MN 10.43<br />
84 16-Jul-08 Orange and Rockland <strong>Utilities</strong> NY 9.40
Written Evidence of James H. Vander Weide, Ph.D.<br />
Page 44 of 87<br />
LINE<br />
NO.<br />
DATE COMPANY STATE <strong>ROE</strong><br />
85 30-Jul-08 Empire District Electric Co. MO 10.80<br />
86 11-Aug-08 PacifiCorp UT 10.25<br />
87 26-Aug-08 Southwestern Public Service NM 10.18<br />
88 27-Aug-08 MidAmerican Energy IA 11.70<br />
89 10-Sep-08 Commonwealth Edison IL 10.30<br />
90 24-Sep-08 Central Illinois Light IL 10.65<br />
91 24-Sep-08 Central Illinois Public Service IL 10.65<br />
92 24-Sep-08 Illinois Power IL 10.65<br />
93 30-Sep-08 Avista Corp. ID 10.20<br />
94 8-Oct-08 Puget Sound Energy WA 10.15<br />
95 13-Nov-08 NorthWestern Corporation MT 10.00<br />
96 17-Nov-08 Appalachian Power VA 10.20<br />
97 1-Dec-08 Tucson Electric Power AZ 10.25<br />
98 23-Dec-08 Detroit Edison MI 11.00<br />
99 29-Dec-08 Portland General Electric OR 10.10<br />
100 29-Dec-08 Avista Corp. WA 10.20<br />
101 31-Dec-08 Northern States Power ND 10.75<br />
102 Average 2006 - 2008 10.40<br />
103 Average 2008 10.47
Written Evidence of James H. Vander Weide, Ph.D.<br />
Page 45 of 87<br />
EXHIBIT 3 (CONTINUED)<br />
ALLOWED RETURNS ON EQUITY<br />
FOR U.S. ELECTRIC AND NATURAL GAS UTILITIES<br />
2006 – 2008<br />
NATURAL GAS UTILITIES<br />
LINE<br />
NO.<br />
DATE COMPANY STATE <strong>ROE</strong><br />
1 5-Jan-06 Northern States Power WI 11.00<br />
2 25-Jan-06 Wisconsin Electric Power WI 11.20<br />
3 25-Jan-06 Wisconsin Gas WI 11.20<br />
4 3-Feb-06 Public Service Colorado CO 10.50<br />
5 23-Feb-06 Southwest Gas AZ 9.50<br />
6 1-Mar-06 Aquila IA 10.40<br />
7 26-Apr-06 Sierra Pacific Power NV 10.60<br />
8 25-May-06 Atmos Energy LA 10.40<br />
9 24-Jul-06 Central Hudson Gas & Electric NY 9.60<br />
10 20-Sep-06 Knight Inc. WY 11.00<br />
11 26-Sep-06 Chesapeake <strong>Utilities</strong> MD 10.75<br />
12 20-Oct-06 Orange & Rockland <strong>Utilities</strong> NY 9.80<br />
13 2-Nov-06 Centerpoint Energy MN Gas MN 9.71<br />
14 9-Nov-06 Public Service E & G NJ 10.00<br />
15 21-Nov-06 Consumers Energy MI 11.00<br />
16 5-Dec-06 Chatanooga Gas TN 10.20<br />
17 5-Jan-07 Puget Sound Energy WA 10.40<br />
18 9-Jan-07 Semco Energy Gas MI 11.00<br />
19 11-Jan-07 Wisconsin Public Service WI 10.90<br />
20 19-Jan-07 Wisconsin Power & light WI 10.80<br />
21 26-Jan-07 Fitchburg Gas & Electric MA 10.00<br />
22 8-Feb-07 PPL Gas <strong>Utilities</strong> PA 10.40<br />
23 14-Mar-07 Connecticut Natural Gas CT 10.10<br />
24 20-Mar-07 Delmarva Power & Light DE 10.25<br />
25 22-Mar-07 Southern Union MO 10.50<br />
26 29-Mar-07 Atmos Energy TX 10.00<br />
27 5-Jun-07 Cascade Natural Gas OR 10.10<br />
28 13-Jun-07 Northern States Power ND 10.75<br />
29 29-Jun-07 Public Service New Mexico NM 9.53<br />
30 29-Jun-07 Yankee Gas Services CT 10.10<br />
31 3-Jul-07 Public Serivce Colorado CO 10.25<br />
32 13-Jul-07 Arkansas Western Gas AR 9.50<br />
33 24-Jul-07 Aquila NE 10.40<br />
34 1-Aug-07 Southern Indian Gas & Electric IN 10.15<br />
35 29-Aug-07 Columbia Gas of Kentucky KY 10.50<br />
36 10-Sep-07 Northern States Power MN 9.71<br />
37 19-Sep-07 Washington Gas Light VA 10.00<br />
38 8-Oct-07 Atmos Energy TN 10.48<br />
39 19-Oct-07 Delta Natural Gas KY 10.50<br />
40 25-Oct-07 Centerpoint Energy Resources AR 9.65<br />
41 15-Nov-07 Washington Gas Light MD 10.00<br />
42 20-Nov-07 Arkansas Oklahoma Gas AR 9.90
Written Evidence of James H. Vander Weide, Ph.D.<br />
Page 46 of 87<br />
LINE<br />
NO.<br />
DATE COMPANY STATE <strong>ROE</strong><br />
43 27-Nov-07 UNS Gas AZ 10.00<br />
44 29-Nov-07 Cheyenne Light Fuel & Power WY 10.90<br />
45 14-Dec-07 Madison Gas & Electric WI 10.80<br />
46 18-Dec-07 Northwestern Energy Div. NE 10.40<br />
47 19-Dec-07 Avista Corp. WA 10.20<br />
48 21-Dec-07 Brooklyn Union Gas NY 9.80<br />
49 21-Dec-07 Keyspan Gas East NY 9.80<br />
50 21-Dec-07 National Fuel Gas Distribution NY 9.10<br />
51 21-Dec-07 Pacific Gas & Electric CA 11.35<br />
52 21-Dec-07 San Diego Gas & Electric CA 11.10<br />
53 8-Jan-08 Northern States Power WI 10.75<br />
54 17-Jan-08 Wisconsin Electric Power WI 10.75<br />
55 17-Jan-08 Wisconsin Gas WI 10.75<br />
56 5-Feb-08 North Shore Gas IL 9.99<br />
57 5-Feb-08 Peoples Gas Light & Coke IL 10.19<br />
58 13-Feb-08 Indiana Gas IN 10.20<br />
59 31-Mar-08 Avista Corp. OR 10.00<br />
60 28-May-08 Duke Energy OH 10.50<br />
61 24-Jun-08 Atmos Energy TX 10.00<br />
62 27-Jun-08 Questar Gas UT 10.00<br />
63 27-Aug-08 SourceGas Distribution CO 10.25<br />
64 2-Sep-08 Chesapeake <strong>Utilities</strong> DE 10.25<br />
65 17-Sep-08 Atmos Energy GA 10.70<br />
66 24-Sep-08 Central Illinois Light IL 10.68<br />
67 24-Sep-08 Central Illinois Public Service IL 10.68<br />
68 24-Sep-08 Illinois Power IL 10.68<br />
69 30-Sep-08 Avista Corp. ID 10.20<br />
70 3-Oct-08 New Jersey Natural Gas NJ 10.30<br />
71 8-Oct-08 Puget Sound Energy WA 10.15<br />
72 20-Oct-08 CenterPoint Energy Resources TX 10.06<br />
73 24-Oct-08 Piedmont Natural Gas NC 10.60<br />
74 24-Oct-08 Public Service of North Carolina NC 10.60<br />
75 24-Nov-08 Southwest Gas-So. California Div. CA 10.50<br />
76 24-Nov-08 Southwest Gas-No. California Div. CA 10.50<br />
77 24-Nov-08 Southwest Gas-So. Lk. Tahoe Dist. CA 10.50<br />
78 24-Nov-08 Narragansett Electric RI 10.50<br />
79 3-Dec-08 Columbia Gas of Ohio OH 10.39<br />
80 24-Dec-08 Southwest Gas AZ 10.00<br />
81 26-Dec-08 Northwest Natural Gas WA 10.10<br />
82 29-Dec-08 Avista Corporation WA 10.20<br />
83 Average 2006 - 2008 10.33<br />
84 Average 2008 10.37
Written Evidence of James H. Vander Weide, Ph.D.<br />
Page 47 of 87<br />
EXHIBIT 4<br />
ALLOWED EQUITY RATIOS FOR<br />
U.S. ELECTRIC AND NATURAL GAS UTILITIES<br />
2006 – 2008 [6]<br />
ELECTRIC UTILITIES<br />
DATE COMPANY STATE COMMON<br />
EQUITY<br />
/TOTAL<br />
CAP<br />
(%)<br />
1/5/2006 Northern States Power Co-WI Wisconsin 53.66<br />
1/27/2006 United Illuminating Co. Connecticut 48.00<br />
3/3/2006 Interstate Power & Light Co. Minnesota 49.10<br />
4/17/2006 PacifiCorp Washington 46.00<br />
4/26/2006 Sierra Pacific Power Co. Nevada 40.76<br />
5/17/2006 Southern California Edison Co. California 48.00<br />
6/6/2006 Delmarva Power & Light Co. Delaware 47.72<br />
6/27/2006 Upper Peninsula Power Co. Michigan 47.12<br />
7/6/2006 Maine Public Service Co. Maine 50.00<br />
7/24/2006 Central Hudson Gas & Electric New York 45.00<br />
7/28/2006 Commonwealth Edison Co. Illinois 42.86<br />
8/23/2006 NY State Electric & Gas Corp. New York 41.60<br />
9/1/2006 Northern States Power Co. - MN Minnesota 51.67<br />
9/14/2006 PacifiCorp Oregon 50.00<br />
9/22/2006 Consolidated Edison Co. of NY New York 48.00<br />
10/6/2006 Unitil Energy Systems Inc. New Hampshire 43.10<br />
11/21/2006 Central Illinois Light Co. Illinois 45.57<br />
11/21/2006 Central Illinois Public Illinois 48.92<br />
11/21/2006 Illinois Power Co. Illinois 51.56<br />
11/30/2006 Duquesne Light Co. Pennsylvania 45.00<br />
12/1/2006 Public Service Co. of CO Colorado 60.00<br />
12/7/2006 Central Vermont Public Service Vermont 55.57<br />
12/21/2006 Empire District Electric Co. Missouri 50.80<br />
12/21/2006 Kansas City Power & Light Missouri 53.69<br />
12/22/2006 Green Mountain Power Corp. Vermont 52.76<br />
12/22/2006 Green Mountain Power Corp. Vermont 52.76<br />
1/5/2007 Oklahoma Gas and Electric Co. Arkansas 32.33<br />
1/11/2007 Metropolitan Edison Co. Pennsylvania 49.00<br />
1/11/2007 Pennsylvania Electric Co. Pennsylvania 49.00<br />
1/11/2007 Wisconsin Public Service Corp Wisconsin 57.46<br />
1/12/2007 Portland General Electric Co. Oregon 50.00<br />
1/13/2007 Puget Sound Energy Inc. Washington 44.00<br />
1/19/2007 Wisconsin Power and Light Co Wisconsin 54.13<br />
3/21/2007 Pacific Gas and Electric Co. California 52.00<br />
[6] Regulatory Research Associates, Inc., “Major Rate Case Decisions–January 2006–<br />
December 2007,” January 8, 2008; “Major Rate Case Decisions–January 2007-December<br />
2008,” January 12, <strong>2009</strong>.
Written Evidence of James H. Vander Weide, Ph.D.<br />
Page 48 of 87<br />
DATE COMPANY STATE COMMON<br />
EQUITY<br />
/TOTAL<br />
CAP<br />
(%)<br />
3/22/2007 Rockland Electric Company New Jersey 46.51<br />
5/15/2007 Appalachian Power Co. Virginia 41.11<br />
5/17/2007 KCP&L Greater Missouri Op Co Missouri 48.17<br />
5/17/2007 KCP&L Greater Missouri Op Co Missouri 48.17<br />
5/22/2007 Monongahela Power Co. West Virginia 46.07<br />
5/22/2007 Union Electric Co. Missouri 52.22<br />
5/23/2007 Nevada Power Co. Nevada 47.29<br />
5/25/2007 Public Service Co. of NH New Hampshire 47.66<br />
6/15/2007 Entergy Arkansas Inc. Arkansas 32.19<br />
6/21/2007 PacifiCorp Washington 46.00<br />
6/22/2007 Appalachian Power Co. West Virginia 42.88<br />
6/28/2007 Arizona Public Service Co. Arizona 54.50<br />
7/12/2007 Granite State Electric Company New Hampshire 50.00<br />
7/19/2007 Potomac Electric Power Co. Maryland 47.69<br />
7/19/2007 Delmarva Power & Light Co. Maryland 48.63<br />
8/15/2007 Southern Indiana Gas & Elec Co Indiana 47.05<br />
10/9/2007 Public Service Co. of OK Oklahoma 46.02<br />
10/17/2007 Orange & Rockland Utlts Inc. New York 47.54<br />
10/31/2007 Electric Transmission Texas Texas 40.00<br />
11/29/2007 Cheyenne Light Fuel Power Co. Wyoming 54.00<br />
12/6/2007 Kansas City Power & Light Missouri 57.62<br />
12/13/2007 AEP Texas Central Co. Texas 40.00<br />
12/14/2007 South Carolina Electric & Gas South Carolina 53.32<br />
12/14/2007 Madison Gas and Electric Co. Wisconsin 57.36<br />
12/19/2007 Avista Corp. Washington 46.00<br />
12/20/2007 Duke Energy Carolinas LLC North Carolina 53.00<br />
12/28/2007 PacifiCorp Idaho 50.40<br />
1/8/2008 Northern States Power Co-WI Wisconsin 52.51<br />
1/17/2008 Wisconsin Electric Power Co. Wisconsin 54.36<br />
1/28/2008 Connecticut Light & Power Co. Connecticut 48.99<br />
1/30/2008 Potomac Electric Power Co. District of Columbia 46.55<br />
1/31/2008 Central Vermont Public Service Vermont 50.02<br />
2/29/2008 Fitchburg Gas & Electric Light Massachusetts 42.80<br />
3/12/2008 PacifiCorp Wyoming 50.80<br />
3/25/2008 Consolidated Edison Co. of NY New York 47.98<br />
4/22/2008 MDU Resources Group Inc. Montana 50.67<br />
4/24/2008 Public Service Co. of NM New Mexico 51.37<br />
5/1/2008 Hawaiian Electric Co. Hawaii 55.79<br />
5/27/2008 UNS Electric Inc. Arizona 48.85<br />
6/10/2008 Consumers Energy Co. Michigan 41.75<br />
6/27/2008 Appalachian Power Co. West Virginia 41.54<br />
6/27/2008 Sierra Pacific Power Co. Nevada 43.49<br />
7/10/2008 Otter Tail Corp. Minnesota 50.00<br />
7/16/2008 Orange & Rockland Utlts Inc. New York 48.00
Written Evidence of James H. Vander Weide, Ph.D.<br />
Page 49 of 87<br />
DATE COMPANY STATE COMMON<br />
EQUITY<br />
/TOTAL<br />
CAP<br />
(%)<br />
7/30/2008 Empire District Electric Co. Missouri 50.78<br />
7/31/2008 San Diego Gas & Electric Co. California 49.00<br />
8/11/2008 PacifiCorp Utah 50.40<br />
8/26/2008 Southwestern Public Service Co New Mexico 51.23<br />
9/10/2008 Commonwealth Edison Co. Illinois 45.04<br />
9/17/2008 Consolidated Edison Co. of NY New York 48.00<br />
9/24/2008 Central Illinois Light Co. Illinois 46.50<br />
9/24/2008 Central Illinois Public Illinois 47.91<br />
9/24/2008 Illinois Power Co. Illinois 51.76<br />
9/30/2008 Avista Corp. Idaho 47.94<br />
10/8/2008 Puget Sound Energy Inc. Washington 46.00<br />
12/1/2008 Tucson Electric Power Co. Arizona 42.50<br />
12/23/2008 Detroit Edison Co. Michigan 40.68<br />
12/29/2008 Avista Corp. Washington 46.30<br />
12/29/2008 Portland General Electric Co. Oregon 50.00<br />
12/30/2008 Wisconsin Public Service Corp Wisconsin 53.41<br />
12/31/2008 Northern States Power Co. - MN North Dakota 51.77<br />
Average 48.35<br />
Average 2008 48.43
Written Evidence of James H. Vander Weide, Ph.D.<br />
Page 50 of 87<br />
EXHIBIT 4 (CONTINUED)<br />
ALLOWED EQUITY RATIOS FOR<br />
U.S. ELECTRIC AND NATURAL GAS UTILITIES<br />
2006 – 2008 [7]<br />
NATURAL GAS UTILITIES<br />
DATE COMPANY STATE COMMON<br />
EQUITY<br />
/TOTAL<br />
CAP<br />
(%)<br />
1/5/2006 Northern States Power Co-WI Wisconsin 53.66<br />
1/25/2006 Wisconsin Gas LLC Wisconsin 50.20<br />
1/25/2006 Wisconsin Electric Power Co. Wisconsin 56.34<br />
2/3/2006 Public Service Co. of CO Colorado 55.49<br />
2/23/2006 Southwest Gas Corp. Arizona 40.00<br />
3/1/2006 KCP&L Greater Missouri Op Co Iowa 51.39<br />
4/26/2006 Sierra Pacific Power Co. Nevada 40.76<br />
7/24/2006 Central Hudson Gas & Electric New York 45.00<br />
9/20/2006 SourceGas Distribution LLC Wyoming 43.56<br />
9/26/2006 Chesapeake <strong>Utilities</strong> Corp. Maryland 53.00<br />
10/20/2006 Orange & Rockland Utlts Inc. New York 48.00<br />
11/2/2006 CenterPoint Energy Resources Minnesota 46.14<br />
11/9/2006 Public Service Electric Gas New Jersey 47.40<br />
11/21/2006 Consumers Energy Co. Michigan 35.06<br />
12/5/2006 Chattanooga Gas Company Tennessee 44.80<br />
1/5/2007 Puget Sound Energy Inc. Washington 44.00<br />
1/9/2007 SEMCO Energy Inc. Michigan 42.94<br />
1/11/2007 Wisconsin Public Service Corp Wisconsin 57.46<br />
1/19/2007 Wisconsin Power and Light Co Wisconsin 54.13<br />
2/8/2007 UGI Central Penn Gas Pennsylvania 51.79<br />
3/14/2007 CT Natural Gas Corp. Connecticut 53.60<br />
3/20/2007 Delmarva Power & Light Co. Delaware 46.90<br />
3/21/2007 Pacific Gas and Electric Co. California 52.00<br />
3/22/2007 Southern Union Co. Missouri 36.06<br />
3/29/2007 Atmos Energy Corp. Texas 48.10<br />
6/13/2007 Northern States Power Co. - MN North Dakota 51.59<br />
6/29/2007 Yankee Gas Services Co. Connecticut 50.30<br />
6/29/2007 Public Service Co. of NM New Mexico 51.80<br />
7/3/2007 Public Service Co. of CO Colorado 60.17<br />
7/13/2007 Arkansas Western Gas Co. Arkansas 34.29<br />
7/24/2007 Black Hills/Nebraska Gas Nebraska 50.73<br />
8/1/2007 Southern Indiana Gas & Elec Co Indiana 47.05<br />
[7] Regulatory Research Associates, Inc., “Major Rate Case Decisions–January 2006–<br />
December 2007,” January 8, 2008; “Major Rate Case Decisions–January–March 2008,” April<br />
2, 2008. Data not included for companies whose ratios are identified as including "cost-free<br />
items or tax credit balances at the overall rate of return." This does not substantially affect<br />
the average result.
Written Evidence of James H. Vander Weide, Ph.D.<br />
Page 51 of 87<br />
DATE COMPANY STATE COMMON<br />
EQUITY<br />
/TOTAL<br />
CAP<br />
(%)<br />
9/10/2007 Northern States Power Co. - MN Minnesota 51.98<br />
9/25/2007 Consolidated Edison Co. of NY New York 48.00<br />
10/8/2007 Atmos Energy Corp. Tennessee 44.20<br />
10/25/2007 CenterPoint Energy Resources Arkansas 33.73<br />
11/15/2007 Washington Gas Light Co. Maryland 53.02<br />
11/20/2007 Arkansas Oklahoma Gas Corp. Arkansas 41.46<br />
11/27/2007 UNS Gas Inc. Arizona 50.00<br />
11/29/2007 Cheyenne Light Fuel Power Co. Wyoming 54.00<br />
12/14/2007 Madison Gas and Electric Co. Wisconsin 57.36<br />
12/19/2007 Avista Corp. Washington 46.00<br />
12/21/2007 National Fuel Gas Dist Corp. New York 44.35<br />
1/8/2008 Northern States Power Co-WI Wisconsin 52.51<br />
1/17/2008 Wisconsin Gas LLC Wisconsin 46.64<br />
1/17/2008 Wisconsin Electric Power Co. Wisconsin 54.36<br />
2/5/2008 North Shore Gas Co. Illinois 56.00<br />
2/5/2008 Peoples Gas Light & Coke Co. Illinois 56.00<br />
2/13/2008 Indiana Gas Co. Indiana 48.99<br />
3/31/2008 Avista Corp. Oregon 50.00<br />
5/28/2008 Duke Energy Ohio Inc. Ohio 55.76<br />
6/24/2008 Atmos Energy Corp. Texas 48.27<br />
6/27/2008 Questar Gas Co. Utah 51.38<br />
7/31/2008 Southern California Gas Co. California 48.00<br />
7/31/2008 San Diego Gas & Electric Co. California 49.00<br />
8/27/2008 SourceGas Distribution LLC Colorado 53.13<br />
9/2/2008 Chesapeake <strong>Utilities</strong> Corp. Delaware 61.81<br />
9/17/2008 Atmos Energy Corp. Georgia 45.00<br />
9/24/2008 Central Illinois Light Co. Illinois 46.50<br />
9/24/2008 Central Illinois Public Illinois 47.91<br />
9/24/2008 Illinois Power Co. Illinois 51.76<br />
9/30/2008 Avista Corp. Idaho 47.94<br />
10/3/2008 New Jersey Natural Gas Co. New Jersey 51.20<br />
10/8/2008 Puget Sound Energy Inc. Washington 46.00<br />
10/20/2008 CenterPoint Energy Resources Texas 55.40<br />
10/24/2008 Piedmont Natural Gas Co. North Carolina 51.00<br />
10/24/2008 Public Service Co. of NC North Carolina 54.00<br />
11/21/2008 Southwest Gas Corp. California 47.00<br />
11/21/2008 Southwest Gas Corp. California 47.00<br />
11/21/2008 Southwest Gas Corp. California 47.00<br />
12/24/2008 Southwest Gas Corp. Arizona 43.44<br />
12/26/2008 Northwest Natural Gas Co. Washington 50.74<br />
12/29/2008 Avista Corp. Washington 46.30<br />
12/30/2008 Wisconsin Public Service Corp Wisconsin 53.41<br />
Average 2006 – 2008 49.07<br />
Average 2008 50.43
Written Evidence of James H. Vander Weide, Ph.D.<br />
Page 52 of 87<br />
EXHIBIT 5<br />
COMPARISON OF DCF EXPECTED RETURN ON AN INVESTMENT IN<br />
ELECTRIC UTILITIES TO THE INTEREST RATE<br />
ON LONG-TERM GOVERNMENT BONDS<br />
LINE<br />
NO.<br />
DATE DCF BOND YIELD RISK<br />
PREMIUM<br />
1 Sep-99 11.69% 6.50% 5.19%<br />
2 Oct-99 11.77% 6.66% 5.11%<br />
3 Nov-99 12.08% 6.48% 5.60%<br />
4 Dec-99 12.58% 6.69% 5.89%<br />
5 Jan-00 12.50% 6.86% 5.64%<br />
6 Feb-00 12.95% 6.54% 6.41%<br />
7 Mar-00 13.36% 6.38% 6.98%<br />
8 Apr-00 12.57% 6.18% 6.39%<br />
9 May-00 12.42% 6.55% 5.87%<br />
10 Jun-00 12.66% 6.28% 6.38%<br />
11 Jul-00 12.76% 6.20% 6.56%<br />
12 Aug-00 12.47% 6.02% 6.45%<br />
13 Sep-00 11.80% 6.09% 5.71%<br />
14 Oct-00 11.82% 6.04% 5.78%<br />
15 Nov-00 11.87% 5.98% 5.89%<br />
16 Dec-00 11.69% 5.64% 6.05%<br />
17 Jan-01 12.05% 5.65% 6.40%<br />
18 Feb-01 12.10% 5.62% 6.48%<br />
19 Mar-01 12.15% 5.49% 6.66%<br />
20 Apr-01 12.77% 5.78% 6.99%<br />
21 May-01 13.04% 5.92% 7.12%<br />
22 Jun-01 13.09% 5.82% 7.27%<br />
23 Jul-01 13.24% 5.75% 7.49%<br />
24 Aug-01 13.30% 5.58% 7.72%<br />
25 Sep-01 13.56% 5.53% 8.03%<br />
26 Oct-01 13.34% 5.34% 8.00%<br />
27 Nov-01 13.38% 5.33% 8.05%<br />
28 Dec-01 13.35% 5.76% 7.59%<br />
29 Jan-02 13.14% 5.69% 7.45%<br />
30 Feb-02 13.27% 5.61% 7.66%<br />
31 Mar-02 12.86% 5.93% 6.93%<br />
32 Apr-02 12.50% 5.85% 6.65%<br />
33 May-02 12.58% 5.81% 6.77%<br />
34 Jun-02 12.57% 5.65% 6.92%<br />
35 Jul-02 13.22% 5.51% 7.71%<br />
36 Aug-02 12.69% 5.19% 7.50%<br />
37 Sep-02 12.88% 4.87% 8.01%<br />
38 Oct-02 12.92% 5.00% 7.92%<br />
39 Nov-02 12.38% 5.04% 7.34%<br />
40 Dec-02 12.08% 5.01% 7.07%<br />
41 Jan-03 11.72% 5.02% 6.70%<br />
42 Feb-03 12.10% 4.87% 7.23%<br />
43 Mar-03 11.71% 4.82% 6.89%<br />
44 Apr-03 11.31% 4.91% 6.40%
LINE<br />
NO.<br />
Written Evidence of James H. Vander Weide, Ph.D.<br />
Page 53 of 87<br />
DATE DCF BOND YIELD RISK<br />
PREMIUM<br />
45 May-03 10.72% 4.52% 6.20%<br />
46 Jun-03 10.27% 4.34% 5.93%<br />
47 Jul-03 10.34% 4.92% 5.42%<br />
48 Aug-03 10.35% 5.39% 4.96%<br />
49 Sep-03 10.06% 5.21% 4.85%<br />
50 Oct-03 9.89% 5.21% 4.68%<br />
51 Nov-03 9.78% 5.17% 4.61%<br />
52 Dec-03 9.49% 5.11% 4.38%<br />
53 Jan-04 9.23% 5.01% 4.22%<br />
54 Feb-04 9.19% 4.94% 4.25%<br />
55 Mar-04 9.16% 4.72% 4.44%<br />
56 Apr-04 9.27% 5.16% 4.11%<br />
57 May-04 9.66% 5.46% 4.20%<br />
58 Jun-04 9.67% 5.45% 4.22%<br />
59 Jul-04 9.59% 5.24% 4.35%<br />
60 Aug-04 9.64% 5.07% 4.57%<br />
61 Sep-04 9.56% 4.89% 4.67%<br />
62 Oct-04 9.53% 4.85% 4.68%<br />
63 Nov-04 9.11% 4.89% 4.22%<br />
64 Dec-04 9.31% 4.88% 4.43%<br />
65 Jan-05 9.33% 4.77% 4.56%<br />
66 Feb-05 9.30% 4.61% 4.69%<br />
67 Mar-05 9.25% 4.89% 4.36%<br />
68 Apr-05 9.27% 4.75% 4.52%<br />
69 May-05 9.22% 4.56% 4.66%<br />
70 Jun-05 9.27% 4.35% 4.92%<br />
71 Jul-05 9.13% 4.48% 4.65%<br />
72 Aug-05 9.23% 4.53% 4.70%<br />
73 Sep-05 9.50% 4.51% 4.99%<br />
74 Oct-05 9.62% 4.74% 4.88%<br />
75 Nov-05 10.05% 4.83% 5.22%<br />
76 Dec-05 10.12% 4.73% 5.39%<br />
77 Jan-06 10.15% 4.65% 5.50%<br />
78 Feb-06 11.26% 4.73% 6.53%<br />
79 Mar-06 11.11% 4.91% 6.20%<br />
80 Apr-06 11.22% 5.22% 6.00%<br />
81 May-06 11.18% 5.35% 5.83%<br />
82 Jun-06 11.57% 5.29% 6.28%<br />
83 Jul-06 11.51% 5.25% 6.26%<br />
84 Aug-06 11.38% 5.08% 6.30%<br />
85 Sep-06 11.64% 4.93% 6.71%<br />
86 Oct-06 11.54% 4.94% 6.60%<br />
87 Nov-06 11.58% 4.78% 6.80%<br />
88 Dec-06 11.45% 4.78% 6.67%<br />
89 Jan-07 11.36% 4.95% 6.41%<br />
90 Feb-07 11.10% 4.93% 6.17%<br />
91 Mar-07 11.20% 4.81% 6.39%<br />
92 Apr-07 10.74% 4.95% 5.79%<br />
93 May-07 11.08% 4.98% 6.10%<br />
94 Jun-07 11.69% 5.29% 6.40%<br />
95 Jul-07 11.79% 5.19% 6.60%<br />
96 Aug-07 11.69% 5.00% 6.69%
LINE<br />
NO.<br />
Written Evidence of James H. Vander Weide, Ph.D.<br />
Page 54 of 87<br />
DATE DCF BOND YIELD RISK<br />
PREMIUM<br />
97 Sep-07 11.35% 4.84% 6.51%<br />
98 Oct-07 11.29% 4.83% 6.46%<br />
99 Nov-07 11.08% 4.56% 6.52%<br />
100 Dec-07 11.29% 4.57% 6.72%<br />
101 Jan-08 12.29% 4.35% 7.94%<br />
102 Feb-08 11.43% 4.49% 6.94%<br />
103 Mar-08 11.78% 4.36% 7.42%<br />
104 Apr-08 11.37% 4.44% 6.93%<br />
105 May-08 11.42% 4.60% 6.82%<br />
106 Jun-08 11.23% 4.74% 6.49%<br />
107 Jul-08 11.72% 4.62% 7.10%<br />
108 Aug-08 11.84% 4.53% 7.31%<br />
109 Sep-08 11.28% 5.32% 5.96%<br />
110 Oct-08 12.19% 4.45% 7.74%<br />
111 Nov-08 12.47% 4.27% 8.20%<br />
112 Dec-08 12.46% 3.18% 9.28%<br />
113 Jan-09 12.25% 3.46% 8.79%<br />
114 Feb-09 12.54% 3.83% 8.71%<br />
115 Average 11.38% 5.17% 6.21%<br />
Notes: See written evidence above and Appendix 3 for a description of the ex ante methodology and<br />
data employed. Government bond yield information from the Federal Reserve. DCF results are<br />
calculated using a quarterly DCF model as follows:<br />
d0 = Latest quarterly dividend per Value Line<br />
P0 = Average of the monthly high and low stock prices for each month per Thomson<br />
Reuters.<br />
FC = Flotation costs expressed as a percent of gross proceeds.<br />
g = I/B/E/S forecast of future earnings growth for each month.<br />
k = Cost of equity using the quarterly version of the DCF model.<br />
1 ⎡<br />
(1+<br />
g<br />
⎤<br />
d ) 4<br />
k = ⎢ 0 ⎥<br />
⎢P0<br />
( 1−<br />
FC)<br />
⎥<br />
⎣ ⎦<br />
4<br />
- 1
Written Evidence of James H. Vander Weide, Ph.D.<br />
Page 55 of 87<br />
EXHIBIT 6<br />
COMPARISON OF DCF EXPECTED RETURN ON AN INVESTMENT IN<br />
NATURAL GAS UTILITIES TO THE INTEREST RATE<br />
ON LONG-TERM GOVERNMENT BONDS<br />
LINE<br />
NO.<br />
DATE DCF BOND<br />
RISK<br />
YIELD PREMIUM<br />
1 Jun-98 11.54% 5.80% 5.74%<br />
2 Jul-98 11.86% 5.78% 6.08%<br />
3 Aug-98 12.34% 5.66% 6.68%<br />
4 Sep-98 12.73% 5.38% 7.35%<br />
5 Oct-98 12.60% 5.30% 7.30%<br />
6 Nov-98 12.11% 5.48% 6.63%<br />
7 Dec-98 11.85% 5.36% 6.49%<br />
8 Jan-99 11.95% 5.45% 6.50%<br />
9 Feb-99 12.43% 5.66% 6.77%<br />
10 Mar-99 12.57% 5.87% 6.70%<br />
11 Apr-99 12.60% 5.82% 6.78%<br />
12 May-99 12.21% 6.08% 6.13%<br />
13 Jun-99 12.08% 6.36% 5.72%<br />
14 Jul-99 12.22% 6.28% 5.94%<br />
15 Aug-99 12.20% 6.43% 5.77%<br />
16 Sep-99 12.26% 6.50% 5.76%<br />
17 Oct-99 12.33% 6.66% 5.67%<br />
18 Nov-99 12.40% 6.48% 5.92%<br />
19 Dec-99 12.80% 6.69% 6.11%<br />
20 Jan-00 13.01% 6.86% 6.15%<br />
21 Feb-00 13.44% 6.54% 6.90%<br />
22 Mar-00 13.44% 6.38% 7.06%<br />
23 Apr-00 13.16% 6.18% 6.98%<br />
24 May-00 12.92% 6.55% 6.37%<br />
25 Jun-00 12.95% 6.28% 6.67%<br />
26 Jul-00 13.17% 6.20% 6.97%<br />
27 Aug-00 12.90% 6.02% 6.88%<br />
28 Sep-00 12.57% 6.09% 6.48%<br />
29 Oct-00 12.60% 6.04% 6.56%<br />
30 Nov-00 12.51% 5.98% 6.53%<br />
31 Dec-00 12.39% 5.64% 6.75%<br />
32 Jan-01 12.61% 5.65% 6.96%<br />
33 Feb-01 12.61% 5.62% 6.99%<br />
34 Mar-01 12.75% 5.49% 7.26%<br />
35 Apr-01 12.27% 5.78% 6.49%<br />
36 May-01 13.02% 5.92% 7.10%<br />
37 Jun-01 13.04% 5.82% 7.22%<br />
38 Jul-01 13.38% 5.75% 7.63%<br />
39 Aug-01 13.27% 5.58% 7.69%<br />
40 Sep-01 12.68% 5.53% 7.15%
LINE<br />
NO.<br />
Written Evidence of James H. Vander Weide, Ph.D.<br />
Page 56 of 87<br />
DATE DCF BOND<br />
RISK<br />
YIELD PREMIUM<br />
41 Oct-01 12.68% 5.34% 7.34%<br />
42 Nov-01 12.68% 5.33% 7.35%<br />
43 Dec-01 12.54% 5.76% 6.78%<br />
44 Jan-02 12.36% 5.69% 6.67%<br />
45 Feb-02 12.41% 5.61% 6.80%<br />
46 Mar-02 11.89% 5.93% 5.96%<br />
47 Apr-02 11.59% 5.85% 5.74%<br />
48 May-02 11.62% 5.81% 5.81%<br />
49 Jun-02 11.70% 5.65% 6.05%<br />
50 Jul-02 12.42% 5.51% 6.91%<br />
51 Aug-02 12.34% 5.19% 7.15%<br />
52 Sep-02 12.60% 4.87% 7.73%<br />
53 Oct-02 12.50% 5.00% 7.50%<br />
54 Nov-02 12.21% 5.04% 7.17%<br />
55 Dec-02 12.16% 5.01% 7.15%<br />
56 Jan-03 12.19% 5.02% 7.17%<br />
57 Feb-03 12.32% 4.87% 7.45%<br />
58 Mar-03 11.95% 4.82% 7.13%<br />
59 Apr-03 11.62% 4.91% 6.71%<br />
60 May-03 11.26% 4.52% 6.74%<br />
61 Jun-03 11.14% 4.34% 6.80%<br />
62 Jul-03 11.27% 4.92% 6.35%<br />
63 Aug-03 11.39% 5.39% 6.00%<br />
64 Sep-03 11.27% 5.21% 6.06%<br />
65 Oct-03 11.23% 5.21% 6.02%<br />
66 Nov-03 10.89% 5.17% 5.72%<br />
67 Dec-03 10.71% 5.11% 5.60%<br />
68 Jan-04 10.59% 5.01% 5.58%<br />
69 Feb-04 10.39% 4.94% 5.45%<br />
70 Mar-04 10.37% 4.72% 5.65%<br />
71 Apr-04 10.41% 5.16% 5.25%<br />
72 May-04 10.45% 5.46% 4.99%<br />
73 Jun-04 10.36% 5.45% 4.91%<br />
74 Jul-04 10.11% 5.24% 4.87%<br />
75 Aug-04 10.08% 5.07% 5.01%<br />
76 Sep-04 9.76% 4.89% 4.87%<br />
77 Oct-04 9.74% 4.85% 4.89%<br />
78 Nov-04 9.62% 4.89% 4.73%<br />
79 Dec-04 9.70% 4.88% 4.82%<br />
80 Jan-05 9.90% 4.77% 5.13%<br />
81 Feb-05 9.79% 4.61% 5.18%<br />
82 Mar-05 9.79% 4.89% 4.90%<br />
83 Apr-05 9.88% 4.75% 5.13%<br />
84 May-05 9.81% 4.56% 5.25%<br />
85 Jun-05 9.76% 4.35% 5.41%<br />
86 Jul-05 9.66% 4.48% 5.18%<br />
87 Aug-05 9.69% 4.53% 5.16%
Written Evidence of James H. Vander Weide, Ph.D.<br />
Page 57 of 87<br />
LINE DATE DCF BOND<br />
RISK<br />
NO.<br />
YIELD PREMIUM<br />
88 Sep-05 9.80% 4.51% 5.29%<br />
89 Oct-05 9.90% 4.74% 5.16%<br />
90 Nov-05 10.49% 4.83% 5.66%<br />
91 Dec-05 10.45% 4.73% 5.72%<br />
92 Jan-06 9.82% 4.65% 5.17%<br />
93 Feb-06 11.24% 4.73% 6.51%<br />
94 Mar-06 11.27% 4.91% 6.36%<br />
95 Apr-06 11.00% 5.22% 5.78%<br />
96 May-06 10.56% 5.35% 5.21%<br />
97 Jun-06 10.49% 5.29% 5.20%<br />
98 Jul-06 10.87% 5.25% 5.62%<br />
99 Aug-06 10.41% 5.08% 5.33%<br />
100 Sep-06 10.53% 4.93% 5.60%<br />
101 Oct-06 10.30% 4.94% 5.36%<br />
102 Nov-06 10.33% 4.78% 5.55%<br />
103 Dec-06 10.35% 4.78% 5.57%<br />
104 Jan-07 10.13% 4.95% 5.18%<br />
105 Feb-07 10.18% 4.93% 5.25%<br />
106 Mar-07 10.18% 4.81% 5.37%<br />
107 Apr-07 10.07% 4.95% 5.12%<br />
108 May-07 9.67% 4.98% 4.69%<br />
109 Jun-07 9.70% 5.29% 4.41%<br />
110 Jul-07 10.06% 5.19% 4.87%<br />
111 Aug-07 10.21% 5.00% 5.21%<br />
112 Sep-07 10.14% 4.84% 5.30%<br />
113 Oct-07 10.80% 4.83% 5.97%<br />
114 Nov-07 10.83% 4.56% 6.27%<br />
115 Dec-07 10.84% 4.57% 6.27%<br />
116 Jan-08 11.13% 4.35% 6.78%<br />
117 Feb-08 11.39% 4.49% 6.90%<br />
118 Mar-08 11.47% 4.36% 7.11%<br />
119 Apr-08 11.67% 4.44% 7.23%<br />
120 May-08 10.69% 4.60% 6.09%<br />
121 Jun-08 10.62% 4.74% 5.88%<br />
122 Jul-08 10.86% 4.62% 6.24%<br />
123 Aug-08 11.23% 4.53% 6.70%<br />
124 Sep-08 11.30% 5.32% 5.98%<br />
125 Oct-08 12.13% 4.45% 7.68%<br />
126 Nov-08 12.21% 4.27% 7.94%<br />
127 Dec-08 11.62% 3.18% 8.44%<br />
128 Jan-09 11.31% 3.46% 7.85%<br />
129 Feb-09 11.55% 3.83% 7.72%<br />
130 Average 11.43% 5.24% 6.19%<br />
Notes: Government bond yield information from the Federal Reserve. DCF results are calculated<br />
using a quarterly DCF model as follows:
Written Evidence of James H. Vander Weide, Ph.D.<br />
Page 58 of 87<br />
d0 = Latest quarterly dividend per Value Line<br />
P0 = Average of the monthly high and low stock prices for each month per Thomson<br />
Reuters.<br />
FC = Flotation costs expressed as a percent of gross proceeds.<br />
g = I/B/E/S forecast of future earnings growth for each month<br />
k = Cost of equity using the quarterly version of the DCF model.<br />
1 ⎡<br />
(1+<br />
g<br />
⎤<br />
d ) 4<br />
k = ⎢ 0 ⎥<br />
⎢P0<br />
( 1−<br />
FC)<br />
⎥<br />
⎣ ⎦<br />
4<br />
- 1
Written Evidence of James H. Vander Weide, Ph.D.<br />
Page 59 of 87<br />
EXHIBIT 7<br />
IMPLIED ALLOWED EQUITY RISK PREMIUM [8]<br />
YEAR<br />
AVERAGE<br />
ALLOWED<br />
RETURN<br />
20-YEAR<br />
U.S.<br />
TREASURY<br />
BOND<br />
RISK<br />
PREMIUM<br />
1988 0.1282 0.0859 0.0423<br />
1989 0.1293 0.0896 0.0397<br />
1990 0.1269 0.0845 0.0424<br />
1991 0.1251 0.0861 0.0390<br />
1992 0.1206 0.0814 0.0392<br />
1993 0.1137 0.0767 0.0370<br />
1994 0.1134 0.0629 0.0505<br />
1995 0.1151 0.0749 0.0402<br />
1996 0.1129 0.0695 0.0434<br />
1997 0.1134 0.0683 0.0451<br />
1998 0.1159 0.0669 0.0490<br />
1999 0.1074 0.0572 0.0502<br />
2000 0.1141 0.0620 0.0521<br />
2001 0.1105 0.0623 0.0482<br />
2002 0.1110 0.0563 0.0547<br />
2003 0.1098 0.0543 0.0555<br />
2004 0.1067 0.0496 0.0571<br />
2005 0.1050 0.0504 0.0546<br />
2006 0.1039 0.0464 0.0575<br />
2007 0.1030 0.0500 0.0530<br />
2008 0.1042 0.0491 0.0551<br />
IMPLIED ALLOWED EQUITY RISK PREMIUM<br />
REGRESSION RESULTS<br />
INTERCEPT COEFFICIENT 0.0776<br />
Slope Coefficient (0.4509)<br />
Treasury Bond Yield 0.0480<br />
Slope x Bond Yield (0.0216)<br />
Forecast Risk Premium 0.0560<br />
Treasury bond yield is 2010 forecast at March <strong>2009</strong> from Global Insight.<br />
[8] Regulatory Research Associates, Inc., “Major Rate Case Decisions–January 2006–<br />
December 2007,” January 8, 2008; “Major Rate Case Decisions–January 2007–December<br />
2008,” January 12, <strong>2009</strong>. Treasury bond yield is 2010 forecast at March <strong>2009</strong> from Global<br />
Insight.
Notes:<br />
LINE<br />
NO.<br />
Written Evidence of James H. Vander Weide, Ph.D.<br />
Page 60 of 87<br />
EXHIBIT 8<br />
SUMMARY OF DISCOUNTED CASH FLOW ANALYSIS<br />
FOR VALUE LINE ELECTRIC COMPANIES<br />
COMPANY D0 P0 GROWTH COST OF<br />
EQUITY<br />
1 Amer. Elec. Power 0.410 31.363 4.16% 10.1%<br />
2 Avista Corp. 0.180 17.990 4.67% 9.1%<br />
3 Dominion Resources 0.438 34.423 8.16% 13.8%<br />
4 DPL Inc. 0.275 21.508 10.33% 16.6%<br />
5 Duke Energy 0.230 14.863 4.46% 11.5%<br />
6 Consol. Edison 0.585 39.205 2.61% 9.3%<br />
7 Entergy Corp. 0.750 77.203 9.42% 14.1%<br />
8 Exelon Corp. 0.525 53.210 8.47% 13.1%<br />
9 FirstEnergy Corp. 0.550 49.527 9.00% 14.4%<br />
10 FPL Group 0.473 48.890 9.62% 14.1%<br />
11 NSTAR 0.375 34.283 6.00% 10.8%<br />
12 Northeast <strong>Utilities</strong> 0.238 23.365 8.15% 12.5%<br />
13 PG&E Corp. 0.390 37.313 6.84% 11.7%<br />
14 Progress Energy 0.620 38.453 5.56% 13.0%<br />
15 Pinnacle West <strong>Capital</strong> 0.525 31.242 4.33% 12.0%<br />
16 Pepco Holdings 0.270 17.060 4.67% 12.0%<br />
17 Portland General 0.245 18.268 5.44% 11.6%<br />
18 SCANA Corp. 0.460 34.060 4.52% 10.7%<br />
19 Southern Co. 0.420 34.428 5.36% 11.0%<br />
20 Sempra Energy 0.350 42.948 7.20% 10.9%<br />
21 Vectren Corp. 0.335 24.848 7.20% 13.4%<br />
22 Wisconsin Energy 0.338 42.678 9.13% 12.3%<br />
23 Westar Energy 0.290 19.268 3.84% 10.7%<br />
24 Xcel Energy Inc. 0.238 18.153 6.72% 12.8%<br />
25 Market-Weighted Average 12.4%<br />
d0 = Most recent quarterly dividend.<br />
d1,d2,d3,d4 = Next four quarterly dividends, calculated by multiplying the last four quarterly<br />
dividends per Value Line by the factor (1 + g).<br />
P0 = Average of the monthly high and low stock prices during the three months ending<br />
February <strong>2009</strong> per Thomson Reuters.<br />
FC = Flotation costs expressed as a percent of gross proceeds.<br />
g = I/B/E/S forecast of future earnings growth February <strong>2009</strong>.<br />
k = Cost of equity using the quarterly version of the DCF model.<br />
. 75<br />
. 50<br />
. 25<br />
d1<br />
( 1+<br />
k)<br />
+ d 2(<br />
1+<br />
k)<br />
+ d 3(<br />
1+<br />
k)<br />
+ d 4<br />
k =<br />
+<br />
P ( 1−<br />
FC)<br />
0<br />
g
LINE<br />
NO.<br />
Written Evidence of James H. Vander Weide, Ph.D.<br />
Page 61 of 87<br />
EXHIBIT 9<br />
SUMMARY OF DISCOUNTED CASH FLOW ANALYSIS<br />
FOR VALUE LINE NATURAL GAS COMPANIES<br />
COMPANY D0 P0 GROWTH COST OF<br />
EQUITY<br />
1 AGL Resources 0.430 30.354 4.25% 10.6%<br />
2 Atmos Energy 0.330 23.847 5.00% 11.3%<br />
3 Equitable Resources 0.220 32.892 11.67% 15.0%<br />
4 Nicor Inc. 0.465 34.098 2.85% 9.0%<br />
5 NiSource Inc. 0.230 10.462 1.60% 11.4%<br />
6 Northwest Nat. Gas 0.395 43.777 4.75% 8.8%<br />
7 Piedmont Natural Gas 0.260 28.345 7.13% 11.4%<br />
8 South Jersey Inds. 0.284 37.268 7.50% 11.0%<br />
9 Questar Corp. 0.125 31.988 9.00% 10.8%<br />
10 Southwest Gas 0.238 24.100 6.00% 10.3%<br />
11 Market-Weighted Average 11.5%<br />
Notes:<br />
d0 = Most recent quarterly dividend.<br />
d1,d2,d3,d4 = Next four quarterly dividends, calculated by multiplying the last four quarterly<br />
dividends per Value Line by the factor (1 + g).<br />
P0 = Average of the monthly high and low stock prices during the three months ending<br />
February <strong>2009</strong> per Thomson Reuters.<br />
FC<br />
g<br />
=<br />
=<br />
Flotation costs expressed as a percent of gross proceeds.<br />
I/B/E/S forecast of future earnings growth February <strong>2009</strong>. [9]<br />
k = Cost of equity using the quarterly version of the DCF model.<br />
. 75<br />
. 50<br />
. 25<br />
d1(<br />
1+<br />
k)<br />
+ d 2(<br />
1+<br />
k)<br />
+ d 3(<br />
1+<br />
k)<br />
+ d 4<br />
k =<br />
+<br />
P ( 1−<br />
FC)<br />
0<br />
[9] Although I normally specify that the I/B/E/S long-term earnings growth forecast must include<br />
the forecasts of at least three analysts, in March <strong>2009</strong> there are only four companies with<br />
growth forecasts from at least three analysts. In this study, therefore, I also include results<br />
for companies that had growth forecasts based on two analysts’ growth forecasts.<br />
g
LINE<br />
NO.<br />
Written Evidence of James H. Vander Weide, Ph.D.<br />
Page 62 of 87<br />
EXHIBIT 10<br />
MARKET VALUE EQUITY RATIOS FOR U.S. ELECTRIC AND<br />
NATURAL GAS COMPANIES AT MARCH <strong>2009</strong><br />
COMPANY LONG-<br />
TERM<br />
DEBT<br />
PREFERRED<br />
EQUITY<br />
MARKET<br />
CAP $ (MIL)<br />
%<br />
MARKET<br />
EQUITY<br />
1 Amer. Elec. Power 14,202 61 11,320 44%<br />
2 Avista Corp. 635 0 779 55%<br />
3 Dominion Resources 13,235 257 17,610 57%<br />
4 DPL Inc. 1,542 23 2,331 60%<br />
5 Duke Energy 9,498 0 17,043 64%<br />
6 Consol. Edison 7,611 213 9,908 56%<br />
7 Entergy Corp. 9,728 311 12,759 56%<br />
8 Exelon Corp. 11,965 87 31,082 72%<br />
9 FirstEnergy Corp. 8,869 0 12,974 59%<br />
10 FPL Group 11,280 0 18,528 62%<br />
11 NSTAR 2,501 43 3,436 57%<br />
12 Northeast <strong>Utilities</strong> 4,401 116 3,411 43%<br />
13 PG&E Corp. 9,753 252 13,979 58%<br />
14 Progress Energy 8,737 93 9,280 51%<br />
15 Pinnacle West <strong>Capital</strong> 3,127 0 2,652 46%<br />
16 Pepco Holdings 4,735 0 3,033 39%<br />
17 Portland General 1,313 0 1,027 44%<br />
18 SCANA Corp. 2,879 113 3,541 54%<br />
19 Southern Co. 14,143 1,080 23,478 61%<br />
20 Sempra Energy 4,553 193 10,119 68%<br />
21 Vectren Corp. 1,245 0 1,690 58%<br />
22 Wisconsin Energy 3,173 30 4,656 59%<br />
23 Westar Energy 1,890 21 1,830 49%<br />
24 Xcel Energy Inc. 6,342 105 7,966 55%<br />
25 Market-Weighted Average 157,357 2,999 224,432 58%<br />
26 Average 55%<br />
Data are from The Value Line Investment Analyzer, March <strong>2009</strong>.
LINE<br />
NO.<br />
Written Evidence of James H. Vander Weide, Ph.D.<br />
Page 63 of 87<br />
EXHIBIT 10 (CONTINUED)<br />
MARKET VALUE EQUITY RATIOS FOR U.S. ELECTRIC AND<br />
NATURAL GAS COMPANIES AT MARCH <strong>2009</strong><br />
COMPANY<br />
LONG-<br />
TERM<br />
DEBT<br />
PREFERRED<br />
EQUITY<br />
MARKET<br />
CAP $<br />
(MIL)<br />
% MARKET<br />
EQUITY<br />
1 AGL Resources 1,674 0 2,133 56%<br />
2 Atmos Energy 2,126 0 2,000 48%<br />
3 Equitable Resources 754 0 4,024 84%<br />
4 Nicor Inc. 423 1 1,418 77%<br />
5 NiSource Inc. 5,594 0 2,400 30%<br />
6 Northwest Nat. Gas 512 0 1,084 68%<br />
7 Piedmont Natural Gas 794 0 1,769 69%<br />
8 South Jersey Inds. 358 0 1,072 75%<br />
9 Questar Corp. 1,021 0 5,000 83%<br />
10 Southwest Gas 1,366 0 856 39%<br />
11 Market-Weighted Average 14,623 1 21,756 60%<br />
12 Average 63%
Written Evidence of James H. Vander Weide, Ph.D.<br />
Page 64 of 87<br />
EXHIBIT 11<br />
APPENDIX 1<br />
QUALIFICATIONS OF JAMES H. VANDER WEIDE, PH.D.<br />
James H. Vander Weide is Research Professor of Finance and Economics at Duke<br />
University, the Fuqua School of Business. Dr. Vander Weide is also founder and President<br />
of Financial Strategy Associates, a consulting firm that provides strategic, financial, and<br />
economic consulting services to corporate clients, including cost of capital and valuation<br />
studies.<br />
Educational Background and Prior Academic Experience<br />
Dr. Vander Weide holds a Ph.D. in Finance from Northwestern University and a<br />
Bachelor of Arts from Cornell University. He joined the faculty at Duke University and was<br />
named Assistant Professor, Associate Professor, Professor, and then Research Professor<br />
of Finance and Economics.<br />
Since joining the faculty at Duke, Dr. Vander Weide has taught courses in corporate<br />
finance, investment management, and management of financial institutions. He has also<br />
taught courses in statistics, economics, and operations research, and a Ph.D. seminar on<br />
the theory of public utility pricing. In addition, Dr. Vander Weide has been active in<br />
executive education at Duke and Duke Corporate Education, leading executive development<br />
seminars on topics including financial analysis, cost of capital, creating shareholder value,<br />
mergers and acquisitions, real options, capital budgeting, cash management, measuring<br />
corporate performance, valuation, short-run financial planning, depreciation policies,<br />
financial strategy, and competitive strategy. Dr. Vander Weide has designed and served as<br />
Program Director for several executive education programs, including the Advanced<br />
Management Program, Competitive Strategies in Telecommunications, and the Duke<br />
Program for Manager Development for managers from the former Soviet Union.<br />
Publications<br />
Dr. Vander Weide has written a book entitled Managing Corporate Liquidity: An<br />
Introduction to Working <strong>Capital</strong> Management published by John Wiley and Sons, Inc. He<br />
has also written a chapter titled, "Financial Management in the Short Run" for The<br />
Handbook of Modern Finance, and written research papers on such topics as portfolio<br />
management, capital budgeting, investments, the effect of regulation on the performance of<br />
public utilities, and cash management. His articles have been published in American<br />
Economic Review, Financial Management, International Journal of Industrial Organization,<br />
Journal of Finance, Journal of Financial and Quantitative Analysis, Journal of Bank
Written Evidence of James H. Vander Weide, Ph.D.<br />
Page 65 of 87<br />
Research, Journal of Portfolio Management, Journal of Accounting Research, Journal of<br />
Cash Management, Management Science, Atlantic Economic Journal, Journal of Economics<br />
and Business, and Computers and Operations Research.<br />
Professional Consulting Experience<br />
Dr. Vander Weide has provided financial and economic consulting services to firms<br />
in the electric, gas, insurance, telecommunications, and water industries for more than 25<br />
years. He has testified on the cost of capital, competition, risk, incentive regulation, forwardlooking<br />
economic cost, economic pricing guidelines, depreciation, accounting, valuation, and<br />
other financial and economic issues in more than 400 cases before the United States<br />
Congress, the Canadian Radio-Television and Telecommunications Commission, the<br />
Federal Communications Commission, the National Telecommunications and Information<br />
Administration, the Federal Energy Regulatory Commission, the public service commissions<br />
of 42 states and the District of Columbia, the insurance commissions of five states, the Iowa<br />
State Board of Tax Review, the National Association of Securities Dealers, and the North<br />
Carolina Property Tax Commission. In addition, he has testified as an expert witness in<br />
proceedings before the United States District Court for the District of New Hampshire;<br />
United States District Court for the Northern District of California; United States District<br />
Court for the District of Nebraska; United States District Court for the Eastern District of<br />
North Carolina; Superior Court of North Carolina, the United States Bankruptcy Court for the<br />
Southern District of West Virginia; and United States District Court for the Eastern District of<br />
Michigan. With respect to implementation of the Telecommunications Act of 1996,<br />
Dr. Vander Weide has testified in 30 states on issues relating to the pricing of unbundled<br />
network elements and universal service cost studies and has consulted with Bell Canada,<br />
Deutsche Telekom, and Telefónica on similar issues. He has also provided expert<br />
testimony on issues related to electric and natural gas restructuring. He has worked for Bell<br />
Canada/Nortel on a special task force to study the effects of vertical integration in the<br />
Canadian telephone industry and has worked for Bell Canada as an expert witness on the<br />
cost of capital. Dr. Vander Weide has provided consulting and expert witness testimony to<br />
the following companies:<br />
Telecommunications Companies<br />
ALLTEL and its subsidiaries Ameritech (now AT&T new)<br />
AT&T (old) Verizon (Bell Atlantic) and<br />
subsidiaries<br />
Bell Canada/Nortel BellSouth and its subsidiaries<br />
Centel and its subsidiaries Cincinnati Bell (Broadwing)<br />
Cisco Systems Citizens Telephone Company<br />
Concord Telephone Company Contel and its subsidiaries<br />
Deutsche Telekom GTE and subsidiaries (now<br />
Verizon)<br />
Heins Telephone Company Lucent Technologies
Minnesota Independent Equal NYNEX and its subsidiaries<br />
Access Corp.<br />
(Verizon)<br />
Pacific Telesis and its<br />
Phillips County Cooperative Tel.<br />
subsidiaries<br />
Co.<br />
Pine Drive Cooperative<br />
Roseville Telephone Company<br />
Telephone Co.<br />
(SureWest)<br />
Siemens SBC Communications (now AT&T<br />
new)<br />
Sherburne Telephone Company Southern New England Telephone<br />
The Stentor Companies Sprint/United and its subsidiaries<br />
Telefónica Union Telephone Company<br />
Woodbury Telephone Company United States Telephone<br />
Association<br />
U S West (Qwest) Valor Telecommunications<br />
(Windstream)<br />
Electric, Gas, and Water<br />
Companies<br />
Alcoa Power Generating, Inc.<br />
Alliant Energy<br />
Ameren<br />
American Water Works<br />
Atmos Energy<br />
Central Illinois Public Service<br />
Citizens <strong>Utilities</strong><br />
Consolidated Natural Gas and its<br />
subsidiaries<br />
Dominion Resources<br />
Duke Energy<br />
Empire District Electric Company<br />
Interstate Power Company<br />
Iowa-American Water Company<br />
Iowa-Illinois Gas and Electric<br />
Iowa Southern<br />
Kentucky-American Water<br />
Company<br />
Kentucky Power Company<br />
MidAmerican Energy and its<br />
subsidiaries<br />
Nevada Power Company<br />
NICOR<br />
North Carolina Natural Gas<br />
Northern Natural Gas Company<br />
Written Evidence of James H. Vander Weide, Ph.D.<br />
Page 66 of 87<br />
NOVA Gas Transmission Ltd.<br />
North Shore Gas<br />
PacifiCorp<br />
PG&E<br />
Peoples Energy and its<br />
subsidiaries<br />
The Peoples Gas, Light and<br />
Coke Co.<br />
Progress Energy<br />
Public Service Company of North<br />
Carolina<br />
PSE&G<br />
Sempra Energy<br />
South Carolina Electric and Gas<br />
Southern Company and<br />
subsidiaries<br />
Tennessee-American Water<br />
Company<br />
Trans Québec & Maritimes<br />
Pipeline Inc.<br />
United Cities Gas Company<br />
Insurance Companies<br />
Allstate<br />
North Carolina Rate Bureau<br />
United Services Automobile<br />
Association (USAA)<br />
The Travelers Indemnity<br />
Company<br />
Gulf Insurance Company<br />
Other Professional Experience<br />
Dr. Vander Weide conducts in-house seminars and training sessions on topics such<br />
as creating shareholder value, financial analysis, competitive strategy, cost of capital, real<br />
options, financial strategy, managing growth, mergers and acquisitions, valuation,<br />
measuring corporate performance, capital budgeting, cash management, and financial<br />
planning. Among the firms for whom he has designed and taught tailored programs and<br />
training sessions are ABB Asea Brown Boveri, Accenture, Allstate, Ameritech, AT&T, Bell
Written Evidence of James H. Vander Weide, Ph.D.<br />
Page 67 of 87<br />
Atlantic/Verizon, BellSouth, Progress Energy/Carolina Power & Light, Contel, Fisons,<br />
GlaxoSmithKline, GTE, Lafarge, MidAmerican Energy, New Century Energies, Norfolk<br />
Southern, Pacific Bell Telephone, The Rank Group, Siemens, Southern New England<br />
Telephone, TRW, and Wolseley Plc. Dr. Vander Weide has also hosted a nationally<br />
prominent conference/workshop on estimating the cost of capital. In 1989, at the request of<br />
Mr. Fuqua, Dr. Vander Weide designed the Duke Program for Manager Development for<br />
managers from the former Soviet Union, the first in the United States designed exclusively<br />
for managers from Russia and the former Soviet republics.<br />
In the 1970’s, Dr. Vander Weide helped found University Analytics, Inc., which at that<br />
time was one of the fastest growing small firms in the country. As an officer at University<br />
Analytics, he designed cash management models, databases, and software packages that<br />
are still used by most major U.S. banks in consulting with their corporate clients. Having sold<br />
his interest in University Analytics, Dr. Vander Weide now concentrates on strategic and<br />
financial consulting, academic research, and executive education.
Written Evidence of James H. Vander Weide, Ph.D.<br />
Page 68 of 87<br />
PUBLICATIONS<br />
JAMES H. VANDER WEIDE<br />
The Lock-Box Location Problem: a Practical Reformulation, Journal of Bank<br />
Research, Summer, 1974, pp. 92-96 (with S. Maier). Reprinted in Management Science<br />
in Banking, edited by K. J. Cohen and S. E. Gibson, Warren, Gorham and Lamont, 1978.<br />
A Finite Horizon Dynamic Programming Approach to the Telephone Cable Layout<br />
Problem, Conference Record, 1976 International Conference on Communications (with<br />
S. Maier and C. Lam).<br />
A Note on the Optimal Investment Policy of the Regulated Firm, Atlantic Economic<br />
Journal, Fall, 1976 (with D. Peterson).<br />
A Unified Location Model for Cash Disbursements and Lock-Box Collections,<br />
Journal of Bank Research, Summer, 1976 (with S. Maier). Reprinted in Management<br />
Science in Banking, edited by K. J. Cohen and S. E. Gibson, Warren Gorham and<br />
Lamont, 1978. Also reprinted in Readings on the Management of Working <strong>Capital</strong>,<br />
edited by K. V. Smith, West Publishing Company, 1979.<br />
<strong>Capital</strong> Budgeting in the Decentralized Firm,’ Management Science, Vol. 23, No. 4,<br />
December 1976, pp. 433-443 (with S. Maier).<br />
A Monte Carlo Investigation of Characteristics of Optimal Geometric Mean<br />
Portfolios, Journal of Financial and Quantitative Analysis, June, 1977, pp. 215-233 (with<br />
S. Maier and D. Peterson).<br />
A Strategy which Maximizes the Geometric Mean Return on Portfolio Investments,<br />
Management Science, June, 1977, Vol. 23, No. 10, pp. 1117-1123 (with S. Maier and D.<br />
Peterson).<br />
A Decision Analysis Approach to the Computer Lease-Purchase Decision,<br />
Computers and Operations Research, Vol. 4, No. 3, September, 1977, pp. 167-172 (with<br />
S. Maier).
Written Evidence of James H. Vander Weide, Ph.D.<br />
Page 69 of 87<br />
A Practical Approach to Short-run Financial Planning, Financial Management,<br />
Winter, 1978 (with S. Maier). Reprinted in Readings on the Management of Working<br />
<strong>Capital</strong>, edited by K. V. Smith, West Publishing Company, 1979.<br />
Effectiveness of Regulation in the Electric Utility Industry,’ Journal of Economics and<br />
Business, May, 1979 (with F. Tapon).<br />
On the Decentralized <strong>Capital</strong> Budgeting Problem Under Uncertainty, Management<br />
Science, September 1979 (with B. Obel).<br />
Expectations Data and the Predictive Value of Interim Reporting: A Comment,<br />
Journal of Accounting Research, Spring 1980 (with L. D. Brown, J. S. Hughes, and M. S.<br />
Rozeff).<br />
General Telephone’s Experience with a Short-run Financial Planning Model, Cash<br />
Management Forum, June 1980, Vol. 6, No. 1 (with J. Austin and S. Maier).<br />
Deregulation and Oligopolistic Price-Quality Rivalry, American Economic Review,<br />
March 1981 (with J. Zalkind).<br />
Forecasting Disbursement Float, Financial Management, Spring 1981 (with S. Maier<br />
and D. Robinson).<br />
Recent Developments in Management Science in Banking, Management Science,<br />
October 1981 (with K. Cohen and S. Maier).<br />
Incentive Considerations in the Reporting of Leveraged Leases, Journal of Bank<br />
Research, April 1982 (with J. S. Hughes).<br />
A Decision-Support System for Managing a Short-term Financial Instrument<br />
Portfolio, Journal of Cash Management, March 1982 (with S. Maier).<br />
An Empirical Bayes Estimate of Market Risk, Management Science, July 1982 (with<br />
S. Maier and D. Peterson).<br />
The Bond Scheduling Problem of the Multi-subsidiary Holding Company,<br />
Management Science, July 1982 (with K. Baker).
Written Evidence of James H. Vander Weide, Ph.D.<br />
Page 70 of 87<br />
Deregulation and Locational Rents in Banking: a Comment, Journal of Bank<br />
Research, Summer 1983.<br />
What Lockbox and Disbursement Models Really Do, Journal of Finance, May 1983<br />
(with S. Maier).<br />
Financial Management in the Short Run, Handbook of Modern Finance, edited by<br />
Dennis Logue, published by Warren, Gorham, & Lamont, Inc., New York, 1984.<br />
Measuring Investors’ Growth Expectations: Analysts vs. History, The Journal of<br />
Portfolio Management, Spring 1988 (with W. Carleton).<br />
Entry Auctions and Strategic Behavior under Cross-Market Price Constraints,<br />
International Journal of Industrial Organization, 20 (2002) 611-629 (with J. Anton and N.<br />
Vettas).<br />
Principles for Lifetime Portfolio Selection: Lessons from Portfolio Theory, Handbook<br />
of Portfolio Construction: Contemporary <strong>Application</strong>s of Markowitz Techniques, John B.<br />
Guerard, (Ed.), Springer, forthcoming <strong>2009</strong>.<br />
Managing Corporate Liquidity: an Introduction to Working <strong>Capital</strong> Management,<br />
John Wiley and Sons, 1984 (with S. Maier).
Written Evidence of James H. Vander Weide, Ph.D.<br />
Page 71 of 87<br />
SUMMARY EXPERT TESTIMONY<br />
JAMES H. VANDER WEIDE<br />
SPONSOR JURISDICTION DATE DOCKET NO.<br />
Progress Energy Florida Mar-09 090079-EI<br />
EPCOR, FortisAlberta, AltaLink Alberta <strong>Utilities</strong> Commission Nov-08<br />
1578571, ID-85<br />
NOVA Gas Transmission Ltd. Alberta <strong>Utilities</strong> Commission Nov-08 1578571, ID-85<br />
Kentucky-American Water Company Kentucky Oct-08 2008-00427<br />
Atmos Energy Tennessee Oct-08 0800197<br />
Dorsey & Whitney LLP-Williams v. Gannon Montana 2nd Judicial Dist. Ct. Silver<br />
Bow County<br />
Apr-08 DV-02-201<br />
Atmos Energy Georgia Mar-08 27163-U<br />
North Carolina Rate Bureau (auto) North Carolina Dept. of Insurance Jan-08<br />
Trans Québec & Maritimes Pipeline Inc. National Energy Board (Canada) Dec-07<br />
Xcel Energy North Dakota Dec-07 PU-07-776<br />
Verizon Southwest Texas Nov-07 34723<br />
Empire District Electric Company Missouri Oct-07 ER-2008-0093<br />
North Carolina Rate Bureau (workers compensation) North Carolina Dept. of Insurance Sep-07<br />
Verizon North Inc. Contel of the South Inc. Michigan Aug-07 Case No. U-15210<br />
Georgia Power Company Georgia Jun-07 25060-U<br />
Duke Energy Carolinas North Carolina May-07 E-7 Sub 828 et al<br />
MidAmerican Energy Company Iowa May-07 SPU-06-5 et al<br />
Morrison & Foerster LLP-JDS Uniphase Securities U.S. District Court Northern District Feb-07 C-02-1486-CW<br />
Litigation<br />
California<br />
TransCanada Pipelines Ltd. National Energy Board (Canada) Feb-07<br />
North Carolina Rate Bureau (homeowners) North Carolina Dept. of Insurance Dec-06<br />
San Diego Gas & Electric FERC Nov-06 ER07-284-000<br />
North Carolina Rate Bureau (workers compensation) North Carolina Dept. of Insurance Aug-06<br />
Union Electric Company d/b/a AmerenUE Missouri Jun-06 ER-2007-0002<br />
North Carolina Rate Bureau (homeowners) North Carolina Dept. of Insurance May-06<br />
North Carolina Rate Bureau (dwelling fire) North Carolina Dept. of Insurance Mar-06<br />
Empire District Electric Company Missouri Feb-06 ER-2006-0315<br />
PacifiCorp Power & Light Company Washington Jan-06 UE-050684<br />
Verizon Maine Maine Dec-05 2005-155<br />
Winston & Strawn LLP-Cisco Systems Securities U.S. District Court Northern District Nov-05 C-01-20418-JW<br />
Litigation<br />
California<br />
Dominion Virginia Power Virginia Nov-05 PUE-2004-00048<br />
Bryan Cave LLP--Omniplex Comms. v. Lucent U.S. District Court Eastern District Sep-05 04CV00477 ERW<br />
Technologies<br />
Missouri<br />
North Carolina Rate Bureau (workers comp) North Carolina Dept. of Insurance Sep-05<br />
Empire District Electric Company Kansas Sep-05 05-EPDE-980-RTS<br />
Verizon Southwest Texas Jul-05 29315<br />
PG&E Company FERC Jul-05 ER-05-1284<br />
Dominion Hope West Virginia Jun-05 05-034-G42T<br />
Empire District Electric Company Missouri Jun-05 EO-2005-0263<br />
Verizon New England U.S. District Court New Hampshire May-05 04-CV-65-PB<br />
San Diego Gas & Electric California May-05 05-05-012<br />
Progress Energy Florida May-05 50078<br />
Verizon Vermont Vermont Feb-05 6959<br />
North Carolina Rate Bureau (homeowners) North Carolina Dept. of Insurance Feb-05<br />
Verizon Florida Florida Jan-05 050059-TL<br />
Verizon Illinois Illinois Jan-05 00-0812<br />
Dominion Resources North Carolina Sep-04 E-22 Sub 412<br />
Tennessee-American Water Company Tennessee Aug-04 04-00288<br />
Valor Telecommunications of Texas, LP. New Mexico Jul-04 3495 Phase C<br />
Alcoa Power Generating Inc. North Carolina Property Tax Jul-04 02 PTC 162 and 02 PTC 709
Written Evidence of James H. Vander Weide, Ph.D.<br />
Page 72 of 87<br />
SPONSOR JURISDICTION DATE DOCKET NO.<br />
Commission<br />
PG&E Company California May-04 04-05-21<br />
Verizon Northwest Washington Apr-04 UT-040788<br />
Verizon Northwest Washington Apr-04 UT-040788<br />
Kentucky-American Water Company Kentucky Apr-04 2004-00103<br />
MidAmerican Energy South Dakota Apr-04 NG4-001<br />
Empire District Electric Company Missouri Apr-04 ER-2004-0570<br />
Interstate Power and Light Company Iowa Mar-04 RPU-04-01<br />
North Carolina Rate Bureau (auto) North Carolina Dept. of Insurance Feb-04<br />
Northern Natural Gas Company FERC Feb-04 RP04-155-000<br />
Verizon New Jersey New Jersey Jan-04 TO00060356<br />
Verizon FCC Jan-04 03-173, FCC 03-224<br />
Verizon FCC Dec-03 03-173, FCC 03-224<br />
Verizon California Inc. California Nov-03 R93-04-003,I93-04-002<br />
Phillips County Telephone Company Colorado Nov-03 03S-315T<br />
North Carolina Rate Bureau (homeowners) North Carolina Dept. of Insurance Oct-03<br />
PG&E Company FERC Oct-03 ER04-109-000<br />
Allstate Insurance Company Texas Department of Insurance Sep-03 2568<br />
Verizon Northwest Inc. Washington Jul-03 UT-023003<br />
Empire District Electric Company Oklahoma Jul-03 Case No. PUD 200300121<br />
Verizon Virginia Inc. FCC Apr-03 CC-00218,00249,00251<br />
North Carolina Rate Bureau (dwelling fire) North Carolina Dept. of Insurance Apr-03<br />
Northern Natural Gas Company FERC Apr-03 RP03-398-000<br />
MidAmerican Energy Iowa Apr-03 RPU-03-1, WRU-03-25-156<br />
PG&E Company FERC Mar-03 ER03666000<br />
Verizon Florida Inc. Florida Feb-03 981834-TP/990321-TP<br />
Verizon North Indiana Feb-03 42259<br />
San Diego Gas & Electric FERC Feb-03 ER03-601000<br />
North Carolina Rate Bureau (auto) North Carolina Dept. of Insurance Jan-03<br />
Gulf Insurance Company Superior Court, North Carolina Jan-03 2000-CVS-3558<br />
PG&E Company FERC Jan-03 ER03409000<br />
Verizon New England Inc. New Hampshire New Hampshire Dec-02 DT 02-110<br />
Verizon Northwest Washington Dec-02 UT 020406<br />
PG&E Company California Dec-02<br />
MidAmerican Energy Iowa Nov-02 RPU-02-3, 02-8<br />
MidAmerican Energy Iowa Nov-02 RPU-02-10<br />
Verizon Michigan US District Court Eastern District of<br />
Michigan<br />
Sep-02 Civil Action No. 00-73208<br />
North Carolina Rate Bureau (workers comp) North Carolina Dept. of Insurance Sep-02<br />
Verizon New England Inc. New Hampshire New Hampshire Aug-02 DT 02-110<br />
Interstate Power Company Iowa Board of Tax Review Jul-02 832<br />
PG&E Company California May-02 A 02-05-022 et al<br />
Verizon New England Inc. Massachusetts FCC May-02 EB 02 MD 006<br />
Verizon New England Inc. Rhode Island Rhode Island May-02 Docket No. 2681<br />
Neumedia, Inc. US Bankruptcy Court Southern<br />
District W. Virginia<br />
Apr-02 Case No. 01-20873<br />
North Carolina Rate Bureau (homeowners) North Carolina Dept. of Insurance Mar-02<br />
MidAmerican Energy Company Iowa Mar-02 RPU 02 2<br />
North Carolina Natural Gas Company North Carolina Feb-02 G21 Sub 424<br />
North Carolina Rate Bureau (auto) North Carolina Dept. of Insurance Jan-02<br />
Verizon Pennsylvania Pennsylvania Dec-01 R-00016683<br />
Verizon Florida Florida Nov-01 99064B-TP<br />
PG&E Company FERC Nov-01 ER0166000<br />
Verizon Delaware Delaware Oct-01 96-324 Phase II<br />
Florida Power Corporation Florida Sep-01 000824-EL<br />
North Carolina Rate Bureau (workers comp) North Carolina Dept. of Insurance Sep-01<br />
Verizon Washington DC District of Columbia Jul-01 962
Written Evidence of James H. Vander Weide, Ph.D.<br />
Page 73 of 87<br />
SPONSOR JURISDICTION DATE DOCKET NO.<br />
Verizon Virginia FCC Jul-01 CC-00218,00249,00251<br />
Sherburne County Rural Telephone Company Minnesota Jul-01 P427/CI-00-712<br />
Verizon New Jersey New Jersey Jun-01 TO010<strong>2009</strong>5<br />
Verizon Maryland Maryland May-01 8879<br />
Verizon Massachusetts Massachusetts May-01 DTE 01-20<br />
North Carolina Rate Bureau (auto) North Carolina Dept. of Insurance Apr-01<br />
PG&E Company FERC Mar-01 ER011639000<br />
Maupin Taylor & Ellis P.A. National Association of Securities<br />
Dealers<br />
Jan-01 99-05099<br />
USTA FCC Oct-00 RM 10011<br />
Verizon New York New York Oct-00 98-C-1357<br />
Verizon New Jersey New Jersey Oct-00 TO00060356<br />
PG&E Company FERC Oct-00 ER0166000<br />
Verizon New Jersey New Jersey Sep-00 TO99120934<br />
North Carolina Rate Bureau (workers comp) North Carolina Dept. of Insurance Sep-00<br />
PG&E Company California Aug-00 00-05-018<br />
Verizon New York New York Jul-00 98-C-1357<br />
PG&E Company California May-00 00-05-013<br />
PG&E Company FERC Mar-00 ER00-66-000<br />
PG&E Company FERC Mar-00 ER99-4323-000<br />
Bell Atlantic New York Feb-00 98-C-1357<br />
USTA FCC Jan-00 94-1, 96-262<br />
MidAmerican Energy Iowa Nov-99 SPU-99-32<br />
PG&E Company California Nov-99 99-11-003<br />
PG&E Company FERC Nov-99 ER973255,981261,981685<br />
North Carolina Rate Bureau (workers comp) North Carolina Dept. of Insurance Sep-99<br />
MidAmerican Energy Illinois Sep-99 99-0534<br />
PG&E Company FERC Sep-99 ER99-4323-000<br />
MidAmerican Energy FERC Jul-99 ER99-3887<br />
North Carolina Rate Bureau (homeowners) North Carolina Dept. of Insurance Jun-99<br />
Bell Atlantic Vermont May-99 6167<br />
Nevada Power Company FERC May-99<br />
Bell Atlantic, GTE, US West FCC Apr-99 CC98-166<br />
Nevada Power Company Nevada Apr-99<br />
Bell Atlantic, GTE, US West FCC Mar-99 CC98-166<br />
North Carolina Rate Bureau (auto) North Carolina Dept. of Insurance Mar-99<br />
PG&E Company FERC Mar-99 ER99-2326-000<br />
MidAmerican Energy Illinois Mar-99 099-0310<br />
PG&E Company FERC Feb-99 ER99-2358,2087,2351<br />
MidAmerican Energy US District Court, District of<br />
Nebraska<br />
Feb-99 8:97 CV 346<br />
Bell Atlantic, GTE, US West FCC Jan-99 CC98-166<br />
The Southern Company FERC Jan-99 ER98-1096<br />
Deutsche Telekom Germany Nov-98<br />
Telefonica Spain Nov-98<br />
Cincinnati Bell Telephone Company Ohio Oct-98 96899TPALT<br />
MidAmerican Energy Iowa Sep-98 RPU 98-5<br />
MidAmerican Energy South Dakota Sep-98 NG98-011<br />
MidAmerican Energy Iowa Sep-98 SPU 98-8<br />
GTE Florida Incorporated Florida Aug-98 980696-TP<br />
GTE North and South Illinois Jun-98 960503<br />
GTE Midwest Incorporated Missouri Jun-98 TO98329<br />
GTE North and South Illinois May-98 960503<br />
MidAmerican Energy Iowa Board of Tax Review May-98 835<br />
San Diego Gas & Electric California May-98 98-05-024<br />
GTE Midwest Incorporated Nebraska Apr-98 C1416<br />
Carolina Telephone North Carolina Mar-98 P100Sub133d
Written Evidence of James H. Vander Weide, Ph.D.<br />
Page 74 of 87<br />
SPONSOR JURISDICTION DATE DOCKET NO.<br />
GTE Southwest Texas Feb-98 18515<br />
North Carolina Rate Bureau (auto) North Carolina Dept. of Insurance Feb-98 P100sub133d<br />
Public Service Electric & Gas New Jersey Feb-98 PUC734897N,-734797N,BPUEO97070461,-<br />
07070462<br />
GTE North Minnesota Dec-97 P999/M97909<br />
GTE Northwest Oregon Dec-97 UM874<br />
The Southern Company FERC Dec-97 ER981096000<br />
GTE North Pennsylvania Nov-97 A310125F0002<br />
Bell Atlantic Rhode Island Nov-97 2681<br />
GTE North Indiana Oct-97 40618<br />
GTE North Minnesota Oct-97 P442,407/5321/CI961541<br />
GTE Southwest New Mexico Oct-97 96310TC,96344TC<br />
GTE Midwest Incorporated Iowa Sep-97 RPU-96-7<br />
North Carolina Rate Bureau (workers) North Carolina Dept. of Insurance Sep-97<br />
GTE Hawaiian Telephone Hawaii Aug-97 7702<br />
The Stentor Companies Canadian Radio-television and<br />
Telecommunications Commission<br />
Jul-97 CRTC97-11<br />
New England Telephone Vermont Jul-97 5713<br />
Bell-Atlantic-New Jersey New Jersey Jun-97 TX95120631<br />
Nevada Bell Nevada May-97 96-9035<br />
New England Telephone Maine Apr-97 96-781<br />
GTE North, Inc. Michigan Apr-97 U11281<br />
Bell Atlantic-Virginia Virginia Apr-97 970005<br />
Cincinnati Bell Telephone Ohio Feb-97 96899TPALT<br />
Bell Atlantic - Pennsylvania Pennsylvania Feb-97 A310203,213,236,258F002<br />
North Carolina Rate Bureau (auto) North Carolina Dept. of Insurance Feb-97<br />
Bell Atlantic-Washington, D.C. District of Columbia Jan-97 962<br />
Pacific Bell, Sprint, US West FCC Jan-97 CC 96-45<br />
United States Telephone Association FCC Jan-97 CC 96-262<br />
Bell Atlantic-Maryland Maryland Jan-97 8731<br />
Bell Atlantic-West Virginia West Virginia Jan-97 961516, 1561, 1009TPC,961533TT<br />
Poe, Hoof, & Reinhardt Durham Cnty Superior Court Kountis<br />
vs. Circle K<br />
Jan-97 95CVS04754<br />
Bell Atlantic-Delaware Delaware Dec-96 96324<br />
Bell Atlantic-New Jersey New Jersey Nov-96 TX95120631<br />
Carolina Power & Light Company FERC Nov-96 OA96-198-000<br />
New England Telephone Massachusetts Oct-96 DPU 96-73/74,-75, -80/81, -83, -94<br />
New England Telephone New Hampshire Oct-96 96-252<br />
Bell Atlantic-Virginia Virginia Oct-96 960044<br />
Citizens <strong>Utilities</strong> Illinois Sep-96 96-0200, 96-0240<br />
Union Telephone Company New Hampshire Sep-96 95-311<br />
Bell Atlantic-New Jersey New Jersey Sep-96 TO-96070519<br />
New York Telephone New York Sep-96 95-C-0657, 94-C-0095,91-C-1174<br />
North Carolina Rate Bureau (workers comp) North Carolina Dept. of Insurance Sep-96<br />
MidAmerican Energy Company Illinois Sep-96 96-0274<br />
MidAmerican Energy Company Iowa Sep-96 RPU96-8<br />
United States Telephone Association FCC Mar-96 AAD-96.28<br />
United States Telephone Association FCC Mar-96 CC 94-1 PhaseIV<br />
Bell Atlantic - Maryland Maryland Mar-96 8715<br />
Nevada Bell Nevada Mar-96 96-3002<br />
North Carolina Rate Bureau (auto) North Carolina Dept. of Insurance Mar-96<br />
Carolina Tel. and Telegraph Co, Central Tel Co North Carolina Feb-96 P7 sub 825, P10 sub 479<br />
Oklahoma Rural Telephone Coalition Oklahoma Oct-95 PUD950000119<br />
BellSouth Tennessee Oct-95 95-02614<br />
Wake County, North Carolina US District Court, Eastern Dist. NC Oct-95 594CV643H2<br />
Bell Atlantic - District of Columbia District of Columbia Sep-95 814 Phase IV<br />
South Central Bell Telephone Company Tennessee Aug-95 95-02614
Written Evidence of James H. Vander Weide, Ph.D.<br />
Page 75 of 87<br />
SPONSOR JURISDICTION DATE DOCKET NO.<br />
GTE South Virginia Jun-95 95-0019<br />
Roseville Telephone Company California May-95 A.95-05-030<br />
Bell Atlantic - New Jersey New Jersey May-95 TX94090388<br />
Cincinnati Bell Telephone Company Ohio May-95 941695TPACE<br />
North Carolina Rate Bureau (auto) North Carolina Dept. of Insurance May-95 727<br />
Northern Illinois Gas Illinois May-95 95-0219<br />
South Central Bell Telephone Company Kentucky Apr-95 94-121<br />
Midwest Gas South Dakota Mar-95<br />
Virginia Natural Gas, Inc. Virginia Mar-95 PUE940054<br />
Hope Gas, Inc. West Virginia Mar-95 95-0003G42T<br />
The Peoples Natural Gas Company Pennsylvania Feb-95 R-943252<br />
and Coke Co., North Shore Gas, Iowa-Illinois Gas Illinois Jan-95 94-0403<br />
and Electric, Central Illinois Public Service, Illinois Jan-95 94-0403<br />
Northern Illinois Gas, The Peoples Gas, Light Illinois Jan-95 94-0403<br />
United Cities Gas, and Interstate Power Illinois Jan-95 94-0403<br />
Cincinnati Bell Telephone Company Kentucky Oct-94 94-355<br />
Midwest Gas Nebraska Oct-94<br />
Midwest Power Iowa Sep-94 RPU-94-4<br />
Bell Atlantic FCC Aug-94 CS 94-28, MM 93-215<br />
Midwest Gas Iowa Jul-94 RPU-94-3<br />
Bell Atlantic FCC Jun-94 CC 94-1<br />
Nevada Power Company Nevada Jun-94 93-11045<br />
Cincinnati Bell Telephone Company Ohio Mar-94 93-551-TP-CSS<br />
Cincinnati Bell Telephone Company Ohio Mar-94 93-432-TP-ALT<br />
GTE South/Contel Virginia Feb-94 PUC9300036<br />
North Carolina Rate Bureau (auto) North Carolina Dept. of Insurance Feb-94 689<br />
Bell of Pennsylvania Pennsylvania Jan-94 P930715<br />
GTE South South Carolina Jan-94 93-504-C<br />
United Telephone-Southeast Tennessee Jan-94 93-04818<br />
C&P of VA, GTE South, Contel, United Tel. SE Virginia Sep-93 PUC920029<br />
Bell Atlantic, NYNEX, Pacific Companies FCC Aug-93 MM 93-215<br />
C&P, Centel, Contel, GTE, & United Virginia Aug-93 PUC920029<br />
Chesapeake & Potomac Tel Virginia Virginia Aug-93 93-00-<br />
GTE North Illinois Jul-93 93-0301<br />
Midwest Power Iowa Jul-93 INU-93-1<br />
Midwest Power South Dakota Jul-93 EL93-016<br />
Chesapeake & Potomac Tel. Co. DC District of Columbia Jun-93 926<br />
Cincinnati Bell Ohio Jun-93 93432TPALT<br />
North Carolina Rate Bureau (dwelling fire) North Carolina Dept. of Insurance Jun-93 671<br />
North Carolina Rate Bureau (homeowners) North Carolina Dept. of Insurance Jun-93 670<br />
Pacific Bell Telephone Company California Mar-93 92-05-004<br />
Minnesota Independent Equal Access Corp. Minnesota Mar-93 P3007/GR931<br />
South Central Bell Telephone Company Tennessee Feb-93 92-13527<br />
South Central Bell Telephone Company Kentucky Dec-92 92-523<br />
Southern New England Telephone Company Connecticut Nov-92 92-09-19<br />
Chesapeake & Potomac Tel. Co.CDC District of Columbia Nov-92 814<br />
Diamond State Telephone Company Delaware Sep-92 PSC 92-47<br />
New Jersey Bell Telephone Company New Jersey Sep-92 TO-92030958<br />
Allstate Insurance Company New Jersey Dept. of Insurance Sep-92 INS 06174-92<br />
North Carolina Rate Bureau (auto) North Carolina Dept. of Insurance Aug-92 650<br />
North Carolina Rate Bureau (workers' comp) North Carolina Dept. of Insurance Aug-92 647<br />
Midwest Gas Company Minnesota Aug-92 G010/GR92710<br />
Pennsylvania-American Water Company Pennsylvania Jul-92 R-922428<br />
Central Telephone Co. of Florida Florida Jun-92 920310-TL<br />
C&P of VA, GTE South, Contel, United Tel. SE Virginia Jun-92 PUC920029<br />
Chesapeake & Potomac Tel. Co. Maryland Maryland May-92 8462
Written Evidence of James H. Vander Weide, Ph.D.<br />
Page 76 of 87<br />
SPONSOR JURISDICTION DATE DOCKET NO.<br />
Pacific Bell Telephone Company California Apr-92 92-05-004<br />
Iowa Power Inc. Iowa Mar-92 RPU-92-2<br />
Contel of Texas Texas Feb-92 10646<br />
Southern Bell Telephone Company Florida Jan-92 880069-TL<br />
Nevada Power Company Nevada Jan-92 92-1067<br />
GTE South Georgia Dec-91 4003-U<br />
GTE South Georgia Dec-91 4110-U<br />
Allstate Insurance Company (property) Texas Dept. of Insurance Dec-91 1846<br />
IPS Electric Iowa Oct-91 RPU-91-6<br />
GTE South Tennessee Aug-91 91-05738<br />
North Carolina Rate Bureau (workers' comp) North Carolina Dept. of Insurance Aug-91 609<br />
Midwest Gas Company Iowa Jul-91 RPU-91-5<br />
Pennsylvania-American Water Company Pennsylvania Jun-91 R-911909<br />
North Carolina Rate Bureau (auto) North Carolina Dept. of Insurance Jun-91 606<br />
Allstate Insurance Company California Dept. of Insurance May-91 RCD-2<br />
Nevada Power Company Nevada May-91 91-5055<br />
Kentucky Power Company Kentucky Apr-91 91-066<br />
Chesapeake & Potomac Tel. Co.CD.C. District of Columbia Feb-91 850<br />
Allstate Insurance Company New Jersey Dept. of Insurance Jan-91 INS-9536-90<br />
GTE South South Carolina Nov-90 90-698-C<br />
Southern Bell Telephone Company Florida Oct-90 880069-TL<br />
GTE South West Virginia Aug-90 90-522-T-42T<br />
North Carolina Rate Bureau (workers' comp) North Carolina Dept. of Insurance Aug-90 R90-08-<br />
The Travelers Indemnity Company Pennsylvania Dept. of Insurance Aug-90 R-90-06-23<br />
Chesapeake & Potomac Tel. Co.-Maryland Maryland Jul-90 8274<br />
Allstate Insurance Company Pennsylvania Dept. of Insurance Jul-90 R90-07-01<br />
Central Tel. Co. of Florida Florida Jun-90 89-1246-TL<br />
Citizens Telephone Company North Carolina Jun-90 P-12, SUB 89<br />
North Carolina Rate Bureau (auto) North Carolina Dept. of Insurance Jun-90 568<br />
Iowa Resources, Inc. and Midwest Energy Iowa Jun-90 SPU-90-5<br />
Contel of Illinois Illinois May-90 90-0128<br />
Southern New England Tel. Co. Connecticut Apr-90 89-12-05<br />
Bell Atlantic FCC Apr-90 89-624 II<br />
Pennsylvania-American Water Company Pennsylvania Mar-90 R-901652<br />
Bell Atlantic FCC Feb-90 89-624<br />
GTE South Tennessee Jan-90<br />
Allstate Insurance Company California Dept. of Insurance Jan-90 REB-1002<br />
Bell Atlantic FCC Nov-89 87-463 II<br />
Allstate Insurance Company California Dept. of Insurance Sep-89 REB-1006<br />
Pacific Bell California Mar-89 87-11-0033<br />
Iowa Power & Light Iowa Dec-88 RPU-88-10<br />
Pacific Bell California Oct-88 88-05-009<br />
Southern Bell Florida Apr-88 880069TL<br />
Carolina Independent Telcos. North Carolina Apr-88 P-100, Sub 81<br />
United States Telephone Association U. S. Congress Apr-88<br />
Carolina Power & Light South Carolina Mar-88 88-11-E<br />
New Jersey Bell Telephone Co. New Jersey Feb-88 87050398<br />
Carolina Power & Light FERC Jan-88 ER-88-224-000<br />
Carolina Power & Light North Carolina Dec-87 E-2, Sub 537<br />
Bell Atlantic FCC Nov-87 87-463<br />
Diamond State Telephone Co. Delaware Jul-87 86-20<br />
Central Telephone Co. of Nevada Nevada Jun-87 87-1249<br />
ALLTEL Florida Apr-87 870076-PU<br />
Southern Bell Florida Apr-87 870076-PU<br />
Carolina Power & Light North Carolina Apr-87 E-2, Sub 526<br />
So. New England Telephone Co. Connecticut Mar-87 87-01-02
Written Evidence of James H. Vander Weide, Ph.D.<br />
Page 77 of 87<br />
SPONSOR JURISDICTION DATE DOCKET NO.<br />
Northern Illinois Gas Co. Illinois Mar-87 87-0032<br />
Bell of Pennsylvania Pennsylvania Feb-87 860923<br />
Carolina Power & Light FERC Jan-87 ER-87-240-000<br />
Bell South NTIA Dec-86 61091-619<br />
Heins Telephone Company North Carolina Oct-86 P-26, Sub 93<br />
Public Service Co. of NC North Carolina Jul-86 G-5, Sub 207<br />
Bell Atlantic FCC Feb-86 84-800 III<br />
BellSouth FCC Feb-86 84-800 III<br />
ALLTEL Carolina, Inc North Carolina Feb-86 P-118, Sub 39<br />
ALLTEL Georgia, Inc. Georgia Jan-86 3567-U<br />
ALLTEL Ohio Ohio Jan-86 86-60-TP-AIR<br />
Western Reserve Telephone Co. Ohio Jan-86 85-1973-TP-AIR<br />
New England Telephone & Telegraph Maine Dec-85<br />
ALLTEL-Florida Florida Oct-85 850064-TL<br />
Iowa Southern <strong>Utilities</strong> Iowa Oct-85 RPU-85-11<br />
Bell Atlantic FCC Sep-85 84-800 II<br />
Pacific Telesis FCC Sep-85 84-800 II<br />
Pacific Bell California Apr-85 85-01-034<br />
United Telephone Co. of Missouri Missouri Apr-85 TR-85-179<br />
South Carolina Generating Co. FERC Apr-85 85-204<br />
South Central Bell Kentucky Mar-85 9160<br />
New England Telephone & Telegraph Vermont Mar-85 5001<br />
Chesapeake & Potomac Telephone Co. West Virginia Mar-85 84-747<br />
Chesapeake & Potomac Telephone Co. Maryland Jan-85 7851<br />
Central Telephone Co. of Ohio Ohio Dec-84 84-1431-TP-AIR<br />
Ohio Bell Ohio Dec-84 84-1435-TP-AIR<br />
Carolina Power & Light Co. FERC Dec-84 ER85-184000<br />
BellSouth FCC Nov-84 84-800 I<br />
Pacific Telesis FCC Nov-84 84-800 I<br />
New Jersey Bell New Jersey Aug-84 848-856<br />
Southern Bell South Carolina Aug-84 84-308-C<br />
Pacific Power & Light Co. Montana Jul-84 84.73.8<br />
Carolina Power & Light Co. South Carolina Jun-84 84-122-E<br />
Southern Bell Georgia Mar-84 3465-U<br />
Carolina Power & Light Co. North Carolina Feb-84 E-2, Sub 481<br />
Southern Bell North Carolina Jan-84 P-55, Sub 834<br />
South Carolina Electric & Gas South Carolina Nov-83 83-307-E<br />
Empire Telephone Co. Georgia Oct-83 3343-U<br />
Southern Bell Georgia Aug-83 3393-U<br />
Carolina Power & Light Co. FERC Aug-83 ER83-765-000<br />
General Telephone Co. of the SW Arkansas Jul-83 83-147-U<br />
Heins Telephone Co. North Carolina Jul-83 No.26 Sub 88<br />
General Telephone Co. of the NW Washington Jul-83 U-82-45<br />
Leeds Telephone Co. Alabama Apr-83 18578<br />
General Telephone Co. of California California Apr-83 83-07-02<br />
North Carolina Natural Gas North Carolina Apr-83 G21 Sub 235<br />
Carolina Power & Light South Carolina Apr-83 82-328-E<br />
Eastern Illinois Telephone Co. Illinois Feb-83 83-0072<br />
Carolina Power & Light North Carolina Feb-83 E-2 Sub 461<br />
New Jersey Bell New Jersey Dec-82 8211-1030<br />
Southern Bell Florida Nov-82 820294-TP<br />
United Telephone of Missouri Missouri Nov-82 TR-83-135<br />
Central Telephone Co. of NC North Carolina Nov-82 P-10 Sub 415<br />
Concord Telephone Company North Carolina Nov-82 P-16 Sub 146<br />
Carolina Telephone & Telegraph North Carolina Aug-82 P-7, Sub 670<br />
Central Telephone Co. of Ohio Ohio Jul-82 82-636-TP-AIR
Written Evidence of James H. Vander Weide, Ph.D.<br />
Page 78 of 87<br />
SPONSOR JURISDICTION DATE DOCKET NO.<br />
Southern Bell South Carolina Jul-82 82-294-C<br />
General Telephone Co. of the SW Arkansas Jun-82 82-232-U<br />
General Telephone Co. of Illinois Illinois Jun-82 82-0458<br />
General Telephone Co. of the SW Oklahoma Jun-82 27482<br />
Empire Telephone Co. Georgia May-82 3355-U<br />
Mid-Georgia Telephone Co. Georgia May-82 3354-U<br />
General Telephone Co. of the SW Texas Apr-82 4300<br />
General Telephone Co. of the SE Alabama Jan-82 18199<br />
Carolina Power & Light Co. South Carolina Jan-82 81-163-E<br />
Elmore-Coosa Telephone Co. Alabama Nov-81 18215<br />
General Telephone Co. of the SE North Carolina Sep-81 P-19, Sub 182<br />
United Telephone Co. of Ohio Ohio Sep-81 81-627-TP-AIR<br />
General Telephone Co. of the SE South Carolina Sep-81 81-121-C<br />
Carolina Telephone & Telegraph North Carolina Aug-81 P-7, Sub 652<br />
Southern Bell North Carolina Aug-81 P-55, Sub 794<br />
Woodbury Telephone Co. Connecticut Jul-81 810504<br />
Central Telephone Co. of Virginia Virginia Jun-81 810030<br />
United Telephone Co. of Missouri Missouri May-81 TR-81-302<br />
General Telephone Co. of the SE Virginia Apr-81 810003<br />
New England Telephone Vermont Mar-81 4546<br />
Carolina Telephone & Telegraph North Carolina Aug-80 P-7, Sub 652<br />
Southern Bell North Carolina Aug-80 P-55, Sub 784<br />
General Telephone Co. of the SW Arkansas Jun-80 U-3138<br />
General Telephone Co. of the SE Alabama May-80 17850<br />
Southern Bell North Carolina Oct-79 P-55, Sub 777<br />
Southern Bell Georgia Mar-79 3144-U<br />
General Telephone Co. of the SE Virginia Mar-76 810038<br />
General Telephone Co. of the SW Arkansas Feb-76 U-2693, U-2724<br />
General Telephone Co. of the SE Alabama Sep-75 17058<br />
General Telephone Co. of the SE South Carolina Jun-75 D-18269
Written Evidence of James H. Vander Weide, Ph.D.<br />
Page 79 of 87<br />
EXHIBIT 12<br />
APPENDIX 2<br />
ESTIMATING THE EXPECTED RISK PREMIUM<br />
ON UTILITY STOCKS USING THE DCF MODEL<br />
The DCF model is based on the assumption that investors value an asset on the<br />
basis of the future cash flows they expect to receive from owning the asset. Thus,<br />
investors value an investment in a bond because they expect to receive a sequence of<br />
semi-annual coupon payments over the life of the bond and a terminal payment equal to<br />
the bond’s face value at the time the bond matures. Likewise, investors value an<br />
investment in a firm’s stock because they expect to receive a sequence of dividend<br />
payments and, perhaps, expect to sell the stock at a higher price sometime in the<br />
future.<br />
A second fundamental principle of the DCF method is that investors value a dollar<br />
received in the future less than a dollar received today. A future dollar is valued less<br />
than a current dollar because investors could invest a current dollar in an interest<br />
earning account and increase their wealth. This principle is called the time value of<br />
money.<br />
Applying the two fundamental DCF principles noted above to an investment in a<br />
bond leads to the conclusion that investors value their investment in the bond on the<br />
basis of the present value of the bond’s future cash flows. Thus, the price of the bond<br />
should be equal to:<br />
where:<br />
PB<br />
= Bond price;<br />
EQUATION 1<br />
C = Cash value of the coupon payment (assumed for notational<br />
convenience to occur annually rather than semi-annually);<br />
F = Face value of the bond;
Written Evidence of James H. Vander Weide, Ph.D.<br />
Page 80 of 87<br />
i = The rate of interest the investor could earn by investing his money<br />
in an alternative bond of equal risk; and<br />
n = The number of periods before the bond matures.<br />
Applying these same principles to an investment in a firm’s stock suggests that the price<br />
of the stock should be equal to:<br />
where:<br />
PS<br />
EQUATION 2<br />
= Current price of the firm’s stock;<br />
D1, D2...Dn = Expected annual dividend per share on the firm’s stock;<br />
Pn<br />
= Price per share of stock at the time the investor expects to sell the<br />
stock; and<br />
k = Return the investor expects to earn on alternative investments of<br />
the same risk, i.e., the investor’s required rate of return.<br />
Equation (2) is frequently called the annual discounted cash flow model of stock<br />
valuation. Assuming that dividends grow at a constant annual rate, g, this equation can<br />
be solved for k, the cost of equity. The resulting cost of equity equation is k = D1/Ps + g,<br />
where k is the cost of equity, D1 is the expected next period annual dividend, Ps is the<br />
current price of the stock, and g is the constant annual growth rate in earnings,<br />
dividends, and book value per share. The term D1/Ps is called the dividend yield<br />
component of the annual DCF model, and the term g is called the growth component of<br />
the annual DCF model.<br />
The annual DCF model is only a correct expression for the present value of future<br />
dividends if dividends are paid annually at the end of each year. Since most industrial<br />
and utility firms pay dividends quarterly, the annual DCF model produces downwardly<br />
biased estimates of the cost of equity. Investors can expect to earn a higher annual<br />
effective return on an investment in a firm that pays quarterly dividends than in one<br />
which pays the same amount of dollar dividends once at the end of each year.
The Dividend Component<br />
Written Evidence of James H. Vander Weide, Ph.D.<br />
Page 81 of 87<br />
The quarterly DCF model requires an estimate of the expected dividends for the<br />
next four quarters. I estimated the expected dividends for the next four quarters by<br />
multiplying the actual dividends for the last four quarters by the factor, (1 + the growth<br />
rate, g).<br />
The Growth Component<br />
To estimate the growth component of the DCF model, I used the analysts’<br />
estimates of future earnings per share (EPS) growth reported by I/B/E/S Thomson<br />
Financial. As part of their research, financial analysts working at Wall Street firms<br />
periodically estimate EPS growth for each firm they follow. The EPS forecasts for each<br />
firm are then published. Investors who are contemplating purchasing or selling shares<br />
in individual companies review the forecasts. These estimates represent five-year<br />
forecasts of EPS growth. I/B/E/S is a firm that reports analysts’ EPS growth forecasts<br />
for a broad group of companies. The forecasts are expressed in terms of a mean<br />
forecast and a standard deviation of forecast for each firm. Investors use the mean<br />
forecast as a consensus estimate of future firm performance. The I/B/E/S growth rates:<br />
(1) are widely circulated in the financial community, (2) include the projections of<br />
reputable financial analysts who develop estimates of future EPS growth, (3) are<br />
reported on a timely basis to investors, and (4) are widely used by institutional and other<br />
investors.<br />
I relied on analysts’ projections of future EPS growth because there is considerable<br />
empirical evidence that investors use analysts’ forecasts to estimate future earnings<br />
growth. To test whether investors use analysts’ growth forecasts to estimate future<br />
dividend and earnings growth, I prepared a study in conjunction with<br />
Willard T. Carleton, Karl Eller Professor of Finance at the University of Arizona, on why<br />
analysts’ forecasts are the best estimate of investors’ expectation of future long-term<br />
growth. This study is described in a paper entitled “Investor Growth Expectations and<br />
Stock Prices: the Analysts versus Historical Growth Extrapolation,” published in the<br />
Spring 1988 edition of The Journal of Portfolio Management.<br />
In our paper, we describe how we first performed a correlation analysis to identify<br />
the historically-oriented growth rates which best described a firm’s stock price. Then we<br />
did a regression study comparing the historical growth rates with the consensus<br />
analysts’ forecasts. In every case, the regression equations containing the average of
Written Evidence of James H. Vander Weide, Ph.D.<br />
Page 82 of 87<br />
analysts’ forecasts statistically outperformed the regression equations containing the<br />
historical growth estimates. These results are consistent with those found by Cragg<br />
and Malkiel, the early major research in this area (John G. Cragg and Burton G. Malkiel,<br />
Expectations and the <strong>Structure</strong> of Share Prices, University of Chicago Press, 1982).<br />
These results are also consistent with the hypothesis that investors use analysts’<br />
forecasts, rather than historically-oriented growth calculations, in making stock buy and<br />
sell decisions. They provide overwhelming evidence that the analysts’ forecasts of<br />
future growth are superior to historically-oriented growth measures in predicting a firm’s<br />
stock price.<br />
My study has been updated to include more recent data. Researchers at State<br />
Street Financial Advisors updated my study using data through year-end 2003. Their<br />
results continue to confirm that analysts’ growth forecasts are superior to historically-<br />
oriented growth measures in predicting a firm’s stock price.<br />
The Price Component<br />
To measure the price component of the DCF model, I used a simple average of the<br />
monthly high and low stock prices for each firm over a three-month period. These high<br />
and low stock prices were obtained from Thomson Financial. I used the three-month<br />
average stock price in applying the DCF method because stock prices fluctuate daily,<br />
while financial analysts’ forecasts for a given company are generally changed less<br />
frequently, often on a quarterly basis. Thus, to match the stock price with an earnings<br />
forecast, it is appropriate to average stock prices over a three-month period.
Written Evidence of James H. Vander Weide, Ph.D.<br />
Page 83 of 87<br />
EXHIBIT 13<br />
APPENDIX 3<br />
THE SENSITIVITY OF THE FORWARD-LOOKING<br />
REQUIRED EQUITY RISK PREMIUM ON UTILITY STOCKS<br />
TO CHANGES IN INTEREST RATES<br />
My estimate of the required equity risk premium on utility stocks is based on studies of<br />
the discounted cash flow (“DCF”) expected return on comparable groups of utilities in each<br />
month of my study period compared to the interest rate on long-term government bonds.<br />
Specifically, for each month in my study period, I calculate the risk premium using the<br />
equation<br />
where:<br />
RPCOMP = DCFCOMP – IB<br />
RPCOMP = the required risk premium on an equity investment in the<br />
comparable companies,<br />
DCFCOMP = average DCF expected rate of return on a portfolio of<br />
comparable companies; and<br />
IB = the yield to maturity on an investment in long-term U.S.<br />
Treasury bonds.<br />
Electric Company Ex Ante Risk Premium Analysis. For my electric company ex ante<br />
risk premium analysis, I began with the Moody’s group of 24 electric companies shown in<br />
Table 1. I used the Moody’s group of electric companies because they are a widely followed<br />
group of electric utilities, and use of this constant group greatly simplified the data collection<br />
task required to estimate the ex ante risk premium over the months of my study. Simplifying<br />
the data collection task was desirable because the ex ante risk premium approach requires<br />
that the DCF model be estimated for every company in every month of the study period.<br />
Exhibit 5 displays the average DCF expected return on an investment in the portfolio of<br />
electric companies and the yield to maturity on long-term Treasury bonds in each month of<br />
the study.<br />
Previous studies have shown that the ex ante risk premium tends to vary inversely with<br />
the level of interest rates, that is, the risk premium tends to increase when interest rates<br />
decline, and decrease when interest rates go up. To test whether my studies also indicate<br />
that the ex ante risk premium varies inversely with the level of interest rates, I performed a
Written Evidence of James H. Vander Weide, Ph.D.<br />
Page 84 of 87<br />
regression analysis of the relationship between the ex ante risk premium and the yield to<br />
maturity on long-term Treasury bonds, using the equation,<br />
where:<br />
RPCOMP<br />
IB<br />
RPCOMP = a + (b x IB) + e<br />
= risk premium on comparable company group;<br />
= yield to maturity on long-term U.S. Treasury bonds;<br />
e = a random residual; and<br />
a, b = coefficients estimated by the regression procedure.<br />
Regression analysis assumes that the statistical residuals from the regression equation are<br />
random. My examination of the residuals revealed that there is a significant probability that<br />
the residuals are serially correlated (non-zero serial correlation indicates that the residual in<br />
one time period tends to be correlated with the residual in the previous time period).<br />
Therefore, I made adjustments to my data to correct for the possibility of serial correlation in<br />
the residuals.<br />
The common procedure for dealing with serial correlation in the residuals is to estimate<br />
the regression coefficients in two steps. First, a multiple regression analysis is used to<br />
estimate the serial correlation coefficient, r. Second, the estimated serial correlation<br />
coefficient is used to transform the original variables into new variables whose serial<br />
correlation is approximately zero. The regression coefficients are then re-estimated using<br />
the transformed variables as inputs in the regression equation. Based on my regression<br />
analysis of the statistical relationship between the yield to maturity on long-term Treasury<br />
bonds and the required risk premium, my estimate of the ex ante risk premium on an<br />
investment in my proxy electric company group as compared to an investment in long-term<br />
Treasury bonds is given by the equation:<br />
RPCOMP = 10.67 - 0.867 x IB.<br />
(10.49) (-4.98) [10]<br />
2<br />
R = 18.48 percent<br />
This equation suggests that the ex ante risk premium on electric utility stocks increases by<br />
more than 80 basis points when the interest rate on long-term Treasury bonds declines by<br />
100 basis points. Equivalently, this regression equation suggests that the cost of equity for<br />
electric utilities declines by less than 20 basis points when the interest rate on long-term<br />
Treasury bonds declines by 100 basis points. These data demonstrate that the AAM <strong>ROE</strong><br />
[10] The t-statistics are shown in parentheses.
Written Evidence of James H. Vander Weide, Ph.D.<br />
Page 85 of 87<br />
Formula, which assumes that the cost of equity declines by 75 basis points when the yield to<br />
maturity on long Canada bonds declines by 100 basis points, is no longer appropriate for<br />
estimating the cost of equity.<br />
Using the <strong>2009</strong> forecast 4.30 percent yield to maturity on long-term Canada bonds<br />
obtained from Consensus Economics as of July 2008, the regression equation produces an<br />
ex ante risk premium equal to 6.94 percent (10.67 – 0.867 x 4.30 = 6.94).<br />
Natural Gas Company Ex Ante Risk Premium Analysis. I also conducted an ex ante<br />
risk premium study applied to a natural gas proxy group and followed the procedures<br />
described above. To select my ex ante risk premium natural gas proxy group of companies,<br />
I used the same criteria that I use when estimating the DCF cost of equity, namely, I<br />
selected all the companies in Value Line’s groups of natural gas companies that: (1) paid<br />
dividends during every quarter of the last two years; (2) did not decrease dividends during<br />
any quarter of the past two years; (3) had at least three analysts included in the I/B/E/S<br />
mean growth forecast; (4) have an investment grade bond rating and a Value Line Safety<br />
Rank of 1, 2, or 3; and (5) have not announced a merger. Exhibit 6 displays the results of<br />
my ex ante risk premium study, showing the average DCF expected return on an investment<br />
in the portfolio of natural gas companies and the yield to maturity on long-term Treasury<br />
bonds in each month. [11]<br />
Based on my knowledge of the statistical relationship between the yield to maturity on<br />
long-term Treasury bonds and the required risk premium, my estimate of the ex ante risk<br />
premium on an investment in my proxy natural gas companies as compared to an<br />
(13.22) (-6.374) [<br />
investment in long-term Treasury bonds is given by the equation:<br />
RPCOMP = 0.1117 - 0.9636 x IB.<br />
12]<br />
2<br />
R = 25.45 percent<br />
This equation suggests that the ex ante risk premium on natural gas utility stocks increases<br />
by more than 90 basis points when the interest rate on long-term Treasury bonds declines<br />
by 100 basis points. Equivalently, this regression equation suggests that the cost of equity<br />
for natural gas utilities declines by less than 10 basis points when the interest rate on long-<br />
term Treasury bonds declines by 100 basis points. These data demonstrate that the AAM<br />
[11] My two ex ante risk premium studies cover slightly different time periods, with the<br />
natural gas company risk premium study extending over a longer period of time,<br />
because I began doing an ex ante study using natural gas companies before I began<br />
performing a similar study for the electric companies.<br />
[12] The t-statistics are shown in parentheses.
Written Evidence of James H. Vander Weide, Ph.D.<br />
Page 86 of 87<br />
<strong>ROE</strong> Formula, which assumes that the cost of equity declines by 75 basis points when the<br />
yield to maturity on long Canada bonds declines by 100 basis points, is no longer<br />
appropriate for estimating the cost of equity.<br />
Using the 4.30 percent forecast yield to maturity on long-term Canada bonds for <strong>2009</strong>,<br />
the regression equation produces an ex ante risk premium equal to 7.03 percent (0.1117 –<br />
.9636 x 4.30 = 7.03).<br />
As described above, my ex ante risk premium regression analysis indicates that the<br />
cost of equity for utilities is significantly less sensitive to interest rate changes than the AAM<br />
<strong>ROE</strong> Formula implies. Rather than declining by 75 basis points when the yield to maturity<br />
on long-term government bonds declines by 100 basis points, my analysis indicates that the<br />
cost of equity declines by less than 50 basis points when interest rates decline by 100 basis<br />
points. To test whether my conclusion is robust to changes in the cost of equity<br />
measurement period, I re-estimated my regression equations using quarterly cost of equity<br />
and interest data rather than monthly data. My regression analysis using quarterly data<br />
strongly supports my conclusion that the cost of equity for utilities is significantly less<br />
sensitive to interest rate changes than the AAM <strong>ROE</strong> Formula suggests. For example, my<br />
regression analysis for electric and natural gas utilities using data for one month of each<br />
quarter, indicates that the cost of equity declines by less than 50 basis points when interest<br />
rates decline by 100 basis points.
Written Evidence of James H. Vander Weide, Ph.D.<br />
Page 87 of 87<br />
TABLE 1<br />
MOODY’S ELECTRIC COMPANIES<br />
American Electric Power<br />
Constellation Energy<br />
Progress Energy<br />
CH Energy Group<br />
Cinergy Corp.<br />
Consolidated Edison Inc.<br />
DPL Inc.<br />
DTE Energy Co.<br />
Dominion Resources Inc.<br />
Duke Energy Corp.<br />
Energy East Corp.<br />
FirstEnergy Corp.<br />
Reliant Energy Inc.<br />
IDACORP. Inc.<br />
IPALCO Enterprises Inc.<br />
NiSource Inc.<br />
OGE Energy Corp.<br />
Exelon Corp.<br />
PPL Corp.<br />
Potomac Electric Power Co.<br />
Public Service Enterprise Group<br />
Southern Company<br />
Teco Energy Inc.<br />
Xcel Energy Inc.<br />
Source of data: Mergent Public Utility Manual, August 2002. Of these 24 companies, I did<br />
not include three companies in my ex ante risk premium DCF analysis because there was<br />
insufficient data to perform a DCF analysis for most of my study period. Specifically,<br />
IPALCO merged with a company that is not in the electric utility industry; Reliant divested its<br />
electric utility operations; and CH Energy does not have any I/B/E/S analysts’ estimates of<br />
long-term growth. In addition, Cinergy completed its merger with Duke Energy in 2006.
Appendices
The Fair Return Standard for Return on Investment by Canadian Gas <strong>Utilities</strong>:<br />
Meaning, <strong>Application</strong>, Results, Implications<br />
The Honourable John C. Major<br />
Former Justice, Supreme Court of Canada<br />
Roland Priddle<br />
President, Roland Priddle Energy Consulting Inc.<br />
Former Chair of the National Energy Board<br />
March 2008<br />
1
Acronyms and Abbreviations<br />
AAM Automatic adjustment mechanism<br />
Alberta Board Alberta Energy and <strong>Utilities</strong> Board<br />
ATWACC After-tax weighted average cost of capital<br />
AUC Alberta <strong>Utilities</strong> Commission<br />
BC Commission British Columbia Public <strong>Utilities</strong> Commission<br />
BCUC British Columbia <strong>Utilities</strong> Commission<br />
California Commission California Public <strong>Utilities</strong> Commission<br />
CAPM <strong>Capital</strong> asset pricing model<br />
CE Comparable earnings<br />
CPUC California Public <strong>Utilities</strong> Commission<br />
DCF Discounted cash flow<br />
ERP Equity risk premium<br />
EUB (Alberta) Energy and <strong>Utilities</strong> Board<br />
FCA Federal Court of Appeal<br />
FRS Fair return standard<br />
LDC Local distribution companies<br />
Manitoba Commission Manitoba Public <strong>Utilities</strong> Commission<br />
MPUB Manitoba Public <strong>Utilities</strong> Commission<br />
MRP Market risk premium<br />
NGTL NOVA Gas Transmission Ltd.<br />
NEB National Energy Board<br />
NERA National Economic Research Associates<br />
Northwestern Northwestern <strong>Utilities</strong> Ltd v. Edmonton [1929] S.C.R. 186<br />
OEB, Ontario Board Ontario Energy Board<br />
Régie Régie de l’énergie (du Québec)<br />
RfD Reasons for Decision<br />
<strong>ROE</strong> Rate of return on equity<br />
SCC Supreme Court of Canada<br />
TCPL, TransCanada TransCanada PipeLines Ltd<br />
TQM Gazoduc TransQuébec & Maritimes<br />
3
Executive Summary<br />
The meaning of the Fair Return Standard (FRS) Canadian governments<br />
responded to the growth of the gas business and the potential for abuse of dominant<br />
position in it by placing utilities under the jurisdiction of administrative tribunals. In<br />
theory, the extent of this regulation is unlimited. In practice it is constrained by the<br />
Constitution Act and by Common Law.<br />
The Supreme Court in Northwestern <strong>Utilities</strong> Ltd v. Edmonton [1929] S.C.R. 186<br />
(Northwestern) defined the scope of the utilities’ right to price their product and their<br />
right as a result to a fair return. The Court stated “By a fair return is meant that the<br />
company will be allowed as large a return on the capital invested in its enterprise (which<br />
will be net to the company) as it would receive if it were investing the same amount in<br />
other securities possessing an attractiveness, stability and certainty equal to that of the<br />
company’s enterprise”. This definition remains in full legal effect today.<br />
A fair rate of return to the corporation is paramount and is all that can be considered in<br />
arriving at a fair rate. In the unrealistic situation that a fair return worked a hardship on<br />
the consumer, the choices before government to provide relief are unlimited but they<br />
should not lower the fair rate of return. Indeed the Federal Court of Appeal (FCA) in<br />
TransCanada PipeLines v. Canada National Energy Board 2004 F.C.A. 149 confirmed<br />
that a fair return need not be modified out of deference to its impact upon customers.<br />
As the operations of regulated utilities have become larger and more complicated, the<br />
courts have developed the view that a selected board of experts could deal more<br />
effectively with the rules of rate making than could the courts on appeal. Therefore, as<br />
long as the board in question acted within their jurisdiction, a successful appeal was<br />
unlikely. Notwithstanding the breadth of discretion afforded a regulator in establishing<br />
just and reasonable rates, the mutuality of interest between utilities and their customers<br />
nevertheless requires that a fair return be provided for the services rendered. The legal<br />
framework governing the determination of that fair return is the “Comparable Return<br />
Standard”. It does not mandate any particular approach to that fair return.<br />
The application of the FRS The current generic approach by Canadian<br />
regulators to gas utility rates of return on equity (<strong>ROE</strong>) awards pursuant to the FRS<br />
evolved after a long period in which regulators applied informed judgment to extensive<br />
evidence about a variety of tests. During that period, differing weights were given to the<br />
results but, with the exception of one jurisdiction and one test 1 , none was ever<br />
permanently discarded. Over the years however, greatest reliance came to be placed on<br />
the equity risk premium (ERP) model.<br />
With the passage of time, the phenomenon of successive protracted proceedings, eliciting<br />
similar evidence, stimulated the search for a generic approach. From the mid-1990’s<br />
Canadian regulators accreted around the concept of an <strong>ROE</strong> for a benchmark utility based<br />
on an ERP over a risk-free rate, the resulting base-year award then being adjusted<br />
4
annually by a predetermined automatic mechanism. This is the essence of the generic<br />
<strong>ROE</strong>, now adopted for the regulation of that component of all major gas pipeline and<br />
distribution utilities’ revenue requirements.<br />
The results of regulators’ current application of the FRS The number<br />
and duration of rate proceedings has been significantly reduced and in certain<br />
jurisdictions the way has been paved for long-term settlements, some of which have made<br />
provision for sharing of efficiency gains between customers and owners.<br />
The Canadian approach to return matters stands in strong contrast to that in the USA,<br />
with which Canada shares the long tradition of cost of service utility regulation. There, in<br />
accordance with essentially similar jurisprudence, the fairness of return on investment is<br />
evaluated against the opportunity cost of capital.<br />
While settlements are also common in the USA, American regulators have not pursued<br />
the generic <strong>ROE</strong> approach but instead maintain case by case reviews, emphasize the<br />
important role of informed judgment, entertain a variety of evidence, but tend to the<br />
discounted cash flow method (DCF) as the default mechanism for their fair return<br />
findings.<br />
In the NEB generic <strong>ROE</strong> era, no new pipelines have applied for tolls based on that<br />
determination of <strong>ROE</strong>. Instead, new projects such as Alliance, Emera Brunswick,<br />
Maritimes and Northeast, and Mackenzie Valley have all come before the Board with<br />
negotiated tolls based on significantly higher <strong>ROE</strong>s. This suggests that the NEB’s generic<br />
<strong>ROE</strong> is insufficient to attract capital to greenfield gas pipeline projects.<br />
The implications of this application of the FRS The now-universal generic<br />
<strong>ROE</strong> approach by Canadian regulators of major gas utilities has created some regulatory<br />
economies. But unfortunately its mechanistic character suspends for lengthy periods the<br />
previously-valued application of informed judgment to the results of alternative methods<br />
of achieving the FRS required by Canadian jurisprudence in <strong>ROE</strong> awards.<br />
A wide and unprecedented gap has developed between Canadian gas utility <strong>ROE</strong>s and<br />
those of USA utilities and of North American low risk industrials. This is factual ground<br />
for concluding that the FRS, essentially the opportunity cost of capital needed to ensure<br />
financial integrity and capital attraction, is no longer being achieved by the generic <strong>ROE</strong><br />
approach.<br />
Canadian regulatory convergence on the generic <strong>ROE</strong> may however inhibit its necessary<br />
reappraisal because particular regulators may be reluctant to break ranks with the group<br />
and because the consensus around an approved generic <strong>ROE</strong> is widely supported by<br />
stakeholders 2 , for reasons of regulatory efficiency and short term economic self-interest.<br />
It would be helpful if, at the same time as specific cases occasionally come before<br />
individual regulators 3 , some further studies of general relevance were to be carried out.<br />
For example, examination is recommended of the results, ex post, of the generic approach<br />
5
in terms of the comparability of the resulting returns with non-utility and utility<br />
comparators and of the fundamentals of the present design including the choice of the<br />
risk-free rate; the appropriate measurement of the risk-premium; the adjustment<br />
mechanism; and the place of the DCF model which is accepted by the great majority of<br />
North American regulators.<br />
6
Introduction<br />
The Canadian Gas Association (CGA) Discussion Paper “Return on Equity: Allowed<br />
Returns for Canadian Gas <strong>Utilities</strong>” 4 , highlighted the importance of a “fair return” in<br />
supporting investments for the long term strength of the nation’s natural gas grid. The<br />
paper went on to summarize the origins and evolution of Canada’s “fair return<br />
standard”. The paper noted that Canadian gas utilities are not now receiving allowed<br />
returns comparable with those of U.S. gas utilities or low-risk unregulated companies.<br />
As a result, Canadian utilities, it stated, are treated unfairly and may be inhibited from<br />
offering a robust optimal system that would provide the highest quality of service<br />
today and would be properly oriented towards a sustainable energy future.<br />
Against that background, the Association asked the present authors, who had<br />
provided advice in the drafting of the Discussion Paper, to expand on some of the<br />
issues raised in it, particularly the identified need for the policy community and<br />
regulators to ensure that allowed returns remain fair and appropriately reflect the<br />
significant changes in their foundational elements such as comparable earnings.<br />
In response, the authors provide here an examination of the meaning of the FRS in<br />
jurisprudential terms, discuss its application by Canadian regulators over the decades,<br />
review the results of the convergence since the mid-1990s on a generic approach to<br />
returns on equity and consider the implications of that approach for the future health<br />
of Canada’s gas utility businesses. As to the application of the FRS, regulators have<br />
received thousands of pages of evidence and written hundreds summarizing it,<br />
providing their views and setting out their reasons for decision. Our discussion is<br />
necessarily a selective and summary one. However, we hope not to have omitted any<br />
point of fundamental significance.<br />
7
1. The Jurisprudential Meaning of the Fair Return Standard<br />
The inception of utility regulation in Canada The introduction of utility regulation<br />
by governments was grounded in the view that the activity had evolved into a number of<br />
sufficiently large corporations operating in a business characterized by natural monopoly<br />
and therefore capable of exerting market power to the detriment of consumers.<br />
History demonstrated a number of methods of control available to the authorities. In<br />
response to concerns about the monopoly power wielded by Standard Oil, the United<br />
States introduced anti-trust legislation which led to its massive restructuring into a<br />
number of smaller corporations, forcing increased competition. The result was reorganization<br />
of their position from virtual dominance of the sector to competition among<br />
the newly formed corporations. Similar experience occurred in diminishing the dominant<br />
areas in steel and railroads.<br />
Canada, because of its size in terms of population and domestic product, chose to remove<br />
the actual or feared problem of monopolies in the utility field either by use of legislative<br />
regulation or by Crown ownership.<br />
In the context of regulation, some economists express the view that a regulator serves as a<br />
surrogate for competition in terms of the regulated company’s potential dominance of a<br />
particular activity. While this may not be a complete explanation of the public purpose, it<br />
is a useful analogy. The pertinent and difficult question is what should these regulated<br />
companies be entitled to charge their retail, commercial and industrial customers so as to<br />
ensure safe and modern service in exchange for a fair return on shareholders’ capital?<br />
Regulatory responsibility conferred on administrative tribunals The history of<br />
the natural gas industry is a relatively short one: it is only in the early part of the 20 th<br />
century that independent commercial use started to visibly develop.<br />
As privately-owned utilities started to evolve into fewer but larger companies capable of<br />
exerting market power, the response of Canadian governments was utility regulation<br />
under which administrative tribunals were given the jurisdiction to regulate private utility<br />
companies falling under their mandate. By and large, however, Crown-owned utilities<br />
were not regulated in the conventional way since their corporate governance was taken to<br />
be enlightened by the government’s perception of the pubic interest of the day.<br />
The recognition of the value of natural gas as a legitimate alternative to electricity and<br />
fuel oils as an energy source, and the need for such control, raised a number of regulatory<br />
and constitutional issues.<br />
As a preliminary point, it is obvious that the constitutional division of powers dictated by<br />
sections 91 and 92 of the British North America Act divided the regulatory responsibility<br />
between the Federal and Provincial governments. This is a separate subject, capable of<br />
8
extensive comment, but it is sufficient for this paper to say intra-provincial activity fell to<br />
the Provincial Legislatures and extra-provincial activity to the Federal Parliament.<br />
Constraints on the extent of regulation In Canada, the extent to which governments<br />
choose to regulate is theoretically unlimited. The absence of property rights for<br />
corporations makes them vulnerable to draconian legislation, if our governments so<br />
choose. However, the courts have recognized Common Law rights that co-exist with the<br />
Canadian Charter of Rights and Freedoms. Expropriation without compensation offends<br />
the Common Law rights of persons and corporations and is unknown to have occurred in<br />
Canada except for some unusual circumstances during war time.<br />
The full reach and restraint by the Constitution Act or Common Law as they affect<br />
persons and corporations is beyond the narrower scope of this paper. It is sufficient to<br />
state that the rights are real, recognizable and enforceable.<br />
Jurisprudence concerning utility rates—the fair return standard The important<br />
test of the prices or rates to be paid by consumers of natural gas supplied by a public<br />
utility has been established by our highest court, the Supreme Court of Canada (SCC).<br />
The Court confirmed the right of the companies to price the product within the confines<br />
of a fair rate of return on investments for the shareholder.<br />
The SCC defined the scope of that right in 1929 and it remains in full legal effect today.<br />
It is consistently referred to and followed. The right to a fair return, and what it is, was<br />
defined by the SCC in Northwestern <strong>Utilities</strong> Ltd. V. Edmonton, [1929] S.C.R. 186 where<br />
Mr. Justice Lamont stated:<br />
“The duty of the Board was to fix fair and reasonable rates; rates which, under the<br />
circumstances, would be fair to the consumer on the one hand, and which, on the<br />
other hand, would secure to the company a fair return for the capital invested. By<br />
a fair return is meant that the company will be allowed as large a return on the<br />
capital invested in its enterprise (which will be net to the company) as it would<br />
receive if it were investing the same amount in other securities possessing an<br />
attractiveness, stability and certainty equal to that of the company’s enterprise”.<br />
The importance of maintaining safe and reliable service requires a fair return as defined<br />
by Mr. Justice Lamont. The consumer has grown accustomed to a high standard in the<br />
delivery of gas services. Humanly, they are used to both the high quality of product and<br />
service. Equally human, they balk at rate increases while knowing that to avoid<br />
deterioration in service, timely increases are necessary.<br />
“Fair return” vs. fairness to the consumer While it has not yet happened,<br />
if providing a fair return to utilities as defined by the courts results in hardship for the<br />
consumer, how should it be resolved? The greater good is served by the application of<br />
Mr. Justice Lamont’s definition. The language found in most legislation refers to words<br />
such as rate fair to the corporation and consumer. Fairness to the consumer in that sense<br />
is redundant. A fair rate of return to the corporation is paramount and is all that can be<br />
9
considered in arriving at a fair rate. The fair rate by logic alone should be deemed of<br />
necessity fair to the consumer.<br />
That a fair rate of return would be a hardship on the consumer is practically unrealistic. It<br />
is academic and an unlikely result. An increase in rates is always unwelcome. If the rate<br />
rose to a hardship, some government intervention should be expected or the regulator<br />
may adjust the rate design while still ensuring the provision of a “fair return” to the<br />
utility. The point is that there are choices for relief, such as subsidies or a rate design<br />
short of lowering the fair rate of return. If hardship is the consequence of a fair return,<br />
nonetheless, the fair return must be set. Failure to do so over time will, as we have<br />
collectively seen, lead inevitably to the deterioration of, and in the extreme case, the<br />
failure of service and supply.<br />
The Federal Court of Appeal (FCA) recently restated the principles of a fair return in<br />
TransCanada PipeLines v. Canada National Energy Board 2004 F.C.A. 149, where it<br />
confirmed the logic of Mr. Justice Lamont’s definition by confirming that the fair return<br />
need not be modified out of deference to its impact upon customers. A fair return assures<br />
the opportunity to earn a level of profit equal to a comparable return from business of<br />
similar risk, although flexibility by which the ultimate tolls are designed may mitigate<br />
clear hardship or unfairness to consumers. However, by definition, a fair return should<br />
not result in these consequences.<br />
Consumers and those outside the industry frequently forget or never considered that<br />
while utilities are by law always entitled to a fair return, it is a limited blessing in that<br />
higher earnings in buoyant times are not available to the utilities. There are no windfall<br />
profits such as may arise in other parts of the energy sector. It is only logical that the<br />
other side of that equation applies and a fair rate of return must also be allowed in less<br />
prosperous economic times.<br />
Judicial review of regulatory awards The right to a fair return is one<br />
foundation of utility jurisprudence. Of concern is the growing development of the law<br />
that demonstrates a reluctance of the courts to review regulatory awards.<br />
Until the 1930s, judicial review was more common as the courts viewed it their role to<br />
protect the public’s interest. However, as Canada’s industrial base grew and the operation<br />
of regulated utilities became both larger and more complicated, the view developed that a<br />
selected board of experts could deal more effectively with the rules of rate-making than<br />
the courts so long as the board in question acted within their jurisdiction, a successful<br />
appeal was unlikely.<br />
The concept of judicial review was more elaborately defined by the SCC in<br />
Pushpanathan v. Canada (Minister of Citizenship and Immigration), [1998] 1 S.C.R.<br />
982, where in summary it held that judicial review was identified by three tests. First, was<br />
the decision reasonable, second was the decision patently unreasonable and finally was<br />
the decision correct in law. It was only the latter, correct in law test, which receives a<br />
judicial welcome. It is the present law that a decision by the board must, if a question of<br />
10
law be correct any other finding or decision of the board must be patently unreasonable<br />
before judicial review is available.<br />
The human concern by applicants of regulatory boards is the question of bias and<br />
fairness. A board that is neither can mouth the established fair return definition but not<br />
accept the applicant’s facts. It is obvious that a fair return is dependant on the facts<br />
accepted by the Board and, except in extreme circumstances, the courts will not interfere.<br />
For fairness to occur dictates good faith by all participants.<br />
Notwithstanding the breadth of the discretion afforded a regulator in establishing just and<br />
reasonable rates, the mutuality of interest between utilities and their customers<br />
nevertheless requires that a fair return be provided for the services rendered. The term<br />
just and reasonable does not displace the common law standard, rather it supports it<br />
(NWL 1929; TCPL 2004; see also Ottawa Electric Railway Co. v. Nepean Township<br />
(1920), 605 S.C.R. 216 at QL5, 11-12; Chastain v. British Columbia Hydro and Power<br />
Authority (1972), 32 D.L.R. (3d) 443 (C.C.S.C.) McIntyre J. at p. 454-456; Re City of<br />
Dartmouth [1976], N.S.J. No.457, 17 N.S.R. (2d) 425, MacKegan C.J. at QL para 11). As<br />
the Federal Court of Appeal most recently expressed it, failure to observe the fair return<br />
standard would result in tolls that are not just and reasonable. In some cases, the courts<br />
confirmed that the fair return need not be modified out of deference to its impact upon<br />
customers.<br />
Conclusion Accordingly, it can be seen that the legal framework governing the<br />
determination of a fair return is the “Comparable Return Standard”. It does not mandate<br />
any particular approach to the determination of a fair return. The courts have recognized<br />
the regulators’ expertise in this area as superior to their own. What pervades the courts’<br />
approach to the determination of a fair return, however, is the mutuality of interest as<br />
amongst utilities and their customers in tying the availability of a fair return to the long<br />
term viability of the utility in providing the essential monopoly services our society<br />
requires.<br />
The latitude given boards to set rates includes the ability to rely on a formula. It is<br />
unlikely that any one formula can fit all rates. A decision by a board that distorts fair<br />
return by the application of a formula that achieves that result poses the obvious risk of<br />
being incorrect at law and subject to judicial revision on that ground, a result any board<br />
would seek to avoid.<br />
11
2. <strong>Application</strong><br />
The place given to the Lamont decision In their decisions on <strong>ROE</strong> 5 , Canadian gas<br />
utility regulators 6 have seldom made explicit reference to the Lamont decision (Lamont).<br />
There have been important exceptions. Thus, in its seminal first decision on<br />
TransCanada’s rates, the National Energy Board (NEB) in 1971 stated that it had been<br />
guided by relevant jurisprudence, as well as by its understanding of the [NEB] Act and<br />
then cited the “fair return” portion of the Lamont decision 7 , followed by other now<br />
familiar cases, Canadian and American. Then, some 30 years later, in dealing with an<br />
application for review and variance of its 1995 decision on Cost of <strong>Capital</strong> 8 , the Board<br />
noted that the applicant had cited Lamont and it went on to summarize the key elements<br />
of that decision, stating that in considering the legal framework associated with the<br />
determination of a fair return, the Board had looked at both prior judicial and Board<br />
consideration of the issue 9 . That 2002 decision was the subject of an application for<br />
review and variance and, in addressing the fair return standard, the Board in 2003<br />
examined its legal obligations and again cited Lamont along with other Canadian and<br />
American jurisprudence 10 . Finally, in dealing in 2005 with an application for new tolls,<br />
the Board summarized the evidence and provided its views on the legal framework for<br />
determining a fair return, giving attention to Lamont and other cases 11 . The Alberta<br />
Energy and <strong>Utilities</strong> Board 12 (EUB, Alberta Board) in its landmark July 2004 decision on<br />
the Generic Cost of <strong>Capital</strong>, as part of its consideration of the legislative and judicial<br />
framework, examined relevant decisions, Canadian and American, starting with<br />
Lamont 13 .<br />
Lamont is present, whether explicitly so or not Despite the scarcity of specific<br />
references, it is nevertheless reasonable to assume that, while acting in accordance with<br />
their respective legislative mandates, all Canadian regulators in making <strong>ROE</strong> awards to<br />
gas utilities have recognized the jurisprudence relating to fair return, and specifically the<br />
Lamont decision, whether they have said so or not. In addition to the Lamont test of<br />
“comparable investment” or opportunity cost of capital, drawing on American<br />
jurisprudence 14 , regulators have concluded that, in order for a return to be fair, it must<br />
also meet the tests of “capital attraction” and “financial integrity” 15 . In this connection,<br />
the Régie de l’Énergie du Québec (Régie) has in several decisions accepted the view that<br />
the cost of capital must be evaluated on the basis of the fundamental principle of the<br />
market opportunity cost of capital and that the rate of return must allow the regulated<br />
entity to assure and maintain its capacity to attract funds under reasonable conditions 16 .<br />
In other cases, intervenors have drawn regulators’ attention to the Lamont text 17 . In still<br />
others, the regulator has referred obliquely to the objectives of fairness and capital<br />
18<br />
attraction .<br />
The traditional approach to <strong>ROE</strong> determinations Prior to the mid-1990’s, the<br />
practice of Canadian gas utilities was to make rate applications, often every one or two<br />
years 19 , generally requiring re-determination of their <strong>ROE</strong>s as one component of the total<br />
revenue requirement that could be recovered in rates. In these proceedings, as the Ontario<br />
Energy Board (OEB) has noted, four main approaches were traditionally used by experts<br />
12
to establish a fair <strong>ROE</strong>. The Comparable Earnings Test (CE), Discounted Cash Flow<br />
(DCF) test, <strong>Capital</strong> Asset Pricing Model (CAPM) and Equity Risk Premium (ERP)<br />
test 20 , are all used in varying degrees to formulate an opinion regarding a fair return to<br />
investors for the test year. Parties, the OEB observed, have generally relied on a<br />
combination of these models to establish a utility’s <strong>ROE</strong>. In a combined approach, the<br />
OEB and experts before it have assigned different weights to the results of the various<br />
tests in order to give more significance to those models which they consider to be the<br />
most relevant 21 .<br />
Within the compass of what must be a relatively short paper, it is impossible to trace the<br />
outworking of this approach by each of the Canadian gas utility regulators. However,<br />
successive NEB Reasons for Decision respecting TransCanada PipeLines’ rates illustrate<br />
how this approach was followed by one regulator over the quarter century to 1994.<br />
That Board, like others, was careful from the start to point out that “The final conclusion<br />
as to what is enough but not too much in the way of return is not precisely supportable on<br />
a mathematical basis.” 22 “Many tests and techniques for assisting the process of reaching<br />
a just decision have been used” the Board said “but no single test is conclusive, nor is any<br />
group of them definitive: whatever tests may be used, in the last analysis the adjudicating<br />
body can not escape the responsibility of exercising judgment as to what, in a stated set<br />
of circumstances, is a just and reasonable return or rate of return, or what is a range of<br />
justness and reasonableness of return or rate of return.” 23 Such reference to the necessity<br />
of the exercise of judgment in making return awards is a recurring theme in Canadian<br />
regulatory decisions over the years. 24<br />
Diversity of tests applied in the traditional approach Reverting to the NEB’s<br />
practice, in the early years of the Board’s “active” regulation of TransCanada’s tolls,<br />
comparable earnings appear to have been at the centre of its attention. Thus: “The Board<br />
concludes, based primarily on the comparable earnings analysis of Canadian industrials<br />
which are reasonable alternative investment opportunities for the applicant’s<br />
shareholders, that a return of…is appropriate for the test year…” 25 In an oil pipeline rate<br />
case about this time, there was applicant evidence “…that statistics relating to US utilities<br />
and industrials deserve perhaps a greater weight in the assessment of the current cost of<br />
equity capital than similar Canadian statistics.” The Board however disagreed and<br />
expressed the belief that “…far greater weight should have been given to Canadian<br />
data…Accordingly the Board was particularly interested in the statistics presented<br />
relating to Canadian industrials…” 26 and concluded “…that the cost of equity should be<br />
equal to or slightly less than the opportunity cost of investment in such companies.” 27<br />
By 1978, the evidence put before the Board included CE and DCF tests, the latter to<br />
measure “capital attraction”, but additionally the beginnings of the ERP approach<br />
appeared. The applicant, TransCanada, was cited to the effect that “…a reasonable <strong>ROE</strong><br />
could also be inferred from an examination of the yield differentials maintained in the<br />
past between long term bonds and those of an equity nature in the regulated industry”. 28<br />
13
However, in that particular case, the Board again stated that it paid particular<br />
consideration to “…the CE of Canadian industrials which it believes to be representative<br />
of reasonable alternative investment opportunities for the applicant’s shareholders.” 29<br />
Over time, the ERP becomes the focus By 1981, intervenor evidence was being filed<br />
before the NEB and it related to the DCF method while the applicant relied primarily on<br />
the CE test 30 . However, within a couple of years something of a pattern had been<br />
established that was to last until the mid-1990s with the applicant and one intervenor<br />
filing CE, DCF and ERP evidence while gas-producer intervenors were focussing their<br />
efforts on the DCF approach. 31 In assessing this spectrum of evidence, the NEB tended<br />
over time to place at first “slightly more” reliance on ERP, to find inherent distortions in<br />
the CE data that it received and to be concerned about the results of the DCF test. By the<br />
time of the last rate hearing prior to the generic cost of capital proceeding, the Board<br />
found that “…in the light of recent and prevailing financial market conditions, neither the<br />
DCF test nor the CE test currently yield reliable results…” Accordingly these tests were<br />
given little or no weight in the Board’s decision” and instead the Board was of the view<br />
that “…the ERP was the primary measure of investors’ required returns in the<br />
circumstances of this case.” However, the Board was careful to state its view that these<br />
tests (CE, DCF) may prove useful under different economic conditions. 32<br />
This era during which Canadian regulators determined <strong>ROE</strong> awards by reviewing<br />
evidence from multiple tests and applying their own judgment was summarized for the<br />
British Columbia <strong>Utilities</strong> Commission (BCUC, the BC Commission) in evidence and<br />
referred to by the Commission in a 2006 decision 33 as follows:<br />
“The evidence is that up to the 1960s the principal methodology to determine fair<br />
rates of return was CE, as, according to Dr. Booth, the DCF method and the ERP<br />
method which was derived from the CAPM, were developed in the 1960s. By the<br />
1980s all three methodologies were in use in Canada. In the early 1990s capital<br />
markets in Canada fell into considerable turmoil, causing DCF and CE to give<br />
unreliable results, which resulted<br />
in the ERP becoming the main, if not the sole, methodology used by regulatory<br />
bodies in Canada to establish fair rates of return…The DCF and CE methods have<br />
never managed to restore themselves to favour in regulatory bodies’ eyes...In the<br />
United States the DCF and CAPM methods got their start in the 1970s and have<br />
survived nearly unchanged as the primary rate of return methods, with the DCF<br />
the virtual default method in practically all U.S. regulatory jurisdictions.” 34<br />
Search for a generic approach to <strong>ROE</strong> The context for the search by Canadian<br />
regulators for a generic approach to <strong>ROE</strong> was characterized by: frequent rate<br />
applications; repetitive evidence, often provided by the same expert witnesses, on the<br />
three principal tests; growing disenchantment with the CE and DCF tests; and increasing<br />
reliance on the ERP approach. That search was led by the BC Commission which “…was<br />
the first regulatory agency in Canada to examine the applicability of a generic, formulabased<br />
approach to setting a natural gas or electric utility <strong>ROE</strong> as a means of improving<br />
the efficiency and effectiveness of the regulatory process.” 35<br />
14
British Columbia In its June 1994 decision resulting from that search, 36 the BC<br />
Commission expressed the view that the DCF test was of little use in the present<br />
economic climate, that CE raised a circularity problem when it was based on utilities data<br />
and that primary reliance should be placed on risk premium tests, with CE and DCF as<br />
checks. The Commission’s view was that generic hearings produce cost savings and<br />
better quality of evidence because a variety of experts are gathered at a single point in<br />
time. This view has been borne out by the subsequent experiences of, for example, the<br />
Alberta Board and the NEB.<br />
National Energy Board When the NEB reported its generic return decision nine<br />
months later in March 1995, it found that CE was only useful as a check, that there were<br />
practical limitations on the DCF method and that most experts gave primary weight to the<br />
ERP, which the Board also did. Annual adjustments in the resulting <strong>ROE</strong> were to be in a<br />
ratio of 0.75 of the forecasted change in the yields of Government of Canada long-term<br />
bonds (long Canadas). 37 The NEB later referred to this as “the RH-2-94 formula”.<br />
Manitoba Two months after that, the Manitoba Board Public <strong>Utilities</strong> Board<br />
(Manitoba Board, MPUB) decided a gas distributor rate case, prior to which the applicant<br />
had proposed a mechanical formula to adjust the Board’s then-currently allowed <strong>ROE</strong>.<br />
The Board approved a spread, effectively an ERP, between long Canadas and the <strong>ROE</strong><br />
for the distributor and an adjustment factor of 0.80 of the change in the underlying long<br />
Canada bond yields. 38<br />
Ontario The OEB has since 1997 followed its own guidelines on a formula-based<br />
return on common equity for utilities under its regulation. 39 The initial setup involved<br />
establishing a just and reasonable return applicable to each of the Ontario local<br />
distribution companies. This base comprised a forecasted yield on long Canadas for the<br />
test year to which was added an appropriate premium. The primary methodological<br />
approach to be used in evaluating the appropriate risk premium was the ERP. The annual<br />
adjustment factor proposed was 0.75 of the difference between the forecasted long<br />
Canadas yield and the corresponding forecasted yield for the immediately preceding year.<br />
The OEB gave three reasons for adopting the formula approach to <strong>ROE</strong>. The first was<br />
regulatory efficiency, already mentioned. The second was the weight of experience of<br />
other Canadian jurisdictions which had reviewed the issue and adopted a formula-based<br />
ERP. The third was that it may provide a first step towards formulaic rate making such as<br />
incentive rates. 40<br />
Alberta Alberta was the fifth jurisdiction to adopt a generic approach, which was<br />
done by a decision of July 2, 2004. The award for 2004 was based on the CAPM<br />
estimate, which the Alberta Energy and <strong>Utilities</strong> Board (Alberta Board, EUB) found was<br />
supported by no less than seven other methods examined in evidence while the Board did<br />
not put any weight on four other methods, including DCF and CE. 41 In this connection it<br />
is worth noting that the Board took the position that the CE test is not equivalent to the<br />
(Lamont) comparable investment test. The Board observed that the CE test measures<br />
actual earnings on actual book value of comparable companies, however it does not<br />
15
measure the return “…it would receive if it were investing the same amount in other<br />
securities possessing an attractiveness, stability and certainty equal to that of the<br />
company’s enterprise.” 42 This conceptual concern was one of the reasons the Board gave<br />
to place no weight on the CE test. Nevertheless, the Board did consider that there may be<br />
other measures of comparable investments that should be considered in establishing an<br />
appropriate <strong>ROE</strong>. It went on to examine eight possible ones. 43 44 As to the adjustment<br />
mechanism, the Alberta Board concluded that an adjustment to the generic <strong>ROE</strong> based on<br />
0.75 of the change in forecasted long-Canada bond yield would be appropriate, beginning<br />
in 2005. 45<br />
Québec The Régie has since its decision D-99-11 of 10 February 1999 respecting a<br />
rates application by Gas Métropolitain, applied a de facto generic <strong>ROE</strong> based on the<br />
CAPM model with an annual adjustment equal to 0.75 of the forecasted change in the<br />
risk-free return. 46 This approach was reconsidered in 2007: the ERP was adjusted<br />
marginally upwards on the assessment that Gaz Métropolitan’s risk had increased<br />
compared to that of the benchmark distribution utility. The adjustment mechanism was to<br />
be left unchanged through <strong>2009</strong>. In the 2007 proceeding, the applicant introduced as an<br />
alternative to CAPM, for the first time in Canada, the Fama-French model, which is used<br />
in the financial industry, but so far used only once in the United States in the regulatory<br />
context and never before in Canada. 47 Even though the two models differ, the objective<br />
of both is to estimate the return an investor expects to earn on an investment in securities<br />
having a certain risk. The main difference between the two approaches is in the method<br />
used to express that risk which, the applicant contended, Fama-French does better than<br />
CAPM for utility-type businesses. The Régie however did not retain the Fama-French<br />
model for establishing the rate of return in this decision: the Régie considered that the<br />
application of that model to regulated enterprises has not been sufficiently examined to<br />
48<br />
date to be used as a basis for fixing the rate of return of a distributor.<br />
The generic approach reviewed and reconfirmed Two of the regulators who<br />
pioneered the generic <strong>ROE</strong> with automatic adjustment mechanism (AAM)—the BC<br />
Commission 49 and the NEB 50 —subsequently reviewed their decisions of the mid-1990s.<br />
After again receiving and reviewing much expert testimony, in the NEB case on two<br />
separate occasions (2002, 2005), the established methodology was reconfirmed by both.<br />
Indeed, one considered that “It is clear the ERP methodology is the “gold standard” for<br />
Canadian regulators...” and stated that “…the Commission Panel will give primary<br />
weight to its application and results…” 51<br />
A new test rejected TransCanada recommended in the RH-4-2001 NEB<br />
proceeding that the Board adopt an After Tax Weighted Average Cost of <strong>Capital</strong><br />
(ATWACC) methodology to establish a fair return for its mainline. This was a new<br />
methodology as far as the NEB was concerned and it rejected it, just as the Régie was in<br />
52 53<br />
2007 to reject the Fama-French test, and it reaffirmed the ERP.<br />
16
Legal obligation to apply the FRS? In its consideration of the application for<br />
review of its 2002 decision (RH-R-1-2002), the NEB refuted the assertion of<br />
TransCanada that the Board “is required by law to apply the comparable investment,<br />
financial integrity and capital attraction standards to determine a fair return for the<br />
Mainline” as an overstatement of the law on this issue. The Board went on to note that in<br />
its decision which was under review (RH-1-2002), it had agreed that the three<br />
components of the FRS, along with the balancing of customer and investor interests<br />
should be attributes of a fair return. The Board further noted the statement it had made in<br />
RH-1-2002 that these principles are reflected in the various accepted methodologies to<br />
establish cost of equity capital, such as the ERP approach, which is the basis of the RH-2-<br />
94 Formula and that no one took issue with this statement. In the Board’s view, it was<br />
implicit that the application of a test that reflects these standards would result in a return<br />
that meets these standards. Therefore, the Board did not have to state explicitly that the<br />
resulting return would meet the comparable investment, financial integrity and capital<br />
attraction standards. The Board stated that an express finding, such as was sought by<br />
TransCanada, which discharges the fundamental legal obligation of the regulator is not<br />
necessary when the standards that must be met are imbedded in the methodology used to<br />
determine the return. The Board also considered that there is no legal obligation to use an<br />
FRS, comprised of the comparable investment, financial integrity and capital attraction<br />
standards to determine tolls. Rather, in normal circumstances, a fair return established by<br />
the Board should meet those three elements. This, the Board stated, was accomplished<br />
through the methodology that was used to determine the return. 54 This issue was revisited<br />
in depth by the NEB in RH-2-2004, Phase II, which followed the decision of the FCA in<br />
TCPL v. NEB. The Board stated that it “…also agrees with TransCanada that the case<br />
law establishes that it is the overall return on capital to the company which ought to meet<br />
the comparable investment, financial integrity and capital attraction requirements of the<br />
fair return standard.” 55 The Board went on to say that it is not required to meet the FRS<br />
by subscribing to any particular methodology or solely by examining evidence on overall<br />
return (TCPL had suggested neither). It concluded that it would ensure that each element<br />
going into the traditional methodology is “reasonable”, then “…uses its judgment to<br />
ensure that the resulting return is a fair return in accordance with the legal requirements.”<br />
56 In summary, the NEB in RH-2-2004 Phase II accepted that the law requires application<br />
of the FRS, including the comparable investment, capital attraction and financial integrity<br />
standards, in determining the overall return, but does not stipulate any particular<br />
methodology for doing so.<br />
Risk-free rate critiqued The applicant before the BC Commission in 2006 stated, in<br />
the words of the Decision, that “the theoretical CAPM assumes that the risk-free rate is<br />
uncorrelated with the return on the market. However, the application of the model<br />
typically assumes that the return on the market is highly correlated with the risk free rate,<br />
that is, that the equity market return and the risk-free rate move in tandem. Similarly, an<br />
<strong>ROE</strong> formula that is predicated on a close tracking between the allowed return and the<br />
risk-free rate assumes the risk-free rate and the return on the market are highly correlated.<br />
The theoretical CAPM calls for using a risk-free rate, whereas the typical application of<br />
the model in the regulatory context employs a long term government bond yield as a<br />
17
proxy for the risk-free rate. Long-term government bond yields may reflect various<br />
factors that render them problematic as an estimate of the “true” risk-free rate, including:<br />
• the yield on long-term government bonds reflects the impact of monetary and<br />
fiscal policy;<br />
• yields on long-term government bonds may reflect shifting degrees of investors’<br />
risk aversion; and<br />
• long-term government bond yields are not risk-free; they are subject to interest<br />
rate risk.” 57<br />
This critique of the risk-free rate and the relationship of market returns to that rate,<br />
although recorded by the Commission, was not responded to in the Commission’s<br />
decision.<br />
Convergence among Canadian gas utility regulators Recent years have seen<br />
a rapid and complete convergence among the five Canadian utility regulators who have<br />
major gas distribution and transmission entities under their jurisdictions. All now base<br />
their <strong>ROE</strong> awards essentially on judgments as to an appropriate base year <strong>ROE</strong> for a<br />
benchmark utility. In every case, this base year award uses a risk free rate plus an ERP<br />
with, in some cases, an allowance for flotation costs. Subsequent annual adjustments are<br />
made mechanically on the basis of 0.75 of the changes in the forecasted long Canadas<br />
yields. 58<br />
Insofar as incumbent utilities are affected, the generic <strong>ROE</strong> plus AAM is entrenched<br />
in Canadian regulatory practice—Canadian regulators have in the last dozen years<br />
affirmed and reaffirmed the generic <strong>ROE</strong> based essentially on the ERP methodology as<br />
the sole method of awarding and, through the associated AAM, varying the returns on<br />
equity for gas utility investors. This position has withstood several review applications<br />
and one appeal to the courts. In one important case, as a result of a negotiated settlement,<br />
it cannot be reopened before 2012. 59<br />
Contrast with American practice This Canadian situation stands in sharp<br />
contrast with that in the USA with which Canada shares the tradition of cost of service<br />
utility regulation where the fairness of return on investment is evaluated against the<br />
opportunity cost of capital. 60 There, only two commissions undertook what turned out to<br />
be lengthy, expensive and ultimately unsuccessful searches for a generic solution. There<br />
is a longstanding seeming disinterest on the part of the American regulatory community<br />
in pursuing this search. Instead, where rate cases are not settled, U.S. regulators continue<br />
to rely on the application of judgment to multiple test results 61 with DCF as the default<br />
mechanism 62 .<br />
18
3. Results from the mid-1990s<br />
The number and duration of rate proceedings involving <strong>ROE</strong> evidence significantly<br />
reduced In the period 1971-1994 inclusive, the NEB in respect of only one<br />
company, TransCanada, averaged one rate proceeding every 18 months. It is likely that,<br />
with TransCanada having now settled its tolls for the period 1 January 2007 through 31<br />
December 2011, the similar hearings in the period 1995-2011 will turn out to have<br />
averaged one per eight years. Similar regulatory efficiencies affecting a large number of<br />
utilities, electric as well as gas, are being found by the principal provincial jurisdictions.<br />
In some jurisdictions, the way paved for long-term settlements of rate matters<br />
The NEB’s experience again furnishes an example. The Board’s decision on a generic<br />
rate of return may have been a factor enabling TransCanada 63 and Westcoast Energy 64 to<br />
achieve their first multi-year negotiated settlements of remaining toll and tariff matters.<br />
Note that one of the objectives of both settlements was “to maintain (“or improve”, in the<br />
65 66<br />
case of TransCanada) the financial integrity…” of the pipeline company.<br />
Regarding the Alberta Board, on the one hand a month after bringing down its Generic<br />
Cost of <strong>Capital</strong> decision in July 2004 approved NOVA Gas Transmission Ltd’s (NGTL)<br />
application to commence negotiated settlement discussions. These eventuated in a<br />
settlement of all revenue requirement issues, return on equity being treated as a flowthrough<br />
item, for the three-year maximum period allowed by the Board, commencing 1<br />
January 2005. 67 On the other hand, prior to the implementation of the <strong>ROE</strong> formula,<br />
Northwestern <strong>Utilities</strong> and ATCO Electric both negotiated settlements. Since the<br />
introduction of the formula there have been no long term settlements other than NGTL.<br />
The BC Commission has approved a Settlement Agreement for <strong>Terasen</strong> Gas for 2004-<br />
2007, incorporating a Performance-Based Rate Plan, 68 and subsequently approved its<br />
extension for 2008-<strong>2009</strong>. 69<br />
As to pipelines under the NEB’s jurisdiction, two points are notable. First, settlements of<br />
toll issues have been the norm for oil pipelines since the mid-1990’s. Second, all new oil<br />
and gas pipelines have applied for tolls, based on settlements, where the <strong>ROE</strong> exceeds<br />
that generated by the Board’s generic formula, often by a generous amount.<br />
Transmission utilities’ incentive agreements have provided for efficiency gains and<br />
sharing of those gains between customers and utility owners Annual or biennial<br />
adversarial proceedings relating to <strong>ROE</strong> are for transmission businesses now a thing of<br />
the past. This may have encouraged and enabled parties to settlement negotiations to<br />
build-in to the resulting agreements features that encourage these pipelines to search for<br />
efficiencies with the prospect of retaining for the investor a share of those efficiencies.<br />
All of the negotiated settlements mentioned in the previous paragraph incorporate such<br />
features in one form or another. In a degree, these shared savings mechanisms have<br />
cushioned the impact of declining <strong>ROE</strong>s resulting from the application of the generic<br />
<strong>ROE</strong> decisions in an environment of declining bond yields. For example, in the letter to<br />
19
shareholders accompanying TransCanada’s 1996 Annual Report, the management<br />
commented that there had been a one per cent decline in the rate of return on common<br />
equity allowed by the NEB in 1996. The letter went on to say “That one per cent<br />
represented a reduction in 1995 earnings of about $21 million that had to be made up. A<br />
substantial part of it came from discretionary revenue earned under an incentive<br />
agreement reached late in 1995 between TransCanada and its customers. Incentive<br />
regulation allows TransCanada to share in discretionary revenues and cost savings.” 70<br />
This cushioning effect may be available to some pipelines on a continuing basis, but in a<br />
regulatory context its results must not be seen as an element of a fair return. Fair return<br />
relates to the opportunity cost of capital. Earnings from incentive agreements are rewards<br />
for extraordinary cost-savings and for entrepreneurship in devising service offerings that<br />
create value for which shippers are willing to pay. As the Federal Court of Appeal<br />
reminded in the 2004 TransCanada decision, 71 the fair return must be determined<br />
independently of its impact upon resulting customer rates.<br />
But Canadian and U.S. regulators’ <strong>ROE</strong> practices are now widely divergent after<br />
decades of essentially parallel approaches Canadians have converged on the<br />
generic approach using essentially anticipated risk-free rates plus ERP and adjusting by a<br />
ratio to anticipated changes in risk-free rates. In the U.S., the federal and one state<br />
commission attempted to regularize the <strong>ROE</strong> component of rate cases, but failed to do so.<br />
One commentator has stated that “Efforts to make the process objective and mechanical<br />
are futile as an administrative and practical matter.” 72 Instead, where cases are litigated,<br />
commissions continue to refer to the legal standards set by the landmark U.S. Supreme<br />
Court decisions in Bluefield and Hope. The regulators receive and access data from<br />
quantitative financial models and apply informed judgment in order, as the California<br />
Pubic <strong>Utilities</strong> Commission (CPUC, California Commission) has put it, to arrive at “An<br />
<strong>ROE</strong> set at a level commensurate with market returns on investments having comparable<br />
risks, and adequate to enable a utility to attract investors to finance the replacement and<br />
expansion of a utility’s facilities to fulfill its public utility obligations.” 73 Moreover, U.S.<br />
regulators: have continued to accept evidence that depends in large part on data about<br />
other U.S. gas and electric companies’ returns; have had at least some regard to short<br />
term bond rates; and in some cases have stated a consistent practice to moderate changes<br />
in the <strong>ROE</strong> relative to changes in interest rates in order to increase the stability of <strong>ROE</strong><br />
over time. 74<br />
And Canadian gas utility <strong>ROE</strong>s have fallen significantly below those of American<br />
ones and below those of low risk North American industrials Historically, the <strong>ROE</strong>s<br />
of Canadian gas local distribution companies (LDCs) have approximately matched those<br />
in the U.S. industry. Since the inception of the generic <strong>ROE</strong> approach by Canadian<br />
regulators, the returns enjoyed by Canadians have fallen increasingly and significantly<br />
(up to 150 bp) below those of these comparables. This result arises despite the fact that<br />
independent analysis shows that business risks faced by LDCs in Canada do not<br />
significantly differ from those in the U.S.; that the greatest risk-determinant for utilities,<br />
regulatory risk, is comparable in Canada and the U.S.; and that tax differences do not<br />
75 76<br />
matter to the comparison of Canadian and U.S.<br />
20
<strong>ROE</strong>s for greenfield interprovincial and international pipelines In the<br />
“generic <strong>ROE</strong> era” it has become the practice for new pipelines subject to NEB<br />
jurisdiction to apply for tolls that have been the subject of prior negotiation with shippers.<br />
Typically, these tolls reflect <strong>ROE</strong>s about 300 or more basis points higher than incumbent<br />
pipelines, such as Foothills, TCPL, TQM and Westcoast, receive under the generic<br />
<strong>ROE</strong>. 77 Two points arise. First, this practice suggests that the NEB’s generic <strong>ROE</strong> is<br />
insufficient to attract capital needed for greenfield projects. Second, one wonders whether<br />
this de facto vintaging of <strong>ROE</strong>s in the Canadian interprovincial and international pipeline<br />
sector breaches a fundamental principle of fairness.<br />
21
4. Implications<br />
On the one hand, the generic <strong>ROE</strong> has created regulatory economies and<br />
encouraged the search for other efficiencies in the sector The frequency of<br />
adversarial proceedings leading to <strong>ROE</strong> awards has been greatly reduced with consequent<br />
public and private savings. The generic <strong>ROE</strong> may have encouraged negotiated<br />
settlements of remaining rate issues, which typically incorporate elements of incentive<br />
rate-making encouraging efficiencies in investment and operations. Some utilities may<br />
have been able in this way to partially compensate for the low <strong>ROE</strong>s resulting from the<br />
application of the generic formula. However where that may have happened, it has been<br />
at the expense of greater risks by the utilities. Even with the presence of incentive<br />
features, there is no assurance that settlements will result in a “fair return” being earned<br />
each year of the settlement and over its lifetime, which could be as much as five years.<br />
The scope to achieve efficiencies while ensuring high quality of service may be<br />
exhausted and the overall return may fail to meet the fairness standard.<br />
On the other hand, the generic <strong>ROE</strong> approach is mechanistic and necessarily<br />
suspends the further application of regulatory judgment for extended periods,<br />
marking a sharp break with past practice<br />
o It was not uncommon in the past for regulators to expressly reject<br />
mechanistic approaches to <strong>ROE</strong> awards and stress the importance of<br />
judgment. 78 The initial generic decisions and any subsequent reviews, like<br />
the annual or biennial rate cases that preceded them, were based on careful<br />
assessment of much evidence and the application of informed regulatory<br />
judgments.<br />
o However, once decisions are taken on a generic process, including the<br />
now universal AAM, the further application of judgment as to whether the<br />
FRS is being attained is suspended. 79 In principle, as the Alberta Board<br />
has observed, parties are free at any time to petition the regulator to<br />
consider a review of the adjustment formula in which, in Alberta, the<br />
petitioning party would bear the onus of demonstrating a material change<br />
in facts or circumstances from the evidence filed in its generic proceeding<br />
to merit a review of the formula. 80 In practice, the party’s freedom to<br />
petition can be circumscribed for periods as long as five years as a result,<br />
for example, of a settlement agreement, a term which can therefore cover<br />
one or more economic cycles.<br />
It would appear from work done prior to 81 and parallel with 82 this review that the<br />
FRS may not have been achieved on an ex-post basis This important conclusion is<br />
suggested by the comparison of Canadian gas LDCs’ <strong>ROE</strong>s and the <strong>ROE</strong>s of U.S. gas<br />
utilities and North American low risk industrials, already referred to. It seems reasonable<br />
as an aspect of the industry oversight expected of regulators that, especially after a<br />
change as fundamental as the generic <strong>ROE</strong>, they would assess that change in terms of<br />
22
whether the results required ex ante by the FRS have in fact been achieved ex post, with<br />
particular regard to the opportunity cost of capital. Such an examination by regulators is<br />
particularly warranted because the generic <strong>ROE</strong> plus AAM effectively prevents regulated<br />
entities from routinely presenting evidence and argument as to whether ex post the<br />
resulting <strong>ROE</strong>s have indeed reflected opportunity pricing of the cost of capital and<br />
achieved other objectives of the FRS which the generic regime is intended prospectively<br />
to do. 83<br />
Two fundamental features driving <strong>ROE</strong> changes and arguably driving the “wedge”<br />
between Canadian LDC returns and others, namely the risk free rate and the AAM<br />
ratio appear to deserve critical examination<br />
• On the first point, as noted in Section 2 above, while one applicant has critiqued<br />
the risk-free rate, the regulator involved (the BC Commission), although<br />
summarizing the applicant’s concerns, did not respond to them. It is not difficult,<br />
for instance by reading the Bank of Canada’s periodic comments on factors<br />
influencing rates to find reasons to question why LDC <strong>ROE</strong>’s should be directly<br />
linked to bond rates. 84<br />
• On the second point, the AAM ratio of 0.75 (and the 0.80 chosen initially by one<br />
regulator) had some empirical support in the proceedings leading to the respective<br />
initial generic decisions. Also it received principled support by the applicants in a<br />
number of proceedings. However it appears not subsequently to have been<br />
critically evaluated in terms of the behaviours of equity returns of comparable<br />
unregulated sectors in relation to changing bond yields in the dozen years since<br />
the earliest Canadian generic <strong>ROE</strong> decisions.<br />
• Regarding U.S. LDC returns, the work of Concentric Energy Advisers for the<br />
OEB has shown a much lower coefficient of regression (0.46) between U.S.<br />
<strong>ROE</strong>s and long bonds compared to Ontario <strong>ROE</strong>s (0.86): in other words, that is<br />
for every one percentage point change in interest rates, the Ontario <strong>ROE</strong>s change<br />
by 86 basis points while U.S. <strong>ROE</strong>s change by 46 basis points. 85<br />
The generic, mechanistic <strong>ROE</strong> including the AAM may require some<br />
reconsideration, if the FRS is to be achieved on a going forward basis<br />
The work carried out by Concentric for the OEB and by National Economic Research<br />
Associates (NERA) for the CGA identifies concerns that sow a doubt as to the ability of<br />
the present design of the generic <strong>ROE</strong> to continuously meet the fair return standard. It is<br />
indisputable that this bold and widely-welcomed initiative of Canadian regulators has<br />
entrained and encouraged valuable public and private efficiencies. However, in exchange,<br />
the generic <strong>ROE</strong> has reduced the opportunities, present in previous practice, to<br />
periodically exercise oversight of this critical element in the revenue requirement, review<br />
the results of a variety of tests, apply informed judgments to them, and recalibrate their<br />
<strong>ROE</strong> awards in conformity with their understanding of the FRS. Even though regulators<br />
are willing to entertain applications for review of the generic approach, it remains that<br />
23
there are necessarily fewer examinations of the relevant data to ensure the generic<br />
formula plus the AAM continues to produce end results which meet the FRS.<br />
Examination of the results of the generic approach, ex-post, suggests that, in an<br />
environment where interest rates have been, first, falling and then stabilizing at low<br />
levels, the generic <strong>ROE</strong> plus an AAM that tracks changes in expected bond yields in a<br />
ratio of 0.75 may have pulled <strong>ROE</strong>s down excessively in relation to the FRS and that, in<br />
the judgement of Concentric, “This may require consideration of additional qualitative<br />
and financial metrics in making the <strong>ROE</strong> determination.” 86 In other words, what was<br />
found to be “fair and reasonable” or “just and reasonable” by careful examination of<br />
multiple tests and the appropriate exercise of informed judgment, may no longer be so<br />
after successive adjustments by admittedly-simple AAMs taking place in continuously<br />
changing economic and business conditions.<br />
The remarkable convergence among Canadian gas utility regulators may be an<br />
obstacle to reappraisal of the ERP plus AAM approach to the generic <strong>ROE</strong><br />
The NEB in dealing with TransCanada’s Fair Return <strong>Application</strong> dated 6 June 2001,<br />
centred on a novel After Tax Weighted Average Cost of <strong>Capital</strong> (ATWACC) approach,<br />
stated: “In summary, in the Board’s view, the lack of regulatory precedent is not a barrier<br />
to the adoption of a new approach to regulation. However, in the absence of such<br />
precedent and in the absence of any support from stakeholders for the proposed change<br />
(meaning to the ATWACC approach—authors), the Board’s analysis of the proposal<br />
should show a clear benefit to be derived from the new approach when compared with<br />
previous acceptable approaches.” 87 As already noted, the Régie in 2007 was similarly<br />
faced with a novel approach proposed by Gaz Métroplitan, the Fama-French model<br />
which, according to the evidence, had never before been used in Canada and only once in<br />
the USA. The Régie decided not to retain Fama-French as a method of fixing the <strong>ROE</strong><br />
because it had not been sufficiently examined to date to be used as a basis for fixing the<br />
rate of return of a distributor. 88<br />
In view of the foregoing, it is reasonable to pose the questions “Is there likely to be<br />
regulatory precedent and stakeholder support for initiatives by the gas utility industry for<br />
review of and change in the generic <strong>ROE</strong>?”<br />
As to “regulatory precedent”, it may not be easy for any Canadian regulator to “break<br />
ranks” with the rest, particularly after several have relatively recently reviewed their<br />
generic <strong>ROE</strong> practices and decided against major changes to them. Having taken place,<br />
regulatory convergence may be a powerful disincentive even for needed changes.<br />
As to “stakeholder support”, it appears that Canadian gas utility stakeholders are<br />
continuing in their virtually unanimous support of the respective regulators’ established<br />
approaches. In the environment of generally-declining bond yields, the present design of<br />
the generic <strong>ROE</strong> has worked to the short-term economic advantage of industrial users,<br />
residential consumers, producers and shippers. This has generated an attitude, common in<br />
the regulatory world, of “what we have we hold”. As long as the provision of safe and<br />
adequate service does not seem to be immediately at risk, this attitude is likely to<br />
24
continue. Broad stakeholder support for major revisions favourable to the utilities seems<br />
unlikely to materialize so long as utilities seem able to attract capital and avoid impairing<br />
their financial integrity. It appears doubtful, however, that the FRS is satisfied by these<br />
considerations alone if the end result is unfair relative to returns available from<br />
investments in companies of similar risk.<br />
Desirable next steps It would be helpful if, at the same time as specific cases<br />
occasionally come before individual regulators, 89 some further studies of general<br />
application were to be carried out. It is not the purpose of this paper to propose an<br />
alternative framework for <strong>ROE</strong> determination. However, any reconsideration should<br />
clearly take place against the background of an ex post examination of the results of the<br />
generic approach in terms of the comparability of the resulting returns with non-utility<br />
and utility comparators. It must include the fundamentals of the present design, namely<br />
the choice of the risk-free rate, the appropriate measurement of the risk premium and the<br />
adjustment mechanism. And it cannot exclude consideration of the place of the DCF<br />
model, given its acceptability to a majority of North American regulators. Finally, in an<br />
era of North American economic and business integration, the question must be asked<br />
“Can Canadian gas utilities successfully compete for capital if their regulators continue to<br />
award lower returns on generally thinner equity shares than those enjoyed by the<br />
American industry?”<br />
Absent such a reconsideration and consequent adjustment, in an environment of<br />
continuing very low interest rates and bond yields, the present generic <strong>ROE</strong> formula<br />
alone may not be protecting the public interest in the provision by incumbent utilities of a<br />
robust, flexible natural gas delivery structure financially strong to support future<br />
sustainability of our energy economy.<br />
25
ENDNOTES<br />
1 The jurisdiction is Alberta. The test is the traditional comparable earnings one. See under heading 2<br />
“<strong>Application</strong>”, subheading “Alberta” on page 16.<br />
2 The word “stakeholder” has become an undefined term of art, particularly in NEB decisions on<br />
applications reflecting negotiated settlements, where it may be used as a synonym for parties to those<br />
settlements. In this paper, by “stakeholders” are meant parties, other than utility managements and<br />
shareholders, who have an economic interest in gas utility rates or tolls and who routinely take part in<br />
related regulatory proceedings and in settlement discussions. In this definition, depending on the nature of<br />
the utility, “stakeholder” can mean gas producer; shipper; exporter; industrial, commercial or residential<br />
consumer; or provincial government.<br />
3 An example may be the application to the NEB by Gazoduc TransQuébec & Maritimes (TQM) for Cost<br />
of <strong>Capital</strong> for 2007 and 2008, revised filing December 18, 2007, the first such application by that company<br />
since 1994. However, because of the complexity of the issues involved in this application and because of<br />
language considerations, a longer than normal hearing process is required. The hearing is presently<br />
scheduled to commence 23 September 2008, which means that a decision on this hearing would not be<br />
released until early <strong>2009</strong>. See National Energy Board letter to TQM of 22 January 2008, file OF-Tolls-<br />
Group1-T201-2007-03 01.<br />
4 Return on Equity: Allowed Returns for Canadian Gas <strong>Utilities</strong>. A Discussion Paper Developed by the<br />
Canadian Gas Association. Summer 2007. 20 pages in bilingual format.<br />
5 The Lamont decision relates to “…a fair return…on the capital invested in its enterprise…” (S.C.R., 1929,<br />
page 193). However, the costs of debt and any preferred shares, assuming they are prudently incurred, are<br />
usually taken as a cost to be flowed directly through to rates via the cost of service. The <strong>ROE</strong> is therefore<br />
the salient variable in the fair return on the (total) capital invested in the enterprise. The discussion in this<br />
paper relates entirely to regulators’ awards for the return on the owners’ equity investment. It does not<br />
extend to consideration of what those awards mean in terms of return on the total capital invested by the<br />
utility in question even though, and the authors acknowledge this, the entire focus of the Lamont decision is<br />
on return on the total capital.<br />
6 By “Canadian gas utility regulators” is meant the relevant regulatory boards and commissions of Alberta,<br />
British Columbia, Canada, Manitoba, Ontario and Quebec.<br />
7 National Energy Board (NEB). Reasons for Decision (RfD). In the Matter of the <strong>Application</strong> under Part<br />
IV of the National Energy Board Act of Trans-Canada Pipelines Limited, RH-1-70, December 1971, pages<br />
6 – 6 to 6 – 9.<br />
8 NEB, RfD, TransCanada et al. Cost of <strong>Capital</strong>. RH-2-94, March 1995.<br />
9 NEB, RfD, TransCanada PipeLines Limited. Cost of <strong>Capital</strong> (Fair Return <strong>Application</strong> of 6 June 2001).<br />
RH-4-2001, June 2002, pages 8-12.<br />
10 NEB, RfD, TransCanada PipeLines Limited. Review of RH-4-2001 Cost of <strong>Capital</strong> Decision. RH-R-1-<br />
2002, February 2003, Chapter 3: Fair Return Standard, pages 6-12.<br />
11 NEB, RfD, TransCanada PipeLines Limited. Cost of <strong>Capital</strong>. RH-2-2004 Phase II, April 2005, Chapter 2<br />
Legal Framework for Determining a Fair Return, pages 8-20. In this context, the NEB noted the finding of<br />
the Federal Court of Appeal in TransCanada’s unsuccessful appeal of the Board’s 2002 decision. The<br />
Court, the Board stated, found that the impact of any resulting toll increases on customers is not a relevant<br />
consideration in the determination of the required rate of return on equity.<br />
12 Since January 1, 2008 the economic regulatory functions of the former EUB in respect of investorowned<br />
and certain municipally-owned utilities are being exercised by the Alberta <strong>Utilities</strong> Commission<br />
(AUC).<br />
13 Energy and <strong>Utilities</strong> Board (EUB), Decision 2004-052, Generic Cost of <strong>Capital</strong>, July 2, 2004, Section 3.2<br />
Relevant Judicial Decisions, pages 12-13.<br />
14 The principal American Supreme Court decisions are Bluefield Water Works & Improvement Company<br />
vs. Public Service Commission of The State of West Virginia et al 262 U.S. 679 [1923] (Bluefield) and<br />
Federal Power Commission et al vs. Hope Natural Gas Co., 320 U.S.591 [1944] (Hope). They are cited by<br />
the NEB in RH-1-70 (op.cit.) at 6 – 8 and 6 – 9, RH-4-2001 (op.cit.) at page 8 and RH-2-2004 (op.cit.) at<br />
pages 14-16.<br />
26
15 This is borne out by the Alberta Board in EUB Decision 2004-052 (op.cit.) where after quoting from<br />
Northwestern, Hope and Bluefield, it stated at page 13 that “The Board notes that no party took issue with<br />
the general consensus that in order for a return to be fair, it must meet the tests of “comparable investment”,<br />
“capital attraction” and “financial integrity” described in the above decisions.<br />
16 « La Régie accepte…que l’évaluation du coût des capitaux propres sur base présumée doit reposer sur le<br />
principe fondamental du coût d’opportunité de marché des capitaux propres…La Régie est d’avis que le<br />
taux de rendement accordé au Distributeur doit lui permettre d’assurer et de maintenir sa capacité d’attirer<br />
les fonds à des conditions raisonnables » Source : Régie de l’Énergie du Québec. Hydro-Québec. D-2003-<br />
93. 2 mars 2003, à la page 70. The same principles had earlier been expressed in Régie de l’Énergie du<br />
Québec. Hydro-Québec. D-2002-95. 30 avril 2002, à la page 163. These were admittedly electric utility<br />
cases, however since the Régie uses essentially the same methodology to determine its <strong>ROE</strong> awards for<br />
Québec gas utilities, it is reasonable to suppose that it does so in pursuit of the same principles of<br />
opportunity cost of capital and capital attraction as it applies to the electrical sector.<br />
17 Manitoba Public <strong>Utilities</strong> Board Act. Centra Gas Manitoba Inc. General Rate <strong>Application</strong>. Order No.<br />
99/07, July 27, 2007, page 65.<br />
18 Ontario Energy Board (OEB) Compendium to Draft Guidelines on a Formula-Based Return on Common<br />
Equity for Regulated <strong>Utilities</strong> (OEB Compendium). Chapter 2: Current OEB Approach, page 2, which<br />
reads in part “The Board’s objective in setting the rate of return on rate base is to ensure that the utility is<br />
provided with a fair return which enables it to meet its obligations and maintain its capability of attracting<br />
capital”.<br />
19 By way of example, TransCanada PipeLines averaged one such application to the NEB per 18 months in<br />
the period 1971-1994 inclusive.<br />
20 The NEB in RH-4-2001 (op.cit.) at page ix (Glossary of Terms) characterizes the ERP method as a<br />
family of models that includes CAPM and ECAPM (Empirical <strong>Capital</strong> Assets Pricing Model). See also<br />
RH-4-2001 page 48, second paragraph.<br />
21 OEB, op.cit.<br />
22 NEB, RH-1-70 op cit, page 6 – 6.<br />
23 NEB, op cit, pages 6 – 2 and 6 – 3.<br />
24 The application of informed judgement is similarly a constant in American regulators’ decisions in utility<br />
rate cases. Consider the following from the California Commission’s December 15, 2005 Decision 05-12-<br />
043 on the Test Year 2006 Return on Equity for the Major <strong>Utilities</strong> (Pacific Gas and Electric [PG&E],<br />
Southern California Edison [SCE] and San Diego Gas and Electric [SDG&E]). At page 23, the<br />
Commission stated “In the final analysis, it is the application of informed judgment, not the precision of<br />
financial models, which is the key to selecting a specific <strong>ROE</strong> estimate. We affirmed this view in D.89-10-<br />
031, which established <strong>ROE</strong>s for GTE California, Inc. and Pacific Bell, noting that we continue to view the<br />
financial models with considerable skepticism.” The Commission then uses the term “informed judgment”<br />
eight times in respect of its own decision-taking. As a matter of interest the resulting <strong>ROE</strong> awards for 2006<br />
were, for PG&E 11.35%; for SCE 11.60%; and for SDG&E 10.70%.<br />
25 NEB, RfD, TransCanada PipeLines Limited, RH-3-76, December 1976 page 4 – 13.<br />
26 NEB, RfD, Interprovincial Pipeline Limited, RH-2-76, December 1977, page 6 – 23.<br />
27 NEB, RH-2-76, op cit, page 6 – 26.<br />
28 NEB, RfD, TransCanada PipeLines Limited, RH-1-78, July 1978, page 5 – 9.<br />
29 Ibid.<br />
30 NEB, RfD, TransCanada PipeLines Limited, RH-4-81, Phase I, August 1981, pages 4 – 5 and 4 – 6.<br />
31 NEB, RfD, TransCanada PipeLines Limited, RH-3-1982, July 1982, pages 3 – 10 to 3 – 12.<br />
32 NEB, RfD, TransCanada PipeLines Limited RH-4-93, June 1994, page 27.<br />
33 BC <strong>Utilities</strong> Commission, Decision in the matter of <strong>Terasen</strong> et al, March 2, 2006, page 45.<br />
34 This statement is from an article by Dr. Jeff D. Makholm in Public <strong>Utilities</strong> Fortnightly, May 15, 2003,<br />
pages 12-18, “In Defense of the ‘Gold Standard’”. The fuller context is as follows: “The fair rate of return<br />
became a hotly contested issue in the early 1970s…The DCF and CAPM methods got their start at this time<br />
and have survived nearly unchanged as the primary rate of return methods, with the DCF the virtual default<br />
method in practically all U.S. regulatory jurisdictions.” (Makholm, page 14, column 1).<br />
35 OEB, op cit, page 8.<br />
36 BC <strong>Utilities</strong> Commission, Decision in the matter of Return on Common Equity, BC Gas Utility et al,<br />
June 10, 1994, see especially pages 17-18.<br />
27
37 NEB, RfD, RH-2-94, TransCanada et al, Cost of <strong>Capital</strong>, March 1995.<br />
38 Manitoba Public <strong>Utilities</strong> Board Act, Order No.49/95, May 5, 1995 in an application by Centra Gas<br />
Manitoba Inc. The Manitoba Board in that decision reserved the right to require a full <strong>ROE</strong> hearing prior to<br />
the 1997 test year as a result of unusual or significant changes in the economy. However such a hearing did<br />
not take place. Centra Gas Manitoba was acquired by Manitoba Hydro, a provincial crown corporation, in<br />
1999 and the <strong>ROE</strong> was subsequently replaced by a provision for a net income as part of Centra’s costs, the<br />
allowed net income would not exceed the allowed return on equity under the Rate Base/Rate of Return<br />
methodology—see Manitoba Public <strong>Utilities</strong> Board Act, Order No. 103/05, July 12, 2005 in an <strong>Application</strong><br />
by Centra Gas Manitoba Inc, page 40.<br />
39 OEB, Draft Guidelines on a Formula-Based Return on Common Equity for Regulated <strong>Utilities</strong>, March<br />
1997 (not page numbered).<br />
40 OEB, Compendium, op cit, page 24, Section 5.1 Rationale for Draft Guidelines, Rationale for Adopting<br />
Formula <strong>ROE</strong>.<br />
41 EUB, Decision 2004-052, op cit, pages 15-31, Section 4.2 <strong>ROE</strong> Methodology and 2004 <strong>ROE</strong>.<br />
42 EUB, op cit, page 23.<br />
43 EUB, op.cit, Section 4.2.7 Other Measures of Comparable Investment, pages 24-30.<br />
44 The CE test was not the only one with which the EUB had difficulties. Thus, it is noted that the Alberta<br />
Board in Decision 2004-052, concluded “…that the results of the ERP tests other than CAPM would<br />
generally support a 2004 <strong>ROE</strong> above the Board’s CAPM estimate, but that for the reasons set out above<br />
only limited weight should be placed on the results of the ERP tests other than CAPM.” EUB op.cit. page<br />
23.<br />
45 EUB, op cit, pages 31-32, Section 4.3 Annual Adjustment Mechanism.<br />
46 The Régie had previously applied the ERP approach but without an automatic adjustment feature, see for<br />
example Régie du Gaz Naturel, Décision D-96-31, 9 octobre 1996, Gaz Métropolitain, pages 69-70, La<br />
prime de risque du marché.<br />
47 Régie de l’énergie, Décision D-2007-116, Gaz Métropolitan, page 23.<br />
48 Ibid, pages 23-24.<br />
49 BC <strong>Utilities</strong> Commission, Decision in the matter of <strong>Terasen</strong> et al, March 2, 2006, op cit.<br />
50 NEB RfDs in TransCanada PipeLines Limited: Cost of <strong>Capital</strong>. RH-4-2001, June 2002; RH-R-1-2002,<br />
Review of RH-4-2001 February 2003; Cost of <strong>Capital</strong>. RH-2-2004 Phase II, April 2005. The RH-R-1-2002<br />
decision was unsuccessfully appealed to the Federal Court of Appeal by TransCanada PipeLines (2004<br />
FCA 149).<br />
51 BC <strong>Utilities</strong> Commission, op cit, page 52. Note that, while intending to give primary weight to the<br />
application and results of the ERP method, the Commission stated that it would need to apply judgment to<br />
the evidence before it.<br />
52 NEB RfD, TransCanada PipeLines Limited, RH-4-2001, pages 45-56.<br />
53 It may be noted that the EUB in Decision E99099, 1999/2000 Electric Tariff <strong>Application</strong>s, 25 November<br />
1999 decided to “use both the traditional method and a modified ATWACC as tools to<br />
arrive at the fair return for (a number of electric utilities) with primary weight placed on the traditional<br />
method.” (see page 328). The ATWACC evidence, which was accepted by the EUB with some<br />
modifications to its results, was submitted by the same witness (Dr.Vilbert) whose methodology and results<br />
were rejected by the NEB in RH-4-2001.<br />
54 NEB RfD, RH-R-1-2002, op cit, pages 11-12 Legal Obligation to use the FRS.<br />
55 NEB RfD, RH-2-2004, op.cit., page 19.<br />
56 Ibid.<br />
57 BCUC, Decision in <strong>Terasen</strong> et al, March 2, 2006, page 46.<br />
58 The degree of convergence as reflected in the annual <strong>ROE</strong> awards is remarkable. Thus, for year 2008 the<br />
range of <strong>ROE</strong>s is only about 50 basis points (bp) with La Régie at 8.91% (Gaz Métro) and the OEB at<br />
8.39% and the EUB, NEB and the BCUC in the middle of the range with 8.75%, 8.71% and 8.62%<br />
respectively. Contrast this with the spread of 65 bp in the awards by one American regulator to three<br />
utilities for one year (footnote 25).<br />
59 The case is TransCanada’s Canadian mainline. The negotiated settlement of March 2007 relates to the<br />
period 2007-2011 inclusive and provides that, during the Term, TransCanada will not pursue litigation of<br />
the NEB RH-2-94 <strong>ROE</strong> formula on behalf of… its Mainline System—see TransCanada PipeLines,<br />
28
<strong>Application</strong> to the NEB, March 14, 2007: <strong>Application</strong> for Approval of a Negotiated Mainline Tolls<br />
Settlement and 2007 Mainline Tolls. Page 5 of 13, item 19. This Negotiated Settlement was approved by<br />
the NEB on 31 May 2007 by Order TG-06-2007.<br />
60 American regulators routinely cite their legal standard for fair return, essentially the Bluefield and Hope<br />
cases which are sometimes referred to also by Canadian regulators (examples: Alberta Board, NEB, see<br />
pages 11-12 above). The California Commission does so in the following terms in case D-05-12-043 (Test<br />
Year 2006 Return on Equity for the Major Energy <strong>Utilities</strong>) “The legal standard for setting the fair rate of<br />
return has been established by the United States Supreme Court in the Bluefield and Hope cases. The<br />
Bluefield decision states that a public utility is entitled to earn a return upon the value of its property<br />
employed for the convenience of the public and sets forth parameters to assess a reasonable return. Such<br />
return should be equal to that generally being made at the same time and in the same general part of the<br />
country on investments in other business undertakings attended by corresponding risks and uncertainties.<br />
That return should also be reasonably sufficient to assure confidence in the financial soundness of the<br />
utility, and adequate, under efficient management, to maintain and support its credit and to enable it to raise<br />
the money necessary for the proper discharge of its public duties. The Hope decision reinforces the<br />
Bluefield decision and emphasizes that such returns should be sufficient to cover operating expenses and<br />
capital costs of the business. The capital cost of business includes debt service and stock dividends. The<br />
return should also be commensurate with returns available on alternative investments of comparable risks.<br />
61 A sampling of relatively recent cases finds that the California Commission received and used DCF,<br />
CAPM and MRP evidence in case D-05-12-043 (see footnote 24), the Illinois Commerce Commission<br />
accepted DCF and CAPM evidence in a September 2005, once-in-a-decade decision on Northern Illinois<br />
Gas Company’s rates; the New York Public Service Commission (NYPSC) received CAPM, CE, DCF and<br />
ERP evidence, found CE and ERP not to be particularly useful, and gave a 50/50 weighting to CAPM and<br />
DCF in a 2007 National Fuel Gas rate case (Case 07-G-0141).<br />
62 See above, text page 15 and footnote 34.<br />
63 NEB, Letter Decision, RH-2-95, December 1995. The TransCanada settlement covered the period 1<br />
January 1996 through 31 December 1999.<br />
64 NEB, RfD, Westcoast Energy Inc., RH-2-97, Part II, August 1997. The Westcoast settlement covered the<br />
period 1 January 1997 through December 31, 2001.<br />
65 NEB, Compilation of Key Documents Related to the Board’s RH-2-95 Decisions, TransCanada, June<br />
1996, page 19, sub Article 1, item 1.2, v).<br />
66 NEB, RH-2-97, op cit, page 1, sub Article 1, item 1.2, (f).<br />
67 EUB, Decision 2005-057, NOVA Gas Transmission Ltd., 2005-2007 Revenue Requirement Settlement,<br />
July 7, 2005, see page 2 thereof.<br />
68<br />
BCUC Order G-51-03 of 29 July 2003 for the initial term.<br />
69<br />
BCUC Order G-33-07 of 23 March 2007 for the extension.<br />
70<br />
“TransCanada PipeLines. Annual Report, 1996. Letter to Shareholders, page 4, final paragraph.<br />
71<br />
Supra, page 9.<br />
72<br />
Makholm, Jeff D., op cit, page 18, column 1.<br />
73<br />
CPUC, D-05-12-043 on Test Year 2006 Return on Equity for the major energy utilities, Findings of Fact,<br />
paragraph 16.<br />
74 It is acknowledged that the Canadian “0.75 ratio” to forecasted changes in long Canadas has this effect.<br />
75 National Economic Research Associates (NERA). Allowed Return on (Gas Utility) Equity in Canada and<br />
the United States: An Economic, Financial and Institutional Analysis. Ken Gordon, Jeff Makholm, Wayne<br />
Olsen, November 2007. Tax differences are dealt with on page 13, business risk on pages 24-25 and<br />
regulatory risk on pages 25-32.<br />
76 Concentric Energy Advisors concluded for the OEB that “(6) On the whole, there are no evident<br />
fundamental differences in the business and operating risks facing Ontario utilities as compared to those<br />
facing U.S. companies or other provinces’ utilities that would explain the difference in <strong>ROE</strong>s.” See<br />
Concentric op. cit., Section VII Conclusions and Summary of Findings, paragraph (6) on page 57.<br />
77 Alliance Pipeline Ltd (Alliance) filed on 31 October 2007 its normal annual toll revisions to become<br />
effective 1 January 2008 The NEB filing ID is A16816. Alliance noted that the filed-for tolls reflect a base<br />
return on equity of 12%, subject to an incentive adjustment, on a deemed capital structure that provides for<br />
30% equity. These are the same numbers as appeared in Alliance’s original certificate application to the<br />
29
NEB which was approved in November 1998 in GH-3-97. At the time of writing, Alliance’s 2008 tolls are<br />
still interim.<br />
Emera Brunswick Pipeline Company Ltd. reached a negotiated agreement for a monthly fixed toll that<br />
would cover all fixed charges including an equity return typically in the 11 to 14 percent range. NEB RfD<br />
Emera Brunswick Pipeline Company Ltd., GH-1-2006, May 2007, Section 7.1 Tolls and Tariffs, page 76<br />
Mackenzie Valley Gas Pipeline, Section 3.1 of the August 2004 application in GH-1-2004 which is still<br />
under consideration presents toll principles that include a deemed capital structure based on 30% equity and<br />
an <strong>ROE</strong> equal to the NEB multi-pipeline <strong>ROE</strong> plus 2.21% for the initial 10 years, see page 3-4<br />
Maritimes and Northeast Pipeline filed on 28 December 2007 a negotiated toll settlement for the calendar<br />
year 2008 which embodies an allowed <strong>ROE</strong> of 11.66 per cent on a deemed equity of 31.18%. NEB filing<br />
ID A17299.<br />
78<br />
The seminal NEB decision in TransCanada’s first rate application, RH-1-70 of December 1971 contains<br />
some important language relating to both points.<br />
First, as to mechanistic approaches, the Board stated at page 6 – 6 “The final conclusion as to what is<br />
enough but not too much in the way of return, and rate of return, is not precisely supportable on a<br />
mathematical basis. If it were, one computer and a few programmers could replace all the regulatory boards<br />
in North America and dispense undeniable justice instantaneously.”<br />
Second, as to the exercise of judgment, the Board said at pages 6 – 2 and 6 – 3 that “Many tests and<br />
techniques for assisting the process of reaching a just decision have been used, but no single test is<br />
conclusive nor is any group of them definitive: whatever tests may be used, in the last analysis the<br />
adjudicating body can not escape the responsibility of exercising judgment as to what, in a stated set of<br />
circumstances, is a just and reasonable return or rate of return, or what is a range of justness and<br />
reasonableness of return or rate of return.” These early comments by the NEB in a sense echo the view<br />
expressed by the SCC in Lamont where, in 1929 S.C.R., at page 199, the Court stated “The question of a<br />
fair rate of return on a risky investment is largely a matter of opinion, and is hardly capable of being<br />
reduced to certainty by evidence, and appears to be on one of the things entrusted by the statute to the<br />
judgment of the Board.”<br />
79<br />
Note that, in applying its automatic mechanism to adjust the rate of return on common equity, the BCUC<br />
initially advised the affected companies that it had “…reviewed the performance of the automatic<br />
mechanism to adjust the rate of return…and has determined that the mechanism has performed<br />
favourably.” (Letters L-61-96, December 2, 1996; L-73-97 of December 2, 1997; L-89-98 of December 4,<br />
1998). After 1998, however, the references to review and to favourable performance were dropped and the<br />
annual notification letters now simply state that “…the Commission has determined that the current <strong>ROE</strong><br />
automatic adjustment mechanism results in an allowed return of…” (example: Letter L-93-07 of November<br />
22, 2007). Essentially the same approach is followed by the EUB (Example: Order U2007-347 of 30<br />
November 2007) and NEB (Example: Letter of 29 November 2007, File OF-TollsGen-RRCE 02).<br />
80<br />
EUB Decision 2004-052, July 2, 2004, page 34.<br />
81<br />
CGA op cit, Section 3: Maintaining a Fair Return, pages 14-17.<br />
82<br />
NERA, op cit, particularly pages 7 – 11.<br />
83<br />
Note that the EUB, in giving its reasons for establishing a standardized approach for setting an <strong>ROE</strong>,<br />
stated “An applicant is also free to apply to the Board to review the <strong>ROE</strong> formula in the manner provided<br />
for in this Decision. Even without an application by a particular party, the <strong>ROE</strong> formula will be subject to<br />
review in certain circumstances and in any event will be considered for review after five years.” See EUB,<br />
Decision 2004-052, op.cit., page 8.<br />
84<br />
A scan of Bank of Canada published comments for the past few years points to the following as rateaffecting<br />
monetary policy factors: economic growth; utilization of economic capacity; demand on the<br />
economy, domestic and export; inflation rates and inflation risks; U.S. economy and major sectors; global<br />
economy and major components EU, Japan, China; global markets, including commodity markets (e.g.<br />
energy), and their balances; Canada/USA exchange rates and the influence on the Canadian economy; cost<br />
of credit to firms and households; state of financial markets, Canada and abroad. These notes are based<br />
mainly on reading the Bank of Canada’s semi-annual Monetary Report and Update available online at<br />
http://www.bank-banque-canada.ca/en/mpr/mpr_previous.html.<br />
85<br />
Concentric Energy Advisors. A Comparative Analysis of Return on Equity of Natural Gas <strong>Utilities</strong>.<br />
Prepared for the OEB. June 14, 2007, pages 18-19. Concentric correctly point out that, “…as interest rates<br />
30
have declined dramatically in Canada in the past ten years, one would expect the OEB formula to yield<br />
accordingly lower authorized <strong>ROE</strong>s. The formula, however, is symmetrical, and <strong>ROE</strong>s will most likely<br />
recover at a faster rate in Ontario than in the U.S., when interest rates begin to rise. In fact, if interest rates<br />
continue to steadily rise, the OEB adjustment formula could surpass and yield higher results than historical<br />
data suggest U.S. authorized returns would reach under the same circumstances.”<br />
86 Ibid, page 57, last sentence in item 5.<br />
87 NEB, Rfd, RH-4-2001, heading Regulatory Precedent, at page 43.<br />
88 Régie de l’énergie. Décision D-2007-116., pages 23-24.<br />
89 The example has already been given of the 17 December 2007 application to the NEB by Gazoduc<br />
Trans-Québec et Maritimes for cost of capital determination for the years 2007 and 2008. See footnote 3,<br />
which also notes the lengthy hearing process which this application may involve, extending over about a<br />
13-month period.<br />
31
Pipelines/Gas &<br />
Electric <strong>Utilities</strong><br />
Pipelines/<br />
Gas & Electric <strong>Utilities</strong><br />
Industry Rating Pipelines:<br />
Industry Rating<br />
Market Perform<br />
Gas & Electric <strong>Utilities</strong>: : Market Market Perform<br />
Perform<br />
2007 <strong>ROE</strong>s Decline to Unprecedented<br />
Levels; Ontario Gets Reprieve<br />
Highlights<br />
December 7, 2006<br />
Toronto, Ontario<br />
Karen J. Taylor, CFA<br />
(416) 359-4304<br />
karen.taylor@bmo.com<br />
Associate: Benjamin Pham<br />
Michael McGowan, CA, CFA<br />
(416) 359-5807<br />
michael.mcgowan@bmo.com<br />
• The ugly got uglier – actual 2007 allowed <strong>ROE</strong>s declined by an average of 0.37% versus the average allowed return on<br />
equity for 2006. The average actual allowed return on equity in 2007 is 8.65% versus 9.01% in 2006.<br />
• The announced allowed returns are fully reflected in our diluted EPS estimates over the 2007 and 2008 forecast<br />
period.<br />
• Although we believe that the allowed returns established by the automatic adjustment mechanisms set out herein likely<br />
violate the Fair Return Standard and are confiscatory, they are in line with expectations and therefore neutral to our<br />
outlook.<br />
• Companies with material exposure to these automatic adjustment mechanisms include Canadian <strong>Utilities</strong> Limited,<br />
Pacific Northern Gas, Gaz Metro L.P., Fortis Inc. and TransCanada Corporation. Companies with limited exposure<br />
to <strong>ROE</strong> adjustment mechanisms include: Enbridge Inc., Duke Energy, and TransAlta Corporation.<br />
• There are a number of companies in our coverage universe with no exposure to these automatic adjustment mechanisms:<br />
Caribbean <strong>Utilities</strong>, and Emera Inc. The pipeline and power trusts/limited partnerships in our coverage universe generally<br />
do not have a material exposure to these mechanisms.<br />
• On November 23, the Ontario Energy Board abandoned its generic licence amendment proceeding, the purpose of<br />
which, among other things, was to codify its approach to determining the allowed return on equity. The Board has<br />
also rejected the implementation of an alternative approach to determine the allowed return on equity for Ontario’s<br />
local electricity distribution utilities. We believe that this alternative approach was seriously flawed and had no basis<br />
in reality.<br />
• We rate the units of Fort Chicago Energy Partners, LP, Inter Pipeline Fund, and Northland Power Income Fund<br />
Outperform. We also rate the shares of Pacific Northern Gas Ltd., and Caribbean <strong>Utilities</strong> Co. Ltd. Outperform.<br />
• We remain restricted on the units of Calpine Power Income Fund.<br />
This report was prepared by an Analyst employed by a Canadian affiliate, BMO Nesbitt Burns Inc., and who is not registered/qualified as a<br />
research analyst under NYSE/NASD rules. For disclosure statements, including the Analyst’s Certification, please refer to pages 10 to 12.
Table of Contents<br />
A. The Calculations ...................................................................................................................................................... 2<br />
B. Allowed Returns are Confiscatory ............................................................................................................................ 5<br />
C. Ontario Gets a Reprieve ........................................................................................................................................... 7<br />
D. Comparable Equity Securities .................................................................................................................................. 9
Page 2 Pipelines/Gas & Electric <strong>Utilities</strong><br />
Table 1: Key Input Assumptions<br />
Regulator Year Formula<br />
Effective<br />
The allowed rates of return on equity (<strong>ROE</strong>) for many of the pipeline and energy utility<br />
companies in our coverage universe are established by an automatic adjustment<br />
mechanism in the fall of each year and are highly dependent on forecast interest rates<br />
for the prospective fiscal period. As discussed below, the 2007 allowed <strong>ROE</strong>s for various<br />
jurisdictions have now been established and allowed <strong>ROE</strong>s, on a cumulative basis, have<br />
reached unprecedented lows.<br />
A. The Calculations<br />
Table 1 sets out the key variables that drive each of the automatic adjustment mechanisms,<br />
by regulator.<br />
Month of<br />
Consensus<br />
Economics<br />
Base GOC<br />
Yield<br />
Equity Risk<br />
Premium<br />
Adjustment<br />
Factor<br />
2004A<br />
<strong>ROE</strong><br />
2005A<br />
<strong>ROE</strong><br />
2006A<br />
<strong>ROE</strong><br />
2007E<br />
<strong>ROE</strong><br />
Change<br />
2007 vs.<br />
2006<br />
National Energy Board<br />
British Columbia <strong>Utilities</strong> Commission<br />
1995 November 9.25% 3.00% 75% 9.56% 9.46% 8.88% 8.46% -0.42%<br />
- <strong>Terasen</strong> Gas (BCGU)<br />
British Columbia <strong>Utilities</strong> Commission<br />
2006 November 5.25% 3.90% 75% 9.15% 9.03% 8.80% 8.37% -0.43%<br />
- <strong>Terasen</strong> Gas (Centra)<br />
British Columbia <strong>Utilities</strong> Commission<br />
2006 November 5.25% 4.60% 75% 9.65% 9.53% 9.50% 9.07% -0.43%<br />
- PNG West Division/Tumbler Ridge<br />
British Columbia <strong>Utilities</strong> Commission<br />
2006 November 5.25% 4.55% 75% 9.80% 9.68% 9.45% 9.02% -0.43%<br />
- PNG Ft. St. John/Dawson Creek/<strong>FortisBC</strong> 2006 November 5.25% 4.30% 75% 9.55% 9.43% 9.20% 8.77% -0.43%<br />
Alberta Energy and <strong>Utilities</strong> Board 2005 November 5.68% 3.92% 75% 9.60% 9.50% 8.93% 8.51% -0.42%<br />
Ontario Energy Board - Enbridge Gas Distribution 1998 October 7.25% 3.40% 75% 9.69% 9.57% 8.74% 8.39% -0.35%<br />
Ontario Energy Board - Union Gas 1<br />
1998 October 7.25% 3.55% 75% 9.62% 9.63% 8.92% 8.53% -0.39%<br />
Regie de l'energie 2<br />
1999 August 5.76% 3.84% 75% 9.45% 9.69% 8.95% 8.73% -0.22%<br />
Nova Scotia <strong>Utilities</strong> and Review Board<br />
Island Regulatory and Appeals Commission<br />
Newfoundland and Labrador Board of<br />
Commissioners of Public <strong>Utilities</strong> 3<br />
Formula Not Presently In Use<br />
2000 Oct/Nov 5.60% 4.15% 80% 9.75% 9.24% 8.77% 8.60% -0.17%<br />
Notes:<br />
(1) Issue of Consensus Economics used to calculate allowed <strong>ROE</strong> has varied.<br />
October stipulated in June 29, 2006 Reasons for Decision re: 2007 Rates.<br />
(2) Excludes 0.57% of Allowed Incentive Return in 2003, 1.51% in 2004, 1.95% in 2005, 0.38% in 2006, and approximately 0.75% in 2007<br />
(3) Return on Equity for Newfoundland Power Inc. Fixed for two-years at 9.75% in decision dated June 20, 2003. Total Return Calculation methodology.<br />
Source: BMO <strong>Capital</strong> Markets
Pipelines/Gas & Electric <strong>Utilities</strong> Page<br />
Table 2: Calculation of the<br />
2007 Actual <strong>ROE</strong> – Multi-<br />
Pipeline Cost of <strong>Capital</strong><br />
As set out in Table 1, the allowed <strong>ROE</strong>s established for the 2007 period are an average<br />
of 0.37% lower than in 2006. The primary reason for the decline in allowed return is the<br />
precipitous drop in the implied forecast 30-year bond yield arising from: (i) reduction in<br />
the underlying Consensus Estimate for 2007 versus 2006 to 4.15% from 4.55%; and (ii)<br />
decline in the observed spreads between the 10-year and 30-year government of Canada<br />
bond yields, as published in the National Post throughout October of 2006 versus a similar<br />
period in 2005, to approximately 7 basis points from approximately 23 basis points.<br />
Tables 2, 3, and 4 highlight the calculation of the allowed 2007 actual <strong>ROE</strong> for the National<br />
Energy Board (NEB), Alberta Energy and Utility Board (AEUB), and the British<br />
Columbia <strong>Utilities</strong> Commission (BCUC). Table 5 highlights our estimate of the allowed<br />
return on equity for Enbridge Gas Distribution, as per the automatic adjustment mechanism<br />
notionally used by the Ontario Energy Board (OEB). We note that that the OEB,<br />
unlike its utility peer group, does not publish or release the calculation for the allowed<br />
return for the utilities subject to its purview. We note that the formulas appear to vary<br />
between Union Gas and Enbridge Gas Distribution and also between the electricity and<br />
natural gas sectors.<br />
Description<br />
2006 Calculated Return on Equity 8.88%<br />
2006 Forecast Yield 4.78%<br />
November 2006 Consensus Forecast - 3 Months Out 4.10%<br />
November 2006 Consensus Forecast - 3 Months Out 4.20%<br />
Average 4.15%<br />
Average Spread between 10-year and 30-year GOCs 1<br />
0.07%<br />
Forecast Long-Term (30-year) GOC Bond Yield - 2007 4.22%<br />
2007 Forecast Yield 4.22%<br />
Less: 2006 Forecast Yield 4.78%<br />
Difference -0.56%<br />
Times 75% Adjustment Factor -0.42%<br />
Plus: 2006 Approved Return on Equity 8.88%<br />
Equals 2007E Approved Return on Equity 8.46%<br />
Note:<br />
(1) Calculated by using the 10-year and 30-year Government of Canada bond yields published daily in<br />
the National Post throughout October of the current year<br />
Source: BMO <strong>Capital</strong> Markets
Page Pipelines/Gas & Electric <strong>Utilities</strong><br />
Table 3: Calculation of the<br />
2007 Actual <strong>ROE</strong> – AEUB<br />
Table 4: Calculation of the<br />
2007 Actual <strong>ROE</strong> – BCUC<br />
Description<br />
Calculated Return on Equity Per Decision 9.60%<br />
Forecast Yield Per Decision 5.68%<br />
November 2006 Consensus Forecast - 3 Months Out 4.10%<br />
November 2006 Consensus Forecast - 3 Months Out 4.20%<br />
Average 4.15%<br />
Average Spread between 10-year and 30-year GOCs 2<br />
0.07%<br />
Forecast Long-Term (30-year) GOC Bond Yield - 2007 4.22%<br />
2007 Forecast Yield 4.22%<br />
Less: 2006 Forecast Yield 5.68%<br />
Difference -1.46%<br />
Times 75% Adjustment Factor -1.10%<br />
Plus: Approved Return on Equity 9.60%<br />
Equals 2007E Approved Return on Equity 8.51%<br />
Note:<br />
(2) Calculated by using the 10-year and 30-year Government of Canada bond yields published daily in<br />
the National Post throughout October of the current year<br />
Source: BMO <strong>Capital</strong> Markets<br />
Description<br />
2006 Calculated Return on Equity 8.80%<br />
November 2006 Consensus Forecast - 3 Months Out 4.10%<br />
November 2006 Consensus Forecast - 3 Months Out 4.20%<br />
Average 4.15%<br />
Average Spread between 10-year and 30-year GOCs 0.07%<br />
Forecast Long-Term (30-year) GOC Bond Yield - 2007 4.22%<br />
Source: BMO <strong>Capital</strong> Markets<br />
Benchmark Return per G-14-06 9.145%<br />
Long-Term (30-year)GOC Bond Yield Decision 5.25%<br />
2007 Forecast Yield 4.22%<br />
Less: Bond Yield from Decision 5.25%<br />
Difference -1.03%<br />
Times 75% Adjustment Factor -0.77%<br />
Plus: Approved Return on Equity Decision 9.145%<br />
Equals 2007E Approved Return on Equity 8.37%
Pipelines/Gas & Electric <strong>Utilities</strong> Page<br />
Table 5: Calculation of the<br />
2007E <strong>ROE</strong> for Enbridge<br />
Gas Distribution – OEB<br />
Description<br />
2006 Calculated Return on Equity 8.74%<br />
2006 Forecast Yield 4.70%<br />
November 2006 Consensus Forecast - 3 Months Out 4.10%<br />
November 2006 Consensus Forecast - 12 Months Out 4.20%<br />
Average 4.15%<br />
Average Spread between 10-year and 30-year GOCs 0.08%<br />
Forecast Long-Term (30-year) GOC Bond Yield - 2006 4.23%<br />
Source: BMO <strong>Capital</strong> Markets<br />
B. Allowed Returns are Confiscatory<br />
2007 Forecast Yield 4.23%<br />
Less: 2006 Forecast Yield 4.70%<br />
Difference -0.47%<br />
Times 75% Adjustment Factor -0.35%<br />
Plus: 2006 Approved Return on Equity 8.74%<br />
Equals 2007E Approved Return on Equity 8.39%<br />
We believe on a collective basis, that the allowed returns as established by the formulas<br />
highlighted above are confiscatory and likely violate the Fair Return Standard. This<br />
standard, as established by Canada’s Supreme Court and accepted by the National Energy<br />
Board in 1971, states that a fair or reasonable rate of return should:<br />
1. be comparable to the return available from the application of the invested capital to<br />
other enterprises of like risk (the comparable earnings standard);<br />
2. enable the financial integrity of the regulated enterprise to be maintained and permit<br />
incremental capital to be attracted to the enterprise on reasonable terms and conditions<br />
(the financial integrity and capital attraction standards); and<br />
3. achieve fairness from the viewpoint of the customers and from the viewpoint of present<br />
and prospective investors (appropriate balance of customer and investor interests).<br />
We believe that regulators have consistently refused to give weight to a number of arguments<br />
that would result in higher allowed returns, solely on the basis that to do so would<br />
result in higher customer rates.<br />
• The North American capital markets are increasingly integrated and investors have the<br />
ability to invest in utility assets north and south of the border.<br />
• There is merit incorporating U.S. market metrics into the analysis and that the Canadian<br />
benchmark equity portfolio (the S&P/TSX) may not meet the theoretical requirement<br />
for a diversified market portfolio.<br />
• The returns on comparable investments with similar risk, whether they be Canadian<br />
or U.S. examples, should be considered.<br />
• The allowed return on equity and deemed equity must satisfy all aspects of the Fair<br />
Return Standard and that no part of the Standard has priority.
Page 6 Pipelines/Gas & Electric <strong>Utilities</strong><br />
• The continued reliance on a derived 30-year government of Canada bond yield may not<br />
be a relevant proxy for the cost of debt (and/or a proxy for the risk free rate) for two<br />
key reasons: (i) the observed and anticipated reduction in the supply of government<br />
of Canada securities and the continued conversation in the financial market that the<br />
government may cease to issue debt securities at the long end of the curve may result in<br />
distortions in the market cost of these securities and thus the observed yields; and (ii)<br />
that corporate debt issuers do not have access to the debt capital market at government<br />
yield levels.<br />
• No pipeline or energy utility in our regulated coverage universe has issued equity in<br />
the last five years to fund, on an unlevered basis, a dollar-for-dollar equity investment<br />
in utility rate base. Continued assertions by regulators that utilities have adequate<br />
access to capital are not credible with respect to the equity component, as access to<br />
equity has not been tested over the ensuing period. For example, On September 16,<br />
2003, Fortis Inc. announced that it planned to acquire the assets of Aquila British<br />
Columbia and Aquila Alberta for $1.36 billion, including assumed debt. The company<br />
financed the transaction by assuming approximately $689 million of utility debt and<br />
issued approximately $170 million of holdco debt, $200 million of holdco preferred<br />
shares and new equity of approximately $350 million. Despite the levered nature of<br />
the transaction and the prospect for above average rate base growth at the two target<br />
utilities, the common shares of Fortis Inc. declined by 5% at the time the transaction<br />
was announced and the transaction was initially widely expected to be dilutive until<br />
2006.<br />
• None of the pipeline projects highlighted in our May 24, 2006, report entitled<br />
“Exchanging Fire”, save and except the Canadian portion of the Southern Access<br />
Pipeline (with an approximate cost of $160 million versus an estimated cost to Enbridge<br />
of projects currently permitted and/or under way of $8 billion), are expected to earn the<br />
National Energy Board multi-pipeline decision return on equity. We note that in many<br />
instances, the market-based tolling arrangements with shippers result in a risk profile<br />
similar to that of the benchmark pipeline, the TransCanada Mainline pipeline.<br />
• Continued investment in utility rate base by the owners of utilities is not an acquiescence<br />
that the allowed return on equity is appropriate and that investment may relate to other<br />
obligations including the utility’s obligation to be the supplier or supply or last resort<br />
and fulfil the obligation to serve, maintain the safe and reliable operation of the utility,<br />
and may be fulfilling specific conditions of its operating licence.<br />
• A failure by utility companies to annually litigate the allowed return on equity “formula”<br />
does not constitute acceptance of the adequacy of the allowed return. Rather, we<br />
believe that the lack of annual litigation reflects the cost of the process, the time required<br />
to pursue litigation that detracts from management’s ability to focus on the efficient<br />
operation of the business and the potential damage to important utility regulatory and<br />
customer relationships.<br />
• The evidenciary standard is too high and almost impossible to meet. Moreover, we<br />
believe that notwithstanding decisions from the Supreme Court that stipulate otherwise,<br />
utility regulators continue to rely heavily on their quasi-judicial and expert status to<br />
impose a bare-bones return on equity and drive down the deemed capital structure of
Pipelines/Gas & Electric <strong>Utilities</strong> Page 7<br />
the utility in order to protect customers from prices, without the fear of reconsideration<br />
upon appeal. Regulators must establish the cost of equity and deemed equity not because<br />
they are experts in this regard, but in order to establish just and reasonable rates. The<br />
regulator is not permitted to consider the effects on customers in the determination<br />
of the allowed <strong>ROE</strong> and capital structure, and we do not believe that the regulator is<br />
permitted to factor in other policy objectives into its determination of the allowed<br />
return on equity; i.e., we do not believe that the regulator is permitted to reduce the<br />
allowed return on equity and/or deemed equity for small utility companies in order<br />
to encourage consolidation or any other specific policy objective. We believe in these<br />
situations, that the inclusion of these other factors in the assessment of cost of equity<br />
and designation of deemed equity, unlawfully transfers value to utility ratepayers from<br />
its legitimate owner, the utility shareholders.<br />
C. Ontario Gets a Reprieve<br />
On November 23, the Ontario Energy Board (OEB) issued a notice to participants regarding<br />
its Multi-year Electricity Distribution Rate Setting Plan, including the Cost of <strong>Capital</strong>,<br />
2nd Generation Incentive Regulation Mechanism and Generic Licence Amendment<br />
Proceeding. The Board indicated that, pursuant to Staff and Panel recommendations,<br />
the Board discontinue its code-based approach (November 17 and November 20, 2006<br />
respectively); that in the interests of achieving a more timely setting of electricity distribution<br />
rates for the 2007 rate year, the Board will instead implement its cost of capital<br />
and 2nd generation incentive regulation policies by means of guidelines. As a result, the<br />
Board discontinued the generic licence amendment proceeding, which was commenced<br />
on the Board’s own motion.<br />
On November 30, the Board issued a Draft Report on the Board on Cost of <strong>Capital</strong> and<br />
2nd Generation Incentive Regulation for Ontario’s Electricity Distributors and Associated<br />
Guidelines. The draft report details the Board’s policies on cost of capital and 2nd generation<br />
incentive regulation, and draws on the work of Board staff and the input of interest<br />
parties since this consultation was initiated in April 2006. Also included are guidelines<br />
to assist parties in understanding how the policies will be implemented and information<br />
for distributors in preparing their rate applications for the 2007 rate year.<br />
The Draft Report contains the following highlights with respect to the cost of equity<br />
capital and deemed capital structure:<br />
• The Board has determined that the current approach to setting <strong>ROE</strong> will be maintained.<br />
The <strong>ROE</strong> will be determined based on the Long Canada Bond Forecast rate plus an<br />
equity risk premium. The Board’s current approach has been in place for six years.<br />
The consultation process undertaken by the Board included a review of one method<br />
that would have required more time and greater costs for its implementation. We also<br />
note that the range of <strong>ROE</strong> produced by this alternative method was unacceptably low;<br />
well below the various rates of return discussed previously. The Board concluded that<br />
none of the approaches reviewed is better than the Board’s current method.<br />
• The Board’s method will continue to include an implicit premium of 50 basis points<br />
(0.5%) for floatation and transaction costs.
Page Pipelines/Gas & Electric <strong>Utilities</strong><br />
• The current method was established in 1999 as part of a review of cost of capital.<br />
The <strong>ROE</strong> calculated at that time is the starting point for the calculation and is 9.35%<br />
(as per Hydro One Network Inc.’s RP-1998-0001 Decision). This formula is <strong>ROE</strong> t =<br />
9.35% + 0.75 (LCBF t – 5.50%). The Long Canada Bond Forecast will use the average<br />
of the January consensus forecast of the 10-year Government of Canada bond yield 3<br />
months ahead and 12 months ahead plus the difference between the observed yields on<br />
the 30-year Government of Canada bond yield and the 10-year Government of Canada<br />
bond yield as published by the Bank of Canada during the month of January (2007).<br />
• No incentive returns for capital investments are appropriate at this time.<br />
• No earnings sharing mechanisms are appropriate for second generation incentive rate<br />
making.<br />
• The Board will include an adjustment to rates in 2008, <strong>2009</strong> and 2010 to transition<br />
distributors from their existing capital structures to a single deemed capital structure<br />
of 40% equity and 60% debt:<br />
o For distributors starting at equity of 35%, the equity component will move in equal<br />
increments over two years until it reaches 40%.<br />
o For distributors starting at equity of 45%, the equity component will move in equal<br />
increments over two years until it reaches 40%; and<br />
o For distributors starting at equity of 50%, the equity component will move in equal<br />
increments over three years until it reaches 40%.<br />
We believe that the following points are relevant about the draft guidelines:<br />
• The current formula is not expected to result in a return on equity that is materially<br />
higher than the formulas previously discussed. We reiterate that the existing formulas<br />
result in an allowed return on equity that likely violates the Fair Return Standard and<br />
we believe them to be confiscatory.<br />
• We are not convinced that a “one-size fits all” capital structure is appropriate and we<br />
are concerned that the Board’s policy objectives of regulatory efficiency and LDC<br />
consolidation are driving force behind the single deemed capital structure approach.<br />
This may not be appropriate.<br />
• We are not disappointed by the Board’s decision to abandon the Licence Amendment<br />
proceeding and the rejection of the alternative approach to determining the return on<br />
equity. This latter item was seriously flawed and had no basis in reality. We set out our<br />
views on this approach in comments/reports dated June 27, August 8 and September<br />
7, 2006.
Pipelines/Gas & Electric <strong>Utilities</strong> Page<br />
D. Comparable Equity Securities<br />
Canadian Gas <strong>Utilities</strong><br />
2006 2007<br />
TSX Price (C$) Shares Market Earnings per Share<br />
P/E Ratios<br />
Dividend 12-Month Total<br />
Company Ticker 5-Dec-06 O/S (mm) Cap. (mm) 2004A 2005A 2006E 2007E 2004A 2005A 2006E 2007E Rate Yield Target Return Rating<br />
Duke Energy Corp. 2<br />
DUK 5<br />
$32.69 1089.6 $35,618 $1.32 $1.73 $1.78 $1.95 16.8 16.1 18.3 16.8 $1.28 3.9% $32.00 1.8% Market Perform<br />
Enbridge Inc. ENB 40.55 339.7 13,775 1.56 1.56 1.76 1.81 16.7 21.8 23.0 22.4 1.20 3.0% 40.00 1.6% Market Perform<br />
Enbridge Income Fund ENF.UN 12.00 34.6 416 0.30 0.44 0.54 0.55 40.4 30.8 22.2 21.8 0.96 8.0% 11.50 3.8% Market Perform<br />
Fort Chicago Energy Partners L.P. FCE.UN 10.75 133.7 1,437 0.74 0.59 0.64 0.47 14.1 20.9 16.8 22.9 0.93 8.7% 11.00 11.0% Outperform<br />
Gaz Métro 4<br />
GZM.UN 15.80 117.5 1,857 1.40 1.30 1.25 1.25 15.4 16.7 12.6 12.7 1.24 7.8% 16.50 12.3% Market Perform<br />
Inter Pipeline Fund IPL.UN 8.39 199.5 1,674 0.46 0.48 0.67 0.48 17.6 20.1 12.5 17.5 0.84 10.0% 8.50 11.3% Outperform<br />
Pacific Northern Gas Ltd. PNG 18.50 3.6 67 1.38 1.72 1.04 1.52 14.3 11.4 17.8 12.2 0.80 4.3% 20.00 12.4% Outperform<br />
Pembina Pipeline Income Fund PIF.UN 15.60 121.9 1,902 0.53 0.65 0.81 0.84 23.5 22.0 19.3 18.6 1.32 8.4% 15.00 4.6% Market Perform<br />
TransCanada Corp. TRP 39.38 487.7 19,206 1.55 1.70 1.86 1.89 17.9 19.1 21.2 20.8 1.33 3.4% 38.50 1.1% Market Perform<br />
Group Average (Excl. ENF, FCE, GZM, IPL and PIF) 16.4 17.1 20.1 18.1 3.6% 4.2%<br />
Canadian Electric <strong>Utilities</strong><br />
TSX Price (C$) Shares Market Earnings per Share<br />
P/E Ratios<br />
Dividend 12-Month Total<br />
Company Ticker 5-Dec-06 O/S (mm) Cap. (mm) 2004A 2005A 2006E 2007E 2004A 2005A 2006E 2007E Rate Yield Target Return Rating<br />
2, 3<br />
Caribbean <strong>Utilities</strong> Co. Ltd. CUP.U $12.44 25.2 $314 $0.77 $0.13 $0.87 $0.87 16.1 NMF 14.3 14.4 $0.66 5.3% $13.00 9.8% Outperform<br />
Emera Inc. EMA 22.91 110.4 2,528 1.16 1.04 1.15 1.14 15.7 18.2 19.9 20.1 0.89 3.9% 22.00 -0.1% Market Perform<br />
Fortis Inc. FTS 28.80 103.4 2,979 0.99 1.10 1.28 1.39 15.6 18.6 22.5 20.7 0.78 2.7% 29.25 4.3% Market Perform<br />
Group Average 15.8 18.4 18.9 18.4 4.0% 4.7%<br />
Canadian Multi-<strong>Utilities</strong><br />
TSX Price (C$) Shares Market Earnings per Share<br />
P/E Ratios<br />
Dividend 12-Month Total<br />
Company Ticker 5-Dec-06 O/S (mm) Cap. (mm) 2004A 2005A 2006E 2007E 2004A 2005A 2006E 2007E Rate Yield Target Return Rating<br />
ACO/X $48.73 51.8 $2,525 $2.17 $2.46 $3.13 $2.77 11.7 14.4 15.6 17.6 $0.82 1.7% NA NA NR<br />
ATCO Ltd. 1<br />
ATP.UN 10.00 46.4 464 (0.57) (0.01) 0.02 0.23 NMF 13.2 16.6 14.0 1.06 10.6% $10.00 10.6% Market Perform<br />
Atlantic Power Corporation 6<br />
Boralex Power Income Fund BPT.UN 8.55 59.1 505 0.50 0.50 0.55 0.50 21.1 21.5 15.6 17.1 0.90 10.5% 9.00 15.8% Market Perform<br />
Calpine Power Income Fund CF.UN 10.89 61.7 672 0.81 0.76 R R 13.5 13.3 R R R R R R Restricted<br />
Cdn Hydro Developers, Inc. KHD 5.80 120.5 699 0.06 0.00 0.06 0.07 44.4 NMF 99.1 86.6 0.00 0.0% 5.60 -3.4% Market Perform<br />
Canadian <strong>Utilities</strong> Ltd. CU 46.19 126.6 5,849 1.98 2.03 2.59 2.57 14.4 17.4 17.8 18.0 1.20 2.6% 42.00 -6.5% Market Perform<br />
Creststreet Power & Income Fund LP CRS.UN 4.40 11.5 51 (0.54) (0.00) 0.02 NMF NMF NMF 0.65 14.8% 4.25 11.4% Underperform<br />
EPCOR Power, L.P. EP.UN 24.84 48.4 1,203 2.25 1.83 1.81 1.27 15.1 19.2 13.7 19.5 2.52 10.1% 25.50 12.8% Market Perform<br />
Great Lakes Hydro Income Fund GLH.UN 18.75 48.3 905 1.03 0.75 1.08 1.03 16.5 25.0 17.3 18.2 1.25 6.7% 16.25 -6.7% Underperform<br />
Innergex Power Income Fund IEF.UN 12.03 24.7 297 0.46 0.46 0.54 0.47 25.5 28.5 22.4 25.6 0.98 8.1% 11.50 3.7% Market Perform<br />
Northland Power Income Fund NPI.UN 12.20 62.1 757 0.57 0.91 0.61 0.73 21.5 13.4 20.0 16.7 1.08 8.9% 13.00 15.4% Outperform<br />
Maxim Power Corp. 1<br />
MXG 6.80 43.9 299 0.50 0.30 0.21 0.24 7.6 24.3 32.4 28.3 0.00 0.0% NA NA NR<br />
TransAlta Corp. TA 25.61 200.6 5,137 0.62 0.88 1.01 1.20 27.6 24.1 25.3 21.3 1.00 3.9% 22.00 -10.2% Underperform<br />
TransAlta Power L.P. TPW.UN 7.10 75.1 533 0.48 (0.04) 0.49 0.37 19.8 NMF 14.4 19.0 0.80 11.2% 6.50 2.7% Underperform<br />
Group Average (Excl. KHD, MXG, IPS, LPs and Income Trusts) 17.9 18.6 19.6 19.0 2.7% -8.3%<br />
Notes:<br />
NA = Not Applicable, NMF = Not Meaningful, NR = Not Rated<br />
1 Estimates from First Call<br />
2 All figures in U.S. Dollars<br />
3 Caribbean <strong>Utilities</strong>’ year-end is April 30<br />
4 Gaz Metro’s year-end is Sept. 30<br />
5 Ticker on the New York Stock Exchange<br />
6 Represents Income Participating Securities (IPS). Share price, Market Cap and Dividend in C$; all else in US$.<br />
Source: BMO <strong>Capital</strong> Markets
Page 10 Pipelines/Gas & Electric <strong>Utilities</strong><br />
Analyst’s Certification<br />
I, Karen Taylor, CFA, hereby certify that the views expressed in this report accurately reflect my personal views about the subject<br />
securities or issuers. I also certify that no part of my compensation was, is, or will be, directly or indirectly, related to the specific recommendations<br />
or views expressed in this report.<br />
I, Michael McGowan, CA, CFA, hereby certify that the views expressed in this report accurately reflect my personal views about the<br />
subject securities or issuers. I also certify that no part of my compensation was, is, or will be, directly or indirectly, related to the specific<br />
recommendations or views expressed in this report.<br />
General Disclosure<br />
The information and opinions in this report were prepared by BMO Nesbitt Burns Inc. and BMO Nesbitt Burns Ltée./Ltd., collectively<br />
(“BMO NB”). BMO NB is not subject to U.S. rules with regard to the preparation of research reports and the independence of analysts.<br />
“BMO <strong>Capital</strong> Markets” is a trade name used by the BMO Investment Banking Group, which includes the wholesale/institutional<br />
arms of Bank of Montreal and BMO NB in Canada, and BMO <strong>Capital</strong> Markets Corp. in the U.S. BMO <strong>Capital</strong> Markets Corp. is<br />
an affiliate of BMO NB. BMO NB and BMO <strong>Capital</strong> Markets Corp. are subsidiaries of Bank of Montreal. Bank of Montreal or its<br />
affiliates (“BMO Financial Group”) has lending arrangements with, or provide other remunerated services to, many issuers covered by<br />
BMO NB research. A significant lending relationship may exist between BMO Financial Group and certain of the issuers mentioned<br />
herein. The reader should assume that BMO NB, BMO <strong>Capital</strong> Markets Corp., Bank of Montreal or their affiliates may have a conflict<br />
of interest and should not rely solely on this report in evaluating whether or not to buy or sell securities of issuers discussed herein.<br />
The opinions, estimates and projections contained in this report are those of BMO NB as of the date of this report and are subject to<br />
change without notice. BMO NB endeavours to ensure that the contents have been compiled or derived from sources that we believe<br />
are reliable and contain information and opinions that are accurate and complete. However, BMO NB makes no representation or<br />
warranty, express or implied, in respect thereof, takes no responsibility for any errors and omissions contained herein and accepts no<br />
liability whatsoever for any loss arising from any use of, or reliance on, this report or its contents. Information may be available to BMO<br />
NB or its affiliates that is not reflected in this report. The information in this report is not intended to be used as the primary basis of<br />
investment decisions, and because of individual client objectives, should not be construed as advice designed to meet the particular<br />
investment needs of any investor. This material is for information purposes only and is not an offer to sell or the solicitation of an<br />
offer to buy any security. The research analyst and/or associates who prepared this report are compensated based upon (among other<br />
factors) the overall profitability of BMO NB and its affiliates, which includes the overall profitability of investment banking services.<br />
BMO NB, or its affiliates expect to receive or will seek compensation for investment banking services within the next 3 months from<br />
all issuers covered by BMO NB. BMO NB or its affiliates will buy from or sell to customers the securities of issuers mentioned in this<br />
report on a principal basis. BMO NB or its affiliates, officers, directors or employees may have a long or short position in the securities<br />
discussed herein, related securities or in options, futures or other derivative instruments based thereon.<br />
Company Specific Disclosures<br />
Atlantic Power Corp. (ATP.UN-TSX) 2, 3, 7, 9, 10AC Fort Chicago Energy L.P. (FCE.UN-TSX) 9, 10C<br />
Boralex Power Income Fund (BPT.UN-TSX) 11 Fortis Inc. (FTS-TSX) 2, 3, 7, 9, 10AC<br />
Calpine Power Income Fund (CF.UN-TSX) 1, 3, 7, 10A Gaz Metro Limited Partnership (GZM.UN-TSX) 1, 2, 3, 7, 9, 10AC<br />
Canadian Hydro Developers Inc. (KHD-TSX) 2, 3, 7, 10A Great Lakes Hydro Income Fund (GLH.UN-TSX)<br />
Canadian <strong>Utilities</strong> (CU-TSX) 2, 3, 7, 9, 10AC, 11, 12 Innergex Power Income Fund (IEF.UN-TSX) 9, 10C<br />
Caribbean <strong>Utilities</strong> Co. Ltd. (CUP.U-TSX) 5, 7, 9, 10AB Inter Pipeline Fund (IPL.UN-TSX) 2, 3, 7, 9, 10AC<br />
Countryside Power Income Fund (COU.UN-TSX) Macquarie Power Income Fund (MPT.UN-TSX)<br />
Creststreet Power & Inc. Fund (CRS.UN-TSX) 2, 3, 7, 10A Northland Power Income Fund (NPI.UN-TSX) 2, 3, 7, 9, 10AC<br />
Duke Energy Corp. (DUK-NYSE) 2, 3, 7, 9, 10AC Pacific Northern Gas (PNG-TSX)<br />
Emera Inc. (EMA-TSX) 9, 10C Pembina Pipeline Income Fund (PIF.UN-TSX) 9, 10C<br />
Enbridge Inc. (ENB-TSX; ENB-NYSE) 2, 3, 4, 7, 9, 10AC TransAlta Corporation (TA-TSX; TAC-NYSE) 2, 3, 4, 5, 7, 9, 10AC, 11, 12<br />
Enbridge Income Fund (ENF.UN-TSX) TransAlta Power L.P. (TPW.UN-TSX) 9, 10C<br />
EPCOR Power, L.P. (EP.UN-TSX) 2, 3, 7, 9, 10AC TransCanada Corporation (TRP-TSX; TRP-NYSE) 2, 3, 5, 7, 9, 10AC, 12
Pipelines/Gas & Electric <strong>Utilities</strong> Page 11<br />
Disclosure Key<br />
BMO NB uses the following Company Specific Disclosure Key. Please refer to the Company Specific Disclosure section above for<br />
specific disclosures applicable to issuers discussed in this report:<br />
1 - BMO NB has provided advice for a fee with respect to this issuer within the past 12 months.<br />
2 - BMO NB has undertaken an underwriting liability with respect to this issuer within the past 12 months.<br />
3 - BMO NB has provided investment banking services with respect to this issuer within the past 12 months.<br />
4 - BMO NB, BMO <strong>Capital</strong> Markets Corp. or an affiliate beneficially owns 1% or more of any class of the equity securities of this<br />
issuer.<br />
5 - BMO NB, BMO <strong>Capital</strong> Markets Corp. or an affiliate makes a market in this security.<br />
6 - BMO <strong>Capital</strong> Markets Corp. or an affiliate has managed or co-managed a public offering of securities with respect to this issuer<br />
within the past 12 months.<br />
7 - BMO <strong>Capital</strong> Markets Corp. or an affiliate has received compensation for investment banking services from this issuer within<br />
the past 12 months.<br />
8 - BMO <strong>Capital</strong> Markets Corp. or an affiliate or its officers or partners own options, rights, or warrants to purchase any securities<br />
of this issuer.<br />
9 - BMO <strong>Capital</strong> Markets Corp. or an affiliate received compensation for products or services other than investment banking<br />
services within the past 12 months.<br />
10A - This issuer is a client (or was a client) of BMO NB, BMO <strong>Capital</strong> Markets Corp. or an affiliate within the past 12 months:<br />
Investment Banking Services<br />
10B - This issuer is a client (or was a client) of BMO NB, BMO <strong>Capital</strong> Markets Corp. or an affiliate within the past 12 months: Non-<br />
Investment Banking Securities Related Services<br />
10C - This issuer is a client (or was a client) of BMO NB, BMO <strong>Capital</strong> Markets Corp.or an affiliate within the past 12 months: Non-<br />
Securities Related Services<br />
11 - An employee, officer, or director of BMO NB is a member of the Board of Directors or an advisor or officer of this issuer.<br />
12 - A member of the Board of Directors of Bank of Montreal is also a member of the Board of Directors or is an officer of this<br />
issuer.<br />
13 - A household member of the research analyst and/or associates who prepared this research report is a member of the Board of<br />
Directors or is an advisor or officer of this issuer.<br />
14 - The research analysts and/or associates (or their household members) who prepared this research report directly or beneficially<br />
own securities of this issuer: None<br />
Distribution of Ratings<br />
Rating BMO BMO BMO First Call<br />
Category Rating Universe I.B. Clients* Universe**<br />
Buy Outperform 35% 45% 47%<br />
Hold Market Perform 55% 48% 46%<br />
Sell Underperform 10% 7% 7%<br />
* Reflects rating distribution of all companies where BMO <strong>Capital</strong> Markets has received compensation for Investment Banking<br />
services.<br />
** Reflects rating distribution of all North American equity research analysts.
Page 12 Pipelines/Gas & Electric <strong>Utilities</strong><br />
Ratings Key<br />
We use the following ratings system definitions:<br />
OP = Outperform - Forecast to outperform the market;<br />
Mkt = Market Perform - Forecast to perform roughly in line with the market;<br />
Und = Underperform - Forecast to underperform the market;<br />
(S) = speculative investment;<br />
NR = No rating at this time;<br />
R = Restricted – Dissemination of research is currently restricted.<br />
Market performance is measured by a benchmark index such as the S&P/TSX Composite Index, S&P 500, Nasdaq Composite, as appropriate<br />
for each company. Prior to September 1, 2003, a fourth rating tier—Top Pick—was used to designate those stocks we felt would be the best<br />
performers relative to the market. Our six Top 15 lists which guide investors to our best ideas according to six different objectives (large,<br />
small, growth, value, income and quantitative) have replaced the Top Pick rating.<br />
Dissemination of Research<br />
Our research publications are available via our web site http://bmocapitalmarkets.com. Institutional clients may also receive our research<br />
via FIRST CALL Research Direct and Reuters. All of our research is made widely available at the same time to all BMO NB, BMO <strong>Capital</strong><br />
Markets Corp. and BMO Nesbitt Burns Securities Ltd. client groups entitled to our research. Please contact your investment advisor or institutional<br />
salesperson for more information.<br />
Additional Matters<br />
TO U.S. RESIDENTS: BMO <strong>Capital</strong> Markets Corp. and/or BMO Nesbitt Burns Securities Ltd., affiliates of BMO NB, furnish this report<br />
to U.S. residents and accept responsibility for the contents herein, except to the extent that it refers to securities of Bank of Montreal. Any<br />
U.S. person wishing to effect transactions in any security discussed herein should do so through BMO <strong>Capital</strong> Markets Corp. and/or BMO<br />
Nesbitt Burns Securities Ltd.<br />
TO U.K. RESIDENTS: The contents hereof are intended solely for the use of, and may only be issued or passed onto, persons described in<br />
part VI of the Financial Services and Markets Act 2000 (Financial Promotion) Order 2001.<br />
BMO Nesbitt Burns Inc. and BMO Nesbitt Burns Ltée/Ltd. are Members of CIPF. BMO <strong>Capital</strong> Markets Corp. and BMO Nesbitt Burns<br />
Securities Ltd. are Members of SIPC.<br />
“BMO <strong>Capital</strong> Markets” is a trade-mark of Bank of Montreal, used under licence.<br />
“BMO (M-Bar roundel symbol)” is a registered trade-mark of Bank of Montreal, used under licence.<br />
R36881
A COMPARATIVE ANALYSIS OF RETURN ON EQUITY OF<br />
NATURAL GAS UTILITIES<br />
Prepared for:<br />
The Ontario Energy Board<br />
June 14, 2007<br />
313 Boston Post Road West, Suite 210<br />
Marlborough, MA 01752<br />
508.263.6200 • 508.303.3290 fax<br />
www.ceadvisors.com
TABLE OF CONTENTS<br />
I. INTRODUCTION .................................................................................................. 1<br />
II. EXECUTIVE SUMMARY ........................................................................................2<br />
III. <strong>ROE</strong> BACKGROUND ............................................................................................5<br />
IV. COMPARISON OF <strong>ROE</strong> METHODOLOGIES AND AWARDS................................... 10<br />
V. COMPETITION FOR CAPITAL IN CANADA VERSUS THE U.S. .............................. 44<br />
VI. COMPETITION FOR CAPITAL FOR STAND-ALONE COMPANIES VERSUS<br />
SUBSIDIARIES .................................................................................................... 54<br />
VII. CONCLUSIONS AND SUMMARY OF FINDINGS..................................................... 56<br />
VIII. LIST OF APPENDICES......................................................................................... 59<br />
IX. LIST OF EXHIBITS ............................................................................................. 59<br />
APPENDICES<br />
A. LISTING OF INDIVIDUALS INTERVIEWED .......................................................... 60<br />
B. LISTING OF DATA SOURCES AND DOCUMENTS CONSIDERED ............................. 61<br />
C. DISCUSSION OF SIGNIFICANT <strong>ROE</strong>-RELATED DECISIONS IN CANADA AND<br />
THE U.S............................................................................................................. 66<br />
Disclaimer:<br />
The views expressed in this report are those of Concentric Energy Advisors and do not<br />
necessarily represent the views of, and should not be attributed to, the Ontario Energy<br />
Board, any individual Board Member, or Board staff.<br />
Page i
I. INTRODUCTION<br />
The Ontario Energy Board (the “Board” or “OEB”) retained Concentric Energy Advisors<br />
(“CEA”) pursuant to Request for Proposal (“RFP”) RFPOEBRPD2007-0227, “A Review of<br />
the Return on Equity of Gas <strong>Utilities</strong> in Ontario”. The Board indicated in the RFP that it<br />
was interested in investigating statements from natural gas utilities that the Return on Equity<br />
(“<strong>ROE</strong>”) awards in Ontario are lower than those of surrounding jurisdictions. To perform<br />
this investigation, the Board has requested a report that provides a comparison of awarded<br />
<strong>ROE</strong>s in other jurisdictions to those awarded in Ontario, including an analysis of the forces<br />
that contribute to those differences. Specifically, the OEB requested a written report that:<br />
(1) Compares recent <strong>ROE</strong> awards in jurisdictions outside of Ontario to those<br />
awarded by the Board for natural gas utilities in the Province;<br />
(2) Provides a review and analysis of whether Canadian utilities compete for<br />
capital on the same basis as utilities in the U.S.; and<br />
(3) Addresses whether stand-alone companies compete for capital on the same<br />
basis as subsidiaries of larger holding companies.<br />
This report provides CEA’s analysis and findings related to these topics. Throughout the<br />
analysis, the focus is on similarities and differences between Canadian and U.S. companies,<br />
as Canada and the U.S. are generally considered to be highly comparable from a business<br />
standpoint and have fairly integrated economies. To provide additional perspective, CEA<br />
has also conducted a limited survey of <strong>ROE</strong> awards and methodologies for gas utilities in the<br />
U.K., Australia, and the Netherlands.<br />
CEA’s research for this report is based on publicly available data, supplemented by<br />
interviews with knowledgeable sources regarding specific features of Ontario’s gas utility<br />
regulation. The report is not intended to be a comprehensive examination of the <strong>ROE</strong> for<br />
any specific company, but rather an overall examination of the major factors contributing to<br />
differences between <strong>ROE</strong> awards in Ontario and those in other jurisdictions.<br />
Page 1
II. EXECUTIVE SUMMARY<br />
A gap between allowed <strong>ROE</strong>s for Ontario gas distribution companies and U.S. gas utilities<br />
has developed over the last ten years, coincident with the implementation of the Board’s<br />
“Draft Guidelines on a Formula-Based Return on Common Equity for Regulated <strong>Utilities</strong>”<br />
in 1997. The current <strong>ROE</strong> differential between Canada and the U.S. is in the range of 1.50<br />
percent to 2.00 percent (i.e., 150 to 200 basis points). The purpose of this report is to<br />
examine the factors leading to this difference in allowed returns.<br />
To begin, CEA examines the historical, pre-1997 relationship between allowed <strong>ROE</strong>s in<br />
Ontario and those found in the U.S. This comparison suggests that <strong>ROE</strong>s were in<br />
approximate parity in 1997. Thereafter, a widening gap has developed placing Ontario<br />
<strong>ROE</strong>s below those in the U.S. CEA’s analysis points to interest rate trends combined with<br />
differing <strong>ROE</strong> methodologies as the principal factors underlying this development. The<br />
relative decrease in allowed returns in Canada is directly related to the past ten-year decline<br />
in interest rates, and all else remaining equal, can be expected to narrow or reverse itself in a<br />
period of rising interest rates.<br />
Beyond the important interest rate determinant, this report looks to the companies<br />
themselves, as well as the jurisdictions and countries in which they operate, to determine<br />
whether there are any fundamental differences between Ontario gas utilities and those in the<br />
U.S. that would further explain <strong>ROE</strong> differences. While the specific characteristics of<br />
individual gas utilities and their respective regulatory environments can lead to differences in<br />
allowed returns, there are no apparent fundamental differences between gas utilities in<br />
Ontario and those of the U.S. that would cause the sizable gap in <strong>ROE</strong>s. In other words,<br />
taken as a whole, U.S. gas utilities are not demonstrably riskier than Canadian gas utilities.<br />
CEA also extends the analysis beyond Canada and the U.S., to determine whether other<br />
countries, specifically the U.K., Australia, and the Netherlands, might form an adequate basis<br />
of comparison and thus allow for a larger population of comparable companies. While the<br />
gas markets in these countries bear certain resemblances to those of Canada and the U.S.,<br />
there are a few substantial differences that weaken the comparison. Thus, allowed returns in<br />
Page 2
these countries are not considered adequate benchmarks against which to examine <strong>ROE</strong>s in<br />
Ontario.<br />
As a result of the interplay between the Canadian and U.S. markets, Canadian utilities<br />
compete for capital essentially on the same basis as utilities in the U.S. In the current market<br />
environment, no fundamental differences were identified that would indicate a significant<br />
difference in investor required returns between the two markets. <strong>Capital</strong> flows efficiently<br />
between these two markets, and over the long-term, equity investors earn nearly identical<br />
returns. On the issue of subsidiaries competing for capital we find that subsidiaries of larger<br />
holding companies ultimately compete for capital much like stand alone companies, as they<br />
must compete among their affiliates for parental investment. Nonetheless, the parental<br />
obligation to invest necessary capital to maintain system integrity will typically provide the<br />
wholly owned subsidiary sufficient capital to sustain operations, where no such provision<br />
exists for stand alone utilities. Over time, however, the equity returns must ultimately<br />
reward the parent or investor at the same rate as a similar investment of comparable risk.<br />
This “comparability standard” is a guiding principle in both Canadian and U.S. utility<br />
regulation.<br />
It is important to note that this report does not attempt to estimate the “correct” <strong>ROE</strong> for<br />
the Ontario gas distributors, nor does it discuss which <strong>ROE</strong> calculation methodology or<br />
rate-setting approach is most appropriate for the Province. Lastly, no suggestions regarding<br />
future policy are proposed. Rather, this report quantifies the differences in existing allowed<br />
<strong>ROE</strong>s between jurisdictions and countries, and discusses the factors that most likely explain<br />
the disparity.<br />
The information provided in this report is based on independent research and analysis of<br />
publicly available information, but is also guided by interviews with, and documentation<br />
provided by, key market participants and regulatory agencies, including the OEB, the<br />
National Energy Board (“NEB”), representatives from Union Gas (“Union”), Enbridge Gas<br />
Distribution (“Enbridge”), and other Canadian gas distributors, the Canadian Gas<br />
Page 3
Association (“CGA”), an industry analyst, and individuals who have represented customer<br />
groups and other interested parties in prior <strong>ROE</strong> proceedings.<br />
Remainder of the Report<br />
The remainder of this report is made up of five sections. Section III provides background<br />
on the theory and practice of <strong>ROE</strong>, including the applicable precedent and approaches used<br />
by various regulatory boards in Canada, the U.S., and the other countries studied. Section<br />
IV contains a discussion of <strong>ROE</strong> methodologies and a comparison of awards across<br />
different jurisdictions, as well as an assessment of risk factors for the companies in the<br />
sample population, and a discussion of what significant differences exist between gas<br />
distributors in Ontario and those in other jurisdictions. Section V presents a discussion of<br />
competition for capital in Canada versus the U.S., and in Section VI we provide a<br />
comparable assessment of stand-alone versus subsidiary companies. Section VII contains<br />
our overall conclusions.<br />
Page 4
III. <strong>ROE</strong> BACKGROUND<br />
The setting of <strong>ROE</strong>, as a component of the rate of return on rate base for a regulated entity<br />
such as a natural gas distributor, meets three essential objectives: (1) to provide a return<br />
consistent with other businesses having similar or comparable risks; (2) to be adequate to<br />
support credit quality and access to capital; and (3) to balance investor and consumer<br />
interests. A return that is adequate to attract equity capital at reasonable terms enables the<br />
utility to provide safe, reliable service while maintaining its financial integrity and providing<br />
just and reasonable rates. The <strong>ROE</strong> should be commensurate with the risks incurred by<br />
investors and comparable to the returns available elsewhere in the market for investments of<br />
equivalent risk. If a utility is allowed to earn its fair and reasonable <strong>ROE</strong>, both ratepayers<br />
and investors should benefit.<br />
<strong>ROE</strong> Precedent:<br />
The Supreme Court of Canada set out the fundamental requirements that a fair and<br />
reasonable return on capital should be met in its decision re.: Northwestern <strong>Utilities</strong> vs. City of<br />
Edmonton, 1929. As stated by Mr. Justice Lamont in that case:<br />
The duty of the Board was to fix fair and reasonable rates; rates which, under<br />
the circumstances, would be fair to the consumer on the one hand, and<br />
which, on the other hand, would secure to the company a fair return for the<br />
capital invested. By a fair return is meant that the company will be allowed<br />
as large a return on the capital invested in its enterprise (which will be net to<br />
the company) as it would receive if it were investing the same amount in<br />
other securities possessing an attractiveness, stability and certainty equal to<br />
that of the company’s enterprise…. 1<br />
The NEB has further summarized its view that the fair return standard can be met by<br />
fulfilling three particular requirements. Specifically, a fair or reasonable return on capital<br />
should:<br />
• Be comparable to the return available from the application of the invested<br />
capital to other enterprises of like risk (the comparable investment standard);<br />
• Enable the financial integrity of the regulated enterprise to be maintained<br />
(the financial integrity standard); and<br />
1 Northwestern <strong>Utilities</strong> v. City of Edmonton [1929] S.C.R. 186 (NUL 1929).<br />
Page 5
• Permit incremental capital to be attracted to the enterprise on reasonable<br />
terms and conditions (the capital attraction standard). 2<br />
For a more detailed discussion of significant <strong>ROE</strong>-related decisions in Canada and the U.S.,<br />
please see Appendix C to this report.<br />
In Canada, the NEB regulates interprovincial and international pipelines, and thus<br />
determines the allowed <strong>ROE</strong>s for pipeline companies. Regulatory boards at the provincial<br />
level, such as the OEB, regulate Canadian local distribution companies (“LDCs”). Similarly,<br />
in the U.S., the Federal Energy Regulatory Commission (“FERC”) regulates energy-related<br />
interstate commerce, while state boards are responsible, for the most part, for the regulation<br />
of U.S. LDCs.<br />
Over the past decade, the formulas used to determine <strong>ROE</strong> awards by the NEB and the<br />
Canadian provinces (including Ontario) have largely utilized the “risk premium” method.<br />
The basic mechanism involves summing the forecasted yield for the long Government of<br />
Canada bond (30-year) for the test year with an equity risk premium. Subsequent<br />
adjustments to the <strong>ROE</strong> are based upon the application of an adjustment factor (e.g., 75<br />
percent) to the year-over-year change in the long-term forecasted bond yield. This<br />
adjustment is added to/subtracted from the previous year’s rate of return, to obtain the<br />
current year’s <strong>ROE</strong>. The long-term bond yield forecast is determined by taking the average<br />
of the three month and twelve month 10-year Canadian Bond forecasts plus a historical yield<br />
spread between the ten-year and thirty-year bonds.<br />
By contrast, <strong>ROE</strong>s in the U.S. are more typically determined through rate proceedings in<br />
which a variety of analytical techniques, including the Discounted Cash Flow (“DCF”)<br />
Model (single and multi-stage), the <strong>Capital</strong> Asset Pricing Model (“CAPM”), risk premium,<br />
and comparable earnings analyses, are presented. The state utility commission or FERC (for<br />
cases involving interstate commerce) ultimately decides the <strong>ROE</strong> of the subject utility based<br />
upon the evidence in the proceeding.<br />
2 Reasons for Decision, TransCanada PipeLines Limited, RH-2-2004, Phase II, April 2005, Cost of <strong>Capital</strong>.<br />
Page 6
While this report focuses on companies in Canada and the U.S., for further comparison it<br />
also provides a high level review of the methodologies for setting returns and the resulting<br />
<strong>ROE</strong>s in the U.K., Australia, and the Netherlands.<br />
U.K.<br />
In the U.K., the Office of Gas and Electricity Markets (“Ofgem”) has adopted a price<br />
control, or “price cap”, method for regulation of gas distributors. An alternative approach<br />
to rate-of-return regulation, the price-cap methodology allows for price increases owing to<br />
inflation, but also accounts for increases in productivity by the utilities, and shares those<br />
benefits with ratepayers. Under the price control, the Ofgem, the U.K.’s regulatory body,<br />
sets the initial base price of the utilities assets for a five year period. Price caps and related<br />
mechanisms are also utilized selectively in U.S. jurisdictions and in Canadian provinces.<br />
One aspect of calculating the initial price level in the U.K. is to determine the cost of capital<br />
for the utilities. In 2000/2001, Ofgem set the cost of capital (utilizing the CAPM method to<br />
calculate the equity return component of the cost of capital) for the only gas distribution<br />
company existing as of that date (National Grid). National Grid has since divested four of<br />
its eight distribution networks, but the price controls have been maintained for the new<br />
owners. The 2000/2001 price control was to be in place from 2001 to 2006, but was<br />
recently extended through 2008. The <strong>ROE</strong>s for the U.K. gas distributors are provided in<br />
Table 4 of this report.<br />
Australia<br />
In Australia, the local gas distribution networks are regulated by each state’s applicable<br />
regulatory commission. Most Australian states surveyed operate in a restructured gas<br />
market, in which the regulator has committed to retail competition and has unbundled<br />
(segregated) the utility’s distribution function from the natural gas supply function. Similar<br />
to Ontario, utilities in these jurisdictions must compete with gas marketers for retail<br />
customers, and are often ‘providers of last resort’. Gas distribution companies are subject to<br />
Page 7
price caps, with an annual adjustment for changes in inflation and productivity. For most<br />
jurisdictions the prices are reviewed every five years.<br />
In Australia, the CAPM is heavily relied upon when setting the <strong>ROE</strong> component of the cost<br />
of capital. While in most instances the regulatory commissions focus on the overall cost of<br />
capital (as opposed to separately reporting the debt and equity returns, along with the capital<br />
structure), it is possible to apply the CAPM to calculate the implicit <strong>ROE</strong> utilizing the given<br />
parameters, as provided in Table 4.<br />
Netherlands<br />
In the Netherlands, there are 12 regional gas network companies, the vast majority of which<br />
are owned by municipalities. Gas distribution companies’ rates are subject to price caps,<br />
with annual adjustments for inflation and changes in productivity. The Netherlands employs<br />
a “yardstick regime”, whereby each company’s rates for an upcoming period are dependent<br />
on overall industry averages for items such as costs and quality of service. The most recent<br />
price cap period in the Netherlands was for the period 2005 through 2007. The Netherlands<br />
Competition Authority (“NCA”) released a report in December 2005 detailing the NCA’s<br />
proposed methodology for setting the cost of capital for the next price cap period. In that<br />
report, the NCA stated, “the price cap to promote operational efficiency has the aim,<br />
amongst others, of ensuring that network managers in any event cannot obtain a return<br />
which is higher than that which is usual within the economy and ensuring that equivalent<br />
efficiency is promoted amongst network managers.” 3<br />
In the Netherlands, the <strong>ROE</strong> component of the allowed cost of capital, as proposed by the<br />
NCA, is determined using the CAPM methodology. In its report, the NCA suggested a<br />
range of values for the various inputs of the CAPM, including an equity risk premium of<br />
between 4.0 percent and 6.0 percent, a Beta of between 0.47 and 0.74, and a risk-free rate of<br />
3.8 percent to 4.3 percent, based on ten-year government bonds. Interestingly, in developing<br />
the Beta estimate, the NCA used a proxy group of comparison companies that included<br />
3 Netherlands Competition Authority, “Consultation Document on the Cost of <strong>Capital</strong> for Regional<br />
Network Managers,” December 2005, at p. 6.<br />
Page 8
Australian, Canadian, Spanish, U.K., and U.S. companies. The resulting range of <strong>ROE</strong>s is<br />
provided in Table 4 to this report.<br />
Page 9
IV. COMPARISON OF <strong>ROE</strong> METHODOLOGIES AND AWARDS<br />
Discussion of <strong>ROE</strong> Methodologies:<br />
Methodological approaches differ in determining <strong>ROE</strong>, but the primary drivers of investor<br />
returns (interest rates and risk) are represented in each alternative methodology. While the<br />
scope of this report does not include an analysis of the merits or appropriateness of each<br />
methodology, it is useful to understand the differing influences of alternative methodologies.<br />
Ideally, alternative methodologies would yield comparable results. However, some methods<br />
are more influenced by certain economic and business specific factors than others. For<br />
example, the DCF approach is the predominant approach for setting <strong>ROE</strong>s in the U.S.<br />
Under this approach, the <strong>ROE</strong> is determined by adding the expected dividend yield to the<br />
long term projected growth in dividends. That formula is the functional equivalent of the<br />
rate of return on equity, which when used to discount the expected cash flows associated<br />
with stock ownership (i.e., the receipt of dividends in perpetuity), yields the current stock<br />
price (typically measured as an average over a reasonable period of time). Under the DCF<br />
approach, therefore, the <strong>ROE</strong> result is a function of annualized dividends, current stock<br />
prices, and anticipated long term growth.<br />
The CAPM is a risk premium approach that specifies the required <strong>ROE</strong> for a given security<br />
as a function of the risk free rate of return, plus a risk premium that represents the non-<br />
diversifiable (sometimes referred to as "systematic") risk of the security. Non-diversifiable<br />
risk represents the variability in returns of a given security due to the combined<br />
macroeconomic forces in the economy. The fundamental notion underlying the CAPM is<br />
that risk adverse investors will require higher returns for assuming additional risk. This non-<br />
diversifiable risk is measured in terms of a company’s Beta, or the covariance of the subject<br />
company’s return relative to the broader market. Beta, therefore, is a measure of the extent<br />
to which the Company’s returns are influenced by the same macroeconomic risks as the<br />
broader market, and thus can not be reduced by diversification. The CAPM formula is given<br />
by the following equation:<br />
k e = r f + β (r m - r f )<br />
Page 10
The risk premium (r m - r f) portion of the CAPM is generally determined by subtracting the<br />
historical risk free rate from historical market returns. 4 The resulting <strong>ROE</strong> derived by the<br />
CAPM approach is driven by the current level of interest rates and the historical relationship<br />
between equity returns and risk free investments for the broader market.<br />
An alternative equity risk premium approach is generally a statistically derived measure of the<br />
linear historical relationship between interest rates and the equity risk premium for the<br />
specific industry sector. Generally, for regulated utilities, this risk premium is calculated as<br />
the difference between authorized returns and the prevailing corporate or risk free bond<br />
yield. Using a corporate bond rate, the risk premium and recommended <strong>ROE</strong> would be<br />
given by the following formulas.<br />
Where:<br />
RP = a + ( X RP x b c ), and<br />
k e = b c + RP<br />
RP = the risk premium<br />
a = the constant term in determining the risk premium, derived using an ordinary<br />
least squares regression model<br />
X RP = the slope coefficient for the change in risk premium for a given change in the<br />
bond yield (this is generally negative indicating an inverse relationship), and<br />
b c = the corporate bond yield.<br />
As this formula indicates, the risk premium is a function of interest rates. Generally, as can<br />
be observed in U.S. and Ontario data, the risk premium decreases as interest rates increase.<br />
The resulting impact on <strong>ROE</strong> takes into account both the change in interest rates and the<br />
effect on the risk premium. With the typical estimation of this model, as interest rates<br />
change, the <strong>ROE</strong> changes by only a fraction of the change.<br />
To understand why <strong>ROE</strong>s resulting from the DCF method might differ from a risk<br />
premium approach, such as the mechanism employed by the OEB, or a CAPM or other<br />
4 It should be noted that the determination of the market equity risk premium is a hotly contested subject<br />
among experts and academics. There are several competing theories as to what the appropriate forward<br />
looking equity risk premium should be.<br />
Page 11
alternative equity risk premium approach, it is important to understand the relationship<br />
between utility dividend yields and bond yields.<br />
There is significant academic research that establishes that utility stock prices are inversely<br />
related to the level of interest rates, and likewise that dividend yields and the level of interest<br />
rates are positively correlated. Chart 1 depicts the strong positive relationship between<br />
average annual 30-year U.S. Treasury yields and the average annual dividend yields for a<br />
representative group of U.S. gas distribution utilities.<br />
CHART 1: COMPARISON OF U.S. GAS UTILITY DIVIDEND YIELDS AND U.S. 30-YEAR<br />
BOND YIELDS FOR THE PERIOD 1991 – 2006 5<br />
Yield Percentage<br />
9.00%<br />
8.00%<br />
7.00%<br />
6.00%<br />
5.00%<br />
4.00%<br />
3.00%<br />
1991 1992 1993 1994 1995 1996 1997 1998 1999 2000 2001 2002 2003 2004 2005 2006<br />
30-YR Bond Avg Div Yld<br />
This strong positive relationship is attributed both to the capital (and debt) intensive nature<br />
of a utility, such that a decrease in debt capital costs will result in higher earnings and higher<br />
stock prices (lowering dividend yields), and to the fact that utilities’ equity returns compete<br />
with debt yields in capital markets, as utilities are generally considered among investors to be<br />
relatively stable, lower risk investments.<br />
5 Dividend yields are represented for the average of all 15 natural gas distribution utilities covered by the<br />
Value Line Investment Survey’s March 16, 2007 publication. 30-Year Treasury bond yields obtained from<br />
Yahoo! Finance.<br />
Page 12
There is a measurable relationship between the utility equity risk premium and the prevailing<br />
bond yield. With this typical relationship, as interest rates rise utility stock prices tend to fall<br />
and, accordingly, dividend yields rise. When stock prices behave in accordance with their<br />
historical behavior to movements in interest rates, the DCF methodologies and the risk<br />
premium methodologies will yield comparable results. However, stock prices and growth<br />
rates do not always move in accordance with historical norms, relative to interest rates,<br />
which creates differences between historical risk premium methodologies and the DCF<br />
approach. Economic factors that affect the utility sector, but not the broader market, such<br />
as stock price inflation due to speculation of merger and acquisition activities, or conversely,<br />
a sector-specific credit contraction such as that which occurred during the Enron<br />
bankruptcy, would yield a much different DCF result than that of an alternative risk<br />
premium approach. In short, the DCF approach is influenced to a substantial degree by<br />
industry specific factors that are reflected in stock prices, but are not accounted for by the<br />
level of interest rates.<br />
Comparison of U.S. and Ontario Risk Premium Models<br />
U.S. authorized returns and Ontario authorized returns were virtually in parity at the time<br />
the OEB implemented the <strong>ROE</strong> adjustment mechanism in 1997. Subsequently, U.S. and<br />
Canadian bond yields have declined significantly, and correspondingly the respective<br />
authorized returns declined as well. For example, the Canadian Long Bond yield decreased<br />
from 10.69 percent to 4.18 percent from 1990 to 2007, a difference of 651 basis points. The<br />
U.S. 30-year Treasury yield decreased from 8.62 percent to 4.81 percent, for the same period,<br />
a drop of 381 basis points. As shown in Chart 2, the more exaggerated decline in the<br />
Canadian Long Bond yield, coupled with the greater interest rate sensitivity of the OEB’s<br />
<strong>ROE</strong> adjustment mechanism (discussed in further detail below), has led to a greater drop in<br />
Canadian authorized returns relative to U.S. authorized returns.<br />
Page 13
CHART 2: U.S. AUTHORIZED RETURNS VS. ONTARIO AUTHORIZED RETURNS – GAS<br />
DISTRIBUTION UTILITIES 1990 - 2007 6<br />
Return Percentage<br />
14.00%<br />
13.00%<br />
12.00%<br />
11.00%<br />
10.00%<br />
9.00%<br />
8.00%<br />
1990<br />
1991<br />
1992<br />
1993<br />
1994<br />
1995<br />
1996<br />
1997<br />
1998<br />
Page 14<br />
1999<br />
Average Ontario Authorized Returns U.S. Authorized Returns<br />
The OEB mechanism for adjusting <strong>ROE</strong> is most closely related to the previously described<br />
risk premium approach. By definition, the adjustment factor of 0.75 for a given change in<br />
interest rates implies that Ontario authorized <strong>ROE</strong>s are highly correlated to changes in bond<br />
yields and that the risk premium moves inversely to interest rates by a factor of 0.25 (1 -<br />
0.75). Table 1 shows an illustrative example of how the OEB formula is applied.<br />
6 Authorized return data for the Ontario <strong>Utilities</strong> was provided by the respective Ontario utilities. Return<br />
data was available for Union Gas and Enbridge from 1985-2007. Return data was available for Centra<br />
from 1990-1997, prior to its consolidation with Union in 1997. Average annual U.S. authorized return<br />
data was available for the period 1990-2007, per RRA Associates, through the SNL database.<br />
2000<br />
2001<br />
2002<br />
2003<br />
2004<br />
2005<br />
2006<br />
2007
TABLE 1: MOST RECENT <strong>ROE</strong> AWARDS FOR ONTARIO GAS UTILITIES<br />
Page 15<br />
OEB Adjustment Mechanism<br />
Allowed <strong>ROE</strong> for test year 1 9.78%<br />
Test Year 2 Long Canada forecast (30-year) 4.00%<br />
Test Year 1 Long Canada forecast (30-year) 5.00%<br />
Change in Interest Rates -1.00%<br />
Adjustment Factor/Slope Coefficient 0.75<br />
Adjustment to <strong>ROE</strong> -0.75%<br />
<strong>ROE</strong> for Test Year 2 9.03%<br />
An analysis of historical authorized returns in Ontario prior to the implementation of the<br />
<strong>ROE</strong> adjustment formula (from 1985 through 1997), reveals that authorized returns<br />
exhibited greater sensitivity to changes in interest rates than the currently prescribed 0.75<br />
adjustment factor inherently assumes. 7 In the U.S., the risk premium has been more<br />
sensitive to changes in interest rates such that <strong>ROE</strong>s themselves are less affected by changes<br />
in long-term interest rates.<br />
To understand the historical relationship of long term bond yields and authorized returns in<br />
the U.S. and Ontario, a series of regressions were performed on Ontario and U.S. data, using<br />
similar parameters. The first regression described the relationship of the risk premium for<br />
regulated utilities as a function of prevailing long term bond yields. The annual risk premium<br />
was derived by subtracting the annual average long term bond yield from the concurrent<br />
average authorized return. The second regression model described the relationship of the<br />
respective authorized return (as opposed to the risk premium) as a function of the prevailing<br />
long term bond yield. The time period reviewed for the Ontario utilities was prior to the<br />
OEB’s implementation of its mechanical <strong>ROE</strong> formula, from 1985 to 1997. This time<br />
period was selected in order to characterize the relationship of Ontario authorized returns<br />
and bond yields, without respect to the returns produced by the adjustment mechanism<br />
7 Prior to 1997, per the Board’s “Draft Guidelines on a Formula-Based Return on Common Equity for<br />
Regulated <strong>Utilities</strong>”, at page 2, <strong>ROE</strong> for gas distributors in Ontario was set much the same as it is in the<br />
U.S. today, through rate proceedings. In the rate proceedings leading up to the “Draft Guidelines”<br />
issuance, “experts relied principally on [the equity risk premium approach], followed by [the comparable<br />
earnings approach] and then DCF. The CAPM is typically given the least weight, if it is relied on at all.”<br />
[Clarification added].
subsequent to 1997. Similar analyses were performed on U.S. data, although the time period<br />
selected for the U.S. models was from 1990 to 2007. Though the autocorrelation present in<br />
these data sets would prohibit the inference of the impact on <strong>ROE</strong> of a given change in<br />
bond yields (at a 95 percent confidence level), the results do provide descriptive insight as to<br />
the historical relationship between interest rates and authorized returns in each market. 8 The<br />
results of these regression models are provided in Table 2:<br />
TABLE 2: REGRESSION RESULTS – RISK PREMIUMS AND AUTHORIZED RETURNS AS A<br />
FUNCTION OF BOND YIELDS – ONTARIO VS. U.S.<br />
Intercept t-statα X t-statx R 2<br />
Risk Premium Regression Model = Intercept + (X * bond yield) = Risk Premium<br />
Ontario Data from 1985 – 1997 0.0546 3.1822 -0.1383 -0.7402 0.0474<br />
U.S. Data from 1990 – 2007 0.0838 22.2059 -0.5365 -8.8984 0.8214<br />
Authorized Return Regression Model = Intercept + (X * bond yield) = Authorized Return<br />
Ontario Data from 1985 – 1997 0.0546 3.1822 0.8617 4.6132 0.6593<br />
U.S. Data from 1990 – 2007 0.0838 22.2059 0.4635 7.6862 0.7869<br />
As the regression results illustrate, both the U.S. and the Ontario risk premiums reflect<br />
negative coefficients implying that changes in the risk premium have been inversely related<br />
to changes in interest rates. However, the Ontario risk premium coefficient is associated<br />
with a low level of statistical confidence. The Ontario risk premium coefficient is<br />
informative, however, in that it has a much weaker relationship to interest rates than is the<br />
case in the U.S., i.e., -0.14 (and insignificant) in Ontario versus -0.54 in the U.S.<br />
While the Ontario risk premium appears to have a much weaker link to interest rates than in<br />
the U.S., the Ontario authorized returns appear to have been more sensitive to interest rate<br />
fluctuations than in the U.S. The regression results above imply differences in interest rate<br />
sensitivity of the two models in that the variable coefficient for interest rates in the Ontario<br />
8 See Plane and Oppermann, Business and Economic Statistics, Revised Edition at 395, where the authors<br />
state: “…There is one particular difficulty that arises in the analysis of time series that limits many of the<br />
techniques of statistical inference …. The difficulty is that the individual observations in a time series<br />
often depend on previous observations….This phenomenon, called serial correlation, causes most time<br />
series to be descriptive rather than inferential.”<br />
Page 16
model is 0.86 where as the U.S. coefficient is 0.46. (That is, for every one percentage point<br />
change in interest rates, the Ontario <strong>ROE</strong>s change by 86 basis points while U.S. <strong>ROE</strong>s<br />
change by 46 basis points).<br />
To assess whether the above regression models are informative in projecting authorized<br />
returns, CEA back-tested each of the models against actual data. Below are graphs for the<br />
U.S. and Ontario authorized returns that compare the actual returns to the estimated returns<br />
based on the respective Ontario and U.S. regression models. Charts 3 and 4 illustrate this<br />
comparison, showing that both regression models reasonably describe respective U.S. and<br />
Ontario authorized return issuances by the level of long term government bond yields, and<br />
may be informative in estimating the level of returns that would typically be authorized in<br />
each country for a given level of interest rates.<br />
CHART 3: AVERAGE ONTARIO AUTHORIZED RETURNS VS. PROJECTED RETURNS PER<br />
REGRESSION MODEL – GAS DISTRIBUTION UTILITIES 1985 - 2007 9<br />
Percentage<br />
16.00%<br />
15.00%<br />
14.00%<br />
13.00%<br />
12.00%<br />
11.00%<br />
10.00%<br />
9.00%<br />
8.00%<br />
1985 1986 1987 1988 1989 1990 1991 1992 1993 1994 1995 1996 1997 1998 1999 2000 2001 2002 2003 2004 2005 2006 2007<br />
Average Ontario Authorized Returns Projected Ontario Returns per Risk Premium and Authorized Returns Regression Models<br />
9 Authorized return data for the Ontario <strong>Utilities</strong> was provided by the respective Ontario utilities. Return<br />
data was available for Union Gas and Enbridge from 1985-2007. Return data was available for Centra<br />
from 1990-1997, prior to its consolidation with Union in 1997. Canadian Long Bond data was obtained<br />
from the Bank of Canada.<br />
Page 17
CHART 4: AVERAGE U.S. ACTUAL AUTHORIZED RETURNS VERSUS PROJECTED<br />
RETURNS PER REGRESSION MODEL 1990 - 2007 10<br />
Percentage<br />
13.00%<br />
12.00%<br />
11.00%<br />
10.00%<br />
1990 1991 1992 1993 1994 1995 1996 1997 1998 1999 2000 2001 2002 2003 2004 2005 2006 2007<br />
U.S. Authorized Returns US Projected Returns from both Risk Premium and Authorized Return Model 1990 - 2007<br />
To summarize, the OEB’s factor of 0.75 used in its automatic <strong>ROE</strong> adjustment mechanism<br />
is reasonably close to what the above analysis on Ontario data suggests is the historical<br />
relationship between Canadian Long Bonds and gas utility authorized returns. Specifically,<br />
the above analysis suggests these variables are historically correlated by a factor of 0.86 in<br />
contrast to the 0.75 used in the OEB adjustment formula. These results differ markedly<br />
from the model describing U.S. data, which suggests a coefficient between authorized<br />
returns and interest rates of 0.46. The reason for the difference between the Ontario<br />
coefficient of 0.86, implied by the regression model, and the historical U.S. implied factor of<br />
0.46, is subject to speculation, but may be due in part to Canada’s historical reliance on the<br />
risk premium approach in establishing authorized <strong>ROE</strong>s, as well as the use of a test year and<br />
less frequent <strong>ROE</strong> determinations in the U.S. (as opposed to the more frequent <strong>ROE</strong><br />
determinations in Ontario). However, the difference in the interest rate sensitivity explained<br />
by the U.S. regression model and the Ontario adjustment mechanism at least partially<br />
explains the recent disparity between U.S. authorized returns and Ontario authorized<br />
returns. As interest rates have declined dramatically in Canada in the past ten years, one<br />
would expect the OEB formula to yield accordingly lower authorized <strong>ROE</strong>s.<br />
10 U.S. authorized return data was available from 1990 to 2007, per RRA Associates, through the SNL<br />
database. 30-Year Treasury yield data was obtained from Yahoo! Finance.<br />
Page 18
The formula, however, is symmetrical, and <strong>ROE</strong>s will most likely recover at a faster rate in<br />
Ontario than in the U.S., when interest rates begin to rise. In fact, if interest rates continue<br />
to steadily rise, the OEB adjustment formula could surpass and yield higher results than<br />
historical data suggest U.S. authorized returns would reach under the same circumstances.<br />
Below is a sensitivity analysis between U.S. authorized returns per the above regression<br />
model and the OEB adjustment formula. As Chart 5 illustrates, there is a greater difference<br />
between U.S. and Ontario returns at extreme high and low interest rates. It is important to<br />
note, however, that over the range of interest rates from 4.00 percent to 6.00 percent (a<br />
range of projected rates that is within the bounds of consensus forecasts), the OEB model<br />
yields results that are consistently and significantly below those implied by the U.S.<br />
regression model.<br />
CHART 5: SENSITIVITY ANALYSIS – <strong>ROE</strong> DETERMINED BY OEB FORMULA VS. U.S.<br />
REGRESSION MODEL OF AUTHORIZED RETURNS EXPLAINED BY 30-YEAR TREASURY<br />
BOND YIELDS 11<br />
Authorized Return<br />
20.00%<br />
18.00%<br />
16.00%<br />
14.00%<br />
12.00%<br />
10.00%<br />
8.00%<br />
6.00%<br />
2.00% 3.00% 4.00% 5.00% 6.00% 7.00% 8.00% 9.00% 10.00% 11.00% 12.00% 13.00% 14.00% 15.00% 16.00% 17.00%<br />
Interest Rates<br />
OEB Model US Regression Model<br />
Page 19<br />
`<br />
11 Chart 5 assumes the U.S. and the Canadian long term government bond yields are in parity. U.S.<br />
authorized returns are calculated based upon the regression equation, k= 0.0838 + (0.4635 x i). The OEB<br />
adjustment formula assumes that the formula would yield a return of 12.25 percent when long Canada<br />
bond yields are 8.30 percent, as was the case when the mechanism was first proposed. The OEB model<br />
formula takes the change in the Canadian Long Bond for the period x 0.75, plus the previous return, so<br />
that when interest rates are at 8.30 percent, the <strong>ROE</strong> is 12.25 percent.
Quantification of Inter-jurisdictional Differences in <strong>ROE</strong>:<br />
Beyond the methodological differences addressed in the prior section, the OEB requested<br />
that CEA examine other factors that explain differences in <strong>ROE</strong>s between Ontario and<br />
other jurisdictions. CEA began this portion of the analysis with the premise that a<br />
reasonable and practical benchmark against which to compare allowed <strong>ROE</strong>s in Ontario is a<br />
range of recently authorized <strong>ROE</strong>s for other gas distribution utility companies both in<br />
Canada and abroad. While there are a multitude of jurisdictional and company-specific<br />
business, operating, financial, and regulatory risks that must be taken into consideration<br />
when evaluating individual utility <strong>ROE</strong>s and estimating the equity returns expected by<br />
investors, CEA believes the <strong>ROE</strong>s awarded by a broad base of other regulatory commissions<br />
can form an adequate starting point for comparison.<br />
To begin its analysis, CEA gathered data from approximately 50 different rate cases in<br />
Canada and the U.S. from 2005 to the present, including: (1) the utilities receiving the <strong>ROE</strong><br />
awards and the jurisdictions in which they operate; and (2) the authorized <strong>ROE</strong>s and capital<br />
structures. CEA also gathered summary level data regarding <strong>ROE</strong> methodologies and<br />
allowed returns in the U.K., Australia, and the Netherlands. A summary of this data is<br />
presented in Tables 3, 4, and 5, and detailed information for all the Canadian and U.S.<br />
companies studied can be found in Exhibit 1. As discussed in greater detail later in this<br />
report, CEA narrowed the U.S. group of companies to a subset of companies more<br />
comparable to the Ontario gas distributors on the basis of size, degree of non-gas<br />
distribution (e.g., electric or steam) operations, and credit rating (see the “Revised<br />
Comparison” discussion in this section of the report for a discussion of the process used to<br />
limit the population of U.S. companies to a more comparable group). The results for these<br />
eight companies are also presented in Table 4.<br />
TABLE 3: MOST RECENT <strong>ROE</strong> AWARDS FOR ONTARIO GAS UTILITIES<br />
Utility 2006 <strong>ROE</strong>/Equity Ratio 2007 <strong>ROE</strong>/Equity Ratio<br />
Enbridge Gas Distribution 8.74% / 35.00% 8.39% / 35.00% 12<br />
Union Gas 8.89% / 35.00% 8.54% / 36.00%<br />
12 Per Enbridge Gas Distribution Inc.’s 2006 Annual Information Form, the company has requested an<br />
equity percentage of 38 percent in its pending 2007 rate application.<br />
Page 20
TABLE 4: MOST RECENT <strong>ROE</strong> AWARDS FOR GAS UTILITIES IN OTHER JURISDICTIONS<br />
Jurisdiction<br />
Canada<br />
British Columbia (PNG and <strong>Terasen</strong>)<br />
<strong>Utilities</strong> Receiving<br />
Recent <strong>ROE</strong> Awards<br />
5<br />
Page 21<br />
Average <strong>ROE</strong><br />
/Equity % [A]<br />
8.85% / 37.40%<br />
Primary Method<br />
for Setting <strong>ROE</strong><br />
ERP/DCF [B]<br />
Adjustment<br />
Mechanism<br />
Annual Adj.<br />
Gaz Metropolitain – Québec. 1 8.95% [C] / 38.50% CAPM/ERP [D] Annual Adj.<br />
Alberta (ATCO and Alta) 2 8.51% / 39.00% CAPM [E] Annual Adj. [F]<br />
Canada (average) [G] 8 8.78% / 38.00%<br />
United States (average) 34 10.35% / 48.00% DCF [H] Case-by-Case<br />
United States (average of 8 comparable cos.) 8 10.40% / 46.44% DCF Case-by-Case<br />
U.K (estimated) [I] 4 6.25% [J] / 37.50% CAPM Fixed (5 Year Period)<br />
Australia (estimated) [K] 8 11.70% - 12.70% /<br />
40.00% - 45.00%<br />
CAPM Fixed (5 Year Period)<br />
Netherlands (estimated) [L] 12 7.00% / 40.00% CAPM Fixed (3-5 Years)<br />
Notes to Table:<br />
[A] <strong>ROE</strong> award based on most recent award for applicable utilities.<br />
[B] See, British Columbia <strong>Utilities</strong> Commission, “In the Matter of <strong>Terasen</strong> Gas Inc. and <strong>Terasen</strong> Gas (Vancouver Island) Inc. <strong>Application</strong> to<br />
Determine the Appropriate Return on Equity and <strong>Capital</strong> <strong>Structure</strong> and to Review and Revise the Automatic Adjustment Mechanism,”<br />
Decision, March 2, 2006.<br />
[C] 8.95 percent for Gaz Met does not include an adder to <strong>ROE</strong> of 0.38 percent, which represents an incentive amount based on expected<br />
productivity gains. See, Gaz Métro Limited Partnership, Analyst Annual Meeting Presentation, December 13, 2005.<br />
[D] Per a representative at Regie de L’Energie, <strong>ROE</strong> was last reviewed in decision D-99-11, R-3397-98, in which the “the Regie put most of<br />
the weight towards [the] <strong>Capital</strong> Asset Pricing Model and the Equity Risk Premium.”<br />
[E] In its 2004 Generic Cost of <strong>Capital</strong> proceeding, the Alberta EUB relied on the CAPM, using other ERP methodologies as a check on<br />
reasonableness. See Alberta EUB, Decision 2004-052, July 2, 2004.<br />
[F] Changes in an <strong>ROE</strong>, while annual, only take effect if a utility files an application for a change in rates for the applicable test year. See,<br />
ATCO Ltd. 2006 Annual Information Form, at p. 8.<br />
[G] CEA purposefully omitted certain other provinces in Canada due to a general lack of comparability. For example, Enbridge Gas New<br />
Brunswick, with an <strong>ROE</strong> award of 13.00 percent, was not included due to its status as a “developing” distribution company. The group of<br />
Canadian companies studied by CEA appears to be consistent with groups used in <strong>ROE</strong> regulatory proceedings and by analysts.<br />
[H] In CEA’s experience, jurisdictions in the U.S. often rely on the DCF model, using other methodologies to validate the DCF results. The<br />
FERC’s favored approach is a form of the DCF model.<br />
[I] Rates of return will be reset for the 2008-2014 period. The 6.25 percent <strong>ROE</strong> was recently re-affirmed for an additional year-long period,<br />
after it was set to lapse in 2007. In a recent discussion regarding the cost of capital for U.K. gas distributors, the Ofgem stated, “Since this is a<br />
one year control, and we have explained that we will review the cost of capital for the main control, we are not sending any signal regarding<br />
long-term returns, so long-term investment decisions should not be unduly affected.” See, Ofgem, “Gas Distribution Price Control Review<br />
One Year Control Final Proposals,” December 4, 2006, at p. 31.<br />
[J] The “Vanilla WACC” (equal to the pre-tax cost of debt plus the after tax cost of equity, adjusted for capitalization), was set at 5.25 percent,<br />
with 62.5 percent debt and a cost of debt of 4.65 percent. The implied <strong>ROE</strong> is thus 6.25 percent after-tax.<br />
[K] Australian price cap reviews are performed every five years. Based on the most recent price cap reviews in the states surveyed, the range of<br />
implicit nominal <strong>ROE</strong>s range from 11.7 percent in Victoria (based on an October 2002 review) to 12.7 percent in Western Australia (based on<br />
a June 2000 review). The average for this group is 12.1 percent. The regulatory commission of New South Wales provides a range of<br />
parameters for which the <strong>ROE</strong> can be calculated, resulting in an implicit <strong>ROE</strong> range of 10.1 percent to 12.2 percent.<br />
[L] In its report, the NCA suggested a range of values for the various inputs of the CAPM, including an equity risk premium of between 4.0<br />
and 6.0 percent, a Beta of between 0.47 and 0.74, and a risk-free rate of 3.8 percent to 4.3 percent, based on ten-year government bonds. The<br />
resulting range of <strong>ROE</strong>s (based on an equity percentage of 40 percent), is from approximately 5.7 percent to 8.7 percent, with an average of 7.0<br />
percent. It is important to note that this range of <strong>ROE</strong>s is based on proposed parameters for the CAPM provided by the NCA.
TABLE 5: <strong>ROE</strong> AND EQUITY PERCENTAGE DIFFERENTIALS<br />
ONTARIO<br />
(AVERAGE<br />
OF<br />
ENBRIDGE<br />
AND<br />
UNION)<br />
<strong>ROE</strong> 8.82% (’06)<br />
Ontario <strong>ROE</strong><br />
Differential 13<br />
8.47% (’07)<br />
OTHER<br />
CANADIAN<br />
PROVINCES<br />
9.15% (’06)<br />
8.77% (’07)<br />
-- (.33%) (’06)<br />
(.31%) (’07)<br />
Page 22<br />
U.S.<br />
10.35%<br />
(‘05 – present)<br />
(1.53%) (’06)<br />
(1.89%) (’07)<br />
U.S. (8<br />
COMPARABLE<br />
COMPANIES)<br />
10.40%<br />
(‘05 – present)<br />
(1.58%) (’06)<br />
(1.94%)<br />
(‘07)<br />
Equity % 35.50% (2007) 37.94% 48.00% 46.44%<br />
Ontario<br />
Equity %<br />
Differential<br />
-- (2.44%) (12.50%) (10.94%)<br />
As can be seen in Table 5, the two major gas distribution utilities in Ontario have an average<br />
2007 <strong>ROE</strong> of 8.47 percent, as compared to an average 2006 <strong>ROE</strong> of 8.82 percent. For the<br />
remaining provinces in Canada, the average <strong>ROE</strong> is 8.77 percent for 2007 and 9.15 percent<br />
for 2006. In the U.S., the overall average allowed <strong>ROE</strong> is 10.35 percent, and for a subgroup<br />
of more comparable U.S. companies (as discussed in more detail later in the report), the<br />
average <strong>ROE</strong> is 10.40 percent.<br />
Chart 6 represents a histogram of allowed <strong>ROE</strong>s in Canada (for the five provinces studied)<br />
and the U.S. (for the group of eight comparable companies and for the remainder of the U.S.<br />
group). The two major gas distribution utilities in Ontario have 2007 <strong>ROE</strong>s of 8.39 percent<br />
for Enbridge, and 8.54 percent for Union, as compared to 2006 <strong>ROE</strong>s of 8.74 percent and<br />
8.89 percent. For the remaining provinces in Canada, the <strong>ROE</strong>s range from 8.37 percent for<br />
<strong>Terasen</strong>’s British Columbia operations to 9.07 percent for <strong>Terasen</strong>’s Vancouver Island<br />
13 Due to the fact that the majority of U.S. companies adjust their <strong>ROE</strong>s on a case-by-case basis, depending<br />
on the timing of their rate cases, as opposed to the annual adjustment mechanism in place in Ontario and<br />
other Canadian jurisdictions, CEA has presented comparisons of U.S. <strong>ROE</strong>s to both 2006 and 2007<br />
allowed <strong>ROE</strong>s in Canada. The breakdown by year of the U.S. rate cases is as follows: 2005 – 20 rates<br />
cases, average <strong>ROE</strong> of 10.35 percent; 2006 – 11 rate cases, average <strong>ROE</strong> of 10.32 percent; 2007 – 3 rate<br />
cases, average <strong>ROE</strong> of 10.53 percent.
operations (a 70 basis point spread). In the U.S., the recently allowed <strong>ROE</strong>s range from 9.45<br />
percent for CenterPoint Energy Resource’s Arkansas operations, to 11.20 percent for two<br />
utilities in Wisconsin (a 175 basis point spread), with a mean of 10.35 percent, and a median<br />
of 10.40 percent. For a subgroup of more comparable U.S. companies (as discussed later in<br />
the report), the range is from 9.50 percent for Southwest Gas Corp. in Arizona to 11.20<br />
percent for Wisconsin Gas (a 170 basis point spread), with a mean of 10.40 percent and a<br />
median of 10.46 percent.<br />
No. of Cases<br />
7<br />
6<br />
5<br />
4<br />
3<br />
2<br />
1<br />
0<br />
CHART 6: HISTOGRAM OF ALLOWED <strong>ROE</strong>S IN CANADA AND THE U.S.<br />
8.0% - 8.25% -<br />
8.25% 8.5%<br />
8.5% -<br />
8.75%<br />
8.75% -<br />
9.0%<br />
9.0% - 9.25% -<br />
9.25% 9.5%<br />
9.5% -<br />
9.75%<br />
9.75% -<br />
10.0%<br />
Allowed <strong>ROE</strong>s<br />
10.0% - 10.25%<br />
10.25% - 10.5%<br />
Page 23<br />
10.5% - 10.75% -<br />
10.75% 11.0%<br />
11.0% - 11.25% -<br />
11.25% 11.5%<br />
Canada<br />
US (8 comparable cos.)<br />
US (other)<br />
As can be seen in Chart 6, there is no overlap between the ranges of Canadian and U.S.<br />
<strong>ROE</strong>s, with Canadian <strong>ROE</strong>s being fairly evenly distributed between 8.25 percent and 9.25<br />
percent, and U.S. <strong>ROE</strong>s clustering between 10.00 percent and 10.50 percent, with the mode<br />
(eight of the 34 total cases) being 11.00 percent. It is important to note that while the<br />
Canadian and U.S. <strong>ROE</strong> ranges do not overlap, the ranges themselves are also quite<br />
different, in terms of spread from top to bottom (i.e., the 70 basis point spread in Canada<br />
versus the 170 to 175 basis point spread in the U.S.). Possible reasons for this additional<br />
divergence are provided in the Jurisdictional Analysis discussion presented later in this<br />
report.<br />
CEA also gathered data related to the allowed equity percentages of the companies analyzed.<br />
The allowed equity percentages in 2007 are 35.00 percent and 36.00 percent for Enbridge
and Union, respectively, although Enbridge has requested a 38.00 percent equity ratio in its<br />
pending rate case. As shown in Exhibit 1, equity ratios in other Canadian provinces range<br />
from 37.00 percent to 39.00 percent, and those in the U.S. are 31.80 percent on the low end,<br />
for CenterPoint Energy Resource’s Arkansas operations, 14 and 60.00 percent on the high<br />
end, for Wisconsin Public Service Corporation, with a mean and median of approximately<br />
48.00 percent. The companies in the group of eight comparable U.S. gas distributors have<br />
equity percentages ranging from 39.31 percent for Michigan Consolidated Gas to 56.37<br />
percent for Northern Illinois Gas, with a mean of 46.44 percent and a median of 46.77<br />
percent. Summary level information is provided in Table 5, and Chart 7 shows the<br />
distribution of allowed equity percentages in Canada and the U.S.<br />
CHART 7: HISTOGRAM OF ALLOWED EQUITY PERCENTAGES IN CANADA AND THE U.S.<br />
No. of Cases<br />
6<br />
5<br />
4<br />
3<br />
2<br />
1<br />
0<br />
30.0% -<br />
32.5%<br />
32.5% -<br />
35.0%<br />
35.0% -<br />
37.5%<br />
37.5% -<br />
40.0%<br />
40.0% -<br />
42.5%<br />
42.5% -<br />
45.0%<br />
45.0% -<br />
47.5%<br />
Allowed Equity %<br />
47.5% -<br />
50.0%<br />
Page 24<br />
50.0% -<br />
52.5%<br />
52.5% -<br />
55.0%<br />
55.0% -<br />
57.5%<br />
57.5% -<br />
60.0%<br />
Canada<br />
US (8 comparable cos.)<br />
US (other)<br />
While there is some overlap between the allowed equity ratios in Canada and the U.S., the<br />
Canadian equity ratios are narrowly gathered between 32.50 percent and 42.50 percent, while<br />
the U.S. equity ratios are well spread throughout the range, with the most instances between<br />
47.50 percent and 55.00 percent.<br />
Chart 8 presents a scatter plot of <strong>ROE</strong>s and equity percentages in Canada and the U.S.<br />
14 It is worthy to note that Arkansas uses the Modified Balance Sheet Adjustment, which is unique among<br />
U.S. regulatory jurisdictions.
<strong>ROE</strong><br />
CHART 8: SCATTER PLOT OF ALLOWED <strong>ROE</strong>S VS. ALLOWED CAP STRUCTURE<br />
11.50%<br />
11.00%<br />
10.50%<br />
10.00%<br />
9.50%<br />
9.00%<br />
8.50%<br />
8.00%<br />
7.50%<br />
25.00% 30.00% 35.00% 40.00% 45.00% 50.00% 55.00% 60.00% 65.00%<br />
Equity Percentage<br />
Page 25<br />
Canadian <strong>Utilities</strong><br />
8 US <strong>Utilities</strong><br />
Other US <strong>Utilities</strong><br />
While pictorially Chart 8 may suggest a positive relationship between <strong>ROE</strong>s and equity<br />
percentages that runs counter to expectations (as, in general, financial theory would suggest<br />
that as equity ratios decrease, the cost of equity increases), a closer look at the data suggests<br />
that no such conclusion can be drawn. Table 6 shows the regression results for Canada and<br />
the U.S., based on the data presented in Chart 8, illustrating that in Canada, there is not a<br />
statistically significant relationship between equity ratios and <strong>ROE</strong>s (based on a t-statistic of<br />
1.51), while in the U.S., a statistically significant relationship exists, but with little explanatory<br />
value (based on an R 2 of .186).<br />
TABLE 6: REGRESSION RESULTS COMPARING <strong>ROE</strong>S TO EQUITY RATIOS<br />
Intercept t-statα X t-statx R 2<br />
Canadian Data .065 4.44 .059 1.51 .222<br />
U.S. Data .088 14.87 .033 2.70 .186
Assessment of Inter-jurisdictional Differences in <strong>ROE</strong>:<br />
The fact that a disparity exists between <strong>ROE</strong>s for gas utilities in Ontario and other<br />
jurisdictions, particularly the U.S., is not disputed. As stated earlier, the OEB requested that<br />
CEA seek to gain an understanding of why the difference exists, and if there is some<br />
explanatory justification beyond the methodology employed in Ontario versus other<br />
jurisdictions. As return on equity is a measure of the return that investors seek for a given<br />
amount of risk, the key question is:<br />
Are gas distribution companies in other jurisdictions more risky than<br />
those in Ontario, as would be indicated by higher <strong>ROE</strong>s applied to<br />
larger equity percentages, and visa-versa?<br />
A key issue is therefore assessing comparative risk. To perform this assessment, CEA<br />
gathered further data regarding fundamental operating, financial, regulatory and business<br />
risks for the companies that were included in the analyses discussed earlier in this report.<br />
Company-Specific Data<br />
Both Dominion Bond Rating Service (“DBRS”) and Standard & Poor’s (“S&P”) cite a series<br />
of factors used to determine the business risk of an LDC. 15 Table 7 is a summary of the<br />
factors provided by these two ratings agencies.<br />
15 See, Dominion Bond Rating Service, “Rating <strong>Utilities</strong> (Electric, Pipelines & Gas Distribution)”, March 9,<br />
2005; Standard & Poor’s, “Key Credit Factors for U.S. Natural Gas Distributors,” November 2006.<br />
Page 26
• Regulatory factors<br />
• Competitive environment<br />
TABLE 7: DBRS AND S&P BUSINESS RISK FACTORS<br />
DBRS S&P<br />
• Supply/demand considerations<br />
• Regulated vs. non-regulated activities<br />
• Domestic vs. foreign operations<br />
• <strong>Capital</strong> spending program<br />
• Coverage ratios<br />
• Qualitative factors such as customer<br />
mix, economic strength in the service<br />
territory, and management expertise<br />
Page 27<br />
• Regulation<br />
• Weather protection<br />
• Earnings sharing<br />
• Allowed <strong>ROE</strong><br />
• Other regulatory factors<br />
• Financial protection from affiliates<br />
• Markets and competition (including<br />
service territory growth, saturation,<br />
customer mix, protection against<br />
bypass, and economic strength)<br />
• Factors related to supply, storage,<br />
system condition, and hedging<br />
• Management<br />
Similarly, in developing a comparable, or “proxy”, group of companies for the purposes of<br />
evaluating and estimating the required return on equity for utility companies, including gas<br />
distribution companies, various screening criteria and metrics of risk are used to arrive at a<br />
group of companies that are fundamentally comparable to the subject company. More<br />
specifically, when estimating the <strong>ROE</strong> for a regulated gas distribution company, such as<br />
Enbridge or Union, a combination of screening criteria typically is used by financial experts<br />
to identify utilities with similar business, financial, and regulatory risks. These criteria may<br />
include:<br />
• Similar Operating and Financial Characteristics: The analyst uses companies that exhibit<br />
operating and financial characteristics similar to the subject company in that they<br />
have a specified percentage of regulated operations, and regulated natural gas<br />
operations contribute a majority of revenues and net income;
• Credit Rating: If the subject company is rated BBB- or above by Standard & Poor’s,<br />
or a similar ratings agency, each selected company has senior bond and/or<br />
corporate credit ratings that are investment grade;<br />
• Beta: The analyst may include only those companies with Betas that are within a<br />
reasonable range of the group average;<br />
• Customer Mix: A concentration of customers in one particular class, such as large<br />
industrial customers, has certain risk ramifications, and thus customer mix by<br />
volume or revenue within certain ranges can assist in defining the proxy group;<br />
• Other: Depending on specific details regarding the subject company and the<br />
environment in which it operates, other screens related to regulatory restructuring,<br />
geography, or other pertinent criteria may be employed.<br />
While not all of this data is available for the companies studied, CEA gathered as much data<br />
as was publicly available along the lines discussed above. Beta, for example, is calculated<br />
using individual company stock returns as compared to the returns of a broader index. As<br />
the majority of the companies studied as part of this report are subsidiaries of larger<br />
corporations, no trading data is available at the subsidiary level, and thus Beta cannot be<br />
calculated. 16 In addition, where financial or other information was not available for<br />
companies in the study (for example, if the company were a small subsidiary for which no<br />
financial data were available), CEA used parent-level information, and applied it to the<br />
subsidiary based on reasonable assumptions of relative size.<br />
CEA also recognizes the correlation between the size of a company and its investors’<br />
required returns. The financial and academic communities have long accepted the<br />
proposition that the cost of equity for small firms is subject to a “size effect.” 17 While<br />
empirical evidence of the size effect often is based on studies of industries beyond regulated<br />
16 As an alternative, the Beta of a parent company may be used by a financial analyst as a proxy for that of a<br />
subsidiary in those cases in which the parent’s operations are representative of the subsidiary’s operations.<br />
However, in cases in which the parent has subsidiary affiliates with substantially different risk profiles<br />
(such as a holding company with a mix of regulated and unregulated subsidiaries), this approximation<br />
becomes less justifiable.<br />
17 See Mario Levis, “The record on small companies: A review of the evidence,” Journal of Asset Management 2<br />
(March 2002):368-397, for a review of literature relating to the size effect.<br />
Page 28
utilities, utility analysts also have noted the risks associated with small market capitalizations.<br />
Specifically, Ibbotson Associates noted:<br />
For small utilities, investors face additional obstacles, such as smaller<br />
customer base, limited financial resources, and a lack of diversification across<br />
customers, energy sources, and geography. These obstacles imply a higher<br />
investor return. 18<br />
Small size, therefore, leads to two categories of increased risk for investors: (1) liquidity risk<br />
(i.e., the risk of not being able to sell one’s shares in a timely manner due to the relatively thin<br />
market for the securities); and, (2) fundamental business risks. For this reason, CEA also<br />
gathered information for each company related the size of its operations. As the majority of<br />
the companies in our sample population are subsidiaries of larger corporations, all with<br />
differing types of regulated and unregulated affiliated companies, CEA could not gather<br />
market capitalization data, nor did we think applying an assumed market-to-book ratio to<br />
each of the companies would provide for a meaningful analysis. For that reason, CEA<br />
collected information related to book capitalization, total revenue, total customers, and gas<br />
throughput as proxies for the relative size of the individual companies.<br />
CEA notes that the Board also requested that CEA gain an understanding of how varying<br />
degrees of forecasted capital expenditures might affect <strong>ROE</strong>. As this type of data is<br />
inconsistently available for the companies studied, it is difficult to perform a quantitative<br />
analysis from which any conclusions can be drawn. CEA has discovered in previous cases,<br />
however, that heightened capital requirements increase business risk for companies in<br />
several ways: (1) risk of cost under recovery associated with project cost over runs and/or<br />
poor performance of the new facilities; and (2) capital requirements to finance new<br />
construction can result in downward pressure on the Company’s credit rating. Market data<br />
indicate that investors recognize these risks and discount the valuation multiples of<br />
companies with high ratios of capital expenditures to net plant. That is, the financial<br />
community acknowledges the risks associated with substantial capital expenditures and<br />
reflects those risks in lower valuation multiples, and therefore, higher required returns.<br />
18 Michael Annin, “Equity and the Small-Stock Effect,” Public <strong>Utilities</strong> Fortnightly, October 15, 1995.<br />
Page 29
In addition, as this is a study of comparative risk, as opposed to absolute risk, CEA has<br />
specifically not gathered information related to factors that by and large affect all gas utilities.<br />
For the most part, these factors include comparative costs between natural gas and other<br />
energy sources, as well as the effect of declining use due to improved efficiency in gas<br />
appliances and equipment. 19<br />
For Canadian companies, data was gathered from information provided by the OEB, Annual<br />
Information Forms and Annual Reports, company websites, and discussions with and<br />
documentation from company representatives and other market participants. In total, CEA<br />
studied ten Canadian gas utilities, including Enbridge and Union in Ontario, Gaz<br />
Metropolitain in Québec, three divisions of Pacific Northern Gas, Ltd. and two divisions of<br />
<strong>Terasen</strong> in British Columbia, and AltaGas Utility and ATCO in Alberta.<br />
For U.S. companies, rate case and company data was gathered from the SNL Interactive<br />
database, the Regulatory Research Associates database, and company filings and websites.<br />
CEA studied 37 rate cases for 34 companies in 22 different states. For companies that had<br />
two or more decided rate proceedings in the past two years, CEA used the most recent<br />
proceeding for comparative purposes.<br />
A full list of data sources is provided in Appendix B. The full data set of companies and rate<br />
proceedings is presented in Exhibits 1 and 2 to this report. A summary of the allowed<br />
<strong>ROE</strong>s is provided in Tables 4 and 5, and a summary of the remaining data is presented in<br />
Table 8.<br />
19 CEA recognizes that cost competition and declining use may affect some utilities more than others.<br />
However, an in depth analysis of these factors is outside the scope of this report.<br />
Page 30
Company/<br />
Jurisdiction<br />
Enbridge Gas<br />
Distribution<br />
TABLE 8: COMPARISON OF OPERATIONAL AND FINANCIAL DATA 20<br />
% Regulated<br />
Gas<br />
Distribution<br />
Rev./% Gas Book Value Total Revenue Revenue<br />
Most Recent Allowed Distribution (million (million (million<br />
<strong>ROE</strong> Equity % Rev.<br />
$CAD) $CAD) $CAD, 2006)<br />
8.39% 35% 100%/98% $4,779 $3,016 $2,958<br />
Page 31<br />
Total Gas<br />
Dist.<br />
Customers<br />
(millions)<br />
Gas Volume<br />
Sold (billion<br />
cubic meters,<br />
1.8 4.4 dist<br />
7.1 trans<br />
11.6 total<br />
Union Gas 8.54% 36% 100%/91% 3,442 2,079 2,046 1.3 13.2 dist<br />
20.6 trans<br />
34.0 total<br />
U.S<br />
(average of 34<br />
companies)<br />
U.S<br />
(average of 8<br />
comparable<br />
companies – see<br />
discussion below)<br />
2006) Customer Mix<br />
Ind 5%<br />
Com 23%<br />
Res 47%<br />
Whls 2%<br />
Trans 23%<br />
Ind 12%<br />
Com 20%<br />
Res 7%<br />
Whls 0%<br />
Trans 61%<br />
10.35% 48% 84%/36% 2,882 2,238 1,175 .6 3.3 Ind 15%<br />
Com 19%<br />
Res 42%<br />
Whls 2%<br />
Trans 22%<br />
10.40% 46.44% 89%/60% 2,767 2,418 1,307 1.1 5.2 Ind 11%<br />
Com 20%<br />
Res 47%<br />
Whls 0%<br />
Trans 22%<br />
20 As noted previously, certain data for the U.S. companies in the analysis are estimates based on data at the parent company or reporting segment level, allocated to<br />
the subject company based on a best estimate of the subject company’s contribution to the overall parent or segment.<br />
Credit Rating<br />
(DBRS/ S&P)<br />
A/A-<br />
A/BBB+<br />
BBB+ (average<br />
S&P rating of<br />
utilities)<br />
BBB+ (average<br />
S&P rating of<br />
utilities)
As a whole, based on the metrics presented above, the gas distribution companies in the U.S.<br />
can be seen to be largely comparable to Enbridge and Union. Notably, all of the companies<br />
in sample group, with the exception of Arkansas Western Gas Company, Consumers<br />
Energy, and Avista Corp. have investment grade ratings from S&P as of the writing of this<br />
report.<br />
There are, however, a few notable differences between the Ontario utilities and those in<br />
other jurisdictions:<br />
• Size: Enbridge and Union are comparatively larger than the majority of the other<br />
companies in the data set, when using total customers and total gas throughput as a<br />
basis of comparison, as well as book value. 21<br />
• Diversification of Services and Non-regulated Affiliates: Certain companies in the group have<br />
diversified operations, including electric operations and non-regulated operations.<br />
This is in contrast to Enbridge and Union, which are almost 100 percent regulated<br />
gas distributors. As noted by DBRS, “Companies that generate most of their<br />
earnings from regulated activities are typically more stable and predictable than those<br />
that have significant non-regulated operations.” 22<br />
• Approach to Setting <strong>ROE</strong>: While <strong>ROE</strong> is an output of the rate-setting process, the<br />
approach used (formulaic versus case-by-case) may have some explanatory value in<br />
estimating investors’ expected returns. In particular, there is some evidence from the<br />
market that the use of a formula for setting <strong>ROE</strong> provides for a more certain return<br />
(inasmuch as the only variable is the forecasted bond yield) than the case-by-case<br />
approach, regardless of the outcome of the calculation.<br />
For instance, S&P, in a review of Ontario’s electric utilities, recently stated:<br />
The stability, transparency, consistency, and timeliness of the Ontario<br />
regulatory regime and framework have been steadily improving as a<br />
result of ongoing amendments to the Ontario Energy Board Act…The<br />
OEB’s decision to maintain its 1998 formula for determining <strong>ROE</strong>s<br />
21 For entities for which book value was not available (i.e., subsidiaries of larger companies for which SEC<br />
reported financials are not available), CEA estimated book value by utilizing the book value of the parent<br />
company or reporting entity, and applying it to the subsidiary based upon an approximation of the<br />
subsidiary’s relative size to the larger company.<br />
22 Dominion Bond Rating Service, “Rating <strong>Utilities</strong> (Electric, Pipelines & Gas Distribution)”, March 9, 2005.<br />
Page 32
allowed for in the rate-setting process, while disappointing for equity<br />
holders and not likely to encourage privatization, is another example of<br />
stability and consistency.” 23<br />
Inherent in these comments is the distinction between debt holders, who<br />
place significant emphasis on certainty, and equity investors, who are equally<br />
concerned with the adequacy of their return.<br />
Additionally, in a presentation at a CAMPUT meeting in January of 2005,<br />
S&P cited regulatory clarity and certainty as affecting business risk and thus<br />
credit ratings. 24<br />
CIBC World Markets mirrored these statements in a recent research report<br />
on Spectra Energy Corporation, the parent of Union Gas. CIBC referred to<br />
Spectra overall as operating in a “stable” regulatory environment, and added,<br />
“Investments in Union Gas are low risk with capital cost and return on this<br />
capital pre-approved by the regulator. As such, we see Union Gas’ regulated<br />
operations outside of storage as having a low earnings growth profile but a<br />
low-risk profile as well that generates stable cash flow.” 25<br />
Thus, as shown above, market analysts look favorably upon regulatory<br />
certainty, but it should be noted that the predictability of authorized returns<br />
does not outweigh the necessity of an adequate return to attract needed<br />
capital.<br />
• Market Dynamics in Non-Canadian and Non-U.S. Countries: While Canada and<br />
the U.S. are considered highly comparable, both economically and in terms<br />
of regulatory structure, there are fundamental differences in market dynamics<br />
23 Standard & Poor’s, “Shining a Light on the Positive Outlooks for Ontario Electricity Distributors,” March<br />
26, 2007.<br />
24 Standard & Poor’s, “Attracting <strong>Capital</strong> – How Does Canada’s Regulatory Environment Compare<br />
Internationally,” CAMPUT Financial Seminar, January 14, 2005. It should be noted, also, that in the same<br />
presentation, S&P cited Canadian regulatory boards as a whole as providing for relatively more<br />
“consistency and predictability” than other countries’ regulators, although Canadian regulators are, “slow<br />
to adapt to changes in external factors.”<br />
25 CIBC World Markets, “Spectra Energy Corporation, Attractive Energy Infrastructure Play; Commodity<br />
Headwinds a Near-term Issue,” January 11, 2007.<br />
Page 33
in the other countries that CEA investigated (i.e., the U.K., Australia, and the<br />
Netherlands). Whether it be regulatory framework (gas distributors in the<br />
U.K., Australia, and the Netherlands are currently operating under differing<br />
forms of price control regulation), ownership structure (the majority of gas<br />
utilities in the Netherlands are municipally owned, while all of the U.K. –<br />
approximately 22 million gas distribution customers – was until recently<br />
served by a single company, National Grid 26 ), accounting rules, geography<br />
and climate, or other factors, the differing markets and regulatory<br />
environments in which these countries’ gas distributors operate weaken the<br />
basis for comparison.<br />
Revised Comparison<br />
To further the analysis, CEA developed a more refined comparison group that could be<br />
considered to be more similar to Enbridge and Union based upon size and corporate<br />
structure (as measured by percentage of unregulated operations). By excluding certain less<br />
comparable companies, the resulting group could be considered to have business and<br />
operating profiles more similar to the Ontario utilities. It is important to note that the<br />
resulting group of eight “comparable companies” is not equivalent to a “proxy group” of<br />
comparable companies typically used in <strong>ROE</strong> analysis. In regards to the latter, in estimating<br />
the <strong>ROE</strong> for a company, a group of publicly-traded companies displaying similar<br />
characteristics to the subject company is analyzed using one or more of the approaches<br />
discussed above (i.e., the DCF, CAPM, etc.) to develop a range of reasonable <strong>ROE</strong>s. In this<br />
case, however, we are beginning with a group of companies for which the <strong>ROE</strong> has already<br />
been estimated (i.e., the allowed <strong>ROE</strong>), and then narrowing that group down to a subset of<br />
companies that are comparable to Enbridge and Union, based on certain criteria. Due to the<br />
fact that the data set is highly dependent on which companies have been awarded <strong>ROE</strong>s in<br />
the recent past, and also contains a large number of subsidiary companies for which accurate<br />
26 The current cost of capital in the U.K. was established in 2000/2001. In 2005, National Grid divested a<br />
large portion of its operating segments, cutting National Grid’s distribution segment in half. The U.K. gas<br />
distribution price control, along with the associated cost of capital, however, was kept in place for the<br />
legacy companies. The fact that the cost of capital was set under a significantly different market structure,<br />
and is currently under review in the U.K., may indicate that the allowed <strong>ROE</strong> in the U.K. is not indicative<br />
of current market dynamics.<br />
Page 34
financial and operational data is unavailable, it can not be expected that this “comparables<br />
group” would yield definitive <strong>ROE</strong> results against which to benchmark Enbridge and<br />
Union’s allowed returns. The purpose of this analysis, therefore, is not to provide an<br />
implied range of reasonable <strong>ROE</strong>s to apply to Enbridge and Union, but rather to more<br />
accurately quantify the existing difference in allowed <strong>ROE</strong>s.<br />
This group of eight companies met the following criteria:<br />
(1) Either between 500,000 to 2,200,000 gas distribution customers, or between<br />
three to approximately ten billion cubic meters in annual gas throughput (or<br />
both);<br />
(2) Gas operations contribute at least approximately 40 percent of total<br />
revenues;<br />
(3) A minimum BBB- (i.e., investment grade) credit rating from S&P; and<br />
(4) The companies currently have no earnings sharing mechanism in place.<br />
Similar to Enbridge and Union, therefore, shareholders are at risk for any<br />
deficiency in earnings below the allowed return, but also get to keep any<br />
amount exceeding the return.<br />
Based on these screening criteria, the narrowed group of U.S. utilities contained the<br />
following companies 27 :<br />
• Southwest Gas Corp. (Arizona)<br />
• Atlanta Gas Light Company (Georgia)<br />
• Northern Illinois Gas Company (Illinois)<br />
• Michigan Consolidated Gas Company (Michigan)<br />
• CenterPoint Energy Resources (Minnesota)<br />
• Public Service Electric Gas (New Jersey)<br />
• Puget Sound Energy, Inc. (Washington)<br />
• Wisconsin Gas LLC (Wisconsin)<br />
27 With the exception of Atlanta Gas Light Company, all the companies in the narrowed group entered into<br />
their most recent rate proceeding under their own volition, generally seeking increases in rates. Atlanta<br />
Gas Light Company had a three-year performance-based ratemaking (“PBR”) mechanism in place for the<br />
period of 2002 to 2005, after the expiration of which it was required to file a rate case. The PBR plan was<br />
not re-authorized.<br />
Page 35
The resulting <strong>ROE</strong> from this revised group is 10.40 percent with a 46.44 percent equity<br />
ratio, as shown in Table 9.<br />
TABLE 9: MOST RECENT <strong>ROE</strong> AWARDS FOR U.S. GAS UTILITIES<br />
Sample Group 2007 <strong>ROE</strong><br />
Entire Group of 34 U.S. Companies 10.35% / 48.00%<br />
Revised Group of 8 U.S. Companies 10.40% / 46.44%<br />
Conclusion Regarding Company-Specific Data<br />
The first conclusion that can be drawn from the comparison of financial and operational<br />
profiles of gas distribution companies in Canada and the U.S. is that there are many<br />
similarities between these two groups of companies (i.e., Canadian and U.S. gas distributors),<br />
and the ranges of sizes, types and number of customers, and credit ratings largely overlap.<br />
The largest difference, as shown in Table 8, is in amount of gas throughput. Enbridge, a<br />
pure distribution company, has nearly double the average gas throughput for the eight U.S.<br />
comparable companies, and Union’s distribution throughput is similarly greater than that of<br />
the U.S. group. However, while this is one measure of the size of the companies, based on<br />
other metrics of size, such as book value and total revenue, the groups can be seen to be<br />
similar, especially in a direct comparison of Union to the U.S. companies. In other words, it<br />
does not appear that the Ontario gas distributors taken together are notably less risky from<br />
the standpoint of business and operational risk, and any differences in the metrics studied<br />
above do not appear to justify the overall <strong>ROE</strong> differential.<br />
The second conclusion that can be drawn stems from the fact that, when certain less<br />
comparable companies were excluded from the overall U.S. group, the average <strong>ROE</strong> remains<br />
essentially unchanged. What this tells us is that while the screening criteria employed are<br />
important in analyzing the risk of a regulated enterprise (for the reasons discussed earlier),<br />
the relative risk level of an individual utility is based on a combination of these and many<br />
other, sometimes subtle, differences in business and operating profiles.<br />
Page 36
In terms of the difference between Ontario gas distributors and other Canadian gas<br />
distributors, it is important to note that differences in allowed <strong>ROE</strong>s are largely a function of<br />
equity risk premiums set at various points in time over the last ten years, and are subject to<br />
different provincial regulatory environments and business risks.<br />
Due to the fact that company-specific data do not appear to explain the gap between inter-<br />
jurisdictional <strong>ROE</strong>s, CEA expanded the analysis to include territory and country-specific<br />
factors, as discussed below. Specifically, CEA addressed: (1) differences in rate design and<br />
rate stabilizing mechanisms; and (2) macro-economic factors.<br />
Jurisdictional Analysis<br />
• Rate Design and Rate Stabilization: A common risk for gas utilities is under or over-<br />
recovery of revenue from ratepayers owing to changes in consumption, and<br />
variability in commodity costs. In addition, utility earnings can vary owing to these<br />
and other un-forecasted changes in revenues and costs. Across the companies<br />
studied as part of this report, there are many different forms of rate and cost<br />
stabilization mechanisms aimed at ensuring the utilities will be better able to earn<br />
forecasted revenues and recover forecasted costs. For example, some of the<br />
companies have weather normalization clauses that protect them from climatic<br />
variability; others are allowed to employ rate stabilization and cost deferral accounts<br />
to ensure rate and cost recovery.<br />
In a determination of the effect on earnings of different rate and earnings<br />
stabilization methods, weighing the various stabilizing mechanisms employed in the<br />
different jurisdictions against one another may not result in an “apples to apples”<br />
comparison, especially if all of the counterbalancing components of a company’s rate<br />
design are not taken into account. Thus, to test whether the Ontario gas distributors<br />
have on the whole more stable earnings than their U.S. counterparts (and thus could<br />
be considered less risky), CEA analyzed recent earnings history for Enbridge and<br />
Union (as provided by the companies), as well as a group of U.S. gas utilities, to<br />
determine if there was a difference in variability in actual returns to equity holders.<br />
Page 37
As noted previously, there is not historical financial data readily available for the<br />
eight U.S. comparable companies since the majority of them are subsidiaries of larger<br />
holding companies. Thus, as a proxy for this group, CEA used the 15 gas utilities<br />
classified by Value Line as Natural Gas Distribution companies, as the required data<br />
is readily available. From this group, CEA removed two companies, Southern Union<br />
and UGI Corp., because they had relatively low percentages of gas operations as<br />
compared to total operations, and thus their earnings variability may be unduly<br />
affected by electric or other operations. 28 Chart 9 shows the variance in actual <strong>ROE</strong><br />
for Enbridge, Union, and the 13 U.S. companies for the period 1997 to 2006.<br />
Std. Dev.<br />
-<br />
CHART 9: ACTUAL <strong>ROE</strong> VARIABILITY FOR ONTARIO AND U.S. GAS<br />
DISTRIBUTORS, 1997 TO 2006<br />
0.045<br />
0.040<br />
0.035<br />
0.030<br />
0.025<br />
0.020<br />
0.015<br />
0.010<br />
0.005<br />
Union<br />
Enbridge<br />
AGL Resources<br />
Ave. for U.S.<br />
(.020)<br />
Atmos Energy<br />
Cascade Natural Gas<br />
Keyspan Corp<br />
Laclede Group<br />
Page 38<br />
New Jersey Res.<br />
Nicor, Inc.<br />
N.W. Nat'l Gas<br />
Piedmont Nat'l Gas<br />
SEMCO Energy<br />
So. Jersy Inds.<br />
Southwest Gas<br />
WGL Holdings<br />
As shown in Chart 9, while the variability in <strong>ROE</strong> for the U.S. companies, as<br />
measured by the standard deviation in <strong>ROE</strong>, encompasses a large range of results<br />
(from .0084 to .0389), the average of .020, as measured by the square root of the<br />
mean variance, is not significantly different than that of Enbridge, while it is greater<br />
than that of Union. If SEMCO, a clear outlier, were to be removed from the U.S.<br />
group, the average would decrease to .018. Additionally, more than one-fourth of<br />
the U.S. companies (four of 13), fall at or below Union. Thus, while volatility in<br />
28 Southern Union reported, on average for 2005 and 2006, 36% of revenues and -11% of operating income<br />
to be earned from gas distribution operations. Similarly, UGI, on average over the past two years, derived<br />
only 11% of revenue and 17% of net income from their gas utility business.
earnings may affect the individual risk of U.S. utilities, or Ontario utilities for that<br />
matter, there is not a consistent difference across the markets that would explain the<br />
market-wide difference in average allowed <strong>ROE</strong>s.<br />
As mentioned above, differences in volatility of actual <strong>ROE</strong>s between individual<br />
utilities can be attributed to a myriad of factors. These include but are not limited to:<br />
regulatory environment, revenue stabilization mechanisms (e.g., weather<br />
normalization adjustments), operational environments, growth rates of territory and<br />
local economies, capital expenditures and associated uncertainties (e.g., expansion<br />
projects), stability and significance of other business units, and corporate<br />
management. 29 The analysis performed above, as presented in Chart 9, was designed<br />
to account for the sum total of all of these factors on earnings, as opposed to<br />
weighing the individual influence of any one risk factor. For instance, in New Jersey,<br />
both New Jersey Resources and South Jersey Industries implemented conservation<br />
incentive programs in 2006, allowing the companies to promote energy conservation<br />
while insulating them from the negative impact of reduced customer usage (as a<br />
result of warmer weather, higher prices, or more efficient heating equipment, etc.).<br />
However, actual returns for New Jersey Resources decreased by 4.50 percent in<br />
2006, from 17.00 percent to 12.50 percent, while those for South Jersey Industries<br />
increased by 3.90 percent, from 12.40 percent to 16.30 percent. Assuming the<br />
conservation incentive programs would have similar effects on each company’s<br />
earnings, this difference in the directional movements of actual <strong>ROE</strong>s must be due<br />
to other factors. This demonstrates the need to analyze the overall effect of the<br />
many competing influences listed above in establishing the relative risk of a gas<br />
utility.<br />
As noted above, the variability in earnings, measured by standard deviation, among<br />
the U.S. gas distributors in this analysis, ranges from 0.0084 (Piedmont) to .0389<br />
(SEMCO). A similarly wide range of U.S. allowed <strong>ROE</strong>s was noted earlier in this<br />
29 While ability to recover commodity costs would also influence earnings, it is CEA’s understanding that<br />
these 13 U.S. companies studied, as well as Union and Enbridge, all have at least some form of gas cost<br />
recovery mechanisms in place.<br />
Page 39
eport. This may be explained in part by differences in approach to <strong>ROE</strong> setting in<br />
the U.S. versus Canada. Generally, U.S. commissions rely on the qualitative aspects<br />
of the rate proceeding, as well as quantitative aspects. Moreover, the lesser<br />
frequency of rate proceedings in the U.S. often requires consideration of the<br />
projection of capital requirements beyond one year in determining <strong>ROE</strong>. This is in<br />
contrast to the approach most widely used in Canada, whereby <strong>ROE</strong> is adjusted<br />
annually based on a purely quantitative calculation.<br />
Economic Analysis<br />
• Tax Law: Tax law can play a role in investors’ expected returns, particularly as it<br />
relates to the taxation of dividends. This is especially true for utilities, as they<br />
typically have relatively high dividend payout ratios. Canada and the U.S. have<br />
varying degrees of favorable tax rates or tax credits related to dividend payments to<br />
individuals. In Canada, for instance, while corporations pay dividends with after-tax<br />
income, individuals receive a tax credit related to dividend income. Under the 2005<br />
enhanced dividend tax credit, individuals receive a non-refundable tax credit of more<br />
than one-fourth of the dividend value. Depending on an individual’s marginal tax<br />
rate, the dividend tax credit can result in effective tax rates on dividends as low as 3<br />
percent, but up to 30 percent. In the U.S., most dividends are taxed at a maximum<br />
rate of 15 percent for individuals (referred to below as the “dividend tax cut”)<br />
effective with the passage of the Jobs and Growth Tax Relief Reconciliation Act of<br />
2003. This favorable rate is currently set to expire after 2010, if not renewed.<br />
It is important to note that the tax advantages related to dividends may be<br />
diminished or not available to international investors. Cross-border taxation of<br />
dividends also differs depending on the direction of the investment (i.e., a U.S.<br />
investment in a Canadian security, a Canadian investment in a U.K. security, etc.), as<br />
well as the type of account in which the investment is held (i.e., retirement versus<br />
taxable). 30 Similarly, institutional investors tend to constitute a large portion of utility<br />
30 For a description of cross-border taxation of dividends, see, Susan E.K. Christoffersen, et al., “Crossborder<br />
dividend taxation and the preferences of taxable and nontaxable investors: Evidence from Canada,” Journal<br />
of Financial Economics, August 24, 2004.<br />
Page 40
stock ownership of U.S. utilities. Since many of those institutions are tax-exempt<br />
investors, it is not clear that the dividend tax cut beneficially affected all utility<br />
investors. Moreover, many U.S. investors hold utility stocks in tax-advantaged 401-k<br />
accounts; here again, the effect of the dividend tax cut on current income is not<br />
definitive.<br />
Thus, the true effect of dividend taxation, if any, requires knowledge of the<br />
individual investor’s tax position. In and of itself, it is not evident that the dividend<br />
tax rules in one country versus another would lead to differences in <strong>ROE</strong> on a<br />
comparative basis.<br />
• Other Macroeconomic Factors: Table 10 provides data for Canada and the U.S. regarding<br />
indicators of economic growth and stability, as well as market returns.<br />
Page 41
TABLE 10: MAC<strong>ROE</strong>CONOMIC FACTORS 31<br />
GDP Growth<br />
Canada U.S.<br />
Return on: CPI<br />
S&P/TSX<br />
(TSE 300)<br />
S&P 500 Canada U.S.<br />
1981 3.05 2.50 (0.14) (0.10) 12.40 10.32 0.83<br />
1982 (2.94) (1.90) 0.02 0.15 10.90 6.16 0.81<br />
1983 2.75 4.50 0.29 0.17 5.80 3.21 0.81<br />
1984 5.67 7.20 (0.06) 0.01 4.30 4.32 0.77<br />
1985 5.40 4.10 0.21 0.26 4.00 3.56 0.73<br />
1986 2.64 3.50 0.06 0.15 4.10 1.86 0.72<br />
1987 4.10 3.40 0.03 0.02 4.40 3.65 0.75<br />
1988 4.86 4.10 0.07 0.12 4.00 4.14 0.81<br />
1989 2.54 3.50 0.17 0.27 5.00 4.82 0.85<br />
1990 0.27 1.90 (0.18) (0.07) 4.80 5.40 0.86<br />
1991 (1.87) (0.20) 0.08 0.26 5.60 4.21 0.87<br />
1992 0.91 3.30 (0.05) 0.04 1.50 3.01 0.83<br />
1993 2.30 2.70 0.29 0.07 1.80 2.99 0.78<br />
1994 4.73 4.00 (0.02) (0.02) 0.20 2.56 0.73<br />
1995 2.77 2.50 0.12 0.34 2.20 2.83 0.73<br />
1996 1.54 3.70 0.26 0.20 1.60 2.95 0.73<br />
1997 4.37 4.50 0.13 0.31 1.60 2.29 0.72<br />
1998 3.31 4.20 (0.03) 0.27 0.90 1.56 0.67<br />
1999 4.54 4.50 0.30 0.20 1.70 2.21 0.67<br />
2000 4.68 3.70 0.03 (0.10) 2.70 3.36 0.67<br />
2001 1.50 0.80 (0.14) (0.13) 2.60 2.85 0.65<br />
2002 3.90 1.60 (0.14) (0.23) 2.20 1.58 0.64<br />
2003 2.60 2.50 0.24 0.26 2.80 2.28 0.72<br />
2004 2.50 3.90 0.12 0.09 1.90 2.66 0.77<br />
2005 3.10 3.20 0.22 0.03 2.20 3.39 0.83<br />
2006 1.90 3.30 0.15 0.14 2.00 3.23 0.88<br />
25 Year Ave. 2.74 3.12 0.08 0.11 3.58 3.52<br />
10 Year Ave. 3.24 3.22 0.09 0.08 2.06 2.54<br />
5 Year Ave. 2.80 2.90 0.12 0.06 2.22 2.63<br />
Standard Deviation 0.145 0.152<br />
Correlation<br />
0.81 0.65 0.87<br />
Page 42<br />
Exchange<br />
Rate<br />
As can be seen in Table 10, the correlation between GDP growth in the two countries is<br />
quite high, as is the correlation between the consumer price indices for each country,<br />
indicating that these metrics tend to vary together over time between the two countries. For<br />
returns on broad market indices (i.e., the Toronto Stock Exchange/S&P and the S&P 500),<br />
the correlation is not as robust; however, there still is a strong positive correlation. In<br />
addition, the returns on these two indices show a similar volatility as measured by their<br />
standard deviations. Based on these macroeconomic factors, there are no obvious<br />
31 Sources: Canada GDP, Exchange Rate, and CPI – Statistics Canada as of April 17, 2007; U.S. GDP – U.S.<br />
Bureau of Economic Analysis as of March 29, 2007; S&P 500 returns – Yahoo! Finance; S&P/TSX (TSE<br />
300) –Yahoo! Finance (2000-2007), finance.sauder.ubc.ca/courses/comm472/TSE300.xls (pre-2000); U.S.<br />
CPI – U.S. Bureau of Labor Statistics.
dissimilarities between Canada and the U.S. (i.e., in terms of volatility in growth, inflation, or<br />
exchange rates) which could explain significant differences in investors’ expectations. Based<br />
on the past five years, investors in the Toronto exchange stocks have enjoyed a six percent<br />
greater return than those investing in the U.S. S&P 500. Over the long term, however,<br />
returns in the respective markets have been more similar. Furthermore, the magnitude and<br />
significance of trade between the two countries would indicate the integration of the two<br />
markets. In 2006, Canada exported 81.6 percent of its total exports to the U.S. and<br />
imported from the U.S. 54.9 percent of its total imports. 32<br />
32 Strategis, Industry Canada, February 2007.<br />
Page 43
V. COMPETITION FOR CAPITAL IN CANADA VERSUS THE U.S.<br />
A company’s access to capital is a key consideration in setting a fair return. Without access<br />
to capital (at reasonable cost rates), a utility would be challenged to maintain its basic<br />
systems, and ultimately system integrity would be jeopardized, let alone any future capital<br />
expansion plans. Companies obtain capital in a variety of ways, through debt or equity<br />
issuances, or in the form of equity infusions from their parent. Regardless of where capital is<br />
coming from, there is a cost for providing that capital that compensates either the creditor,<br />
the investor, or the parent for the risk they take on in providing capital to the entity, and that<br />
compensation should be no less than what could be received by an alternative investment<br />
target of comparable risk.<br />
This section of the report examines whether capital for utility investment between the<br />
Canadian and U.S. markets is integrated, and whether Canadian companies must compete<br />
with U.S. companies for capital. To answer this question, consideration has been given to<br />
three primary questions: (1) Are there fundamental differences between the securities<br />
markets of the U.S. and Canada that would result in corresponding differences in the<br />
countries’ required returns? (2) Do the investment bases in U.S. and Canadian gas utilities<br />
suggest that the markets are integrated? (3) Is capital migrating to jurisdictions with the<br />
higher returns? In the following section, those questions will be analyzed and discussed.<br />
International Market Return on Equity – Canada vs. U.S.<br />
Morningstar, Inc. (formerly Ibbotson Associates) identifies several methods for determining<br />
the international cost of capital, highlighting differences between countries. Of those<br />
methodologies described by Morningstar, four are employed below to ascertain if there are<br />
fundamental differences in the required returns between Canada and the U.S. that are<br />
attributable to the countries’ equity markets themselves. Such differences would address<br />
inflation, political risk, exchange rate risk, and other macroeconomic factors.<br />
The first methodology employed is the “International CAPM”. Morningstar states that the<br />
principles of the CAPM can also be applied to the international market. The definition of<br />
the market portfolio can be expanded to include the equity markets of all countries of the<br />
Page 44
world. Morningstar’s International CAPM model uses the country specific risk free rate and<br />
Beta, and uses an equity risk premium calculated on a world wide basis. 33 Beta is estimated<br />
using the world equity market as the benchmark. Morningstar determined the world equity<br />
risk premium to be 7.73 percent, and the Betas for the U.S. and Canada are determined to be<br />
0.99 and 0.96, respectively. 34 Using both countries current respective long term government<br />
bonds for the risk free rate results in an <strong>ROE</strong> for the U.S. of 12.45 percent and for Canada,<br />
11.62 percent, 83 basis points below the U.S. 35 :<br />
U.S. CAPM = 4.80 + 0.99 (7.73) = 12.45%<br />
Canada CAPM = 4.20 + .96 (7.73) = 11.62%<br />
A second approach to estimating the required return in international markets, put forward by<br />
Morningstar, is the “Country Risk Rating Model”, which takes into account a forward-<br />
looking measure of risk for alternative markets. This approach uses a linear regression<br />
model on a sample of returns as the dependent variable and the natural log of country credit<br />
ratings as the independent variable. This analysis indicates that the U.S. required equity<br />
return should be 16 basis points lower than that of the Canadian return, based upon the<br />
relationship of the relative country credit rating and historical returns:<br />
U.S. credit rating = 94.5, U.S. required equity return = 10.60% 36<br />
Canada credit rating = 93.7, Canadian required equity return = 10.76% 37<br />
A third approach to estimating the international required return on equity, according to<br />
Morningstar, uses a spread methodology, between countries. This approach adds a country<br />
specific spread to a cost of equity determined from more conventional means. The spread<br />
between long term government bonds is added or subtracted to the U.S. cost of equity<br />
estimate obtained through a normal CAPM assuming a market Beta of 1.00. This approach<br />
results in a 60 basis point spread, where the U.S. long term government bond is 60 basis<br />
points above its Canadian counterpart:<br />
33 Morningstar relied upon the Morgan Stanley <strong>Capital</strong> International (MSCI) world index as a proxy for<br />
world markets, see SBBI Morningstar 2007 Yearbook, Valuation Edition, at p. 178.<br />
34 SBBI Morningstar 2007 Yearbook, Valuation Edition, at p. 179.<br />
35 Taking the average monthly bond yield for the preceding 12 months, results in increases in the U.S. and<br />
Canada risk free rates of 5 basis points and 4 basis points, respectively, resulting in a negligible impact on<br />
the <strong>ROE</strong>. Hence, for purposes of this analysis, current spot yields are reasonably representative of 12<br />
month averages.<br />
36 SBBI Morningstar 2007 Yearbook, Valuation Edition, at p. 181.<br />
37 Ibid.<br />
Page 45
U.S. Required Equity Return = 4.80 + 1 (7.13) = 11.93%<br />
Spread = U.S. 30-Year Treasuries – Canada Long Bond = 4.80% - 4.20% =<br />
0.60%<br />
Canadian Equity Return = 11.93% - .60% = 11.33%<br />
The last of the methodologies proposed by Morningstar is a “Relative Standard Deviation<br />
Model”. In this model, the standard deviation of international markets is indexed to the<br />
standard deviation of the U.S. market. Countries with higher standard deviations than the<br />
U.S. are given a higher equity risk premium in proportion to their relative standard deviation.<br />
Morningstar’s study indicates that the Canadian standard deviation relative to the U.S.<br />
market is 1.25 38 , hence Canada’s risk premium should be the product of the U.S. risk<br />
premium and the Canada/U.S. index, or 7.13 x 1.25 = 8.91. This increased risk premium<br />
would yield a higher Canadian return than that in the U.S. by 117 basis points (13.11 percent<br />
- 11.94 percent), derived below:<br />
U.S. Required Equity Return = 4.80 + 1 (7.13) = 11.93%<br />
Canadian Required Equity Return = 4.20 + 1(8.91) = 13.11%<br />
The four Morningstar approaches identified above are summarized in the Table 11:<br />
TABLE 11: INTERNATIONAL COST OF CAPITAL SUMMARY<br />
Morningstar Methodology U.S. Return Canadian<br />
Return<br />
Page 46<br />
Difference<br />
International CAPM 12.45% 11.62% 0.83%<br />
Country Risk Rating Model 10.60% 10.76% (0.16%)<br />
Country-Spread Model 11.93% 11.33% 0.60%<br />
Relative Standard Deviation Model 11.93% 13.11% (1.18%)<br />
Average – Arithmetic 11.73% 11.71% 0.02%<br />
Average – Geometric 11.71% 11.67% 0.04%<br />
As Table 11 indicates, the four international cost of capital methodologies yield diverse<br />
results depending on the drivers of the methodology employed (i.e., bond yields or relative<br />
risk metrics), with results ranging from a Canadian required return exceeding the U.S.<br />
required return by 118 basis points, to a U.S. required return exceeding the Canadian<br />
38 Ibid., at p. 183.
equired return by 83 basis points. However, the arithmetic and geometric average of all<br />
approaches indicate nearly identical results for both the Canadian and the U.S. required<br />
returns, with the average difference of all methods being between two and four basis points.<br />
These results imply that the impact of the currently lower Canadian bond yield is offset by<br />
the increased relative risk of Canadian returns (as determined under these methodologies). 39<br />
As a result, there do not appear to be determinative market differences between the U.S.<br />
equities market and the Canadian equities market at this time to justify any sustained<br />
differences in required returns on equity.<br />
In a 2002 study performed by Dimson, Marsh and Staunton, the authors indicate that when<br />
deriving a forward looking projection of required return on equity from a purely historical<br />
estimate of the risk premium, it is necessary to “reverse-engineer” the facts that impacted<br />
stock returns over the past 102 years, backing out factors that could not be anticipated to be<br />
recurring in the future, such as unanticipated growth or diminished business risk through<br />
technological advances. To this point, the authors state:<br />
While there are obviously differences in risk between markets, this is unlikely<br />
to account for cross-sectional differences in historical premia. Indeed much<br />
of the cross-country variation in historical equity premia is attributable to<br />
country-specific historical events that will not recur. When making future<br />
projections, there is a strong case, particularly given the increasingly<br />
international nature of capital markets, for taking a global rather than a<br />
country by country approach to determining the prospective equity risk<br />
premium…<br />
...Indeed it is difficult to infer expected premia from any analysis of historical<br />
excess returns. It may be better to use a “normal” equity premium most of<br />
the time, and to deviate from this prediction only when there are compelling<br />
economic reasons to suppose expected premia are unusually high or low. 40<br />
The current disparity between Canadian and U.S. long term bond yields is informative at<br />
least in part in understanding the recent differences in authorized <strong>ROE</strong>’s in the U.S. and<br />
39 According to the Country Risk Rating Model and the Relative Standard Deviation Model Canadian returns<br />
should be higher than those of the U.S. Consideration of the lower Canadian bond yield in the<br />
International CAPM Model and the Country-Spread Model, indicates that Canadian returns should be<br />
lower than U.S. returns. As such, it appears that the higher risk of Canadian returns as evidenced by the<br />
credit rating and standard deviation of Canadian returns, is mitigated by the lower bond yield relative to<br />
that of the U.S.<br />
40 Elroy Dimson, Paul Marsh and Mike Staunton, Global Evidence on the Equity Risk Premium, Copyright<br />
September 2002.<br />
Page 47
Canada. Historically, however, as discussed below, these bond yields have been highly<br />
correlated, and based on historical performance, the current spread may not be sustainable.<br />
Bond Yields<br />
The correlation between the Canadian and U.S. Treasury bonds was noted by the NEB in its<br />
decision establishing an <strong>ROE</strong> formula for NEB-regulated pipelines. “[T]he Board is of the<br />
view that inflationary expectations in the U.S. are likely to put upward pressure on U.S.<br />
interest rates. This, in turn, is likely to exert upward pressure on Canadian interest rates.” 41<br />
While the spread between Canadian and U.S. long-term bond yields has averaged three and<br />
two basis points over the past five and ten-year periods, respectively (with Canadian bond<br />
yields exceeding U.S. yields, on average), Canadian bond yields have decreased relative to<br />
U.S. bond yields over the past year. In addition, the forecast ten-year bond rate is 4.15<br />
percent in Canada, as compared to the 4.85 percent forecast for the U.S. ten-year Note. 42<br />
Inasmuch as this spread is expected to continue, it accounts for some of the current<br />
difference in <strong>ROE</strong>s between Canada and U.S. However, as the two yields have historically<br />
been very highly correlated, with a minimal spread between them, the difference in yields<br />
may not persist over the long run.<br />
41 National Energy Board, Reasons for Decisions, RH-2-94, March 1995, at p. 6.<br />
42 The <strong>ROE</strong> formula in Ontario uses the average of the three and 12 month forward ten-year Canadian bond<br />
forecasts, plus the historical spread between the ten and the 30-year bonds. For an approximation of the<br />
ten-year U.S. Note forecast of 4.85 percent, CEA used an average of the three and 12 month forward tenyear<br />
Treasury Note as supplied by Blue Chip Economic Indicators, October 10, 2006.<br />
Page 48
CHART 10: COMPARISON OF YIELDS ON THE CANADIAN LONG-TERM BOND VS. THE<br />
U.S. 30-YEAR BOND<br />
8<br />
7.5<br />
7<br />
6.5<br />
6<br />
5.5<br />
5<br />
4.5<br />
4<br />
3.5<br />
3<br />
01/1997<br />
06/1997<br />
11/1997<br />
04/1998<br />
09/1998<br />
02/1999<br />
07/1999<br />
12/1999<br />
05/2000<br />
10/2000<br />
Investor Base of Canadian Gas <strong>Utilities</strong><br />
03/2001<br />
08/2001<br />
01/2002<br />
06/2002<br />
Page 49<br />
11/2002<br />
04/2003<br />
09/2003<br />
02/2004<br />
CND Long-Term<br />
US 30-Year<br />
CEA has found evidence that there is a high degree of integration of the capital markets<br />
between the U.S. and Canada, though there appears to be evidence of a “home country” bias<br />
for investors, in that investors tend to seek investments in their home countries before<br />
investing abroad, using foreign holdings as a means of balancing portfolios. This may be<br />
due in part to preferential tax treatment encouraging local investment or reluctance on the<br />
part of the investor to invest in unfamiliar territory. Nonetheless, there is substantial<br />
institutional investment flowing across borders.<br />
For example, according to a December 2003 CGA study, the average pension fund in<br />
Canada was invested 56 percent in equities and 44 percent in debt and other instruments, or<br />
roughly 60 percent equity and 40 percent debt. The assumed asset allocation was 35 percent<br />
Canadian equities, 12.5 percent U.S. equities, 12.5 percent International equities, and 40<br />
percent bonds. 43 Similarly, the capitalization of Enbridge further illustrates the bias towards<br />
43 Andrews, Doug, An Examination of the Equity Risk Premium Assumed by Canadian Pension Plan<br />
Sponsors, July 2004, at p. 4.<br />
07/2004<br />
12/2004<br />
05/2005<br />
10/2005<br />
03/2006<br />
08/2006<br />
01/2007
investing in local companies, as indicated by a breakdown of the investor base in Enbridge<br />
Inc. As can be seen in Chart 11, 75 percent of Enbridge Inc.’s equity investors are Canadian.<br />
However, the U.S. share of investment is still significant at 19 percent of Enbridge’s investor<br />
base. It is worthy to note that U.S. investors do play a significant role in the capitalization of<br />
Canadian companies. Even though the U.S. share is a minority, one could argue that in<br />
order to attract this incremental capital, Canadian companies are competing on the margin<br />
for the same capital as U.S. gas utilities.<br />
Canadian Retail<br />
25%<br />
CHART 11: ENBRIDGE INC. INVESTOR BASE 44<br />
Canadian Institutional<br />
50%<br />
Migration of <strong>Capital</strong> across U.S. and Canadian Border<br />
Page 50<br />
U.S. Institutional<br />
17%<br />
U.S. Retail<br />
2%<br />
European Institutional<br />
4%<br />
Management<br />
2%<br />
The question remains, if the current differences between the Canadian and the U.S. equities<br />
markets are completely offsetting, and there is significant integration between U.S. and<br />
Canadian markets, how is it that Ontario utilities are not required to meet U.S. higher returns<br />
to attract capital in Ontario? Through interviews with key market participants and<br />
representatives of customer groups, and other individuals with past involvement in <strong>ROE</strong><br />
44 Source: Enbridge Inc.
proceedings, as well as analysis of the factors discussed above, there appear to be four<br />
primary reasons why capital is retained in Canada: (1) the home country bias; (2) Canadians<br />
perceive the U.S. regulatory environment to be more unpredictable than the Canadian<br />
regulatory environment; (3) most Canadian investor owned utilities are part of a greater<br />
holding company structure, where the parent has an obligation to maintain system integrity;<br />
and (4) market participants recognize the reciprocity of the <strong>ROE</strong> adjustment mechanism,<br />
and believe that returns are currently at the bottom.<br />
On the issue of home country biases, some of the individuals among those surveyed for this<br />
study indicated that the average Canadian retail investor would not invest across the border<br />
to the U.S., despite the fact that returns might be higher. This may be due in part to tax<br />
incentives that are lost when investing in a foreign company. Further, pension funds have<br />
various internal restrictions that limit investment in foreign nations, to keep jobs and income<br />
in Canada. As such, large investors such as pension funds and mutual funds have<br />
prescribed investment levels in foreign markets.<br />
To the second point of relative risk between the Canadian and the U.S. regulatory<br />
environments, certain of the individuals who were interviewed as part of this study alluded<br />
to the greater unpredictability of the U.S. regulatory environment versus that of Canada.<br />
The California energy crisis and changing and evolving regulatory structures in the U.S. were<br />
mentioned in discussions of relative risk of the U.S. versus the Canadian utility markets. It<br />
seems that despite the lower <strong>ROE</strong>s, the Canadian regulators are perceived by investors and<br />
analysts as being highly supportive. Some participants offered that even though current<br />
<strong>ROE</strong>s in Ontario were low, the protection afforded by the OEB to enable the utility to<br />
actually earn the authorized return was much more certain than in the U.S. Nothing was<br />
identified in this analysis to justify a differential between U.S. and Canadian returns on the<br />
basis of relative risk. Nonetheless, Canadian investors apparently perceive greater risk in<br />
investing in a U.S. utility versus that of a Canadian utility, and prefer to hold investments in<br />
their home country, where they believe returns are currently low but are not subject to the<br />
same risks of non-recovery as those of U.S. returns.<br />
Page 51
With respect to the third point, the natural gas distribution sector in Ontario and throughout<br />
much of Canada is comprised of several gas utilities that are part of a larger holding<br />
company structure. Though utilities that are part of a holding company structure may issue<br />
debt at the utility level, the flow of equity capital to these utilities typically comes from the<br />
parent in the way of equity infusions. While it is true that companies in a holding company<br />
structure compete for capital in much the same way as stand alone companies, an equity<br />
holder in a stand alone company can sell that investment, whereas there is little risk that<br />
utilities in a holding company structure would not be provided adequate capital by the parent<br />
to sustain their operations.<br />
As many market participants stated during the survey phase of this study, a company makes<br />
a strategic commitment when deciding to invest in gas distribution in Canada. Most of the<br />
holding companies with Canadian utilities have diverse energy portfolios with a blend of<br />
returns. Even in an environment of lower allowed returns, key market participants indicated<br />
that they would either stay the course and provide all the capital necessary to provide a safe<br />
and efficient gas distribution system, or they would make a case to the regulatory authorities<br />
for regulatory relief. Few market participants indicated that they would divert capital to<br />
higher return jurisdictions, in order to minimize the effect of low returns. None indicated<br />
that they had considered abandoning utility operations in Canada due to the current return<br />
environment. As one key market participant stated, “you are either in the game or you are<br />
not”. Thus, the regulator is largely in the driver’s seat in this relationship, relying on<br />
principals of a fair return in setting allowed returns.<br />
With respect to the final point, market participants recognize the symmetrical nature of the<br />
OEB adjustment mechanism and believe that interest rates are at historical lows and<br />
eventually will rebound. As demonstrated earlier in this report, the <strong>ROE</strong> adjustment<br />
mechanism may in fact be approaching its lowest point and its greatest disparity from U.S.<br />
returns. While CEA did not perform an analysis of the effect of allowed returns on the<br />
financial integrity of regulated utilities or on customers’ rates, we do note that, all else being<br />
equal, at extremely low interest rates and correspondingly low returns, unexpected earnings<br />
variations (i.e., deviations from those conditions that would have been anticipated when<br />
Page 52
setting rates) will generally have a more pronounced effect on the financial condition of the<br />
utilities, as those deviations would be applied to a smaller earnings base. Accordingly, in an<br />
extreme low (or high) interest rate environment (i.e., at those points in which the <strong>ROE</strong>s in<br />
Canada and the U.S. would most greatly diverge), further consideration is warranted to<br />
assess whether the allowed return is consistent with the established standards.<br />
Page 53
VI. COMPETITION FOR CAPITAL FOR STAND-ALONE COMPANIES VERSUS<br />
SUBSIDIARIES<br />
In general, subsidiaries of larger corporations compete for capital in much the same way that<br />
stand-alone entities would. Specifically, investment decisions at the parent level involve<br />
seeking a certain amount of return for a given amount of risk, much the same as investment<br />
decisions are made by investors when buying stakes in stand-alone companies or purchasing<br />
assets. Inasmuch as one subsidiary can provide a better return to the parent than another<br />
subsidiary of comparable risk, it is reasonable to assume the parent would prefer to invest in<br />
the more profitable company, all else being equal.<br />
One important distinction, however, between stand-alone and subsidiary investments is the<br />
difference in relative liquidity of the investments. A parent company may have to accept<br />
lower returns from a subsidiary than it would demand from “outside”, or third party,<br />
investments, especially if the parent has no easy, cost-effective method for exiting the<br />
business. In the words of one industry participant, a parent company is not going to let a<br />
subsidiary “flounder” because it offers substandard returns. In some ways, this effect is<br />
compounded for a utility company, in that it must maintain safe, dependable operations.<br />
However, a parent company would most likely seek to minimize additional capital<br />
investment in its underperforming subsidiary if a more attractive return were available<br />
elsewhere.<br />
Additionally, affiliated companies can generate certain types of tax savings that stand-alone<br />
entities cannot. These tax savings can materialize in the form of one affiliated company<br />
being able to offset its taxable income with a loss from the operations of another affiliate. It<br />
is important to realize, however, that these tax savings do not affect the relative risk of the<br />
individual affiliated companies, and there is much debate as to the degree that these savings<br />
can and should affect the cost of capital at the subsidiary level. 45<br />
To test whether a “stand-alone” premium exists within the companies studied as part of this<br />
report, CEA segregated the Canadian and U.S. companies into stand-alone and subsidiary<br />
45 Please note that CEA is not offering an opinion regarding the issue of consolidated taxes as it pertains to<br />
utility rate-making in this report.<br />
Page 54
groupings. As stated previously, there are a multitude of jurisdictional and company-specific<br />
business, operating, financial, and regulatory risks that must be taken into consideration<br />
when evaluating individual utility <strong>ROE</strong>s and estimating the equity returns expected by<br />
investors. However, because the data set used comprises the entire population of recently<br />
set <strong>ROE</strong>s for gas distribution companies in Canada and the U.S., CEA used this as a starting<br />
point to determine if any discernible trend exists. A summary of these results is presented in<br />
Table 12.<br />
TABLE 12: <strong>ROE</strong>S FOR STAND-ALONE VERSUS SUBSIDIARY COMPANIES<br />
Utility Group Stand-Alone Subsidiary<br />
Canada 8.94% (average for PNG<br />
companies)<br />
Page 55<br />
8.62% (7 subsidiaries)<br />
U.S. 9.86% (6 companies) 10.46% (28 subsidiaries)<br />
As shown, the lone stand-alone company in Canada, Pacific Northern Gas (“PNG”), has, on<br />
average for its operating divisions, a higher allowed <strong>ROE</strong> than the remainder of the<br />
Canadian utilities, all of which are subsidiaries of larger corporations. 46 It should be noted,<br />
however, that PNG, with its three gas distribution companies, is known as being generally<br />
riskier than other Canadian utilities, due to its relative small size and reliance on large<br />
customers.<br />
Conversely, in the U.S., over the last two years, stand-alone companies have, on average,<br />
been awarded lower <strong>ROE</strong>s than subsidiary companies. The spread between the mean <strong>ROE</strong>s<br />
of these two groups is 60 basis points. These conflicting results demonstrate two things: (1)<br />
that while corporate structure may influence <strong>ROE</strong>, its effect is not consistent within this<br />
group of companies; and (2) there are many other factors with greater effects on <strong>ROE</strong>. This<br />
result is consistent with the “independent firm approach” to ratemaking, whereby the<br />
subsidiary is treated as if it was an independent firm and requires the subsidiary to earn its<br />
stand-alone cost of equity. Required rates of return are thus considered a function of the<br />
risk of the asset, regardless of stock ownership.<br />
46 PNG is comprised of three divisions each with separate <strong>ROE</strong>s. However, as PNG has no other active<br />
operations, the company is considered “stand-alone” for purposes of this analysis.
VII. CONCLUSIONS AND SUMMARY OF FINDINGS<br />
Based on the foregoing analyses, CEA’s general conclusions are as follows:<br />
(1) The average <strong>ROE</strong>s for Enbridge and Union (8.82 percent for 2006 and 8.47<br />
percent for 2007) are approximately 150 to 185 basis points (1.50 percent to<br />
1.85 percent) lower than average allowed U.S. <strong>ROE</strong>s for gas distribution<br />
utilities. When certain U.S. companies that are less comparable to the<br />
Ontario utilities are excluded from the comparison, the gap between<br />
Canadian and U.S. <strong>ROE</strong>s remains relatively constant, at between<br />
approximately 160 and 200 basis points.<br />
(2) While the ranges of <strong>ROE</strong>s in Canada and the U.S. do not overlap, allowed<br />
returns in the U.S. are dispersed over a wider spectrum than in Canada, from<br />
9.45 percent to 11.20 percent in the U.S. (i.e., 175 basis points) versus from<br />
8.37 percent to 9.07 percent in Canada (i.e., 70 basis points). The range of<br />
<strong>ROE</strong>s for the narrower group of more comparable U.S. utilities is from 9.50<br />
percent to 11.20 percent (i.e., 170 basis points), roughly equivalent to that of<br />
the larger U.S. group.<br />
(3) Enbridge and Union also have lower allowed equity ratios than U.S.<br />
companies, on average. Enbridge and Union’s allowed equity percentages<br />
are currently 35.00 percent and 36.00 percent, as compared to 46.00 percent<br />
on average for the eight comparable U.S. companies (48.00 percent for the<br />
entire U.S. group). In general, financial theory would suggest that as equity<br />
ratios decrease, the cost of equity increases.<br />
(4) The OEB’s formulaic adjustment factor of .75 is reasonably reflective of the<br />
historical (i.e., pre-1997) relationship between Canadian authorized returns<br />
and long term government bond yields. It also is significantly more sensitive<br />
to changes in interest rates than is suggested by regression results based on<br />
U.S. data. The difference in the interest rate sensitivity of each, the U.S.<br />
regression model and the Ontario adjustment mechanism, at least partially<br />
explains the recent disparity between U.S. authorized returns and Ontario<br />
authorized returns. The OEB <strong>ROE</strong> adjustment mechanism, however, is<br />
Page 56
eciprocal; as interest rates recover <strong>ROE</strong>s will rise at a faster rate in Ontario<br />
than in the U.S. Ontario authorized returns could eventually surpass U.S.<br />
authorized returns, if interest rates rise above the point at which they were<br />
when the mechanism was established in 1997.<br />
(5) Through our research, CEA has identified a strong positive historical<br />
relationship between long term Canadian Bond yields and Canadian<br />
authorized returns. The <strong>ROE</strong> adjustment formula employed by the OEB<br />
appropriately characterizes that historical relationship. While CEA did not<br />
perform an analysis of the effect of allowed returns on the financial integrity<br />
of regulated utilities or on customers’ rates, we do note that, all else being<br />
equal, at extremely low interest rates and correspondingly low returns,<br />
unexpected earnings variations (i.e., deviations from those conditions that<br />
would have been anticipated when setting rates) will generally have a more<br />
pronounced effect on the financial condition of the utilities, as those<br />
deviations would be applied to a smaller earnings base. Accordingly, in an<br />
extreme low (or high) interest rate environment (i.e., at those points in which<br />
the <strong>ROE</strong>s in Canada and the U.S. would most greatly diverge), further<br />
consideration is warranted to assess whether the allowed return is consistent<br />
with the established standards. This may require the consideration of<br />
additional qualitative and financial metrics in making the <strong>ROE</strong> determination.<br />
(6) On the whole, there are no evident fundamental differences in the business<br />
and operating risks facing Ontario utilities as compared to those facing U.S.<br />
companies or other provinces’ utilities that would explain the difference in<br />
<strong>ROE</strong>s.<br />
(7) Other market related distinctions and resulting financial risk differences,<br />
particularly between Canada and the U.S., do exist. These factors, including<br />
differences in market structure, investor bases, regulatory environments, and<br />
other economic factors may have an impact on investors’ return<br />
requirements for Canadian versus U.S. utility investments. However,<br />
through analysis and interviews with key market participants, representatives<br />
of customer groups, and other individuals with past involvement in <strong>ROE</strong><br />
Page 57
proceedings in Canada and the U.S., these differences are determined to be<br />
negligible.<br />
(8) While the gas markets in the U.K., the Netherlands, and Australia bear<br />
certain resemblances to those of Canada and the U.S., there are a few<br />
substantial differences that weaken the comparison. Thus, allowed returns in<br />
these countries are not considered adequate benchmarks against which to<br />
examine <strong>ROE</strong>s in Ontario.<br />
(9) As a result of the interplay between the Canadian and U.S. markets, Canadian<br />
utilities compete for capital essentially on the same basis as utilities in the<br />
U.S.<br />
(10) CEA concludes that stand-alone companies compete for capital just as<br />
subsidiaries of larger holding companies do, as the latter must compete<br />
among their affiliates for parental investment. Nonetheless, the parental<br />
obligation to invest necessary capital to maintain system integrity will<br />
typically provide the wholly owned subsidiary sufficient capital to sustain<br />
operations, where no such provision exists for stand alone utilities as external<br />
investors have no similar obligation to invest. Thus, one could argue that<br />
subsidiaries enjoy the benefit of more patient capital, but over time, the<br />
equity returns must ultimately reward the parent for investments of<br />
comparable risk.<br />
Page 58
VIII. LIST OF APPENDICES<br />
Appendix A – Listing of market participants interviewed<br />
Appendix B – Listing of data sources and documents considered<br />
Appendix C – Discussion of significant <strong>ROE</strong>-related decisions in Canada and<br />
IX. LIST OF EXHIBITS<br />
the U.S.<br />
Exhibit 1 – “<strong>ROE</strong> Database” of Canadian and U.S. gas distribution companies<br />
Exhibit 2 – Complete listing of U.S. gas distribution <strong>ROE</strong> awards, 2005 to<br />
present<br />
Page 59
APPENDIX A<br />
LISTING OF INDIVIDUALS INTERVIEWED<br />
As part of the research phase of this report, CEA interviewed many market participants,<br />
consumer group representatives, and other individuals with past or current involvement in<br />
<strong>ROE</strong> proceedings in Ontario and other jurisdictions. In addition, while not listed here, we<br />
would also like to thank the many individuals at the OEB, other regulatory boards, and<br />
companies who provided us documentation and other information during the process.<br />
• Professor Laurence Booth, CIT Chair in <strong>Structure</strong>d Finance, Rotman School of<br />
Management, University of Toronto<br />
• Brad Boyle, Treasurer, Enbridge Gas Distribution Inc.<br />
• R. J. Campbell, Manager, Regulatory Policy & Research, Enbridge Gas Distribution<br />
Inc.<br />
• Bryan Gormley, Director, Policy & Economics, Canadian Gas Association<br />
• Mike Packer, Director, Regulatory Affairs, Union Gas Limited<br />
• Jay Shepherd, Counsel to the School Energy Coalition, Shibley Righton LLP<br />
• Karen J. Taylor, Managing Director, Pipelines & <strong>Utilities</strong> Equity Research, BMO<br />
<strong>Capital</strong> Markets<br />
• Peter Thompson Q.C., Counsel for the Industrial Gas Users Association, Borden,<br />
Ladner, Gervais LLP.<br />
• An additional market participant who requested to remain anonymous.<br />
Page 60
APPENDIX B<br />
LISTING OF DATA SOURCES AND DOCUMENTS CONSIDERED<br />
Canada<br />
1. Alberta EUB, Generic Cost of <strong>Capital</strong>, Decision 2004-052, July 2, 2004.<br />
2. Andrews, Doug, An Examination of the Equity Risk Premium Assumed by Canadian<br />
Pension Plan Sponsors, July 2004.<br />
3. Annual Information Forms and Financial Reports for Canadian Companies.<br />
4. Berkowitz, Michael K. and Jaiping Qiu, “Common Risk Factors in Explaining<br />
Canadian Equity Returns,” December, 2001.<br />
5. BMO <strong>Capital</strong> Markets, “2007 <strong>ROE</strong> Preview – the Ugly Get Uglier and Is There<br />
Trouble Brewing in Ontario?” June 27, 2006.<br />
6. British Columbia <strong>Utilities</strong> Commission, In the Matter of <strong>Terasen</strong> Gas Inc. and <strong>Terasen</strong><br />
Gas (Vancouver Island) Inc. <strong>Application</strong> to Determine the Appropriate Return on<br />
Equity and <strong>Capital</strong> <strong>Structure</strong> and to Review and Revise the Automatic Adjustment<br />
Mechanism, Decision, March 2, 2006.<br />
7. CIBC World Markets, “Spectra Energy Corporation, Attractive Energy Infrastructure<br />
Play; Commodity Headwinds a Near-term Issue,” January 11, 2007.<br />
8. Credit Suisse, Spectra Energy Corp, “There’s A New Sheriff in Town,” February 5,<br />
2007.<br />
9. Documentation received from company representatives at Union Gas and Enbridge<br />
Gas Distribution.<br />
10. Dominion Bond Rating Service, “Rating <strong>Utilities</strong> (Electric, Pipelines & Gas<br />
Distribution)”, March 9, 2005.<br />
11. Dominion Bond Rating Service, AltaGas Income Trust Rating Report, December 29,<br />
2006.<br />
12. Dominion Bond Rating Service, ATCO Ltd, January 31, 2007.<br />
13. Dominion Bond Rating Service, Pacific Northern Gas Ltd., September 1, 2005.<br />
14. Dominion Bond Rating Service, Union Gas Limited Rating Report, March 6, 2007.<br />
15. Dominion Bond Rating Service, Union Gas Limited, February 20, 2007.<br />
16. Foster Associates, Inc., “Alberta Energy <strong>Utilities</strong> Board Adopts Generic Approach to<br />
Determining Return On Equity and <strong>Capital</strong> <strong>Structure</strong> for <strong>Utilities</strong> and Pipelines,”<br />
Foster Natural Gas Report, July 8, 2004.<br />
17. Foster Associates, Inc., “National Energy Boards Fair Rate of Return Determination<br />
Based on Traditional Methods Disappoints TransCanada,” Foster Natural Gas Report,<br />
June 27, 2002.<br />
18. Gaz Métro Limited Partnership, Analyst Annual Meeting Presentation, December 13,<br />
2005.<br />
Page 61
APPENDIX B<br />
LISTING OF DATA SOURCES AND DOCUMENTS CONSIDERED<br />
19. McShane, Kathleen C., Foster Associates, Inc., Opinion, <strong>Capital</strong> <strong>Structure</strong> and Fair<br />
Return on Equity prepared for Hydro One Networks Inc., August 14, 2006.<br />
20. McShane, Kathy, Foster Associates, Utility Cost of <strong>Capital</strong> Canada vs. U.S., May 7,<br />
2003.<br />
21. National Energy Board, Reasons for Decision, TransCanada PipeLines Limited, RH-4-<br />
2001, Cost of <strong>Capital</strong>, June, 2002.<br />
22. National Energy Board, Reasons for Decisions, RH-2-94, March 1995.<br />
23. National Energy Board, Reasons for Decisions, TransCanada PipeLines Limited, RH-<br />
2-2004, Phase II, Cost of <strong>Capital</strong>, April, 2005.<br />
24. National Energy Board, Written Evidence of TransCanada PipeLines Limited on Fair<br />
Return, Appendix B-2 Fair Return Standard, July 29, 2004.<br />
25. New Brunswick Board of Commissioners of Public <strong>Utilities</strong>, Decision in the Matter of<br />
an <strong>Application</strong> by Enbridge Gas New Brunswick Inc. for Approval of its Rates and<br />
Tariffs, June 23, 2000.<br />
26. Northwestern <strong>Utilities</strong> v. City of Edmonton [1929] S.C.R. 186 (NUL 1929).<br />
27. Ontario Energy Board File Nos.: EB-2006-0088/EB-2005-0089, Cost of <strong>Capital</strong>/IRM<br />
Technical Conference, Questions from the Coalition of Large Distributors (“CLD”),<br />
September 27, 2006.<br />
28. Ontario Energy Board, Draft Guidelines on a Formula-based Return on Common<br />
Equity for Regulated <strong>Utilities</strong>, March 1997.<br />
29. Ontario Energy Board, EB-2006-0209, Staff Discussion Paper on an Incentive<br />
Regulation Framework for Natural Gas <strong>Utilities</strong>, January 5, 2007.<br />
30. Ontario Energy Board, RP-2002-0158, In the Matter of <strong>Application</strong>s by Union Gas<br />
Limited and Enbridge Gas Distribution Inc. for a Review of the Board’s Guidelines<br />
for Establishing their Respective Return on Equity, Decision and Order, January 16,<br />
2004.<br />
31. Scotia <strong>Capital</strong>, Daily Edge, Enbridge Inc., February 6, 2007.<br />
32. Standard & Poor’s Corporate Credit Rating, Union Gas Limited, December 2005.<br />
33. Standard & Poor’s, “Attracting <strong>Capital</strong> – How Does Canada’s Regulatory Environment<br />
Compare Internationally,” CAMPUT Financial Seminar, January 14, 2005.<br />
34. Standard & Poor’s, “Shining a Light on the Positive Outlooks for Ontario Electricity<br />
Distributors,” March 26, 2007.<br />
35. Standard & Poor’s, Research Summary, Union Gas Ltd., January 5, 2007.<br />
36. Strategis, Industry Canada, February 2007.<br />
37. www.2ontario.com, Canada Is a Trading Nation, Canada’s Major Trading Partners –<br />
2006, May 11, 2007.<br />
Page 62
APPENDIX B<br />
LISTING OF DATA SOURCES AND DOCUMENTS CONSIDERED<br />
38. www.thestreet.com Ratings, Enbridge Inc., March 27, 2007.<br />
U.S.<br />
39. Bluefield Waterworks & Improvement Company v. Public Service Commission of<br />
West Virginia, 262 U.S. 679, 1923.<br />
40. Federal Power Commission v. Hope Natural Gas Co., 320 U.S. 591, 1944.<br />
41. Moody’s Investors Service, “Local Gas Distribution Companies: Update on Revenue<br />
Decoupling and Implications for Credit Ratings,” June, 2006.<br />
42. New England Telephone & Telegraph Co. v. State, 98 N.H. 211, 220, 97 A.2d 213,<br />
1953, at 220-221 citing New England Tel. & Tel. Co. v. Department of Pub. Util.,<br />
(Mass.) 327 Mass. 81, 97 N.E. 2d 509, 514; Petitions of New England Tel. & Tel. Co.<br />
116 Vt. 480, A.2d 671 and Chesapeake & Potomac Tel. Co. v. Public Service<br />
Commission, (Md.) 201 Md. 170, 93 A..2d 249, 257.<br />
43. SEC Form 10-K’s for U.S. Companies.<br />
44. SNL database.<br />
45. Standard & Poor’s, “Key Credit Factors for U.S. Natural Gas Distributors,” U.S.<br />
<strong>Utilities</strong> and Power Commentary, November, 2006.<br />
46. Value Line Investment Survey, March 16, 2007.<br />
47. Yahoo! Finance.<br />
U.K., Australia, Netherlands<br />
48. Annual Reports for U.K. Companies.<br />
49. Australian Competition and Consumer Commission, Supplementary Submission to the<br />
Productivity Commission Review of the Gas Access Regime, November 24, 2003.<br />
50. Australian Gas Light Company, Revisions to AGLGN’s Access Arrangement and<br />
Access Arrangement Information, June 10, 2005.<br />
51. Charles River Associates, Cost of <strong>Capital</strong> Estimation in the U.K., December, 2003.<br />
52. Essential Services Commission, Review of Gas Access Arrangements, Final Decision,<br />
October, 2002.<br />
53. Frontier Economics, The Cost of <strong>Capital</strong> for Regional Distribution Networks, A<br />
Report for DTE, December, 2005.<br />
54. Global Legal Group, The International Comparative Legal Guide to: Gas Regulation<br />
2007, Chapter 21, Netherlands.<br />
Page 63
APPENDIX B<br />
LISTING OF DATA SOURCES AND DOCUMENTS CONSIDERED<br />
55. Independent Gas Pipelines Access Regulator, Western Australia Final Decision: Access<br />
Arrangement Mid-West and South-West Gas Distribution Systems, Submitted by<br />
AlintaGas, Part B Supporting Information, June 30, 2000.<br />
56. Independent Pricing and Regulatory Tribunal of New South Wales, Review of Gas and<br />
Electricity Regulated Retail Tariffs Issues Paper, Discussion Paper DP70, October,<br />
2003.<br />
57. Independent Pricing and Regulatory Tribunal of New South Wales, Revised Access<br />
Arrangement for AGL Gas Networks, Final Decision, April, 2005.<br />
58. Moody’s Investors Service, UK Independent Gas Distribution Companies: Similar<br />
Fundamentals to Regulated Water at Slightly Lower Leverage, March, 2004.<br />
59. Netherlands Competition Authority, “Consultation Document on the Cost of <strong>Capital</strong><br />
for Regional Network Managers,” December 2005.<br />
60. Ofgem, Gas Distribution Price Control Review Fourth Consultation Document,<br />
Consultation and Appendices, March 26, 2007.<br />
61. Ofgem, Gas Distribution Price Control Review One Year Control Final Proposals,<br />
Decision Document and Appendices, December 4, 2006.<br />
62. Ofgem, Gas Distribution Price Control Review Third Consultation Document,<br />
November 27, 2006.<br />
63. Queensland Competition Authority, Access Arrangements for Gas Distribution<br />
Networks: Allgas Energy Limited and Envestra Limited, Final Approval, December,<br />
2001.<br />
64. Queensland Competition Authority, Final Decision, Revised Access Arrangement for<br />
Gas Distribution Networks: Envestra, May, 2006.<br />
65. Queensland Competition Authority, Final Decision, Revised Access Arrangement for<br />
Gas Distribution Networks: Allgas Energy, May, 2006.<br />
66. Queensland Competition Authority, Proposed Access Arrangements for Gas<br />
Distribution Networks: Allgas Energy Limited and Envestra Limited, Final Decision<br />
Errata, November, 2001.<br />
67. Wright, Stephen, Robin Mason, David Miles, “A Study into Certain Aspects of the<br />
Cost of <strong>Capital</strong> for Regulated <strong>Utilities</strong> in the U.K.,” February 13, 2003.<br />
Other<br />
68. Annin, Michael, “Equity and the Small-Stock Effect,” Public <strong>Utilities</strong> Fortnightly, October<br />
15, 1995.<br />
69. Bernstein, Peter L., “Dividends and the Frozen Orange Juice Syndrome,” Financial<br />
Analysts Journal, March/April, 2005.<br />
Page 64
APPENDIX B<br />
LISTING OF DATA SOURCES AND DOCUMENTS CONSIDERED<br />
70. Christoffersen, Susan E.K., et al., “Crossborder dividend taxation and the preferences<br />
of taxable and nontaxable investors: Evidence from Canada,” Journal of Financial<br />
Economics, August 24, 2004.<br />
71. Dimson, Elroy, Paul Marsh and Mike Staunton, Global Evidence on the Equity Risk<br />
Premium, Copyright September 2002.<br />
72. Dominion Bond Rating Service, The Rating Process and the Cost of <strong>Capital</strong> for<br />
<strong>Utilities</strong>, May, 2003.<br />
73. Energy Information Administration, “RPI-X: Price Caps Versus Rate-of-Return<br />
Regulation.”<br />
74. Mario Levis, “The record on small companies: A review of the evidence,” Journal of<br />
Asset Management 2 (March 2002):368-397.<br />
75. Network Economics Consulting Group PTY Ltd., International comparison of<br />
WACC decisions, September, 2003.<br />
76. Radford, Bruce W., “Consolidated Tax Savings and Affiliated <strong>Utilities</strong>: New Life for an<br />
Old Issue,” Progress of Regulation Trends and Topics, Public <strong>Utilities</strong> Fortnightly,<br />
November 5, 1981.<br />
77. SBBI Morningstar 2007 Yearbook, Valuation Edition.<br />
78. Standard and Poor’s, Corporate Ratings Criteria—Ratings and Ratios: Ratio Medians,<br />
June 9, 2005.<br />
79. World Bank Group, “Price Caps, Rate-of-Return Regulation, and the Cost of <strong>Capital</strong>,”<br />
Public Policy for the Private Sector, September, 1996.<br />
Page 65
APPENDIX C<br />
DISCUSSION OF SIGNIFICANT <strong>ROE</strong>-RELATED DECISIONS IN CANADA AND THE U.S.<br />
The United States Supreme Court’s precedent-setting Hope and Bluefield decisions established<br />
the standards for determining the fairness and reasonableness of a utility’s allowed return on<br />
common equity. Among the standards established by the Court in those cases are: (1)<br />
consistency with other businesses having similar or comparable risks; and (2) adequacy of<br />
the return to support credit quality and access to capital.<br />
The Hope and Bluefield cases read, in pertinent part:<br />
A public utility is entitled to such rates as will permit it to earn a return on<br />
the value of the property which it employs for the convenience of the<br />
public equal to that generally being made at the same time and in the same<br />
general part of the country on investments in other business undertakings<br />
which are attended by corresponding risks and uncertainties; but it has no<br />
constitutional right to profits such as are realized or anticipated in highly<br />
profitable enterprises or speculative ventures. The return should be<br />
adequate, under efficient and economic management, to maintain and<br />
support its credit and enable it to raise the money necessary for the proper<br />
discharge of its public duties. A rate of return may be reasonable at one<br />
time and become too high or too low by changes affecting opportunities<br />
for investment, the money market and business conditions generally. 47<br />
Rates which are not sufficient to yield a reasonable return on the value of the<br />
property used at the time it is being used to render the service are unjust,<br />
unreasonable and confiscatory… 48<br />
From the investor or company point of view, it is important that there be<br />
enough revenue not only for operating expenses, but also for the capital<br />
costs of the business. These include service on the debt and dividends on the<br />
stock. By that standard the return to the equity owner should be<br />
commensurate with returns on investments in other enterprises having<br />
corresponding risks. That return, moreover, should be sufficient to assure<br />
confidence in the financial integrity of the enterprise, so as to maintain its<br />
credit and to attract capital. 49<br />
The Supreme Court of Canada in Northwestern <strong>Utilities</strong> vs. City of Edmonton established a similar<br />
definition of fair return. As stated by Mr. Justice Lamont in that case:<br />
The duty of the Board was to fix fair and reasonable rates; rates which, under<br />
the circumstances, would be fair to the consumer on the one hand, and<br />
which, on the other hand, would secure to the company a fair return for the<br />
47<br />
Bluefield Waterworks & Improvement Company v. Public Service Commission of West Virginia, 262 U.S.<br />
679, 1923, at 692-693 (“Bluefield”).<br />
48<br />
Id., at 690-692.<br />
49<br />
Federal Power Commission v. Hope Natural Gas Co., 320 U.S. 591, 1944, at 603 (“Hope”).<br />
Page 66
APPENDIX C<br />
DISCUSSION OF SIGNIFICANT <strong>ROE</strong>-RELATED DECISIONS IN CANADA AND THE U.S.<br />
capital invested. By a fair return is meant that the company will be allowed<br />
as large a return on the capital invested in its enterprise (which will be net to<br />
the company) as it would receive if it were investing the same amount in<br />
other securities possessing an attractiveness, stability and certainty equal to<br />
that of the company’s enterprise… 50<br />
The standards set out in these court cases are endorsed and used by the Federal Court of<br />
Canada and the NEB. 51 In its December 1971 Decision, the NEB concluded as follows in<br />
respect of the framework for consideration of an appropriate rate of return for<br />
TransCanada:<br />
The Board is of the opinion that in respect of rate regulation, its powers and<br />
responsibilities include on the one hand a responsibility to prevent<br />
exploitation of monopolistic opportunity to charge excessive prices, and<br />
equally include on the other hand the responsibility so to conduct the<br />
regulatory function that the regulated enterprise has the opportunity to<br />
recover its reasonable expenses, and to earn a reasonable return on capital<br />
usefully employed in providing utility service. Further, it holds that to be<br />
reasonable such return should be comparable with the return available from<br />
the application of the capital to other enterprises of like risk. The Board<br />
accepts that, with qualifications, the rate of return is the concept perhaps<br />
most commonly used to project for some future period the ratio of return<br />
which has been found appropriate for the capital employed usefully by a<br />
regulated enterprise in providing utility service in a defined test period. The<br />
expectation is that, pending major changes, that ratio will provide a return,<br />
notwithstanding changes in the amount of capital invested, which will be fair<br />
both from the viewpoint of the customers and from the viewpoint of present<br />
and prospective investors.<br />
An example of how the NEB describes their utilization of the fair return standard is seen in<br />
the RH-2-2004 (Phase II) proceeding. 52<br />
The Board is of the view that the fair return standard can be articulated by<br />
having reference to three particular requirements. Specifically, a fair or<br />
reasonable return on capital should:<br />
• be comparable to the return available from the application of the<br />
invested capital to other enterprises of like risk (the comparable<br />
investment standard);<br />
• enable the financial integrity of the regulated enterprise to be maintained<br />
(the financial integrity standard); and<br />
50 Northwestern <strong>Utilities</strong> v. City of Edmonton [1929] S.C.R. 186 (NUL 1929)<br />
51 See TransCanada PipeLines Limited v. Canada (National Energy Board), [2004] F.C.A. 149, paragraphs 35<br />
and 36; AO-1-RH-1-70 Reasons for Decision, pp. 6-6 through 6-9; RH-4-2001 Decision, pages 10-12.<br />
52 Reasons for Decision, TransCanada PipeLines Limited, RH-2-2004, Phase II, April 2005, Cost of <strong>Capital</strong>.<br />
Page 67
APPENDIX C<br />
DISCUSSION OF SIGNIFICANT <strong>ROE</strong>-RELATED DECISIONS IN CANADA AND THE U.S.<br />
• permit incremental capital to be attracted to the enterprise on reasonable<br />
terms and conditions (the capital attraction standard). 53<br />
<strong>Capital</strong> <strong>Structure</strong>:<br />
The U.S. Supreme Court and various utility commissions have long recognized the role of<br />
capital structure in the development of a just and reasonable rate of return for a regulated<br />
utility. In particular, a utility’s leverage, or debt ratio, has been explicitly recognized as an<br />
important element in determining a just and reasonable rate of return:<br />
Although the determination of whether bonds or stocks should be issued is<br />
for management, the matter of debt ratio is not exclusively within its<br />
province. Debt ratios substantially affect the manner and cost of obtaining<br />
new capital. It is therefore an important factor in the rate of return and must<br />
necessarily come within the authority of the body charged by law with the<br />
duty of fixing a just and reasonable rate of return. 54<br />
The NEB, in the RH-2-94 Multi-Pipeline Cost of <strong>Capital</strong> Decision, established the <strong>ROE</strong> for<br />
a benchmark pipeline to be applied to all pipelines in that hearing. It then determined that<br />
any risk differentials between the pipelines could be accounted for by adjusting the common<br />
equity ratio. 55<br />
The NEB stated that, “case law establishes that it is the overall return on capital to the<br />
company which ought to meet the comparable investment, financial integrity and capital<br />
attraction requirements of the fair return standard.” Yet they indicated that this does not in<br />
the NEB’s view, “require that the Board make the necessary determinations solely by means<br />
of examining evidence on overall return.” 56<br />
53 Id., at p. 17.<br />
54 New England Telephone & Telegraph Co. v. State, 98 N.H. 211, 220, 97 A.2d 213, 1953, at 220-221 citing<br />
New England Tel. & Tel. Co. v. Department of Pub. Util., (Mass.) 327 Mass. 81, 97 N.E. 2d 509, 514;<br />
Petitions of New England Tel. & Tel. Co. 116 Vt. 480, A.2d 671 and Chesapeake & Potomac Tel. Co. v.<br />
Public Service Comm’n, (Md.) 201 Md. 170, 93 A..2d 249, 257.<br />
55 RH-2-94, at p.25.<br />
56 Reasons for Decision, TransCanada PipeLines Limited, RH-2-2004, Phase II, April 2005, Cost of <strong>Capital</strong>,<br />
at p. 19.<br />
Page 68
DRAFT - CONFIDENTIAL EXHIBIT 1 - <strong>ROE</strong> Database of Canadian and U.S. Gas Distribution Companies<br />
Company Jurisdiction<br />
Most<br />
Recent<br />
<strong>ROE</strong> Date<br />
Allowed<br />
Equity<br />
%<br />
Parent Company<br />
Percent<br />
Regulated<br />
Revenue<br />
Percent<br />
Regulated<br />
Net Income<br />
Percent Gas<br />
Distribution<br />
Revenue<br />
Book<br />
Value<br />
(million<br />
$CAD)<br />
Total<br />
Revenue<br />
(million<br />
$CAD)<br />
Gas<br />
Distribution<br />
Revenue<br />
(million<br />
$CAD)<br />
Total Gas<br />
Distribution<br />
Whlsl &<br />
Customers Ind. Comm. Res. Other<br />
CANADIAN COMPANIES<br />
Enbridge Gas Distribution [3] Ontario, CAN 8.39% 2007 35.00% 100% 100% 98% $4,779 $3,016 $2,958 1,819,765 5% 23% 47% 2% 23% 11.55 A/A- 1.84 Y<br />
Union Gas Ontario, CAN 8.54% 2007 36.00% 100% 100% 91% $3,442 $2,079 $2,046 1,268,000 12% 20% 7% 0% 61% 13.21 A/BBB+ 1.91 Y<br />
PNG, Ltd. (PNG West Division) BC, CAN 9.02% 2007 40.00% 100% 100% 89% $157 $139 $124 39,511 10% 22% 25% 0% 43% 0.33 BBB/BBB 2.47 Y<br />
PNG, Ltd. (PNG Tumbler Ridge) BC, CAN 9.02% 2007 36.00% 100% 100% 89% [4] [4] [4] [4] [4] [4] [4] [4] [4] [4] BBB/BBB [4] Y<br />
PNG, Ltd. (PNG Ft. St. John/Dawson<br />
Creek/<strong>FortisBC</strong>)<br />
BC, CAN 8.77% 2007 36.00% 100% 100% 89% [4] [4] [4] [4] [4] [4] [4] [4] [4] [4] BBB/BBB [4] Y<br />
<strong>Terasen</strong> Gas Inc. (BCGU) BC, CAN 8.37% 2007 35.00% 98% 100% 86% $2,468 $1,525 $1,525 815,000 2% 18% 31% 0% 48% 5.72 A/A 2.06 Y<br />
<strong>Terasen</strong> Gas (Vancouver Island) Inc. BC, CAN 9.07% 2007 40.00% 98% 100% 86% $2,124 [5] $216 89,400 [5] [5] [5] [5] [5] [5] [5] [5] N<br />
Gaz Metropolitain Québec, CAN 8.95% 2006 38.50% 97% 100% 94% $2,358 $2,004 $1,886 205,903 [5] [5] [5] [5] [5] [5] A/A 2.13 Y<br />
Alta Alberta, CAN 8.51% 2007 41.00% 100% 100% 100% $151 $131 $126 63,532 1% 35% 64% 0% 0% 0.31 BBB 2.44 Y<br />
ATCO [6] Alberta, CAN 8.51% 2007 37.00% 38% 30% 31% $4,123 $2,861 $903 969,877 7% 45% 48% 0% 0% 5.90 A/A 3.52 Y<br />
AVERAGES 8.72% 37.45% 93% 93% 85% $2,450 $1,679 $1,223 658,874 6% 27% 37% 0% 29% 6.17 A- 2.34<br />
Median 8.86% 37.75%<br />
Minimum 8.37% 35.00%<br />
Maximum 9.07% 41.00%<br />
U.S. COMPANIES [7]<br />
U.S. Companies Determined to be More Comparable to Enbridge and Union<br />
Southwest Gas Corp. Arizona, U.S. 9.50% 2006 40.00% 85% 85% 85% $887 $775 $661 588,720 6% 18% 28% 0% 48% 2.28 BBB- 2.34 N<br />
Atlanta Gas Light Company Georgia, U.S. 10.90% 2005 47.93% 97% 81% 62% $2,250 $2,068 $1,281 1,546,000 3% 3% 94% 0% 0% 5.98 BBB+ 3.77 Y<br />
Northern Illinois Gas Company Illinois, U.S. 10.51% 2005 56.37% 86% 100% 85% $1,753 $2,845 $2,423 2,166,000 1% 10% 42% 0% 47% 12.43 AA 2.32 Y<br />
Michigan Consolidated Gas Company Michigan, U.S. 11.00% 2005 39.31% 94% 94% 83% $2,139 $2,101 $1,751 1,300,000 29% 29% 29% 0% 12% 3.82 BBB 1.96 Y<br />
CenterPoint Energy Resources Minnesota, U.S. 9.71% 2006 46.14% 48% 26% 48% $929 $1,456 $23.98 521,199 30% 30% 40% 0% 0% 1.78 BBB 2.83 N<br />
Public Service Electric Gas New Jersey, U.S. 10.00% 2006 47.40% 98% 98% 40% $5,932 $5,465 $2,212.12 1,700,000 4% 36% 60% 0% 0% 8.98 BBB 2.29 Y<br />
Puget Sound Energy, Inc. Washington, U.S. 10.40% 2007 44.13% 100% 99% 39% $5,982 $3,372 $1,300 713,000 4% 22% 49% 0% 25% 3.07 BBB- 1.89 N<br />
Wisconsin Gas LLC Wisconsin, U.S. 11.20% 2006 50.20% 100% 100% 36% $2,268 $1,258 $803 588,800 11% 11% 36% 0% 43% 3.45 A- 3.82 N<br />
AVERAGES 10.40% 46.44% 89% 85% 60% $2,767 $2,418 $1,307 1,140,465 11% 20% 47% 0% 22% 5.22 BBB+ 2.65<br />
Median 10.46% 46.77%<br />
Minimum 9.50% 39.31%<br />
Maximum 11.20% 56.37%<br />
Page 1 of 3<br />
Customer Mix [1]<br />
Transportation<br />
Gas<br />
Volume<br />
Sold<br />
(10 9 m 3 )<br />
Credit<br />
Rating<br />
(DBRS/<br />
S&P)<br />
Interest<br />
Cov.<br />
Ratio [2]<br />
Unbundled
DRAFT - CONFIDENTIAL EXHIBIT 1 - <strong>ROE</strong> Database of Canadian and U.S. Gas Distribution Companies<br />
Company Jurisdiction<br />
Most<br />
Recent<br />
<strong>ROE</strong> Date<br />
Allowed<br />
Equity<br />
%<br />
Parent Company<br />
Percent<br />
Regulated<br />
Revenue<br />
Percent<br />
Regulated<br />
Net Income<br />
Percent Gas<br />
Distribution<br />
Revenue<br />
Book<br />
Value<br />
(million<br />
$CAD)<br />
Total<br />
Revenue<br />
(million<br />
$CAD)<br />
Gas<br />
Distribution<br />
Revenue<br />
(million<br />
$CAD)<br />
Customer Mix [1]<br />
Total Gas<br />
Distribution<br />
Whlsl &<br />
Customers Ind. Comm. Res. Other<br />
Other U.S. Companies<br />
Arkansas Oklahoma Gas Corp. Arkansas, U.S. 9.70% 2005 41.04% N/A N/A N/A N/A N/A N/A N/A N/A N/A N/A N/A N/A N/A N/A N/A N<br />
Arkansas Western Gas Company Arkansas, U.S. 9.70% 2005 33.03% 23% 2% 2% $413 $200 $200 151,000 26% 22% 34% 0% 18% 0.62 BB+ 22.01 N<br />
CenterPoint Energy Resources Arkansas, U.S. 9.45% 2005 31.80% 51% 65% 48% $929 $1,456 $24 521,199 30% 30% 40% 0% 0% 1.78 BBB 2.83 N<br />
Public Service Company of CO Colorado, U.S. 10.50% 2006 55.49% 99% 95% 33% $6,183 $4,416 $1,464 1,255,330 8% 8% 35% 0% 49% 6.99 BBB 2.53 Partial<br />
Southern Connecticut Gas Company Connecticut, U.S. 10.00% 2005 51.28% 90% 99% 32% $477 $364 $1,970 176,000 N/A N/A N/A N/A N/A N/A BBB+ 2.35 N<br />
Illinois Power Company Illinois, U.S. 10.00% 2005 53.09% 89% 70% 13% $2,711 $1,966 $630 430,000 19% 24% 57% 0% 0% 1.29 BBB+ 4.68 Y<br />
Interstate Power & Light Company Iowa, U.S. 10.40% 2005 49.35% 96% 100% 20% $2,650 $2,037 $417 239,372 6% 17% 24% 0% 53% 1.76 BBB+ 4.37 N<br />
Duke Energy Kentucky, Inc. Kentucky, U.S. 10.20% 2005 54.45% 45% 45% 15% $4,793 $1,874 $5,248 250,000 N/A N/A N/A N/A N/A N/A BBB+ 12.52 Partial<br />
Entergy Gulf States, Inc. Louisiana, U.S. 10.50% 2005 47.52% 84% 61% 2% $5,351 $4,270 $98 92,000 N/A N/A N/A N/A N/A 0.19 BBB 3.08 N<br />
Baltimore Gas and Electric Company Maryland, U.S. 11.00% 2005 48.40% 100% 100% 30% $4,155 $3,499 $1,044 640,600 18% 32% 32% 0% 17% 3.26 BBB+ 1.38 Y<br />
Bay State Gas Company Massachusetts, U.S. 10.00% 2005 53.95% 80% 68% 63% $1,328 $363 $5,452 337,502 44% 20% 29% 0% 7% 2.34 BBB 2.25 Y<br />
Consumers Energy Company Michigan, U.S. 11.00% 2006 35.06% 99% 100% 41% $8,372 $6,639 $2,755 1,714,000 N/A N/A N/A N/A N/A 8.75 BB 1.58 Y<br />
Northern States Power Company - MN Minnesota, U.S. 10.40% 2005 50.24% 100% 93% 19% $5,234 $4,206 $864 418,994 22% 22% 43% 2% 11% 2.02 BBB 3.65 N<br />
Central Hudson Gas & Electric New York, U.S. 9.60% 2006 45.00% 66% 79% 16% $845 $765 $181 367,000 N/A N/A N/A N/A N/A N/A A 3.76 Y<br />
Orange & Rockland <strong>Utilities</strong>, Inc. New York, U.S. 9.80% 2006 48.00% 100% 100% 29% $989 $949 $675 125,589 5% 5% 63% 26% 0.35 A 2.64 Y<br />
Vectren Energy Delivery Ohio Ohio, U.S. 10.60% 2005 48.10% 81% 84% 60% $933 $663 $401 318,000 47% 27% 27% 0% 0% 1.45 A- 2.46 Y<br />
Oklahoma Natural Gas Co Oklahoma, U.S. 9.90% 2005 46.76% 16% 14% 16% $2,863 $5,436 $895 800,047 0% 9% 29% 8% 54% 10.74 BBB 2.16 N<br />
PPL Gas <strong>Utilities</strong> Corp Pennsylvania, U.S. 10.40% 2007 51.79% 69% 39% 5% $7,244 $3,844 N/A 110,000 N/A N/A N/A N/A N/A N/A BBB 3.46 Y<br />
South Carolina Electric & Gas South Carolina, U.S. 10.25% 2005 50.75% 100% 100% 21% $5,750 $2,775 $586 297,165 41% 28% 25% 0% 6% 1.23 A- 3.34 N<br />
Virginia Natural Gas, Inc. Virginia, U.S. 10.00% 2006 44.96% 97% 81% 62% $525 $365 $1,702 264,000 4% 4% 92% 0% 0% 0.93 BBB+ 3.77 Y<br />
Avista Corp. Washington, U.S. 10.40% 2005 40.00% 84% 89% 41% $1,850 $1,386 $604 304,000 2% 19% 31% 25% 24% 1.78 BB+ 2.12 N<br />
Madison Gas and Electric Company Wisconsin, U.S. 11.00% 2005 56.65% 103% 74% 40% $794 $589 $237 138,000 4% 38% 55% 0% 3% N/A AA- 5.55 N<br />
Wisconsin Public Service Corp Wisconsin, U.S. 11.00% 2005 59.73% 100% 92% 31% $449 $349 $515 306,293 10% 10% 30% 0% 50% 1.94 A+ 3.60 N<br />
Northern States Power Co-WI Wisconsin, U.S. 11.00% 2006 53.66% 100% 101% 21% $941 $853 $173 100,000 22% 22% 32% 5% 18% 0.50 BBB+ 3.89 N<br />
Wisconsin Electric Power Company Wisconsin, U.S. 11.20% 2006 56.34% 100% 100% 19% $5,199 $3,617 $685 452,600 12% 12% 39% 0% 38% 2.30 A- 6.12 N<br />
Wisconsin Power and Light Co Wisconsin, U.S. 10.80% 2007 54.00% 100% 100% 20% $1,984 $1,626 $318 182,098 2% 19% 26% 0% 53% 1.23 A- 31.88 N<br />
AVERAGES 10.34% 48.48% 83% 78% 28% $2,918 $2,180 $1,131 399,632 17% 19% 39% 2% 22% 2.57 BBB+ 3.14<br />
Median 10.40% 49.80%<br />
Minimum 9.45% 31.80%<br />
Maximum 11.20% 59.73%<br />
ALL U.S. - AVERAGES 10.35% 48.00% 84% 80% 36% $2,882 $2,238 $1,175 579,228 15% 19% 42% 2% 22% 3.33 BBB+ 2.98<br />
ALL U.S. - Median 10.40% 48.10%<br />
ALL U.S. - Minimum 9.45% 31.80%<br />
ALL U.S. - Maximum 11.20% 59.73%<br />
Page 2 of 3<br />
Transportation<br />
Gas<br />
Volume<br />
Sold<br />
(10 9 m 3 )<br />
Credit<br />
Rating<br />
(DBRS/<br />
S&P)<br />
Interest<br />
Cov.<br />
Ratio [2]<br />
Unbundled
DRAFT - CONFIDENTIAL EXHIBIT 1 - <strong>ROE</strong> Database of Canadian and U.S. Gas Distribution Companies<br />
Most<br />
Recent<br />
<strong>ROE</strong> Date<br />
Allowed<br />
Equity<br />
%<br />
Parent Company<br />
Percent<br />
Regulated<br />
Revenue<br />
Percent<br />
Regulated<br />
Net Income<br />
Percent Gas<br />
Distribution<br />
Revenue<br />
Book<br />
Value<br />
(million<br />
$CAD)<br />
Total<br />
Revenue<br />
(million<br />
$CAD)<br />
Gas<br />
Distribution<br />
Revenue<br />
(million<br />
$CAD)<br />
Customer Mix [1]<br />
Total Gas<br />
Distribution<br />
Whlsl &<br />
Customers Ind. Comm. Res. Other<br />
Company Jurisdiction<br />
Notes:<br />
[1] Customer mix is based on the best available information for each of the companies analyzed. For the most part, customer mix is based on volume of throughput per customer class. Where throughput information was not available, revenue by customer class was used. If neither of<br />
these types of information was available, CEA used number of customers by customer class. Enbridge’s customer mix is based on revenue by customer type, based on Enbridge’s 2007 test year rate case, EB-2006-0034, Exhibit C3, Tab 1, Schedule 1, p. 2. Union’s customer mix is<br />
based on total 2007 forecast throughput for industrial, commercial, and residential customers, taking into account the approximate percentage of transportation throughput based on Union’s 2006 MD&A. See EB-2005-0520, Exhibit C1, Summary Schedule 1, and Union Gas 2006<br />
Annual Report.<br />
[2] The mean interest coverage ratio for the U.S. companies is 4.8 times, but includes certain outlier data, such as 22 times for Arkansas Western Gas Company, 31.9 times for Wisconsin Power and Light Co, and 12.5 times for Duke Energy Kentucky. For this reason, CEA excluded the<br />
outlier data to arrive at the presented mean.<br />
[3] While technically a gas distribution company, Enbridge classifies certain of it revenues as “transportation” revenues. Per Enbridge’s 2006 Annual Information Form, “Under the transportation service, arrangement, a customer supplies natural gas at a TransCanada receipt point in<br />
western Canada or at a TransCanada delivery point in Ontario, and [Enbridge] redelivers an equal amount of gas to the customer’s end-use location.”<br />
[4] Certain of Pacific Northern Gas, Ltd.'s information was presented at the holding company level only. For purposes of this table, that information is provided under PNG's West Division.<br />
[5] Certain of <strong>Terasen</strong> Gas Inc.'s information was presented at the holding company level only. For purposes of this table, that information is provided under <strong>Terasen</strong> Gas Inc.<br />
[6] Transportation volumes were unavailable for ATCO.<br />
[7] Note: for U.S subsidiary companies for which financial statements were not available at the subsidiary level, CEA approximated book value and total revenue based on an estimate of the subsidiary’s total contribution to the parent's consolidated operations. Estimates were made based<br />
on the best available data, which included customer numbers, revenue, and fixed assets.<br />
Page 3 of 3<br />
Transportation<br />
Gas<br />
Volume<br />
Sold<br />
(10 9 m 3 )<br />
Credit<br />
Rating<br />
(DBRS/<br />
S&P)<br />
Interest<br />
Cov.<br />
Ratio [2]<br />
Unbundled
DRAFT - CONFIDENTIAL<br />
EXHIBIT 2 - Complete Listing of U.S. Gas Distribution <strong>ROE</strong> Awards, 2005 to Present<br />
State Company Case Identification Date<br />
Rate<br />
Increase<br />
($M)<br />
Return on<br />
Rate Base(%)<br />
Return on<br />
Equity<br />
(%)<br />
Common<br />
Equity<br />
/Total Cap<br />
(%)<br />
Arizona Southwest Gas Corp. D-G-01551A-04-0876 2/15/2006 49.3 8.40% 9.50% 40.00%<br />
Arkansas CenterPoint Energy Resources D-04-121-U 9/19/2005 -11.3 5.31% 9.45% 31.80%<br />
Arkansas Arkansas Western Gas Co. D-04-176-U 11/2/2005 4.6 5.93% 9.70% 33.03%<br />
Arkansas Arkansas Oklahoma Gas Corp. D-05-006-U 12/9/2005 4.4 6.61% 9.70% 41.04%<br />
Colorado Public Service Co. of CO D-05S-264G 1/19/2006 22.5 8.70% 10.50% 55.49%<br />
Connecticut Southern Connecticut Gas Co. D-05-03-17PH01 12/28/2005 26.7 8.85% 10.00% 51.28%<br />
Georgia Atlanta Gas Light Co. D-18638-U 6/10/2005 0.0 8.53% 10.90% 47.93%<br />
Illinois Illinois Power Co. D-04-0476 5/17/2005 11.3 8.18% 10.00% 53.09%<br />
Illinois Northern Illinois Gas Co. D-04-0779 9/30/2005 54.2 8.85% 10.51% 56.37%<br />
Iowa Interstate Power & Light Co. D-RPU-05-1 10/14/2005 14.0 8.68% 10.40% 49.35%<br />
Kentucky Duke Energy Kentucky Inc. C-2005-00042 12/22/2005 8.1 8.10% 10.20% 54.45%<br />
Louisiana Entergy Gulf States Inc. D-U-28035 7/6/2005 5.8 8.11% 10.50% 47.52%<br />
Maryland Baltimore Gas and Electric Co. C-9036 12/21/2005 35.6 8.49% 11.00% 48.40%<br />
Massachusetts Bay State Gas Co. DTE-05-27 11/30/2005 11.1 8.22% 10.00% 53.95%<br />
Michigan Michigan Consolidated Gas Co. C-U-13898 4/28/2005 60.8 7.19% 11.00% 39.31%<br />
Michigan Consumers Energy Co. C-U-14547 11/21/2006 80.8 6.69% 11.00% 35.06%<br />
Minnesota Northern States Power Co. - MN D-G-002-GR-04-1511 8/11/2005 5.8 8.76% 10.40% 50.24%<br />
Minnesota CenterPoint Energy Resources D-G-008/GR-051380 11/2/2006 21.0 7.54% 9.71% 46.14%<br />
New Jersey Public Service Electric Gas D-GR05100845 11/9/2006 40.0 7.96% 10.00% 47.40%<br />
New York Central Hudson Gas & Electric C-05-G-0935 7/24/2006 8.0 7.05% 9.60% 45.00%<br />
New York Orange & Rockland Utlts Inc. C-05-G-1494 10/18/2006 12.0 7.99% 9.80% 48.00%<br />
Ohio Vectren Energy Delivery Ohio C-04-571-GA-AIR 4/13/2005 15.7 8.94% 10.60% 48.10%<br />
Oklahoma Oklahoma Natural Gas Co Ca-PUD-200400610 10/4/2005 57.5 8.74% 9.90% 46.76%<br />
Pennsylvania PPL Gas <strong>Utilities</strong> Corp C-R-00061398 2/8/2007 8.1 8.44% 10.40% 51.79%<br />
South Carolina South Carolina Electric & Gas D-2005-113-G 10/31/2005 22.9 8.43% 10.25% 50.75%<br />
Virginia Virginia Natural Gas Inc. C-PUE-2005-00057 7/24/2006 0.0 7.83% 10.00% 44.96%<br />
Washington Avista Corp. D-UE-05-0483 12/21/2005 1.0 9.11% 10.40% 40.00%<br />
Washington Puget Sound Energy Inc. D-UG-060267 1/5/2007 29.5 8.40% 10.40% 44.13%<br />
Wisconsin Madison Gas and Electric Co. D-3270-UR-114 12/12/2005 3.8 8.88% 11.00% 56.65%<br />
Wisconsin Wisconsin Public Service Corp D-6690-UR-117 (elec.) 12/22/2005 7.2 8.83% 11.00% 59.73%<br />
Wisconsin Northern States Power Co-WI D-4220-UR-114 (gas) 1/5/2006 3.9 9.97% 11.00% 53.66%<br />
Wisconsin Wisconsin Electric Power Co. D-05-UR-102 (WEP-GAS) 1/25/2006 21.4 8.94% 11.20% 56.34%<br />
Wisconsin Wisconsin Gas LLC D-05-UR-102 (WG) 1/25/2006 38.7 11.38% 11.20% 50.20%<br />
Wisconsin Wisconsin Power and Light Co D.6680-UR-115 (gas) 1/11/2007 1.0 NA 10.80% 54.00%<br />
Source: Regulatory Research Associates.<br />
Page 1 of 1
Allowed Return on Equity in<br />
Canada and the United States<br />
An Economic, Financial and<br />
Institutional Analysis<br />
National Economic Research Associates, Inc.<br />
Kenneth Gordon, Ph.D<br />
Jeff D. Makholm, Ph.D<br />
February 2008
This study was commissioned by the Canadian Gas Association.<br />
NERA Economic Consulting<br />
200 Clarendon Street, 35th Floor<br />
Boston, Massachusetts 02116<br />
Tel: +1 617 621 0444<br />
Fax: +1 617 621 0336<br />
www.nera.com
Table of Contents<br />
I. INTRODUCTION ...............................................................................................................4<br />
II. EXECUTIVE SUMMARY .................................................................................................7<br />
III. AN EVIDENT DISPARITY IN CANADIAN AND US ALLOWED RETURNS ............9<br />
A. The Divergence between Canadian and US Allowed Returns for Ratemaking ..................9<br />
B. Is Allowed <strong>ROE</strong> the Proper Metrics for the Comparison of the Treatment of <strong>Utilities</strong><br />
by their Regulators? ...........................................................................................................11<br />
1. Allowed <strong>ROE</strong>s versus Achieved Returns ....................................................................12<br />
2. <strong>Capital</strong> Flows ...............................................................................................................13<br />
3. Tax Differences............................................................................................................15<br />
4. Macroeconomic Interest Rates.....................................................................................15<br />
C. The Source and Form of the New Canadian <strong>ROE</strong> Methods..............................................16<br />
IV. THE TRADITIONAL CASE-BY-CASE METHODS OF CANADIAN AND US<br />
REGULATORS .................................................................................................................19<br />
A. Discounted Cash Flow (DCF) or “Yield Plus Growth”.....................................................20<br />
B. Equity Risk Premium (ERP) and the <strong>Capital</strong> Asset Pricing Model (CAPM)....................21<br />
C. <strong>Capital</strong> <strong>Structure</strong> ................................................................................................................23<br />
V. RELATIVE RISK FOR CANADIAN AND US GAS UTILITIES ..................................25<br />
A. What Risk Matters to Utility Equity Investors?.................................................................25<br />
1. Regulatory Risk ...........................................................................................................25<br />
2. Business Risk...............................................................................................................26<br />
3. Financial Risk ..............................................................................................................27<br />
B. What are the Practical Boundaries to Regulatory Risk?....................................................27<br />
1. Strong Primary Legislation..........................................................................................28<br />
2. Credible, Comprehensive and Transparent Administrative Procedures......................30<br />
3. Accounting for Utility Ratemaking .............................................................................31<br />
4. Reliable Judicial Review..............................................................................................31<br />
C. What are the Elements of Canadian vs. US Regulatory Risk? ..........................................32<br />
D. Does the Continued Ability to Raise <strong>Capital</strong> for Canadian <strong>Utilities</strong> Indicate that All is<br />
Well?..................................................................................................................................34<br />
NERA Economic Consulting i
List of Figures<br />
Figure 1: Allowed Return Average Differential (Canada-US) for Gas Distribution<br />
<strong>Utilities</strong>, 1992-2007............................................................................................................. 10<br />
Figure 2: Allowed versus Earned Returns For Gas Distributors in Canada, 1992-2007............ 13<br />
Figure 3: Long-Term Bond Yields in Canada and the United States (1996-2006) .................... 16<br />
Figure 4: Elements of Recent <strong>ROE</strong> Regulation in the United States and Canada...................... 33<br />
NERA Economic Consulting ii
List of Tables<br />
Table 1: Canada-US Average Allowed Return Differential, 1992-2007.................................... 11<br />
Table 2: Hypothetical Formula-Based <strong>ROE</strong>s ............................................................................. 17<br />
Table 3: Major Jurisdictions Implementing Formula-Based <strong>ROE</strong>s............................................ 18<br />
NERA Economic Consulting iii
I. INTRODUCTION 1<br />
Canada and the United States have almost hundred-year histories of regulating investor-owned<br />
utilities. This shared experience is different from almost all of the rest of the world, where the<br />
appearance of investor-owned (i.e., private) utilities came only with the privatization wave of the<br />
late 20 th century. The regulatory laws, mechanisms and institutions in those other countries are<br />
new—and in many cases untested. But longstanding regulatory institutions in Canada and the<br />
US have for decades been helping to provide safe and adequate services to the public at<br />
reasonable prices while ensuring that the companies involved remain “going concerns” with<br />
sufficient credit worthiness to attract the capital needed to maintain and expand their facilities.<br />
Over the past decade, however, a significant difference has appeared in the regulatory practices<br />
between Canada and the US. In an effort to improve regulatory efficiency, Canadian<br />
regulators—first in British Columbia, then more widely—moved away from the case-by-case<br />
approach to determining the fair return on equity (<strong>ROE</strong>) for utility rate making purposes.<br />
Canadian regulators adopted generic, formula-based approaches to deriving the admittedly<br />
elusive fair <strong>ROE</strong>. US regulators in the 1980s and 1990s made two tries at generic, formulabased<br />
approaches to setting the <strong>ROE</strong> (one at the federal level and one in the State of New York),<br />
but, in the end, did not abandon their longstanding, case-by-case methods that rested on two<br />
existing and long-accepted financial theories.<br />
The apparent efficiency of bypassing case-by-case evidentiary proceedings with a generic<br />
formula may have foretold a new and more efficient method of deriving regulated rates<br />
generally—except for one thing. The current Canadian generic <strong>ROE</strong> formula appears to have<br />
created a persistent divergence between allowed gas utility returns in Canada and the US. Since<br />
1998, <strong>ROE</strong>s used to make regulated tariffs have been, on average, 100 to 150 basis points lower<br />
than in the US. That is, in dozens of evidentiary proceedings since 1998, US regulators have<br />
allowed their companies to set tariffs reflecting <strong>ROE</strong>s that were on average substantially higher<br />
than for their Canadian formula-driven <strong>ROE</strong> counterparts.<br />
The purpose of this report is to analyze the root causes of this disparity between Canadian and<br />
US <strong>ROE</strong>s that has apparently been propelled—either directly or indirectly—by the Canadian<br />
<strong>ROE</strong> adjustment formula. Since the “appropriate” level of <strong>ROE</strong> is driven by the risk/return<br />
requirements of those utility investor-owners, the obvious question is whether Canadian utilities<br />
face sufficiently less risk than their US counterparts. Conversely, we investigate whether the<br />
difference in allowed returns for ratemaking is merely a symptom of a structurally inflexible<br />
formula rather than an indicator of underlying risk differences. If it is the latter, then Canadian<br />
regulators have indeed streamlined rate cases for the better. If the former, then perhaps the<br />
formula has had unintended consequences and is in need of updating better to reflect the<br />
market’s judgment on the cost of equity of regulated Canadian utilities.<br />
1 This report was written by NERA’s Kenneth Gordon, Special Consultant and former Chairman of the<br />
Department of Public <strong>Utilities</strong> Massachusetts and the Public Utility Commission in Maine and Jeff D. Makholm,<br />
Senior Vice President. They were supported by Ryan Knight at NERA.<br />
4
It is important to state at the outset how we approach examining this divergence We cannot<br />
automatically presume that the burden falls on Canadian regulators to justify the persistently<br />
lower average <strong>ROE</strong>s than those granted by their US counterparts. Nevertheless, it is the group of<br />
Canadian regulators that changed course in the last decade, led by those regulators using the<br />
generic formula for streamlined regulatory procedures. Those regulators in the US who failed to<br />
find a suitable way to streamline their <strong>ROE</strong> procedures continued on the former path common to<br />
both Canadian and the US regulation—to examine anew, in every tariff case, expert evidence on<br />
<strong>ROE</strong> for the company in question for the relevant period of time. We do not believe that either<br />
Canadian or US regulators would consider the results of those case-by-case evidentiary<br />
procedures to be biased on a large scale. They are perhaps expensive, time consuming or<br />
overwrought—but not biased. Therefore, it is natural—and again to us justifiable—to subject<br />
the new Canadian generic formula to the test of bias. If we find that Canadian and US utilities<br />
face comparable operating environments and risk to investors, then it is natural to question the<br />
efficacy of the new Canadian formula approach to the <strong>ROE</strong>, not the traditional path US<br />
regulators still hold. It is therefore not prejudgment that prompts us to examine underlying<br />
justifications for the new and lower Canadian <strong>ROE</strong>s, but practicality. We do not question<br />
whether US regulators (or Canadian regulators up to the adoption of the new formula) were<br />
incapable of deriving “just and reasonable” tariffs. What we do question is whether, based on<br />
underlying risk factors, the new Canadian generic <strong>ROE</strong> formula can do likewise.<br />
Canadian regulators have acknowledged in rate cases that a disparity exists between Canadian<br />
and US allowed <strong>ROE</strong>s, but have not concluded whether or not the disparity warrants action.<br />
de for investors.”<br />
2<br />
For example, the regulator in Quebec, the Regie de l’Energie, stated in 2007, “[i]n the Regie’s<br />
view, even though rates of return allowed in the United States are clearly higher on average than<br />
those allowed in Canada, the evidence does not make it possible to conclude that there is any<br />
prejudice to or unfair treatment of the distributor.... The evidence does not make it possible to<br />
compare the overall differences that may exist in the institutional, economic and financial<br />
3<br />
contexts of the two countries and their impact on the opportunities they provi<br />
Unfortunately, nothing surrounding the required <strong>ROE</strong> for the purpose of making regulated tariffs<br />
is an easy discussion. Unlike the other elements of tariff setting (operating costs, maintenance<br />
costs, administrative expenses or the interest rates on utility bonds) the <strong>ROE</strong> is not directly<br />
observable. The required <strong>ROE</strong> is a function of investor expectations. Those expectations remain<br />
complex functions of how investors believe that price regulation, along with the utility’s other<br />
circumstances, will work to allow them a return on the capital that they devote to serving the<br />
public. Given the complexity associated with discussion of the fair <strong>ROE</strong>, this report will<br />
examine the root of the post-1998 differences in permitted <strong>ROE</strong>s. Those differences stem either<br />
from corresponding differences in risk in Canada versus the US or from more banal causes<br />
relating to the operation of the generic <strong>ROE</strong> formula itself vis-à-vis investors’ genuine riskdriven<br />
expectations.<br />
2 See: Ontario Energy Board (OEB) A Review of the Board’s Guidelines for Establishing Return on Equity RP-<br />
2002-0158 (2004) 122. See also: Alberta Energy Board (EUB) Generic Cost of <strong>Capital</strong> Decision 2004-052<br />
(2004) pgs 25-27.<br />
3 Regie de l’Energie, Decision: <strong>Application</strong> to Modify the Tariffs of Gaz Metro Ltd. D-2007-116 (2007) §4.1.10.<br />
5
The report concludes that the regulatory environments in Canada and the US are highly similar<br />
and directly comparable. Since the world’s first utility commission regulatory statute was<br />
written in the US in 1907 in Wisconsin, that general form has been widely copied in all states<br />
and provinces in Canada and the US. 4 These two national jurisdictions thus share a common<br />
heritage that is quite different, for example, from the newly-privatized regulatory jurisdictions in<br />
the rest of the world. Those jurisdictions overseas regulate their investor-owned utilities on an<br />
institutional basis quite different than in Canada and the US—two countries that share the<br />
longest, largest and most unencumbered trade border in the world. It is thus a fair question to<br />
compare and contrast Canadian and US utilities with each other to examine how their regulators<br />
deal with them and, in particular, derive the <strong>ROE</strong>s used to set their regulated tariffs.<br />
Section II contains our Executive Summary. In Section III, we examine the evident divergence<br />
between allowed returns in Canada and the US that propels this study. In Section IV, we<br />
compare the methods used for setting base <strong>ROE</strong>s in Canada to the case-by-case methods still<br />
used by US utility regulators, despite two highly visible attempts to create generic formulas<br />
there. In Section V, we examine the sources of risk for regulated utilities and any apparent<br />
differences between investor-owned utilities in Canada and the US that might, in principle,<br />
explain the wedge in <strong>ROE</strong>s that has appeared since 1998.<br />
4 That statute was drafted by John R. Commons, a professor of economics at the University of Wisconsin and 10<br />
years later the President of the American Economic Association.<br />
6
II. EXECUTIVE SUMMARY<br />
In the introduction to this report, we stated that we do not automatically presume that the burden<br />
falls on Canadian regulators to justify the persistently lower <strong>ROE</strong>s allowed relative to their US<br />
counterparts. First, those numbers may not fairly gauge the treatment of Canadian gas<br />
distributors on the part of regulators. Second, those <strong>ROE</strong>s may combine with other aspects of<br />
Canadian financial markets or regulatory procedures that do not generalize to the US. Third, the<br />
relative <strong>ROE</strong>s may reflect business, regulatory, or financial risk differences for Canadian gas<br />
distributors versus their US counterparts.<br />
Taking these elements into account, however, it is our opinion that the generic Canadian formula<br />
itself should be the subject of scrutiny. The formula works like an “autopilot” for setting new<br />
Canadian <strong>ROE</strong>s that uses long bonds as the only contemporary gauge of financial markets—<br />
instead of directly targeting equity costs. If the new autopilot has been setting a different course<br />
than the case-by-case “human” pilots that previously characterized Canadian <strong>ROE</strong>, and still<br />
characterize US <strong>ROE</strong> setting, then the autopilot should bear the burden of showing that it is not<br />
biased. We cannot conclude going in that the group of independent regulators setting their own<br />
<strong>ROE</strong>s on a case-by-case basis are the ones to be exhibiting a bias.<br />
Figure 1 in our report, showing a marked split in the allowed <strong>ROE</strong>s in Canada and the US,<br />
demands the examination of three issues regarding the meaning and comparability of the relative<br />
<strong>ROE</strong>s before the question of whether the Canadian formula has exhibited a bias in recent years<br />
can be addressed:<br />
We explain that under both Canadian and US regulatory methods, the <strong>ROE</strong> is the measure of<br />
cost of capital that enters the formula to make “just and reasonable” rates. It is the measure<br />
of compensation allowed for the capital that investors devote to the service of the public at<br />
the time rates are set. What happens afterward—in other words, what the utilities actually<br />
achieve in profitability—is a different matter. The actual returns reflect many things<br />
including management effectiveness, sales growth, the weather, macroeconomic<br />
considerations, changes in capital costs, etc. But regulatory treatment of investor-owners is<br />
tightly bound to the <strong>ROE</strong>. We conclude that allowed <strong>ROE</strong> is the proper metric for<br />
comparison.<br />
We find that the regulatory institutions and customs for setting regulated prices for investorowned<br />
Canadian and US utilities are very alike. That is, in accounting, administrative<br />
procedures, regulatory legislation, and basic constitutional protections of private property,<br />
little or nothing separates the average Canadian from the average US regulatory jurisdictions,<br />
unlike newly-privatized utilities in new regulatory jurisdictions overseas, where regulatory<br />
institutions are young (and largely untested),. There are of course differences in regulatory<br />
treatment from province to province and from state to state. But we find generally that there<br />
is no persistent difference in regulatory legislation or rule making between Canada and the<br />
7
US. 5 As such, the cost of equity capital is comparable between the two countries as long as<br />
the risk of gas distributors is the same or similar on both sides of the border.<br />
We examine the definition of risk to investors of placing their capital at the use of the public,<br />
for which the <strong>ROE</strong> provides compensatory payment. We look at how those risks could be<br />
different in Canada versus the US. What we find is that the basic sources of risk—<br />
regulatory, business and financial—are comparable with respect to both jurisdictions.<br />
Objective and disinterested analyses of the relative risks between Canadian and US utilities<br />
are rare, but what we have found points to no smaller risks in Canada. As such, we conclude<br />
that there is no objective evidence showing that business or regulatory risks are sufficiently<br />
lower in Canada to account for the divergences shown in Figure 1.<br />
With this analysis, our conclusion is inescapable. The Canadian <strong>ROE</strong>s produced by the generic<br />
Canadian <strong>ROE</strong> formula are biased downward. The formula has, since its inception, ridden on<br />
autopilot the declining Canadian long-bond interest rates (the cost of a kind of debt) with no<br />
independent check on the cost of equity. The generic Canadian formula might not always be<br />
biased, and indeed in an era of stable interest rates and equity markets it may have held a true<br />
course for many years. But is has been overtaxed by the relatively unprecedented decline in<br />
interest rates since the late 1990s. The uncorrected, un-calibrated formula—not risk differences<br />
or inherent Canadian regulatory differences—has driven the divergence between observed<br />
Canadian and US <strong>ROE</strong>s.<br />
The manifest remedies are either to return to “human” pilots (representing case-by-case <strong>ROE</strong><br />
determinations) or re-calibrate the Canadian generic formula by re-examining the current<br />
relationship between the contemporaneous cost of debt and gas utility equity. Given the<br />
similarity in the jurisdictions, the institutions of regulation and capital markets, it would be<br />
useful in our opinion to employ both Canadian and US gas utility equities in such an analysis,<br />
along with both of the main cost of equity models (DCF and CAPM). Without a new calibration,<br />
it is likely that as long as the interest rates in Canada and the US remain low, the generic <strong>ROE</strong><br />
formula will continue to fly off course—essentially treating Canadian utility investors unfairly<br />
and slowly taxing their financial health in this era of low interest rates.<br />
5 If one threw all 63 federal and provincial/state regulatory statutes (13 for Canada, 51 from the US) into one pile<br />
with all the names blacked out, we would challenge anyone to sort them into a Canadian or US pile based on<br />
their content alone.<br />
8
III. AN EVIDENT DISPARITY IN CANADIAN AND US ALLOWED<br />
RETURNS<br />
This report is propelled by the need to examine the persistent gap between the allowed returns on<br />
equity for ratemaking purposes between Canadian and US regulators. 6 This section examines<br />
what the divergence is and where it comes from. It examines whether the <strong>ROE</strong> figures in<br />
Canada and the US are both a reasonable and comparable metric for determining effective<br />
regulatory control over profitability in both countries, and also describes how the Canadian <strong>ROE</strong><br />
formula works.<br />
There are two key questions. First, does the divergence mean anything? Is the <strong>ROE</strong> (as opposed<br />
to earned returns) the right metric for comparison? Second, are the economies comparable<br />
enough (given differences in taxes, etc.—everything but regulatory risk) to permit <strong>ROE</strong><br />
comparisons.<br />
A. The Divergence between Canadian and US Allowed Returns for<br />
Ratemaking<br />
Figure 1 shows that Canadian allowed returns were, at one time, higher than those allowed in the<br />
US, but that this changed during 1997. Since then, Canadian allowed returns have been<br />
markedly lower than those in the US.<br />
Figure 1 was compiled using data submitted by members of the Canadian Gas Association<br />
(CGA) for Canada and data gathered from Regulatory Research Associates for the US. The<br />
CGA submitted data for 8 Canadian LDCs, although data were not available for every LDC for<br />
every year. The number of rate case decisions for US LDCs for which Regulatory Research<br />
Associates data were available varies from 10 in 1999 to 42 in 1993. The data used to construct<br />
Figure 1 is presented in Table 1 below.<br />
6 It is important to keep in mind that “allowed returns” (i.e., <strong>ROE</strong>) means the rate of return equity, permitted in a<br />
rate case proceeding, to form a component of regulated prices. It does not refer to an attempt by regulators to<br />
control the return on capital actually earned by utilities once those rates are set. Ratemaking in Canadian and US<br />
jurisdictions is generally a prospective exercise.<br />
9
Figure 1: Allowed Return Average Differential (Canada-US) for Gas Distribution <strong>Utilities</strong>, 1992-2007<br />
1.5<br />
1.0<br />
0.5<br />
0.0<br />
-0.5<br />
-1.0<br />
-1.5<br />
-2.0<br />
1992<br />
1993<br />
1994<br />
1995<br />
1996<br />
Source: Canadian Gas Association, Regulatory Research Associates.<br />
1997<br />
1998<br />
1999<br />
• Figure 1 was generated by subtracting the average allowed US <strong>ROE</strong> from the average<br />
allowed Canadian <strong>ROE</strong> for each year. This differential for Canada ranges from 121 basis<br />
points above US <strong>ROE</strong>s in 1993 to 164 basis points below in 2007. Starting in 1997, the<br />
differential has been consistently negative; indicating that, over the past decade, average<br />
allowed US <strong>ROE</strong>s are higher on average than those in Canada. These average allowed<br />
<strong>ROE</strong>s for both countries are presented on<br />
Table 1.<br />
2000<br />
2001<br />
2002<br />
2003<br />
2004<br />
2005<br />
2006<br />
2007<br />
10
Table 1: Canada-US Average Allowed Return Differential, 1992-2007<br />
Canada US Difference<br />
1992 12.88 11.98 0.89<br />
1993 12.58 11.37 1.21<br />
1994 11.44 11.24 0.19<br />
1995 12.03 11.44 0.59<br />
1996 11.68 11.12 0.56<br />
1997 11.01 11.31 -0.29<br />
1998 10.38 11.52 -1.15<br />
1999 9.52 10.64 -1.12<br />
2000 9.80 11.35 -1.55<br />
2001 9.64 10.96 -1.32<br />
2002 9.61 11.10 -1.48<br />
2003 9.79 10.97 -1.18<br />
2004 9.55 10.63 -1.08<br />
2005 9.52 10.41 -0.89<br />
2006 8.99 10.43 -1.45<br />
2007 8.71 10.35 -1.64<br />
By the simple metric of average <strong>ROE</strong>s in Canada and the US, a clear disparity has emerged.<br />
This disparity was the subject of a recent report by Concentric Energy Advisors, which examined<br />
the disparity between Ontario LDCs and US LDCs in particular. The Concentric Report<br />
concludes that Canadian <strong>ROE</strong>s were more sensitive to the drop in bond yields over this period<br />
than were US <strong>ROE</strong>s. 7 Further, the Concentric Report suggests that this sensitivity arose through<br />
the adoption of an automatic adjustment mechanism that explicitly ties Canadian <strong>ROE</strong>s to longbond<br />
prices. 8<br />
B. Is Allowed <strong>ROE</strong> the Proper Metrics for the Comparison of the<br />
Treatment of <strong>Utilities</strong> by their Regulators?<br />
A threshold question is whether the figures in Table 1 mean anything in terms of assessing<br />
regulatory treatment in Canada versus the US. That is, given the unique economic and financial<br />
contexts of each country, are <strong>ROE</strong>s structurally different such that an allowed return in the<br />
Canada does not mean the same thing as an allowed return in the US?<br />
Three issues arise in answering this question. First, is the <strong>ROE</strong> the proper metric, as opposed to<br />
the return that the utilities in question have actually achieved during the period of time the rates<br />
were in effect? It is a question that arises often in comparison of <strong>ROE</strong>s. Second, does capital<br />
flow freely between countries? If capital does not flow between countries, allowed returns are<br />
7<br />
Concentric Energy Advisors, “A Comparative Analysis of Return on Equity of Natural Gas <strong>Utilities</strong>,” prepared<br />
for Ontario Energy Board (2007). p. 2.<br />
8<br />
Id., p. 56.<br />
11
likely to not be comparable as capital costs would reflect strictly national macroeconomic<br />
considerations. Third, given the distinct tax and financial environments, such as differences in<br />
country-specific interest rates, are allowed returns similar indicators in both Canada and the US?<br />
This section examines these issues in turn.<br />
1. Allowed <strong>ROE</strong>s versus Achieved Returns<br />
Is the allowed <strong>ROE</strong> the proper metric, or are the returns that the utilities in question have actually<br />
achieved during the period of time the rates were in effect the relevant indicator? We readily<br />
conclude that the answer is yes: allowed <strong>ROE</strong>s are the proper metric. Both in Canada and the<br />
US, the general manner of regulatory control is for regulators to set reasonable rates and then<br />
allow utilities to do the best they can to make a business and earn a reasonable return against<br />
those rates. That is to say, utilities in Canada and the US are not cost-plus businesses that can<br />
appeal to cover costs after the fact. <strong>Utilities</strong> are not confined to any particular return. There are<br />
admittedly exceptions (which we consider idiosyncrasies) to this general statement—but the<br />
character of ratemaking control in both countries is prospective.<br />
For over a century, both in Canada and the US, the pull between private enterprise and the public<br />
welfare has been settled just this way: regulators deem the return to be considered “just and<br />
reasonable” and the private utility subsequently does its best to profit—until such time as the<br />
regulator or the utility request that the question of the forward-looking just and reasonable rates<br />
should be adjudicated again.<br />
It follows that if the ratemaking mechanisms defined by regulatory legislation and rulemaking<br />
(i.e., how costs are added together and then divided by measured sales to form the rate) are the<br />
same in Canada and the US, then the allowed <strong>ROE</strong>s are directly comparable. After the fact,<br />
some utilities may profit more than others (e.g., those in fast-growing service territories versus<br />
slow-growing ones). 9 Or there may be some times when it is easier than others for utilities to<br />
profit (i.e., when capital costs are generally falling rather than rising against a fixed set of just<br />
and reasonable rates). But with the commonality of ratemaking mechanisms in Canada and the<br />
US, the role of the allowed <strong>ROE</strong> is the same. Hence, its comparability across jurisdictions is<br />
proper.<br />
If ratemaking procedures and operating conditions are comparable in Canada and the US, there<br />
would be no reason to expect utilities in either country would regularly earn more than the<br />
allowed <strong>ROE</strong>. Figure 2 shows that, as we would expect, given our review of the mechanisms of<br />
rate regulation in Canada, earned returns have been both above and below allowed returns in<br />
9 There is a comparison between returns for Canadian and US regulated pipelines, offered in NEB RH-2-2004 by<br />
CAPP (the Canadian Associate of Petroleum Producers) that might seem to suggest a persistent success in<br />
achieved returns for Canadian companies versus their US counterparts (although we have not looked closely into<br />
the sources or particular reasons for those results reported by CAPP). We note, however, that these are returns<br />
obtained by federally-regulated interstate pipeline companies, not local gas utilities. Those pipeline companies<br />
do not have the public service obligations or stable customer base of distribution companies, and they are not<br />
informative to the comparison of the Canadian versus US utility <strong>ROE</strong>s. See: NEB, Reasons for Decision RH-2-<br />
2004 Phase II (2005), Figure 5-1.<br />
12
Canada since the inception of the formula. In our experience, this pattern of allowed versus<br />
actual <strong>ROE</strong>s, reflecting occasional average divergences, is characteristic of utilities in the US as<br />
well.<br />
Figure 2: Allowed versus Earned Returns For Gas Distributors in Canada, 1992-2007<br />
14.00<br />
12.00<br />
10.00<br />
8.00<br />
6.00<br />
4.00<br />
2.00<br />
0.00<br />
1992<br />
1993<br />
1994<br />
1995<br />
1996<br />
Source: Canadian Gas Association<br />
1997<br />
1998<br />
1999<br />
2000<br />
2001<br />
2002<br />
2003<br />
2004<br />
2005<br />
2006<br />
2007<br />
allowed<br />
actual<br />
We show Figure 2 merely as a way of dealing again with the statement that earned returns—an<br />
ex post measure of utility performance against a fixed set of “just and reasonable rates”—is not<br />
exceptional in Canada. There is nothing, to us, in Figure 2 that removes the reasonable use of<br />
Figure 1 as a reason to question whether Canadian <strong>ROE</strong> methods lately have been causing a<br />
divergence in the fair return between Canada and the US.<br />
2. <strong>Capital</strong> Flows<br />
There is no doubt that Canada and the US can experience unique macroeconomic conditions<br />
(interest rates, inflation, GDP growth, etc.). That said, Canada and the US share the longest,<br />
largest and most open trade border in the world. There has not been a shot fired in anger across<br />
this border since 1812. Canada-US trade is open, with few import or export taxes or tariffs.<br />
13
Energy trade in North America is governed by the North American Free Trade Agreement<br />
(NAFTA), the Canada-US Free Trade Agreement (FTA), and the General Agreement on Tariffs<br />
and Trade (GATT). Among other things, NAFTA has “provided the building block for the<br />
emergence of a cooperative North American market for energy goods.” 10<br />
Today, there are:<br />
35 cross-border natural gas pipelines between the US, Canada, and Mexico.<br />
22 cross-border oil and petroleum product pipelines.<br />
51 cross-border electric transmission lines.<br />
These facilities physically bind Canada and the US together. 11 This physical integration is<br />
matched by capital market integration as well. Since deregulation of the wellhead price of<br />
natural gas (1985 in Canada, 1981 in US), trade in this “increasingly significant sector” would be<br />
based on “internationally-recognized, non-discriminatory market access principles.” 12 With<br />
competitive markets for the gas commodity and for transport capacity, shippers can negotiate for<br />
gas supplies and pipeline space on transmission systems in both Canada and the US, searching<br />
for the most economical mix of commodity and transport costs. The situation between Canada<br />
and the US is remarkable—unlike many parts of the world, where pipelines are not built if it<br />
means passing through other countries.<br />
There does appear to be a preference for domestic investment, especially by pension funds and<br />
other “trustee investments,” which could result in segmented capital markets. However, many<br />
Canadian firms are cross-listed on US exchanges—including Enbridge. As identified by the<br />
Concentric report, US investors do play a significant, albeit less prominent, role in the<br />
capitalization of Canadian utilities. 13 To the extent that the trustee investments in Canadian<br />
utilities represent a structural barrier to investing outside the country, then the cross-border<br />
equity investments from the US are a marginal source of funds. 14 Furthermore, some Canadian<br />
utilities and their parent companies engage in business in the US and abroad, indicating that<br />
utility companies are not regionalized.<br />
One test of the comparability of allowed utility returns is the cost of capital for non-utility firms<br />
in Canada and the US. It may be that there are structural differences in the cost of capital<br />
10 See: North American Energy Working Group, “North American Natural Gas Vision,” Experts Group on Natural<br />
Gas Trade and Interconnections, January 2005:<br />
http://www2.nrcan.gc.ca/es/es/naewg/NANaturalGasVision_e.cfm (Accessed on October 28, 2007).<br />
11 Id., p. 34.<br />
12 Id., p. 10.<br />
13 Concentric, supra note 4 p. 50.<br />
14 Under the efficient markets hypothesis, the marginal investor sets the price for a security. To the extent that this<br />
hypothesis holds, it may be that US investors are leading the valuation of Canadian firms. See: Ibbotson, R.G.<br />
and G.P. Brinson, Global Investing: The Professional’s Guide to the World <strong>Capital</strong> Markets, McGraw-Hill: New<br />
York (1993), p. 37-41.<br />
14
etween Canada and the US that would result in a categorically lower cost of capital for<br />
Canadian firms, reflecting a lower opportunity cost of investment for Canadian utilities.<br />
In an attempt to address this question, a 2007 study by researchers at the Bank of Canada<br />
estimated a cost of capital 30-50 basis points higher for Canadian firms than US firms, all else<br />
equal. The study estimated cost of capital based on a forward-looking, discounted cash flow<br />
(DCF) analysis of Canadian and US firms from 1988 to 2006. 15 This study takes into account<br />
forward-looking investor expectations, and is evidence that the cost of capital does not appear to<br />
be categorically lower in Canada.<br />
3. Tax Differences<br />
Differences in tax laws have been proposed in some previous discussions about the differences in<br />
recent Canadian and US allowed returns as a potentially confounding factor in Canada-US<br />
comparisons. Tax rates facing Canadian and US investors are indeed different, both for domestic<br />
and cross-border investments. However, it is the practice of Canadian and US regulators to set<br />
allowed <strong>ROE</strong>s on a pre-tax basis, permitting income taxes for the utility, as such, to enter the<br />
ratemaking formula as a pass through expense in permitted rates. 16 In other words, income taxes<br />
are treated in both jurisdictions as a measurable expense when grossing up the pre-income-tax<br />
<strong>ROE</strong> to calculate a post-income-tax figure for use in setting consumers charges. Therefore, as<br />
the income tax treatment is similar, if the institutional, financial and economic risk environments<br />
are comparable, <strong>ROE</strong>s are comparable as well, regardless of differences in taxation.<br />
4. Macroeconomic Interest Rates<br />
If interest rates forecasts are substantially lower in Canada, the apparent disparity in allowed<br />
returns may simply be a byproduct of lower underlying capital cost rates, and there may be no<br />
difference in the relevant fair <strong>ROE</strong> awarded by Canadian and US regulators.<br />
As Figure 3 shows, interest rates have been in rough parity since the beginning of the<br />
divergence, and US long-bond yields were even below Canada’s for much of the time. This<br />
would indicate that macroeconomic interest rates are not driving the divergence since 1998<br />
(although they may account for some of the positive divergence before that time), given that US<br />
interest rates have been both above and below Canada’s rates during the period of interest.<br />
15 Witmer, J. and Zorn, L. “Estimating and Comparing the Implied Cost of Equity for Canadian and U.S. Firms”<br />
Bank of Canada Working Paper 2007-48 (2007). Available at: http://www.bank-banquecanada.ca/en/res/wp/2007/wp07-48.pdf<br />
(Accessed on 11/15/07).<br />
16 The income taxes on dividends or capital gains for individual investors are not a subject of concern to Canadian or<br />
US regulators—only the income taxes that form a part of compensatory rates for the utility.<br />
15
Figure 3: Long-Term Bond Yields in Canada and the United States (1996-2006)<br />
9<br />
8<br />
7<br />
6<br />
5<br />
4<br />
3<br />
2<br />
1<br />
0<br />
1/2/1996<br />
1/2/1997<br />
1/2/1998<br />
1/2/1999<br />
1/2/2000<br />
1/2/2001<br />
Source: US Treasury Department and Bloomberg<br />
C. The Source and Form of the New Canadian <strong>ROE</strong> Methods<br />
1/2/2002<br />
1/2/2003<br />
1/2/2004<br />
1/2/2005<br />
1/2/2006<br />
US 30-yr<br />
CA 30-yr<br />
Beginning in 1994, Canadian regulators—first some, then others—have adopted automatic<br />
adjustment mechanisms for setting the <strong>ROE</strong> in utility rates based on a fixed spread with observed<br />
movements in Canadian interest rates on long bonds. In these jurisdictions, the <strong>ROE</strong> is<br />
automatically adjusted annually based on movements in long-term bond forecasts.<br />
The approach used by the NEB, Ontario, Quebec and Alberta is to establish a “benchmark” <strong>ROE</strong><br />
that is applied to all utilities, with individual business risks taken into account when the capital<br />
structure is “deemed.” 17 The generic <strong>ROE</strong> is then adjusted annually as follows:<br />
17 <strong>Capital</strong> structures are “deemed” in Canada based on relative business risk. An LDC with more business risk will<br />
be deemed a higher equity ratio in its capital structure to raise the overall weighted average cost of capital. This<br />
contrasts with the US, where LDCs are predominantly allowed to choose their capital structure within a band of<br />
reasonableness.]<br />
16
1. The forecast yields on 3 and 12 month out 10-year Canadian bonds are obtained from<br />
the most recent forecast by Consensus Economics.<br />
2. These two forecasts are then averaged.<br />
3. To get an estimate for a 30-year forecast, the result is adjusted to reflect the actual<br />
spread between 10-year and 30-year bonds in the previous month as reported in The<br />
Financial Post.<br />
4. This estimated 30-year forecast is subtracted from the previous years’ forecast.<br />
5. The difference is multiplied by 0.75.<br />
6. The new <strong>ROE</strong> is previous years’ <strong>ROE</strong> plus (minus) the result.<br />
Some provinces may use a slightly different adjustment, but the process is largely similar. The<br />
<strong>ROE</strong> adjustment is shown in Equation 1.<br />
<strong>ROE</strong><br />
t<br />
= <strong>ROE</strong>t<br />
−1<br />
+ . 75(<br />
Forecastt<br />
− Forecastt<br />
Using this formula, the following rates would result from a benchmark <strong>ROE</strong> of 12 percent based<br />
on interest rates of 8 percent if interest rates were to fall.<br />
Table 2: Hypothetical Formula-Based <strong>ROE</strong>s<br />
Bond Allowed<br />
forecast <strong>ROE</strong><br />
8.00 12.00<br />
7.00 11.25<br />
6.00 10.50<br />
5.00 9.75<br />
4.00 9.00<br />
3.00 8.25<br />
The formula approach was first introduced in British Columbia in 1994 before being adopted by<br />
Manitoba and the NEB in 1995. Ontario adopted the NEB approach for 1997, and was followed<br />
by Quebec in 1999. Finally, Alberta adopted formula adjustments in 2004.<br />
−1<br />
)<br />
(1)<br />
17
Table 3: Major Jurisdictions Implementing Formula-Based <strong>ROE</strong>s<br />
Regulator Jurisdiction Case ID Year<br />
British Columbia Utility<br />
Commission (BCUC)<br />
National Energy Board<br />
(NEB)<br />
Public <strong>Utilities</strong> Board of<br />
Manitoba (PUBM)<br />
Ontario Energy Board<br />
(OEB)<br />
British Columbia<br />
Federal<br />
Decision in the Matter of<br />
Return on Common Equity,<br />
June 10, 1994<br />
Reasons for Decision re: RH2-<br />
94 Cost of <strong>Capital</strong>, March 1995<br />
1994<br />
1995<br />
Manitoba PUB Order 49/95 1995<br />
Ontario<br />
Draft Guidelines on a Forumla-<br />
Based Retun on Common<br />
Equity for Regulated<br />
Companies<br />
1997<br />
Regie de l'Energie Quebec D-99-11 1999<br />
Alberta Energy <strong>Utilities</strong><br />
Board (EUB)<br />
The 0.75 adjustment factor arose out of the 1995 NEB formula decision. The formula is based<br />
on the historical observation that allowed returns tend to move in the same direction as long-term<br />
bond yields. There was a desire to protect utility customers from high bond yields and<br />
shareholders from low bond yields, so the NEB decided to weight the <strong>ROE</strong> movement by 0.75<br />
times the change in bond prices. Previously, Manitoba had used a 0.8 adjustment, while British<br />
Columbia made one-to-one adjustments if bond prices moved outside of a certain band.<br />
Before the formula can be applied, a base <strong>ROE</strong> must be calculated. The benchmark <strong>ROE</strong> may be<br />
arrived at in a variety of ways, and is set in a manner similar to the setting of <strong>ROE</strong>s in the US.<br />
Equity risk premium (ERP) analysis, capital asset pricing model (CAPM) analysis and, less<br />
often, comparable earning analysis are all taken into consideration. Notably, the DCF method is<br />
given little to no weight, for a variety of reasons. For example, the NEB has acknowledged that<br />
the DCF test is theoretically sound, but raised concerns about practical difficulties. 18<br />
Not all major Canadian jurisdictions had implemented formula-based <strong>ROE</strong>s when US and<br />
Canadian returns began to diverge. However, the jurisdictions retaining case-by-case analyses<br />
seemed to set <strong>ROE</strong>s in a manner that was highly sensitive to changes in the bond markets. 19 One<br />
could therefore view the “formula” jurisdictions as price leaders who set the standard for<br />
following the decline in bond prices in the setting of returns.<br />
18 NEB, Reasons for Decision RH-2-94 (1994) §2.5.<br />
Alberta 2004-052 2004<br />
19 See, Alberta Energy and <strong>Utilities</strong> Board (EUB), Canadian Western Natural Gas Co. Ltd. 1997 Return on<br />
Common Equity and <strong>Capital</strong> Strucutre and 1998 General Rate <strong>Application</strong>, Decision 2000-9 (2000). On page<br />
65, the EUB states, “[t]he Board notes that interest rates and bond yields have significantly declined during the<br />
time frame… Consequently, this significant reduction in interest rates will have a major impact on the<br />
determination of a fair return for a utility.”<br />
18
The unique feature of the Canadian <strong>ROE</strong> formula is that is sets a gap between Canadian long<br />
bonds and the fair <strong>ROE</strong>, as shown in Figure 3. The only reason that the <strong>ROE</strong> does not move in<br />
lock step with the long bond is the notion that the spread grows/shrinks with the move in the<br />
bond, by a quarter of the bond’s movement. We say “notion” purposely, because the formula’s<br />
tie between long bonds and <strong>ROE</strong> is not based on financial evidence on the contemporaneous<br />
spread between what the market requires as a return on bonds as opposed to a return on equity<br />
investments in Canadian utilities.<br />
This last point bears emphasis. For those jurisdictions that have adopted the formula shown in<br />
Equation 1, or those jurisdictions led by those who do, the only new evidence determining <strong>ROE</strong><br />
in utility rate cases is the movement in long-bond interest rates. Nothing in the application of the<br />
formula, as a factual matter, attempts to gauge contemporaneous equity cost rates. Rather, the<br />
formula adjusts <strong>ROE</strong>s based on the historical observation that allowed <strong>ROE</strong>s move in the same<br />
direction as bond yields.<br />
In this fashion, the Canadian formula diverges from attempts in the US to streamline cost of<br />
capital proceedings by implementing a generic formula for the cost of capital. There have been<br />
two highly visible attempts to do such a thing in the US, by the Federal Energy Regulatory<br />
Commission (FERC) in the late 1980s and by the New York Public Service Commission<br />
(NYPSC) in the early 1990s. 20 In both of those cases, the target of the generic formulae was the<br />
cost of equity, using contemporaneous market information with theoretical models designed<br />
specifically to gauge equity costs.<br />
Neither the FERC nor the NYPSC methods ultimately resulted in an abandonment of a case-bycase<br />
examination of the cost of equity. The FERC methods have streamlined somewhat the<br />
construction of the “proxy groups” for gathering market information on similarly-situated<br />
regulated firms and have basically set the form of the theoretical formula for combining stock<br />
yields plus analyst growth rates (in the “yield plus growth” or DCF formula). Those streamlines<br />
aside, the FERC generally dropped its pursuit of a generic formula by about 1992 over legal<br />
concerns that a company-specific record must support the finding of a fair return. The FERC<br />
since has not departed from a case-by-case examination of the cost of equity. The NYPSC<br />
formula, for its part, was created after a multi-month process costing some millions of dollars. It,<br />
too, centered on a formula for deriving the cost of equity (rather than the long bond rates plus a<br />
pre-determined spread), but it was never adopted formally by the NYPSC.<br />
IV. THE TRADITIONAL CASE-BY-CASE METHODS OF CANADIAN<br />
AND US REGULATORS<br />
Rate cases in the US are relatively standardized affairs. This is not to say that US commissions<br />
never err in their decisions, that all commission decisions are objective or that rate cases are<br />
20 FERC Order 442 Generic Determination of Rate of Return for Public <strong>Utilities</strong>, Docket No. RM85-19-000; New<br />
York Public Service Commission, Generic Financing Proceeding, Case No. 91-M-0509.<br />
19
never protracted battles. Property rights and US regulation are continually evolving and have<br />
only reached their current state through experimentation and judicial rebuke.<br />
In an attempt to relieve the regulatory burden the FERC intended to move to a generic <strong>ROE</strong><br />
approach in the 1980s with Orders 420, 442 and 461, and similar efforts were made by the<br />
NYPSC and the Federal Communications Commission (FCC) in telecommunications. However,<br />
the generic <strong>ROE</strong> pursued in these cases was never applied extensively and fell into disuse. US<br />
<strong>ROE</strong>s are now determined the same way they have always been determined: through discounted<br />
cash flow (DFC) analysis that examines a comparable group similar to the utility in question.<br />
US gas utilities generally do not generally undergo annual rate cases. 21 Rather, the <strong>ROE</strong> stands<br />
until either the utility requests a rate case or the commission judges that conditions have changed<br />
enough to warrant a re-examination of rates. To streamline rate cases, commissions have<br />
objectivity standards that include the need for a theoretical justification of the methods used and<br />
all subjective decisions are justified in the public record. These standards help to ease contention<br />
in rate cases and limit the discussion to manageable issues.<br />
In this section we will explore the methods used for rate setting in a case-by-case environment.<br />
We begin with the most popular method in the US, the DCF, before examining the CAPM and<br />
other ERP methods. Finally, we discuss the role of capital structures in case-by-case ratemaking.<br />
A. Discounted Cash Flow (DCF) or “Yield Plus Growth”<br />
The most popular method used to determine the <strong>ROE</strong> among US regulatory commissions is to<br />
determine what future stream of common dividends investors expect on a case-by-case basis<br />
using discounted cash-flow (DCF) analysis. Its popularity is a function of its ease of use and<br />
comprehension by finders of fact not necessarily particularly versed in financial theories. At its<br />
most fundamental level, the DCF method endeavors to compute the cost of equity capital by<br />
summing the two sources of equity investor returns—the “yield” portion (meaning the dividend<br />
yield with respect to the stock price) and the “growth” portions—the rise in the stock price that<br />
investors expect to see. In a world of complicated ratemaking formulae and financial theories, it<br />
is no surprise that “yield plus growth” has an intrinsic appeal, particularly when there are many<br />
sorts of similar utilities by which to gauge the sum of these two common-sense factors that make<br />
up the <strong>ROE</strong>. The formal statement of the DCF methodology grew out of Professor Myron J.<br />
Gordon’s work on stock valuation models, which was first published in complete form in 1962. 22<br />
Part of the DCF formula that may not appeal to analysts and regulators is the growth rate<br />
expected by investors. That growth rate is inherently inscrutable, and in small capital markets<br />
21 California has annual adjustments to rates, but that is a unique US jurisdiction and not in any way an indicator of<br />
what happens in the rest of the country. The tortured experience associated with the lead up and aftermath of the<br />
California energy crisis of 2000-2001 continues to cast regulatory procedures there in a unique light.<br />
22 See Gordon, M.J. The Investment, Financing and Valuation of the Corporation (Homewood, IL: Richard D.<br />
Irwin Inc., 1962; reprint, Westport, CT: Greenwood Press, Publishers, 1982).<br />
20
(such as many utility jurisdictions overseas), it is very hard to gauge investor expectations and<br />
thus to apply the DCF model. But in the US, where the model retains its great popularity, a<br />
robust industry of independent stock market analysts helps greatly. Both in print and on the web,<br />
disinterested estimates of utility growth rates are readily available to assist in the calculation of<br />
DCF-derived <strong>ROE</strong> figures. Combining these publicly-available growth rate estimates with the<br />
availability of a number of similar-risk companies, in “proxy groups,” allows regulators to enjoy<br />
the stabilizing influence of the law of large numbers in setting the <strong>ROE</strong>. 23 For practical-minded<br />
regulators looking for stable, understandable and objective evidence, its popularity is no surprise.<br />
DCF analysis involves making selections at two key stages: first, the analyst selects a specific<br />
“proxy group” of utilities facing similar risks and then selects the various of inputs such as the<br />
growth rate. Many of the practical concerns of Canadian regulators over these selections have<br />
been addressed in US jurisdictions, and the regulatory burden of case-by-case ratemaking has<br />
been lightened by establishing consistent selection criteria at each stage. One concern unique to<br />
Canadian jurisdictions, however, is the applicability of proxy groups that contain US utilities.<br />
Given the degree of capital market integration, the degree of cross-border gas trade, and the<br />
international presence of several Canadian LDCs, we believe that a proxy group that includes US<br />
utilities facing similar risks would be appropriate for Canadian utilities. We will examine in<br />
Section IV whether the risks facing Canadian utilities are, in fact, comparable to those facing US<br />
utilities but, so long as Canadian regulators are attentive to potential macroeconomic divergence,<br />
we see no economic or financial factor that would confound the use of proxy groups that include<br />
US utilities.<br />
B. Equity Risk Premium (ERP) and the <strong>Capital</strong> Asset Pricing Model<br />
(CAPM)<br />
Equity risk premium (ERP) analysis is based on the observation that it is more risky to hold<br />
equity than bonds. Assuming that investors are risk adverse, they will require a higher return to<br />
hold assets with higher risk. Equity returns therefore carry a premium over bond returns. If riskfree<br />
bond yields could be identified and the equity premium could be estimated, the cost of<br />
capital will result.<br />
There are a wide variety of methods for estimating the cost of capital along these lines, the most<br />
popular of which is the capital asset pricing model (CAPM). The CAPM formula itself is rather<br />
straightforward. Its components are: (1) the risk free rate of return; (2) the market rate of return;<br />
and (3) the beta. These inputs are combined to estimate the <strong>ROE</strong>.<br />
23 In practical terms, the “law” describes the stability of a random variable, with repeated sampling. That is, given a<br />
sample of independent and identically distributed random variables, the sample average will approach and stay<br />
close to the true population average as the size of the sample increases. This is a long way of saying that the<br />
<strong>ROE</strong> results from a “proxy group” sample of similar utilities are more representative of the actual <strong>ROE</strong> than the<br />
<strong>ROE</strong> for a single company alone.<br />
21
<strong>ROE</strong> = Risk-Free Rate + β(Market Return) (2)<br />
Despite this algebraic simplicity, there are different methods to obtain each of these components<br />
and to compute the required rate of return. The effects of choosing one method over another can<br />
substantially change the required cost of capital. Because CAPM, with the exception of the beta<br />
term, does not have the “law of large numbers” properties in a comparable group that the DCF<br />
has, there is less reason to focus primarily on a comparable group rather than the utility in<br />
question, especially when the beta is significantly different from that of the proxy group.<br />
The practical elements of the CAPM formula are full of contention. For example, the beta term<br />
relates the movement in an individual company stock price compared with that of the entire<br />
market for stocks. Greater relative movement vis-à-vis the market means a higher beta. Those<br />
betas published by investment analyst houses (such as Value Line, Merrill Lynch or others) make<br />
use of an adjustment procedure that moves “raw” betas toward 1.0. The “adjusted” published<br />
betas are generally the ones used by US regulators when they make reference to the CAPM.<br />
The other area of contention is the market return—defined as the premium that the market for<br />
equities demands as a spread on the risk free rate. Market risk premiums are not published, but<br />
have to be derived. Some are based on historical achieved returns and others try to gauge<br />
investor expectations on future equity returns not unlike those who perform a DCF analysis. In<br />
rate case application of the CAPM, there is always dissension among interested parties regarding<br />
the size of the market risk premium, as its choice directly affects the level of “just and<br />
reasonable” rates. Practical-minded regulators wrestle with this issue.<br />
• Despite these areas of contention, one benefit of the use of the CAPM is that the theory<br />
upon which it rests provides a relatively clear method for gauging the effect of increased<br />
leverage, or “gearing,” on the cost of equity. It is well known in both financial theory<br />
and in practical investment circles that a high proportion of debt in the capital structure<br />
adds financial risk to the business risk facing a company—and raises both the cost of debt<br />
and equity. The CAPM model provides a theoretical method to compute the effect of<br />
different gearing on the <strong>ROE</strong>. 24 Indeed, in some prominent cases in the US, the this<br />
method has been used as the basis for regulators to grant higher equity costs to adjust for<br />
the use of greater gearing levels as deemed prudent by the regulator. 25<br />
24 For the theoretical formula regarding the relationship between betas (and hence equity costs) and gearing, see:<br />
Copeland, T.E., and Weston, J.F., Financial Theory and Corporate Policy, Third Edition, Addison-Wesley,<br />
Reading, Massachusetts (1988), p. 457.<br />
25 For example, in the aftermath of the electricity utility restructuring in Texas, the Public Utility Commission there<br />
approved a 50 basis point “financial risk” premium to the cost of equity for all electricity distributors in the state<br />
to reflect its desire that the utilities all move toward a higher amount of debt in their capital structures (60<br />
percent) reflecting the spin-off of their generating function. See Public Utility Commission of Texas, Order No.<br />
42: Intermin Order Establishing Return on Equity and <strong>Capital</strong> <strong>Structure</strong>, Docket No. 22344 (2000).<br />
22
CAPM is often used in US rate cases, but it is almost never used as the sole determinant of the<br />
cost of equity capital. 26 The judgment required in selecting parameters for the CAPM is no less<br />
significant than the judgment required for judicial use of the DCF, and the CAPM lacks the<br />
“central tendency” properties of DCF that smooth the results to yield a more reliable estimate.<br />
C. <strong>Capital</strong> <strong>Structure</strong><br />
Modern financial theory suggests that there is a relatively wide zone of reasonableness for capital<br />
structures, with capital structures within that zone producing about the same cost of capital. 27 In<br />
the US, a utility’s management is therefore granted a measure of discretion as to the type of<br />
capital raised. Having a solid level of financial integrity can provide rate stability and other<br />
benefits to customers, and commissions are reluctant to interfere with a utility’s capital structure<br />
unless it is pushing the bounds of reasonableness.<br />
In the US, the projected actual capital structure ratios of the utility at the time that new rates<br />
would go into effect are used to calculate a pre-tax weighted-average cost of capital. Because the<br />
rate proceeding will set rates to be charged for service in future periods, it is appropriate to base<br />
the capital structure components on the best available estimates for the period of time in which<br />
the rates will be in effect. Furthermore, the actual degree of leverage has important implications<br />
for ratemaking, as higher leverage raises financial risk and therefore the cost of capital.<br />
Financial risk is the portion of total corporate risk over and above basic business risk that results<br />
from using debt. 28 Because equity investors are the residual claimants after the payment of debt,<br />
the cost of equity increases with higher debt ratios (i.e. with higher leverage). As a company<br />
increases the portion of debt in its capital structure, investors perceive a greater chance that there<br />
will not be sufficient returns available after the payment of fixed charges. Both the Modigliani-<br />
Miller theory, a the basis for the field of finance, and empirical tests of the theory confirm this<br />
inextricable link between capital structure and the cost of equity. 29<br />
The total cost of capital is therefore U-shaped with respect to capital structure. High equity<br />
percentages raise the WACC, but the WACC also increases at high debt percentages as investors<br />
seek higher returns on equity due to the increased financial risk.<br />
26 One jurisdiction in our experience, Oregon, for some time in the 1990s and into the mid 2000s appeared to use<br />
the CAPM as the sole method for finding the <strong>ROE</strong>. It stopped that seemingly sole reliance in 2001. See Public<br />
<strong>Utilities</strong> Commission of Oregon, Order No. 01-777 (2001).<br />
27 See Morin, R., <strong>Utilities</strong>’ Cost of <strong>Capital</strong>, PUR, Arlington, VA 1984, p. 268.<br />
28 Brigham, E.E., Financial Management, Theory and Practice, Third Edition., The Dryden Press, Chicago<br />
(1982), p. 861.<br />
29 See Copeland, T.E. and Weston, J.F., Financial Theory and Corporate Policy, Third Edition., Addison-Wesley,<br />
Reading MA (1988), Chapters 13 (theory) and 14 (empirical evidence and applications).<br />
23
Hypothetical capital structures have been used in the US when it was judged that utilities were<br />
deviating from reasonable capital structures by either employing too much debt or equity in an<br />
effort to raise overall returns. Hypothetical capital structures may also be used if the utility is<br />
owned by a parent company that faces markedly difference risks from those faced by utilities and<br />
therefore carries a capital structure that would be inappropriate for a utility.<br />
In such cases, the capital structure of a comparable group of utilities is used, on the basis that<br />
comparable groups’ capital structures reflect the opportunity costs facing investors, satisfying the<br />
comparable investment standard. Very rarely would a capital structure be “deemed” in the US<br />
without consulting a comparable group and addressing why the actual capital structure chosen by<br />
the management is inappropriate.<br />
24
V. RELATIVE RISK FOR CANADIAN AND US GAS UTILITIES<br />
The previous two sections of this paper described how Canadian and US regulators have derived<br />
the <strong>ROE</strong>. This section investigates whether there is any justification for concluding that lower<br />
(higher) risks for utilities in Canada (the US) justify ten years of divergent returns.<br />
In this section, then, we first examine more carefully which risks matter to utility investors. We<br />
then examine the practical boundaries to those risks for regulated utilities in Canada and the US<br />
and upon what legal and procedural foundations those risks rest. Finally, we examine whether<br />
there is any evidence available that allows us to conclude that the divergence in Table 1 stems<br />
from any persistently lower risk in Canada for gas distributors than that level we observe in the<br />
US.<br />
A. What Risk Matters to Utility Equity Investors?<br />
Any discussion of risk in the context of utilities invites controversy. Much of this, in our<br />
opinion, comes from a colloquial as opposed to a technical definition of risk in the context of<br />
<strong>ROE</strong>. In setting a fair compensation for investors in the <strong>ROE</strong>, the risks that matter are the ones<br />
for which those investors require compensation. Colloquially, all would agree that predicting the<br />
weather is risky, but to the extent that over time weather conforms tightly to averages, the rates<br />
set on average weather patterns carry no particular risk to investors’ ability to recoup their cost of<br />
capital. That is to say, weather risk is not the same as <strong>ROE</strong> risk. For a natural monopoly gas<br />
utility whose costs are geared to serving customers with whatever local weather conditions exist,<br />
the weather does not stand between them and recouping their funds—and is not properly a part<br />
of the <strong>ROE</strong>.<br />
Weather is merely one example of the need to focus on technical risk definitions in gauging the<br />
fairness of the <strong>ROE</strong>. While the cost of service may differ between US and Canadian utilities<br />
based on their distinct geographies and other factors, both can expect the opportunity to earn a<br />
fair rate of return that is based on the returns to an investment of comparable risk.<br />
1. Regulatory Risk<br />
The risk that a gas LDC faces is inherently intertwined with regulation. Gas LDCs are a natural<br />
monopoly—the only thing standing between an LDC and monopoly profits is regulation. The<br />
greatest risk to an LDC is the risk that the regulator will not allow the utility to recover prudent<br />
costs—including the cost of capital—in a timely manner.<br />
25
2. Business Risk<br />
The business risk faced by LDCs in Canada does not significantly differ from those in the US.<br />
There are forward-looking risks facing investors that are somewhat independent from regulatory<br />
risk. These risks are limited, however, as a utility has the right to call for a rate case if<br />
significant events (such as a recession) damage its ability to earn a reasonable return on its<br />
invested capital without an increase in prices—a recourse obviously not available to unregulated<br />
firms. Business risk is therefore an interaction between regulatory risk and the business<br />
environment and many business risks can be lessened, modified or even eliminated through<br />
various regulatory practices.<br />
Forward-looking business risks include:<br />
Long-Lived Assets. Gas LDCs in Canada and the US connect to a multitude of<br />
consumers. Therefore, distributors are the ones charged with the planning of upgrades to<br />
networks that in many cases are decades old. The need for major expenditures to provide<br />
safe local service do not always follow rate case schedules, so there is often a lag<br />
between investments in long-lived assets and recovery of those costs in rates. Such risks<br />
in the cost of planning and engaging in ongoing local network maintenance are the same<br />
in both Canada and the US, and both utilize deferral accounts to mitigate this risk.<br />
Risks of service interruptions. Major or minor service interruptions are generally the<br />
responsibility of the distributor—as are the costs of remedying outages. Cracked gas<br />
mains, storm damage to electricity wires and sub-stations, are all the responsibility of the<br />
distributor, which can try to plan for—but cannot guarantee—the collection of all costs<br />
that are incurred.<br />
Adequacy of depreciation. The depreciation allowance included in distribution company<br />
rates is an estimate based on historic experience. Depreciation allowances may not<br />
consider economic obsolescence resulting from unanticipated technological change or<br />
potential large capital additions. As such, there is a risk that utility plant will be underdepreciated,<br />
and changes in technology or regulation may cause shareholders to bear the<br />
result of inadequate depreciation.<br />
Risk of technological bypass. Gas LDCs in Canada and the US are at risk of customers<br />
bypassing the network by switching fuels or adopting alternate technologies. If bypass is<br />
significant there is no guarantee that the remaining rates will be adjusted to recover the<br />
cost of abandoned or excess capacity.<br />
Risk of the competitiveness of rates. While LDCs are entitled to recover their actual,<br />
prudently-incurred cost of doing business, gas LDCs in Canada and the US are at risk for<br />
the continued viability of the overall business. Competitive pressures from distributed<br />
generation or alternate fuels could create a situation in which allowed revenues are not<br />
competitively viable.<br />
26
Risk of timeliness and adequacy of allowed revenue levels. Gas LDCs in Canada and the<br />
US face the need to increase distribution rates as costs increase. It is expensive and<br />
difficult to file for a small rate increase. <strong>Utilities</strong> would absorb such costs until they<br />
become large enough to justify the cost of a rate filing.<br />
3. Financial Risk<br />
Apart from the regulatory and business environments facing an LDC, investors face financial<br />
risk as well. Financial risk is the risk associated with carrying debt in the capital structure. Debt<br />
return (i.e., interest payments) are contractual obligations. Up to a point, raising utility funds<br />
with debt provides for a less expensive way to provide the capital needed to provide services to<br />
customers. But with greater proportions of debt, the risk that those interest payments will not be<br />
“covered” increases, and with it both the interest rate demanded by lenders and the return<br />
required by equity investors. This effect on required rates of return is well established and<br />
widely known.<br />
Financial risk is generally taken into account in setting <strong>ROE</strong>s in US rate cases. To the extent that<br />
a regulated firm’s capital structure mimics those of a group of its regulated peers, no adjustment<br />
is necessary for financial risk. One the other hand, if there is a difference between the firms in<br />
question and their peers, then an adjustment to reflect the differential financial risk may be<br />
necessary (as happened in a noteworthy case for all of the regulated electric distributors in<br />
Texas—where a 50 basis point premium for the <strong>ROE</strong> was permitted to reflect the regulator’s<br />
desire for the distribution-only utilities to take on more debt). 30<br />
The question of financial risk appears to often be obscured in Canada, where the generic <strong>ROE</strong> is<br />
provided for all utilities in a jurisdiction, leaving the issues of financial risk to be deal with in a<br />
specific deemed capital structure to address the risks of a particular distributor.<br />
B. What are the Practical Boundaries to Regulatory Risk?<br />
With any investor-owned utility, the regulator and the utility have reciprocal obligations that are<br />
generally well recognized. That is, the utility operates the service and provides the capital<br />
needed to maintain and expand the facilities that allow the public to be adequately served. For<br />
its part, the regulator provides a stable regulatory environment, oversees the adequacy of<br />
services, and offers the utility a reasonable opportunity to earn a return on its investments.<br />
30 See Texas PUC, Generic Issues Associated with <strong>Application</strong>s for Approval of Unbundled cost of Service Rates<br />
Pursuant to PURA §39.21 and PUC Subst. Rule §25.344, Docket No. 22344.<br />
27
Among its various duties, a key role for regulators is to signal, credibly, to investor-owned<br />
utilities’ investors how their investments will be recovered in regulated charges. 31<br />
Such regulation is described in the economic literature as a “form of long-term contracting.” 32<br />
Canada and the US have proven over 100 years of natural gas regulatory history that they are<br />
able to honor the “long-term contract.” The exact form of this long-term contracting has evolved<br />
throughout this history as regulators pushed against the regulatory boundaries, were reprimanded<br />
by courts, were given new direction through legislative action, and were chaired by individuals<br />
of various political inclinations as new executives were elected.<br />
In mature regulatory jurisdictions with strong legal and administrative histories, such as Canada<br />
and the US, the regulatory compact represents a concatenation of: (1) strong primary legislation;<br />
(2) credible, comprehensive and transparent administrative procedures for making regulatory<br />
decisions and adjudicating disputes; (3) accounting regulation specifically designed for utility<br />
ratemaking; and (4) clear pathways for reliable judicial review of regulatory decisions. Newer<br />
regulatory jurisdictions around the world that do not have comparable bodies of regulatory<br />
precedent routinely use explicit contracts to express such principles.<br />
1. Strong Primary Legislation<br />
Canadian regulatory legislation is effectively very similar to that in the US, although Canada<br />
does not have all of the judicial precedent regarding the constitutional protection of private<br />
property that characterizes the US. Canada’s regulatory compact is based instead on common<br />
law and “fundamental justice” but nevertheless does appear to be comparable the US in<br />
practice. 33 The US Constitution, especially the fifth and fourteenth amendments, provides the<br />
foundation that supports those protections in the US.<br />
In Canada and the US, Supreme Court interpretations of this primary legislation define the legal<br />
limitations on regulators’ ability to take action on charges that may damage the value of utility<br />
investors’ property. The best known case is that of Federal Power Commission v. Hope Natural<br />
31 This mutuality of obligations is sometimes called the “regulatory bargain” or “regulatory compact,” but those are<br />
merely convenient labels for how governments and investors have traditionally worked out how the public will<br />
be adequately served by private companies.<br />
32 Professor Oliver E. Williamson, an authority on the economics of transactions and regulation, noted that “[a]t the<br />
risk of oversimplification, regulation may be described contractually as a highly incomplete form of long-term<br />
contracting in which (1) the regulatee is assured an overall fair rate of return, in exchange for which (2)<br />
adaptations to changing circumstances are successively introduced without the costly haggling that attends such<br />
changes when parties to the contract enjoy greater autonomy.” Williamson, O.E., The Economic Institutions of<br />
<strong>Capital</strong>ism, Free Press, New York (1985), p. 347. See also Victor Goldberg, Regulation and Administered<br />
Contracts, Bell Journal Of Economics, Vol. 7 (Autumn 1976): p. 426-448.<br />
33 Canada’s equivalent to the US 14 th Amendment, Section 7 of the Charter of Rights and Freedoms, states:<br />
“[e]veryone has the right to life, liberty and security of the person and the right not to be deprived thereof except<br />
in accordance with the principles of fundamental justice.” As a relatively recent act, it remains to be seen<br />
exactly how “fundamental justice” will be interpreted but it has thus far been interpreted as more than simple<br />
procedural rights.<br />
28
Gas, in which the Supreme Court set a standard for determining “just and reasonable” returns, a<br />
standard that has stood the test of time. 34 Canada and the US share a remarkably similar<br />
regulatory mandate and their “fair and reasonable” standards for utilities returns are almost<br />
identical. Indeed, Canada’s Northwestern <strong>Utilities</strong> v. City of Edmonton anticipated the landmark<br />
US Hope case by fifteen years. Both established the opportunity cost of capital as the relevant<br />
standard by which utilities’ returns should be judged.<br />
The Supreme Court of Canada stated in Northwestern <strong>Utilities</strong>:<br />
The duty of the Board was to fix fair and reasonable rates; rates which, under the<br />
circumstances, would be fair to the consumer on the one hand, and which, on the<br />
other hand, would secure to the company a fair return for the capital invested. By<br />
a fair return is meant that the company will be allowed as large a return on the<br />
capital invested in its enterprise (which will be net to the company) as it would<br />
receive if it were investing the same amount in other securities possessing an<br />
attractiveness, stability and certainty equal to that of the company’s enterprise… 35<br />
In the Hope decision, the US Supreme Court, by a vote of five to three, set a new standard for<br />
determining “just and reasonable” returns for investor-owned utilities.<br />
The return to the equity owner should be commensurate with returns on<br />
investments in other enterprises having corresponding risks. That return,<br />
moreover, should be sufficient to assure confidence in the financial integrity of<br />
the enterprise, so as to maintain its credit and attract capital. 36<br />
In Bluefield, an earlier case leading up to the Hope decision, the US Supreme Court defined the<br />
proper rate of return as follows:<br />
A public utility is entitled to such rates as will permit it to earn a return on the<br />
value of the property which it employs for the convenience of the public equal to<br />
that generally being made at the same time and in the same general part of the<br />
country on investments in other business undertakings which are attended by<br />
corresponding risks and uncertainties... 37<br />
In setting required revenues, a utility’s returns would henceforth be measured by<br />
investors’ possible earnings on alternative enterprises of similar risk. The Supreme<br />
Courts thus ruled that a utility’s investments were safe from seizure (i.e., a “taking”) if<br />
regulators set charges to award returns consistent with investors’ opportunity cost of<br />
34 Federal Power Commission v. Hope Natural Gas, 320 US 591 (1944).<br />
35 Northwest <strong>Utilities</strong> v. City of Edmonton, S.C.R. 186 (NUL 1929).<br />
36 Hope, 320 US 591, 603 (1944).<br />
37 Bluefield Waterworks & Improvement Co. v. Public Service Commission of the State of West Virginia et al., 262<br />
US 679, 693 (1923). The Hope and Bluefield decisions refer to two Constitutional Amendments. The Fifth<br />
Amendment, as interpreted by the Court, gave the Court jurisdiction over Congress in such matters. The<br />
Fourteenth Amendment, under the Court’s interpretation, gave it similar jurisdiction over the States.<br />
29
capital. These limitations on the discretion of regulators were not academic exercises.<br />
For the purposes of the future gas market, the Hope and Northwest <strong>Utilities</strong> decisions<br />
were critical. They sharply limited investor or shipper uncertainty regarding the ability of<br />
regulators to act in a manner that would damage the value of the assets that investors<br />
would devote to regulated enterprises.<br />
2. Credible, Comprehensive and Transparent Administrative Procedures<br />
Predictable regulatory or tariff-making practices are unlikely without a clear set of administrative<br />
procedures that bind the way that the independent regulators conduct their business. Canada and<br />
the US both provide stability to their utility investors through strong administrative procedures.<br />
An important tenet of Canadian administrative practices is the common law right to procedural<br />
fairness. The Supreme Court of Canada has held that judicial and quasi-judicial bodies, but also<br />
other administrative decision makers, must follow common law principles of procedural fairness<br />
that include the right to be heard and the right to be judged impartially. 38<br />
The 1946 Administrative Procedures Act guides regulatory procedures in the US. Similar to<br />
Canada, it requires regulators to hold hearings, warn participants of impending rule changes, to<br />
allow participation in regulatory proceedings from the affected parties and to accept evidence<br />
(subject to cross-examination in those hearings). The late US Senator Daniel Patrick Moynihan<br />
explained that:<br />
The APA rests on a constellation of ideas: government agencies should be<br />
required to keep the public informed of their organization, procedures, and rules;<br />
the public should be able to participate in the rule-making process; uniform<br />
standards should apply to all formal rule-making and adjudicatory proceedings;<br />
and judicial review should be available in certain circumstances. Taken together<br />
with the Freedom of Information Act, an amendment to the APA that was enacted<br />
in 1966 and added to in 1974, 1986, and 1996, the APA was intended to foster<br />
more open government through various procedural requirements and thus to<br />
promote greater accountability in decision making. 39<br />
These are precisely the elements of “due process” in the administration of regulation. Indeed,<br />
the legal inquiries that resulted in the Administrative Procedures Act arose out of the general<br />
judicial concern (arising in the US in the 1930s) that regulating prices of investor-owned<br />
companies at any level represented a potentially unconstitutional taking of private property. That<br />
38 An important decision with regard to procedural fairness was Nicholson v. Haldimand-Norfolk Reg. Police<br />
Commrs., where the Supreme Court of Canada significantly extended the rights to procedural fairness to nonjudicial<br />
administrative decision makers and solidified the right to justification for a decision. Nicholson v.<br />
Haldimand-Norfolk Reg. Police Commrs., [1979] 1 S.C.R. 311.<br />
39 Daniel Patrick Moynihan, Secrecy: The American Experience New Haven, Conn: Yale University Press, 1998,<br />
p. 157.<br />
30
potential unconstitutionality, it was rightly thought, could only be prevented if a specific<br />
framework was applied for assuring the due process of regulatory decisions.<br />
While Canada does not have an exact equivalent to the U.S. Administrative Practices Act of<br />
1946, it does have an umbrella of provincial statutes, the charter(s) of the administrative decision<br />
maker(s), and the protection of common law, which includes previous interpretations as well as<br />
foundational justice and the founding principles of the constitution. 40 Through these channels,<br />
Canadian administrative procedures are equally well-established and effective as US procedures.<br />
3. Accounting for Utility Ratemaking<br />
The goals of effective and efficient regulation can be frustrated without a consistent, credible,<br />
and sustainable set of regulatory accounts. Strict accounting standards (i.e., the Uniform System<br />
of Accounts) rarely leave US or Canadian energy utilities and their regulators in major dispute<br />
over basic financial issues (like profitability, depreciation expenses or the admissibility of<br />
particular costs).<br />
Strong and transparent accounting standards were established over half a century ago in Canada<br />
and the US, but such is not the case in other, supposedly “mature” jurisdictions. For example, a<br />
major component of the reviews of British Gas conducted in recent years by both Ofgas (the gas<br />
regulatory body before Ofgem was created) and the Monopolies and Mergers Commission<br />
concerned basic accounting and finance items in an environment with no regulatory accounting<br />
standards. 41 This confusion in the UK over British Gas’s rate of profits on its capital stock and<br />
the depreciation allowed on billions of pounds sterling of transportation assets represents a major<br />
risk to utility investors that is absent in Canada and the US. Canadian and US accounting<br />
standards would never leave major assets in question, as was the case in the UK and elsewhere<br />
following privatization.<br />
4. Reliable Judicial Review<br />
Effective limits on regulatory authority in systems with well functioning regimes come from the<br />
judiciary and other paths of appeal. In both Canada and the US, the fundamental legal<br />
limitations on the ability of regulators to take actions that damage the holdings of utility<br />
investors (in some way or another) come from well-known Supreme Court decisions. The<br />
Courts in both countries have found that the property rights of investors in regulated companies,<br />
40 The provincial administrative practices acts include: Statutory Powers Procedure Act, R.S.O. 1990, c. S.22<br />
(Ont.); Administrative Procedures Act, R.S.A. 2000, c. A-3 (Alta.); Administrative justice, An Act respecting,<br />
R.S.Q. c. J-3 (QC).<br />
41 The Economist has referred to UK regulatory accounting as a “fiddly bit of guesswork.” (See: “Don’t you just<br />
love being in control?” The Economist, May 18 th , 1996.)<br />
31
as well as the rights of the customers they serve, require strict regulatory attention to invested<br />
capital.<br />
C. What are the Elements of Canadian vs. US Regulatory Risk?<br />
While Canada and the US share a credible regulatory environment, the exact regulatory<br />
foundations are admittedly not identical. However, the differences that do exist are more<br />
procedural than fundamental. The two jurisdictions engage in roughly the same practices,<br />
although they may go by slightly different names or receive more or less attention. The differing<br />
levels of attention does not imply that some practices are superior to others; rather, these<br />
differences arise from the dates the practices were implemented, the procedures used to handle<br />
the practices, and the emphasis placed on various practices in regulatory proceedings.<br />
These principles are generally true of all regulatory jurisdictions in the US and Canada. Both<br />
equity investors and lenders generally give funds to utilities with the reasonable expectation the<br />
principles of obligations to be provided with a fair return will be honored. Even though the<br />
particular utility statutes may vary from jurisdiction to jurisdiction, and even though regulatory<br />
commissions may have different policies and precedents in different jurisdictions, investors<br />
anticipate the basic bargain between them and their regulator (who represents the public) will<br />
apply to their investments.<br />
From the constitutional foundation through to administrative practices, accounting practices and<br />
judicial review, Canada and the US have virtually indistinguishable regulatory environments—so<br />
much so that the US Hope and Bluefield decisions are even cited in Canadian rate cases. 42<br />
Figure 4 illustrates the regulatory pyramid in Canada and the United states.<br />
42 See, for example, Alberta’s Generic Cost of <strong>Capital</strong> decision, where the EUB stated, “[t]he Board concurs that<br />
the above decisions [Northwestern, Hope, and Bluefield] are the most relevant judicial authorities with respect to<br />
the establishment of a fair return for regulated utilities.” Alberta Energy and <strong>Utilities</strong> Board, Generic Cost of<br />
<strong>Capital</strong> Decision 2004-052 (2005), p. 13.<br />
32
Figure 4: Elements of Recent <strong>ROE</strong> Regulation in the US and Canada<br />
Ratemaking<br />
Appeal<br />
Accounting<br />
Administration<br />
Compact<br />
Foundation<br />
Casebycase<br />
Independent<br />
Judiciary<br />
Actual Accounts<br />
US GAAP<br />
Due Process and 1946<br />
Administrative Procedures Act<br />
Hope and Bluefield,<br />
Just and Reasonable Returns<br />
Formula<br />
Independent<br />
Judiciary<br />
Actual Accounts<br />
CA GAAP<br />
Foundational Justice and<br />
Provincial Procedures Acts<br />
Northwest <strong>Utilities</strong>,<br />
Fair and Reasonable Returns<br />
US Constitution, 5 th and 14 th Amendments CA Constitutions Acts, Founding Principles<br />
United States Canada<br />
Regulation in Canada and the US is founded on strong primary legislation that protects the rights<br />
of citizens. The constitution of Canada is an amalgam of codified acts and uncodified traditions<br />
and conventions. 43 The Constitutions Act, 1982 established a Charter of Rights and Freedoms,<br />
the Canadian equivalent to the US Bill of Rights. While the Charter extends many protections to<br />
Canadian citizens, including the right to “foundational justice,” this Charter does not explicitly<br />
include the protection of property rights. A significant difference in the regulatory foundations is<br />
the strong constitutional protection of property rights in the United States afforded by the 5 th and<br />
14 th amendments.<br />
The regulatory compact in both countries is shaped by judicial decisions and includes the right to<br />
earn a “fair return” on investment, as determined by the opportunity cost of capital, which is<br />
termed the “comparable investment” standard. While the phrase, “regulatory compact,” is not<br />
used as often in Canada as in the US, the concept is there. Indeed, the decisions that shape the<br />
US compact are cited in Canadian rate cases, and the Canadian decisions are widely recognized<br />
as establishing an effective compact that is very nearly identical to that of the US. 44<br />
While Canada does not have a single, federal administrative practices statue, administrative<br />
practices are highly refined in Canada and afford at least as much protection to investors as does<br />
the United States. The Canadian common law protection—enhanced by the introduction of<br />
foundation justice in the Charter of Rights and Freedoms and provincial administrative<br />
43 The Preamble to the Constitution Act, 1867 states that the provinces shall have, “a Constitution similar in<br />
Principle to that of the United Kingdom.” 43 This has been interpreted as stating that the practices of the United<br />
Kingdom that were common before the creation of the constitution form part of the Canadian constitution—for<br />
example, the practice of an independent judiciary has been constitutionally guaranteed under this argument. See<br />
Provincial Judges Reference [1997] 3 S.C.R. 3.<br />
44 Morin, R.A. New Regulatory Finance, Vienna, Virginia: Public <strong>Utilities</strong> Reports (2006), p. 12.<br />
33
procedures acts—equals the US standard of due process and the Administrative Procedures Act<br />
of 1946 in its protection of investors’ rights.<br />
In both Canada and the US, regulatory accounting is sufficiently refined that actual accounts are<br />
used for ratemaking without contention, avoiding the regulatory conflicts that surround<br />
benchmarked costs or replacement value accounting. The right to use actual costs for<br />
intraprovincial/intrastate regulation comes from provincial and state statutes. While some<br />
provinces have “fair value” mandates and are not required to use book values, they do so<br />
nonetheless. 45 This is similar to the US, where five states have “fair value” statues but have<br />
defined fair value to be the book value, so it is a difference without a distinction.<br />
There is a perception that Canadian judiciaries are reluctant to interfere with the decisions of<br />
utility regulators. However, US judiciaries also do not overturn regulatory decisions without a<br />
clear reason to do so, and judicial rebuke is the exception rather than the rule in the US. Most<br />
important is that clear pathways for appeal exist in both countries and appeals are conducted in a<br />
manner such that, should major grievances be raised, the judiciaries are capable of reaching a<br />
reasonable decision.<br />
Canada and the US share similarly mature regulatory compacts, supported by well-established<br />
accounting, administrative and appellate procedures. They are unique in their advanced<br />
regulatory environment based on credible, actual accounts. The greatest risk-determinant for<br />
utilities, regulatory risk, is comparable in Canada and the US.<br />
D. Does the Continued Ability to Raise <strong>Capital</strong> for Canadian <strong>Utilities</strong><br />
Indicate that All is Well?<br />
Figure 1 drove this examination of the foundations of the regulatory procedures and risk. It<br />
shows that the allowed <strong>ROE</strong> was persistently lower in Canada that in the US over the previous<br />
decade. To the extent that this divergence is found not to be the result of different Canadian<br />
regulatory practices or lower regulatory risk vis-à-vis the US, but the result of the use of<br />
Canada’s formula, an obvious question arises: would this cause investors to withhold funds from<br />
Canadian utilities?<br />
In other words, is there any evidence that the Canadian utilities whose returns make up Figure 1<br />
have been unable to raise funds? If the generic Canadian <strong>ROE</strong> formula rests too heavily on long<br />
bonds and ignores genuine equity capital costs, the most manifest evidence that this is<br />
detrimental would show up in a difficulty for those companies in raising new capital.<br />
Conversely, does the continued ability of these Canadian utilities to provide adequate services in<br />
and of itself refute any possibility that the formula-based <strong>ROE</strong> is biased or inadequate?<br />
45 The use of actual accounts in Canada was upheld in B.C. Electric Co., where the court established that the book<br />
value of prudently incurred costs could be used to provide a fair return, despite a statute requiring that appraisal<br />
value be used. B.C. Electric Co. Ltd. v. Public <strong>Utilities</strong> Commission et al. (1957) 13 D.L.R. (2d) 589 (BCCA).<br />
34
We conclude that as a practical matter the answers to these questions are no. Absence of<br />
evidence that Canadian utilities subject to the formula are barred from the market for funds does<br />
not constitute evidence that those <strong>ROE</strong>s are adequate in the market.<br />
There are times in the not-so-recent past when persistently inadequate returns have appeared for<br />
utilities in general. During two periods of high inflation in the 1970s and 1980s, US utilities<br />
faced wholly inadequate returns. Inflation, coupled with the need to construct new generation<br />
and transmission capacity, ruined the ability of traditional regulatory procedures to provide<br />
utilities with a reasonable prospect of earning an adequate <strong>ROE</strong>. In short, the traditional<br />
methods of regulating rates, using a test year, created a lag in the ability to recoup ongoing,<br />
inflated, costs that visibly affected the financial health of utilities.<br />
Evidence that the utilities were suffering was clear in the stock markets, as utility stocks slid in<br />
relation to their book values. During both periods, it was common for utility stocks to be trading<br />
below the equity book value of utility investments (roughly the equity “rate base”). When this<br />
happened, any new equity raised by these utilities would “dilute” the equity of existing<br />
shareholders—basically providing a subsidy to new equity investors from old ones. 46 Such a<br />
subsidy could not continue forever, as it would doom an investor enterprise. As it happened,<br />
however, the problem—as highly visible as it was—was only relatively temporary.<br />
No equity investors would willingly sell proportional rights to the future returns on the equity<br />
rate base for a discount—but they did so during this period anyway. Why? Given their<br />
overriding obligations to provide safe, adequate and reliable service to customers, they had<br />
effectively no choice in the matter. Inflation pushed up the cost of new funds to the extent that it<br />
reflected a subsidy from existing shareholders, but nothing during the years of high inflation left<br />
utilities off the hook regarding their own responsibilities to serve the public.<br />
Fixing the problem required either a change in regulatory procedures to deal with high inflation<br />
(for example, using inflation accounting like in European or Latin American countries), or an<br />
end to high inflation itself. When inflation dropped in the US, utilities returned to business-asusual.<br />
The prospect of high inflation is still a risk to which utilities have generally no defense<br />
except a strong belief that the central bank will work to prevent its recurrence. 47 But in no<br />
fashion was the continued investment in US utility infrastructures in the 1970s and 1980s<br />
evidence that the ratemaking formula wasn’t damaging investor interests in periods of high<br />
inflation.<br />
Similarly, the evidence that Canadian investors continue to provide safe, adequate and reliable<br />
service to their consumers cannot be taken as evidence, in and of itself, that the formula-based<br />
returns reflected in Figure 1 are fair. The utilities in Canada are a mixture of closely-held<br />
subsidiaries (without traded stocks of their own) and publicly-traded firms. If the <strong>ROE</strong>s based<br />
46 See: Morin, R.A., New Regulatory Finance, Public <strong>Utilities</strong> Reports, Inc., Vienna, Virginia (2006), p. 364; and<br />
Hymay, L.S., Americas Electric <strong>Utilities</strong>: Past, Present and Future, Public <strong>Utilities</strong> Reports, Arlington, Virginia<br />
(1985), p. 262.<br />
47 Of course, bankruptcy is a defense against persistent confiscatory regulatory treatment, but that has only<br />
appeared rarely in the US, and then only in conjunction with other idiosyncratic events.<br />
35
on the formula are unfair, it would be, in our opinion, beyond practical measures to try to discern<br />
objectively, as a separate matter, how it damaged the interest of investors. By its very nature the<br />
market’s cost of equity is not easily and objectively measurable—which is precisely why<br />
regulators and analysis use indirect formulae like the DCF and CAPM. Reverse-engineering the<br />
effect of the Canadian generic formula is not a practical and objective possibility to measure the<br />
effect it has had on utility equity investments in Canada since around 1998.<br />
36
Natural Gas Utility<br />
Return Determination in<br />
Canada:<br />
Time For a New approach<br />
A Discussion Paper Developed by the<br />
Canadian Gas Association<br />
April 2008
Canadian Gas Association<br />
Association cannadienne du gaz<br />
350, rue Sparks Street<br />
Suite / bureau 809<br />
Ottawa, ON K1R 7S8<br />
Tel: 613-748-0057 Fax: 613-748-9078<br />
www.cga.ca
ACRONYMS AND ABBREVIATIONS<br />
AAM Automatic adjustment mechanism<br />
CAPM <strong>Capital</strong> asset pricing model<br />
CE Comparable earnings<br />
CEA Concentric Energy Advisors<br />
DCF Discounted cash fl ow<br />
ERP Equity risk premium<br />
FCA Federal Court of Appeal<br />
FRS Fair return standard<br />
LDC Local distribution companies<br />
M/P J.C. Major, R. Priddle<br />
MRP Market risk premium<br />
NEB National Energy Board<br />
NERA National Economic Research Associates<br />
OEB Ontario Energy Board<br />
RfD Reasons for decision<br />
<strong>ROE</strong> Rate of return on equity<br />
S&P Standard and Poor’s<br />
TSX Toronto Stock Exchange<br />
Natural Gas Utility Return Determination in Canada: A Review of Key Concerns and Issues<br />
April 2008
Introduction<br />
Section 1: Current Legal Underpinnings for Utility Return Determination<br />
Section 2: Canadian Returns in Comparative Perspective<br />
Section 3: Th e Formula Approach and Changes in the Macro Economy<br />
Section 4: Impacts on Return Determination in Canada<br />
Section 5: Responding to the Impacts: Reconnecting to the Cost of Equity<br />
Section 6: Objections Raised<br />
Conclusions<br />
Bibliography<br />
TABLE OF CONTENTS<br />
Natural Gas Utility Return Determination in Canada: A Review of Key Concerns and Issues<br />
April 2008<br />
1<br />
3<br />
5<br />
7<br />
9<br />
11<br />
13<br />
17<br />
19
INTRODUCTION<br />
One of the most contentious, and long-lived issues for Canada’s<br />
natural gas distribution industry is the determination of what<br />
a regulated utility should be allowed to earn on its investment<br />
in the equipment, operations, facilities and people required to<br />
provide natural gas services to the public.<br />
Because natural gas utilities are not competitive free market<br />
enterprises, there is no “invisible hand” of an open market to<br />
keep costs and profi ts in check. Instead, it is up to the regulators<br />
and regulated utilities to determine the costs, risks and return<br />
of supporting the enterprise’s operation.<br />
While accounting records, purchase orders, payroll records<br />
and other documentation can accurately establish the costs<br />
expected for the utility, in the absence of competitive market<br />
pressures, it is not possible to directly observe the appropriate<br />
return to owners of a regulated utility.<br />
Over the past year, the Canadian Gas Association (CGA)<br />
and other associations and utilities have been looking into<br />
the various aspects, issues and information surrounding the<br />
process of determining an appropriate return on capital. What<br />
many are fi nding is that since the adoption 14 years ago of a<br />
formulaic approach to determine fair returns, there have been<br />
a growing number of indications that the process is no longer<br />
producing appropriate results.<br />
In June 2007, Concentric Energy Advisors (CEA) completed<br />
a report for the Ontario Energy Board that concluded that the<br />
current rate of return on equity (<strong>ROE</strong>) diff erential between<br />
Ontario/Canadian and comparable US gas utilities of 150<br />
to 200 basis points was largely due to the formula itself and<br />
its reliance on trends in Canadian government bonds. It also<br />
found that there were no fundamental risk diff erences between<br />
Canadian and US natural gas distribution utilities that would<br />
warrant such a gap.<br />
In February 2008, in a report commissioned by CGA, National<br />
Economic Research Associates Inc. (NERA) confi rmed CEA’s<br />
fi ndings of a signifi cant, systemic gap between comparable<br />
Canadian and US gas utilities. NERA also concluded that the<br />
gap was not warranted on risk diff erences and that the use of<br />
US comparisons were indeed valid given the shared Canada-<br />
US legal foundations and the integration of the two fi nancial<br />
markets and economies.<br />
Natural Gas Utility Return Determination in Canada: A Review of Key Concerns and Issues<br />
April 2008<br />
In March 2008, CGA released a report entitled “Th e Fair<br />
Return Standard for Return on Investment by Canadian Gas<br />
<strong>Utilities</strong>: Meaning, <strong>Application</strong>, Results, Implications” (M/P)<br />
that focussed on the legal foundations of return determination<br />
in Canada. In the report, authors former Supreme Court<br />
Justice, John C. Major and former National Energy Board<br />
Chair, Roland Priddle reviewed the history of the Fair Return<br />
Standard (FRS) in Canada and the US. Th e authors conclude,<br />
among other things, that the mechanistic nature of the formula<br />
approach often suspends the use of informed judgement. Th e<br />
resulting gap that has developed between US and Canadian<br />
<strong>ROE</strong> awards, the report maintains, is an indication that<br />
the required standard for returns is no longer being met in<br />
Canada.<br />
Th is paper reviews and summarizes a number of the<br />
observations made in the above-mentioned body of research<br />
regarding return determination for regulated natural gas<br />
utilities. It examines the issues and outstanding questions<br />
relating to return determination in the context of the economic,<br />
fi nancial and business environment in Canada today and for<br />
the past 30 years. While many of the issues raised in the paper<br />
have arisen in regulatory proceedings over the past decade,<br />
several perspectives are new. Among these are the broader time<br />
perspective pertaining to the long trend away from the FRS,<br />
the importance of the need for considered regulatory judgment<br />
in the use of formula approaches and the appropriateness of the<br />
comparison with returns in US utilities. Th is paper is off ered<br />
as a means of contributing such perspectives to the ongoing<br />
debate.<br />
1
2<br />
Natural Gas Utility Return Determination in Canada: A Review of Key Concerns and Issues<br />
April 2008
SECTION 1: CURRENT LEGAL UNDERPINNINGS FOR UTILITY RETURN DETERMINATION<br />
Given the lack of open market forces to drive the determination<br />
of returns for utility investors the process has instead been<br />
grounded in a legal determination of what constitutes “fair”.<br />
In 1929, the Supreme Court of Canada in Northwestern<br />
<strong>Utilities</strong> Ltd v. Edmonton [1929] S.C.R. 186 (Northwestern)<br />
defi ned the scope of the utilities’ right to price their product<br />
and their right as a result to a fair return. Th e Court stated:<br />
“By a fair return is meant that the company will be allowed as<br />
large a return on the capital invested in its enterprise (which will<br />
be net to the company) as it would receive if it were investing<br />
the same amount in other securities possessing an attractiveness,<br />
stability and certainty equal to that of the company’s enterprise.” 1<br />
In 1994, the British Columbia <strong>Utilities</strong> Commission became<br />
the fi rst regulator in Canada to adopt a generic formula<br />
approach to return determination. Th en, in 1995, the NEB<br />
also adopted a generic cost of capital approach to setting<br />
utility returns. Other provincial regulatory boards have since<br />
followed suit and today apply an essentially uniform generic<br />
formula approach to setting returns.<br />
In 2004, the Federal Court of Appeal (FCA) added some depth<br />
to the defi nition of fair return in TransCanada PipeLines v.<br />
Canadian National Energy Board 2004 F.C.A. 149, where the<br />
court confi rmed that a fair return need not be modifi ed out<br />
of deference to its impact upon customers. It was determined<br />
that regulators are free to use constructs like deferral accounts<br />
and other mechanisms to spread out the impact of commodity<br />
costs and weather impacts on the customer rates. However, the<br />
law explicitly states that regulators cannot simply reduce the<br />
return to the investor/owner as a mechanism to avoid potential<br />
increases in customer rates. Canadian law in eff ect requires<br />
that a fair return be provided for the services rendered by the<br />
utility. Th is “fair return standard” and its requirements remain<br />
in full legal eff ect today.<br />
Further practical guidance as to how to functionally apply the<br />
FRS evolved from the National Energy Board (NEB) in its<br />
RH-2-2004 Phase II Decision, where it stated:<br />
1 Supreme Court of Canada in Northwestern <strong>Utilities</strong> Ltd v. Edmonton [1929] S.C.R. 186 (Northwestern).<br />
2 National Energy Board in RH-2-2004 Phase II Decision.<br />
“Th e Board is of the view that the fair return standard can be<br />
articulated by having reference to three particular requirements.<br />
Specifi cally, a fair or reasonable return on capital should:<br />
• be comparable to the return available from the<br />
application of invested capital to other enterprises<br />
of like risk (the comparable investment standard);<br />
• enable the fi nancial integrity of the regulated<br />
enterprise to be maintained (the fi nancial integrity<br />
standard); and<br />
• permit incremental capital to be attracted to the<br />
enterprise on reasonable terms and conditions (the<br />
capital attraction standard).” 2<br />
Notable in the legal defi nition of the FRS is the court’s<br />
recognition that it is in the best interest of the utility and its<br />
customers to tie society’s need for the essential service provided<br />
by the utility to the long-term viability of the utility.<br />
Th e question then, is whether returns to Canadian natural gas<br />
utilities are meeting the required standards designed to ensure<br />
this long-term service and viability.<br />
Natural Gas Utility Return Determination in Canada: A Review of Key Concerns and Issues<br />
April 2008 3
4<br />
Natural Gas Utility Return Determination in Canada: A Review of Key Concerns and Issues<br />
April 2008
SECTION 2: CANADIAN RETURNS IN COMPARATIVE PERSPECTIVE<br />
A simple illustration of the possible problem with utility return<br />
determination in Canada can be seen in a comparison of the<br />
returns to US natural gas utilities. (Fig. 1 & 2) In CGA’s<br />
2007 report entitled “Return on Equity: Allowed Returns for<br />
Canadian Gas <strong>Utilities</strong>” it was shown that a signifi cant gap has<br />
emerged between Canadian and US returns.<br />
Confi rmation of this discrepancy came in an Ontario Energy<br />
Board (OEB) –commissioned report carried out by Concentric<br />
Energy Advisors (CEA). In their report, CEA shows (Fig. 3)<br />
that Canadian utilities are consistently and markedly below a<br />
reasonably constructed representative group of their US-based<br />
peers.<br />
While it is possible to compare Canadian natural gas utilities<br />
only to each other, the uniform use of the formula approach<br />
to return determination in Canada makes such a comparison<br />
circular in both its logic and result. A Canadian peer group<br />
could potentially be made from a properly constructed group<br />
of low-risk industrial enterprises. However, eff orts to introduce<br />
such comparisons have tended to founder on the diffi culty in<br />
identifying enterprises that are suffi ciently comparable to that<br />
of a natural gas utility.<br />
Alternatively, one can reasonably ask whether US-based<br />
utilities are an acceptable peer/comparator group. Th is<br />
question was also addressed by the CEA report in which they<br />
state the following:<br />
“While specifi c characteristics of individual gas utilities and their<br />
respective regulatory environments can lead to diff erences in<br />
allowed returns, there are no apparent fundamental diff erences<br />
between gas utilities in Ontario and those in the US that would<br />
cause a sizable gap in <strong>ROE</strong>. In other words, taken as a whole,<br />
US gas utilities are not demonstrably riskier than Canadian gas<br />
utilities.” 3<br />
Th e issue of the appropriateness of comparison to US natural<br />
gas utilities was further investigated by NERA in their CGAcommissioned<br />
report entitled “Allowed Return on Equity in<br />
Canada and the United States: An Economic, Financial and<br />
Institutional Analysis”. In their report, NERA concluded the<br />
following:<br />
Natural Gas Utility Return Determination in Canada: A Review of Key Concerns and Issues<br />
April 2008<br />
%Return<br />
16<br />
15<br />
14<br />
13<br />
12<br />
11<br />
10<br />
9<br />
8<br />
Figure 2<br />
Canada / U.S. <strong>ROE</strong> Comparison<br />
1985 1987 1989 1991 1993 1995 1997 1999 2001 2003 2005 2007<br />
Canadian LDCs Allowed <strong>ROE</strong> US LDCs Allowed <strong>ROE</strong><br />
Source: CGA, Regulatory Research Associates (RRA)<br />
“Canada and the United States have almost hundred-year<br />
histories of regulating investor-owned utilities. Th is shared<br />
experience is diff erent from almost all the rest of the world, where<br />
the appearance of investor-owned (i.e. private) utilities came only<br />
with the privatization wave of the late 20th century.” […] “Th ese<br />
two national jurisdictions thus share a common heritage that is<br />
quite diff erent, for example from the newly-privatized regulatory<br />
3 “A Comparative Analysis of Return on Equity of Natural Gas <strong>Utilities</strong>,” p. 2, prepared for the Ontario Energy Board by Concentric Energy Advisors, June<br />
14, 2007.<br />
%<br />
17<br />
15<br />
13<br />
11<br />
9<br />
7<br />
Figure 1<br />
Equity Return Comparison<br />
Low Risk North American Industrials<br />
Canadian Gas LDCs<br />
US Gas LDCs<br />
5<br />
1993 1995 1997 1999 2001 2003 2005<br />
Source: Canadian Gas Association, S&P Insight<br />
5
jurisdictions in the rest of the world. Th ose jurisdictions overseas<br />
regulate their investor-owned utilities on an institutional basis<br />
quite diff erent than in Canada and the US – two countries that<br />
share the longest, largest and most unencumbered trade border<br />
in the world. It is thus a fair question to compare and contrast<br />
Canadian and US utilities with each other to examine how their<br />
regulators deal with them and, in particular, derive the <strong>ROE</strong>s used<br />
to set their regulated tariff s.” 4<br />
Further questions about the validity and meaning of a<br />
divergence between the Canadian and US allowed return levels<br />
are raised in a study published in the autumn 2007 edition of<br />
the Bank of Canada Review. 5 Th e study notes that the higher<br />
the risk to future returns, the higher those expected returns must<br />
be to compensate investors for taking those risks. According to<br />
the study, Canadian fi rms show a higher degree of fi nancial<br />
leverage, a higher variability (dispersion) in future earnings,<br />
lower stock market liquidity and lower corporate taxes.<br />
Combined, these factors in part explain an observed higher<br />
cost for equity fi nancing in Canada. Yet, since the introduction<br />
of the formula approach to return determination in Canada,<br />
utility returns have declined markedly as compared to their US<br />
counterparts, a move exactly contrary to that suggested by the<br />
Bank of Canada, CEA, NERA and others.<br />
6<br />
<br />
<br />
<br />
<br />
<br />
<br />
<br />
<br />
Figure 3<br />
<br />
8.0% - 8.25% - 8.5% - 8.75% - 9.0% - 9.25% - 9.5% - 9.75% - 10 .0 % - 10 .2 5% 10 .5% - 10 .75% - 11.0 % - 11.2 5% -<br />
8.25% 8.5% 8.75% 9.0% 9.25% 9.5% 9.75% 10 .0 % 10 .2 5% - 10.5% 10 .75% 11.0 % 11.2 5% 11.5%<br />
<br />
<br />
<br />
<br />
<br />
<br />
Th e comparability called for in the FRS appears to have<br />
diminished, at least in part, due to the diffi culties, perceived<br />
and otherwise, in undertaking such an eff ort. In contrast, in<br />
the US, signifi cant eff orts are made to compare utility returns<br />
to an agreed peer group. Indeed, such comparisons are the<br />
very foundation for regulatory board return decisions in that<br />
country.<br />
4 “National Economic Research Associates Inc., “Allowed Return on Equity in Canada and the United States: An Economic, Financial and Institutional<br />
Analysis,” p. 4, p. 6, February 2008.<br />
5 Estimating the Cost of Equity for Canadian and U.S. Firms, Bank of Canada Review, Autumn 2007.<br />
Natural Gas Utility Return Determination in Canada: A Review of Key Concerns and Issues<br />
April 2008
SECTION 3: THE FORMULA APPROACH AND CHANGES IN THE MACRO-ECONOMY<br />
In the 14 years since the introduction of the formula approach<br />
to return determination in Canada the economic, fi nancial,<br />
and business landscape has changed markedly. Of particular<br />
importance are the changes witnessed in the various measures<br />
that infl uence the formula-based approach, specifi cally,<br />
government debt levels, infl ation, interest rates, and the<br />
performance of Canada’s economy.<br />
Some experts contend that it is counter-intuitive that<br />
such variables should be the driving factors behind return<br />
determination for Canadian gas utilities at all. In a recently<br />
published article, Roland Priddle, former Chair of the National<br />
Energy Board stated:<br />
“It’s now hard for me to see that long-term bond yields, driven by<br />
factors as disparate as governments’ eff orts to get budgetary defi cits<br />
in hand, central bank’ concerns (or not) about infl ation…are<br />
somehow going to provide a continuing, reliable proxy for returns<br />
available in businesses presenting degrees of risk similar to gas<br />
pipelines and distribution enterprises.” 6<br />
Canada’s Fiscal Defi cit<br />
In the 10 years immediately prior to the introduction of the<br />
formula approach, Canada regularly ran multi-billion dollar<br />
annual defi cits, racking up massive amounts of government<br />
debt. Th en, almost coincident with the introduction of the<br />
generic approach, Canada started to get its fi scal house in<br />
order. (Fig. 4)<br />
With today’s hindsight, we can now see that the fi nancing<br />
requirements generated by these huge defi cits meant that<br />
Canadian bond rates were necessarily quite high. Indeed from<br />
1976 to the end of 1996, the average interest rate diff erential<br />
between Canadian and US long bonds was just shy of 150 basis<br />
points. In the 10 years from 1996 to the end of 2006, this<br />
diff erential has averaged just under 50 basis points.<br />
Canada’s Infl ation<br />
Infl ation in Canada had also been roaring along in the late<br />
1970’s and early 1980’s, at times at double digit levels. (Fig. 5)<br />
As a result as we entered the 1990’s investors seemed to expect<br />
infl ation and currency depreciation that was out of line with<br />
6 Roland Priddle, “It’s Time for the Next Evolution in Regulation,” Th e Gas Journal of Canada (2007): A9.<br />
Natural Gas Utility Return Determination in Canada: A Review of Key Concerns and Issues<br />
April 2008<br />
$ millions<br />
%<br />
30,000<br />
20,000<br />
10,000<br />
0<br />
-10,000<br />
-20,000<br />
-30,000<br />
-40,000<br />
-50,000<br />
14.0<br />
12.0<br />
10.0<br />
8.0<br />
6.0<br />
4.0<br />
2.0<br />
0.0<br />
1975<br />
1983-84<br />
1978<br />
1985-86<br />
Figure 4<br />
Canada's Federal Fiscal Position<br />
1987-88<br />
1989-90<br />
1991-92<br />
the anti-infl ation monetary policy that was by then being<br />
consistently pursued by the authorities. Th e credibility of<br />
infl ation policy was also undermined by large budget defi cits<br />
and by political concerns about the possibility of Quebec<br />
separation. It was not until the second half of the decade that<br />
infl ationary expectations were reined in as defi cits were largely<br />
eliminated, infl ation was kept low, and political uncertainty<br />
abated somewhat.<br />
1993-94<br />
1995-96<br />
1997-98<br />
1999-00<br />
Source: Finance Canada, Statistics Canada<br />
1981<br />
Figure 5<br />
Inflation in Canada<br />
1984<br />
1987<br />
1990<br />
1993<br />
1996<br />
1999<br />
Source: Statistics Canada, Table 326-0021<br />
2001-02<br />
2002<br />
2003-04<br />
2005<br />
2005-06<br />
2008<br />
7
Canada’s Economic Performance<br />
Th e decade prior to the formula adoption also saw Canada’s<br />
economy weather two large recessionary periods (Fig. 6), the<br />
fi rst in the early 1980s, and then another in the early 1990s.<br />
Th ese economic dislocations came on the heels of a very volatile<br />
pattern of economic growth that had characterised the 1970s.<br />
In general, in the 20 years prior to the adoption of the formula<br />
approach, there was twice as much volatility in Canada’s<br />
economy compared to that seen in the 15 years since then.<br />
Not surprisingly, these recessionary periods caused signifi cant<br />
turmoil in terms of business risk, profi tability, and the stability<br />
of corporate earnings.<br />
Implications<br />
In sum, the formula approach was adopted at the end of a period<br />
whose macro-economic circumstances would subsequently<br />
prove to be atypical of the period over which the formula<br />
was destined to be applied. What this says about the future<br />
is of course unclear but it does underpin the contention that<br />
a formula left, in eff ect, on automatic pilot for an extended<br />
period risks producing outcomes which do not accurately<br />
refl ect economic and business realities.<br />
8<br />
% GDP growth, annualized<br />
4.0<br />
3.0<br />
2.0<br />
1.0<br />
0.0<br />
-1.0<br />
-2.0<br />
1970<br />
1973<br />
1976<br />
Figure 6<br />
Canada's Economic Growth<br />
Standard Deviation of Canadian GDP Grow th<br />
1970-1980 1981-1993 1994-2007<br />
0.90 0.95 0.48<br />
1979<br />
1982<br />
1985<br />
1988<br />
1991<br />
1994<br />
1997<br />
Source: Statistics Canada<br />
2000<br />
2003<br />
2006<br />
Natural Gas Utility Return Determination in Canada: A Review of Key Concerns and Issues<br />
April 2008
SECTION 4: IMPACTS ON RETURN DETERMINATION IN CANADA<br />
Bond Markets and Return Determination<br />
Th e economic and market volatilities and instabilities of the<br />
1980s and early 1990s had a profound infl uence on which<br />
methods and methodologies regulators and stakeholders saw<br />
as preferable. Th ese infl uences were enunciated by the NEB in<br />
1994 at its last rate hearing prior to the generic cost of capital<br />
proceeding where the Board found that:<br />
“…in the light of recent and prevailing fi nancial market conditions,<br />
neither the Discounted Cash Flow (DCF) test nor the Comparable<br />
Earnings (CE) test currently yield reliable results. … Accordingly<br />
these tests were given little or no weight in the Board’s decision.”<br />
Instead, the Board was of the view that “…the ERP [equity risk<br />
premium] was the primary measure of investors’ required returns<br />
in the circumstances of this case.” However, the Board was careful<br />
to state its view that these tests (CE, DCF) may prove useful under<br />
diff erent economic conditions.” 7<br />
In the face of this instability, Canadian regulators were pushed<br />
towards risk-based return determination methods that were<br />
based on the relatively “calm” bond market. Th e availability<br />
of credible historical data and independent credible forecasts<br />
certainly made this seem like a safer foundation for a formulaic<br />
approach to return determination.<br />
What can now be seen with hindsight, however, is that<br />
government bonds yields in Canada in the early 1990s also<br />
had a number of risk elements that made them an equally poor<br />
basis for a formula approach to return determination. Th e<br />
same high government annual defi cit and high infl ation that<br />
contributed to volatility in equity comparisons were adding<br />
a “risk premium” to Canadian bond yields illustrated by the<br />
divergence from yields aff orded their US equivalents. (Fig. 7,<br />
shaded area).<br />
NERA addresses the impact in their report, wherein they<br />
concluded:<br />
“Th e apparent effi ciency of bypassing case-by-case evidentiary<br />
proceedings with a generic formula may have foretold a new and<br />
more effi cient method of deriving regulated rates generally—<br />
Canada /U.S. Bond Yield Comparison<br />
except for one thing. Th e new Canadian generic <strong>ROE</strong> formula<br />
appears to have created a persistent divergence between allowed<br />
gas utility returns in Canada and the US….Th at is, in dozens of<br />
evidentiary proceedings since 1998, US regulators have allowed<br />
their companies to set tariff s refl ecting <strong>ROE</strong>s that were on average<br />
substantially higher than for their Canadian formula-driven <strong>ROE</strong><br />
counterparts.” 8<br />
7 J.C. Major, R. Priddle “Th e Fair Return Standard for Return on Investment by Canadian Gas <strong>Utilities</strong>: Meaning, <strong>Application</strong>, Results, Implications”,<br />
pg. 14, March 2008.<br />
8 National Economic Research Associates Inc., “Allowed Return on Equity in Canada and the United States: An Economic, Financial and Institutional<br />
Analysis,” p. 4, February 2008.<br />
Natural Gas Utility Return Determination in Canada: A Review of Key Concerns and Issues<br />
April 2008 9<br />
Rate / Average Annual Yield<br />
%yield<br />
18<br />
16<br />
14<br />
12<br />
10<br />
20<br />
18<br />
16<br />
14<br />
12<br />
10<br />
8<br />
6<br />
4<br />
2<br />
0<br />
8<br />
6<br />
4<br />
2<br />
0<br />
Jan-80<br />
1985<br />
Jan-82<br />
Jan-84<br />
Jan-86<br />
Jan-88<br />
Jan-90<br />
Figure 7<br />
Jan-92<br />
Jan-94<br />
Jan-96<br />
Jan-98<br />
Jan-00<br />
Canada benchmark long bond<br />
U.S. 30-Year Treasury<br />
Jan-02<br />
Jan-04<br />
Source: U.S. Federal Reserve, Statistics Canada<br />
1987<br />
1989<br />
<strong>ROE</strong> vs Long Bond Comparison<br />
1991<br />
1993<br />
Figure 8<br />
1995<br />
1997<br />
1999<br />
2001<br />
2003<br />
Jan-06<br />
Canadian LDCs Allowed <strong>ROE</strong> US LDCs Allowed <strong>ROE</strong><br />
Long Canadas Yield U.S. 30yr Treasury Yield<br />
2005<br />
Source: Statscan, Bank of Canada, US Fed, RRA,CGA<br />
Jan-08<br />
2007
Th is observation echoes CEA’s fi ndings that prior to the<br />
formula-approach, Ontario utilities exhibited the expected<br />
higher return as compared to their US counterparts. Figure 8<br />
illustrates this point.<br />
Th e NERA report picks up on this fact and goes on to explain<br />
that the explicit and independent use of comparative return<br />
information in the US confi rms the validity and impartiality<br />
of those results, and that the counterintuitive Canadian result<br />
of lower returns, despite an equally risky basis, if not more<br />
so, illustrates the systemic downward bias in Canadian return<br />
determinations processes.<br />
NERA concludes that it is the formula itself that is driving the<br />
result:<br />
“Th e Canadian <strong>ROE</strong>s produced by the generic Canadian<br />
<strong>ROE</strong> formula are biased downward. Th e formula has, since its<br />
inception, ridden on autopilot the declining Canadian long-bond<br />
interest rates (the cost of a kind of debt) with no independent check<br />
on the cost of equity. Th e generic Canadian formula might not<br />
always be biased, and indeed in an era of stable interest rates and<br />
equity markets it may have held a true course for many years. But<br />
it has been overtaxed by the relatively unprecedented decline in<br />
interest rates since the late 1990s. Th e uncorrected, un-calibrated<br />
formula—not risk diff erences or inherent Canadian regulatory<br />
diff erences—has driven the divergence between observed Canadian<br />
and US <strong>ROE</strong>s.” 9<br />
Th e current form of Canadian formula approach, chosen<br />
because of the nature and circumstances of the equity market,<br />
bond market, and economic history that formed the very<br />
landscape of its birthplace, does not fi t the circumstances of<br />
today.<br />
9 National Economic Research Associates Inc., “Allowed Return on Equity in Canada and the United States: An Economic, Financial and Institutional<br />
Analysis,” p. 8, February 2008.<br />
10<br />
Natural Gas Utility Return Determination in Canada: A Review of Key Concerns and Issues<br />
April 2008
SECTION 5: RESPONDING TO THE IMPACTS: RECONNECTING TO THE COST OF EQUITY<br />
Reestablishing the cost of equity in Canada<br />
Th e now-favoured capital asset pricing model (CAPM)<br />
approach to return determination is driven by the current level<br />
of interest rates and the relationship between the risk-free rate<br />
of return and the return of the equity market.<br />
But a simple ex-post check shows how the cost of equity has<br />
evolved along quite a diff erent trajectory than the cost of debt<br />
(Fig. 9). As a result, the aforementioned infl uences related to the<br />
broader macro-economy appear to have caused utility returns,<br />
based essentially on the cost of debt, to track off course.<br />
In the US, a more explicit consideration of cost of equity<br />
is commonly applied using peer/proxy group return<br />
methodologies of DCF and CE. As a result US gas utility<br />
returns do not track US long bond yields as closely (Fig. 10),<br />
and have remained more in line with the broader cost of equity<br />
in North America.<br />
In the US, comparison-based methodologies benefi t from the<br />
existence of a larger, more stable group of comparable publicly<br />
traded utilities. Th at said, as argued earlier, Canadian utilities<br />
are suffi ciently comparable to the US to justify use of US peers/<br />
proxies in Canadian return determination. In their report CEA<br />
did just that, applying a standard US process to establish an<br />
acceptable peer group to accurately quantify the diff erence seen<br />
in Canadian and US returns and concluded:<br />
“Th ere are many similarities between these two groups of companies<br />
(i.e., Canadian and US gas distributors) …and any diff erences in<br />
the metrics studied above do not appear to justify the overall <strong>ROE</strong><br />
diff erential.” 10<br />
What is also apparent is that the use of peer groups requires<br />
more judgement in the return determination process, a<br />
fact recognized by the NEB in 1971 when it observed the<br />
following:<br />
“Many tests and techniques for assisting the process of reaching a<br />
just decision have been used …but no single test is conclusive, nor<br />
is any group of them defi nitive: whatever test may be used, in the<br />
Natural Gas Utility Return Determination in Canada: A Review of Key Concerns and Issues<br />
April 2008<br />
% annual average return<br />
18<br />
16<br />
14<br />
12<br />
10<br />
8<br />
6<br />
4<br />
2<br />
0<br />
1980<br />
1983<br />
Returns Comparisons<br />
1986<br />
1989<br />
1992<br />
1995<br />
Source: Statistics Canada; CGA<br />
Rate / Yield<br />
16<br />
14<br />
12<br />
10<br />
8<br />
6<br />
4<br />
2<br />
0<br />
1985<br />
1987<br />
Figure 9<br />
1998<br />
last analysis the adjudicating body cannot escape the responsibility<br />
of exercising judgement as to what, in a stated set of circumstances,<br />
is a just and reasonable return or rate of return”. 11<br />
2001<br />
2004<br />
2007<br />
Figure 10<br />
<strong>ROE</strong> vs Long Bond Comparison<br />
1989<br />
1991<br />
1993<br />
1995<br />
1997<br />
1999<br />
2001<br />
Source: US Federal Reserve, RRA, CGA<br />
18 TSX 20 Yr<br />
Average<br />
16<br />
Return<br />
14<br />
12 Canadian<br />
LDCs<br />
10 Allowed<br />
8 <strong>ROE</strong><br />
US LDCs<br />
6<br />
Allowed<br />
4 <strong>ROE</strong><br />
2<br />
0<br />
2003<br />
2005<br />
US LDCs Allowed <strong>ROE</strong> U.S. 30yr<br />
Canadian<br />
Long Bond<br />
Yield<br />
10 “A Comparative Analysis of Return on Equity of Natural Gas <strong>Utilities</strong>,” p. 36, prepared for the Ontario Energy Board by Concentric Energy Advisors,<br />
June 14, 2007.<br />
11 J.C. Major, R. Priddle “Th e Fair Return Standard for Return on Investment by Canadian Gas <strong>Utilities</strong>: Meaning, <strong>Application</strong>, Results, Implications”,<br />
pg. 13, March 2008.<br />
2007<br />
12<br />
10<br />
8<br />
6<br />
4<br />
2<br />
0<br />
11
To underscore the above point it is worth repeating how<br />
circumstances have changed and how these changing<br />
circumstances have undermined the validity of the formula.<br />
Th e formula is stable provided that there is a stable or at least<br />
predictable relationship between the cost of equity and the<br />
cost of debt – essentially the equity risk premium. Plausibly,<br />
and consistent with the evidence of the past 14 years the ERP<br />
will tend to compress in high interest rate circumstances and<br />
expand in low interest rate circumstances.<br />
Th e automatic adjustment mechanism adjusts the annual<br />
allowed return by a fraction (currently 75% in most Canadian<br />
provinces) of the change seen in the long bond. However in<br />
their study, the CEA found that this factor is almost twice as<br />
large as the relationship seen between allowed returns and long<br />
bonds in the US where the two returns are not systematically<br />
linked to the each other. 12<br />
12 “… for every one percentage point change in interest rates, the Ontario <strong>ROE</strong>s change by 86 basis points while U.S. <strong>ROE</strong>s change by 46 basis points.”, A<br />
Comparative Analysis of Return on Equity of Natural Gas <strong>Utilities</strong>,” prepared for the Ontario Energy Board by Concentric Energy Advisors, June 14,<br />
2007, pp. 16-17.<br />
12<br />
Natural Gas Utility Return Determination in Canada: A Review of Key Concerns and Issues<br />
April 2008
SECTION 6: OBJECTIONS RAISED<br />
Over the past year CGA has been discussing the issues around<br />
returns on capital with a wide range of stakeholders, regulators<br />
and policy makers. In these discussions several objections have<br />
been raised which we believe can be readily set aside. For that<br />
reason we have addressed them in the following section. Th e<br />
essential concern is set out in bold followed by our responses,<br />
most of which are based on the other research cited in the<br />
paper.<br />
Canadian gas utilities can still raise money and have not<br />
shown any signs of distress so their returns must be okay.<br />
Th ey do not “need” a higher return.<br />
• Th e courts have confi rmed that the law requires<br />
that the three pillars of the FRS be met. Th is ties<br />
together the consumers’ need for viable long-term<br />
services and the long-term viability of the regulated<br />
utility. Regulated utilities must, as required by law,<br />
be allowed to earn a fair return on their investment<br />
having regard to their duty to provide service.<br />
Th ey can neither easily divest nor responsibly<br />
stop providing services. Th is objection shows a lack<br />
of understanding of the fundamental nature of the<br />
legal rights and obligations of a regulated utility in<br />
Canada.<br />
You just can’t use the US for comparison; US utilities work<br />
under diff erent fact circumstances, including a riskier<br />
investment environment.<br />
• As NERA and CEA concluded, the US industry is<br />
highly comparable to Canada on a legal, fi nancial,<br />
and risk basis. As such, there are no fundamental<br />
diff erences that would justify the persistent gap seen<br />
between returns in Canada and the US.<br />
• In fact, Bank of Canada researchers observe<br />
that Canada is a higher risk environment and<br />
generally the cost of capital in Canada is actually<br />
higher than in the US. Canada’s smaller, less liquid,<br />
more leveraged, and more variable earnings<br />
environment are the main reasons for this<br />
observation.<br />
Natural Gas Utility Return Determination in Canada: A Review of Key Concerns and Issues<br />
April 2008<br />
Even if US returns are higher there is no reason to conclude<br />
that Canadian returns are too low; rather US returns may be<br />
biased upward<br />
• Given the wide dispersion of US returns (albeit all<br />
higher than Canadian) returns this assertion is<br />
counterintuitive. Quoting NERA: “Th ose regulators<br />
in the US who failed to fi nd a suitable way to<br />
streamline their <strong>ROE</strong> procedures continued on the<br />
former path common to both Canadian and<br />
US regulation – to examine anew, in every tariff<br />
case, expert evidence on <strong>ROE</strong> for the company in<br />
question for the relevant period of time. We do not<br />
believe that either Canadian or US regulators<br />
would consider the results of those case-by-case<br />
evidentiary procedures to be biased on a large scale.<br />
Th ey are perhaps expensive, time consuming or<br />
overwrought – but not biased.” 13<br />
New rate-setting mechanisms, like incentive-based rates, will<br />
allow utilities that are more productive to earn higher returns,<br />
so they do not need higher allowed returns.<br />
• As outlined by M/P “Earnings from incentive<br />
agreements are rewards for extraordinary cost-savings<br />
and for entrepreneurship in devising service off erings<br />
that create value for which shippers (customers) are<br />
willing to pay. As the Federal Court of Appeal<br />
reminded in the 2004 TransCanada decision, the fair<br />
return must be determined independently of its impact<br />
upon resulting customer rates.” 14<br />
Allowed returns are only a part of the total return available<br />
to Canadian utilities. Th ey have received increases in their<br />
“equity thickness” that compensate them for their lower<br />
return on equity.<br />
• In their report, CEA observes that Canadian utility<br />
allowed returns and equity thickness are both well<br />
below their US comparators (Fig. 11). Th is fact<br />
goes counter to the observed open market where<br />
higher leveraged equity investors seek higher<br />
13 National Economic Research Associates Inc., “Allowed Return on Equity in Canada and the United States: An Economic, Financial and Institutional<br />
Analysis,” p. 5, February 2008.<br />
14 J.C. Major, R. Priddle “Th e Fair Return Standard for Return on Investment by Canadian Gas <strong>Utilities</strong>: Meaning, <strong>Application</strong>, Results, Implications”,<br />
pg. 20, March 2008.<br />
13
14<br />
<br />
<br />
<br />
<br />
<br />
<br />
<br />
<br />
<br />
Figure 11<br />
<br />
<br />
<br />
<br />
<br />
<br />
equity returns to compensate them for the extra<br />
risk of that leverage. It also runs counter to the<br />
fundamental legal principle that what is at issue<br />
is a “fair return on the total capital invested”, a<br />
principle that dates back to the Northwest <strong>Utilities</strong><br />
Case in 1929 and reaffi rmed by the NEB since that<br />
time. Since, in Canada, both <strong>ROE</strong> and equity<br />
thickness are systematically lower than US<br />
comparators, the eff ect is to even further bias the<br />
return downward when looked at in the perspective<br />
of total return on capital.<br />
Canadian utilities have a tax advantage on items like dividends<br />
from utilities that make our lower returns justifi ed.<br />
• CEA concludes in their report that “In and of<br />
itself, it is not evident that the dividend tax rules in<br />
one country versus another would lead to<br />
diff erences in <strong>ROE</strong> on a comparative basis.” 15<br />
Allowed return on equity masks the reality of what utilities<br />
actually earn and that would be a more valid basis for<br />
comparison.<br />
• NERA concludes that “…under both the<br />
Canadian and US regulatory methods, the <strong>ROE</strong> is<br />
the measure of cost of capital that enters the<br />
formula to make “just and reasonable” rates.<br />
It is the measure of compensation allowed for the<br />
capital that investors devote to the service of the<br />
public at the time the rates are set. What utilities<br />
actually achieve in profi tability, however, is a<br />
diff erent matter. Th e actual returns are a refl ection<br />
of myriad factors, including management<br />
eff ectiveness, sales growth, macro-economic<br />
considerations, changes in capital costs, and even<br />
the weather. Th e regulatory treatment of investorowners<br />
is tightly bound to the <strong>ROE</strong>. Clearly, <strong>ROE</strong><br />
is the proper metric for comparison.” 16<br />
Any changes to the determination of returns for Canadian<br />
utilities must preserve the results of past regulatory decisions.<br />
Th ese decisions were made with full consideration of the facts<br />
of the time and as such are, by defi nition, fair.<br />
• Th e authors of Canada’s formula approach correctly<br />
expected a regular review of its results to ensure<br />
fairness. Th e systemic bias that has seen Canadian<br />
returns become disconnected from a reasonably<br />
formed comparator group indicates that the<br />
comparability called for in the FRS is not being<br />
maintained. Th is risks disconnecting the tie between<br />
the consumers’ long-term need for viable energy<br />
services and the long-term viability of natural gas<br />
utilities in Canada. While some regulators have<br />
reviewed the formula since its inception and while<br />
many of the issues raised in this paper have indeed<br />
been brought forward already, the long term trends<br />
indicated in the CEA and NERA reports were not<br />
available at the time of those reviews. In addition,<br />
there has been controversy regarding the relevance<br />
15 “A Comparative Analysis of Return on Equity of Natural Gas <strong>Utilities</strong>,” p. 41, prepared for the Ontario Energy Board by Concentric Energy Advisors,<br />
June 14, 2007.<br />
16 National Economic Research Associates Inc., “Allowed Return on Equity in Canada and the United States: An Economic, Financial and Institutional<br />
Analysis,” p. 7, February 2008.<br />
Natural Gas Utility Return Determination in Canada: A Review of Key Concerns and Issues<br />
April 2008
of comparisons with US LDC returns. By accepting<br />
the validity of a US comparator group regulators<br />
could resolve the dilemma such as that faced<br />
recently by BCUC who in their March 2, 2006<br />
Decision accepted the principle that comparative<br />
returns should be considered but were unable to<br />
give weight to the proposition because of concerns<br />
about sample size, stating it was “unable to give<br />
any weight to the Comparable Earnings of low-risk<br />
Canadian industrials in this proceeding, although it<br />
believes that this approach may play a role in future<br />
hearings.” 17 Both the NERA and CEA reports<br />
address this issue and conclude fi rmly that the US<br />
comparison is valid.<br />
17 “<strong>Application</strong> to Determine the Appropriate Return on Equity and <strong>Capital</strong> <strong>Structure</strong> and to Review and Revise the Automatic Adjustment<br />
Mechanism” British Columbia <strong>Utilities</strong> Commission Decision March 2006.<br />
Natural Gas Utility Return Determination in Canada: A Review of Key Concerns and Issues<br />
April 2008<br />
15
16<br />
Natural Gas Utility Return Determination in Canada: A Review of Key Concerns and Issues<br />
April 2008
CONCLUSIONS<br />
Various studies over the past year have confi rmed a persistent<br />
divergence between returns awarded to Canadian natural<br />
gas utilities and those awarded to a plausible and reasonably<br />
formed comparator group. Th is divergence is primarily due<br />
to a systemic bias in the Canadian formula approach and is<br />
not explained by diff erences in the risks to Canadian utility<br />
investors nor is it due to a systematic bias in the return<br />
determination process employed for the comparator group.<br />
Th e macro-economic and market circumstances that prevailed<br />
at the time when Canada was moving to a formula approach<br />
to utility return determination led stakeholders to seek a stable<br />
base such as the Canadian long bond. But in retrospect we see<br />
that those circumstances have changed signifi cantly and the<br />
stability of the relationship between the cost of debt and the<br />
cost of equity has declined dramatically.<br />
Th e systemic bias evident in Canadian formula-based utility<br />
return determination and the signifi cant gap that has emerged<br />
between Canadian <strong>ROE</strong> and US <strong>ROE</strong> levels warrants a<br />
Canadian proceeding to redetermine the cost of equity to gas<br />
utilities and to establish an improved approach in future Th e<br />
following processes and principles would help ensure a sound<br />
and enduring approach.<br />
• Th ere is a need to rebase Canadian <strong>ROE</strong>’s based on<br />
a comprehensive review of the cost of capital using<br />
all accepted approaches including comparison with<br />
a broad comparator group extending across all<br />
reasonably comparable industrial groups and<br />
jurisdictions including the US.<br />
• Th ere is a need to refresh the formula. In order to<br />
meet the requirements of transparency and stability<br />
the formula would need to be established on<br />
a reasonably stable and readily observable base with<br />
an adjustment factor that accounts as fully as<br />
possible for the changing relationship between the<br />
cost of equity and the cost of debt.<br />
• Th e formula should be allowed to stand for no<br />
more than fi ve years (and probably not less) after<br />
which there would need to be another<br />
comprehensive cost of capital review which brings<br />
in other methodologies and comparators.<br />
Natural Gas Utility Return Determination in Canada: A Review of Key Concerns and Issues<br />
April 2008<br />
17
18<br />
Natural Gas Utility Return Determination in Canada: A Review of Key Concerns and Issues<br />
April 2008
BIBLIOGRAPHY<br />
Bank of Canada Review “Estimating the Cost of Equity for Canadian and U.S. Firms,” Autumn 2007.<br />
British Columbia <strong>Utilities</strong> Commission “<strong>Application</strong> to Determine the Appropriate Return on Equity and <strong>Capital</strong> <strong>Structure</strong><br />
and to Review and Revise the Automatic Adjustment Mechanism” Decision, March 2006.<br />
Canadian Gas Association “Return on Equity: Allowed Returns for Canadian <strong>Utilities</strong>”, June 13, 2007.<br />
Concentric Energy Advisors “A Comparative Analysis of Return on Equity of Natural Gas <strong>Utilities</strong>,” prepared for the Ontario<br />
Energy Board, June 14, 2007.<br />
J.C. Major, R. Priddle “Th e Fair Return Standard for Return on Investment by Canadian Gas <strong>Utilities</strong>: Meaning, <strong>Application</strong>,<br />
Results, Implications”, March 2008.<br />
National Economic Research Associates Inc., “Allowed Return on Equity in Canada and the United States: An Economic,<br />
Financial and Institutional Analysis,” prepared for the Canadian Gas Association, February 2008.<br />
National Energy Board in RH-2-2004 Phase II Decision.<br />
Supreme Court of Canada in Northwestern <strong>Utilities</strong> Ltd v. Edmonton [1929] S.C.R. 186 (Northwestern).<br />
Th e Gas Journal of Canada “It’s Time for the Next Evolution in Regulation,” by Roland Priddle, June 2007.<br />
Natural Gas Utility Return Determination in Canada: A Review of Key Concerns and Issues<br />
April 2008 19
Canadian Gas Association<br />
Association cannadienne du gaz<br />
350, rue Sparks Street<br />
Suite / bureau 809<br />
Ottawa, ON K1R 7S8<br />
Tel: 613-748-0057 Fax: 613-748-9078<br />
www.cga.ca
RBC Dominion Securities Inc.<br />
Robert Kwan, CFA (Analyst)<br />
(604) 257-7611; robert.kwan@rbccm.com<br />
Peter Heusel, CFA (Associate)<br />
(604) 257-7617; peter.heusel@rbccm.com<br />
INDUSTRY | COMMENT<br />
JANUARY 16, <strong>2009</strong><br />
Energy Infrastructure<br />
Allowed <strong>ROE</strong>s: The Formula Is Broken, but Will<br />
Regulators Fix It?<br />
Investment Highlights<br />
• <strong>2009</strong> Formula <strong>ROE</strong>s to Decline by Roughly 15 Basis Points. Despite<br />
weak equity markets and rising corporate bond yields, the National Energy<br />
Board (NEB) and B.C. <strong>Utilities</strong> Commission (BCUC) formula-based<br />
allowed <strong>ROE</strong>s for <strong>2009</strong> decline by 14 bps and 15 bps, respectively. The<br />
Alberta <strong>Utilities</strong> Commission (AUC) will not set a <strong>2009</strong> generic <strong>ROE</strong> due to<br />
its upcoming review of the formula. For more information on the<br />
background and mechanics of the <strong>ROE</strong> formulas, please refer to our <strong>ROE</strong><br />
Outlook for <strong>2009</strong> report dated October 24, 2008.<br />
• Based on Current Data, the 2010 <strong>ROE</strong> Could Significantly Decline.<br />
Using current market data as a proxy for the forecast data used in the<br />
formulas, we estimate that the 2010 allowed <strong>ROE</strong>s could decline by a<br />
further 67 basis points.<br />
• The Formula Is Broken...With higher equity risk premiums and higher<br />
long bond yields for Energy Infrastructure companies that are trading at<br />
levels close to the allowed <strong>ROE</strong>s, it appears that the formula is broken.<br />
Forgetting the magnitude of change, it appears that the formula is producing<br />
a result that is directionally incorrect (i.e., <strong>ROE</strong>s declining yet corporate<br />
bond yields and equity risk premiums are rising).<br />
• ...But Will Regulators Fix It? Historically, there has been a reluctance to<br />
make changes to the <strong>ROE</strong> formula, although we believe that current market<br />
data makes it more difficult to justify the formula in its current form. The<br />
first crack at changes to the formula will be the NEB decision on Trans<br />
Quebec & Maritimes' (TQM) cost of capital proceeding, which is now<br />
expected to be issued by the end of March <strong>2009</strong> (delay from the originally<br />
anticipated timeline). If the NEB deviates from the <strong>ROE</strong> formula, we would<br />
expect provincial regulators to review their formulas as well.<br />
• From a Risk-Reward Perspective, We Would Focus on Companies with<br />
the Least Exposure to the Formula. The two companies in our coverage<br />
universe with low exposures to the <strong>ROE</strong> formulas are Emera and Enbridge.<br />
Based on its lack of <strong>ROE</strong> exposure and strong defensive characteristics, we<br />
upgraded Emera this morning to Sector Perform (from<br />
Underperform)--please refer to our Research Comment this morning on<br />
Emera for further details. Enbridge remains ranked Outperform, Average<br />
Risk. We also favour TransCanada (Outperform, Average Risk), which has<br />
higher, but still relatively modest, exposure to the <strong>ROE</strong> formulas than<br />
Emera and Enbridge.<br />
Priced as of prior trading day's market close, EST (unless otherwise noted).<br />
All values in CAD unless otherwise noted.<br />
For Required Disclosures, please see Page 6.
January 16, <strong>2009</strong><br />
<strong>2009</strong> Allowed <strong>ROE</strong>s to Decline by Roughly 15 Basis Points<br />
The allowed <strong>ROE</strong> formulas used by some regulators in Canada have been set, and indicate a decline of roughly 15 basis points<br />
compared to 2008 levels.<br />
• National Energy Board (NEB): The NEB’s Multi-Pipeline <strong>ROE</strong> for <strong>2009</strong> will be 8.57% compared to 8.71% in 2008 (14<br />
basis point decline).<br />
• British Columbia <strong>Utilities</strong> Commission (BCUC): The BCUC’s <strong>ROE</strong> for a low-risk benchmark utility for <strong>2009</strong> is 8.47%<br />
compared to 8.62% for 2008 (15 basis point decline).<br />
• Alberta <strong>Utilities</strong> Commission (AUC): The AUC will not be confirming its generic <strong>ROE</strong> for <strong>2009</strong> due to its upcoming<br />
review of the formula. However, the mechanics of the formula are similar to that of the NEB and would have resulted in a<br />
similar decline for <strong>2009</strong> compared to 2008.<br />
2010 Declines Could Be Significantly Higher<br />
The allowed <strong>ROE</strong> formulas are set based on data in November, so a lot can happen between now and then. However, if current market<br />
data were used as a proxy for the inputs into the NEB formula for 2010, our analysis indicates that allowed <strong>ROE</strong>s could decline by<br />
roughly 67 basis points as shown in Exhibit 1. Changes to the BCUC and AUC formulas would be roughly similar to the NEB<br />
formula.<br />
Exhibit 1: Estimated 2010 <strong>ROE</strong> Based on Current Market Data<br />
NEB <strong>ROE</strong> Calculation 2008 <strong>2009</strong> 2010E*<br />
Consensus economic forecast 10-yr bond yield (3 Months Out) 4.30% 3.70%<br />
Consensus economic forecast 10-yr bond yield (12 Months Out) 4.70% 4.00%<br />
Average 4.50% 3.85% 2.59%<br />
Add: average basis point spread between 10-year and 30-year GOC bond 0.05% 0.51% 0.89%<br />
Current year forecast of the 30-year GOC bond yield 4.55% 4.36% 3.48%<br />
Previous year forecast of the 30-year GOC bond yield 4.22% 4.55% 4.36%<br />
Difference between current year forecast and previous year bond yield 0.33% -0.19% -0.88%<br />
Adjustment factor 0.75<br />
0.75<br />
0.75<br />
0.25% -0.14% -0.66%<br />
Previous year <strong>ROE</strong> 8.46% 8.71% 8.57%<br />
Current Year Forecast <strong>ROE</strong> 8.71% 8.57% 7.90%<br />
* - For 2010, we use the current 10-yr bond yield and current spread between the 10-yr and 30-yr GOC<br />
Source: National Energy Board; Bloomberg; RBC <strong>Capital</strong> Markets estimates<br />
EPS in 2010 Could Meaningfully Decline<br />
Energy Infrastructure<br />
As shown in Exhibit 2, a 67 basis point decline in the formulas would cause EPS to meaningfully decline for several companies.<br />
Although there are nuances in some of the formulas (particularly the formula for Fortis’ Newfoundland Power), we have used an<br />
across-the-board 67 basis point change as a proxy for all <strong>ROE</strong>s exposed to formulas.<br />
We estimate that Fortis and Canadian <strong>Utilities</strong> would be most negatively impacted if formula-based <strong>ROE</strong>s were to significantly<br />
decline, while Emera (not shown as it has no formula-based <strong>ROE</strong> exposure) and Enbridge would have the lowest exposure.<br />
2
January 16, <strong>2009</strong><br />
Exhibit 2: Forecast EPS Sensitivity (In $MM except per share figures)<br />
<strong>2009</strong><br />
<strong>ROE</strong><br />
Change<br />
in <strong>ROE</strong><br />
Estimated<br />
Ratebase<br />
Impacted Deemed Earnings<br />
by Change Equity Impact<br />
EPS<br />
Impact<br />
EPS<br />
Impact<br />
(%)<br />
Canadian <strong>Utilities</strong> PPAs 8.64% -0.67% $977 $440 ($2.9) ($0.023) -0.80%<br />
Alberta <strong>Utilities</strong> Commission 1<br />
8.45% -0.67% 4,649 1,736 (11.6) (0.093) -3.15%<br />
Total $5,626 $2,175 ($14.6) ($0.116) -3.95%<br />
ATCO <strong>ROE</strong> exposure through 52.4% interest in Canadian <strong>Utilities</strong> (see above) ($0.250) -3.06%<br />
Enbridge 2<br />
National Energy Board 8.57% -0.67% $1,397 $629 ($4.2) ($0.011) -0.51%<br />
Noverco preferred shares 7.94% -0.67% 182 182 (1.2) (0.003) -0.15%<br />
Total $1,578 $811 ($5.4) ($0.015) -0.66%<br />
Fortis Alberta <strong>Utilities</strong> Commission 1<br />
8.45% -0.67% $1,349 $499 ($3.3) ($0.020) -1.28%<br />
BCUC 8.47% -0.67% 3,930 1,447 (9.7) (0.057) -3.71%<br />
Newfoundland Power 8.95% -0.67% 849 382 (2.6) (0.015) -0.98%<br />
Total $6,129 $2,328 ($15.6) ($0.092) -5.97%<br />
TransCanada National Energy Board 8.57% -0.67% $7,893 $3,105 ($20.8) ($0.033) -1.46%<br />
Alberta <strong>Utilities</strong> Commission 1<br />
8.45% -0.67% 4,612 1,614 (10.8) (0.017) -0.76%<br />
Total $12,505 $4,720 ($31.6) ($0.051) -2.23%<br />
TransAlta PPAs 8.64% -0.67% $1,275 $574 ($3.8) ($0.020) -1.18%<br />
Notes:<br />
(1) For utilities regulated by the AUC, our analysis uses an estimate of the <strong>2009</strong> allowed <strong>ROE</strong> as the AUC will not be setting<br />
an <strong>ROE</strong> for <strong>2009</strong> due to its ongoing generic <strong>ROE</strong> proceeding.<br />
(2) Per its 2008 settlement agreement, Enbridge Gas Distribution's allowed <strong>ROE</strong> will not change annually based on the OEB's<br />
formula.<br />
Source: Bank of Canada; Financial Post; Bloomberg; various regulatory decisions; company reports; RBC <strong>Capital</strong> Markets estimates<br />
What Will Regulators Do?<br />
Energy Infrastructure<br />
Historically, regulators have been reluctant to make changes to the <strong>ROE</strong> formula and we believe that there will be resistance to<br />
making changes in the future, despite the current market environment. There remains a possibility that regulators could choose to<br />
suspend the formula in 2010 (and potentially retroactively for <strong>2009</strong>), or even correct the direction of the formula by increasing<br />
allowed <strong>ROE</strong>s from current levels. We believe that the upcoming NEB decision will be very important in gauging the future of the<br />
<strong>ROE</strong> formula. We do not believe that the upside from a potential change in the formula outweighs the downside risk of the status quo,<br />
and as such we favour names with lower exposure to the <strong>ROE</strong> formulas.<br />
Energy Infrastructure Still a Solid Sector, but Lower Exposure to Formulas Is a Good Thing<br />
• Sector Has Strong Defensive Characteristics: We continue to highlight that the sector has a good history of outperforming<br />
in down markets. Since 1975, the sector has outperformed the S&P/TSX Composite 7 out of 8 times in major market declines<br />
with an average annualized outperformance of 28%. Further, many of the stocks have unique credit market defensive<br />
attributes such as the ability to pass through debt funding costs to customers as part of the regulatory framework or provisions<br />
in customer contracts.<br />
• Lower Formula <strong>ROE</strong> Exposure Is a Good Thing: Although there remains the potential for upside in allowed <strong>ROE</strong>s should<br />
the National Energy Board provide a positive decision on TQM’s proceeding by the end of March, the potential for a<br />
significant decline in the formula-based <strong>ROE</strong> for 2010 causes us some concern.<br />
At this stage of the cycle, we recommend that investors stick with the large cap names with the greatest trading liquidity, namely<br />
Enbridge and TransCanada. We believe these two stocks provide investors with the best ability to participate in a market rally due to<br />
their growth profiles, while still preserving a strong defensive component for portfolios. Further, by holding the names with the<br />
highest trading liquidity, investors will be able to most effectively rotate out of the sector when they want to re-position into more<br />
offensive names for a pending market rally. In addition, both companies have relatively low exposure to the allowed <strong>ROE</strong> formulas.<br />
For more bearish investors concerned that equity and credit markets will significantly weaken over the coming year, we recommend<br />
the companies with the highest percentage of earnings derived from utilities operating under Canadian cost of service regulation,<br />
namely Emera and Fortis. Given its lower exposure to the <strong>ROE</strong> formula, we have a slight preference for Emera.<br />
3
January 16, <strong>2009</strong><br />
Exhibit 3: Large Cap Energy Infrastructure Coverage Universe<br />
Normalized Basic EPS Current<br />
PRICE Normalized Fully Diluted EPS P/E Ratio Dividend/ Current 1-Year<br />
Ticker 15-Jan-09 FY07 FY08E FY09E FY10E FY08E FY09E FY10E Distrib. Yield Target Recommendation Risk<br />
ATCO Ltd. ACO.X $37.44 $3.79 $4.32 $3.80 $4.00 8.7x 9.9x 9.4x $0.94 2.5% $40.00 Sector Perform Above Average<br />
$3.76 $4.29 $3.77 $3.97<br />
Canadian <strong>Utilities</strong> CU $40.05 $2.74 $3.10 $2.94 $3.09 12.9x 13.6x 13.0x $1.33 3.3% $40.00 Underperform Average<br />
$2.73 $3.09 $2.93 $3.08<br />
Emera EMA $22.38 $1.30 $1.31 $1.43 $1.48 17.1x 15.7x 15.1x $1.01 4.5% $23.00 Sector Perform Average<br />
$1.27 $1.28 $1.40 $1.45<br />
Enbridge ENB $40.04 $1.77 $1.88 $2.22 $2.48 21.3x 18.0x 16.1x $1.48 3.7% $44.00 Outperform Average<br />
$1.76 $1.87 $2.21 $2.46<br />
Fortis FTS $24.10 $1.33 $1.56 $1.54 $1.63 15.4x 15.6x 14.8x $1.04 4.3% $24.00 Sector Perform Average<br />
$1.31 $1.54 $1.52 $1.61<br />
TransAlta Corp. TA $22.85 $1.33 $1.46 $1.69 $1.88 15.7x 13.5x 12.2x $1.08 4.7% $28.00 Sector Perform Above Average<br />
$1.33 $1.46 $1.69 $1.88<br />
TransCanada TRP $34.24 $2.09 $2.37 $2.29 $2.47 14.4x 15.0x 13.9x $1.44 4.2% $40.00 Outperform Average<br />
$2.08 $2.36 $2.28 $2.46<br />
Average: 15.1x 14.5x 13.5x 3.9%<br />
Source: RBC <strong>Capital</strong> Markets estimates<br />
Price Target Justifications and Impediments<br />
Energy Infrastructure<br />
ATCO<br />
Our price target for ATCO of $40.00 is based on a net asset value (NAV) framework given that its primary asset is its holdings in the<br />
publicly traded Canadian <strong>Utilities</strong>. In calculating our price target, we are reflecting a NAV discount of 18%, which is in line with the<br />
estimated average historical discount. A decline in Canadian <strong>Utilities</strong>’ actual and/or expected share price would have negative<br />
implications for ATCO’s NAV and, accordingly, its share price.<br />
Canadian <strong>Utilities</strong><br />
Our price target for Canadian <strong>Utilities</strong> of $40.00 implies a forward P/E of 12.9x, and a required dividend yield of 3.80% based on a<br />
12-month dividend distribution one year forward of $1.53. The forward P/E is an approximately 2x discount to the average P/E<br />
implied by our price targets for Canadian <strong>Utilities</strong>’ peer group. The P/E discount is in line with historical averages. A 10 basis point<br />
change in the required dividend yield would affect our price target by approximately $1.00 per share. Factors that could have negative<br />
implications for Canadian <strong>Utilities</strong>’ earnings and price target include negative regulatory decisions by the Alberta <strong>Utilities</strong><br />
Commission, depressed prices for power in Alberta over an extended period, an acquisition that fails to gain the confidence of<br />
investors, and failure to meet long-term power purchase arrangement obligations.<br />
Emera<br />
Our price target for Emera of $23.00 implies a forward P/E of 15.5x, and a required dividend yield of 4.5% based on a 12-month<br />
dividend distribution one year forward of $1.05. A 10 basis point change in the required dividend yield would affect our price target<br />
by approximately $0.25 per share. Risks to our earnings estimates and price target include, but are not limited to, the following:<br />
unexpected losses from business development activities, the unsuccessful completion of the Brunswick Pipeline; actual returns or a<br />
risk profile for the Brunswick Pipeline that differs materially from our assumptions, and the impact of future regulatory decisions for<br />
NSPI and Bangor Hydro.<br />
Enbridge<br />
Our price target for Enbridge of $44.00 implies a forward P/E of 18x, and a required dividend yield of 3.50% based on a 12-month<br />
dividend distribution one year forward of $1.58. A 10 basis point change in the required dividend yield would affect our price target<br />
by approximately $1.25 per share. Our price target is based on the assumption that Enbridge can complete the list of projects that it is<br />
pursuing on attractive economic terms and that the company will continue to announce new projects that will help drive future annual<br />
EPS growth in the high single digits. The price target further assumes that the company’s risk profile does not materially change.<br />
Fortis<br />
Our target price of $24.00 implies a forward P/E of 14.7x, and a required dividend yield of 4.75% based on a 12-month dividend<br />
distribution one year forward of $1.13. A 10 bp change in the required dividend yield would affect our price target by approximately<br />
$0.50 per share. The forward P/E multiple is in line with the average current multiple for the group, reflecting Fortis’ slowing EPS<br />
growth profile that should approximate the average growth rate of the group over the next couple of years. In addition, the forward P/E<br />
used in our valuation is at the low end of the stock’s 5-year historical P/E range (roughly 14x-20x), reflecting the weak equity markets<br />
4
January 16, <strong>2009</strong><br />
Energy Infrastructure<br />
and the slowing EPS growth profile. The political environment in Belize, risk of punitive regulatory decisions, economic/tourism<br />
conditions in its service territories, operational or financial issues at newly acquired businesses or power prices in Ontario may have<br />
implications for our target price as well as our earnings and dividend estimates.<br />
TransAlta<br />
Our $28.00 price target implies a 7.5x 2010E EBITDA for the base operations plus a $5/share risked upside when the Alberta Power<br />
Purchase Arrangements expire in 2017 and 2020. The potential upside assumes an $80/MWh net realized power price and a 15%<br />
levered equity discount rate. Impediments to our price target include the takeover of the company, valuations for U.S. independent<br />
power producers, differences between actual results and our forecasts in the power market, coal costs at the Centralia and Alberta<br />
plants, results from trading activities, operational issues, and investor’ acceptance of acquisitions and new projects. Note that our risk<br />
qualifier for TransAlta is Above Average.<br />
TransCanada<br />
Our price target for TransCanada of $40.00 implies a forward P/E of 16x, and a required dividend yield of 4.00% based on a forecast<br />
12-month dividend distribution one year forward of $1.60. We estimate that a 10 basis point change in the required dividend yield<br />
would impact our price target by approximately $1.00 per share. The 16x forward P/E multiple is a roughly 2x discount to Enbridge,<br />
which is generally in line with the current discount and reflects modestly lower expected EPS growth in addition to the financing<br />
challenges relative to Enbridge over the next year. There is risk to our price target from reduced gas flows on the Canadian Mainline<br />
in addition to the company investing in new projects that fail to gain the support and confidence of its shareholders. TransCanada also<br />
has earnings exposure to power prices and gas prices. Prices that differ from our estimates could cause actual results to be lower than<br />
expected.<br />
5
January 16, <strong>2009</strong><br />
Required Disclosures<br />
This product constitutes a compendium report (covers six or more subject companies). As such, RBC <strong>Capital</strong> Markets<br />
chooses to provide specific disclosures for the subject companies by reference. To access current disclosures for the subject<br />
companies, clients should refer to http://www7.rbccm.com/GLDisclosure/PublicWeb/DisclosureLookup.aspx?EntityID=1 or<br />
send a request to RBC CM Research Publishing, P.O. Box 50, 200 Bay Street, Royal Bank Plaza, 29th Floor, South Tower,<br />
Toronto, Ontario M5J 2W7.<br />
Distribution of Ratings<br />
For the purpose of ratings distributions, regulatory rules require member firms to assign ratings to one of three rating<br />
categories - Buy, Hold/Neutral, or Sell - regardless of a firm's own rating categories. Although RBC <strong>Capital</strong> Markets' ratings<br />
of Top Pick/Outperform, Sector Perform and Underperform most closely correspond to Buy, Hold/Neutral and Sell,<br />
respectively, the meanings are not the same because our ratings are determined on a relative basis (as described above).<br />
Distribution of Ratings<br />
RBC <strong>Capital</strong> Markets, Equity Research<br />
Investment Banking<br />
Serv./Past 12 Mos.<br />
Rating Count Percent Count Percent<br />
BUY[TP/O] 491 44.60 127 25.87<br />
HOLD[SP] 509 46.10 93 18.27<br />
SELL[U] 103 9.30 14 13.59<br />
Analyst Certification<br />
All of the views expressed in this report accurately reflect the personal views of the responsible analyst(s) about any and all<br />
of the subject securities or issuers. No part of the compensation of the responsible analyst(s) named herein is, or will be,<br />
directly or indirectly, related to the specific recommendations or views expressed by the responsible analyst(s) in this report.<br />
Dissemination of Research<br />
RBC <strong>Capital</strong> Markets endeavours to make all reasonable efforts to provide research simultaneously to all eligible clients,<br />
having regard to local time zones in overseas jurisdictions. RBC <strong>Capital</strong> Markets' research is posted to our proprietary<br />
websites to ensure eligible clients receive coverage initiations and changes in rating, targets and opinions in a timely manner.<br />
Additional distribution may be done by the sales personnel via email, fax or regular mail. Clients may also receive our<br />
research via third party vendors. Please contact your investment advisor or institutional salesperson for more information<br />
regarding RBC <strong>Capital</strong> Markets research.<br />
RBC <strong>Capital</strong> Markets also provides eligible clients with access to a database which may contain Short-Term trading calls on<br />
certain of the subject companies for which it currently provides equity research coverage. The database may be accessed via<br />
the following hyperlink https://www2.rbccm.com/cmonline/index.html. The information regarding Short-Term trading calls<br />
accessible through the database does not constitute a research report. These Short-Term trading calls are not formal ratings<br />
and reflect the research analyst's views with respect to market and trading events in the coming days or weeks and, as such,<br />
may differ from the price targets and recommendations in our published research reports reflecting the research analyst's<br />
views of the longer-term (one year) prospects of the subject company. Thus, it is possible that a subject company's common<br />
equity that is considered a long-term 'sector perform' or even an 'underperform' might be a Short-Term buying opportunity as<br />
a result of temporary selling pressure in the market; conversely, a subject company's common equity rated a long-term<br />
'outperform' could be considered susceptible to a Short-Term downward price correction.<br />
Conflicts Disclosures<br />
RBC <strong>Capital</strong> Markets Policy for Managing Conflicts of Interest in Relation to Investment Research is available from us on<br />
request. To access our current policy, clients should refer to<br />
http://www.rbccm.com/cm/file/0,,63022,00.pdf<br />
or send a request to RBC CM Research Publishing, P.O. Box 50, 200 Bay Street, Royal Bank Plaza, 29th Floor, South<br />
Tower, Toronto, Ontario M5J 2W7. We reserve the right to amend or supplement this policy at any time.<br />
Important Disclosures<br />
Energy Infrastructure<br />
The analyst(s) responsible for preparing this research report received compensation that is based upon various factors,<br />
6
January 16, <strong>2009</strong><br />
including total revenues of the member companies of RBC <strong>Capital</strong> Markets and its affiliates, a portion of which are or have<br />
been generated by investment banking activities of the member companies of RBC <strong>Capital</strong> Markets and its affiliates.<br />
Additional Disclosures<br />
RBC <strong>Capital</strong> Markets is the business name used by certain subsidiaries of Royal Bank of Canada, including RBC Dominion Securities Inc., RBC <strong>Capital</strong><br />
Markets Corporation, Royal Bank of Canada Europe Limited and Royal Bank of Canada - Sydney Branch. The information contained in this report has been<br />
compiled by RBC <strong>Capital</strong> Markets from sources believed to be reliable, but no representation or warranty, express or implied, is made by Royal Bank of<br />
Canada, RBC <strong>Capital</strong> Markets, its affiliates or any other person as to its accuracy, completeness or correctness. All opinions and estimates contained in this<br />
report constitute RBC <strong>Capital</strong> Markets' judgement as of the date of this report, are subject to change without notice and are provided in good faith but without<br />
legal responsibility. Nothing in this report constitutes legal, accounting or tax advice or individually tailored investment advice. This material is prepared for<br />
general circulation to clients and has been prepared without regard to the individual financial circumstances and objectives of persons who receive it. The<br />
investments or services contained in this report may not be suitable for you and it is recommended that you consult an independent investment advisor if you<br />
are in doubt about the suitability of such investments or services. This report is not an offer to sell or a solicitation of an offer to buy any securities. Past<br />
performance is not a guide to future performance, future returns are not guaranteed, and a loss of original capital may occur. RBC <strong>Capital</strong> Markets research<br />
analyst compensation is based in part on the overall profitability of RBC <strong>Capital</strong> Markets, which includes profits attributable to investment banking revenues.<br />
Every province in Canada, state in the U.S., and most countries throughout the world have their own laws regulating the types of securities and other<br />
investment products which may be offered to their residents, as well as the process for doing so. As a result, the securities discussed in this report may not be<br />
eligible for sale in some jurisdictions. This report is not, and under no circumstances should be construed as, a solicitation to act as securities broker or dealer<br />
in any jurisdiction by any person or company that is not legally permitted to carry on the business of a securities broker or dealer in that jurisdiction. To the full<br />
extent permitted by law neither RBC <strong>Capital</strong> Markets nor any of its affiliates, nor any other person, accepts any liability whatsoever for any direct or<br />
consequential loss arising from any use of this report or the information contained herein. No matter contained in this document may be reproduced or copied<br />
by any means without the prior consent of RBC <strong>Capital</strong> Markets.<br />
Additional information is available on request.<br />
Energy Infrastructure<br />
To U.S. Residents:<br />
This publication has been approved by RBC <strong>Capital</strong> Markets Corporation, which is a U.S. registered broker-dealer and which accepts responsibility for this<br />
report and its dissemination in the United States. Any U.S. recipient of this report that is not a registered broker-dealer or a bank acting in a broker or dealer<br />
capacity and that wishes further information regarding, or to effect any transaction in, any of the securities discussed in this report, should contact and place<br />
orders with RBC <strong>Capital</strong> Markets Corporation.<br />
To Canadian Residents:<br />
This publication has been approved by RBC Dominion Securities Inc. Any Canadian recipient of this report that is not a Designated Institution in Ontario, an<br />
Accredited Investor in British Columbia or Alberta or a Sophisticated Purchaser in Quebec (or similar permitted purchaser in any other province) and that<br />
wishes further information regarding, or to effect any transaction in, any of the securities discussed in this report should contact and place orders with RBC<br />
Dominion Securities Inc., which, without in any way limiting the foregoing, accepts responsibility for this report and its dissemination in Canada.<br />
To U.K. Residents:<br />
This publication has been approved by Royal Bank of Canada Europe Limited ('RBCEL') which is authorized and regulated by Financial ServicesAuthority<br />
('FSA'), in connection with its distribution in the United Kingdom. This material is not for general distribution in the United Kingdom to retail clients, as<br />
defined under the rules of the FSA. However, targeted distribution may be made to selected retail clients of RBC and its affiliates. RBCEL accepts<br />
responsibility for this report and its dissemination in the United Kingdom.<br />
To Persons Receiving This Advice in Australia:<br />
This material has been distributed in Australia by Royal Bank of Canada - Sydney Branch (ABN 86 076 940 880, AFSL No. 246521). This material has been<br />
prepared for general circulation and does not take into account the objectives, financial situation or needs of any recipient. Accordingly, any recipient should,<br />
before acting on this material, consider the appropriateness of this material having regard to their objectives, financial situation and needs. If this material<br />
relates to the acquisition or possible acquisition of a particular financial product, a recipient in Australia should obtain any relevant disclosure document<br />
prepared in respect of that product and consider that document before making any decision about whether to acquire the product.<br />
To Hong Kong Residents:<br />
This publication is distributed in Hong Kong by RBC Investment Services (Asia) Limited, a licensed corporation under the Securities and Futures Ordinance<br />
or, by Royal Bank of Canada, Hong Kong Branch, a registered institution under the Securities and Futures Ordinance. This material has been prepared for<br />
general circulation and does not take into account the objectives, financial situation, or needs of any recipient. Hong Kong persons wishing to obtain further<br />
information on any of the securities mentioned in this publication should contact RBC Investment Services (Asia) Limited or Royal Bank of Canada, Hong<br />
Kong Branch at 17/Floor, Cheung Kong Center, 2 Queen's Road Central, Hong Kong (telephone number is 2848-1388).<br />
To Singapore Residents:<br />
This publication is distributed in Singapore by RBC (Singapore Branch), a registered entity granted offshore bank status by the Monetary Authority of<br />
Singapore. This material has been prepared for general circulation and does not take into account the objectives, financial situation, or needs of any recipient.<br />
You are advised to seek independent advice from a financial adviser before purchasing any product. If you do not obtain independent advice, you should<br />
consider whether the product is suitable for you. Past performance is not indicative of future performance.<br />
®Registered trademark of Royal Bank of Canada. RBC <strong>Capital</strong> Markets is a trademark of Royal Bank of Canada. Used under license.<br />
Copyright © RBC <strong>Capital</strong> Markets Corporation <strong>2009</strong> - Member SIPC<br />
Copyright © RBC Dominion Securities Inc. <strong>2009</strong> - Member CIPF<br />
Copyright © Royal Bank of Canada Europe Limited <strong>2009</strong><br />
Copyright © Royal Bank of Canada <strong>2009</strong><br />
All rights reserved<br />
7