Point Cook West Precinct Structure Plan - Growth Areas Authority
Point Cook West Precinct Structure Plan - Growth Areas Authority
Point Cook West Precinct Structure Plan - Growth Areas Authority

You also want an ePaper? Increase the reach of your titles
YUMPU automatically turns print PDFs into web optimized ePapers that Google loves.
POINT COOK WEST PRECINCT STRUCTURE PLAN<br />
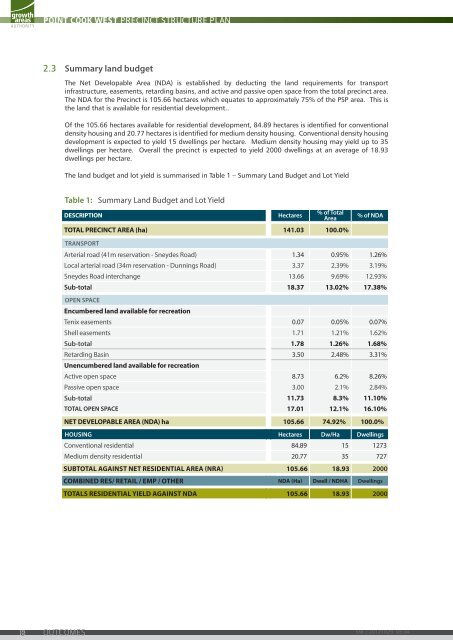
2.3 Summary land budget<br />
8 OUTCOMES<br />
The Net Developable Area (NDA) is established by deducting the land requirements for transport<br />
infrastructure, easements, retarding basins, and active and passive open space from the total precinct area.<br />
The NDA for the <strong>Precinct</strong> is 105.66 hectares which equates to approximately 75% of the PSP area. This is<br />
the land that is available for residential development..<br />
Of the 105.66 hectares available for residential development, 84.89 hectares is identified for conventional<br />
density housing and 20.77 hectares is identified for medium density housing. Conventional density housing<br />
development is expected to yield 15 dwellings per hectare. Medium density housing may yield up to 35<br />
dwellings per hectare. Overall the precinct is expected to yield 2000 dwellings at an average of 18.93<br />
dwellings per hectare.<br />
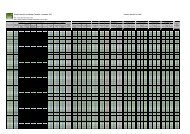
The land budget and lot yield is summarised in Table 1 – Summary Land Budget and Lot Yield<br />
Table 1: Summary Land Budget and Lot Yield<br />
DESCRIPTION Hectares<br />
% of Total<br />
Area<br />
TOTAL PRECINCT AREA (ha) 141.03 100.0%<br />
% of NDA<br />
TRANSPORT<br />
Arterial road (41m reservation - Sneydes Road) 1.34 0.95% 1.26%<br />
Local arterial road (34m reservation - Dunnings Road) 3.37 2.39% 3.19%<br />
Sneydes Road interchange 13.66 9.69% 12.93%<br />
Sub-total<br />
OPEN SPACE<br />
Encumbered land available for recreation<br />
18.37 13.02% 17.38%<br />
Tenix easements 0.07 0.05% 0.07%<br />
Shell easements 1.71 1.21% 1.62%<br />
Sub-total 1.78 1.26% 1.68%<br />
Retarding Basin<br />
Unencumbered land available for recreation<br />
3.50 2.48% 3.31%<br />
Active open space 8.73 6.2% 8.26%<br />
Passive open space 3.00 2.1% 2.84%<br />
Sub-total 11.73 8.3% 11.10%<br />
TOTAL OPEN SPACE 17.01 12.1% 16.10%<br />
NET DEVELOPABLE AREA (NDA) ha 105.66 74.92% 100.0%<br />
HOUSING Hectares Dw/Ha Dwellings<br />
Conventional residential 84.89 15 1273<br />
Medium density residential 20.77 35 727<br />
SUBTOTAL AGAINST NET RESIDENTIAL AREA (NRA) 105.66 18.93 2000<br />
COMBINED RES/ RETAIL / EMP / OTHER NDA (Ha) Dwell / NDHA Dwellings<br />
TOTALS RESIDENTIAL YIELD AGAINST NDA 105.66 18.93 2000<br />
SM | 20121029 05:04