Transport Modelling - Growth Areas Authority
Transport Modelling - Growth Areas Authority
Transport Modelling - Growth Areas Authority

Create successful ePaper yourself
Turn your PDF publications into a flip-book with our unique Google optimized e-Paper software.
Northern <strong>Growth</strong> Corridor <strong>Transport</strong> <strong>Modelling</strong><br />
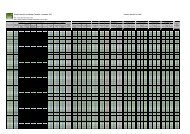
Table 4: Daily mode shares by LGA, 2046 scenarios<br />
2046 Unconstrained 2046 Constrained<br />
LGA % CAR % PT TOTAL % CAR % PT TOTAL<br />
Hume 90.7% 9.3% 2,699,652 91.7% 8.3% 2,715,097<br />
Whittlesea 92.5% 7.5% 1,789,852 92.6% 7.4% 1,795,304<br />
Mitchell n/a n/a* 932,319** n/a n/a* 946,593**<br />
* The likely %PT for the Shire of Mitchell is likely to be higher than for Hume due to the close proximity<br />
of residential and employment precincts to train stations (Wallan, Beveridge, Lockerbie and Donnybrook<br />
stations) and a frequent service running to the CBD.<br />
* *The Mitchell trip volumes only apply to the portion of the municipality within the model.<br />
A3 plots of the outputs are provided in Appendix E<br />
PAGE xxv