Transport Modelling - Growth Areas Authority
Transport Modelling - Growth Areas Authority
Transport Modelling - Growth Areas Authority

You also want an ePaper? Increase the reach of your titles
YUMPU automatically turns print PDFs into web optimized ePapers that Google loves.
Northern <strong>Growth</strong> Corridor <strong>Transport</strong> <strong>Modelling</strong><br />
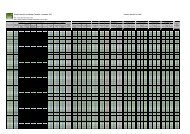
Table 3: Mode shares and total trips to and from each LGA<br />
2011 2046<br />
LGA % CAR % PT TOTAL % CAR % PT TOTAL<br />
Hume 94.7% 5.3% 1,077,587 90.7% 9.3% 2,699,652<br />
Whittlesea 95.5% 4.5% 786,549 92.5% 7.5% 1,789,852<br />
Mitchell n/a n/a n/a n/a n/a* 932,319**<br />
* The likely %PT for the Shire of Mitchell is likely to be higher than for Hume due to the close proximity<br />
of residential and employment precincts to train stations (Wallan, Beveridge, Lockerbie and Donnybrook<br />
stations) and a frequent service running to the CBD.<br />
* *The Mitchell trip volumes only apply to the portion of the municipality within the model.<br />
PAGE xxi