Transport Modelling - Growth Areas Authority
Transport Modelling - Growth Areas Authority
Transport Modelling - Growth Areas Authority

You also want an ePaper? Increase the reach of your titles
YUMPU automatically turns print PDFs into web optimized ePapers that Google loves.
Northern <strong>Growth</strong> Corridor <strong>Transport</strong> <strong>Modelling</strong><br />
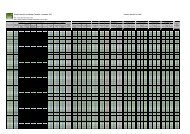
Figure 9: PM peak (3pm-6pm) volume to capacity ratios<br />
3.1 PUBLIC TRANSPORT LOADS<br />
Public transport bandwidth plots have been produced for the AM and PM peak<br />
periods; thicker lines represent higher passenger volumes. The forecast rail<br />
patronage between Wallan and Roxburgh Park (where the Upfield and Craigieburn<br />
Lines merge) is very high and is unlikely to be accommodated by the future rail<br />
network capacity. We recommend that the model be run with public transport<br />
capacity constraints so that forecasts are within more reasonable bounds.<br />
PAGE xviii