Development Contributions Plan - Growth Areas Authority
Development Contributions Plan - Growth Areas Authority
Development Contributions Plan - Growth Areas Authority

Create successful ePaper yourself
Turn your PDF publications into a flip-book with our unique Google optimized e-Paper software.
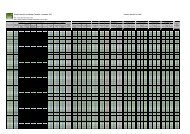
Table 2: Property specific land use budget (Continued)<br />
Property Number<br />
Net Developable Area<br />
% of Precinct<br />
Active Open Space<br />
% NDA<br />
Key Percentages<br />
Passive Open Space<br />
% NDA<br />
Property 1 0.00% 0.00% 0.00% 0.00% 10.09% -10.09% 0.00%<br />
Property 2 0.00% 0.00% 0.00% 0.00% 10.09% -10.09% 0.00%<br />
Property 3 89.61% 0.00% 0.00% 0.00% 10.09% -10.09% -6.44%<br />
Property 4 60.11% 0.00% 3.14% 3.14% 10.09% -6.95% -222.02%<br />
Property 5 88.98% 0.00% 0.00% 0.00% 10.09% -10.09% -4.48%<br />
Property 6 87.67% 0.00% 0.00% 0.00% 10.09% -10.09% -4.52%<br />
Property 7 68.42% 39.25% 0.00% 39.25% 10.09% 29.16% 411.68%<br />
Property 8 53.61% 0.00% 0.00% 0.00% 10.09% -10.09% -2.62%<br />
Property 9 62.15% 19.84% 7.40% 27.25% 10.09% 17.16% 231.76%<br />
Property 10 91.20% 0.00% 0.00% 0.00% 10.09% -10.09% -210.27%<br />
Property 11 82.45% 0.00% 2.79% 2.79% 10.09% -7.30% -263.96%<br />
Property 12 55.67% 19.37% 4.45% 23.82% 10.09% 13.73% 308.83%<br />
Property 13 76.19% 2.91% 3.25% 6.15% 10.09% -3.94% -121.12%<br />
Property 15 0.00% 0.00% 0.00% 0.00% 10.09% -10.09% 0.00%<br />
Property 16 0.00% 0.00% 0.00% 0.00% 10.09% -10.09% 0.00%<br />
Property 17 69.62% 0.00% 5.25% 5.25% 10.09% -4.84% -145.83%<br />
Property 18 92.56% 0.00% 2.23% 2.23% 10.09% -7.86% -352.68%<br />
Property 19 65.97% 10.44% 4.41% 14.85% 10.09% 4.76% 424.63%<br />
Property 20 87.16% 0.00% 9.37% 9.37% 10.09% -0.72% -13.83%<br />
Property 21 77.72% 0.00% 0.00% 0.00% 10.09% -10.09% -108.73%<br />
Property 22 91.02% 0.00% 0.00% 0.00% 10.09% -10.09% -96.24%<br />
Property 23 99.40% 0.00% 0.00% 0.00% 10.09% -10.09% -84.92%<br />
Property 24 20.48% 361.95% 0.00% 361.95% 10.09% 351.86% 544.68%<br />
Property 25 100.00% 0.00% 0.00% 0.00% 10.09% -10.09% -77.77%<br />
Property 26 66.67% 0.00% 3.21% 3.21% 10.09% -6.89% -261.33%<br />
Property 27 0.00% 0.00% 0.00% 0.00% 10.09% -10.09% 0.00%<br />
Property 28 100.00% 0.00% 0.00% 0.00% 10.09% -10.09% -13.10%<br />
Pound Road 0.00% 0.00% 0.00% 0.00% 10.09% -10.09% 0.00%<br />
Soldiers Road 0.00% 0.00% 0.00% 0.00% 10.09% -10.09% 0.00%<br />
Total 70.59% 6.57% 3.52% 10.09% 10.09% 0.00% 0.00%<br />
Total Passive & Active<br />
Open Space %<br />
Open Space <strong>Development</strong><br />
Target %<br />
Difference<br />
Equivalent Land Area<br />
(Hectares)<br />
CLYDE NORTH PSP DEVELOPMENT CONTRIBUTIONS PLAN<br />
Table 3: Overall Housing Yields Summary<br />
Density Target Area Ha<br />
Net Developable Area 432.213<br />
Total No.<br />
Dwellings<br />
Net Residential Area 426.344 6,610<br />
Conventional Residential Density (Min. Av.<br />
of 15 lots for NRHa)<br />
Medium Density Housing (Min. Av. 20<br />
dwellings per NRHa)<br />
High Density/Specialised Housing (Min.<br />
Av. 30 dwellings per NRHa)<br />
Table 4: Overall Housing Yields in Detail<br />
Description Area 1<br />
Retail / Emp & Other Ha<br />
Activity Centre (retail / office / mixed use) 5.115<br />
Other Employment 0.755<br />
Subtotal 5.870<br />
% of Total Net<br />
Residential Area<br />
% of Total Lots<br />
Av. Lot Size<br />
(sqm)<br />
386.366 5,795 90.62% 87.68% 500<br />
38.466 769 9.02% 11.64% 375<br />
1.512 45 0.35% 0.69% 251<br />
Residential NRA (Ha) Dwell / NRHa Dwellings<br />
Residential - Conventional Density<br />
Residential<br />
386.366 15 5,795<br />
Residential - Medium Density 38.466 20 769<br />
Residential - High Density 1.512 30 45<br />
Subtotal Against Net Residential Area (NRA) 426.344 15.5 6,610<br />
Combined Res/ Retail / Emp / Other NDA (Ha) Dwell / NDHa Dwellings<br />
Totals Residential Yield Against NDA 432.213 15.3 6,610<br />
23<br />
Part 2 – Calculation of <strong>Contributions</strong> 23