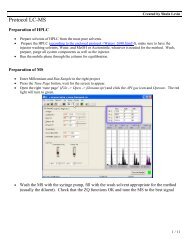
Processing Chromatograms
Processing Chromatograms
Processing Chromatograms

Create successful ePaper yourself
Turn your PDF publications into a flip-book with our unique Google optimized e-Paper software.
Chromatogram<br />
<strong>Processing</strong> <strong>Chromatograms</strong><br />
Page 130<br />
Three processes are available for use on chromatograms; polynomial background<br />
subtraction, smoothing, and integration. Background subtraction and smoothing<br />
help you improve the presentation of the data. Integration locates peaks, positions<br />
baselines, and calculates peak statistics for quantitative work.<br />
<strong>Processing</strong> multiple chromatograms<br />
Subtract<br />
The background subtract, smooth and integrate processes can be performed<br />
automatically on all the chromatograms within the current window. To enable this<br />
operation press the Toolbar button or select Process All Traces from the<br />
Chromatogram Process menu, the menu item will have a tick next to it. To turn<br />
off multiple processing reselect the Toolbar button or menu item.<br />
You can choose if you wish to add the processed trace to the current window or if<br />
you want to replace the current trace with the processed trace. Pressing this<br />
button once causes each subsequent chromatogram or chromatogram process to<br />
replace the currently selected trace. Pressing the button a second time causes each<br />
subsequent chromatogram or chromatogram process to be added to the traces on<br />
display. Note the button is grayed out when the button is depressed.<br />
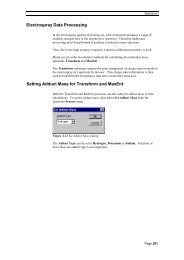
The purpose of Background Subtract<br />
Background Subtract fits a smooth curve through the noise in the chromatogram,<br />
then subtracts this curve from the chromatogram, leaving the peaks on a flat<br />
baseline.<br />
Figure 3.12 Background Subtract dialog<br />
The Polynomial order control allows you to specify the degrees of freedom<br />
allowed to the fitted curve. With polynomial order set to 0, a horizontal straight<br />
line is fitted. With polynomial order set to 1, a sloping straight line is fitted. The<br />
further the background is from a straight line, the higher you must set the<br />
polynomial order control. But too high a value will cause the fitted curve to begin<br />
to follow the peak shapes. Normal operating range for this parameter is 3rd to 20th<br />
order.
Chromatogram<br />
The Below curve parameter allows you to move the background curve up and<br />
down in the noise. The curve fit is constrained to place the specified percentage of<br />
data points beneath the fitted background curve. Normal operating range for this<br />
parameter is 5% - 30%, depending on the abundance and width of peaks in the<br />
chromatogram. For fewer, or narrower peaks, increase the value.<br />
The Tolerance parameter affects the precision to which the internal arithmetic is<br />
performed. It should not normally be altered from its default value of 0.01.<br />
When the Flatten Edges parameter is selected MassLynx checks that the<br />
polynomial applied is flat or horizontal at the beginning and end of the trace.<br />
The parameters shown in Figure 3.12 produced the background subtracted<br />
chromatogram illustrated in Figure 3.14 .<br />
Figure 3.13 Unprocessed Total Ion Chromatogram<br />
Figure 3.14 Background Subtracted Chromatogram. Parameters as shown in<br />
Figure 3.12<br />
Page 131
Chromatogram<br />
Page 132<br />
Checking the results of Background Subtract<br />
You can check the operation of the background subtraction process with a given set<br />
of parameters by selecting the Make graph of fitted polynomial check box. This<br />
causes the same calculation to take place, but rather than displaying a<br />
chromatogram with the background curve subtracted, the curve itself is displayed.<br />
By choosing Overlay graphs and Link vertical axes from the Chromatogram<br />
Display View dialog, a display like Figure 3.15 can be produced, enabling the fit of<br />
the baseline to the noise to be examined. The parameters shown in Figure 3.12<br />
were used.<br />
Figure 3.15 Checking the operation of Background Subtract<br />
To subtract the background from a chromatogram<br />
1. Choose Subtract from the Chromatogram Process menu.<br />
2. Set the polynomial order parameter as described above.<br />
3. Set the below curve parameter as described above.<br />
4. Press the OK button.<br />
The Subtract status dialog box indicates the progress of the subtract algorithm.<br />
After every iteration, the convergence value in the dialog box is updated. The<br />
algorithm terminates when convergence is less than tolerance.<br />
With higher order polynomials, background subtract will sometimes have difficulty<br />
converging on a solution. There is a pre-set upper limit of 300 iterations. If<br />
background subtract does not seem to be making progress, you can press the<br />
Cancel button in the status box, and try again with a lower-order polynomial.
Smoothing <strong>Chromatograms</strong><br />
Chromatogram<br />
Smoothing improves presentation and aids interpretation of a chromatogram by<br />
increasing the apparent signal-to-noise ratio.<br />
Two types of smoothing are available for chromatograms: Moving Mean and<br />
Savitzky Golay. Both methods slide a window along the chromatogram,<br />
averaging the data points in the window to produce a point in the smoothed<br />
chromatogram. Moving Mean takes the arithmetical mean of the intensities of the<br />
data points in the window. Savitzky Golay takes an average of the intensities<br />
weighted by a quadratic curve. This tends to enhance peak and valley shapes, as<br />
well as preserving the height of the peaks better than the Moving Mean. However,<br />
Savitzky Golay does tend to produce small artifacts on either side of the real peaks.<br />
Figure 3.16 Chromatogram Smooth Parameters dialog<br />
To smooth a chromatogram<br />
1. Choose Smooth from the Chromatogram Process menu.<br />
2. Set the Window size parameter. The number you specify is the half-width of<br />
the smoothing window in scans. This parameter can be set automatically by<br />
clicking the right mouse button, and dragging across a chromatogram peak at<br />
half height (Figure 3.18).<br />
Figure 3.17 Setting the Window size parameter<br />
Page 133
Chromatogram<br />
Page 134<br />
3. Select a smoothing method.<br />
4. You may wish to alter the number of times the smooth is repeated, by<br />
changing the Number of smooths parameter from its default value of two.<br />
Increasing this parameter gives a heavier smooth.<br />
5. Press the OK button.<br />
Figure 3.18 Results of chromatogram smoothing
Integrating <strong>Chromatograms</strong><br />
Chromatogram<br />
The integration process locates the peaks in a chromatogram, draws baselines and<br />
calculates peak heights and areas for quantification.<br />
You can integrate a chromatogram with the current parameters by clicking on the<br />
button in the Toolbar. You can use the Integrate dialog to change the<br />
parameters. Note: The integration process operates only on the currently<br />
displayed range and not on the whole chromatogram.<br />
Figure 3.19 Integrate chromatogram dialog<br />
The Copy button allows you to copy the current integration parameters to the<br />
Clipboard. These parameters can then be pasted into another application such as<br />
the Quantify Method Editor.<br />
The Paste button allows you to paste a set of integration parameters from the<br />
Clipboard.<br />
The Integrate chromatogram dialog requires the user to enter the Peak-to-peak<br />
noise amplitude. This value is used by the integration software to prefilter the<br />
chromatogram. A suitable value can be measured directly from the chromatogram<br />
by clicking the right mouse button, and dragging the mouse across a section of<br />
noise in the chromatogram. The sensitivity of the integration algorithm can be<br />
fine-tuned by manually adjusting this value.<br />
Page 135
Chromatogram<br />
Page 136<br />
Figure 3.20 Setting the peak-to-peak noise amplitude<br />
You may choose to smooth the chromatogram before integrating by selecting the<br />
Enable smoothing check box. The parameters for the smooth may be examined<br />
and altered by pressing the Smooth.. button. For more information, see<br />
"Smoothing <strong>Chromatograms</strong>" on page 133.<br />
Check the ApexTrack Peak Integration box to use an alternative peak detection<br />
algorithm.<br />
Small peaks may optionally be removed by setting one of the four available<br />
threshold parameters. Press the Threshold.. button to examine or modify these<br />
parameters.<br />
Figure 3.21 The Response Threshold dialog<br />
Relative height Check this box to remove peaks whose height is less than the<br />
specified percentage of the highest peak.<br />
Absolute height Check this box to remove peaks whose height is less than the<br />
specified value.<br />
Relative area Check this box to remove peaks whose area is less than the<br />
specified percentage of the largest peak area.<br />
Absolute area Check this box to remove peaks whose area is less than the<br />
specified value.
Chromatogram<br />
You may examine and modify the parameters controlling the positioning of<br />
baselines and separation of partially resolved peaks by verticals (droplines) by<br />
pressing the Peak detect... button.<br />
Figure 3.22 The Chromatogram Peak Detect dialog<br />
Page 137
Chromatogram<br />
Page 138<br />
The join valleys parameter affects how baselines for partially resolved peaks are<br />
drawn. The larger the value of this parameter, the more peak baselines will be<br />
drawn up to the valleys between unresolved peaks. The default value for this<br />
parameter is 30%, and normal operating range is 5%–75%.<br />
Figure 3.23 Join valleys parameter set to 60%<br />
Figure 3.24 Join valleys parameter set to 15%
Chromatogram<br />
The reduce peak tailing and raise baseline parameters allow control over the<br />
positioning of baseline end points. In the example below, the pronounced tail on<br />
the peak at 5.42 mins is reduced by decreasing the value of the reduce peak tailing<br />
parameter from 150% to 50%. The default value for this parameter is 50%, and<br />
normal operating range is between 25% and 300%.<br />
Figure 3.25 Reduce peak tailing parameter set to 150%<br />
Figure 3.26 Reduce peak tailing parameter set to 50%<br />
Page 139
Chromatogram<br />
Page 140<br />
The raise baseline parameter prevents the baseline end point being moved too high<br />
up the peak. To prevent the baseline endpoints moving up the peaks, reduce the<br />
value of this parameter. The default value is 5%, and normal operating range is<br />
5% - 20%. This parameter is only relevant when the reduce peak tailing<br />
parameter has a small value ( less than 50% ). In the example below, the reduce<br />
peak tailing parameter has been set to 25%.<br />
Figure 3.27 Raise baseline parameter set to 50%<br />
Figure 3.28 Raise baseline parameter set to 5%
Chromatogram<br />
The draw vertical parameter determines how well resolved peaks must be before<br />
they are separated by a dropline (or baselines are drawn up into the valleys,<br />
depending on the value of the join valleys parameter). If you wish poorly resolved<br />
peaks to be separated, increase the value of this parameter. The default value is<br />
90%, and normal operating range is 50%–100%.<br />
Figure 3.29 Draw verticals parameter set to 50%.<br />
Figure 3.30 Draw verticals parameter set to 95%.<br />
You can optionally attempt to detect completely unresolved peaks, or shoulders, by<br />
selecting the detect shoulder peaks check box. The algorithm will detect a<br />
shoulder if the slope of the shoulder top is less than the specified percentage of the<br />
steepest slope on the peak. Therefore, to make shoulder detection more sensitive,<br />
increase the value of this parameter. The default value is 30%, and normal<br />
operating range is 20%–90%.<br />
Page 141
Chromatogram<br />
Page 142<br />
To integrate a chromatogram<br />
1. Display the chromatogram range you wish to integrate over.<br />
2. Choose Integrate from the Chromatogram Process menu.<br />
3. Enter a value for Noise amplitude. To calculate this value, display a section<br />
of the chromatogram that contains only background. Click at one end of this<br />
section with the right mouse button, drag the mouse pointer to the other end<br />
and release it. The integration software will calculate the Noise amplitude<br />
and update the value shown in the control.<br />
4. Optionally, select the Enable smoothing check box, and examine or modify<br />
the smoothing parameters by pressing the Smooth... button.<br />
5. Optionally, set up one or more thresholds to remove small peaks by pressing<br />
the Threshold button to bring up the Response Threshold dialog.<br />
6. Press OK to exit the dialog and perform the integration. The integration<br />
software will smooth the chromatogram trace if requested, locate the peaks,<br />
draw baselines and calculate peak statistics.
Editing Detected Peaks<br />
Chromatogram<br />
You can use the Edit Integrated Peaks dialog box to alter the results of integration<br />
by changing the position of an individual baseline, adding a single peak, or<br />
deleting one or all peaks.<br />
To display information about an integrated peak<br />
A single click with the left mouse button on a peak will display the peak top<br />
position, peak height and peak area in the status bar at the bottom of the<br />
chromatogram window.<br />
Peak Annotation can be displayed using any combination of peak top time, peak top<br />
scan, peak response height and peak response area by choosing Peak Annotation<br />
from the Chromatogram Display menu.<br />
Figure 3.31 Edit Integrated Peaks dialog<br />
To edit a peak baseline<br />
1. Choose Integrated Peaks from the Chromatogram Edit menu<br />
2. Select the peak whose baseline you wish to edit by clicking the right mouse<br />
button on a peak in the chromatogram, or by selecting from the Peak Tops<br />
list box with the left mouse button.<br />
3. Alter the Start or End point by typing in new values with the keyboard, or<br />
select a range with the right mouse button, and press the Modify button.<br />
You can also alter the range by clicking on one of the end markers (boxes)<br />
with the left mouse button and dragging it to the required position.<br />
4. The figures in the Peak Information group will update to reflect the edited<br />
baseline.<br />
To add a new peak<br />
1. Choose Integrated Peaks from the Chromatogram Edit menu<br />
2. Type the start and end points of the new peak’s baseline into the Start and<br />
End controls or select a range with the right mouse button.<br />
3. Press the Add button<br />
4. The figures in the Peak Information group will update to reflect the new<br />
peak.<br />
Page 143
Chromatogram<br />
Page 144<br />
To delete a single peak<br />
1. Choose Integrated Peaks from the Chromatogram Edit menu<br />
2. Select the peak you wish to delete by clicking the right mouse button on a<br />
peak in the chromatogram, or by selecting from the peak tops list box with<br />
the left mouse button.<br />
3. Press the Delete button.<br />
To delete all the peaks<br />
1. Choose Integrated Peaks from the Chromatogram Edit menu<br />
2. Press the Clear All button.<br />
When you are happy with your changes to the integrated peaks, press the OK<br />
button in the Edit Integrated Peaks dialog. Pressing the Cancel button aborts the<br />
edit and discards your changes.