manual for social impact assessment of land-based ... - Forest Trends
manual for social impact assessment of land-based ... - Forest Trends manual for social impact assessment of land-based ... - Forest Trends
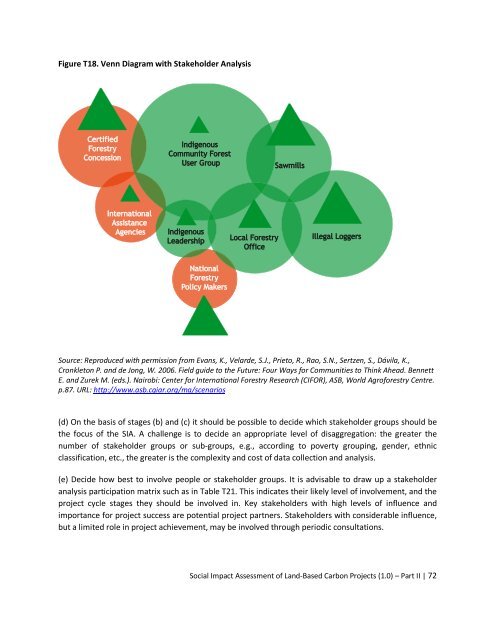
Box T5: Use of Venn Diagrams for Stakeholder Analysis Participants should firstly cut three sizes of circles – at least two sets of circles using different colored cards. One color is for ‘insider stakeholders’ and another is for ‘outsider stakeholders.’ For each ‘outsider stakeholder’, the participants need to decide how important the involvement of each stakeholder or stakeholder group is, or should be, in the project, and select the corresponding size of circle: • Little importance = smallest circle • Some or significant importance = middle sized circle • Very important = largest circle The name of the ‘insider’ stakeholder or stakeholder groups can then be written on the appropriate sized circles/cards. This should be repeated for all the ‘insider’ stakeholders using the other colored card. When all the stakeholders have been represented, the circles should be organized and stuck to a flipchart, grouping and placing the circles according to the relationships between the stakeholders: the closer is the relationship between two stakeholders, the closer should be the circles on the flipchart. The next stage is to cut three sizes of triangles from different colored cards. For each stakeholder (group), a small, medium or large triangle should be chosen to represent the degree of influence that the stakeholder has on the project. The triangle should then be stuck on the edge of the stakeholder circle. A stakeholder with a small ‘importance circle’ could have a large ‘influence triangle’ and vice versa. The overlap of the circles represents the extent of the relationship between stakeholders (see Figure 18). Once the diagram is complete, it should be reviewed by the wider group, which should continue to discuss the relative importance and influence of each stakeholder or stakeholder group until a consensus is reached. (See also Figure 18). Source: Evans, Velarde et al., 2006. Social Impact Assessment of Land-Based Carbon Projects (1.0) – Part II | 71
Figure T18. Venn Diagram with Stakeholder Analysis Source: Reproduced with permission from Evans, K., Velarde, S.J., Prieto, R., Rao, S.N., Sertzen, S., Dávila, K., Cronkleton P. and de Jong, W. 2006. Field guide to the Future: Four Ways for Communities to Think Ahead. Bennett E. and Zurek M. (eds.). Nairobi: Center for International Forestry Research (CIFOR), ASB, World Agroforestry Centre. p.87. URL: http://www.asb.cgiar.org/ma/scenarios (d) On the basis of stages (b) and (c) it should be possible to decide which stakeholder groups should be the focus of the SIA. A challenge is to decide an appropriate level of disaggregation: the greater the number of stakeholder groups or sub-groups, e.g., according to poverty grouping, gender, ethnic classification, etc., the greater is the complexity and cost of data collection and analysis. (e) Decide how best to involve people or stakeholder groups. It is advisable to draw up a stakeholder analysis participation matrix such as in Table T21. This indicates their likely level of involvement, and the project cycle stages they should be involved in. Key stakeholders with high levels of influence and importance for project success are potential project partners. Stakeholders with considerable influence, but a limited role in project achievement, may be involved through periodic consultations. Social Impact Assessment of Land-Based Carbon Projects (1.0) – Part II | 72
- Page 29 and 30: Table T4: The PIPA Outcomes Logic M
- Page 31 and 32: Main Sources and Further Guidance h
- Page 33 and 34: T3 Sustainability Framework Approac
- Page 35 and 36: Figure T12: SAPA Initiative Modifie
- Page 37 and 38: 1. Identify a small group of key in
- Page 39 and 40: Table T6: Example of LOAM Livelihoo
- Page 41 and 42: T4 Matching Methods T4.1 Introducti
- Page 43 and 44: Advantages and Disadvantages of ‘
- Page 45 and 46: Box T1. General Data Collection and
- Page 47 and 48: Box T3. Data Collection Methods Pro
- Page 49 and 50: T6 Specific Data Collection Methods
- Page 51 and 52: Table T8: Example of a Household BN
- Page 53 and 54: The poverty index can range from 0%
- Page 55 and 56: The PIA guide proposes the followin
- Page 57 and 58: day. The ‘before project’ score
- Page 59 and 60: Figure T15: “Before and After”
- Page 61 and 62: Table T10: Pair-Wise Ranking Showin
- Page 63 and 64: Impact calendars Impact calendars c
- Page 65 and 66: A large sample is needed to be conf
- Page 67 and 68: Table T15: Scoring of Changes in Ag
- Page 69 and 70: Table T17: QPA Scoring of Social Eq
- Page 71 and 72: T6.4 Participatory Economic Valuati
- Page 73 and 74: Advantages and Disadvantages of Par
- Page 75 and 76: The stories are collected from thos
- Page 77 and 78: Main Sources and Further Guidance D
- Page 79: Table T19: Stakeholder Analysis Pro
- Page 83 and 84: T7.2 Problem Trees Assuming it is p
- Page 85 and 86: T7.3 Scenario Analysis Scenarios ar
- Page 87 and 88: Box T7. Driving Forces in a Communi
- Page 89 and 90: Maack, J.N. 2001. Scenario analysis
- Page 91 and 92: In terms of non-monetary benefits,
- Page 93 and 94: and duration of employment, the sta
- Page 95 and 96: Physical Capital Positive changes i
- Page 97 and 98: these strategic resource off-limits
- Page 99 and 100: einforce existing institutions or n
- Page 101 and 102: PROJECT: PROFAFOR TYPE: Plantations
- Page 103 and 104: their occurrence will depend in lar
- Page 105 and 106: HUMAN CAPITAL Increase in perceptio
- Page 107 and 108: Table T26: Potential Mid- to Long-T
- Page 109 and 110: Figure T20: Example of Relationship
- Page 111 and 112: Figure T22: Additional Potential So
- Page 113 and 114: T9 Further Guidance on Indicator Se
- Page 115 and 116: Box T9. Goals and Indicators Defini
- Page 117 and 118: When selecting indicators, it is be
- Page 119 and 120: Table T27: Indicator Quality Assess
- Page 121 and 122: Box T10. Indicators Derived from th
- Page 123 and 124: T9.5 Disaggregating Indicators Mult
- Page 125 and 126: Mayoux, L. 2001. What Do We Want to
- Page 127 and 128: Landscape Outcomes Assessment Metho
- Page 129 and 130: • Access to essential services (w
Figure T18. Venn Diagram with Stakeholder Analysis<br />
Source: Reproduced with permission from Evans, K., Velarde, S.J., Prieto, R., Rao, S.N., Sertzen, S., Dávila, K.,<br />
Cronkleton P. and de Jong, W. 2006. Field guide to the Future: Four Ways <strong>for</strong> Communities to Think Ahead. Bennett<br />
E. and Zurek M. (eds.). Nairobi: Center <strong>for</strong> International <strong>Forest</strong>ry Research (CIFOR), ASB, World Agro<strong>for</strong>estry Centre.<br />
p.87. URL: http://www.asb.cgiar.org/ma/scenarios<br />
(d) On the basis <strong>of</strong> stages (b) and (c) it should be possible to decide which stakeholder groups should be<br />
the focus <strong>of</strong> the SIA. A challenge is to decide an appropriate level <strong>of</strong> disaggregation: the greater the<br />
number <strong>of</strong> stakeholder groups or sub-groups, e.g., according to poverty grouping, gender, ethnic<br />
classification, etc., the greater is the complexity and cost <strong>of</strong> data collection and analysis.<br />
(e) Decide how best to involve people or stakeholder groups. It is advisable to draw up a stakeholder<br />
analysis participation matrix such as in Table T21. This indicates their likely level <strong>of</strong> involvement, and the<br />
project cycle stages they should be involved in. Key stakeholders with high levels <strong>of</strong> influence and<br />
importance <strong>for</strong> project success are potential project partners. Stakeholders with considerable influence,<br />
but a limited role in project achievement, may be involved through periodic consultations.<br />
Social Impact Assessment <strong>of</strong> Land-Based Carbon Projects (1.0) – Part II | 72


