manual for social impact assessment of land-based ... - Forest Trends
manual for social impact assessment of land-based ... - Forest Trends manual for social impact assessment of land-based ... - Forest Trends
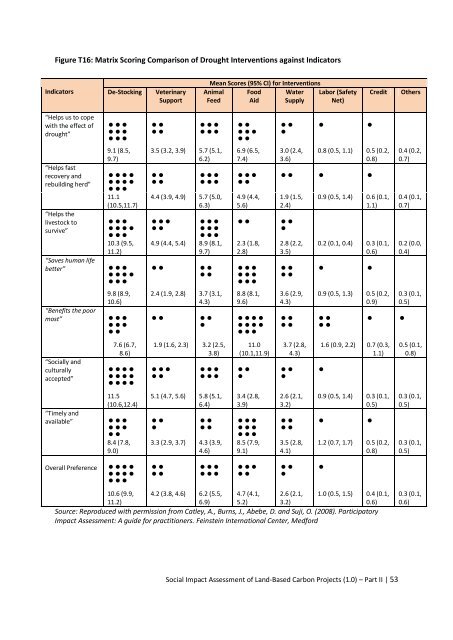
Figure T16: Matrix Scoring Comparison of Drought Interventions against Indicators Indicators “Helps us to cope with the effect of drought” “Helps fast recovery and rebuilding herd” “Helps the livestock to survive” “Saves human life better” “Benefits the poor most” “Socially and culturally accepted” “Timely and available” Overall Preference De-Stocking Veterinary Support 9.1 (8.5, 9.7) 11.1 (10.5,11.7) 10.3 (9.5, 11.2) 9.8 (8.9, 10.6) 7.6 (6.7, 8.6) 11.5 (10.6,12.4) 8.4 (7.8, 9.0) Mean Scores (95% CI) for Interventions Animal Feed 3.5 (3.2, 3.9) 5.7 (5.1, 6.2) 4.4 (3.9, 4.9) 5.7 (5.0, 6.3) 4.9 (4.4, 5.4) 8.9 (8.1, 9.7) 2.4 (1.9, 2.8) 3.7 (3.1, 4.3) 1.9 (1.6, 2.3) 3.2 (2.5, 3.8) 5.1 (4.7, 5.6) 5.8 (5.1, 6.4) 3.3 (2.9, 3.7) 4.3 (3.9, 4.6) Food Aid 6.9 (6.5, 7.4) 4.9 (4.4, 5.6) 2.3 (1.8, 2.8) 8.8 (8.1, 9.6) 11.0 (10.1,11.9) 3.4 (2.8, 3.9) 8.5 (7.9, 9.1) Water Supply 3.0 (2.4, 3.6) 1.9 (1.5, 2.4) 2.8 (2.2, 3.5) 3.6 (2.9, 4.3) 3.7 (2.8, 4.3) 2.6 (2.1, 3.2) 3.5 (2.8, 4.1) Labor (Safety Net) Credit Others Social Impact Assessment of Land-Based Carbon Projects (1.0) – Part II | 53 0.8 (0.5, 1.1) 0.5 (0.2, 0.8) 0.9 (0.5, 1.4) 0.6 (0.1, 1.1) 0.2 (0.1, 0.4) 0.3 (0.1, 0.6) 0.9 (0.5, 1.3) 0.5 (0.2, 0.9) 1.6 (0.9, 2.2) 0.7 (0.3, 1.1) 0.9 (0.5, 1.4) 0.3 (0.1, 0.5) 1.2 (0.7, 1.7) 0.5 (0.2, 0.8) 10.6 (9.9, 4.2 (3.8, 4.6) 6.2 (5.5, 4.7 (4.1, 2.6 (2.1, 1.0 (0.5, 1.5) 0.4 (0.1, 11.2) 6.9) 5.2) 3.2) 0.6) Source: Reproduced with permission from Catley, A., Burns, J., Abebe, D. and Suji, O. (2008). Participatory Impact Assessment: A guide for practitioners. Feinstein International Center, Medford 0.4 (0.2, 0.7) 0.4 (0.1, 0.7) 0.2 (0.0, 0.4) 0.3 (0.1, 0.5) 0.5 (0.1, 0.8) 0.3 (0.1, 0.5) 0.3 (0.1, 0.5) 0.3 (0.1, 0.6)
Impact calendars Impact calendars can be useful for measuring impacts against ‘dimensional’ indicators such as time and distance. Catley et al (2008) describe how an impact calendar was used to analyze the number of months of household food security ‘before’ and ‘after’ a project. Project participants were given 25 counters representing a household’s post-harvest food balance. Using 12 cards, one for each month of the year, participants were asked to distribute the counters along a 12 month calendar to show the monthly household utilization of the harvested maize, as shown in Table T12. Table T12: Food Security Impact Calendar Using 25 Counters April May June July Aug Sept Oct Nov Dec Jan Feb Mar 2004-2005 •••••• ••••• •••• •• • •••••• • 2006-2007 •••••• •••• •••• ••• ••• •• actual ••• 2006-2007 •••••• ••••• •••• (Control) •••••• •• •• Source: Reproduced with permission from Catley, A., Burns, J., Abebe, D. and Suji, O. (2008). Participatory Impact Assessment: A guide for practitioners. Feinstein International Center, Medford This exercise was done three times: firstly with the project participants for the agricultural year before the project started; secondly with the same people for the agricultural year after the project had started; and thirdly with a control group - community members who had not participated in the project – for the year after the project started. The three sets of time series data were then graphed as shown in Figure T17. FigureT17: Changes in Number of Months of Food Security 15 10 5 0 Duration of Household Food Security (n = 1) Apr May Jun Jul Aug Sept Oct Nov Dec Jan Feb Mar 2004-2005 2006/07 Project Participants 2006/07 Non-Participants Source: Reproduced with permission from Catley, A., Burns, J., Abebe, D. and Suji, O. (2008). Participatory Impact Assessment: A guide for practitioners. Feinstein International Center, Medford. Social Impact Assessment of Land-Based Carbon Projects (1.0) – Part II | 54
- Page 11 and 12: Sections T5 and T6 present a range
- Page 13 and 14: Figure T1: The Main Stages and Step
- Page 15 and 16: Figure T2: Example of a Conceptual
- Page 17 and 18: Figure T4: Generic Conceptual Model
- Page 19 and 20: Stages 3-5 of Open Standards The re
- Page 21 and 22: Figure T7: Diagram of the ROtI Anal
- Page 23 and 24: table so they can be read, discusse
- Page 25 and 26: Table T1: Theory of Change for Seyc
- Page 27 and 28: T2.4 Participatory Impact Pathways
- Page 29 and 30: Table T4: The PIPA Outcomes Logic M
- Page 31 and 32: Main Sources and Further Guidance h
- Page 33 and 34: T3 Sustainability Framework Approac
- Page 35 and 36: Figure T12: SAPA Initiative Modifie
- Page 37 and 38: 1. Identify a small group of key in
- Page 39 and 40: Table T6: Example of LOAM Livelihoo
- Page 41 and 42: T4 Matching Methods T4.1 Introducti
- Page 43 and 44: Advantages and Disadvantages of ‘
- Page 45 and 46: Box T1. General Data Collection and
- Page 47 and 48: Box T3. Data Collection Methods Pro
- Page 49 and 50: T6 Specific Data Collection Methods
- Page 51 and 52: Table T8: Example of a Household BN
- Page 53 and 54: The poverty index can range from 0%
- Page 55 and 56: The PIA guide proposes the followin
- Page 57 and 58: day. The ‘before project’ score
- Page 59 and 60: Figure T15: “Before and After”
- Page 61: Table T10: Pair-Wise Ranking Showin
- Page 65 and 66: A large sample is needed to be conf
- Page 67 and 68: Table T15: Scoring of Changes in Ag
- Page 69 and 70: Table T17: QPA Scoring of Social Eq
- Page 71 and 72: T6.4 Participatory Economic Valuati
- Page 73 and 74: Advantages and Disadvantages of Par
- Page 75 and 76: The stories are collected from thos
- Page 77 and 78: Main Sources and Further Guidance D
- Page 79 and 80: Table T19: Stakeholder Analysis Pro
- Page 81 and 82: Figure T18. Venn Diagram with Stake
- Page 83 and 84: T7.2 Problem Trees Assuming it is p
- Page 85 and 86: T7.3 Scenario Analysis Scenarios ar
- Page 87 and 88: Box T7. Driving Forces in a Communi
- Page 89 and 90: Maack, J.N. 2001. Scenario analysis
- Page 91 and 92: In terms of non-monetary benefits,
- Page 93 and 94: and duration of employment, the sta
- Page 95 and 96: Physical Capital Positive changes i
- Page 97 and 98: these strategic resource off-limits
- Page 99 and 100: einforce existing institutions or n
- Page 101 and 102: PROJECT: PROFAFOR TYPE: Plantations
- Page 103 and 104: their occurrence will depend in lar
- Page 105 and 106: HUMAN CAPITAL Increase in perceptio
- Page 107 and 108: Table T26: Potential Mid- to Long-T
- Page 109 and 110: Figure T20: Example of Relationship
- Page 111 and 112: Figure T22: Additional Potential So
Figure T16: Matrix Scoring Comparison <strong>of</strong> Drought Interventions against Indicators<br />
Indicators<br />
“Helps us to cope<br />
with the effect <strong>of</strong><br />
drought”<br />
“Helps fast<br />
recovery and<br />
rebuilding herd”<br />
“Helps the<br />
livestock to<br />
survive”<br />
“Saves human life<br />
better”<br />
“Benefits the poor<br />
most”<br />
“Socially and<br />
culturally<br />
accepted”<br />
“Timely and<br />
available”<br />
Overall Preference<br />
De-Stocking Veterinary<br />
Support<br />
<br />
<br />
<br />
9.1 (8.5,<br />
9.7)<br />
<br />
<br />
<br />
11.1<br />
(10.5,11.7)<br />
<br />
<br />
<br />
10.3 (9.5,<br />
11.2)<br />
<br />
<br />
<br />
9.8 (8.9,<br />
10.6)<br />
<br />
<br />
<br />
7.6 (6.7,<br />
8.6)<br />
<br />
<br />
<br />
11.5<br />
(10.6,12.4)<br />
<br />
<br />
<br />
8.4 (7.8,<br />
9.0)<br />
<br />
<br />
<br />
<br />
<br />
Mean Scores (95% CI) <strong>for</strong> Interventions<br />
Animal<br />
Feed<br />
<br />
<br />
3.5 (3.2, 3.9) 5.7 (5.1,<br />
6.2)<br />
<br />
<br />
<br />
<br />
4.4 (3.9, 4.9) 5.7 (5.0,<br />
6.3)<br />
<br />
<br />
<br />
<br />
<br />
4.9 (4.4, 5.4) 8.9 (8.1,<br />
9.7)<br />
<br />
<br />
<br />
2.4 (1.9, 2.8) 3.7 (3.1,<br />
4.3)<br />
<br />
<br />
<br />
1.9 (1.6, 2.3) 3.2 (2.5,<br />
3.8)<br />
<br />
<br />
<br />
<br />
5.1 (4.7, 5.6) 5.8 (5.1,<br />
6.4)<br />
<br />
<br />
<br />
<br />
3.3 (2.9, 3.7) 4.3 (3.9,<br />
4.6)<br />
<br />
<br />
<br />
<br />
Food<br />
Aid<br />
<br />
<br />
<br />
6.9 (6.5,<br />
7.4)<br />
<br />
<br />
4.9 (4.4,<br />
5.6)<br />
<br />
2.3 (1.8,<br />
2.8)<br />
<br />
<br />
<br />
8.8 (8.1,<br />
9.6)<br />
<br />
<br />
<br />
11.0<br />
(10.1,11.9)<br />
<br />
<br />
3.4 (2.8,<br />
3.9)<br />
<br />
<br />
<br />
8.5 (7.9,<br />
9.1)<br />
<br />
<br />
Water<br />
Supply<br />
<br />
<br />
3.0 (2.4,<br />
3.6)<br />
<br />
1.9 (1.5,<br />
2.4)<br />
<br />
<br />
2.8 (2.2,<br />
3.5)<br />
<br />
<br />
3.6 (2.9,<br />
4.3)<br />
<br />
<br />
3.7 (2.8,<br />
4.3)<br />
<br />
<br />
2.6 (2.1,<br />
3.2)<br />
<br />
<br />
3.5 (2.8,<br />
4.1)<br />
<br />
<br />
Labor (Safety<br />
Net)<br />
Credit Others<br />
Social Impact Assessment <strong>of</strong> Land-Based Carbon Projects (1.0) – Part II | 53<br />
<br />
<br />
0.8 (0.5, 1.1) 0.5 (0.2,<br />
0.8)<br />
<br />
<br />
0.9 (0.5, 1.4) 0.6 (0.1,<br />
1.1)<br />
0.2 (0.1, 0.4) 0.3 (0.1,<br />
0.6)<br />
<br />
<br />
0.9 (0.5, 1.3) 0.5 (0.2,<br />
0.9)<br />
<br />
<br />
<br />
1.6 (0.9, 2.2) 0.7 (0.3,<br />
1.1)<br />
<br />
0.9 (0.5, 1.4) 0.3 (0.1,<br />
0.5)<br />
<br />
<br />
1.2 (0.7, 1.7) 0.5 (0.2,<br />
0.8)<br />
10.6 (9.9, 4.2 (3.8, 4.6) 6.2 (5.5, 4.7 (4.1, 2.6 (2.1, 1.0 (0.5, 1.5) 0.4 (0.1,<br />
11.2)<br />
6.9) 5.2)<br />
3.2)<br />
0.6)<br />
Source: Reproduced with permission from Catley, A., Burns, J., Abebe, D. and Suji, O. (2008). Participatory<br />
Impact Assessment: A guide <strong>for</strong> practitioners. Feinstein International Center, Med<strong>for</strong>d<br />
<br />
0.4 (0.2,<br />
0.7)<br />
0.4 (0.1,<br />
0.7)<br />
0.2 (0.0,<br />
0.4)<br />
0.3 (0.1,<br />
0.5)<br />
<br />
0.5 (0.1,<br />
0.8)<br />
0.3 (0.1,<br />
0.5)<br />
0.3 (0.1,<br />
0.5)<br />
0.3 (0.1,<br />
0.6)


