manual for social impact assessment of land-based ... - Forest Trends
manual for social impact assessment of land-based ... - Forest Trends manual for social impact assessment of land-based ... - Forest Trends
Figure T9: Stages in Participatory Impact Pathways Analysis Identifying a linear logic linking project outputs to project goal Identifying the evolving network of actors needed to achieve the vision Integration of both views 2. Outputs What the project will produce 4. "Now" network map Necessary relationships in place to produce the OUTPUTS 1. Problem Tree Helps understand project rationale and what needs to change 6. Key changes 3. Vision Where project is going - Goal 7. Outcomes logic model 5. "Future" network map Necessary relationships to achieve the VISION The outcomes the project will help achieve, how, and with whom 8. Timeline, targets and milestones Link activities to outcomes and set targets and milestones. The basis of an evaluation plan Source: Reproduced with permission from Douthwaite, B., Alvarez, S., Thiele, G., Mackay, R., Cordoba, D. & Tehelen, K. 2008. Participatory Impact Pathways Analysis: a practical method for project planning and evaluation. Paper prepared for: ‘Rethinking Impact: Understanding the Complexity of Poverty and Change’ Workshop. www.prgaaprogram.org/riw/files/papers/PIPA-Impact-WS.doc Social Impact Assessment of Land-Based Carbon Projects (1.0) – Part II | 19
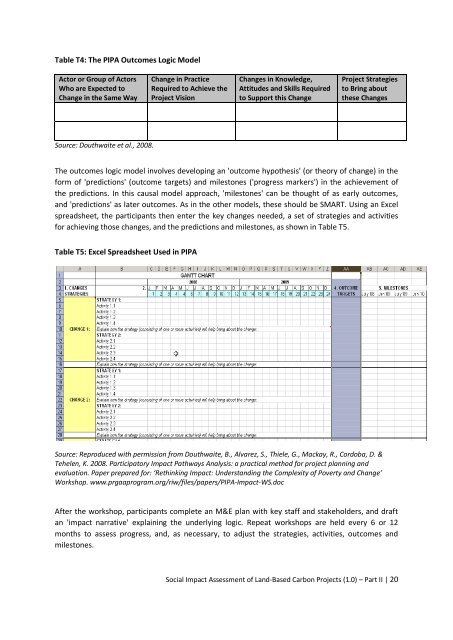
Table T4: The PIPA Outcomes Logic Model Actor or Group of Actors Who are Expected to Change in the Same Way Source: Douthwaite et al., 2008. Change in Practice Required to Achieve the Project Vision Changes in Knowledge, Attitudes and Skills Required to Support this Change Project Strategies to Bring about these Changes The outcomes logic model involves developing an 'outcome hypothesis' (or theory of change) in the form of 'predictions' (outcome targets) and milestones ('progress markers') in the achievement of the predictions. In this causal model approach, 'milestones' can be thought of as early outcomes, and 'predictions' as later outcomes. As in the other models, these should be SMART. Using an Excel spreadsheet, the participants then enter the key changes needed, a set of strategies and activities for achieving those changes, and the predictions and milestones, as shown in Table T5. Table T5: Excel Spreadsheet Used in PIPA Source: Reproduced with permission from Douthwaite, B., Alvarez, S., Thiele, G., Mackay, R., Cordoba, D. & Tehelen, K. 2008. Participatory Impact Pathways Analysis: a practical method for project planning and evaluation. Paper prepared for: ‘Rethinking Impact: Understanding the Complexity of Poverty and Change’ Workshop. www.prgaaprogram.org/riw/files/papers/PIPA-Impact-WS.doc After the workshop, participants complete an M&E plan with key staff and stakeholders, and draft an 'impact narrative' explaining the underlying logic. Repeat workshops are held every 6 or 12 months to assess progress, and, as necessary, to adjust the strategies, activities, outcomes and milestones. Social Impact Assessment of Land-Based Carbon Projects (1.0) – Part II | 20
- Page 1 and 2: MANUAL FOR SOCIAL IMPACT ASSESSMENT
- Page 3 and 4: Table of Contents T1 Introduction t
- Page 5 and 6: List of Boxes Box T1. General Data
- Page 7 and 8: Forest Trends’ mission is to main
- Page 9 and 10: List of Acronyms (Core Guidance and
- Page 11 and 12: Sections T5 and T6 present a range
- Page 13 and 14: Figure T1: The Main Stages and Step
- Page 15 and 16: Figure T2: Example of a Conceptual
- Page 17 and 18: Figure T4: Generic Conceptual Model
- Page 19 and 20: Stages 3-5 of Open Standards The re
- Page 21 and 22: Figure T7: Diagram of the ROtI Anal
- Page 23 and 24: table so they can be read, discusse
- Page 25 and 26: Table T1: Theory of Change for Seyc
- Page 27: T2.4 Participatory Impact Pathways
- Page 31 and 32: Main Sources and Further Guidance h
- Page 33 and 34: T3 Sustainability Framework Approac
- Page 35 and 36: Figure T12: SAPA Initiative Modifie
- Page 37 and 38: 1. Identify a small group of key in
- Page 39 and 40: Table T6: Example of LOAM Livelihoo
- Page 41 and 42: T4 Matching Methods T4.1 Introducti
- Page 43 and 44: Advantages and Disadvantages of ‘
- Page 45 and 46: Box T1. General Data Collection and
- Page 47 and 48: Box T3. Data Collection Methods Pro
- Page 49 and 50: T6 Specific Data Collection Methods
- Page 51 and 52: Table T8: Example of a Household BN
- Page 53 and 54: The poverty index can range from 0%
- Page 55 and 56: The PIA guide proposes the followin
- Page 57 and 58: day. The ‘before project’ score
- Page 59 and 60: Figure T15: “Before and After”
- Page 61 and 62: Table T10: Pair-Wise Ranking Showin
- Page 63 and 64: Impact calendars Impact calendars c
- Page 65 and 66: A large sample is needed to be conf
- Page 67 and 68: Table T15: Scoring of Changes in Ag
- Page 69 and 70: Table T17: QPA Scoring of Social Eq
- Page 71 and 72: T6.4 Participatory Economic Valuati
- Page 73 and 74: Advantages and Disadvantages of Par
- Page 75 and 76: The stories are collected from thos
- Page 77 and 78: Main Sources and Further Guidance D
Table T4: The PIPA Outcomes Logic Model<br />
Actor or Group <strong>of</strong> Actors<br />
Who are Expected to<br />
Change in the Same Way<br />
Source: Douthwaite et al., 2008.<br />
Change in Practice<br />
Required to Achieve the<br />
Project Vision<br />
Changes in Knowledge,<br />
Attitudes and Skills Required<br />
to Support this Change<br />
Project Strategies<br />
to Bring about<br />
these Changes<br />
The outcomes logic model involves developing an 'outcome hypothesis' (or theory <strong>of</strong> change) in the<br />
<strong>for</strong>m <strong>of</strong> 'predictions' (outcome targets) and milestones ('progress markers') in the achievement <strong>of</strong><br />
the predictions. In this causal model approach, 'milestones' can be thought <strong>of</strong> as early outcomes,<br />
and 'predictions' as later outcomes. As in the other models, these should be SMART. Using an Excel<br />
spreadsheet, the participants then enter the key changes needed, a set <strong>of</strong> strategies and activities<br />
<strong>for</strong> achieving those changes, and the predictions and milestones, as shown in Table T5.<br />
Table T5: Excel Spreadsheet Used in PIPA<br />
Source: Reproduced with permission from Douthwaite, B., Alvarez, S., Thiele, G., Mackay, R., Cordoba, D. &<br />
Tehelen, K. 2008. Participatory Impact Pathways Analysis: a practical method <strong>for</strong> project planning and<br />
evaluation. Paper prepared <strong>for</strong>: ‘Rethinking Impact: Understanding the Complexity <strong>of</strong> Poverty and Change’<br />
Workshop. www.prgaaprogram.org/riw/files/papers/PIPA-Impact-WS.doc<br />
After the workshop, participants complete an M&E plan with key staff and stakeholders, and draft<br />
an '<strong>impact</strong> narrative' explaining the underlying logic. Repeat workshops are held every 6 or 12<br />
months to assess progress, and, as necessary, to adjust the strategies, activities, outcomes and<br />
milestones.<br />
Social Impact Assessment <strong>of</strong> Land-Based Carbon Projects (1.0) – Part II | 20


