manual for social impact assessment of land-based ... - Forest Trends
manual for social impact assessment of land-based ... - Forest Trends manual for social impact assessment of land-based ... - Forest Trends
Increase in community stocks of timber + 1 Increase in the availability of timber (for household and community use) + 1 Decrease in the availability of timber (for household and community use) + 1 Increase in availability of fuel-wood (for household and community use) + 1 Decrease in availability of fuel-wood (for household and community use) PHYSICAL CAPITAL + 1 Deterioration or reduction in transportation infrastructure - 2 New or improved transportation infrastructure + 1 Improved access to markets (due to new or improved roads/infrastructure) + 2 Ecotourism facilities developed or improved + 1 Health clinic established or improved (directly by the project) SOCIAL CAPITAL + 2 Community organization established or strengthened + 1 Community and/or household negotiation skills improved + 1 Community gain voice and participation in local and/or national planning + 2 Mistrust towards authorities & project managers due to complexity/lack of understanding of project’s payment/compensation regime/contracts & assoc. factors incl. carbon pricing, etc. - 1 Legal recognition of land tenure rights (private or communal titles) of local inhabitants + 1 Increase in land tenure security (due to change in perception as result of inclusion of land in carbon scheme) + 2 Decrease or loss of informal/customary rights over forest resources and land - 1 Decrease in availability of land for poor landless, due to access restrictions - 1 Decrease or loss of access to forest resources for extraction/harvest (timber, NTFPs, wild game etc.) - 1 Recognition of carbon rights for local communities or individuals + 1 New micro-enterprises developed + 1 Logging companies cause social disruption and tensions - 1 Social Impact Assessment of Land-Based Carbon Projects (1.0) – Part II | 97
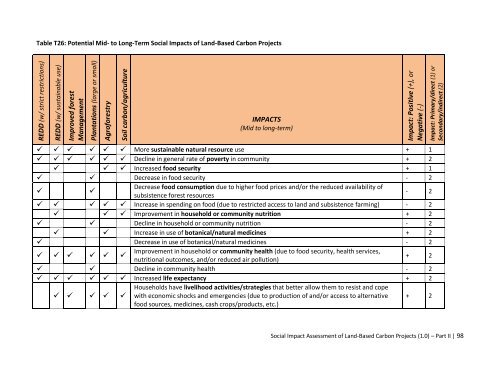
Table T26: Potential Mid- to Long-Term Social Impacts of Land-Based Carbon Projects REDD (w/ strict restrictions) REDD (w/ sustainable use) Improved forest Management Plantations (large or small) Agroforestry Soil carbon/agriculture IMPACTS (Mid to long-term) More sustainable natural resource use + 1 Decline in general rate of poverty in community + 2 Increased food security + 1 Decrease in food security - 2 Decrease food consumption due to higher food prices and/or the reduced availability of subsistence forest resources - 2 Increase in spending on food (due to restricted access to land and subsistence farming) - 2 Improvement in household or community nutrition + 2 Decline in household or community nutrition - 2 Increase in use of botanical/natural medicines + 2 Decrease in use of botanical/natural medicines - 2 Improvement in household or community health (due to food security, health services, nutritional outcomes, and/or reduced air pollution) + 2 Decline in community health - 2 Increased life expectancy + 2 Households have livelihood activities/strategies that better allow them to resist and cope with economic shocks and emergencies (due to production of and/or access to alternative food sources, medicines, cash crops/products, etc.) Impact: Positive (+), or Negative (-) + 2 Impact: Primary/direct (1) or Secondary/indirect (2) Social Impact Assessment of Land-Based Carbon Projects (1.0) – Part II | 98
- Page 55 and 56: The PIA guide proposes the followin
- Page 57 and 58: day. The ‘before project’ score
- Page 59 and 60: Figure T15: “Before and After”
- Page 61 and 62: Table T10: Pair-Wise Ranking Showin
- Page 63 and 64: Impact calendars Impact calendars c
- Page 65 and 66: A large sample is needed to be conf
- Page 67 and 68: Table T15: Scoring of Changes in Ag
- Page 69 and 70: Table T17: QPA Scoring of Social Eq
- Page 71 and 72: T6.4 Participatory Economic Valuati
- Page 73 and 74: Advantages and Disadvantages of Par
- Page 75 and 76: The stories are collected from thos
- Page 77 and 78: Main Sources and Further Guidance D
- Page 79 and 80: Table T19: Stakeholder Analysis Pro
- Page 81 and 82: Figure T18. Venn Diagram with Stake
- Page 83 and 84: T7.2 Problem Trees Assuming it is p
- Page 85 and 86: T7.3 Scenario Analysis Scenarios ar
- Page 87 and 88: Box T7. Driving Forces in a Communi
- Page 89 and 90: Maack, J.N. 2001. Scenario analysis
- Page 91 and 92: In terms of non-monetary benefits,
- Page 93 and 94: and duration of employment, the sta
- Page 95 and 96: Physical Capital Positive changes i
- Page 97 and 98: these strategic resource off-limits
- Page 99 and 100: einforce existing institutions or n
- Page 101 and 102: PROJECT: PROFAFOR TYPE: Plantations
- Page 103 and 104: their occurrence will depend in lar
- Page 105: HUMAN CAPITAL Increase in perceptio
- Page 109 and 110: Figure T20: Example of Relationship
- Page 111 and 112: Figure T22: Additional Potential So
- Page 113 and 114: T9 Further Guidance on Indicator Se
- Page 115 and 116: Box T9. Goals and Indicators Defini
- Page 117 and 118: When selecting indicators, it is be
- Page 119 and 120: Table T27: Indicator Quality Assess
- Page 121 and 122: Box T10. Indicators Derived from th
- Page 123 and 124: T9.5 Disaggregating Indicators Mult
- Page 125 and 126: Mayoux, L. 2001. What Do We Want to
- Page 127 and 128: Landscape Outcomes Assessment Metho
- Page 129 and 130: • Access to essential services (w
- Page 131 and 132: T10.3 Social Indicators Derived fro
- Page 133 and 134: Empowerment of women indicators:
- Page 135 and 136: CCBA, 2008. Climate, Community & Bi
- Page 137 and 138: James A., Pangtey V., Singh P. & Vi
- Page 139: SEEP Network. 2006. Social Performa
Table T26: Potential Mid- to Long-Term Social Impacts <strong>of</strong> Land-Based Carbon Projects<br />
REDD (w/ strict restrictions)<br />
REDD (w/ sustainable use)<br />
Improved <strong>for</strong>est<br />
Management<br />
Plantations (large or small)<br />
Agro<strong>for</strong>estry<br />
Soil carbon/agriculture<br />
IMPACTS<br />
(Mid to long-term)<br />
More sustainable natural resource use + 1<br />
Decline in general rate <strong>of</strong> poverty in community + 2<br />
Increased food security + 1<br />
Decrease in food security - 2<br />
<br />
Decrease food consumption due to higher food prices and/or the reduced availability <strong>of</strong><br />
subsistence <strong>for</strong>est resources<br />
- 2<br />
Increase in spending on food (due to restricted access to <strong>land</strong> and subsistence farming) - 2<br />
Improvement in household or community nutrition + 2<br />
Decline in household or community nutrition - 2<br />
Increase in use <strong>of</strong> botanical/natural medicines + 2<br />
Decrease in use <strong>of</strong> botanical/natural medicines - 2<br />
<br />
Improvement in household or community health (due to food security, health services,<br />
nutritional outcomes, and/or reduced air pollution)<br />
+ 2<br />
Decline in community health - 2<br />
Increased life expectancy + 2<br />
<br />
Households have livelihood activities/strategies that better allow them to resist and cope<br />
with economic shocks and emergencies (due to production <strong>of</strong> and/or access to alternative<br />
food sources, medicines, cash crops/products, etc.)<br />
Impact: Positive (+), or<br />
Negative (-)<br />
+ 2<br />
Impact: Primary/direct (1) or<br />
Secondary/indirect (2)<br />
Social Impact Assessment <strong>of</strong> Land-Based Carbon Projects (1.0) – Part II | 98


