Maneuvering the Mosaic: Full Report - Forest Trends
Maneuvering the Mosaic: Full Report - Forest Trends
Maneuvering the Mosaic: Full Report - Forest Trends

Create successful ePaper yourself
Turn your PDF publications into a flip-book with our unique Google optimized e-Paper software.
Premium Sponsor<br />
<strong>Maneuvering</strong> <strong>the</strong> <strong>Mosaic</strong><br />
State of <strong>the</strong> Voluntary Carbon Markets 2013<br />
Sponsors<br />
timber of <strong>the</strong> 21st century
About <strong>Forest</strong> <strong>Trends</strong>’ Ecosystem Marketplace and Bloomberg New Energy Finance<br />
Ecosystem Marketplace, an initiative of <strong>the</strong> non-profit organization <strong>Forest</strong> <strong>Trends</strong>, is a leading source of<br />
information on environmental markets and payments for ecosystem services. Our publicly available information<br />
sources include annual reports, quantitative market tracking, weekly articles, daily news, and news briefs<br />
designed for different payments for ecosystem services stakeholders. We believe that by providing solid and<br />
trustworthy information on prices, regulation, science, and o<strong>the</strong>r market-relevant issues, we can help payments<br />
for ecosystem services and incentives for reducing pollution become a fundamental part of our economic and<br />
environmental systems, helping make <strong>the</strong> priceless valuable.<br />
Ecosystem Marketplace is financially supported by organizations such as <strong>the</strong> Skoll Foundation, <strong>the</strong> Swiss Agency<br />
for Development and Cooperation, <strong>the</strong> International Climate Initiative, <strong>the</strong> Gordon and Betty Moore Foundation,<br />
as well as sponsors and supporters of this report.<br />
<strong>Forest</strong> <strong>Trends</strong> is a Washington, DC-based international non-profit organization whose mission is to maintain,<br />
restore, and enhance forests and connected natural ecosystems, which provide life-sustaining processes, by<br />
promoting incentives stemming from a broad range of ecosystem services and products. Specifically, <strong>Forest</strong><br />
<strong>Trends</strong> seeks to catalyze <strong>the</strong> development of integrated carbon, water, and biodiversity incentives that deliver<br />
real conservation outcomes and benefits to local communities and o<strong>the</strong>r stewards of our natural resources.<br />
<strong>Forest</strong> <strong>Trends</strong> analyzes strategic market and policy issues, catalyzes connections between producers,<br />
communities and investors, and develops new financial tools to help markets work for conservation and people.<br />
Bloomberg New Energy Finance (BNEF) is <strong>the</strong> definitive source of insight, data and news on <strong>the</strong> transformation<br />
of <strong>the</strong> energy sector. BNEF has staff of more than 200, based in London, New York, Beijing, Cape Town, Hong<br />
Kong, Munich, New Delhi, San Francisco, São Paulo, Singapore, Sydney, Tokyo, Washington D.C., and Zurich.<br />
BNEF Insight Services provide financial, economic and policy analysis in <strong>the</strong> following industries and markets:<br />
advanced transportation, bioenergy, carbon capture and storage, carbon markets, digital energy, energy<br />
efficiency, energy storage, gas, geo<strong>the</strong>rmal, hydro & marine, nuclear, power markets, REC markets, solar, water<br />
and wind. BNEF’s Industry Intelligence Service provides access to <strong>the</strong> world’s most comprehensive database<br />
of assets, investments, companies and equipment in <strong>the</strong> same sectors. The BNEF News Service is <strong>the</strong> leading<br />
global news service focusing on finance, policy and economics for <strong>the</strong> same sectors. The group also undertakes<br />
custom research on behalf of clients and runs senior-level networking events, including <strong>the</strong> annual BNEF Summit,<br />
<strong>the</strong> premier event on <strong>the</strong> future of <strong>the</strong> energy industry.<br />
New Energy Finance Limited was acquired by Bloomberg L.P. in December 2009, and its services and products<br />
are now owned and distributed by Bloomberg Finance L.P., except that Bloomberg L.P. and its subsidiaries<br />
distribute <strong>the</strong>se products in Argentina, Bermuda, China, India, Japan, and Korea.<br />
<strong>Forest</strong> <strong>Trends</strong>’ Ecosystem Marketplace<br />
1203 19th Street, NW<br />
4th floor<br />
Washington, DC 20036<br />
info@ecosystemmarketplace.com<br />
www.ecosystemmarketplace.com<br />
www.forest-trends.org<br />
Bloomberg New Energy Finance<br />
731 Lexington Avenue<br />
New York, NY 10022<br />
sales.bnef@bloomberg.net<br />
www.about.bnef.com
<strong>Maneuvering</strong> <strong>the</strong> <strong>Mosaic</strong><br />
State of <strong>the</strong> Voluntary Carbon Markets 2013<br />
A <strong>Report</strong> by <strong>Forest</strong> <strong>Trends</strong>’ Ecosystem Marketplace<br />
& Bloomberg New Energy Finance<br />
Molly Peters-Stanley and Daphne Yin<br />
Contributors: Selene Castillo, Gloria Gonzalez, and Allie Goldstein<br />
June 20, 2013
Copyright and Disclaimer:<br />
© Ecosystem Marketplace is an initiative of <strong>Forest</strong> <strong>Trends</strong> and Bloomberg New Energy Finance is a service of<br />
Bloomberg LP.<br />
This document was prepared and based upon information supplied by participants in a market survey conducted<br />
by both parties. Nei<strong>the</strong>r Bloomberg New Energy Finance nor Ecosystem Marketplace represents or warrants <strong>the</strong><br />
accuracy, suitability, or content of <strong>the</strong> survey responses or <strong>the</strong> results of that survey as set out herein. It is <strong>the</strong> sole<br />
responsibility and obligation of <strong>the</strong> reader of this report to satisfy himself/herself as to <strong>the</strong> accuracy, suitability,<br />
and content of <strong>the</strong> information contained herein. Bloomberg New Energy Finance and/or Ecosystem Marketplace<br />
(such terms taken to also include <strong>the</strong>ir respective affiliates, officers, directors, partners, and employees) make<br />
no warranties and shall have no liability to <strong>the</strong> reader for any inaccuracy, representation, or misrepresentation set<br />
out herein. The reader fur<strong>the</strong>r agrees to hold both Bloomberg New Energy Finance and Ecosystem Marketplace<br />
harmless from and against any claims, loss, or damage in connection with or arising out of any commercial<br />
decisions made on <strong>the</strong> basis of <strong>the</strong> information contained herein. The reader of this report is strongly advised<br />
not to use <strong>the</strong> content of this report in isolation, but to take <strong>the</strong> information contained herein toge<strong>the</strong>r with o<strong>the</strong>r<br />
market information and to formulate his/her own views, interpretations, and opinions <strong>the</strong>reon. The reader is<br />
strongly advised to seek appropriate legal and professional advice before entering into commercial transactions.<br />
Acknowledgments:<br />
This report is a compilation of <strong>the</strong> insights of a wide range of individuals across several continents. It would not<br />
be possible without <strong>the</strong> more than 300 individuals who shared valuable information about <strong>the</strong>ir organizations.<br />
This report is publicly available due to support from our premium sponsor Santiago Climate Exchange; sponsors<br />
Baker & McKenzie, ClimateCare, EcoInvest, EcoPlanet Bamboo, <strong>the</strong> <strong>Forest</strong> Carbon Group AG, <strong>the</strong> Global<br />
Alliance for Clean Cookstoves, and Love <strong>the</strong> World. O<strong>the</strong>r industry supporters also include <strong>the</strong> American Carbon<br />
Registry, BioCarbon Group, Bloomberg, BP Target Neutral, First Climate, South Pole Carbon Asset Management,<br />
The CarbonNeutral Company, and <strong>the</strong> Verified Carbon Standard.<br />
The creation of this report has also required insights, time, and support from dozens of people. They include<br />
Andrea Abrahams, David Antonioli, Evan Ard, Nick Atkinson, Crhistian Austin, Lucas Belenky, Ollie Belton,<br />
Kathy Benini, Carlos Berner, Simon Besnard, Henrietta Boyd, Derik Broekhoff, James Bulinski, Kishore Butani,<br />
Gabriel Carrero, Aldo Cerda, Marisa Chiarella, Taylor Clayton, Jeff Cohen, Erin Craig, Christian Dannecker, Ben<br />
Dappen, Ca<strong>the</strong>rine Diam-Valla, Michel Dicapua, Dhanush Dinesh, Johannes Ebeling, Rupert Edwards, Gabriel<br />
Eickhoff, Matt Evans, Sun Fang, Peter Favretto, Bruno Ferraz, Drew Fleeter, Heloísa Garcia da Mota, Jay Gillette,<br />
Sara Gipton, Justin Glass, Roberto Leon Gomez, Mary Grady, Sophy Greenhalgh, Jeannette Gurung, Edward<br />
Hanrahan, Buddy Hay, Franziska Heidenreich, Renat Heuberger, Lenny Hochschild, Sam Hoffer, Aya Hosono,<br />
Sayaka Iguchi, Lars Kvale, Robert Lee, Sascha Lafeld, Alexis Leroy, Grattan MacGiffin, Ingrid Maier, Stephen<br />
McComb, Brian McFarland, Chongyi Li, Patrick Nye, Jacob Olander, Tanya Petersen, Patrick Pfeiffer, Gerald<br />
Prolman, Charles Purshouse, Bertrand Rame, Matt Riddiford, Adrian Rimmer, David Rokoss, Rangel Romao,<br />
Junia Ruggiero, Derek Sabori, Michael Sahm, Richard Saines, Kazuyoshi Sasaki, Jerry Seager, Wayne Sharpe,<br />
Jonathan Shopley, Agustin Silvani, James Tansey, Anne Thiel, Evan Thomas, Phuc Xuan To, Kevin Townsend,<br />
Gareth Turner, Jennifer Tweddell, Francesca Vigna, Keren Visser, Peter Weir, Vicky West, Justin Whalen, Claire<br />
Willers, Troy Wiseman, Gareth Wishart, Patrick Wood, Erik Wurster, Jinhong Yuan, Zubair Zakir, and Steve Zwick.<br />
A special thank you also to Michael Jenkins and Ka<strong>the</strong>rine Hamilton for <strong>the</strong>ir guidance and <strong>the</strong> staff at <strong>Forest</strong><br />
<strong>Trends</strong>’ Ecosystem Marketplace and Bloomberg New Energy Finance.<br />
Cover, layout, and graphics by Eszter Szöcs of Visilio Design (www.visilio.com).<br />
design
Last year, voluntary actors worldwide channeled <strong>the</strong>ir<br />
personal or corporate fi nancial resources into carbon<br />
reduction projects that often refl ected <strong>the</strong> full spectrum<br />
of <strong>the</strong>ir climate footprint, supporting activities that deliver<br />
positive benefi ts “beyond carbon” and that are in line<br />
with <strong>the</strong>ir environmental impacts and vulnerabilities.<br />
Executive Summary<br />
State of <strong>the</strong> Voluntary Carbon Markets 2013 v<br />
Consumer awareness of <strong>the</strong> immediate impacts and future risks of climate change is trending<br />
upward – converging with a global economic scenario that complicates <strong>the</strong> implementation<br />
of broad-based policy solutions. But where some policy makers fear to tread, many private<br />
companies are voluntarily internalizing <strong>the</strong> price of carbon in <strong>the</strong>ir business activities, as seen<br />
in <strong>the</strong>ir still-growing voluntary demand for carbon offsets in 2012.<br />
2012 KEY FINDINGS<br />
This motivation was deeply felt by forestry and landuse<br />
projects where a resurgence of support to earlystage<br />
activities by offset end users speaks to buyers’<br />
growing confi dence in <strong>the</strong> projects’ ability to deliver<br />
verifi ed carbon assets and potentially mitigate supply<br />
chain risks.<br />
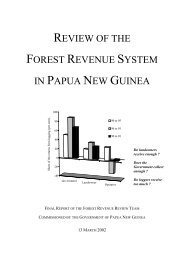
• In 2012, voluntary actors contracted 101 million tonnes of carbon offsets (MtCO 2 e) for immediate or<br />
future delivery – 4% more than in 2011. Market value decreased 11% to $523 million as offset prices<br />
fell slightly for several popular project types (Figure 1).<br />
• 90% of offset volumes were contracted by <strong>the</strong> private sector – where corporate social responsibility<br />
and industry leadership were primary motivations for offset purchases.<br />
• Offset buyers’ desire to positively impact <strong>the</strong> climate resilience of <strong>the</strong>ir supply chain or sphere of<br />
infl uence was evident in our data which identifi es a strong relationship between buyers’ business<br />
sectors and <strong>the</strong> project categories from which <strong>the</strong>y contract offsets.<br />
• Most forward contracts spanning multiple years were negotiated between project developers and<br />
offset end users – providing some indication of future corporate demand for carbon offsets, particularly<br />
from project types that confer additional environmental and social benefi ts.<br />
• A sizeable portion of market value (64% of value associated with a contract type or $170 million) was<br />
paid to offset sellers at <strong>the</strong> point of transaction ra<strong>the</strong>r than offset delivery – primarily via spot contracts<br />
(35.6 MtCO 2 e, up 25% from 2011) and pre-payment for future delivery (8.7 MtCO 2 e, down 1% from<br />
2011).<br />
• Demand surged for carbon offsets from forestry projects certifi ed to <strong>the</strong> Verifi ed Carbon Standard and<br />
Climate, Community and Biodiversity Standards. Voluntary buyers also funneled $80 million to Gold<br />
Standard-certifi ed offsets from projects that distribute clean cookstoves and water fi ltration devices.<br />
• Suppliers predict market value could reach $1.6 - $2.3 billion in 2020 1 – if market actors can effectively<br />
communicate <strong>the</strong> relevance of offsetting and carbon market infrastructure to private sector actors,<br />
<strong>the</strong> international donor community, and governments seeking tools to incentivize, verify, and fi nance<br />
climate action.<br />
1 Based on current dollar value without consideration to infl ation.<br />
Executive Summary
vi State of <strong>the</strong> Voluntary Carbon Markets 2013<br />
Executive Summary<br />
Voluntary offset buyers also sought a large volume of<br />
offsets from projects that distribute clean cookstoves<br />
and water fi ltration devices – that burn fuel more<br />
effi ciently or not at all, thus reducing carbon emissions<br />
while sparing households from harmful smoke<br />
inhalation. More traditional project types – from wind<br />
energy to fuel switching – rounded out a mosaic of<br />
mitigation activities implemented in <strong>the</strong> largest number<br />
of countries ever tracked in this report series.<br />
These projects were guided by results-based accounting<br />
standards that underpinned an ever-larger collection<br />
of mitigation approaches. Throughout 2012, <strong>the</strong>se<br />
standards bodies took steps to lower transaction<br />
MtCO 2 e<br />
160<br />
140<br />
120<br />
100<br />
80<br />
60<br />
40<br />
20<br />
0<br />
costs, streng<strong>the</strong>n voluntary actors’ relationships with<br />
compliance carbon markets, and expand projects’ ability<br />
to account for <strong>the</strong>ir additional contributions to health,<br />
women’s empowerment, and o<strong>the</strong>r public services.<br />
At <strong>the</strong> receiving end of this global effort, offset buyers<br />
in Europe and North America expanded <strong>the</strong>ir offset<br />
programs in order to “demonstrate climate leadership”<br />
even as both regions struggle to implement or<br />
maintain a meaningful carbon price signal. Where<br />
governments have included offset provisions within<br />
<strong>the</strong>ir broader climate regulations, demand ranged<br />
from steady (in California) to growing (in Australia) as<br />
companies prepared for compliance.<br />
Figure 1: Historical Offset Demand by Transacted Volume, All Voluntary Carbon Markets<br />
88 M<br />
4<br />
84<br />
32 M<br />
10<br />
21<br />
73 M<br />
23<br />
49<br />
135 M<br />
69<br />
107 M<br />
2<br />
65 64<br />
Notes: Based on 763 MtCO e of offsets transacted and reported to Ecosystem Marketplace over 7 survey years.<br />
2<br />
Source: <strong>Forest</strong> <strong>Trends</strong>’ Ecosystem Marketplace. State of <strong>the</strong> Voluntary Carbon Markets 2013.<br />
41<br />
131 M<br />
2<br />
2<br />
128<br />
97 M<br />
2<br />
95<br />
101 M<br />
2<br />
pre-2006 2006 2007 2008 2009 2010 2011 2012<br />
Voluntary Offsets Contracted Over<strong>the</strong>-Counter<br />
Voluntary Offsets Traded on an<br />
Exchange<br />
Historical Transactions Tracked and<br />
Added in 2012<br />
Over-<strong>the</strong>-counter Chicago Climate Exchange-traded O<strong>the</strong>r exchanges<br />
Table 1: Historical Transaction Volumes, All Voluntary Carbon Markets<br />
Volume (MtCO 2 e) Value ($ Million)<br />
98<br />
Average Price (Volume-<br />
Weighted $/tCO 2 e)<br />
2011 2012 2011 2012 2011 2012<br />
93 98.5 $572 $515.7 $6.2/t $5.9/t<br />
2 2.3 $4.2 $6.3 – –<br />
1.8 – $10.9 – – –<br />
Voluntary Carbon Markets Total 97 101 $586.5 $523 $6.2/t $5.9/t<br />
Source: <strong>Forest</strong> <strong>Trends</strong>’ Ecosystem Marketplace. State of <strong>the</strong> Voluntary Carbon Markets 2013.
These and o<strong>the</strong>r fi ndings are described in this seventh<br />
edition of <strong>the</strong> State of <strong>the</strong> Voluntary Carbon Markets<br />
report series, which is informed by over 300 responses<br />
to our global annual survey of offset providers. Each of<br />
<strong>the</strong>se suppliers respond on behalf of a unique portfolio<br />
of carbon offset projects and voluntary demand drivers.<br />
This report describes <strong>the</strong>se responses both as unique<br />
actions and as <strong>the</strong> sum of <strong>the</strong>ir many parts, unveiling a<br />
picture of a market leveraging innovation to maneuver<br />
<strong>the</strong> mosaic of public and private solutions to climate<br />
change.<br />
Voluntary Offset Demand Tops 100 Million Tonnes,<br />
Market Value Down 11%<br />
In 2012, voluntary actors contracted 101 million tonnes<br />
of carbon offsets (MtCO 2 e) for immediate or future<br />
delivery – 4% more than in 2011. The vast majority<br />
of <strong>the</strong>se offset transactions (98.5 MtCO 2 e) occurred<br />
bilaterally, or “over <strong>the</strong> counter” (OTC) ra<strong>the</strong>r than on<br />
any formal exchange.<br />
This represents <strong>the</strong> second highest level of OTC market<br />
activity tracked in this report series, behind <strong>the</strong> 2010<br />
market which was boosted by a sizable transaction of<br />
offsets generated through <strong>the</strong> voluntary Chicago Climate<br />
Exchange (CCX) – which wound down operations in<br />
<strong>the</strong> same year. Despite <strong>the</strong> formal program’s closure,<br />
its infl uence is still felt in <strong>the</strong> North American carbon<br />
markets, where voluntary actors transacted 8.3 MtCO 2 e<br />
of CCX offsets in 2012 – pushing <strong>the</strong> voluntary market<br />
as whole over <strong>the</strong> one-hundred-million-tonne mark.<br />
While offset demand grew, market value decreased<br />
11% to $523 million as offset prices fell slightly for<br />
most project types. A sizeable portion of market<br />
value (64% of value associated with a contract type<br />
or $170 million) was paid to offset sellers at <strong>the</strong> point<br />
of transaction ra<strong>the</strong>r than offset delivery – primarily via<br />
spot contracts (35.6 MtCO 2 e, up 25% from 2011) and<br />
pre-payment for future delivery (8.7 MtCO 2 e, down 1%<br />
from 2011). Ano<strong>the</strong>r $97.5 million will be paid in future<br />
years, if and when <strong>the</strong> projects under contract deliver<br />
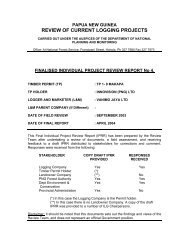
verifi able reductions. As seen in Figure 2, this fi nding<br />
refl ects a signifi cant shift in contract structures favoring<br />
upfront payments as <strong>the</strong> volume of verifi ed tonnes has<br />
grown over time, boosting both offset supply and buyer<br />
confi dence that projects are capable of verifying GHG<br />
reductions and delivering offsets.<br />
In 2012, voluntary actors paid a volume-weighted<br />
average price of $5.9/tCO 2 e – slightly down from 2011’s<br />
$6.2/tCO 2 e, but signifi cantly higher than <strong>the</strong> United<br />
Nations’ regulatory Clean Development Mechanism<br />
State of <strong>the</strong> Voluntary Carbon Markets 2013 vii<br />
Figure 2: Historical Market Share, Transacted Volume<br />
by Payment Method<br />
100%<br />
90%<br />
80%<br />
70%<br />
60%<br />
50%<br />
40%<br />
30%<br />
20%<br />
10%<br />
0%<br />
2008 2009 2010 2011 2012<br />
Spot Pre-payment Pay on delivery Options<br />
Notes: Based on 65.5 MtCO e associated<br />
2<br />
with a contract type.<br />
Source: <strong>Forest</strong> <strong>Trends</strong>’ Ecosystem Marketplace.<br />
State of <strong>the</strong> Voluntary Carbon Markets 2013.<br />
(CDM) carbon offset price of less than a $1/tCO 2 e.<br />
Declining prices were most apparent in <strong>the</strong> highpriced<br />
offsets range ($10+/tCO 2 e) where <strong>the</strong> volume<br />
of offsets contracted at <strong>the</strong>se prices fell by 46%.<br />
On <strong>the</strong> o<strong>the</strong>r hand, transacted volumes of offsets at<br />
less than $5/tCO 2 e grew by 19%. Suppliers say this<br />
downward trend was primarily a function of perceived<br />
offset oversupply and knock-on effects of <strong>the</strong> collapse<br />
of <strong>the</strong> EU carbon price.<br />
Over all of <strong>the</strong> years of market activity tracked in<br />
this report series, voluntary buyers have funded<br />
763 MtCO 2 e in emissions reductions worth $3.7<br />
billion and at an average historical price of $5.9/<br />
tCO 2 e – equivalent to <strong>the</strong> 2012 market-wide average<br />
offset price.<br />
Project Developers, Private Sector Dominate Transactions<br />
Project developers were responsible for generating<br />
and selling almost half of all offset volumes in 2012<br />
– valued at $184 million, or about 18% <strong>the</strong> size of<br />
<strong>the</strong> primary market for offsets in <strong>the</strong> CDM in 2012,<br />
according to Bloomberg New Energy Finance.<br />
Around 15 MtCO 2 e of this volume was sold to retail<br />
offset providers that will <strong>the</strong>n sell <strong>the</strong> offsets to <strong>the</strong>ir<br />
offset end use clients. Ano<strong>the</strong>r 16 MtCO 2 e was sold<br />
Executive Summary
viii State of <strong>the</strong> Voluntary Carbon Markets 2013<br />
Executive Summary<br />
Figure 3: Transacted Volume and Average Price by<br />
Buyer and Seller Types, OTC 2012<br />
16.4<br />
MtCO 2 e<br />
$6.3<br />
No data<br />
14.8<br />
MtCO 2 e<br />
$4.8<br />
Broker 9.1 MtCO e $3.9<br />
2 Reseller<br />
$6.4<br />
Project Developer<br />
4 MtCO 2 e<br />
End Buyer<br />
22.2<br />
MtCO 2 e<br />
$6.6<br />
Notes: Based on 324 organizations reporting 66 MtCO 2 e<br />
associated with business roles and buyer types.<br />
Source: <strong>Forest</strong> <strong>Trends</strong>’ Ecosystem Marketplace.<br />
State of <strong>the</strong> Voluntary Carbon Markets 2013.<br />
Volume<br />
purchased<br />
(Million tonnes)<br />
43.4 M<br />
29.6 M<br />
5.7 M<br />
1.9 M<br />
0.3 M<br />
by project developers directly to offset end users – in<br />
direct competition with retailers and for a slightly lower<br />
average price ($6.3/tCO 2 e versus $6.6/tCO 2 e, as seen<br />
in Figure 3).<br />
At <strong>the</strong> o<strong>the</strong>r end of <strong>the</strong>se transactions, a full 90% of<br />
offset volumes were contracted by <strong>the</strong> private sector<br />
– representing a mix of multi-national fi rms (36% of all<br />
buyers), small- to medium-size enterprises (31%), and<br />
domestic corporations (13%) from a wide variety of<br />
business sectors.<br />
A large contingent of primarily European offset retailers<br />
formed <strong>the</strong> single most prominent buyer type in 2012.<br />
The manufacturing and energy sectors were tied as<br />
<strong>the</strong> top source of offset end use demand, followed by<br />
trans portation services (air and rail), and <strong>the</strong> fi nance/<br />
insurance industry. Prominent buyers in <strong>the</strong>se sectors in<br />
2012-2013 included Chevrolet, Qantas, Allianz, Germany<br />
utility HSE Entega, and US-based utility Entergy.<br />
Corporate social responsibility remained <strong>the</strong> top offsett<br />
ing motivation among end users. In 2012, respondents<br />
also identifi ed buyers’ desire to demonstrate<br />
climate leadership in <strong>the</strong>ir respective industries as<br />
ano<strong>the</strong>r signifi cant motivation, tracked for <strong>the</strong> fi rst time<br />
this year.<br />
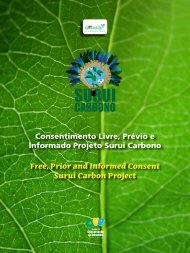
Figure 4: Transacted Volume, Value, and Average Price by Buyer Region, OTC 2012<br />
Buyer region<br />
value<br />
($ Million)<br />
204.9 M<br />
142.9 M<br />
14.3 M<br />
35.4 M<br />
2.6 M<br />
Buyer region<br />
Europe<br />
North<br />
America<br />
Oceania<br />
Asia<br />
Latin<br />
America<br />
36%<br />
9%<br />
Buyer share<br />
of market value<br />
4% 1%<br />
Notes: Based on 81 MtCO e associated with a buyer region.<br />
2<br />
Source: <strong>Forest</strong> <strong>Trends</strong>’ Ecosystem Marketplace. State of <strong>the</strong> Voluntary Carbon Markets 2013.<br />
51%
x State of <strong>the</strong> Voluntary Carbon Markets 2013<br />
Executive Summary<br />
28.7 MtCO 2 e. A little over a third of offsets purchased<br />
by US buyers (9.7 million tonnes) were obtained for<br />
future use in California’s emerging cap-and-trade<br />
program. Over time, offset demand in Europe and<br />
North America has grown by an average of 35%/year<br />
and 13%/year, respectively. While North American<br />
buyers continued to prefer supporting domestic<br />
projects, European offset buyers remained <strong>the</strong> world’s<br />
primary source of voluntary demand for offsets from<br />
developing countries.<br />
Market Outlook: Steady as She Goes<br />
Projects that successfully contracted offsets in 2012<br />
could potentially reduce 54-233 MtCO 2 e/year, or 430-<br />
1,860 MtCO 2 e cumulatively over <strong>the</strong> next eight years,<br />
based on <strong>the</strong>ir estimated annual reductions (Figure 6).<br />
This does not account for projects that might exit <strong>the</strong><br />
market, as discussions with offset suppliers indicate<br />
that project developers will indeed abandon carbon<br />
project activities and revert back to a businessas-usual<br />
scenario if/when carbon revenues prove<br />
insuffi cient. Nor does it account for <strong>the</strong> even larger<br />
volumes of emissions reductions from large-scale<br />
projects that are not yet online, but are in <strong>the</strong> pipeline.<br />
In ano<strong>the</strong>r section of our survey, project developers<br />
reported that <strong>the</strong>y anticipate bringing an additional<br />
1,440 MtCO 2 e online over <strong>the</strong> next fi ve years – more<br />
than has been contracted cumulatively to date.<br />
Renewables<br />
34%<br />
26 M<br />
<strong>Forest</strong>ry<br />
and land use<br />
32%<br />
24 M<br />
2 Based on current dollar value without consideration to infl ation.<br />
To absorb <strong>the</strong>se volumes, and according to survey<br />
respondents’ back-of-<strong>the</strong>-envelope predictions, <strong>the</strong><br />
market expects an average market growth rate of 17%<br />
in 2012-2020. Based on <strong>the</strong> voluntary carbon market’s<br />
historical average price of $5.9/tCO 2 e, suppliers’<br />
predictions place market value at $2.3 billion in<br />
2020. 2 Ano<strong>the</strong>r predictive measure – that of recent<br />
years’ average growth rate for voluntary offset<br />
demand (13% from years 2008-2012) – estimates<br />
2020 market value at $1.6 billion.<br />
In order to incentivize voluntary offsetting activities of<br />
this magnitude, suppliers say <strong>the</strong> market must more<br />
effectively communicate <strong>the</strong> value of its underlying<br />
infrastructure and pilot project activities to private<br />
sector actors, <strong>the</strong> international donor community, and<br />
governments seeking tools to incentivize, verify, and<br />
fi nance emissions reductions. They also anticipate that<br />
in coming years, <strong>the</strong> private sector may increasingly<br />
leverage offset payments to incentivize sustainable<br />
resource management in <strong>the</strong>ir supply chains and<br />
spheres of infl uence.<br />
Project Type: <strong>Forest</strong>ry Regains Ground While<br />
Cookstove Projects Heat Up<br />
Voluntary offset buyers’ list of preferred project types<br />
in 2012 was strikingly similar to trends tracked in<br />
2011, with offsets from wind energy projects again on<br />
top – <strong>the</strong>ir popularity attributed to affordability, ready<br />
availability, and simplicity. A total of 15.3 MtCO 2 e of<br />
Figure 7: Transacted Volume by Project Category, OTC 2012 (MtCO 2 e and % Share)<br />
Household<br />
device<br />
7 M<br />
Methane<br />
Energy<br />
efficiency and<br />
fuel switch<br />
6 M<br />
Gases<br />
9% CH9% 9% 8% 6%<br />
CH9% 9% 4<br />
Notes: Findings pertain to <strong>the</strong> 75.5 MtCO e associated with a response to this question, including “N/A” and “O<strong>the</strong>r”.<br />
2<br />
Source: <strong>Forest</strong> <strong>Trends</strong>’ Ecosystem Marketplace. State of <strong>the</strong> Voluntary Carbon Markets 2013.<br />
7 M<br />
5 M<br />
O<strong>the</strong>r<br />
0.4 %<br />
0.3 M
7%<br />
8%<br />
6%<br />
9%<br />
5%<br />
5% 4% 4% 4%<br />
4%<br />
12%<br />
wind project-based offsets were transacted from<br />
projects both in developing countries (China and<br />
India) and <strong>the</strong> United States.<br />
The volume of transacted wind offsets fell 35% from<br />
2011. Demand for forestry and land-use activities<br />
grew, on <strong>the</strong> o<strong>the</strong>r hand, as voluntary support for<br />
afforestation/reforestation projects climbed once more<br />
to a transacted volume of 8.8 MtCO 2 e. Meanwhile,<br />
demand for offsets from projects that reduce<br />
emissions from deforestation and forest degradation<br />
2%<br />
16%<br />
Figure 8: Market Share by Project Type, OTC 2012<br />
20%<br />
3%<br />
5%<br />
3%<br />
2%<br />
2%<br />
Fuel switching,<br />
1%<br />
Livestock<br />
methane, 1%<br />
Geo<strong>the</strong>rmal, 1%<br />
O<strong>the</strong>r, 2%<br />
Notes: Percentages and totals may not sum perfectly due to rounding.<br />
State of <strong>the</strong> Voluntary Carbon Markets 2013 xi<br />
Source: <strong>Forest</strong> <strong>Trends</strong>’ Ecosystem Marketplace. State of <strong>the</strong> Voluntary Carbon Markets 2013.<br />
13%<br />
10%<br />
Figure 9: Market Share by Project Standard, OTC 2012<br />
8%<br />
37%<br />
5%<br />
5%<br />
3%<br />
1%<br />
1%<br />
(REDD) fell by 8% to 6.8 MtCO 2 e in 2012. Even so,<br />
<strong>the</strong> volume of offsets contracted from REDD projects<br />
that are or aspire to be certifi ed to both <strong>the</strong> Verifi ed<br />
Carbon Standard (VCS) and <strong>the</strong> Climate, Community<br />
and Biodiversity (CCB) Standards more than doubled<br />
– as demand for this combination of certifi cations grew<br />
market-wide.<br />
Voluntary buyers funneled $80 million into offsets from<br />
projects that distribute clean cookstoves and water<br />
fi ltration devi ces – that burn fuel more effi ciently or not<br />
Panda Standard,<br />
1%<br />
ISO-14064,
xii State of <strong>the</strong> Voluntary Carbon Markets 2013<br />
Executive Summary<br />
at all, thus reducing greenhouse gas emissions while<br />
sparing households from harmful smoke inhalation. In a<br />
separate survey adminis tered only to cookstove project<br />
developers we found that <strong>the</strong>se projects have so far<br />
delivered at least 4 million cookstoves or o<strong>the</strong>r “clean”<br />
household devices to developing country households<br />
with <strong>the</strong> aid of carbon revenues.<br />
O<strong>the</strong>r popular projects in 2012 included ozone-depleting<br />
substance destruction – aimed exclusively at California<br />
cap-and-trade program buyers preparing for <strong>the</strong><br />
compliance market – and landfi ll methane projects,<br />
also contracted primarily by US-based buyers.<br />
Project Certification: Standards Expand Scope, Seek Scale<br />
The VCS retained its top spot among third-party<br />
standards guiding <strong>the</strong> development and measurement<br />
of carbon project performance. Buyers contracted<br />
43 MtCO 2 e of offsets adhering to a VCS-approved<br />
project methodology, up from 41 MtCO 2 e in 2011. The<br />
volume of VCS offsets from projects that certifi ed <strong>the</strong>ir<br />
additional environmental and social benefi ts to <strong>the</strong><br />
CCB Standards more than doubled to 12.5 MtCO 2 e.<br />
Transaction volumes certifi ed to The Gold Standard<br />
continued <strong>the</strong>ir steady market ascent as a result of<br />
sustained demand for offsets from <strong>the</strong> standard’s<br />
signature household device distribution projects –<br />
increasingly tapping into <strong>the</strong> crediting of micro-scale<br />
activities – as well as biodigester and Turkey-based<br />
wind projects. Voluntary offset buyers contracted a total<br />
volume of 10 MtCO 2 e from Gold Standard voluntary<br />
projects in 2012. Next year this report will likely add<br />
forestry and climate-smart agriculture to <strong>the</strong> roster of<br />
Gold Standard-supported project types, following<br />
<strong>the</strong> standard’s expansion into land use carbon offset<br />
certifi cation with its 2012 acquisition of <strong>the</strong> CarbonFix<br />
Standard for afforestation/reforestation projects and its<br />
new alliance with <strong>the</strong> agriculture-facing Fairtrade label.<br />
Behind The Gold Standard, offsets using CCX methodologies<br />
reappeared in <strong>the</strong> 2012 marketplace after<br />
a sharp drop in demand in 2011. While <strong>the</strong> CCX<br />
program originated in <strong>the</strong> United States, only 26% of<br />
<strong>the</strong> reported 7.6 MtCO 2 e transacted from CCX projects<br />
were US-based. Remaining volumes were sourced<br />
from projects in China, India, Brazil, Germany, and<br />
several o<strong>the</strong>r country locations.<br />
Both <strong>the</strong> Climate Action Reserve (CAR) and <strong>the</strong> American<br />
Carbon Registry (ACR) projects saw decreased market<br />
activity as both certifi cation programs turned <strong>the</strong>ir<br />
attention to <strong>the</strong> California compliance carbon market –<br />
where CAR and ACR received long-awaited approval<br />
as Offset Project Registries for <strong>the</strong> regional program.<br />
VCS, ACR, and CAR all reported major strides in <strong>the</strong><br />
expansion of <strong>the</strong>ir land-use programs, including pilot<br />
project development in <strong>the</strong> fi elds of rice cultivation<br />
(ACR and CAR), wetland restoration (ACR), and soil<br />
carbon management and sustainable agricultural land<br />
management (VCS). VCS and ACR both fi nalized and<br />
made available Jurisdictional Nested REDD (JNR)<br />
require ments guiding <strong>the</strong> development of juris dictional<br />
REDD programs and <strong>the</strong>ir relationship to REDD projects.<br />
With support of a grant from <strong>the</strong> Norwegian government,<br />
VCS is exploring, and in some cases already supporting,<br />
several regions in piloting JNR programs.<br />
Standards, too, are responding to intensifi ed corporate<br />
interest in measuring and verifying <strong>the</strong> delivery of<br />
“non-carbon” project attributes. Existing and new<br />
programs are exploring how non-carbon attributes like<br />
vulnerability reduction via adaptation, water quality,<br />
biodiversity, women’s empowerment, and public<br />
health can be tied to a carbon offset – and if not, what<br />
o<strong>the</strong>r units of outcomes accounting are potentially<br />
appropriate and viable.<br />
To this end, programs like <strong>the</strong> Higher Ground Foundation<br />
(exploring vulnerability reduction offsets), <strong>the</strong> Water<br />
Benefi t Partners (exploring water benefi t certifi cates),<br />
and <strong>the</strong> Women’s Carbon Standard (recognizing<br />
women’s issues and contributions in project development)<br />
are among several programs that have emerged<br />
in <strong>the</strong> last year to explore opportunities for harnessing<br />
corporate sustainability investments for developmental<br />
aims that are not restricted to GHG mitigation.<br />
Project Location: Asia, Oceania Markets Grow on Trees<br />
Last year, <strong>the</strong> market extended voluntary carbon<br />
fi nance to four new country locations, making for a<br />
total of 65 countries represented in this year’s data.<br />
Despite <strong>the</strong> continued predominance of renewable<br />
energy offsets fl owing from major supplier countries<br />
China and India, Asia saw forestry, energy effi ciency,<br />
and fuel switching offsets grow signifi cantly in market<br />
share. Overall, <strong>the</strong> region saw a 4% increase in <strong>the</strong><br />
volume of offsets supplied, while <strong>the</strong>ir average price<br />
fell by 9% to $3.5/tCO 2 e. While <strong>the</strong> bulk of <strong>the</strong> region’s<br />
offsets fl owed to overseas buyers in keeping with<br />
previous years, 2012 saw a signifi cant increase in <strong>the</strong><br />
purchase of Asian offsets by Asian buyers – a growing<br />
trend as emissions trading schemes and domestic<br />
offset initiatives are set to develop over <strong>the</strong> next several<br />
years in China, South Korea, Thailand, and Vietnam.<br />
Fur<strong>the</strong>r south, while still attracting some support from<br />
both domestic and overseas buyers, New Zealand’s<br />
forestry-dominated market fell by over 50% in voluntary<br />
transaction volume in <strong>the</strong> shadow of its compliance
From<br />
To<br />
market. Australian suppliers, awaiting clarity on future<br />
de mand for offsets generated through <strong>the</strong> Carbon<br />
Farming Initiative, never<strong>the</strong>less saw domestic demand<br />
for offsets more than double to 5.6 MtCO 2 e owing<br />
to some pre-compliance activity as well as purely<br />
voluntary transactions of offsets through <strong>the</strong> National<br />
Carbon Offset Standard.<br />
Kenya-based projects stood <strong>the</strong>ir ground in 2012 as <strong>the</strong><br />
world’s fourth largest supplier country, responsible for<br />
over half of Africa’s 8 MtCO 2 e total transaction volume.<br />
In addition to attracting corporate support for REDD<br />
efforts, Kenya and o<strong>the</strong>r countries including Ghana,<br />
State of <strong>the</strong> Voluntary Carbon Markets 2013 xiii<br />
Figure 10: Flow of Transacted Volumes by Offset Supplier and Buyer Region, OTC 2012<br />
From To<br />
↑<br />
North America<br />
Latin America<br />
Africa<br />
Asia<br />
Oceania<br />
Europe<br />
↑<br />
From<br />
To<br />
From<br />
From<br />
From<br />
North America Latin America Asia Oceania Europe<br />
20.3 M<br />
-<br />
-<br />
-<br />
1.2 M<br />
1.1 M<br />
0.7 M<br />
2.5 M<br />
0.3 M<br />
1.5 M<br />
*Values smaller than 0.1 Million (M) are not shown on map.<br />
0.2 M<br />
-<br />
-<br />
-<br />
-<br />
To<br />
0.3 M<br />
Notes: Based on 80 MtCO associated with ei<strong>the</strong>r offset project or buyer location.<br />
2<br />
Source: <strong>Forest</strong> <strong>Trends</strong>’ Ecosystem Marketplace. State of <strong>the</strong> Voluntary Carbon Markets 2013.<br />
-<br />
1.3 M<br />
-<br />
-<br />
1.5 M<br />
0.03 M*<br />
1 M<br />
1.8 M<br />
-<br />
Mozambique, Uganda, and <strong>the</strong> Democratic Republic<br />
of <strong>the</strong> Congo saw international demand for offset<br />
from projects delivering clean cookstoves and water<br />
purifi cation devices, which in Kenya produced <strong>the</strong><br />
fi rst large-scale issuance using The Gold Standard’s<br />
suppressed-demand approach.<br />
North America’s biggest surprise in 2012 materialized<br />
in <strong>the</strong> over 8.3 MtCO 2 e of offsets transacted through <strong>the</strong><br />
Chicago Climate Exchange offsets registry program,<br />
where new offset generation has more or less come to<br />
a halt but domestic buyers continue to transact offsets<br />
at sub-dollar rates to replenish <strong>the</strong>ir portfolios. The total<br />
To<br />
2.8 M<br />
3.9 M<br />
21.5 M<br />
1.7 M<br />
0.4 M<br />
From<br />
To<br />
Executive Summary
xiv State of <strong>the</strong> Voluntary Carbon Markets 2013<br />
Executive Summary<br />
value of offsets generated in North America was $123<br />
million, with 73% of overall value transacted to precompliance<br />
buyers in anticipation of California’s capand-trade<br />
program. Buyers in <strong>the</strong> United States toge<strong>the</strong>r<br />
purchased more offsets than buyers in any o<strong>the</strong>r single<br />
country, supporting $143 million worth of offsets in 2012.<br />
The volume of offsets transacted in Latin America was<br />
relatively stable in 2012 at 7.2 MtCO 2 e despite a fall<br />
in average price, with forestry still driving <strong>the</strong> bulk of<br />
domestic project development. Seeds of growth were<br />
planted in <strong>the</strong> region, with governments in Acre (Brazil),<br />
Colombia, and Chile signing agreements with VCS<br />
to establish stronger frameworks for <strong>the</strong>ir domestic<br />
carbon markets, and Mexico passing a law to pursue<br />
a domestic emissions trading scheme. Latin American<br />
projects contracted a large proportion of <strong>the</strong>ir offsets<br />
to European buyers, with only a smattering of Latin<br />
American offset buyers in <strong>the</strong> game.<br />
Regulated under <strong>the</strong> European Union Emissions<br />
Trading Scheme and broader Kyoto Protocol commitments,<br />
projects in EU member states supplied a<br />
modest 1.4 MtCO 2 e of offsets in 2012, continuing for<br />
<strong>the</strong> most part to be a source of voluntary offset demand<br />
ra<strong>the</strong>r than supply. On <strong>the</strong> demand side, buyers<br />
in <strong>the</strong> United Kingdom and o<strong>the</strong>r major European<br />
countries continued to show a strong appetite offsets<br />
from abroad, securing a total of 43.4 MtCO 2 e offsets<br />
in 2012, with over half of those offsets sourced from<br />
projects in Asia.<br />
Caveats and Conclusions: The Year Ahead<br />
As seen in <strong>the</strong> mosaic of project types, regional trends,<br />
and unpredictable drivers of offset demand presented<br />
in this summary of our 2013 State of <strong>the</strong> Voluntary<br />
Carbon Markets report, voluntary buyers are a source of<br />
demand for differentiated products that are purchased<br />
on <strong>the</strong> basis of dozens of decision points. These criteria<br />
include offset supplier reputation, perceived offset<br />
quality, and, more broadly, <strong>the</strong> health of <strong>the</strong> buyer’s<br />
business, <strong>the</strong> economy, and <strong>the</strong>ir previous experience<br />
with offset programs.<br />
Because of <strong>the</strong> market’s lack of liquidity and predictability,<br />
historical trends presented in this report should<br />
be viewed only as a starting point for understanding<br />
demand in <strong>the</strong> current year – which continues to evolve<br />
as both offset buyers and suppliers innovate new ways<br />
to mitigate GHGs, infl uence policy, and communicate<br />
<strong>the</strong>ir purchases and successes.<br />
Already in 2013, major organizations ranging from<br />
Microsoft to <strong>the</strong> United Nations Environment Programme<br />
have renewed or made new offsetting commitments,<br />
with Microsoft and The Walt Disney Company both<br />
introducing an internal carbon price on operations to<br />
pay for offset purchases. On <strong>the</strong> “sell” side, programs<br />
like <strong>the</strong> UN Foundation’s Global Alliance for Clean<br />
Cookstoves and campaigns Code REDD and Whole<br />
World Water are expanding <strong>the</strong>ir efforts to raise public<br />
awareness of voluntary carbon fi nance’s contributions<br />
to forest conservation and sustainable development.<br />
Meanwhile, offset suppliers are experimenting with<br />
crowd -funding, collective purchase auctions, and<br />
wrapping inexpensive issued offsets with forward sales<br />
of offsets from early-stage projects – to support both<br />
existing and future offset project development.<br />
Offset suppliers remain concerned that <strong>the</strong> collapse<br />
of an EU carbon price and exclusion of a host of CDM<br />
projects post-2012 will channel an oversupply of<br />
compliance instruments into <strong>the</strong> voluntary markets. In<br />
2012, Ecosystem Marketplace tracked less than 1<br />
MtCO 2 e of CDM offsets (“CERs”) sold to voluntary<br />
buyers – typically from unique projects and locations<br />
and at prices similar to those paid to traditional<br />
voluntary projects. We will continue to closely track<br />
<strong>the</strong>se developments throughout <strong>the</strong> year.<br />
While concerns about <strong>the</strong> fate of millions of CERs<br />
drive some suppliers to distance <strong>the</strong>mselves and<br />
<strong>the</strong>ir products from <strong>the</strong> Kyoto offset market, o<strong>the</strong>rs are<br />
focus ing on connecting with emerging compliance<br />
programs – in California, Australia, South Africa,<br />
China, and various jurisdictions in Latin America. Here,<br />
offset infra structure providers and market participants<br />
are working to bridge <strong>the</strong> gap between voluntary and<br />
compliance programs. As some offsetting activities<br />
in <strong>the</strong>se regions shift from voluntary “pre-compliance”<br />
preparations to full-blown compliance market participation,<br />
fi ndings around market size and make-up in<br />
this report series will no doubt change substantially in<br />
future editions.<br />
In <strong>the</strong> midst of this dynamic marketplace, voluntary<br />
offset market players are also changing <strong>the</strong>ir pitch<br />
– from simply offsetting carbon emissions to relating<br />
<strong>the</strong>ir on-<strong>the</strong>-ground experience to broader policy and<br />
corporate sustainability objectives.<br />
This involves highlighting <strong>the</strong> offset project market’s<br />
potential for rapid response to mitigation opportunities<br />
that can supplement slower-moving fund-based<br />
actions. Some market players are focused on<br />
communicating lessons learned about verifi cation<br />
and results-based fi nance models. Still o<strong>the</strong>rs are<br />
develop ing a new lexicon around <strong>the</strong> delivery of<br />
vulnerability reduction, health, and o<strong>the</strong>r public<br />
benefi ts associated with private sector interventions.<br />
Through a combination of <strong>the</strong>se and o<strong>the</strong>r efforts to<br />
raise <strong>the</strong> offset product market profi le, suppliers strive<br />
to remain relevant as climate policy makers target<br />
ever-more scalable solutions.
Table of Contents<br />
Table of Contents and Figures<br />
State of <strong>the</strong> Voluntary Carbon Markets 2013 xv<br />
Executive Summary v<br />
Voluntary Offset Demand Tops 100 Million Tonnes, Market Value Down 11% vii<br />
Market Outlook: Steady as She Goes x<br />
Project Type: <strong>Forest</strong>ry Regains Ground While Cookstove Projects Heat Up x<br />
Project Certifi cation: Standards Expand Scope, Seek Scale xii<br />
Project Location: Asia, Oceania Markets Grow on Trees xii<br />
Caveats and Conclusions: The Year Ahead xiv<br />
Table of Contents and Figures xv<br />
Defi nitions and Glossary xix<br />
Introduction 1<br />
Methodology: Frequently Asked Questions 2<br />
Voluntary Carbon Offsetting 101 5<br />
1. Market Overview: Volume and Value 9<br />
1.1 Offset Retirement: Walking <strong>the</strong> Talk 12<br />
1.2 Profi t Status: Suppliers by Sector 13<br />
1.3 Value Chain: From Supplier to Buyer 14<br />
1.4 O<strong>the</strong>r Supplier Types: Exchanges and Auctions 17<br />
2. Offset Origins: Type, Place, and Time 18<br />
2.1 Project Type: Technologies and Techniques 19<br />
2.2 Offset Price by Project Type 25<br />
2.3 Project Location: Offsets at Home and Abroad 27<br />
2.4 Offset Uniqueness: O<strong>the</strong>r Dimensions of Demand 29<br />
3. Market Infrastructure: Standards and Registries 33<br />
3.1 Third-Party Offset Project Standards and Certifi cations 34<br />
3.2 Third-Party Standards Usage in 2012 36<br />
3.3 Offset Prices by Standard Utilized 39<br />
3.4 Offset Prices by Standard and Project Stage 40<br />
3.5 Offset Project Registries: Tracking <strong>the</strong> Trades 41<br />
3.6 Registry-<strong>Report</strong>ed Activity in 2012 43<br />
4. Details of <strong>the</strong> Deals: Buyers and Contract Structures 45<br />
4.1 Who Buys Offsets? 46<br />
4.2 Which Business Sectors Actively Offset Their Emissions? 48<br />
4.3 What Motivated Offset Buyers in 2012? 50<br />
4.4 Are Companies Considering Their Supply Chain in Offset Purchase or Project Investment Decisions? 52<br />
4.5 Where Are Offset Buyers Located? 53<br />
4.6 What Were <strong>the</strong> Terms of Payment and Offset Delivery? 55<br />
Table of Contents and Figures
xvi State of <strong>the</strong> Voluntary Carbon Markets 2013<br />
Table of Contents and Figures<br />
5. Regional Market Deep Dive: Where’s, Who’s, and How’s of Voluntary Offsetting in 2012 57<br />
5.1 Introduction 58<br />
5.2 Explanation of Figures 58<br />
5.3 Asia: Branching Out from Renewables 58<br />
5.4 North America: Domestic Programs Shape <strong>the</strong> Market 61<br />
5.5 Latin America: REDD Rebounds But Prices Lag 67<br />
5.6 Africa: Record Activity, Regulations Move Market Forward 69<br />
5.7 Oceania: Suppliers Operate in <strong>the</strong> Shadow of Compliance Markets 72<br />
5.8 EU and Non-EU Europe: EU Demand Soars, Turkey Standards Shift 73<br />
6. Projections: Striking a New Balance 77<br />
6.1 Suppliers’ Market Projections: Summary 77<br />
6.2 Supplier Estimate Details 78<br />
6.3 Predicted Standard Utilization 78<br />
6.4 The Year Ahead: Striking a New Balance 79<br />
ANNEX 1: Standards 82<br />
A.1.1 Carbon Project Accounting Standards 83<br />
A.1.2 Project Co-Benefi ts Programs 87<br />
A.1.3 Domestic (Country- or Region-Specifi c) Programs 88<br />
A.1.4 Standards to Watch 91<br />
A.1.5 O<strong>the</strong>r Programs 92<br />
ANNEX 2: Registries and Registry Infrastructure Providers 95<br />
ANNEX 3: Offset Supplier Directory 96<br />
Sponsors and Supporters 101<br />
Table of Boxes<br />
BOX 1: Make or Break – Implications of CDM Market Developments for Voluntary Offset Supply and Demand 16<br />
BOX 2: The Market for Offsets from Clean Cookstove Distribution: Some Like It Hot 23<br />
BOX 3: California Activity Steady, While Prices on <strong>the</strong> Rise 63<br />
Table of Figures<br />
Figure 1: Historical Offset Demand by Transacted Volume, All Voluntary Carbon Markets vi<br />
Figure 2: Historical Market Share, Transacted Volume by Payment Method vii<br />
Figure 3: Transacted Volume and Average Price by Buyer and Seller Types viii<br />
Figure 4: Transacted Volume, Value, and Average Price by Buyer Region viii<br />
Figure 5: Transacted Volume by Vintage and Buyer Type ix<br />
Figure 6: Market Projections, Historical Data and Supplier Predictions ix<br />
Figure 7: Transacted Volume by Project Category x<br />
Figure 9: Market Share by Project Standard xi<br />
Figure 8: Market Share by Project Type xi<br />
Figure 10: Flow of Transacted Volumes by Offset Supplier and Buyer Region xiii<br />
Figure 11: Response Rate Distribution by Offset Supplier Country Location 3
State of <strong>the</strong> Voluntary Carbon Markets 2013 xvii<br />
Figure 12: The Voluntary Carbon Markets Value Chain 7<br />
Figure 13: Historical Offset Demand by Transacted Volume, All Voluntary Carbon Markets 11<br />
Figure 14: Historical Offset Demand by Market Value, All Voluntary Carbon Markets 11<br />
Figure 15: Transacted Volume by Average Price 12<br />
Figure 16: Historical Voluntary Offset Retirements 13<br />
Figure 17: Cumulative Response Count by Supplier Profi t Status, All Survey Years 13<br />
Figure 18: Market Share and Average Price by Offset Supplier Profi t Status 14<br />
Figure 19: Market Share by Project Category and Offset Supplier Profi t Status 14<br />
Figure 20: Market Share by Supplier Role, 2011-2012, and Average Price 15<br />
Figure 21: Transacted Volume and Average Price by Buyer and Seller Types 15<br />
Figure 22: Market Share by Offset Transaction Platform 17<br />
Figure 23: Transacted Volume by Project Category 20<br />
Figure 24: Market Share by Project Type 20<br />
Figure 25: Historical Transaction Volumes, VCS+CCB and O<strong>the</strong>r <strong>Forest</strong>ry Standards 21<br />
Figure 26: Transacted Volume and Average Price by Cookstove Carbon Project Standard 24<br />
Figure 27: Transacted Volume and Average Price by Buyer and Seller Types, <strong>Forest</strong>ry Offsets 26<br />
Figure 29: Transacted Volume and Average Price by Project Type 26<br />
Figure 28: Transacted Volume and Average Price by Buyer and Seller Types, Renewables Offsets 26<br />
Figure 30: Change in Transacted Volume and Average Price by Project Type, 2011-2012 27<br />
Figure 31: Change in Transacted Volume and Average Price by Project Region, 2011-2012 28<br />
Figure 32: “Uniqueness” Preference: Comparison of Historical Transaction Volumes from Popular Project Types 30<br />
Figure 33: Market Share by Independent Third-Party Carbon Project Standard 36<br />
Figure 34: Market Share by Co-benefi ts Standard or Project Area Label 37<br />
Figure 35: Market Share by Domestic Project Standard 38<br />
Figure 36: Transacted Volume and Average Price by Various Project Standards and Certifi cations, 2011 39<br />
Figure 37: Transacted Volume and Average Price by Various Project Standards and Certifi cations, 2012 40<br />
Figure 38: Market Share and Average Price by Project Stage, Popular Project Types 2011-2012 41<br />
Figure 39: Market Share of Issued Offsets by Registry 42<br />
Figure 40: Number of Registered Projects by Project Category 42<br />
Figure 41: Market Share by Buyer Organization Type 47<br />
Figure 42: Transacted Volume Sold to and by Retailers 49<br />
Figure 43: Market Share by Buyer Sector 49<br />
Figure 44: Buyer Sectors’ Demand by Project Category 52<br />
Figure 45: Transacted Volume, Value and Average Price by Buyer Region 53<br />
Figure 46: Historical Market Share, Transacted Volume by Payment Method 55<br />
Figure 47: Transacted Volume by Vintage and Buyer Type 55<br />
Figure 48: Flow of Transacted Volumes by Offset Supplier and Buyer Region 59<br />
Figure 49: Issued, Transacted, Retired Volumes and Average Price by Vintage: Asia 60<br />
Figure 50: Issued, Transacted, Retired Volumes and Average Price by Vintage: North America 62<br />
Figure 51: Change in Transacted Volume and Average Price, California Offset Types, 2011-2012 63<br />
Figure 52: Projected California Offset Demand and Supply, Supplier-<strong>Report</strong>ed, CAR Registered Projects’<br />
Offsets Pipeline, and ACR-Estimated Technical Capacity for Emissions Reductions, 2013-2017 65<br />
Figure 53: Survey Respondents’ Estimated 5-Year California Offset Pipeline by Project Type, 2013-2017 66<br />
Figure 54: Issued, Transacted, Retired Volumes and Average Price by Vintage: Latin America 68<br />
Figure 55: Issued, Transacted, Retired Volumes and Average Price by Vintage: Africa 70<br />
Figure 56: Market Projections, Historical Data and Supplier Predictions 77<br />
Figure 57: Market Projections, Supplier-Estimated Project Pipeline Volume and Value, 2013-2017 78<br />
Figure 58: Market Projections, Supplier-Estimated Standard Utilization, 2013 79<br />
Table of Contents and Figures
xviii State of <strong>the</strong> Voluntary Carbon Markets 2013<br />
Table of Contents and Figures<br />
Table of Tables<br />
Table 1: Historical Transaction Volumes, All Voluntary Carbon Markets vi<br />
Table 2: Basic Project Cycle by Popular Standards 6<br />
Table 4: Historical Transaction Volumes, VCS+CCB and O<strong>the</strong>r <strong>Forest</strong>ry Standards 22<br />
Table 5: Number of Gold Standard Projects and Estimated Annual Reductions by Project Region 24<br />
Table 6: Number of Gold Standard Projects and Estimated Annual Reductions by Stage 24<br />
Table 7: Transaction Volume and Average Price by Projects’ Estimated Annual Reductions 29<br />
Table 8: “Uniqueness” Preference: Annual Change in Volume, Price, Number of Transactions,<br />
Project Locations and Most Common Project Size for Popular Project Types 30<br />
Table 9: Offset Issuance and Retirement by Registry, Historical and 2012 43<br />
Table 10: Buyer Profi le: BP Target Neutral 48<br />
Table 11: Buyer Profi le: Volcom, Inc. 50<br />
Table 12: Offset End Users’ Top Offsetting Motivations 51<br />
Table 13: Buyer Profi le: Interface, Inc. 51<br />
Table 14: Volume and Value Transacted by Buyer Region and Top Country Locations 54<br />
Table 15: Transacted Volume and Average Price by Payment and Delivery Terms 56<br />
Table 16: Asia by <strong>the</strong> Numbers 60<br />
Table 17: Asia: Transacted Ofset Types and Offset Buyers 61<br />
Table 18: North America by <strong>the</strong> Numbers 61<br />
Table 19: North America: Transacted Offset Types and Offset Buyers 62<br />
Table 20: Latin America by <strong>the</strong> Numbers 67<br />
Table 21: Latin America: Transacted Offset Types and Offset Buyers 69<br />
Table 22: Africa by <strong>the</strong> Numbers, 2012 69<br />
Table 23: Africa: Transacted Offset Types and Offset Buyers 71<br />
Table 24: Oceania by <strong>the</strong> Numbers 72<br />
Table 25: Europe by <strong>the</strong> Numbers 73<br />
Table 26: Non-EU Europe by <strong>the</strong> Numbers 74<br />
Table 27: Carbon and Co-benefi ts Programs: Where to Find Them 94<br />
Table 28: Registry Infrastructure Providers 95
Definitions and Glossary<br />
Additionality Requirement that emissions reductions claimed as offsets<br />
must go above and beyond emissions reductions that could have been<br />
achieved under a business-as-usual scenario. Methods of gauging<br />
additionality include regulatory, fi nancial, barriers and common<br />
practice tests, and can be applied at <strong>the</strong> project level (project-based<br />
approach) or across a project category (standardized approach).<br />
Baseline The estimate of greenhouse gas emissions, population,<br />
gross domestic product, common practice, and o<strong>the</strong>r factors that<br />
describe <strong>the</strong> “business-as-usual” scenario that would have occurred<br />
without implementation of <strong>the</strong> carbon project activity.<br />
Carbon Offset In this report series, a carbon offset is defi ned as an<br />
instrument representing <strong>the</strong> reduction, avoidance or sequestration of<br />
one metric tonne of CO or greenhouse gas equivalent.<br />
2<br />
Compliance Carbon Markets Marketplaces through which regulated<br />
entities obtain and surrender emissions permits (allowances) or offsets<br />
in order to meet predetermined regulatory targets. In <strong>the</strong> case of capand-trade<br />
programs, participants – often including both emitters<br />
and fi nancial intermediaries – are allowed to trade allowances in<br />
order to make a profi t from unused allowances or to meet regulatory<br />
requirements.<br />
Co-Benefi ts Additional environmental, social, or o<strong>the</strong>r benefi ts arising<br />
from a carbon project that are quantifi ed based on metrics or indicators<br />
defi ned by <strong>the</strong> project developer; a co-benefi ts certifi cation program;<br />
or third-party carbon project standard that accounts for both climate<br />
and co-benefi ts. Some registries and standards enable co-benefi ts<br />
certifi cation to be “tagged” onto issued carbon offsets, if quantifi cation<br />
and verifi cation of co-benefi ts are not already embedded in a carbon<br />
project standard.<br />
Emissions Scopes Scope 1 emissions encompass all direct<br />
greenhouse gas emissions. Scope 2 emissions cover indirect<br />
emissions from consumption of purchased electricity, heat, or steam.<br />
Scope 3 emissions represent indirect emissions from outstanding<br />
sources left out of Scope 2, including extraction and production of<br />
purchased materials and fuels, electricity-related activities, transport<br />
activities in vehicles not owned/controlled by <strong>the</strong> reporting entity,<br />
outsourced activities, and waste disposal.<br />
Issuance / Issued Offsets Once a carbon offset project has been<br />
validated, verifi ed, and undergone o<strong>the</strong>r required processes, carbon<br />
offsets can be issued to <strong>the</strong> project owner with a unique identifi er; and<br />
tracked, transferred, and retired by a designated registry.<br />
Primary and Secondary Markets The primary market for carbon<br />
offsets is defi ned as <strong>the</strong> initial transaction of offsets from <strong>the</strong> project<br />
developer to <strong>the</strong> fi rst buyer in line – this can be an offset retailer or<br />
wholesaler (i.e., <strong>the</strong> “secondary market”) or a buyer of offsets for<br />
“end use” (i.e., end user or end buyer) in <strong>the</strong> voluntary or compliance<br />
carbon offset markets.<br />
Registry A registry issues, holds, and transfers carbon offsets, which<br />
are given unique serial numbers to track <strong>the</strong>m throughout <strong>the</strong>ir lifetime<br />
and can also retire offsets. In compliance markets, each scheme has its<br />
State of <strong>the</strong> Voluntary Carbon Markets 2013 xix<br />
AAUs Assigned Amount Units<br />
ACR American Carbon Registry<br />
AFOLU<br />
Agriculture, <strong>Forest</strong>ry, and<br />
O<strong>the</strong>r Land Use<br />
A/R Afforestation/Reforestation<br />
ARB<br />
California Air Resources<br />
Board<br />
CAR Climate Action Reserve<br />
CBEEX<br />
CCB<br />
CCER<br />
China Beijing Environment<br />
and Energy Exchange<br />
Climate, Community &<br />
Biodiversity Standards<br />
Chinese Certifi ed Emission<br />
Reduction<br />
CCO California Carbon Offset<br />
CCX Chicago Climate Exchange<br />
CDM<br />
Clean Development<br />
Mechanism<br />
CDM EB CDM Executive Board<br />
CER Certifi ed Emission Reduction<br />
CFI Carbon Farming Initiative<br />
CRT Climate Reserve Tonne<br />
CSR<br />
Corporate Social<br />
Responsibility<br />
CTX Carbon Trade Exchange<br />
DOE Designated Operational Entity<br />
EU ETS<br />
FPIC<br />
European Union Emissions<br />
Trading Scheme<br />
Free, Prior and Informed<br />
Consent<br />
FSC <strong>Forest</strong> Stewardship Council<br />
GHG Greenhouse Gas<br />
GS The Gold Standard<br />
IFM<br />
Improved <strong>Forest</strong><br />
Management<br />
Defi nitions and Glossary
xx State of <strong>the</strong> Voluntary Carbon Markets 2013<br />
Defi nitions and Glossary<br />
own designated registry. In <strong>the</strong> voluntary market, <strong>the</strong>re are independent<br />
registries available.<br />
Retirement The point at which a carbon offset that is purchased<br />
voluntarily is permanently set aside by its owner in a designated<br />
registry – effectively taking <strong>the</strong> carbon offset’s unique serial number<br />
out of circulation. Retiring offsets through a registry ensures that <strong>the</strong>y<br />
cannot be re-sold – which is of particular importance if <strong>the</strong> buyer’s<br />
intent is to claim <strong>the</strong> offsets’ emissions reductions against a carbon<br />
reduction or neutrality target.<br />
Suppressed Demand A situation where access to energy services<br />
is insuffi cient due to poverty or lack of access to modern energy<br />
infrastructure to meet stakeholders’ needs (i.e., <strong>the</strong>ir demand for<br />
energy services is “suppressed” by <strong>the</strong>ir circumstances). In <strong>the</strong>se<br />
instances, <strong>the</strong> project baseline may include a scenario where<br />
users’ future emissions are projected to rise above current levels as<br />
development provides access to more carbon-intensive sources of<br />
energy. Typically based on survey research, <strong>the</strong> project assumes a<br />
higher volume of emissions from <strong>the</strong> project area in <strong>the</strong> future and<br />
thus receives a larger volume of offsets for avoiding future emissions<br />
by enabling project stakeholders to “leapfrog” to a clean energy<br />
technology fi rst.<br />
Standard A set of project design, monitoring, and reporting criteria<br />
to which carbon offsetting activities and/or projects’ environmental,<br />
social, and o<strong>the</strong>r co-benefi ts can be certifi ed or verifi ed. In<br />
<strong>the</strong> voluntary markets, a number of competing standards have<br />
emerged with <strong>the</strong> intent to increase credibility in <strong>the</strong> marketplace.<br />
More recently, national and sub-national regulated markets have<br />
also designed standards specifi c to regional needs, for voluntary<br />
or regulatory use.<br />
Tagged Offsets / “Tagging” When an offset is verifi ed as delivering<br />
carbon benefi ts via a carbon accounting standard – and <strong>the</strong>n also<br />
verifi ed to deliver co-benefi ts – <strong>the</strong> co-benefi ts certifi cation is formally<br />
layered onto <strong>the</strong> offset in a registry system.<br />
Transaction(s) We consider “transactions” to occur at <strong>the</strong> point that<br />
offsets are contracted or suppliers o<strong>the</strong>rwise agree to deliver offsets<br />
immediately or in <strong>the</strong> future.<br />
Validation The approval of carbon offset projects in <strong>the</strong>ir planning<br />
stages, when projects must submit for approval information on project<br />
design, including information on baseline scenarios, monitoring<br />
schemes and methodologies for calculating emissions reductions.<br />
Verifi cation The process of verifying emissions offsets generated<br />
by an offset project to a particular standard, which quantifi es <strong>the</strong><br />
amount of actual emissions reductions to guarantee that this amount<br />
aligns with <strong>the</strong> number of offsets to be issued to <strong>the</strong> project; or to<br />
verify <strong>the</strong> delivery of a project’s stated environmental, social, and<br />
o<strong>the</strong>r co-benefi ts.<br />
Voluntary Carbon Market The voluntary carbon marketplace encompasses<br />
all transactions of carbon offsets that are not purchased with<br />
<strong>the</strong> intention to surrender into an active regulated carbon market. It<br />
does include offsets that are purchased with <strong>the</strong> intent to re-sell or<br />
retire to meet carbon neutral or o<strong>the</strong>r environmental claims.<br />
Voluntary (or Verifi ed) Emissions Reductions (VERS) General term<br />
for offsets transacted in <strong>the</strong> voluntary carbon markets.<br />
J-CDM<br />
J-VER<br />
K-VER<br />
Japan Clean Development<br />
Mechanism<br />
Japan Verifi ed Emissions<br />
Reduction<br />
Korea Verifi ed Emissions<br />
Reduction<br />
KYC Know Your Client<br />
LDC Least-Developed Country<br />
MRV<br />
MtCO 2 e<br />
NCOS<br />
Monitoring, <strong>Report</strong>ing, and<br />
Verifi cation<br />
Million Metric Tonnes of<br />
Carbon or Carbon Equivalent<br />
National Carbon Offset<br />
Standard (AU)<br />
ODS Ozone-Deleting Substance<br />
OPRs Offset Project Registries<br />
OTC Over <strong>the</strong> Counter<br />
PDD Project Design Document<br />
PFSI<br />
Permanent <strong>Forest</strong> Sink<br />
Initiative<br />
PIN Project Idea Note<br />
REC<br />
REDD<br />
SALM<br />
UNFCCC<br />
Renewable Energy<br />
Certifi cate<br />
Reduced Emissions from<br />
Deforestation and <strong>Forest</strong><br />
Degradation<br />
Sustainable Agricultural Land<br />
Management<br />
United Nations Framework<br />
Convention on Climate<br />
Change<br />
VCM Voluntary Carbon Markets<br />
VCS Verifi ed Carbon Standard<br />
VER Verifi ed Emission Reduction<br />
VCU Verifi ed Carbon Units<br />
WCC Woodland Carbon Code<br />
WCI Western Climate Initiative
A mosaic is made up of many unique pieces that can<br />
be valued as a whole and for <strong>the</strong> uniqueness that<br />
each piece contributes to <strong>the</strong> bigger picture. What<br />
better way to understand <strong>the</strong> market for voluntary<br />
carbon offsetting than by appreciating <strong>the</strong> world’s<br />
many distinctive approaches to market-based climate<br />
action, both individually and as <strong>the</strong> sum of <strong>the</strong>ir parts?<br />
The mosaic of global offsetting trends is, by nature,<br />
a work in progress. Over <strong>the</strong> seven years that <strong>Forest</strong><br />
<strong>Trends</strong>’ Ecosystem Marketplace and Bloomberg<br />
New Energy Finance have tracked this marketplace,<br />
voluntary actors continue to build upon <strong>the</strong> original<br />
picture laid by those that conceptualized a truly global<br />
carbon market. This once-unifi ed market concept has<br />
evolved into localized climate solutions as <strong>the</strong> public<br />
and private sectors reimagine <strong>the</strong> most effective ways<br />
to price carbon.<br />
This trend was recently seen in <strong>the</strong> World Bank’s notable<br />
shift from tracking <strong>the</strong> State and <strong>Trends</strong> of <strong>the</strong> Carbon<br />
Markets to Mapping Carbon Pricing Initiatives among<br />
40 nations and 20 jurisdictions that are pricing carbon<br />
by differentiated means. Uniqueness, innovation,<br />
and business and community relevance have long<br />
been goals of voluntary carbon market programs and<br />
actors, which are increasingly called upon to support<br />
emerging domestic carbon initiatives in jurisdictions<br />
ranging from South Africa to California to Costa Rica.<br />
But companies, not countries, remain <strong>the</strong> driving<br />
source of voluntary offset demand – with <strong>the</strong>ir appetite<br />
to support ever-more innovative environmental<br />
projects, couched in increasingly complex resultsbased<br />
frameworks. Even <strong>the</strong> potential for voluntary<br />
Michael Jenkins<br />
President and CEO<br />
<strong>Forest</strong> <strong>Trends</strong><br />
Introduction<br />
State of <strong>the</strong> Voluntary Carbon Markets 2013 1<br />
offset demand adds a larger number of greenhouse<br />
gas mitigation approaches, guiding standards, project<br />
locations, and offset suppliers to <strong>the</strong> market mosaic,<br />
and, ultimately, to our tracking efforts every year.<br />
This annual report is a signifi cant part of <strong>Forest</strong><br />
<strong>Trends</strong>’ endeavor to facilitate transparency and a fl ow<br />
of information about <strong>the</strong>se individual efforts and <strong>the</strong>ir<br />
effi cacy as a whole.<br />
Its creation requires outreach to hundreds of<br />
organizations that willingly take <strong>the</strong> time to complete<br />
our surveys and, for some, participate in detailed<br />
interviews. The outcome is this analysis, which we<br />
hope, as <strong>the</strong> only report of its kind, continues to<br />
provide vital perspectives on voluntary offset supply,<br />
prices, demand, market infrastructure, and places and<br />
people engaged in voluntary carbon fi nance.<br />
Despite tremendous efforts to contact and collect data<br />
from as many suppliers as possible, we are acutely<br />
aware of <strong>the</strong> limitations of survey-based analysis.<br />
We caution readers to understand our reporting<br />
methodology and to consider reported numbers as<br />
conservative.<br />
We hope this report will continue to inspire suppliers<br />
to share data and we thank those who contributed<br />
data for fostering a more transparent and effective<br />
marketplace.<br />
Throughout 2013, Ecosystem Marketplace will track<br />
trends and questions fi rst illuminated in this report. If<br />
you have questions about content or supporting <strong>the</strong><br />
production of this type of analysis, please contact us<br />
at: info@ecosystemmarketplace.com.<br />
Molly Peters-Stanley<br />
Associate Director<br />
Ecosystem Marketplace<br />
Introduction
2 State of <strong>the</strong> Voluntary Carbon Markets 2013<br />
Methodology: Frequently Asked Questions<br />
Methodology: Frequently Asked Questions<br />
How Does This <strong>Report</strong> Define “Voluntary” Offsetting?<br />
In this report, <strong>the</strong> term “voluntary offsetting”<br />
and“voluntary carbon markets” refers to all purchases<br />
of carbon offsets not driven by an existing regulatory<br />
compliance obligation. This includes transactions<br />
of offsets created specifi cally for voluntary buyers<br />
(Verifi ed Emission Reductions – VERs), as well as<br />
regulatory market offsets or allowances that buyers<br />
voluntarily purchase to offset <strong>the</strong>ir emissions. It also<br />
includes preemptive transactions of offsets to prepare<br />
for future compliance obligations (“pre-compliance”).<br />
How Does This <strong>Report</strong> Define a Transaction?<br />
We consider “transactions” to occur at <strong>the</strong> point that<br />
offsets are contracted; or suppliers o<strong>the</strong>rwise agree<br />
to deliver offsets immediately or in <strong>the</strong> future; or when<br />
suppliers agree to retire an offset on someone’s behalf<br />
based on a donation model. Payment and delivery of<br />
offsets can occur simultaneously (“spot” transaction);<br />
payment can occur immediately (“pre-pay”) or upon<br />
delivery (“pay on delivery”) of offsets that will be generated<br />
from future emissions reductions; contracts<br />
can defi ne a specifi c volume of offsets to deliver<br />
(“fi rm” or “fi xed” delivery), or specify that delivery and<br />
payment are based on <strong>the</strong> volume of offsets that are<br />
actually generated by <strong>the</strong> project in <strong>the</strong> future (“unit<br />
contingent”).<br />
Does This <strong>Report</strong> Track Environmental Impact?<br />
Our analysis examines <strong>the</strong> volume of carbon offsets<br />
transacted in order to chart <strong>the</strong> size of <strong>the</strong> global<br />
marketplace in terms of carbon offsetting and future<br />
project investment. We do not track <strong>the</strong> individual<br />
“lives” of offsets as <strong>the</strong>y pass through <strong>the</strong> value chain.<br />
For example, if a project developer sold an offset to an<br />
offset retailer and <strong>the</strong>n <strong>the</strong> retailer sold <strong>the</strong> same offset<br />
to a fi nal buyer, we count each transaction separately in<br />
order to derive <strong>the</strong> volume and value of transactions in<br />
<strong>the</strong> overall market. This methodology is consistent with<br />
most o<strong>the</strong>r marketplace analysis, such as <strong>the</strong> World<br />
Bank’s annual reports on carbon pricing mechanisms 3 .<br />
We do collect data on <strong>the</strong> volume of offsets retired. This<br />
volume, along with origination numbers, represents<br />
<strong>the</strong> market’s ultimate environmental impact – retired<br />
offsets can no longer be resold and so represent <strong>the</strong><br />
amount of carbon emissions that were confi rmed as<br />
being offset in each year.<br />
Where Does Ecosystem Marketplace’s Market Data<br />
Come From?<br />
Information presented is based on data collected from<br />
offset project developers, wholesalers, brokers, and<br />
retailers, as well as carbon offset accounting registries<br />
and exchanges that track and facilitate <strong>the</strong> transfer of<br />
offsets between owners.<br />
The bulk of data was collected via an online survey<br />
designed for organizations supplying offsets into <strong>the</strong><br />
“over-<strong>the</strong>-counter” (OTC) voluntary carbon market.<br />
The survey was available between January 21 and<br />
April 15, 2013. It was sent to approximately 1,200<br />
organizations identifi ed as possible suppliers and was<br />
distributed through <strong>the</strong> Ecosystem Marketplace news<br />
briefs and Climate-L and <strong>Forest</strong>-L list serves. In <strong>the</strong><br />
same survey, developers of forest carbon and clean<br />
cookstove offset projects were additionally surveyed<br />
for both this report and o<strong>the</strong>r research products,<br />
including <strong>the</strong> State of <strong>the</strong> <strong>Forest</strong> Carbon Markets<br />
2013 report, which require a more extensive projectbased<br />
(vs. transaction-based) survey. In 2012-2013,<br />
Ecosystem Marketplace partnered with <strong>the</strong> Global<br />
Alliance for Clean Cookstoves to disseminate <strong>the</strong><br />
clean cookstove distribution project survey.<br />
We complemented <strong>the</strong> survey with data and insights<br />
provided by major brokerage fi rms such as Evolution<br />
Markets, Armajaro, Amerex, Karbone, and TFS<br />
Energy LLC, as well as registries and exchanges,<br />
including: APX, Inc., Australia’s Clean Energy<br />
Regulator Registry of Offsets Projects, BlueRegistry,<br />
BTAAB Registry, Canadian Standards Association<br />
GHG CleanProjects Registry, CDC Climat, Japan<br />
Verifi ed Emissions Reduction (J-VER) Registry, Korea<br />
GHG Reduction Registry Center, Markit Environmental<br />
Registry, Carbon Trade Exchange (CTX), <strong>the</strong> Chicago<br />
Climate Exchange Offsets Registry Program, Climex,<br />
Tianjin Climate Exchange (TCX), and Santiago Climate<br />
Exchange (SCX).<br />
3 http://documents.worldbank.org/curated/en/2013/05/17751166/mapping-carbon-pricing-initiatives-developments-prospects.
To minimize <strong>the</strong> occurrence of “double-counting”<br />
volumes reported by offset suppliers and brokers, we<br />
asked respondents to specify <strong>the</strong> volume of offsets<br />
transacted through a broker or exchange. When we<br />
identifi ed an overlap, <strong>the</strong> transaction was counted<br />
only once.<br />
How Do You Protect <strong>the</strong> Confidentiality of Survey<br />
Responses?<br />
This report presents only aggregate data. All supplierspecifi<br />
c information is treated as confi dential. Any<br />
supplier-specifi c transaction data mentioned in <strong>the</strong><br />
text was already public information or approved by<br />
<strong>the</strong> supplier. Additionally, we do not identify prices<br />
or volumes from any country, project type, standard,<br />
or vintage for which we had fewer than three data<br />
points to protect <strong>the</strong> confi dentiality of <strong>the</strong> supplier’s<br />
transaction information. We do not share supplier<br />
information with third parties without prior permission<br />
from <strong>the</strong> survey respondent.<br />
What Was This <strong>Report</strong>’s Survey Response Rate in 2013<br />
(Examining <strong>the</strong> 2012 Offset Marketplace)?<br />
Each year, our goal is to identify and collect information<br />
from as many active offset suppliers as possible. It is<br />
No data<br />
1+ responses<br />
5+ responses<br />
10+ responses<br />
15+ responses<br />
State of <strong>the</strong> Voluntary Carbon Markets 2013 3<br />
critical to note that because of <strong>the</strong> fragmented nature<br />
of <strong>the</strong> market and confi dentiality issues surrounding<br />
transaction data, it is impossible to capture all deals.<br />
This year, we received survey information from<br />
320 organizations that supplied carbon offsets to<br />
voluntary buyers in or before 2012. We identifi ed or<br />
communicated with ano<strong>the</strong>r 213 suppliers from our list<br />
that did not transact offsets in 2012, were no longer<br />
selling voluntary carbon offsets, or were no longer in<br />
business. Based on <strong>the</strong> numbers described above as<br />
well as contact will brokers and industry associations,<br />
we estimate that well over two-thirds of active VER<br />
suppliers provided some level of data.<br />
What Was <strong>the</strong> Regional Survey Response Distribution<br />
in 2012?<br />
The largest proportion of survey respondents was<br />
based in <strong>the</strong> US (26% of all respondents). After <strong>the</strong> US,<br />
suppliers based in <strong>the</strong> United Kingdom were again <strong>the</strong><br />
second largest proportion of respondents, followed by<br />
Australia and Brazil.<br />
Taken as a whole, we received <strong>the</strong> largest number of<br />
responses from North American suppliers (93) – in line<br />
with <strong>the</strong> large volume of offsets purchased from <strong>the</strong><br />
Figure 11: Response Rate Distribution by Offset Supplier Country Location, 2012<br />
Source: <strong>Forest</strong> <strong>Trends</strong>’ Ecosystem Marketplace. State of <strong>the</strong> Voluntary Carbon Markets 2013.<br />
Methodology: Frequently Asked Questions
4 State of <strong>the</strong> Voluntary Carbon Markets 2013<br />
Methodology: Frequently Asked Questions<br />
region. The response rate from Europe-based offset<br />
suppliers was close behind (91). Offset suppliers from<br />
emerging markets in developing countries saw ano<strong>the</strong>r<br />
growth year in terms of market participants, tracking<br />
94 responses from organizations headquartered in<br />
Latin America (43), Asia (32), and Africa (19). These<br />
organizations represent 31% of all survey responses,<br />
slightly up from <strong>the</strong> 88 developing country supplier<br />
responses to our 2011 survey. Figure 11 illustrates<br />
regional response rate distribution by country.<br />
While <strong>the</strong> locations of survey somewhat align with<br />
<strong>the</strong> locations of both offset project developers and<br />
resellers (wholesalers, brokers, retailers), we believe<br />
<strong>the</strong>re are dozens of project developers generating<br />
and selling to voluntary buyers across <strong>the</strong> globe that<br />
we were unable to survey. Many of <strong>the</strong>se projects<br />
are represented by reseller responses in <strong>the</strong> survey<br />
and hence Figure 11 does not fully represent <strong>the</strong><br />
distribution of project locations. For this information,<br />
see Chapter 5.<br />
How Do You Calculate Market Share and Aggregate<br />
Volumes?<br />
This year’s survey collected both organization-wide<br />
and transaction-specifi c information. Because all of <strong>the</strong><br />
calculations in this report are weighted by respondents’<br />
transaction volumes to determine <strong>the</strong> signifi cance of<br />
<strong>the</strong>ir response, responses from suppliers who did not<br />
disclose 2012 transaction volumes were not included<br />
in many fi gures, as it could not be ascertained how<br />
signifi cant <strong>the</strong>ir answers were to <strong>the</strong> offset market.<br />
All of <strong>the</strong> calculations in this report are weighted<br />
by respondents’ transaction volumes to determine<br />
<strong>the</strong> signifi cance of <strong>the</strong>ir response. Responses from<br />
suppliers who did not disclose 2012 transaction<br />
volumes were not included in many fi gures, as it could<br />
not be ascertained how signifi cant <strong>the</strong>ir answers were<br />
to <strong>the</strong> offset market. Market share is thus calculated<br />
based only on <strong>the</strong> transaction volume associated<br />
with each question. We do not extrapolate market<br />
share fi ndings to all volumes reported in our survey,<br />
as <strong>the</strong> marketplace is too differentiated to make such<br />
assumptions. Notes at <strong>the</strong> bottom of most fi gures report<br />
<strong>the</strong> transaction volume associated with <strong>the</strong> fi gure.<br />
How Does This <strong>Report</strong> Present Prices and Market<br />
Value?<br />
All offset prices reported in this series are volumeweighted<br />
to determine <strong>the</strong>ir signifi cance. We prioritize<br />
pricing that was reported at <strong>the</strong> transaction level as<br />
more granular and robust than organization-wide<br />
pricing. For organizations that disclosed volume data<br />
but not price data, we used <strong>the</strong> market-wide average<br />
price as a proxy in our monetary valuation of <strong>the</strong><br />
overall market and any variables for which we present<br />
market value.<br />
All fi nancial fi gures presented are reported in US Dollars<br />
unless o<strong>the</strong>rwise noted. The numbers presented<br />
throughout this survey are measured in metric tonnes<br />
of carbon dioxide equivalent (tCO 2 e) or million metric<br />
tonnes of carbon dioxide equivalent (MtCO 2 e).<br />
Do Ecosystem Marketplace Researchers Screen <strong>the</strong><br />
Quality of Offsets <strong>Report</strong>ed in This Survey?<br />
Because <strong>the</strong> aim of this report is to account for all<br />
voluntary payments for emissions reductions, we<br />
do not apply any quality criteria screens for offsets<br />
included in calculations. However, we did follow up<br />
with dozens of respondents to confi rm or clarify survey<br />
responses that were incomplete or raised a red fl ag.<br />
This included any responses that varied signifi cantly<br />
from “typical” market behaviors and thus would also<br />
signifi cantly infl uence market trends. In a few cases<br />
where we were unable to confi rm that transactions<br />
occurred, <strong>the</strong>se responses were omitted.
Voluntary Carbon Offsetting 101<br />
Voluntary Offsetting Motivations and Markets<br />
Voluntary demand for carbon offsets is driven by<br />
companies and individuals that take responsibility<br />
for offsetting <strong>the</strong>ir own emissions (“purely voluntary”<br />
demand), as well as entities that purchase “precompliance”<br />
offsets before emissions reductions are<br />
required by regulation.<br />
Purely voluntary offset buyers are driven by a<br />
variety of considerations related to corporate social<br />
responsibility (“CSR”), ethics, and reputational or<br />
supply chain risk. Pre-compliance buyers speculatively<br />
procure offsets before a compliance carbon<br />
market start date, hoping to obtain a lower price<br />
than what <strong>the</strong> same offset may eventually fetch in <strong>the</strong><br />
compliance program.<br />
Voluntary markets co-exist with compliance offset<br />
markets driven by mandated caps on greenhouse gas<br />
(“GHG”) emissions, which operate at a signifi cantly<br />
larger scale. The most active compliance carbon offset<br />
program is <strong>the</strong> United Nations Clean Development<br />
Mechanism (“CDM”), <strong>the</strong> source of offsets for Kyoto<br />
Protocol Signatory Counties and buyers in <strong>the</strong><br />
European Union Emissions Trading Scheme (“EU<br />
ETS”). See Box 1 for a comparison of CDM and<br />
voluntary offset market size.<br />
What <strong>the</strong> voluntary carbon markets lack in size, <strong>the</strong>y<br />
make up for in fl exibility – spinning off innovations in<br />
project fi nance, monitoring, and methodologies that<br />
also infl uence regulatory market mechanisms. For<br />
example, <strong>the</strong> voluntary carbon market has spawned its<br />
own standards, registries, and project types beyond<br />
<strong>the</strong> scope of existing compliance market mechanisms.<br />
In turn, in recent years governments worldwide<br />
have increasingly turned to voluntary carbon market<br />
mechanisms – particularly standards and registries –<br />
to inform <strong>the</strong> development of or serve as compliance<br />
instruments <strong>the</strong>mselves.<br />
The Project Cycle and Standards<br />
Carbon offset projects are implemented to reduce,<br />
avoid, or sequester greenhouse gases. Each carbon<br />
offset represents one tonne of GHGs reduced that<br />
can <strong>the</strong>n be purchased to cancel out or neutralize a<br />
comparable volume of GHG emissions elsewhere.<br />
State of <strong>the</strong> Voluntary Carbon Markets 2013 5<br />
Project developers create carbon offsets according<br />
to a methodology describing how a project will be<br />
implemented and how climate benefi ts are to be<br />
measured. There are currently dozens of independent<br />
standards offering methodologies that can guide<br />
offset project development. Some standards develop<br />
methodologies internally with support from external<br />
stakeholders. O<strong>the</strong>rs enable external parties to<br />
develop and propose new methodologies which are<br />
subjected to an approval process prior to use.<br />
Project developers engage in several preparatory<br />
steps to project implementation that vary by project<br />
type and methodology requirements. This typically<br />
includes producing a Project Idea Note (“PIN”)<br />
that gives shape to project plans; various project<br />
feasibility, impact, and risk assessments; stakeholder<br />
input sessions; and numerous o<strong>the</strong>r early-stage<br />
preparations.<br />
Once a methodology is available, developers produce<br />
a Project Design Document (“PDD”) that details<br />
project design; anticipated emissions reductions;<br />
plans for quantifying and monitoring <strong>the</strong> delivery of<br />
climate and o<strong>the</strong>r social and environmental benefi ts;<br />
assesses projects’ arguments that <strong>the</strong> project activity<br />
exceeds “business-as-usual” (“BAU”) reductions and<br />
avoids emissions leakage; and o<strong>the</strong>r technical issues.<br />
Validation is <strong>the</strong> process by which a third-party<br />
auditor examines a project’s planning documents and<br />
proposed framework (including <strong>the</strong> PDD), affi rming its<br />
ability to deliver expected outcomes.<br />
Following a period – sometimes years – of project<br />
implementation, monitoring, and documentation,<br />
ano<strong>the</strong>r audit process called verifi cation assesses<br />
<strong>the</strong> delivery of GHG mitigation and any additional “cobenefi<br />
ts”. This confi rms <strong>the</strong> total volume of emissions<br />
that <strong>the</strong> project has reduced over time. After tonnes<br />
are verifi ed, <strong>the</strong>y can be issued by an offset project<br />
registry – which assigns each tonne a unique serial<br />
number that stays with <strong>the</strong> offset as it changes hands<br />
and is ultimately retired.<br />
Offset Retirement<br />
When a buyer desires to retire an offset so that it<br />
can no longer be re-sold, <strong>the</strong> registry designates <strong>the</strong><br />
offset as “retired” in <strong>the</strong> offset owner’s account. Often,<br />
Voluntary Carbon Offsetting 101
6 State of <strong>the</strong> Voluntary Carbon Markets 2013<br />
Voluntary Carbon Offsetting 101<br />
offset suppliers will retire an offset on behalf of <strong>the</strong>ir<br />
buyer without transferring offset ownership to <strong>the</strong>m<br />
and publicly acknowledge <strong>the</strong> offsetter’s name on <strong>the</strong><br />
registry for o<strong>the</strong>rs to see. Offset suppliers may retire<br />
offsets regularly or intermittently in bulk. They may<br />
also choose whe<strong>the</strong>r or not to make this or any registry<br />
information available for public view.<br />
Offsets are typically issued on a registry in order to<br />
be formally retired – to demonstrate that <strong>the</strong> tonne<br />
has been verifi ed as “real” and to enable <strong>the</strong> buyer<br />
to claim that emissions have been neutralized.<br />
While many offset buyers seek issued offsets for<br />
this purpose, some may desire to use <strong>the</strong>ir CSR<br />
resources to catalyze new project development by<br />
supporting earlier-stage activities. Thus, some offsets<br />
are forward-contracted for future delivery once <strong>the</strong><br />
project has successfully verifi ed and issued tonnes.<br />
Both early- and late-stage transactions are tracked in<br />
this report series.<br />
“Over-<strong>the</strong>-Counter” Versus Exchange Contracts<br />
The majority of voluntary offset buyers obtain offsets<br />
through decentralized “over-<strong>the</strong>-counter” (“OTC”)<br />
transactions. These are bilateral contracts between<br />
buyers and sellers that defi ne <strong>the</strong> terms of payment<br />
and offset delivery. A small volume of offsets are also<br />
obtained on private exchanges.<br />
This report primarily focuses on OTC transactions, <strong>the</strong><br />
source of most offset transactions and market value,<br />
as exchange activity is less common. From 2004<br />
Clean Development Mechanism<br />
Project Cycle: Early Stages Project Cycle: Late Stages<br />
PIN –> PDD Design –> Host Country Approval –><br />
Validation –> Registration –><br />
Verifi ed Carbon Standard<br />
Monitoring –> Verifi cation –> Issuance –><br />
Forwarding –><br />
Project Cycle: Early Stages Project Cycle: Late Stages<br />
PIN –> PDD Design –> Validation –><br />
Registration –><br />
The Gold Standard<br />
Monitoring –> Verifi cation –> Issuance –><br />
Transfer of offset ownership –><br />
Project Cycle: Early Stages Project Cycle: Late Stages<br />
PIN –> Local Stakeholder Input & PDD Design –><br />
Stakeholder Consultation Feedback and <strong>Report</strong> –><br />
Validation –> Registration –><br />
Table 2: Basic Project Cycle by Popular Standards<br />
Monitoring –> Verifi cation (Carbon, Sustainability<br />
Monitoring <strong>Report</strong>s) –> Gold Standard Review of Verifi -<br />
cation –> Issuance –> Transfer of Credit Ownership –><br />
Source: Standard website information: http://www.cdmgoldstandard.org/; http://v-c-s.org/; http://cdm.unfccc.int/.<br />
to 2010, however, a signifi cant volume of voluntary<br />
offset transactions occurred on <strong>the</strong> Chicago Climate<br />
Exchange (CCX). The CCX was a cap-and-trade<br />
system that organizations joined voluntarily, making<br />
legally binding commitments to track and reduce <strong>the</strong>ir<br />
GHG emissions. The exchange was launched as a<br />
pilot program and completed its fi nal trades in 2010.<br />
Today, CCX continues to administer a voluntary offset<br />
program and registry.<br />
Voluntary Offset Supply Chain<br />
In compliance carbon markets, formal exchanges<br />
and several layers of intermediaries drive market<br />
liquidity and transparency. In <strong>the</strong> voluntary carbon<br />
markets, <strong>the</strong>re are typically only three layers – project<br />
developers, brokers, and retailers or wholesalers.<br />
The term “offset project developer” is a catch-all<br />
phrase to describe activities that may be carried out<br />
by many different entities. “Project developer” often<br />
(but not always) describes <strong>the</strong> organization that acts<br />
as carbon asset developer – developing concept<br />
and feasibility studies and <strong>the</strong> PDD, and managing<br />
<strong>the</strong> seeing <strong>the</strong> project through validation, monitoring<br />
activities and, ultimately, verifi cation. Depending on<br />
project type and circumstance, this organization may<br />
differ from <strong>the</strong> actual project owner; from local partner<br />
organizations involved in project implementation;<br />
from project fi nanciers/investors; and from <strong>the</strong><br />
organization actually selling offsets to end users.<br />
Additionally, a separate aggregator may pull toge<strong>the</strong>r<br />
several of <strong>the</strong>se disparate functions.
Figure 12: The Voluntary Carbon Markets Value Chain<br />
Broker<br />
Doesnʼt take credit ownership<br />
Project Developer<br />
End Buyer<br />
Reseller<br />
Does take credit ownership<br />
Source: <strong>Forest</strong> <strong>Trends</strong>’ Ecosystem Marketplace.<br />
State of <strong>the</strong> Voluntary Carbon Markets 2013.<br />
Offset retailers do not traditionally manage project<br />
development and documentation. Instead, <strong>the</strong>y contract<br />
with project developers to take ownership of a portfolio<br />
of offsets that <strong>the</strong>y <strong>the</strong>n offer to end users. Because <strong>the</strong>ir<br />
role is more end user-facing, <strong>the</strong>y typically also offer<br />
o<strong>the</strong>r corporate carbon management services that may<br />
also include internal emissions reductions strategies<br />
and public relations tied to <strong>the</strong> overall corporate<br />
environmental strategy – including offset use.<br />
Brokers do not take ownership of offsets, but facilitate<br />
transactions between project developers and end<br />
users; project developers and retailers; and between<br />
retailers. They do this for a fee. There are currently<br />
only a handful of active brokers in <strong>the</strong> voluntary offset<br />
marketplace. When given <strong>the</strong> opportunity, some<br />
retailers will also perform this role, but generally not at<br />
signifi cant volumes.<br />
Throughout this report, <strong>the</strong> initial offset contract<br />
between a project developer and an end user or o<strong>the</strong>r<br />
intermediary is referred to as <strong>the</strong> primary market. The<br />
secondary market consists of transactions between<br />
retailers and retailers, or retailers and offset end buyers.<br />
Offset Buyers and Suppliers: How They Connect<br />
Offset buyers may take one or several available routes<br />
to identify an offset supplier and choose offset types.<br />
Because voluntary offset transactions do not occur<br />
State of <strong>the</strong> Voluntary Carbon Markets 2013 7<br />
on any formal exchange where buyers are easily<br />
identifi ed, offset suppliers report that <strong>the</strong> time required<br />
to fi nd a buyer can be <strong>the</strong> most costly aspect of <strong>the</strong>ir<br />
business. Wait times may range from a few months to<br />
several years.<br />
As seen in Section 4.2, many voluntary offset end use<br />
buyers rely on offset retailers to guide <strong>the</strong>ir decisions<br />
and procure offsets. Buyers may identify an offset<br />
retailer by looking to industry associations like <strong>the</strong><br />
International Carbon Reduction and Offsets Alliance<br />
(ICROA). They may also partner with organizations<br />
and campaigns like <strong>the</strong> Global Alliance for Clean<br />
Cookstoves or <strong>the</strong> Code REDD campaign. Project<br />
developers and retailers engage with <strong>the</strong>se<br />
organizations in order to gain access to end users<br />
through association-based events, introductions,<br />
mailings, and o<strong>the</strong>r outlets for exposure. Project<br />
developers wishing to sell <strong>the</strong>ir offsets to retailers may<br />
pursue commercialization agreements that grant<br />
retailers <strong>the</strong> exclusive right to market projects’ offsets<br />
to <strong>the</strong>ir clients, with some form of return to projects.<br />
Some buyers may assemble advisory committees<br />
of NGOs, third-party carbon offset project standards<br />
and, o<strong>the</strong>r stakeholders to guide <strong>the</strong>ir offset purchase<br />
decisions. They may also identify suppliers from a<br />
company or industry list of approved vendors. Public<br />
Requests for Proposals (RFPs) are ano<strong>the</strong>r approach<br />
whereby end buyers – and in some cases retailers<br />
grappling with large contracts – will issue tenders<br />
specifying <strong>the</strong>ir offset requirements. In some cases<br />
RFPs will be made publicly available online, while in<br />
o<strong>the</strong>r cases <strong>the</strong>y are sent only to project developers<br />
and retailers with which <strong>the</strong> buyer has some<br />
familiarity. Buyers and suppliers may also connect<br />
via international carbon or o<strong>the</strong>r industry-specifi c<br />
conferences, or simply engage in “cold calling.”<br />
An emerging approach taken by offset buyers is to<br />
consider offset project opportunities that address<br />
emissions within <strong>the</strong>ir supply chain or sphere of<br />
infl uence. As discussed in Section 4.3, this may not<br />
always mean that <strong>the</strong> project bears a direct relationship<br />
to buyers’ operations but may be located in a relevant<br />
region or sector – thus helping to narrow <strong>the</strong> fi eld of<br />
offset options.<br />
Market and <strong>Report</strong> Limitations<br />
While companies have voluntarily offset <strong>the</strong>ir emissions<br />
for over two decades, <strong>the</strong> vast majority of this activity<br />
has occurred in <strong>the</strong> last 5 years. Because voluntary<br />
offsetting is largely unregulated but also driven by<br />
corporate climate actions, many self-regulating tools<br />
Voluntary Carbon Offsetting 101
8 State of <strong>the</strong> Voluntary Carbon Markets 2013<br />
Voluntary Carbon Offsetting 101<br />
have quickly emerged that aim to assure buyers of <strong>the</strong><br />
environmental impact of <strong>the</strong>ir purchases.<br />
As such, this marketplace has matured rapidly. However,<br />
demand continues to rest with those actors that have<br />
<strong>the</strong> desire and discretionary income to voluntarily<br />
purchase offsets. In reality, this represents a small<br />
number of buyers and transactions when compared<br />
to <strong>the</strong> volume of trades that occur daily to weekly in a<br />
commoditized, compliance-based carbon market.<br />
In comparison to more active marketplaces, voluntary<br />
buyers are not always at hand and offset prices are<br />
highly stratifi ed and unpredictable, even within similar<br />
classes of offsets. The details of payment and offset<br />
delivery vary tremendously from one project to <strong>the</strong><br />
next, as do <strong>the</strong> projects’ design, risk, start date, and<br />
o<strong>the</strong>r factors that contribute to <strong>the</strong>ir eventual price.<br />
Therefore, to produce a traditional market report that<br />
offers intra-year trading data or forecasts would be<br />
impossible if not misleading.<br />
What this report series aims to offer is a year-on-year,<br />
survey-based exploration of trends in offset supply<br />
and demand – to illuminate disruptive innovations,<br />
emerging or distressed markets, and <strong>the</strong> impact of<br />
broader regulatory, economic, and consumer signals.
<strong>Maneuvering</strong> <strong>the</strong> <strong>Mosaic</strong> State of <strong>the</strong> Voluntary Carbon Markets 2013<br />
1. Market Overview<br />
Volume and Value
10 State of <strong>the</strong> Voluntary Carbon Markets 2013<br />
1. Market Overview: Volume and Value<br />
1. Market Overview: Volume and Value<br />
In 2012, voluntary actors contracted 101 million tonnes<br />
of carbon offsets (MtCO 2 e) for immediate or future<br />
delivery – 4% more than in 2011. The vast majority<br />
of <strong>the</strong>se offset transactions (98 MtCO 2 e) occurred<br />
bilaterally, or “over <strong>the</strong> counter” (OTC) ra<strong>the</strong>r than on<br />
any formal exchange.<br />
This represents <strong>the</strong> second highest level of OTC market<br />
activity ever tracked. The OTC market’s “biggest” year<br />
was in 2010, when <strong>the</strong> market was boosted by a<br />
sizable transaction of offsets generated through <strong>the</strong><br />
voluntary Chicago Climate Exchange (CCX) – which<br />
wound down operations in <strong>the</strong> same year. Despite <strong>the</strong><br />
formal program’s closure, its infl uence is still felt in<br />
<strong>the</strong> North American carbon markets, where voluntary<br />
actors transacted 8.3 MtCO 2 e of CCX offsets in 2012<br />
– pushing <strong>the</strong> voluntary market as whole over <strong>the</strong> onehundred-million-tonne<br />
mark.<br />
2012 KEY FINDINGS<br />
The volume of offsets traded on exchanges hovered<br />
around 2 MtCO 2 e, similar to <strong>the</strong> level activity reported<br />
by exchanges for <strong>the</strong> last four years. All of <strong>the</strong><br />
platforms that reported activity in 2012 – including<br />
<strong>the</strong> Carbon Trade Exchange (CTX), Climex, and<br />
<strong>the</strong> Santiago Climate Exchange (SCX) – are return<br />
respondents, most of which saw modest growth<br />
last year. No new voluntary offset exchanges were<br />
tracked in 2012.<br />
While offset demand grew, market value decreased<br />
11% to $523 million 4 as offset prices fell slightly<br />
for most project types. The sizeable demand for<br />
CCX offsets transacted at an average of $0.1/<br />
tCO 2 e, which did not aid market value. As with offset<br />
volumes, <strong>the</strong> majority of this value was generated by<br />
OTC offset contracts ($516 million) while exchangetraded<br />
offsets were valued at a total of $6.3 million.<br />
• In 2012, voluntary actors contracted 101 million tonnes of carbon offsets (MtCO 2 e) for immediate or<br />
future delivery – 4% more than in 2011. Market value decreased 11% to $523 million.<br />
• 2012’s voluntary actors paid a volume-weighted average price of $5.9/tCO 2 e – down 5% from 2011,<br />
but signifi cantly higher than <strong>the</strong> United Nations’ regulatory Clean Development Mechanism (CDM)<br />
recent record low carbon offset price of $0.16/tCO 2 e.<br />
• Over all of <strong>the</strong> years of market activity tracked in this report series, voluntary buyers have funded 763<br />
MtCO 2 e in emissions reductions worth $3.7 billion and at an average historical price of $5.9/tCO 2 e –<br />
equivalent to <strong>the</strong> 2012 market-wide average offset price.<br />
• Offset project registries report that voluntary actors retired a record volume of offsets in 2012, totalling<br />
close to 20 MtCO 2 e across all certifi cation programs. This is in keeping with <strong>the</strong> ever-growing volume<br />
of offsets that have been verifi ed by auditors and “issued” by registries (66 MtCO 2 e newly issued in<br />
2012 alone) and so are eligible for retirement.<br />
• In 2012, private sector offset suppliers transacted 86% of market volumes (or 81 MtCO 2 e) – regaining<br />
ground lost to non-profi t organizations in 2011.<br />
• Project developers were responsible for generating and selling almost half of all offset volumes in<br />
2012 – valued at $184 million, or about 18% <strong>the</strong> size of <strong>the</strong> primary market for offsets in <strong>the</strong> CDM in<br />
2012 ($1,047 million – see Box 1). Overall, retailers bought or supplied a total of 50 MtCO 2 e valued at<br />
$230 million in 2012, roughly 51% of all transacted offsets and 45% of market value.<br />
• In 2012, our survey tracked less that 1 MtCO 2 e of CERs sold to voluntary buyers – mostly from unique<br />
projects and locations, at prices similar to those paid to traditional voluntary projects.<br />
4 See Methodology section for an explanation of how volume-weighted average prices and value are calculated throughout this report.
A substantial portion of market value (64% of all<br />
volumes reporting contract types or $170 million)<br />
was paid to offset sellers at <strong>the</strong> point of transaction<br />
(ra<strong>the</strong>r than on delivery) – primarily via spot contracts<br />
(35.6 MtCO 2 e, up 25% from 2011) and pre-payment<br />
MtCO 2 e<br />
$ Million<br />
160<br />
140<br />
120<br />
100<br />
80<br />
60<br />
40<br />
20<br />
0<br />
State of <strong>the</strong> Voluntary Carbon Markets 2013 11<br />
for future delivery (8.7 MtCO 2 e, down 1% from 2011).<br />
Ano<strong>the</strong>r $97.5 million will be paid in future years<br />
– if and when <strong>the</strong> projects under contract deliver<br />
verifi able reductions. This dynamic is discussed in<br />
greater detail in Section 4.6.<br />
Figure 13: Historical Offset Demand by Transacted Volume, All Voluntary Carbon Markets<br />
88 M<br />
4<br />
84<br />
32 M<br />
10<br />
21<br />
73 M<br />
23<br />
49<br />
135 M<br />
69<br />
107 M<br />
2<br />
65 64<br />
Notes: Based on 763 MtCO e of offsets transacted and reported to Ecosystem Marketplace over 7 survey years.<br />
2<br />
Source: <strong>Forest</strong> <strong>Trends</strong>’ Ecosystem Marketplace. State of <strong>the</strong> Voluntary Carbon Markets 2013.<br />
$900<br />
$800<br />
$700<br />
$600<br />
$500<br />
$400<br />
$300<br />
$200<br />
$100<br />
$0<br />
41<br />
131 M<br />
2<br />
2<br />
128<br />
97 M<br />
2<br />
95<br />
101 M<br />
2<br />
pre-2006 2006 2007 2008 2009 2010 2011 2012<br />
Over-<strong>the</strong>-counter Chicago Climate Exchange-traded O<strong>the</strong>r exchanges<br />
Figure 14: Historical Offset Demand by Market Value, All Voluntary Carbon Markets<br />
$351<br />
$5<br />
$345<br />
$126<br />
$38<br />
$88<br />
$375<br />
$1<br />
$72<br />
$301<br />
$790<br />
$2<br />
$308<br />
$479<br />
$475<br />
$12<br />
$49<br />
$426<br />
$412 $414<br />
$582<br />
Notes: Based on $3.6 billion in voluntary offset market value transacted and reported to<br />
Ecosystem Marketplace over 7 survey years.<br />
Source: <strong>Forest</strong> <strong>Trends</strong>’ Ecosystem Marketplace. State of <strong>the</strong> Voluntary Carbon Markets 2013.<br />
$11<br />
$586<br />
$4.2<br />
98<br />
$523<br />
$6.3<br />
$516<br />
pre-2006 2006 2007 2008 2009 2010 2011 2012<br />
Over-<strong>the</strong>-counter Chicago Climate Exchange-traded O<strong>the</strong>r exchanges<br />
1. Market Overview: Volume and Value
12 State of <strong>the</strong> Voluntary Carbon Markets 2013<br />
1. Market Overview: Volume and Value<br />
In 2012, voluntary actors paid a volume-weighted<br />
average price of $5.9/tCO 2 e – down 5% from 2011’s<br />
$6.2/tCO 2 e, but signifi cantly higher than <strong>the</strong> United<br />
Nations’ regulatory Clean Development Mechanism<br />
(CDM) carbon offset price of less than a $1/tCO 2 e<br />
as of mid-2013. As demonstrated throughout this<br />
report, last year’s lower average price for voluntary<br />
offset transactions is <strong>the</strong> aggregation of close to 1,000<br />
reported price points that vary greatly by project<br />
standard, location, and technology – ranging from less<br />
than $.1/tCO 2 e to over $100/tCO 2 e in 2011.<br />
Declining prices for voluntary offsetting were most<br />
apparent in <strong>the</strong> high-priced offset range ($10+/tCO 2 e)<br />
where <strong>the</strong> volume of offsets contracted at <strong>the</strong>se prices<br />
fell by 46%. On <strong>the</strong> o<strong>the</strong>r hand, transacted volumes<br />
of offsets at less than $5/tCO 2 e grew by 19%. This<br />
trend is illustrated in Figure 15 which depicts <strong>the</strong><br />
volume of offset transacted for every dollar between<br />
$0-$30/tCO 2 e. Suppliers say this downward trend was<br />
primarily a function of perceived offset oversupply<br />
and knock-on effects of <strong>the</strong> collapse of <strong>the</strong> EU carbon<br />
price.<br />
Over all of <strong>the</strong> years of market activity tracked in<br />
this report series, voluntary buyers have funded 763<br />
MtCO 2 e in emissions reductions worth $3.7 billion<br />
and at an average historical price of $5.9/tCO 2 e –<br />
equivalent to <strong>the</strong> 2012 market-wide average offset<br />
price.<br />
MtCO e 2<br />
14 M<br />
12 M<br />
10 M<br />
8 M<br />
6 M<br />
4 M<br />
2 M<br />
0 M<br />
2012 Avg.<br />
$5.9 2012 / tCO2e Avg.<br />
$5.9/tCO2e<br />
1.1 Offset Retirement: Walking <strong>the</strong> Talk<br />
Organizations seeking to neutralize <strong>the</strong>ir carbon<br />
emissions must ideally “retire” <strong>the</strong> offsets <strong>the</strong>y<br />
purchase – so that offsets can no longer be onsold<br />
to o<strong>the</strong>r market participants and claimed more than<br />
once. Offset registry systems execute this process,<br />
track ing individual offsets as <strong>the</strong>y enter <strong>the</strong> market,<br />
change ownership, and are ultimately retired in <strong>the</strong>ir<br />
systems. See Voluntary Offsetting 101 for more about<br />
this process.<br />
Offset project registries report that voluntary actors<br />
retired a record volume of offsets in 2012, totalling<br />
close to 20 MtCO 2 e across all certifi cation programs.<br />
This is in keeping with <strong>the</strong> ever-growing volume of<br />
offsets that have been verifi ed by auditors and “issued”<br />
by registries and so are eligible for retirement. As of<br />
January 1, 2013, registries had issued over 66 MtCO 2 e<br />
across all programs – ano<strong>the</strong>r market record.<br />
A sizable portion of retired offsets (12.2 MtCO 2 e)<br />
was certifi ed to <strong>the</strong> Verifi ed Carbon Standard (VCS)<br />
program, which also saw <strong>the</strong> largest volume of newly<br />
issued offsets (34.4 MtCO 2 e). This fi nding is discussed<br />
in greater detail in Chapter 3.<br />
The survey that informs this report also tracks <strong>the</strong><br />
subset of offsets that suppliers reported selling and<br />
also retiring in 2012 – totaling 12.7 MtCO 2 e in 2012.<br />
Figure 15: Transacted Volume by Average Price, 2011-2012<br />
$0 $1 $2 $3 $4 $5 $6 $7 $8 $9 $10 $11 $12 $13 $14 $15 $16 $17 $18 $19 $20 $21 $22 $23 $24 $25 $26 $27 $28 $29 $30<br />
Volume by average price, 2011 Volume by average price, 2012<br />
Notes: Based on 1,142 reported transaction prices associated with 74 MtCO 2 e.<br />
Source: <strong>Forest</strong> <strong>Trends</strong>’ Ecosystem Marketplace. State of <strong>the</strong> Voluntary Carbon Markets 2013.
140<br />
120<br />
100<br />
80<br />
60<br />
40<br />
20<br />
Figure 16: Historical Voluntary Offset Retirements<br />
(MtCO 2 e)<br />
0<br />
While this number is lower than total retirement volumes<br />
reported by registries, it is also important to note that<br />
offset suppliers often will not retire offsets in <strong>the</strong> same<br />
year that <strong>the</strong>y are transacted – ei<strong>the</strong>r because <strong>the</strong><br />
offsets have not yet been issued or because <strong>the</strong>y prefer<br />
to retire offsets on behalf of clients all at once, in bulk.<br />
Response Count<br />
21<br />
pre-2006<br />
350<br />
300<br />
250<br />
200<br />
150<br />
100<br />
50<br />
0<br />
6<br />
63 16 16 14 14 18 14 13<br />
2006<br />
pre-2002<br />
33<br />
2007<br />
22<br />
14 16<br />
19<br />
12 13 19 29<br />
2002<br />
51 49<br />
2008<br />
2009<br />
2003<br />
110<br />
2010<br />
2004<br />
79<br />
2011<br />
29<br />
44<br />
2005<br />
86<br />
2012<br />
Total retired Total OTC Est. future retirement<br />
Source: <strong>Forest</strong> <strong>Trends</strong>’ Ecosystem Marketplace.<br />
State of <strong>the</strong> Voluntary Carbon Markets 2013.<br />
67<br />
42<br />
60<br />
2006<br />
State of <strong>the</strong> Voluntary Carbon Markets 2013 13<br />
Thus, some proportion of registry-reported retirements<br />
capture offsets that were transacted before 2012 and<br />
only recently issued and retired.<br />
Ano<strong>the</strong>r question in our survey’s Buyers section asks<br />
suppliers about <strong>the</strong>ir buyers’ motivations to determine<br />
<strong>the</strong> volume of offsets purchased for purely voluntary<br />
purposes that might be retired in <strong>the</strong> future. In 2012,<br />
47% of offsets were transacted by purely voluntary<br />
offset end users. This is illustrated in Figure 16 as <strong>the</strong><br />
“estimated future retirement fi gure”, totaling 67 MtCO 2 e.<br />
1.2 Profit Status: Suppliers by Sector<br />
Carbon offset suppliers are challenged to juggle both<br />
environ mental and fi nancial outcomes in this marketplace,<br />
which uniquely unites <strong>the</strong> realms of philanthropy<br />
and commodity. In this arena, organizations from<br />
all sec tors – private, public, and non-profi t – supply<br />
carbon offsets.<br />
Of <strong>the</strong> 336 respondents that reported a profi t status<br />
in our 2013 survey, private sector suppliers vastly<br />
outnumbered non-profi t suppliers – as <strong>the</strong>y have<br />
since 2005. Suppliers that identifi ed as public sector<br />
organizations were again few in number in 2012, but<br />
represented many levels of government worldwide.<br />
In 2012, private sector offset suppliers transacted 86%<br />
of market volumes (or 81 MtCO 2 e) – regaining ground<br />
lost to non-profi t organizations in 2011. Non-profi t<br />
market share fell from 20% to 14%, even as voluntary<br />
Figure 17: Cumulative Response Count by Supplier Profi t Status, All Survey Years<br />
56<br />
110<br />
2007<br />
66<br />
141<br />
2008<br />
71<br />
159<br />
2009<br />
8<br />
16<br />
76<br />
166<br />
2010<br />
For-profit Not-for-profit Public sector O<strong>the</strong>r<br />
Notes: Based on 324 organization responses.<br />
Source: <strong>Forest</strong> <strong>Trends</strong>’ Ecosystem Marketplace. State of <strong>the</strong> Voluntary Carbon Markets 2013.<br />
2<br />
12<br />
76<br />
220<br />
2011<br />
12<br />
84<br />
228<br />
2012<br />
1. Market Overview: Volume and Value
14 State of <strong>the</strong> Voluntary Carbon Markets 2013<br />
1. Market Overview: Volume and Value<br />
Figure 18: Market Share and Average Price by Offset<br />
Supplier Profi t Status, OTC 2012<br />
(% Share and $/tCO 2 e)<br />
100%<br />
90%<br />
80%<br />
70%<br />
60%<br />
50%<br />
40%<br />
30%<br />
20%<br />
10%<br />
0%<br />
100%<br />
86%<br />
79%<br />
$5.5<br />
$6.8<br />
20%<br />
14%<br />
$11.4<br />
1% 0.4%<br />
For-Profit Not-for-Profit Public Sector<br />
Market share 2011 Market share 2012<br />
Notes: Based on 324<br />
Avg.<br />
organizations<br />
price 2012<br />
reporting<br />
95 MtCO e transacted.<br />
2<br />
Source: <strong>Forest</strong> <strong>Trends</strong>’ Ecosystem Marketplace.<br />
State of <strong>the</strong> Voluntary Carbon Markets 2013.<br />
Figure 19: Market Share by Project Category and<br />
Offset Supplier Profi t Status, OTC 2012<br />
90%<br />
80%<br />
70%<br />
60%<br />
50%<br />
40%<br />
30%<br />
20%<br />
10%<br />
0%<br />
For-Profit Not-for-Profit<br />
$12<br />
$10<br />
Renewables <strong>Forest</strong>ry Gases Household<br />
Efficiency / fuel switch Methane O<strong>the</strong>r<br />
Notes: Based on 324 organizations reporting<br />
95 MtCO 2 e transacted.<br />
Source: <strong>Forest</strong> <strong>Trends</strong>’ Ecosystem Marketplace.<br />
State of <strong>the</strong> Voluntary Carbon Markets 2013.<br />
$8<br />
$6<br />
$4<br />
$2<br />
$0<br />
demand for forest carbon offset projects grew. As seen<br />
in Figure 19, forestry has always been and remains a<br />
key component of non-profi t offset suppliers’ portfolios.<br />
2012 saw a slightly smaller proportion of offsets<br />
transacted by public sector actors hosting domestic<br />
offset programs – at .4 MtCO 2 e last year. These actors<br />
reported <strong>the</strong> highest per-tonne offset prices, however,<br />
at an average of $11.4/tCO 2 e, refl ecting <strong>the</strong> typical<br />
above-average price paid to public programs. At <strong>the</strong><br />
o<strong>the</strong>r end of <strong>the</strong> spectrum, private sector suppliers<br />
contracted offsets at an average of $5.5/tCO 2 e while<br />
non-profi ts reported an average offset price of $6.8/<br />
tCO 2 e. This is a departure from 2011, when average<br />
prices did not differ between private-sector and nonprofi<br />
t offset suppliers.<br />
1.3 Value Chain: From Supplier to Buyer<br />
No two voluntary carbon offset suppliers are alike; but<br />
depending on <strong>the</strong>ir position in <strong>the</strong> supply chain, sellers<br />
can be categorized into three major types:<br />
Project developers: Develop emissions reduction<br />
projects to generate and sell offsets to offset retailers<br />
or end buyers.<br />
Retailers/wholesalers: Take ownership of a portfolio<br />
offsets to sell to offset end users (companies or<br />
individuals). In addition to offset sales, <strong>the</strong>y may also<br />
engage in o<strong>the</strong>r carbon management advisory and<br />
communications services.<br />
Brokers: Do not own offsets, but facilitate transactions<br />
between sellers and buyers (ei<strong>the</strong>r retailers or offset<br />
end users).<br />
This report also occasionally draws a distinction<br />
between primary and secondary market transactions.<br />
Primary transactions are defi ned in this report<br />
series as <strong>the</strong> initial sale of offsets from <strong>the</strong> project<br />
developer – into <strong>the</strong> “secondary market” of retailer<br />
intermediaries or to offset end users. The secondary<br />
market represents transactions reported by retailers/<br />
wholesalers that are transacted amongst <strong>the</strong>mselves<br />
or (more commonly) sold to offset end users.<br />
In order to understand suppliers’ activities throughout<br />
<strong>the</strong> supply chain, we asked <strong>the</strong>m to identify <strong>the</strong>ir<br />
role in each offset transaction. Overall, we fi nd that<br />
project developers were responsible for generating<br />
and selling almost half of all offset volumes in 2012<br />
– valued at $184 million, or about 18% <strong>the</strong> size of <strong>the</strong><br />
primary market for offsets in <strong>the</strong> CDM in 2012 ($1,047<br />
million – see Box 1). Developers contracted a total of<br />
37.4 MtCO 2 e.
Figure 20: Market Share by Supplier Role, 2011-2012,<br />
and Average Price, 2012 (% Share and $/tCO 2 e)<br />
60%<br />
50%<br />
40%<br />
30%<br />
20%<br />
10%<br />
0%<br />
$6.2<br />
49%<br />
44%<br />
$5.6 $5.6<br />
37%<br />
29%<br />
19% 22%<br />
Developer Retail/Wholesale Broker<br />
Market share 2011 Market share 2012<br />
Avg. price 2012<br />
Notes: Notes: Based on 324 organizations<br />
reporting 77 MtCO 2 e transacted<br />
Source: <strong>Forest</strong> <strong>Trends</strong>’ Ecosystem Marketplace.<br />
State of <strong>the</strong> Voluntary Carbon Markets 2013.<br />
Retailers were responsible for ano<strong>the</strong>r 29% (22<br />
MtCO 2 e) of offsets transacted in 2012 – considerably<br />
down from 2011’s 29 MtCO 2 e. This is partly due to <strong>the</strong><br />
fact that in 2012, a larger volume of offsets were sold<br />
from project developers working with project types<br />
that have not traditionally taken <strong>the</strong> retail route to<br />
market, but instead sold directly to offset end users,<br />
like clean cookstove and forestry offset projects. At <strong>the</strong><br />
same time, 2012 saw several instances of mergers or<br />
acquisitions between project developers and retailers,<br />
thus blurring <strong>the</strong> lines between roles.<br />
A slightly larger proportion of volumes were reported<br />
as brokered between parties instead of being sourced<br />
directly from a project developer or retailer. All told,<br />
brokers were responsible for facilitating 16.7 MtCO 2 e<br />
of offsets in 2012. Offsets that were obtained to<br />
prepare for California’s impending cap-and-trade<br />
program were <strong>the</strong> primary source of growth in this<br />
market segment, where brokers long active in <strong>the</strong> US<br />
carbon markets were sought to navigate <strong>the</strong> year’s<br />
tumultuous offset policy and pricing developments.<br />
Project developers’ reported average price of $6.2/<br />
tCO 2 e was slightly lower than in 2011 ($7/tCO 2 e) –<br />
$7<br />
$6<br />
$5<br />
$4<br />
$3<br />
$2<br />
$1<br />
$0<br />
State of <strong>the</strong> Voluntary Carbon Markets 2013 15<br />
but remained higher than for o<strong>the</strong>r offset suppliers<br />
types. Prices associated with transactions that were<br />
facilitated by brokers increased from $4.9/tCO 2 e<br />
– tied to <strong>the</strong> rising price of California-facing offset<br />
contracts.<br />
Figure 21 provides a more complete picture of <strong>the</strong>se<br />
dyna mics, though it only captures data from suppliers<br />
that reported offset transaction volume, price, and<br />
buyer (67 MtCO 2 e total). In 2012, project developers<br />
sold 15 MtCO 2 e to retail offset providers, to <strong>the</strong>n offer<br />
to <strong>the</strong>ir offset end use clients. Ano<strong>the</strong>r 16 MtCO 2 e<br />
were sold by project developers directly to off set<br />
end users – in direct competition with retailers and<br />
for a slightly lower average price than that offered by<br />
retailers to end users ($6.3/tCO 2 e versus $6.6/tCO 2 e).<br />
We can also assume that a large volume of offsets<br />
brokered to offset end users or retailers were sourced<br />
from project developers, though we have no means<br />
of confi rming <strong>the</strong> source of volumes reported by<br />
brokers. We do fi nd that <strong>the</strong> price of offsets brokered<br />
to end users ($6.4/tCO 2 e) is very similar to offsets<br />
sold directly to end users by project developers.<br />
Retailers obtained <strong>the</strong> lowest-priced offsets in <strong>the</strong><br />
market when sourcing <strong>the</strong>m through a broker – <strong>the</strong><br />
story for 9 MtCO 2 e sold at $3.9/tCO 2 e.<br />
Figure 21: Transacted Volume and Average Price by<br />
Buyer and Seller Types, OTC 2012<br />
16.4<br />
MtCO 2 e<br />
$6.3<br />
No data<br />
14.8<br />
MtCO 2 e<br />
$4.8<br />
Broker 9.1 MtCO e $3.9<br />
2 Reseller<br />
$6.4<br />
Project Developer<br />
4 MtCO 2 e<br />
End Buyer<br />
22.2<br />
MtCO 2 e<br />
$6.6<br />
Notes: Based on 324 organizations reporting 66 MtCO e 2<br />
associated with business roles and buyer types.<br />
Source: <strong>Forest</strong> <strong>Trends</strong>’ Ecosystem Marketplace.<br />
State of <strong>the</strong> Voluntary Carbon Markets 2013.<br />
1. Market Overview: Volume and Value
16 State of <strong>the</strong> Voluntary Carbon Markets 2013<br />
1. Market Overview: Volume and Value<br />
BOX 1: Make or Break – Implications of CDM Market Developments for Voluntary Offset Supply and Demand<br />
Historically, compliance-driven demand for carbon offsets from <strong>the</strong> UN Clean Development Mechanism<br />
(CDM) has far outpaced voluntary offset demand – thanks to a substantive carbon price and offset<br />
demand from <strong>the</strong> world’s largest regulatory carbon market, <strong>the</strong> European Emissions Trading Scheme (EU<br />
ETS). In 2012, however, <strong>the</strong> EU ETS was a market in severe distress. Bloomberg New Energy Finance<br />
estimates that while traded volumes for CERs jumped 16% in 2012, market value for CERs (primary and<br />
secondary market) fell from an estimated $22 billion in 2011 to $6.5 billion this past year. Throughout<br />
2012-2013, CDM offset (“CER”) prices fell precipitously, falling to a record low of $0.16/tCO 2 e.<br />
Within this context, <strong>the</strong> voluntary market has begun and may continue to take some supply of offsets<br />
already developed for and targeted toward compliance buyers with obligations under <strong>the</strong> EU ETS or<br />
broader Kyoto Protocol targets, as well as o<strong>the</strong>r markets with prices linked to <strong>the</strong>se. Some developers<br />
may consider <strong>the</strong> voluntary markets’ historical average pricing to be comparable or favorable compared<br />
to current compliance market prices, which have been driven to record lows by policies that have not<br />
corrected for oversupply and provide insuffi cient price signals for compliance market-facing offsets.<br />
But while <strong>the</strong> relative stability of voluntary offset demand and pricing may be appealing to CDM project<br />
developers and CER suppliers, it’s important to recognize that this report’s fi ndings capture a large volume<br />
of offset sales from project types that are not eligible under <strong>the</strong> CDM (like projects that reduce emissions<br />
from deforestation and forest degradation or “REDD” – or all offsets generated in developed countries).<br />
Table 3 details 2012 offset transactions that are relevant to CDM project developers (see Notes), as <strong>the</strong>y<br />
come from relevant project types developed under <strong>the</strong> CDM, VCS, or The Gold Standard. Here, we see<br />
that 43% (42 MtCO 2 e) of all offsets sought by voluntary buyers in 2012 were from “CDM-relevant” projects<br />
– valued at $172 million or one third of overall voluntary market value. Prices for <strong>the</strong>se offset types, at<br />
an average of $4.5/tCO 2 e, were 23% less than <strong>the</strong> overall voluntary markets’ average of $5.9/tCO 2 e.<br />
Excluding high-priced Gold Standard offsets from <strong>the</strong> mix (a total of 9.3 MtCO 2 e), this price falls to $3.3/<br />
tCO 2 e. (Continued on next page.)<br />
Table 3: Transacted Volume, Market Value, and Average Price, UN Clean Development Mechanism<br />
and “CDM-Relevant” Voluntary Carbon Offset Types, 2012<br />
Clean Development Mechanism Voluntary Carbon Offsets<br />
Volume<br />
(MtCO 2 e)<br />
Value<br />
($ Million)<br />
Avg. Price<br />
($/tCO 2 e)<br />
Volume<br />
(MtCO 2 e)<br />
Value<br />
($ Million)<br />
Avg. Price<br />
($/tCO 2 e)<br />
Primary Markets<br />
339 Mt $1,047 M $3.1/t 20 Mt $86 M $5/t<br />
Secondary Markets 1,686 Mt $5,451 M $3.2/t 22 Mt $87 M $4.2/t<br />
TOTAL 2012 2,025 Mt $6,498 M $3.2/t 42 Mt $172 M $4.5/t<br />
Rulemaking Body UNFCCC/ Executive Board (CDM EB)<br />
Independent third-party standards guide<br />
projects; no central regulatory body<br />
Geographic Scope Non-Annex I Countries Global<br />
Trading Platform Exchange or Over-<strong>the</strong>-Counter Over-<strong>the</strong>-Counter<br />
Price Setter(s) Kyoto Compliance Markets Voluntary Buyers<br />
Notes: Non-Annex I countries are Kyoto Protocol signatories that are not obligated to set and achieve<br />
emissions reductions targets, but are typically developed country participants that are eligible to host CDM projects.<br />
Source: <strong>Forest</strong> <strong>Trends</strong>’ Ecosystem Marketplace. State of <strong>the</strong> Voluntary Carbon Markets 2013.<br />
Bloomberg New Energy Finance, CDM market analysis, 2013.
Box 1: Continued<br />
State of <strong>the</strong> Voluntary Carbon Markets 2013 17<br />
Despite voluntary offset supplier concerns that traditional CDM market players will channel an<br />
oversupply of CERs into <strong>the</strong> voluntary markets, in 2012 our survey tracked less than 1 MtCO 2 e of<br />
CERs sold to voluntary buyers – mostly from unique projects and locations, at prices similar to those<br />
paid to traditional voluntary projects. In contrast, 8.3 MtCO 2 e were sold from CCX projects to North<br />
American buyers at an average $0.1/tCO 2 e, representing a far larger source of inexpensive offsets<br />
that never<strong>the</strong>less did not collapse <strong>the</strong> US voluntary offset price. This highlights <strong>the</strong> fact that voluntary<br />
offset demand is highly stratifi ed according to buyer tastes and offset supplier relationships, hence <strong>the</strong><br />
demand for unique and atypical CERs, roughly half of which were also Gold Standard-certifi ed.<br />
CER suppliers considering a position in <strong>the</strong> voluntary offset market will face a host of challenges and<br />
important considerations – including <strong>the</strong> longer time required to identify a voluntary offset buyer; opaque<br />
supply information; additional registry fees; and voluntary offset suppliers’ historic effort to distance <strong>the</strong>ir<br />
products from <strong>the</strong> CER market.<br />
Finally, 24.3 MtCO 2 e were sold by retailers to offset<br />
end users at an average price of $6.6/tCO 2 e. While this<br />
price is higher than for offsets transacted by o<strong>the</strong>r types<br />
of suppliers, it does not imply that retailers necessarily<br />
achieved a signifi cant margin as some of <strong>the</strong> volumes<br />
transacted may have been contracted from project<br />
developers in previous years and at a higher price.<br />
Overall, <strong>the</strong>se fi ndings mirror o<strong>the</strong>r fi ndings in our<br />
Buyers and Contracts section that pin <strong>the</strong> retail offset<br />
market as <strong>the</strong> single most common type of buyer in<br />
<strong>the</strong> voluntary carbon markets.<br />
1.4 O<strong>the</strong>r Supplier Types: Exchanges and Auctions<br />
As seen in Figure 22, voluntary offset exchanges and<br />
auctions have reported small but steady volumes for<br />
four years. Throughout this report series, we have<br />
tracked <strong>the</strong> rise and market exit of several platforms –<br />
however, all platforms active in 2012 were also tracked<br />
in previous years and have evolved <strong>the</strong>ir business<br />
models as <strong>the</strong>y seek sure footing in this recognizably<br />
opaque marketplace.<br />
CTX facilitated <strong>the</strong> transaction of 1.5 MtCO 2 e in<br />
2012, making it <strong>the</strong> most active of <strong>the</strong>se platforms.<br />
Last year and into 2013, CTX set its sights on <strong>the</strong><br />
US offset market – seeking a boost in activity from<br />
a new relationship with California protocol-setter <strong>the</strong><br />
Climate Action Reserve (CAR) and parenting <strong>the</strong><br />
Texas Climate and Carbon Exchange to target buyers<br />
preparing for compliance under California’s cap-andtrade<br />
program.<br />
Auction platform and voluntary market veteran Climex<br />
saw smaller transaction volumes pass through<br />
its platform in 2012, and in early 2013 introduced<br />
collective purchase auctions as a new arrangement<br />
aiming to provide market access to buyers demanding<br />
offset volumes under 10,000 tCO 2 e from Gold Standard<br />
projects.<br />
All o<strong>the</strong>r exchanges reporting 2012 activities were<br />
based in developing countries – particularly in Asia<br />
and Latin America. Here, SCX continued working to<br />
build domestic business capacity for offsetting with <strong>the</strong><br />
support of a VCS regional offi ce in Santiago. SCX was<br />
<strong>the</strong> third largest voluntary offset purchase platform in<br />
2012. Last year, VCS also announced its collaboration<br />
with Colombia’s Fundacion Natura to support projects<br />
that will ultimately underpin <strong>the</strong> region’s voluntary<br />
carbon market – facilitated by a domestic exchange<br />
still under development.<br />
30%<br />
Figure 22: Market Share by Offset Transaction<br />
Platform<br />
2%<br />
<strong>Maneuvering</strong> <strong>the</strong> <strong>Mosaic</strong> State of <strong>the</strong> Voluntary Carbon Markets 2013<br />
2. Offset Origins<br />
Type, Place, and Time
State of <strong>the</strong> Voluntary Carbon Markets 2013 19<br />
2. Offset Origins: Type, Place, and Time<br />
2.1 Project Type: Technologies and Techniques<br />
Initiatives that reduce or avoid carbon emissions are<br />
<strong>the</strong> source of offsets in <strong>the</strong> voluntary carbon markets.<br />
Each project is differentiated by its technology, location,<br />
and potential environmental and social contributions<br />
(“co-benefi ts”). Voluntary buyers emphasize <strong>the</strong>se<br />
details – <strong>the</strong> story behind <strong>the</strong> offsets – to make <strong>the</strong>ir<br />
purchase decisions. An ever-expanding variety of<br />
emissions reduction projects refl ects voluntary buyers’<br />
diverse tastes and motivations. This section describes<br />
<strong>the</strong> origins of offsets transacted OTC in 2012: <strong>the</strong><br />
project types, locations, and o<strong>the</strong>r factors that begin to<br />
2012 KEY FINDINGS<br />
differentiate each offset from <strong>the</strong> next – and ultimately<br />
determine <strong>the</strong>ir appeal to end buyers.<br />
In 2012, offsets developed from renewable energy<br />
projects were <strong>the</strong> most popular among voluntary offset<br />
buyers. These projects were <strong>the</strong> source of 26 MtCO 2 e or<br />
34% of all transacted offsets that were associated with<br />
a project type. <strong>Forest</strong>ry and land-use activities were<br />
close behind as <strong>the</strong> source of ano<strong>the</strong>r 24 MtCO 2 e, a<br />
volume 22% greater than in 2011. This year, Ecosystem<br />
Marketplace added a new category, “Household Device<br />
Distribution” – where we tracked signifi cant growth<br />
both in <strong>the</strong> number of projects and demand for offsets<br />
• In 2012, offsets from renewable energy projects were <strong>the</strong> most popular among voluntary offset buyers,<br />
as <strong>the</strong> source of 26 MtCO 2 e or 34% of transacted offsets that were associated with a project type.<br />
Wind energy was behind 15.3 MtCO 2 e of transacted offsets – 35% less than in 2011, as some buyers<br />
turned <strong>the</strong>ir attention to o<strong>the</strong>r inexpensive offsets sourced from large hydropower projects. <strong>Forest</strong>ry<br />
and o<strong>the</strong>r land-use projects were close behind, supplying ano<strong>the</strong>r 24 MtCO 2 e, a volume 22% greater<br />
than in 2011.<br />
• REDD offsets that were (or aim to be) certifi ed to both <strong>the</strong> VCS and CCB Standards more than tripled<br />
<strong>the</strong>ir transaction volume in 2012. VCS REDD projects that have already issued offsets can potentially<br />
generate and transact 9.6 MtCO 2 e annually. Only 5.6 MtCO 2 e of this volume has ever been issued.<br />
• Transactions of clean cookstove offsets were valued at $65.3 million in 2012 – 54% more than in 2011.<br />
Over time, <strong>the</strong> value of private sector support for clean cookstove carbon projects is estimated to be<br />
$145 million. This has enabled <strong>the</strong> distribution of 4 million stoves from <strong>the</strong> 45 projects tracked so far in<br />
this survey – 99% of <strong>the</strong>se stoves were delivered to users below <strong>the</strong>ir respective national poverty lines.<br />
• Last year, <strong>the</strong> market extended voluntary carbon fi nance to 4 new country locations, making for a total<br />
of 65 countries represented in this year’s data. Asia supplied <strong>the</strong> largest volume of transacted offsets<br />
(29 MtCO 2 e) from a growing variety of project types.<br />
• Project uniqueness (understood by number of available standards, project locations, offset suppliers,<br />
and project size) is an important contributor to steady market growth. Project types that generate<br />
smaller annual volumes from a larger number of project locations, standards, and offset suppliers<br />
have seen more sustained demand over time.<br />
• While buyers have an ever-growing buyer interest to engage closely or exclusively with a projects, few<br />
buyers expressed demand to support multi-year, exclusive engagement with large- or mega-sized<br />
projects. 98 of 113 transactions of future offset vintages – and 25 out of 40 multi-year forward contracts<br />
signed in 2012 – were for offsets from micro- to medium-scale projects. In 2012, our survey tracked<br />
less than 1 MtCO 2 e of CERs sold to voluntary buyers, mostly from unique projects and locations, at<br />
prices similar to those paid to traditional voluntary projects.<br />
2. Offset Origins: Type, Place, and Time
20 State of <strong>the</strong> Voluntary Carbon Markets 2013<br />
2. Offset Origins: Type, Place, and Time<br />
Renewables<br />
34%<br />
26 M<br />
Figure 23: Transacted Volume by Project Category, OTC 2012 (MtCO 2 e and % Share)<br />
<strong>Forest</strong>ry<br />
and land use<br />
32%<br />
24 M<br />
generated from <strong>the</strong> distribution of clean cookstoves<br />
and water fi ltration devices in developing countries.<br />
In o<strong>the</strong>r categories, demand for offsets from US-based<br />
landfi ll methane projects declined last year as, without<br />
some source of a regulatory price signal, low prices for<br />
landfi ll methane offsets were an insuffi cient incentive<br />
for project developers to continue generating and<br />
transacting offsets. The category for projects that<br />
destroy o<strong>the</strong>r potent GHGs – primarily ozone-depleting<br />
substances (“ODS”) – expanded <strong>the</strong>ir market share<br />
due to intensifying demand for <strong>the</strong> offset type among<br />
future California carbon market participants.<br />
Household<br />
device<br />
7 M<br />
Methane<br />
Energy<br />
efficiency and<br />
fuel switch<br />
6 M<br />
Gases<br />
9% CH9% 9%<br />
8% 6%<br />
CH9% 9% 4<br />
Notes: fi ndings pertain to <strong>the</strong> 75.5 MtCO e associated with a response to this question, including “N/A” and “O<strong>the</strong>r”.<br />
2<br />
Source: <strong>Forest</strong> <strong>Trends</strong>’ Ecosystem Marketplace. State of <strong>the</strong> Voluntary Carbon Markets 2013.<br />
7%<br />
8%<br />
6%<br />
9%<br />
5%<br />
5% 4% 4% 4%<br />
4%<br />
12%<br />
7 M<br />
Figure 24: Market Share by Project Type, OTC 2012<br />
20%<br />
3%<br />
3%<br />
2%<br />
2%<br />
5%<br />
5 M<br />
<strong>Forest</strong>ry regains ground while renewable energy<br />
offsets stay on top<br />
O<strong>the</strong>r<br />
0.4 %<br />
0.3 M<br />
Looking at specifi c project types within each of <strong>the</strong>se<br />
categories (Figure 24), wind energy offsets remained<br />
popular in 2012 due to <strong>the</strong>ir straightforward “story” and<br />
<strong>the</strong> voluntary market’s abundant supply of inexpensive<br />
wind offsets.<br />
“Wind offsets are a simple, linear option and <strong>the</strong><br />
investment isn’t likely to be detrimental to <strong>the</strong> buyers’<br />
public profi le, explains UK broker Armajaro’s Gareth<br />
Turner. It may not be an exotic choice, but it’s safe.”<br />
Fuel switching,<br />
1%<br />
Livestock<br />
methane, 1%<br />
Geo<strong>the</strong>rmal, 1%<br />
O<strong>the</strong>r, 2%<br />
Wind<br />
Afforestation / reforestation<br />
REDD or avoided conversion<br />
Clean cookstove distribution<br />
Large hydro<br />
Ozone-depleting substances (US-based)<br />
Improved forest management<br />
Landfill methane<br />
Run-of-river hydro<br />
Waste heat recovery<br />
Coal mine methane<br />
No-till / low-till agriculture<br />
Grassland / rangeland management<br />
Biomass / biochar<br />
Water purification device distribution<br />
Energy efficiency<br />
Notes: Findings pertain to <strong>the</strong> 75.5 MtCO e associated with a response to this question, including “N/A” and “O<strong>the</strong>r”.<br />
2<br />
Source: <strong>Forest</strong> <strong>Trends</strong>’ Ecosystem Marketplace. State of <strong>the</strong> Voluntary Carbon Markets 2013.
These projects were behind 15.3 MtCO 2 e of transacted<br />
offsets, which is a 35% drop from 2011, as some<br />
buyers turned <strong>the</strong>ir attention to o<strong>the</strong>r inexpensive<br />
offsets sourced from large hydropower projects. More<br />
attention was also paid to o<strong>the</strong>r project types that<br />
feature additional environmental and social benefi ts,<br />
beyond <strong>the</strong> 2.3 MtCO 2 e transacted from Gold Standard<br />
wind projects demonstrating sustainable development<br />
contributions.<br />
Enter forestry projects, where offsets suppliers reported<br />
some regrowth in demand following a tough 2011.<br />
Across all sequestration approaches, afforestation/<br />
reforestation (“A/R”) remained <strong>the</strong> second most popular<br />
activity in <strong>the</strong> voluntary offset marketplace, as <strong>the</strong><br />
source for 8.8 MtCO 2 e of transacted offsets.<br />
Like wind energy, tree planting activities owe <strong>the</strong>ir<br />
steady year-on-year growth to buyers’ familiarity with<br />
reforestation, along with a diversity of project locations<br />
and standards utilized, and typically small project<br />
size. All of <strong>the</strong>se variations enable buyers to make<br />
unique claims about <strong>the</strong>ir ultimate impact on project<br />
viability and to potentially support A/R activities as a<br />
project’s sole offset buyer. See Section 2.4 for more<br />
on this topic.<br />
A/R projects were also behind 1/3 of all survey<br />
responses in which offset suppliers sold more than<br />
one year’s worth of estimated carbon reductions. This<br />
refl ects <strong>the</strong>ir need to cover <strong>the</strong> high up-front costs<br />
incurred from tree planting and forest monitoring<br />
activities.<br />
As in 2011, projects that reduce emissions from defo<br />
res tation and forest degradation (“REDD”) were<br />
buyers’ third most popular choice as an offset<br />
source, transacting 6.8 MtCO 2 e or 8% less than <strong>the</strong><br />
previous year. This decline occurred exclusively in<br />
<strong>the</strong> categories of projects that did not utilize a thirdparty<br />
standard to certify <strong>the</strong>ir carbon reductions or that<br />
utilized a “domestic”, country-specifi c standard like<br />
Brasil Mata Viva.<br />
On <strong>the</strong> o<strong>the</strong>r hand, 2012 was a signifi cant year for<br />
REDD offsets that were (or aim to be) certifi ed to<br />
both <strong>the</strong> VCS and CCB Standards – which more than<br />
tripled <strong>the</strong>ir transaction volume (Figure 25). Overall,<br />
REDD offset suppliers reported a larger number of<br />
transactions of offsets sourced from a larger diversity<br />
of projects than ever before.<br />
As REDD projects increasingly demonstrated <strong>the</strong>ir<br />
ability to verify climate and community benefi ts and<br />
issue offsets, buyers were more willing to support<br />
State of <strong>the</strong> Voluntary Carbon Markets 2013 21<br />
projects at all stages of development. Around 82% of all<br />
VCS forestry offset transactions were from projects that<br />
had not yet achieved offset verifi cation or issuance. End<br />
use buyers were more likely than retailers to support<br />
projects at <strong>the</strong>se stages, albeit at a lower average price<br />
(see Section 4.6).<br />
Despite <strong>the</strong>se overall “wins” for conservation forestry<br />
– and for VCS REDD projects in particular – suppliers<br />
still recount <strong>the</strong>ir ongoing struggle to compete for buyer<br />
attention with less expensive renewable energy offsets.<br />
As <strong>the</strong> pipeline of VCS REDD projects and offsets<br />
(Verifi ed Carbon Units - or “VCUs) continues to grow,<br />
<strong>the</strong>y also express concern for <strong>the</strong> future price of <strong>the</strong><br />
asset class. Table 4 summarizes this dynamic, where<br />
REDD projects that have demonstrated <strong>the</strong>ir ability to<br />
issue VCUs have <strong>the</strong> potential to generate and transact<br />
9.6 MtCO 2 e annually – only 5.6 MtCO 2 e of which has<br />
ever been issued. Of this volume, almost half were<br />
issued in 2012 alone, and a smaller proportion was<br />
actually transacted in 2012. A full 96% of REDD VCUs<br />
issued in 2012 were from four VCS+CCB projects – <strong>the</strong><br />
Kenyan Kasigau Corridor project (Phases I and II), <strong>the</strong><br />
Mai Ndombe Project in <strong>the</strong> Democratic Republic of <strong>the</strong><br />
Congo (“DRC”), and <strong>the</strong> Alto Mayo Project in Peru – all<br />
of which are additionally certifi ed to <strong>the</strong> CCB Standards.<br />
30<br />
25<br />
20<br />
15<br />
10<br />
Figure 25: Historical Transaction Volumes, VCS+CCB<br />
and O<strong>the</strong>r <strong>Forest</strong>ry Standards (MtCO 2 e)<br />
5<br />
0<br />
5<br />
10<br />
3<br />
13<br />
2009 2010 2011 2012<br />
VCS + CCB O<strong>the</strong>r forestry<br />
Notes: Findings pertain to 85 MtCO 2 e associated with historical,<br />
voluntary forest carbon offset transactions in 2009-2012.<br />
Source: <strong>Forest</strong> <strong>Trends</strong>’ Ecosystem Marketplace.<br />
State of <strong>the</strong> Voluntary Carbon Markets 2013.<br />
2. Offset Origins: Type, Place, and Time
22 State of <strong>the</strong> Voluntary Carbon Markets 2013<br />
2. Offset Origins: Type, Place, and Time<br />
Table 4: Historical Transaction Volumes, VCS+CCB<br />
and O<strong>the</strong>r <strong>Forest</strong>ry Standards (MtCO 2 e)<br />
9.6 Mt<br />
5.6 Mt<br />
Potential annual reductions from<br />
VCS REDD projects that have<br />
previously issued offsets<br />
REDD VCUs issued, all years<br />
3 Mt REDD VCUs issued in 2012<br />
1.8 Mt<br />
Issued REDD VCUs transacted<br />
in 2012<br />
Notes: 2012 transaction fi ndings pertain to 6.8 MtCO e of 2<br />
REDD offsets transacted.<br />
Source: <strong>Forest</strong> <strong>Trends</strong>’ Ecosystem Marketplace. State of<br />
<strong>the</strong> Voluntary Carbon Markets 2013, VCS Project Database.<br />
Project developers point to <strong>the</strong>se large numbers to<br />
illustrate <strong>the</strong> idea that <strong>the</strong> market’s signifi cant efforts to<br />
develop technical capacity around REDD should now<br />
transition to identifying suffi cient demand to support<br />
and refi nance projects.<br />
“It will be very challenging for voluntary private sector<br />
buyers to purchase enough credits from already<br />
verifi ed vintages to suffi ciently satisfy project needs,<br />
even if <strong>the</strong>y buy really substantial offset volumes,”<br />
explains retailer <strong>Forest</strong> Carbon Group’s Michael Sahm.<br />
“This is why we’ve begun exploring how to engage<br />
institutional or country-level buyers that want to<br />
engage in REDD purchase programs or bilateral<br />
agreements that can achieve a greater scale of<br />
demand.”<br />
REDD offset suppliers expressed mixed feelings about<br />
<strong>the</strong> development of jurisdictional REDD programs that<br />
will account for and issue offsets as a region, ra<strong>the</strong>r<br />
than exclusively at <strong>the</strong> project level. Ultimately, <strong>the</strong>y<br />
acknowledge that offsets issued in accordance with<br />
<strong>the</strong>se programs – all of which are currently being<br />
developed to <strong>the</strong> VCS Jurisdictional Nested REDD<br />
(JNR) requirements – may be best placed to secure<br />
bilateral or multilateral support.<br />
On <strong>the</strong> o<strong>the</strong>r hand, regional programs generating<br />
JNR VCUs pose a much larger source of REDD offset<br />
supply that begs questions like, “Will voluntary offset<br />
end use buyers engage in transactions with a domestic<br />
government?”, “Will governments allow project<br />
developers to issue and monetize <strong>the</strong>ir own offsets – or<br />
what does <strong>the</strong> private sector need to demonstrate to<br />
governments in order to gain <strong>the</strong>ir confi dence in this<br />
approach?”, “How can progress be demonstrated<br />
to <strong>the</strong> private sector?”, “Will offsets from <strong>the</strong>se large<br />
programs affect <strong>the</strong> market’s perception of supply and<br />
infl uence prices, or will <strong>the</strong>y be suffi ciently differentiated<br />
from project-level activities?”<br />
While <strong>the</strong> market and JNR program developers<br />
grapple with <strong>the</strong>se questions, private initiatives like <strong>the</strong><br />
Code REDD campaign (fi rst introduced in last year’s<br />
State of <strong>the</strong> Voluntary Carbon Markets and State of<br />
<strong>the</strong> <strong>Forest</strong> Carbon Markets reports) attempt to position<br />
existing REDD projects in <strong>the</strong> public eye, even as<br />
Code REDD itself eyes opportunities to unite projects<br />
with jurisdictional efforts.<br />
Support for clean household device distribution<br />
projects heats up<br />
Voluntary offset buyers funneled $80 million to offsets<br />
from projects that distribute clean cookstoves and<br />
water fi ltration devices – that burn fuel more effi ciently<br />
or not at all, thus reducing greenhouse gas emissions<br />
while sparing households from harmful smoke<br />
inhalation. In this category, clean cookstove projects<br />
were <strong>the</strong> market’s fourth most popular greenhouse gas<br />
mitigation activity – transacting 5.8 MtCO e, or 80%<br />
2<br />
more than in 2011. Water fi lter distribution captured<br />
ano<strong>the</strong>r 2% of market share.<br />
These project approaches debuted in our data in<br />
2010-2011 and have seen continued uptake from<br />
voluntary buyers in 2012 as project developers<br />
brought a larger number of projects and verifi ed<br />
tonnes to <strong>the</strong> voluntary offset market. Most offsets<br />
from this category (89%) were transacted from latestage<br />
projects that had verifi ed tonnes, compared to<br />
34% in 2011.<br />
As project developers and <strong>the</strong>ir local partners continue<br />
to expand <strong>the</strong>ir technical capacity and device<br />
distribution channels (i.e., <strong>the</strong> means by which <strong>the</strong>y<br />
sell or distribute devices to end users), <strong>the</strong>y report<br />
struggling with issues similar to those facing forest<br />
project developers.<br />
Examples of some of <strong>the</strong>se issues are: “How does one<br />
quantify <strong>the</strong> improvement of community well-being and<br />
health over <strong>the</strong> life of <strong>the</strong> project?”, “How can private<br />
sector projects and stakeholders better engage with<br />
donor-based sustainable development fi nancing
BOX 2: The Market for Offsets from Clean Cookstove Distribution: Some Like It Hot<br />
State of <strong>the</strong> Voluntary Carbon Markets 2013 23<br />
From <strong>the</strong> fi rst registered clean cookstove offset project in 2007 to record transaction volumes in 2012,<br />
<strong>the</strong> voluntary offset market has watched climate actors worldwide get behind this popular approach<br />
to carbon reductions and sustainable development. This year, <strong>Forest</strong> <strong>Trends</strong>’ Ecosystem Marketplace<br />
teamed up with <strong>the</strong> Global Alliance for Clean Cookstoves to survey cookstove project developers<br />
regarding <strong>the</strong>ir projects’ transactions, devices and inputs, distribution channels and, ultimately, <strong>the</strong><br />
populations <strong>the</strong>y impact. This section brings you <strong>the</strong> preliminary results of this jointly administered<br />
research project, with key fi ndings that include:<br />
• Voluntary demand for clean cookstove offsets was valued at $65.3 million in 2012 – 54% more than in<br />
2011. Around 61% or $40 million of this value arose from transactions reported by a project developer.<br />
The remaining value resulted from offset resale.<br />
• Over time, <strong>the</strong> value of private sector support for clean cookstove carbon projects is estimated to be<br />
$145 million. This has enabled <strong>the</strong> distribution of 4 million stoves from <strong>the</strong> 45 projects tracked so far in<br />
this survey – 67% of which were distributed in 2012 alone.<br />
• In 2012, carbon fi nance for clean cookstove distribution reached 15 country locations on three<br />
continents. The most prominent project locations included Peru, Ghana, Mozambique, and Kenya.<br />
• The average price for offsets from clean cookstove projects was $11.3/tCO 2 e. This is <strong>the</strong> aggregation<br />
of 67 unique prices reported for this project type and represents a 15% fall in price from 2011’s $13.2/<br />
tCO 2 e. This difference is a function of both <strong>the</strong> growing volume of available cookstove project offset<br />
supply and lack of clarity regarding CER demand in <strong>the</strong> EU ETS – ano<strong>the</strong>r source of demand for some<br />
clean cookstove offsets.<br />
• Clean cookstove distribution directly connected carbon fi nance to <strong>the</strong> rural and urban poor, as 99% of<br />
stoves were delivered to users below <strong>the</strong>ir respective national poverty lines. Of <strong>the</strong>se, 64% of stoves<br />
went to users in rural communities. Projects tracked so far reported 1,662 local employees – 27% of<br />
which are women – working for local partner organizations or in-country offi ces.<br />
• Approximately 3 out of 4 stoves were assembled in <strong>the</strong> country where <strong>the</strong>y were distributed to meet<br />
users’ cooking specifi cations. Offsets sold from projects where stoves were assembled in-country (as<br />
opposed to imported stoves) saw a 17% higher average price ($11.7/tCO 2 e versus $10/tCO 2 e).<br />
• Only 2% of projects that reported contracting offsets in 2012 engaged in stove “give-aways” – <strong>the</strong> majority<br />
of projects charged users between $2 and >$140/device. Lower prices were sometimes associated with<br />
projects that only distributed clean ignition devices, versus a whole stove, while o<strong>the</strong>rs only charged a<br />
nominal cost to ensure that <strong>the</strong> stove user had some “buy-in” with regard to stove use over time.<br />
• In a survey section that asked offset suppliers to identify <strong>the</strong> polluting activities that <strong>the</strong> more effi cient<br />
or clean cookstoves would address, <strong>the</strong> most commonly cited “business-as-usual” fuel source was<br />
charcoal that user populations would purchase.<br />
• Almost half of <strong>the</strong> projects distribute cookstoves based on <strong>the</strong> side-feeding “rocket” stove design –<br />
combusting biomass fuel sources effi ciently by harnessing a natural draft. Effi cient charcoal stoves<br />
were <strong>the</strong> second most popular stove/fuel type.<br />
• 83% of cookstove project offsets transacted in 2012 were certifi ed to <strong>the</strong> Gold Standard, <strong>the</strong> carbon<br />
market’s most popular program based on its many available methodologies and projects, and volume<br />
of issued and transacted offsets. A smaller proportion of offsets were certifi ed to <strong>the</strong> VCS, most of<br />
which were issued and sold or re-sold from one long-running project in Asia. A small volume of<br />
transacted cookstove project offsets were developed under <strong>the</strong> CDM and additionally certifi ed to<br />
<strong>the</strong> Gold Standard. This volume may grow as a number of CDM project developers look to voluntary<br />
buyers for more sustainable offset prices – adding <strong>the</strong>ir CERs to <strong>the</strong> mix of over 80 Gold Standard VER<br />
projects that rely exclusively on <strong>the</strong> voluntary market for demand. (Continued on next page.)<br />
2. Offset Origins: Type, Place, and Time
24 State of <strong>the</strong> Voluntary Carbon Markets 2013<br />
2. Offset Origins: Type, Place, and Time<br />
Box 2: Continued<br />
• Gold Standard certifi ed offsets were priced at an average $11/tCO 2 e. The price for CDM Gold<br />
Standard offsets was close to this level but cannot be reported due to a small number of data points.<br />
On average, suppliers estimated that The Gold Standard issued 2.98 tCO 2 e (or roughly three offset<br />
tonnes) per device distributed.<br />
• The majority of Gold Standard projects that have verifi ed and issued offsets were developed for voluntary<br />
buyers. As of April 2013, only one CDM Gold Standard project had issued offsets. However, more new<br />
project applicants will pursue both CDM and Gold Standard certifi cation than those that will generate<br />
Gold Standard VERs. Overall, Gold Standard clean cookstove projects at various stages and in both<br />
mar kets could reduce an estimated 6.4 MtCO e annually from 143 unique projects.<br />
2<br />
(Continued on next page.)<br />
Table 5: Number of Gold Standard Projects and<br />
Estimated Annual Reductions by Project Region<br />
Region Project Count<br />
Latin<br />
America<br />
Status<br />
Estimated Annual<br />
Reductions<br />
(MtCO 2 e / Year)<br />
15 0.7<br />
Asia 53 1.7<br />
Africa 75 3.7<br />
Total 143 6<br />
Source: The Gold Standard, as of April 2013.<br />
Gold Standard Voluntary Market Projects<br />
(GS VERs)<br />
Estimated Annual<br />
Project Count<br />
Reductions<br />
(MtCO e / Year)<br />
2<br />
5<br />
4<br />
3<br />
2<br />
1<br />
Figure 26: Transacted Volume and Average Price<br />
by Cookstove Carbon Project Standard, 2012<br />
4.5<br />
$11<br />
0<br />
The Gold Standard<br />
0.6<br />
$9<br />
0.3<br />
VCS CDM + The Gold<br />
Standard<br />
Volume 2012 Price 2012<br />
$11<br />
$10<br />
Source: <strong>Forest</strong> <strong>Trends</strong>’ Ecosystem Marketplace. State of<br />
<strong>the</strong> Voluntary Carbon Markets 2013.<br />
Table 6: Number of Gold Standard Projects and Estimated Annual Reductions by Stage<br />
$9<br />
$8<br />
Gold Standard CDM Projects (GS CERs)<br />
Project Count<br />
Estimated Annual<br />
Reductions<br />
(MtCO 2 e / Year)<br />
Listed 30 1.1 18 0.6<br />
Registered 20 0.8 5 0.4<br />
Validated 3 0.3 2 0.05<br />
Inactive 10 0.4 – –<br />
New Project<br />
Applicant<br />
17 0.9 22 1.1<br />
Issued 15 0.8 1 0.06<br />
Source: The Gold Standard, as of April 2013.
models?”, “How can baselines (which describe<br />
business as usual scenarios or “BAU”) and future<br />
emissions scenarios be accurately estimated to fairly<br />
credit projects for avoided emissions while preserving<br />
project and market integrity?”, “Which organizations<br />
or institutions have suffi cient offset demand to support<br />
multi-year contracts?”<br />
Regarding <strong>the</strong>se questions about future market<br />
challenges and development related to REDD and<br />
clean cookstove projects, Ecosystem Marketplace<br />
invites experts to share <strong>the</strong>ir insights and expertise via<br />
a new insight series to be published monthly through<br />
our news service beginning in July 2012.<br />
O<strong>the</strong>r project types<br />
Suppliers also reported transacting 5.1 MtCO2e in<br />
offsets from large hydropower projects in China, India<br />
and Turkey. Most offsets from this project type (75%)<br />
were sold by project developers to offset retailers,<br />
primarily based in <strong>the</strong> United Kingdom. In 2012, large<br />
hydro projects were also <strong>the</strong> most common project<br />
type in <strong>the</strong> CDM project pipeline, though <strong>the</strong> New<br />
Zealand Emissions Trading Scheme banned large<br />
hydro project CERs – as well a few o<strong>the</strong>r industrial<br />
gas project types – from use under its domestic<br />
scheme. While <strong>the</strong> EU has considered banning large<br />
hydro CERs in recent years, currently projects are<br />
only required to undergo an independent assessment<br />
of <strong>the</strong>ir compliance with <strong>the</strong> World Commission on<br />
Dams quality criteria. A few voluntary offset suppliers<br />
have raised <strong>the</strong> question of whe<strong>the</strong>r carbon industry<br />
associations, standards or o<strong>the</strong>r market players<br />
could take steps to limit <strong>the</strong> use of offsets from such<br />
controversial and large scale projects, given that <strong>the</strong>y<br />
potentially raise reputational risks to <strong>the</strong> voluntary<br />
carbon market – which is not centrally regulated and<br />
also perceived to be oversupplied.<br />
Demand for o<strong>the</strong>r popular project types was<br />
driven by buyers’ preparations for <strong>the</strong> California<br />
compliance carbon market. Here, ODS, livestock<br />
methane and improved forest management (“IFM”)<br />
projects developed to ARB-approved Early Action<br />
Quantifi cation Methodologies and California’s<br />
compliance offset protocols are eligible for use. This<br />
is discussed in greater detail in <strong>the</strong> California marketspecifi<br />
c section (Box 3). Also in North America, this<br />
year’s survey tracked a large volume of offsets<br />
supplied from agricultural land management projects.<br />
Almost all of <strong>the</strong>se offsets were certifi ed to <strong>the</strong> CCX<br />
offset protocols.<br />
State of <strong>the</strong> Voluntary Carbon Markets 2013 25<br />
2.2 Offset Price by Project Type<br />
In 2012, <strong>the</strong> market-wide average price for offsets<br />
was $5.9/tCO 2 e. This fi nding is <strong>the</strong> aggregation of<br />
hundreds of individually reported prices across over<br />
30 offset project types. <strong>Forest</strong>ry projects saw <strong>the</strong><br />
most dramatic decrease in prices, where across all<br />
forest carbon project types <strong>the</strong> average price fell 25%<br />
to $7.8/tCO 2 e from $10.5/tCO 2 e in 2011, as buyers<br />
sought larger offset volumes for future delivery from<br />
projects in <strong>the</strong>ir earlier stages (see also Section 3.4).<br />
Project developers also found it necessary to lower<br />
<strong>the</strong>ir offset price from forestry’s 2011 high in order to<br />
compete with o<strong>the</strong>r forestry projects and project types<br />
experiencing similar price pressures.<br />
Along <strong>the</strong> carbon market value chain, forest carbon<br />
offset prices primarily fell for offsets sold to retailers (from<br />
$9.4/ tCO 2 e in 2011 to $6.2/ tCO 2 e in 2012) who were<br />
unable to expand <strong>the</strong> volume of offsets <strong>the</strong>y ultimately<br />
sold to end users. Project developers alternatively grew<br />
<strong>the</strong> volume of offsets <strong>the</strong>y sold directly to end users<br />
while reducing <strong>the</strong>ir average price by only $0.2/ tCO 2 e.<br />
Prices for renewable energy offsets remained relatively<br />
stable in 2012, particularly for offsets from wind projects<br />
which did not see a signifi cant change. This fi nding<br />
also captures a substantial difference in price between<br />
primary and secondary transactions. For example,<br />
retailers paid project developers an average of $2/<br />
tCO 2 e and sold renewable energy offsets to end buyers<br />
for an average price of $4.6/tCO 2 e (removing Gold<br />
Standard renewable energy offsets from this equation,<br />
retailers’ average sell price dropped to $3.5/tCO 2 e).<br />
Retailers explain that this price spread refl ects <strong>the</strong>ir<br />
common use of a “basket” or “portfolio” approach.<br />
This sometimes involves assembling and pricing a<br />
portfolio of offsets types that imposes a larger markup<br />
on inexpensive offsets in order to sell more expensive<br />
offset types at cost or even a loss in order to meet<br />
<strong>the</strong> average portfolio price clients are willing to pay..<br />
Retailers say that if <strong>the</strong> portfolio approach was not<br />
possible, <strong>the</strong> overall price at which <strong>the</strong>y sell to end<br />
buyers would be signifi cantly higher for those who want<br />
offsets from more expensive categories, like forestry or<br />
clean cookstoves – but in lesser quantities.<br />
Sometimes retailers are compelled to sell offsets at<br />
a lower price than what <strong>the</strong>y paid to compete with<br />
project developers that sell offsets to end buyers at<br />
lower prices than <strong>the</strong>y sell to retailers. This is evident<br />
in both <strong>the</strong> VCS REDD and household device delivery<br />
categories. Retailers say that increasingly narrow<br />
margins for charismatic project types will ultimately<br />
2. Offset Origins: Type, Place, and Time
26 State of <strong>the</strong> Voluntary Carbon Markets 2013<br />
2. Offset Origins: Type, Place, and Time<br />
Figure 27: Transacted Volume and Average Price by<br />
Buyer and Seller Types, <strong>Forest</strong>ry Offsets, 2012<br />
(MtCO 2 e and $/tCO 2 e)<br />
8.8 MtCO 2 e<br />
$7.3<br />
MtCO 2 e<br />
18<br />
16<br />
14<br />
12<br />
10<br />
8<br />
6<br />
4<br />
2<br />
0<br />
No data<br />
No data<br />
Project Developer<br />
0.4<br />
MtCO e 2<br />
End Buyer<br />
$6.2<br />
Broker $8.3 Reseller<br />
$8.4<br />
4.9 MtCO 2 e<br />
1.9 MtCO 2 e<br />
Notes: Findings based on 16 MtCO 2 e associated with<br />
forestry offsets and a response to both transaction-level<br />
and buyer-type questions.<br />
Source: <strong>Forest</strong> <strong>Trends</strong>’ Ecosystem Marketplace.<br />
State of <strong>the</strong> Voluntary Carbon Markets 2013.<br />
Figure 28: Transacted Volume and Average Price by<br />
Buyer and Seller Types, Renewables Offsets, 2012<br />
(MtCO 2 e and $/tCO 2 e)<br />
Figure 29: Transacted Volume and Average Price by Project Type, 2012<br />
Cookstove<br />
Water filters<br />
Livestock meth<br />
ODS (US-based)<br />
Biogas<br />
IFM<br />
Afforestation/reforestation<br />
REDD/Avoided conversion<br />
Transportation<br />
Geo<strong>the</strong>rmal<br />
Energy efficiency<br />
Biomass/biochar<br />
Waste water methane<br />
N O 2<br />
Large hydro<br />
Wind<br />
Landfill methane<br />
Fuel switching<br />
Run-of-river hydro<br />
Waste heat recovery<br />
Coal mine methane<br />
Volume 2012 Max price - Min price Average price<br />
Notes: Findings based on 77 MtCO 2 e associated with transaction-level price, volume, and project type.<br />
Source: <strong>Forest</strong> <strong>Trends</strong>’ Ecosystem Marketplace. State of <strong>the</strong> Voluntary Carbon Markets 2013.<br />
1.8 MtCO 2 e<br />
$4<br />
No data<br />
Broker $1.4 Reseller<br />
$5.8<br />
Project Developer<br />
2.8 MtCO 2 e<br />
5.9 MtCO 2 e<br />
End Buyer<br />
Notes: Findings based on 26 MtCO 2 e associated with<br />
renewable energy offsets and a response to both<br />
transaction-level and buyer-type questions.<br />
Source: <strong>Forest</strong> <strong>Trends</strong>’ Ecosystem Marketplace.<br />
State of <strong>the</strong> Voluntary Carbon Markets 2013.<br />
$2<br />
$4.6<br />
$50<br />
$45<br />
$40<br />
$35<br />
$30<br />
$25<br />
$20<br />
$15<br />
$10<br />
$5<br />
$0<br />
6<br />
MtCO 2 e<br />
9.5<br />
MtCO 2 e<br />
$/tCO 2 e
MtCO 2 e<br />
25<br />
20<br />
15<br />
10<br />
5<br />
0<br />
jeopardize <strong>the</strong>ir ability to continue adding value to<br />
<strong>the</strong> marketplace, where between <strong>the</strong>ir purchases and<br />
sales <strong>the</strong>y contributed almost half of market-wide value<br />
($247 million). At <strong>the</strong> same time, project developers<br />
note (and our data shows) that retailers were less<br />
likely than offset end users to sign on to multi-year,<br />
large-volume contracts. Retailers say that last year’s<br />
lower volume of forward-sold offsets refl ects some<br />
avoidance of risk associated with exposing clients<br />
to prices that are trending downward. It also doesn’t<br />
refl ect <strong>the</strong> offset quantities that clients have committed<br />
to buy on annual basis via multi-year contracts with<br />
retailers.<br />
Figures 29 and 30 show that offsets from clean cookstove<br />
and water fi ltration device projects commanded aboveaverage<br />
prices, though slightly lower than in 2011.<br />
Clean cookstove offset prices varied highly by project<br />
stage, as is also discussed in Section 3.4.<br />
Offsets that will be eligible for use in <strong>the</strong> California capand-trade<br />
program were also in <strong>the</strong> market’s aboveaverage<br />
category, including IFM, ODS and livestock<br />
methane projects. Alongside <strong>the</strong>se project types, <strong>the</strong><br />
price of forestry offsets including A/R ($7.9/tCO 2 e) and<br />
REDD ($7.4/tCO 2 e) fell in 2012 but remained aboveaverage.<br />
Project developers say that <strong>the</strong>ir prices<br />
have remained at this level because, as <strong>the</strong> forestry<br />
sector matures, <strong>the</strong>y have better insight into project<br />
costs – from <strong>the</strong> upfront costs of tree planting to costs<br />
State of <strong>the</strong> Voluntary Carbon Markets 2013 27<br />
Figure 30: Change in Transacted Volume and Average Price by Project Type, 2011-2012<br />
Wind<br />
Afforestation/reforestation<br />
REDD<br />
Cookstoves<br />
Large hydro<br />
ODS (US-based)<br />
IFM<br />
Landfill methane<br />
Run-of-river hydro<br />
Waste heat recovery<br />
Coal mine methane<br />
No-till/low-till<br />
Ag land mgmt<br />
Biomass/biochar<br />
Water filters<br />
Energy efficiency<br />
Fuel switch<br />
Geo<strong>the</strong>rmal<br />
Livestock methane<br />
Volume supplied 2011 Volume supplied 2012 Price 2011 Price 2012<br />
Notes: Findings based on 77 MtCO e associated with transaction-level price, volume and project type.<br />
2<br />
Source: <strong>Forest</strong> <strong>Trends</strong>’ Ecosystem Marketplace. State of <strong>the</strong> Voluntary Carbon Markets 2013.<br />
$14<br />
$12<br />
$10<br />
associated with local community engagement, and<br />
regularly adjusting project specifi cations to “fi t” with<br />
several VCS forestry and land-use program updates.<br />
Notes one Latin American forest carbon project<br />
developer, “all of this unexpected additional time to<br />
implement <strong>the</strong> project begins to add up, and so do<br />
<strong>the</strong> costs. And so, so does <strong>the</strong> eventual offset price<br />
to compensate for those costs.”<br />
2.3 Project Location: Offsets at Home and Abroad<br />
Last year, <strong>the</strong> market extended voluntary carbon<br />
fi nance to 4 new country locations, making for a total<br />
of 65 countries represented in this year’s data. This<br />
section provides an overview of project location-based<br />
fi ndings, while Chapter 5 presents detailed fi ndings by<br />
region.<br />
Asia, Oceania markets grow on trees<br />
In addition to <strong>the</strong> continued predominance of renewable<br />
energy offsets fl owing from major supplier countries<br />
China and India, Asia saw forestry, energy effi ciency,<br />
and fuel switching offsets grow signifi cantly in market<br />
share. Overall, <strong>the</strong> region saw a 4% increase in <strong>the</strong><br />
volume of offsets supplied, though <strong>the</strong> region’s average<br />
offset price fell by 9% to $3.5/tCO e. 2<br />
While <strong>the</strong> bulk of <strong>the</strong> region’s offsets fl owed to overseas<br />
buyers in keeping with previous years, 2012 saw a<br />
signifi cant increase in <strong>the</strong> purchase of Asian offsets by<br />
$8<br />
$6<br />
$4<br />
$2<br />
$0<br />
$/tCO 2 e<br />
2. Offset Origins: Type, Place, and Time
28 State of <strong>the</strong> Voluntary Carbon Markets 2013<br />
2. Offset Origins: Type, Place, and Time<br />
MtCO 2 e<br />
35<br />
30<br />
25<br />
20<br />
15<br />
10<br />
5<br />
0<br />
Figure 31: Change in Transacted Volume and Average Price by Project Region, 2011-2012<br />
Asia:<br />
$103M<br />
North<br />
America:<br />
$151M<br />
Africa:<br />
$66M<br />
Notes: Findings based on 79 MtCO e associated with transaction-level price, volume, and project location.<br />
2<br />
Source: <strong>Forest</strong> <strong>Trends</strong>’ Ecosystem Marketplace. State of <strong>the</strong> Voluntary Carbon Markets 2013.<br />
Asian buyers – a growing trend as emissions trading<br />
schemes and domestic offset initiatives are set to<br />
develop over <strong>the</strong> next several years in China, South<br />
Korea, Thailand, and Vietnam.<br />
Fur<strong>the</strong>r south, while still attracting some support from<br />
both domestic and overseas buyers, New Zealand’s<br />
forestry-dominated market fell by over 50% in voluntary<br />
transaction volume in <strong>the</strong> shadow of its struggling<br />
compliance market. Australian suppliers, awaiting<br />
clarity on future demand for offsets generated through<br />
<strong>the</strong> Carbon Farming Initiative (“CFI”), never<strong>the</strong>less<br />
saw domestic demand for offset more than double to<br />
5.6 MtCO 2 e, owing to some pre-compliance activity as<br />
well as purely voluntary transactions of offsets through<br />
<strong>the</strong> National Carbon Offset Standard (“NCOS”).<br />
The NCOS is Australia’s government-administered<br />
program defi ning accept able offset programs from<br />
which domestic companies can purchase offsets to<br />
make carbon reductions and neutrality claims.<br />
Cookstoves, forestry on Africa’s front burner<br />
Kenya-based projects stood <strong>the</strong>ir ground in 2012 as <strong>the</strong><br />
world’s fourth largest supplier country, responsible for<br />
over half of Africa’s 8 MtCO e total transaction volume –<br />
2<br />
<strong>the</strong> largest-ever volume of offsets voluntarily contracted<br />
from <strong>the</strong> region.<br />
In addition to attracting corporate support for REDD<br />
efforts, Kenya and o<strong>the</strong>r countries including Ghana,<br />
Oceania:<br />
$65M<br />
Latin America:<br />
$61M<br />
Turkey:<br />
$16M<br />
Europe:<br />
$1M<br />
Volume supplied 2011 Volume supplied 2012 Price 2011 Price 2012<br />
$14<br />
$12<br />
$10<br />
Mozambique, Uganda, and <strong>the</strong> Democratic Republic<br />
of <strong>the</strong> Congo saw international demand for offset<br />
from projects delivering clean cookstoves and water<br />
purifi cation devices. Kenya saw <strong>the</strong> fi rst large-scale<br />
offset issuance using The Gold Standard’s suppressed<br />
demand approach for social entrepreneur Vestergaard<br />
Frandsen’s mega-sized LifeStraw project water fi lter<br />
distribution project.<br />
CCX legacy offsets, California carbon market boost<br />
North American offsetting<br />
North America’s biggest surprise in 2012 materialized in<br />
<strong>the</strong> over 8.3 MtCO 2 e of offsets transacted through <strong>the</strong><br />
Chicago Climate Exchange offsets registry program,<br />
where new offset generation has more or less come<br />
to a halt, but domestic buyers continue to transact<br />
offsets at sub-dollar rates to replenish <strong>the</strong>ir voluntary<br />
offset portfolios.<br />
The total value of offsets generated in North America<br />
was $151 million, with 60% of overall value contributed<br />
by pre-compliance buyers preparing for California’s<br />
cap-and-trade program. By volume, however, 56% or<br />
12 MtCO 2 e of North American offset purchases were<br />
motivated by purely voluntary action. Buyers in <strong>the</strong><br />
United States toge<strong>the</strong>r purchased more offsets than<br />
buyers in any o<strong>the</strong>r single country, supporting $143<br />
million worth of offsets in 2012.<br />
$8<br />
$6<br />
$4<br />
$2<br />
$0<br />
$/tCO 2 e
Domestic programs make (or break) offset supply in<br />
Latin America, Europe<br />
Demand for offsets generated in Latin America was<br />
relatively stable in 2012 at 7.2 MtCO 2 e, with forestry<br />
still driving <strong>the</strong> bulk of domestic project development.<br />
Seeds of growth were planted in <strong>the</strong> region, with<br />
governments in Acre (Brazil), Colombia, and Chile<br />
signing agreements with VCS to establish stronger<br />
frameworks for <strong>the</strong>ir domestic carbon markets; and<br />
Mexico passing a law to pursue a domestic emissions<br />
trading scheme. Latin American projects contracted<br />
<strong>the</strong> bulk of <strong>the</strong>ir offsets to European buyers, with still<br />
only a smattering of domestic offset buyers in <strong>the</strong> game.<br />
Regulated under <strong>the</strong> EU ETS and broader Kyoto<br />
Protocol commitments, projects in EU member states<br />
supplied a modest 1.4 MtCO 2 e of offsets in 2012 to<br />
voluntary buyers in <strong>the</strong> United States – primarily offsets<br />
from coal mine methane projects in Germany whose<br />
certifi cation precedes <strong>the</strong> Kyoto Protocol start date.<br />
O<strong>the</strong>rwise, <strong>the</strong> EU continued for <strong>the</strong> most part to be a<br />
source of voluntary offset demand ra<strong>the</strong>r than supply.<br />
On <strong>the</strong> demand side, buyers in <strong>the</strong> United Kingdom<br />
and o<strong>the</strong>r major European countries continued to<br />
show a strong appetite offsets from abroad, securing<br />
a total of 43.4 MtCO 2 e offsets in 2012, with over half of<br />
those offsets sourced from projects in Asia.<br />
2.4 Offset Uniqueness: O<strong>the</strong>r Dimensions of Demand<br />
Because every offset project and <strong>the</strong>ir ultimate buyers<br />
differ slightly to signifi cantly from <strong>the</strong> next, data in this<br />
relatively small marketplace is also too differentiated<br />
to conduct much meaningful multivariate analysis. We<br />
can, however, informally compare information about<br />
a few of <strong>the</strong> market’s most popular project types to<br />
shed light on a key driver of demand described by<br />
offset suppliers over time and in 2012 – that of offset<br />
“uniqueness.”<br />
Sizing up emissions reductions<br />
Offset projects reduce, sequester, or avoid emissions<br />
every year at volumes ranging from less than 5,000<br />
tCO e to over 1 MtCO e annually. Project size is and<br />
2 2<br />
has always been a key determinant of offset price, as<br />
seen in Table 7 for 2012. This fi nding has seen little<br />
change throughout our State of report series, and<br />
refl ects not only buyers’ willingness to pay more to<br />
support “boutique”, small-scale projects where <strong>the</strong>y<br />
can potentially afford exclusivity, but also <strong>the</strong> higher<br />
marginal abatement cost associated with smaller,<br />
community-based efforts. Suppliers also point out that<br />
very large scale projects tend to sell to any buyer that<br />
Reductions / Year<br />
State of <strong>the</strong> Voluntary Carbon Markets 2013 29<br />
Table 7: Transaction Volume and Average Price by<br />
Projects’ Estimated Annual Reductions<br />
(i.e., “Project Size”), 2012<br />
Volume<br />
(MtCO 2 e)<br />
Response<br />
Count<br />
Average<br />
Price<br />
($/tCO 2 e)<br />
Micro ( 1 MtCO e) 2<br />
11.4 30 $5.8<br />
Notes: Based on 50 MtCO 2 e associated with a project size.<br />
Source: <strong>Forest</strong> <strong>Trends</strong>’ Ecosystem Marketplace.<br />
State of <strong>the</strong> Voluntary Carbon Markets 2013.<br />
shows interest in <strong>the</strong> project, and thus <strong>the</strong>y or <strong>the</strong>ir<br />
retailers fi nd <strong>the</strong>ir prices being undercut by <strong>the</strong> same<br />
supply from different sources – sources that may not<br />
have paid anything to secure commercialization rights.<br />
“We do sometimes see sellers coming to market in a<br />
way that can erode price because <strong>the</strong> chosen route<br />
is uncoordinated, in a market which is of limited<br />
size,” says The CarbonNeutral Company’s Zubair<br />
Zakir. “Sellers that only offer a portion of <strong>the</strong>ir volumes<br />
more selectively, may see higher prices and possibly<br />
improve value overall.”<br />
Over time, <strong>the</strong> market has seen a few highly anticipated<br />
mitigation approaches emerge from such large-scale<br />
(500,000 – 1 MtCO 2 e/year) to even “mega-sized” (>1<br />
MtCO 2 e/year) activities, like <strong>the</strong> fi rst Gold Standard<br />
wind project offsets in 2008 or VCS plus CCB Standardcertifi<br />
ed REDD projects in 2010. Both of <strong>the</strong>se project<br />
types saw intense demand when <strong>the</strong> projects (or<br />
even just <strong>the</strong> methodologies in <strong>the</strong> case of REDD) fi rst<br />
entered <strong>the</strong> market – only to see transactions level off<br />
in subsequent years.<br />
On <strong>the</strong> o<strong>the</strong>r hand, project types that generate smaller<br />
annual volumes from a larger number of project<br />
locations, standards, and offset suppliers have seen<br />
more sustained growth over time. The most obvious of<br />
<strong>the</strong>se cases are offsets sold from A/R projects, which<br />
over time have contracted most of <strong>the</strong>ir volume from<br />
2. Offset Origins: Type, Place, and Time
30 State of <strong>the</strong> Voluntary Carbon Markets 2013<br />
2. Offset Origins: Type, Place, and Time<br />
Figure 32: “Uniqueness” Preference: Comparison of Historical Transaction Volumes from Popular Project Types<br />
MtCO e 2<br />
10<br />
9<br />
8<br />
7<br />
6<br />
5<br />
4<br />
3<br />
2<br />
1<br />
0<br />
2007 2008 2009 2010 2011 2012<br />
micro- to medium-scale projects and have grown <strong>the</strong>ir<br />
transaction volumes in all but one year (2010).<br />
As can be seen in Figure 32 and Table 8, clean<br />
cookstove projects may follow a similar trend. Future<br />
market tracking will reveal whe<strong>the</strong>r or not cookstove<br />
offset projects will continue this trajectory, however, as<br />
many cookstove projects optimize stove distribution<br />
VCS + CCB REDD+ Gold Standard wind<br />
Gold Standard cookstoves A/R: Mult. standards<br />
Notes: Based on 28 MtCO e associated with survey responses that report project type, location, and transaction volume.<br />
2<br />
Source: <strong>Forest</strong> <strong>Trends</strong>’ Ecosystem Marketplace. State of <strong>the</strong> Voluntary Carbon Markets 2013.<br />
TYPE<br />
VCS +<br />
CCB<br />
REDD<br />
Gold<br />
Standard<br />
Wind<br />
Gold<br />
Standard<br />
Cookstoves<br />
Affor. /<br />
Refor.<br />
Volume<br />
2011<br />
Volume<br />
2012<br />
Price<br />
2011<br />
Price<br />
2012<br />
# Transactions<br />
2011<br />
and thus grow in project size and <strong>the</strong> volume of issued<br />
offsets generated over <strong>the</strong> life of <strong>the</strong> project.<br />
The popularity of project types capable of deployment<br />
to many locations, via several standards and method ologies,<br />
and (critically) at multiple scales, speaks to what<br />
suppliers describe as an ever-growing buyer interest to<br />
engage closely – and ideally, exclusively – with a project.<br />
Table 8: “Uniqueness” Preference: Annual Change in Volume, Price, Number of Transactions,<br />
Project Locations and Most Common Project Size for Popular Project Types<br />
# Transactions<br />
2012<br />
# Loca tions<br />
2011<br />
# Loca tions<br />
2012<br />
2.4 M 6.5 M $8/t $7/t 19 23 6 9<br />
Common<br />
Size<br />
2011<br />
“Mega”<br />
Project<br />
Common<br />
Size<br />
2012<br />
“Mega”<br />
Project<br />
2.6 M 2.2 M $10/t $7/t 32 24 7 3 Medium Large<br />
1.6 M 4.4 M $14/t $11/t 24 36 12 15 Medium Medium<br />
7.6 M 8.8 M $9/t $8/t 81 53 31 20 Macro Medium<br />
Notes: Based on 28 MtCO e associated with survey responses that report project type, location, and transaction volume.<br />
2<br />
Source: <strong>Forest</strong> <strong>Trends</strong>’ Ecosystem Marketplace. State of <strong>the</strong> Voluntary Carbon Markets 2013.
However, most buyers in this resource-constrained<br />
economic environment don’t have <strong>the</strong> balance sheet<br />
to provide multi-year, exclusive project fi nancing or<br />
offtake to large- or mega-scale projects.<br />
Indeed, 98 of 113 transactions of future offset vintages<br />
(i.e., support for future project activities) were for<br />
offsets from micro- to medium-scale projects. Of <strong>the</strong> 40<br />
multi-year forward contracts signed in 2012, 25 were<br />
for offsets from micro- to medium-scale projects, with<br />
ano<strong>the</strong>r 9 reported for large projects. The remainder is<br />
of unknown size.<br />
Location(s) count<br />
As a market, VCS REDD projects saw increased offset<br />
demand in 2012, but growth occurred primarily in <strong>the</strong><br />
category of offsets sold from new project locations that<br />
did not report signifi cant transaction volumes in 2011.<br />
Gold Standard wind offsets originated from some bynow-familiar<br />
locations and projects (primarily from<br />
Turkey) and are constrained by <strong>the</strong> comparably small<br />
number of country locations that present opportunities<br />
for wind project installation.<br />
Both A/R and clean cookstove projects, on <strong>the</strong> o<strong>the</strong>r<br />
hand, represented a large number of project locations<br />
and unique transactions relative to o<strong>the</strong>r project types.<br />
Cookstove offset project developers and suppliers<br />
continued to rapidly add new project locations to<br />
<strong>the</strong> map and identify buyers for a growing volume of<br />
issued offsets. A/R projects, implemented on every<br />
relevant continent, also expanded market activity in<br />
2012, though <strong>the</strong> number of A/R project locations and<br />
transactions fell as attention shifted from micro-scale<br />
projects (27% of all projects that commercialized<br />
offsets in 2011) to medium-sized projects (40% of all<br />
reported projects in 2012).<br />
This partly refl ects decreased demand for both Plan<br />
Vivo and CarbonFix program A/R offsets – a traditional<br />
source of offsets from “boutique” tree planting and<br />
agro-forestry projects. The trend may see a reversal in<br />
coming months, however, as <strong>the</strong> CarbonFix program<br />
is integrated into The Gold Standard, which acquired<br />
CarbonFix in 2012 and will make its micro-scale<br />
scheme available to smallholders under its emerging<br />
land-use program.<br />
Unique implications<br />
At a high level, <strong>the</strong>se trends speak to <strong>the</strong> offset<br />
demand side’s sometimes confl icting interests in<br />
GHG mitigation, sustainable development, and public<br />
image and communications. Over time, o<strong>the</strong>r survey<br />
State of <strong>the</strong> Voluntary Carbon Markets 2013 31<br />
fi ndings have revealed that corporate risk mitigation –<br />
in <strong>the</strong> form of pre-compliance and now (to a still-limited<br />
extent) supply chain risk management – is <strong>the</strong> dominant<br />
incentive for large-scale, multi-year transactions. While<br />
a few prominent voluntary buyers engage in large-scale<br />
transaction activities with single projects, such cases<br />
are rare.<br />
This reality is currently driving some large- to megascale<br />
project developers and <strong>the</strong>ir representative<br />
standards bodies to engage bilateral and multilateral<br />
institutions and large donors in an emerging<br />
discussion about how VERs can be incorporated<br />
into “results-based” but potentially non-marketbased<br />
mitigation funding programs like <strong>the</strong> <strong>Forest</strong><br />
Carbon Partnership Facility or <strong>the</strong> Green Climate or<br />
Adaptation Funds. It is also forcing voluntary offset<br />
market participants to realistically assess <strong>the</strong> private<br />
sector’s ability to support large-scale mitigation,<br />
absent <strong>the</strong> presence of a strong carbon price signal<br />
from governments.<br />
In an effort to drive private sector voluntary demand, a<br />
few market participants and <strong>the</strong>ir buyers have begun<br />
to describe and leverage offset project activities as<br />
tools that fi nancially incentivize <strong>the</strong>ir producers to<br />
“climate-proof” <strong>the</strong>ir supply chains in a measurable<br />
way – thus potentially tapping into corporate’s less<br />
public-facing and more substantial risk management<br />
budgets.<br />
O<strong>the</strong>rs have considered “parceling out” specifi c sections<br />
of large project areas to individual buyers to<br />
offer buyers more of a direct connection to <strong>the</strong> project<br />
and, potentially, to <strong>the</strong> community being impacted<br />
by <strong>the</strong>ir contribution. Ra<strong>the</strong>r than measuring and<br />
reporting separately for each parcel, this would be<br />
done symbolically. Even so, suppliers point out that<br />
<strong>the</strong>method leads to tricky issues such as: “ Which land<br />
areas and communities are offered fi rst?”, “From an<br />
ethical marketing standpoint, can such an approach<br />
be taken without undertaking MRV for unique project<br />
areas?”<br />
Most large-scale REDD and renewable energy project<br />
developers interviewed for this report believe that <strong>the</strong>ir<br />
market success will require harnessing a combination<br />
of <strong>the</strong>se concepts. They also stress that <strong>the</strong> original<br />
motivation for “scaling” up <strong>the</strong>se activities was to<br />
dramatically disrupt business-as-usual in favor of largescale<br />
GHG mitigation, biodiversity protection, and<br />
social benefi ts to <strong>the</strong> extent that one corporation alone<br />
could not accomplish, but <strong>the</strong> combined resources of<br />
many actors could.<br />
2. Offset Origins: Type, Place, and Time
32 State of <strong>the</strong> Voluntary Carbon Markets 2013<br />
2. Offset Origins: Type, Place, and Time<br />
“While some people in this market are now looking to<br />
govern ments to scale up demand for our actions,<br />
political will and public money are not always present<br />
and won’t be enough without <strong>the</strong> participation of <strong>the</strong><br />
private sector,” says Wildlife Works founder Mike<br />
Korchinsky.<br />
“As a market, we have to do a better job of com municating<br />
<strong>the</strong> fact that climate change and biodiversity and<br />
forest loss are a large scale problem that requires large<br />
scale solutions,” he adds. “The scale of both problem<br />
and solution means that <strong>the</strong> private and public sectors<br />
need to fi nd a way to go down this path toge<strong>the</strong>r.”
<strong>Maneuvering</strong> <strong>the</strong> <strong>Mosaic</strong> State of <strong>the</strong> Voluntary Carbon Markets 2013<br />
3. Market Infrastructure<br />
Standards and Registries
34 State of <strong>the</strong> Voluntary Carbon Markets 2013<br />
3. Market Infrastructure: Standards and Registries<br />
3. Market Infrastructure: Standards and Registries<br />
3.1 Third-Party Offset Project Standards and<br />
Certifications<br />
Every new route to market on <strong>the</strong> voluntary carbon<br />
market’s expanding map of project types is paved by<br />
methodologies that steer <strong>the</strong> development of projects,<br />
offsets, and, in some ways, <strong>the</strong> market itself. The 2012<br />
market continued to see uptake in <strong>the</strong> proportion of<br />
offset projects that used third-party, peer-reviewed<br />
standards. Suppliers that reported using a standard<br />
said that 100% of all <strong>the</strong>ir transacted offsets used an<br />
independent third-party standard as opposed to an<br />
internal or proprietary standard. 5<br />
2012 KEY FINDINGS<br />
Over <strong>the</strong> years and again in 2012, carbon project<br />
standards persisted in <strong>the</strong>ir efforts to raise <strong>the</strong> bar<br />
on technical rigor for project methodologies, while<br />
identifying opportunities to reduce project costs and<br />
pave routes to market for new project categories that<br />
are still in pilot stages.<br />
Last year, standards’ certifi cation processes continued<br />
to evolve in hopes of unlocking <strong>the</strong> potential for an everbroader<br />
set of activities to access carbon fi nance with<br />
an eye to cost-effectiveness and scalability, given <strong>the</strong><br />
market price downturn and size limitations of some of<br />
voluntary buyers’ favorite project types. Six major trends<br />
– some new, o<strong>the</strong>rs ongoing – are highlighted here.<br />
• For <strong>the</strong> fi rst time, suppliers that reported using a standard said that 100% of all <strong>the</strong>ir transacted offsets<br />
used an independent third-party standard instead of an internal or proprietary standard.<br />
• Existing and new standards are innovating methodologies to measure and verify <strong>the</strong> delivery of cobenefi<br />
ts, including some efforts to bypass carbon quantifi cation entirely and instead support “impact”<br />
projects. Examples include <strong>the</strong> development of Gold Standard Water Benefi t Certifi cates, <strong>the</strong> Women’s<br />
Carbon Standard, Vulnerability Reduction Credits, and <strong>the</strong> BBOP Standard on Biodiversity Offsets.<br />
• In 2012, <strong>the</strong> VCS retained its position as <strong>the</strong> market’s most popular third-party standard, when VCSapproved<br />
project methodologies were behind a record transaction volume of 43 MtCO 2 e. Demand for<br />
Gold Standard offsets topped <strong>the</strong> 10 MtCO 2 e for <strong>the</strong> fi rst time in <strong>the</strong> standard’s history, while Chicago<br />
Climate Exchange projects around <strong>the</strong> world grew <strong>the</strong>ir market share from 3% in 2011 to 12% last<br />
year. Only one third of CCX offsets were from agriculture, forestry, and land-use projects in <strong>the</strong> US.<br />
• Offsets from REDD projects that are or aspire to be certifi ed to both VCS and CCB more than doubled<br />
in 2012. These projects, combined with Gold Standard-certifi ed offsets, made up 73% of all transaction<br />
volumes that quantifi ed project co-benefi ts or were implemented in forest areas that feature additional<br />
non-carbon forest product certifi cation. Country-specifi c standards backed an additional 9.5 MtCO 2 e<br />
or 13% of all offsets transacted in <strong>the</strong> voluntary carbon markets in 2012.<br />
• 42.5 MtCO 2 e or 43% of all transacted offsets were reported as being issued at <strong>the</strong> time of transaction.<br />
Overall, of <strong>the</strong> 312 MtCO 2 e of verifi ed offsets that have ever been issued and tracked on a registry,<br />
21% of this volume (66 MtCO 2 e) was issued in 2012.<br />
• 96% of all offsets issued in 2012 were housed on a registry hosted by APX Inc. (34 MtCO 2 e issued in<br />
2012) or Markit Environmental Registry (25 MtCO 2 e issued in 2012). A few domestic registries like <strong>the</strong><br />
Clean Energy Regulator’s offset register under Australia’s Carbon Farming Initiative also issued <strong>the</strong>ir<br />
fi rst offsets in 2012.<br />
5 21 MtCO2e of transacted offsets were not reported alongside a response on <strong>the</strong>ir use of a project standard, so <strong>the</strong> standards<br />
breakdown for this volume is unknown
Streamlining expertise and process<br />
Carbon accounting standards and o<strong>the</strong>r certifi cation<br />
bodies became more ambitious and collaborative<br />
in developing measures to more effi ciently verify<br />
emissions reductions, motivated partly by <strong>the</strong> declining<br />
carbon price, as well as <strong>the</strong> solidifying relationships<br />
between actors working toward environment, health,<br />
and sustainable development outcomes. Moving<br />
beyond its traditional focus on renewable energy and<br />
energy-effi cient technologies, The Gold Standard<br />
acquired <strong>the</strong> forest-facing CarbonFix standard and<br />
entered into partnerships with <strong>the</strong> <strong>Forest</strong> Stewardship<br />
Council (“FSC”) and Fairtrade consumer label. VCS<br />
also launched a joint approval process with CCB for<br />
VCS-CCB certifi cation, designed to lower validation/<br />
verifi cation costs for forestry and land-use projects<br />
seeking offsets for both emissions reductions and cobenefi<br />
ts.<br />
Building out co-benefi ts<br />
Projects’ environmental, social, sustainable development,<br />
and o<strong>the</strong>r public benefi ts continue to climb to<br />
<strong>the</strong> top of buyers’ offset project considerations. In<br />
response, existing and new standards are innovating<br />
methodologies to measure and verify <strong>the</strong> delivery<br />
of <strong>the</strong>se benefi ts, including some mechanisms that<br />
bypass carbon quantifi cation entirely.<br />
These efforts include <strong>the</strong> development of water benefi t<br />
certifi cates (initiated by <strong>the</strong> Water Benefi t Partners, The<br />
Gold Standard, and offset supplier First Climate); <strong>the</strong><br />
Women’s Carbon Standard (administered by Women<br />
Organizing for Change in Agriculture and Natural<br />
Resource Management – WOCAN), certifying women’s<br />
engagement and leadership in carbon projects;<br />
and Vulnerability Reduction Credits (from <strong>the</strong> Higher<br />
Ground Foundation) that aim to quantify vulnerability<br />
reduction resulting from adaptation efforts; and The<br />
Poverty Alleviation Criteria Tool, developed by ACR and<br />
<strong>the</strong> China Beijing Environmental Exchange, to assess<br />
poverty alleviation impacts achieved by implementing<br />
forestry and o<strong>the</strong>r land-use projects under <strong>the</strong> Panda<br />
Standard.<br />
O<strong>the</strong>r programs under development in 2012 include<br />
a tool to quantify cookstove project health benefi ts<br />
(developed by C-Quest Capital with <strong>the</strong> Global<br />
Alliance for Clean Cookstoves) and <strong>the</strong> Business and<br />
Biodiversity Offsets Program (“BBOP” – an initiative<br />
of Ecosystem Marketplace parent organization <strong>Forest</strong><br />
<strong>Trends</strong>) BBOP Standard on Biodiversity Offsets. These<br />
programs are being designed to sit alongside existing<br />
and long-utilized co-benefi ts certifi cations like <strong>the</strong><br />
CCB and SOCIALCARBON Standards.<br />
State of <strong>the</strong> Voluntary Carbon Markets 2013 35<br />
“It’s encouraging to see programs that certify<br />
development benefi ts without pinning all results to<br />
<strong>the</strong> carbon element,” says Climate Care CEO Edward<br />
Hanrahan. “The development community has strong<br />
measurement tools and larger funding streams<br />
that we can harness,” he adds, “while being open<br />
to <strong>the</strong> effi ciencies that can be gained by layering<br />
what we’re doing [in <strong>the</strong> carbon markets] with what<br />
<strong>the</strong>y’re doing.”<br />
Tapping into voluntary programs’ experience<br />
To avoid reinventing <strong>the</strong> wheel in <strong>the</strong> design of <strong>the</strong>ir<br />
formal offset programs, governments worldwide<br />
continued to borrow expertise from prevailing<br />
independent third-party standards to inform <strong>the</strong>ir<br />
emerging domestic markets. Governments ranging<br />
from Chile to Costa Rica to Brazil’s state of Acre<br />
signed agreements with VCS to pilot <strong>the</strong> standard’s<br />
Jurisdictional Nested REDD (JNR) guidelines, intended<br />
to scale up emissions reductions beyond projectlevel<br />
activities into larger jurisdictional targets. ACR<br />
released its own nested REDD methodology in 2012<br />
and is currently in <strong>the</strong> process of identifying pilots.<br />
In <strong>the</strong> US, California’s Air Resources Board (ARB)<br />
continued to consider new offset protocols developed<br />
in <strong>the</strong> voluntary market by CAR, ACR, and o<strong>the</strong>rs for<br />
use in its compliance cap-and-trade program. In Asia,<br />
Thailand’s “T-VER” program continues to build capacity<br />
with support from Korea’s K-VER program, which<br />
became accredited as a VCS audit body in 2012. In<br />
early 2012, Thailand’s Greenhouse Gas Management<br />
Organization announced that it will also allow eligible<br />
domestic VCS projects to additionally tag <strong>the</strong>ir offsets<br />
with <strong>the</strong> national Crown Standard label.<br />
In Oceania, project developers submitted methodologies<br />
for use under Australia’s Carbon Farming<br />
Initiative (“CFI”) program that adapted elements<br />
of existing VCS methodologies, while fi ne-tuning<br />
<strong>the</strong>m to suit <strong>the</strong> Australian context. Both <strong>the</strong> CFI and<br />
China’s independent Panda Standard continued to<br />
develop AFOLU-facing program methodologies and<br />
encourage pilot activities for use in <strong>the</strong>ir domestic<br />
markets – with <strong>the</strong> Panda Standard applying to have<br />
its methodologies eligible to issue CCERs under<br />
China’s emerging cap-and-trade pilots, which are set<br />
to launch this year.<br />
Crediting <strong>the</strong> link between carbon and water<br />
Both ACR and VCS rolled out landmark carbon<br />
accounting methodologies for wetland restoration in<br />
2012. ACR approved <strong>the</strong> world’s fi rst methodology for<br />
deltaic wetland restoration, while VCS released <strong>the</strong><br />
3. Market Infrastructure: Standards and Registries
36 State of <strong>the</strong> Voluntary Carbon Markets 2013<br />
3. Market Infrastructure: Standards and Registries<br />
standard’s fi rst requirements for crediting restoration<br />
and conservation across wetland ecosystems. As<br />
stakeholders in <strong>the</strong> payments-for-watershed-services<br />
space continue to explore new vehicles for fi nancing<br />
water quality projects, some have fl oated <strong>the</strong> possibility<br />
of “stacking” or “bundling” blue carbon projects’<br />
multiple benefi ts to watersheds through a third-party<br />
carbon standard.<br />
Tackling “o<strong>the</strong>r” land-use emissions<br />
While movement on climate-smart agriculture<br />
in international negotiations has been slow, <strong>the</strong><br />
voluntary carbon standards and projects have<br />
continued to elevate technical rigor and accessibility<br />
for this project type. VCS approved its fi rst soil<br />
carbon methodology in 2012, based on a versatile<br />
sampling method that may potentially apply to o<strong>the</strong>r<br />
landscapes including wetlands and peatlands. ACR<br />
and CAR introduced new N O fertilizer management<br />
2<br />
methodologies, while ACR saw expansion of its<br />
California Rice Production methodology to <strong>the</strong><br />
US Mid-South, as well as new methodologies for<br />
Grazing Land and Livestock Management and<br />
Avoided Conversion of Grasslands to Croplands.<br />
The Gold Standard, too, is exploring accreditation<br />
of climate-smart agriculture through its new alliance<br />
with Fairtrade and <strong>the</strong> FSC.<br />
Targeting <strong>the</strong> hard-to-reach places<br />
The Gold Standard’s micro-scale scheme gained<br />
traction in 2012, reportedly seeing a signifi cant<br />
amount of new project development that leverages <strong>the</strong><br />
scheme’s lower audit costs for projects in developing<br />
countries that will generate under 10,000 tCO 2 e/year.<br />
The Gold Standard’s 2012 alliance with Fairtrade<br />
fur<strong>the</strong>r streng<strong>the</strong>ned <strong>the</strong> network through which <strong>the</strong><br />
standard can bring carbon fi nance to smallholders.<br />
Plan Vivo also updated its standard guidelines to cover<br />
all community-based land management activities,<br />
aiming to offer more integrated certifi cation services<br />
for smallholder activities.<br />
Suppressed demand methodologies – which credit<br />
projects for avoiding future emissions resulting from<br />
more carbon-intensive development – saw <strong>the</strong>ir<br />
fi rst large-scale Gold Standard issuance for water<br />
fi lteration device distribution in Kenya. This follows <strong>the</strong><br />
mechanism’s original intent to enable larger issuances<br />
from projects that promote sustainable development.<br />
It also raised some level of concern among market<br />
practitioners that say that “baseline innovations” like<br />
suppressed demand and ex ante (i.e., forward) project<br />
crediting render <strong>the</strong> market vulnerable to external<br />
criticism.<br />
Note on fi gures<br />
We provide separate analyses for independent thirdparty<br />
standards, and domestic offset and co-benefi ts<br />
certifi cation programs, given <strong>the</strong>ir unique designs and<br />
functions.<br />
3.2 Third-Party Standards Usage in 2012<br />
In 2012, <strong>the</strong> VCS retained its position as <strong>the</strong> market’s<br />
most popular third-party standard, when VCS projects<br />
were behind a record transaction volume of 43<br />
MtCO 2 e. This represents 61% of all offsets utilizing an<br />
Figure 33: Market Share by Independent Third-Party Carbon Project Standard, 2012<br />
14% 12%<br />
61%<br />
10%<br />
1%<br />
independent third-party carbon standard (Figure 33),<br />
or 53% market share if one includes domestic offset<br />
standards (Figure 9). Last year, 52% of transacted<br />
VCS offset volume was from renewable energy<br />
projects, compared to 60% in 2011. On <strong>the</strong> fl ip side,<br />
VCS forestry offsets made up a growing proportion of<br />
<strong>the</strong> standard’s portfolio, transacting 13 MtCO 2 e or 30%<br />
of VCS volumes.<br />
Demand for Gold Standard offsets topped <strong>the</strong> 10<br />
MtCO 2 e mark for <strong>the</strong> fi rst time in <strong>the</strong> standard’s history,<br />
with much of <strong>the</strong> increase in transaction volume owing<br />
to heightened interest in <strong>the</strong> clean cookstoves and<br />
water fi lter distribution space.<br />
Volumes transacted from Chicago Climate Exchange<br />
projects around <strong>the</strong> world grew <strong>the</strong>ir market share<br />
from 3% in 2011 to 12% last year. Of this 8.3 MtCO 2 e,<br />
only one third of CCX offsets were from agriculture,<br />
forestry, and land-use projects in <strong>the</strong> US – worldwide,<br />
CCX offsets were sourced from ano<strong>the</strong>r nine locations<br />
including Costa Rica, Germany, Brazil, India, and<br />
China. CCX volume largely came from a trickle of highvolume,<br />
low-priced bilateral transactions of offsets<br />
generated before 2009.<br />
In <strong>the</strong> United States, both CAR and ACR fell in market<br />
share as both standards reoriented <strong>the</strong>ir focus to support<br />
<strong>the</strong> development of methodologies and infrastructure<br />
for California’s cap-and-trade program. The California<br />
Air Resources Board approved both programs as Offset<br />
Project Registries (“OPRs”) in late 2012.<br />
Even in light of plunging prices in <strong>the</strong> CDM market, a<br />
limited 0.7 MtCO 2 e of CDM offsets (“CERs”) reportedly<br />
found <strong>the</strong>ir way into <strong>the</strong> hands of voluntary buyers.<br />
Offset suppliers say this volume is bound to increase<br />
as a growing number of CDM project developers seek<br />
a market exit strategy that will help recoup some of <strong>the</strong><br />
losses incurred in <strong>the</strong> distressed compliance program.<br />
“Voluntary buyers are now accepting some volume<br />
of CERs, and obviously CER suppliers are keen to<br />
promote that,” says EcoInvest’s Grattan MacGiffi n, who<br />
adds that (up to now) voluntary buyers have primarily<br />
considered CERs only from <strong>the</strong> most “unique” projects.<br />
“For most CDM projects like wind and hydropower,<br />
voluntary offset supply is long for those types<br />
already,” MacGiffi n explains. “Buyers are primarily<br />
looking for interesting projects with a story behind<br />
<strong>the</strong>m, and <strong>the</strong> fact that some people may buy CERs<br />
won’t change that.”<br />
Among o<strong>the</strong>r programs, both Plan Vivo and <strong>the</strong><br />
CarbonFix program saw smaller transaction volumes<br />
State of <strong>the</strong> Voluntary Carbon Markets 2013 37<br />
in 2012, toge<strong>the</strong>r comprising less than 1% of market<br />
share. Even so, <strong>the</strong> Plan Vivo project register reported<br />
two new projects registered in early 2013 and several<br />
new projects that submitted <strong>the</strong>ir fi rst documentation<br />
in 2012. In 2012, <strong>the</strong> CarbonFix Standard continued<br />
to operate independently of The Gold Standard, but<br />
will be included in The Gold Standard’s market share<br />
in future years.<br />
Co-benefi ts standards and project area certifi cations<br />
For many voluntary buyers, a carbon offset’s contribution<br />
to social and sustainable development is as important<br />
as its climate benefi ts. Some carbon standards – The<br />
Gold Standard, Plan Vivo and CarbonFix – require<br />
that <strong>the</strong>ir projects measure up to both climate and<br />
additional social and environmental indicators that<br />
are certifi ed simultaneously. These standards are<br />
thus included in both carbon accounting and “o<strong>the</strong>r<br />
certifi cations” categories (Figures 33 and 34). On<br />
<strong>the</strong> o<strong>the</strong>r hand, purely carbon accounting standards<br />
like <strong>the</strong> VCS and ACR do not require additional cobenefi<br />
ts certifi cation – but <strong>the</strong>y do encourage project<br />
developers to pursue additional certifi cation to some<br />
standards that exclusively measure “beyond carbon”<br />
impacts. This certifi cation is <strong>the</strong>n tagged onto <strong>the</strong><br />
carbon offset and sold as a single unit.<br />
We examine all of <strong>the</strong>se programs separately in Figure<br />
34. Transacted offsets that utilize both a pure carbon<br />
accounting standard and are tagged with an additional<br />
certifi cation are included in our analysis under <strong>the</strong>ir<br />
primary carbon accounting standard in Figure 33 to<br />
prevent double-counting.<br />
Figure 34: Market Share by Co-benefi ts Standard or<br />
Project Area Label, 2012<br />
10%<br />
35%<br />
5%<br />
1% 1%
38 State of <strong>the</strong> Voluntary Carbon Markets 2013<br />
3. Market Infrastructure: Standards and Registries<br />
The volume of offsets contracted from REDD projects<br />
that are or aspire to be certifi ed to both VCS and<br />
CCB more than doubled in 2012 as demand for <strong>the</strong><br />
combination grew market-wide, with growth in activities<br />
tracked in Latin America, Africa, and Asia. Across<br />
regions, CCB was applied to 95% of transacted VCS<br />
forestry offsets (12 MtCO 2 e of 13 MtCO 2 e).<br />
VCS projects that applied <strong>the</strong> SOCIALCARBON<br />
certifi cation saw transaction volumes drop slightly to<br />
1.3 MtCO 2 e in 2012. As in previous years, certifi ed<br />
SOCIALCARBON offsets were primarily transacted<br />
from fuel switching and biomass projects in Brazil,<br />
though 2012 did see some interest in forestry offsets<br />
with SOCIALCARBON certifi cation as well.<br />
The Gold Standard program differentiates between<br />
projects that are developed exclusively for voluntary<br />
offset buyers and those that are targeted to <strong>the</strong> CDM’s<br />
compliance carbon markets and also seek additional<br />
Gold Standard certifi cation. Around half of <strong>the</strong> .7<br />
MtCO 2 e that was transacted from CDM projects in<br />
2012 was additionally certifi ed to The Gold Standard.<br />
These Gold Standard projects transacted a small<br />
proportion of CERs to voluntary buyers – compared<br />
to <strong>the</strong> bulk of Gold Standard VERs sold to voluntary<br />
buyers.<br />
Ano<strong>the</strong>r question specifi c to our forest project survey<br />
asks respondents about any additional certifi cations<br />
of forest management or forest products associated<br />
with <strong>the</strong> area in which a carbon project is developed<br />
– but which are not <strong>the</strong>mselves carbon offset<br />
certifi cations. These certifi cation programs include <strong>the</strong><br />
organic Fairtrade, Rainforest Alliance, and FSC labels.<br />
These labels are not in any way tied to carbon offsets<br />
issued to <strong>the</strong> project but do infl uence <strong>the</strong> desirability<br />
of offsets from projects occurring in certifi ed forests<br />
or that produce certifi ed forest products. This demand<br />
reportedly stems from investors’ or offset buyers’<br />
desire to support projects that clearly feature <strong>the</strong><br />
added stability of additional revenue streams and<br />
lesser risk associated with third-party certifi cation of<br />
forest products.<br />
Indeed, in <strong>the</strong> 2011 forest carbon market, we found<br />
that offset buyers were more likely to support REDD<br />
and A/R projects that promote a transition to alternative<br />
sustainable livelihoods, which in some cases included<br />
sustainable, certifi ed commodity production from<br />
forests in <strong>the</strong> carbon project area. This trend will again<br />
be analyzed in more depth in this year’s State of <strong>the</strong><br />
<strong>Forest</strong> Carbon Markets report.<br />
In 2012, 1.7 MtCO 2 e of VCS offsets were sourced from<br />
project areas where communities engaged in Fairtrade<br />
labeled productive activities. Currently, however, <strong>the</strong>re<br />
are no offsets labeled by any of <strong>the</strong>se programs under<br />
any carbon accounting standard. In 2012, The Gold<br />
Standard established <strong>the</strong> voluntary carbon market’s<br />
fi rst formal link with both Fairtrade and FSC programs<br />
so that <strong>the</strong> benefi ts of both <strong>the</strong> carbon mitigation<br />
project and o<strong>the</strong>r certifi ed activities will be “bundled”<br />
in one offset – and in <strong>the</strong> case of Fairtrade-labeled<br />
offsets, will be sold according to Fairtrade program<br />
specifi cations.<br />
Domestic standards<br />
Country-specifi c standards backed a record 9.5<br />
MtCO 2 e or 13% of all offsets transacted in <strong>the</strong><br />
voluntary carbon markets in 2012. Aside from China’s<br />
Panda Standard for forestry and land-use projects,<br />
all participating standards were developed or are<br />
administered by <strong>the</strong> public sector. For this reason,<br />
many of <strong>the</strong>m service compliance markets but sell<br />
offsets into <strong>the</strong> voluntary market, too.<br />
Domestic offset market activity was almost evenly split<br />
between offsets developed to California’s regulationbased<br />
offset protocols and Australia’s CFI, both<br />
reporting roughly 4 MtCO 2 e in 2012 transactions.<br />
Behind <strong>the</strong>se programs, New Zealand’s Permanent<br />
<strong>Forest</strong> Sink Initiative (“PFSI”) and China’s Panda<br />
Standard contributed just under 0.5 MtCO 2 e apiece,<br />
both focused on domestic A/R activities. Voluntary<br />
demand for PFSI units in NZ was modest, with some<br />
support from overseas buyers but limited domestic<br />
demand.<br />
44%<br />
Figure 35: Market Share by Domestic<br />
Project Standard, 2012<br />
4%<br />
2% 1% 1%<br />
48%<br />
California Offset Protocols<br />
CFI (Australia)<br />
Panda Standard (China)<br />
J-VER (Japan)<br />
Woodland Carbon Code (UK)<br />
Pacific Carbon Standard (BC)<br />
Notes: Based on 18 MtCO e associated with <strong>the</strong> use of an<br />
2<br />
additional co-benefi ts standard or project area label.<br />
Source: <strong>Forest</strong> <strong>Trends</strong>’ Ecosystem Marketplace.<br />
State of <strong>the</strong> Voluntary Carbon Markets 2013.
Out of <strong>the</strong> domestic programs, Japan’s J-VER program<br />
continued to draw <strong>the</strong> highest prices, at $85/tCO 2 e<br />
for forestry offsets contracted to domestic buyers<br />
motivated by philanthropic and CSR purposes. United<br />
Kingdom’s Woodland Carbon Code had a quiet year<br />
compared to 2011, but moving into 2013 piloted its<br />
fi rst grouped validation scheme in support of reduced<br />
validation costs for small-scale forest carbon project<br />
developers.<br />
3.3 Offset Prices by Standard Utilized<br />
In 2012, volume-weighted average prices ranged<br />
from under $0.1/tCO 2 e for CCX offsets to $85/tCO 2 e<br />
for offsets from Japan’s J-VER program.<br />
As in 2011, offsets certifi ed to CarbonFix or The Gold<br />
Standard commanded <strong>the</strong> highest average prices<br />
($10.7/tCO 2 e and $10/tCO 2 e, respectively), though<br />
both average prices were slightly to signifi cantly<br />
lower than 2011 levels. While both <strong>the</strong>se standards<br />
and Plan Vivo certify project benefi ts in addition to<br />
carbon accounting, <strong>the</strong>y are only included under<br />
“Independent Carbon Standard” in Figures 36 and<br />
37 to avoid redundancy. Gold Standard CERs are<br />
included under <strong>the</strong> co-benefi ts category, however, to<br />
MtCO e 2<br />
State of <strong>the</strong> Voluntary Carbon Markets 2013 39<br />
demonstrate <strong>the</strong> variation in price between <strong>the</strong>se and<br />
non-Gold Standard CERs.<br />
For several activities in <strong>the</strong> marketplace (ISO-14064<br />
and ACR-certifi ed projects, and projects implemented<br />
in FSC-certifi ed forests) signifi cantly smaller transaction<br />
volumes correlated with higher average prices.<br />
ACR offset prices rose from $5.7/tCO 2 e in 2011 to $7.4/<br />
tCO 2 e in 2012, refl ecting above average prices paid by<br />
US-based buyers like The Walt Disney Company and<br />
Chevrolet. Meanwhile, pre-compliance program offsets<br />
under <strong>the</strong> CAR program, California regulation-based<br />
offset protocols, and Australia’s CFI converged at a<br />
range between $7/tCO 2 e and $12.7/tCO 2 e as offsetting<br />
preparations picked up in <strong>the</strong> respective regions. While<br />
California regulation-based protocols and <strong>the</strong> CFI saw<br />
offset prices fall within a narrow range, CAR program<br />
offsets varied more widely as some of <strong>the</strong> program’s<br />
offsets (including low-priced landfi ll methane offsets<br />
and high-priced livestock methane offsets) continued<br />
to be sold to purely voluntary buyers at prices that<br />
varied from “typical” pre-compliance offset prices.<br />
The average price for “pure” VCS offsets (without any<br />
additional certifi cations) remained stable in 2012.<br />
Figure 36: Transacted Volume and Average Price by Various Project Standards and Certifi cations, 2012<br />
14<br />
12<br />
10<br />
8<br />
6<br />
4<br />
2<br />
0<br />
CarbonFix<br />
$11<br />
Gold Standard<br />
$9 $8 $7 $7 $7<br />
ISO-14064<br />
ACR<br />
CAR<br />
"Pure VCS"<br />
2012: 29 Mt<br />
Plan Vivo<br />
"Pure" VCS<br />
$4<br />
CDM<br />
$3 $0.1<br />
CCX<br />
Volume 2012 Max price - Min price Average price<br />
Notes: Based on 70 MtCO e associated with <strong>the</strong> use of an independent third-party project standard.<br />
2<br />
Source: <strong>Forest</strong> <strong>Trends</strong>’ Ecosystem Marketplace. State of <strong>the</strong> Voluntary Carbon Markets 2013.<br />
Gold Standard + CDM<br />
$13<br />
FSC forest area<br />
$11<br />
CCB + VCS<br />
$7 $6<br />
CCB + ISO-14064<br />
SOCIALCARBON + VCS<br />
J-VER<br />
2012: $85/<br />
tCO 2 e<br />
Independent Carbon Standard Co-benefits/Project Area Label Domestic<br />
$4<br />
J-VER<br />
CFI (Australia)<br />
$13 $10<br />
CA Offset Protocols<br />
$50<br />
$45<br />
$40<br />
$35<br />
$30<br />
$25<br />
$20<br />
$15<br />
$10<br />
$5<br />
$0<br />
$/tCO 2 e<br />
3. Market Infrastructure: Standards and Registries
40 State of <strong>the</strong> Voluntary Carbon Markets 2013<br />
3. Market Infrastructure: Standards and Registries<br />
Within this category, prices ranged from an average<br />
$1.4/tCO 2 e for VCS energy effi ciency project offsets<br />
to an average $9/tCO 2 e for a small volume transacted<br />
from VCS clean cookstove distribution project offsets.<br />
Beneath VCS, CDM project offsets without any<br />
additional Gold Standard certifi cation transacted at an<br />
average $3.4/tCO 2 e, while those with Gold Standard<br />
certifi cation – while very rarely reported – averaged $13/<br />
tCO 2 e. This premium was primarily tied to household<br />
device delivery projects or projects employing o<strong>the</strong>r<br />
unique technologies in unique locations.<br />
3.4 Offset Prices by Standard and Project Stage<br />
Because 76% of transaction volumes were concent<br />
rated around <strong>the</strong> market’s top fi ve independent<br />
standards, it is helpful to understand <strong>the</strong> variables<br />
within those standards that infl uence price. Figure<br />
38 examines some of <strong>the</strong> voluntary market’s leading<br />
project types (according to type and dominant<br />
standard) to understand <strong>the</strong> price paid for offsets at<br />
various stages of project development.<br />
42.5 MtCO 2 e or 43% of all transacted offsets were<br />
reported as being issued at <strong>the</strong> time of transaction.<br />
Even so, a few project types (particularly VCS forestry)<br />
reported offset transactions that predominantly<br />
occurred in projects’ early, pre-verifi cation stages. Both<br />
here and in <strong>the</strong> clean cookstove distribution market,<br />
buyers paid more for offset contracts occurring at later<br />
stages in <strong>the</strong> project cycle.<br />
Much like buyers had a preference for offsets from late<br />
stage forestry projects in 2011, <strong>the</strong> same was seen for<br />
Gold Standard clean cookstove projects in 2012 as a<br />
larger volume of issued offsets came online. Cookstove<br />
project developers had a more diffi cult time contracting<br />
offsets from early-stage projects in 2012, reportedly<br />
due to <strong>the</strong> fact that, based on <strong>the</strong>ir experience with<br />
recent decelerating offset prices, buyers offered<br />
signifi cantly lower prices for new forward contracts,<br />
which developers were unwilling to accept.<br />
“Looking back fi ve years ago, Gold Standard offsets<br />
from cookstove projects were trading at €15 to €16<br />
per tonne [approximately $20/tCO 2 e], and multi-<br />
Figure 37: Transacted Volume and Average Price by Various Project Standards and Certifi cations, 2011-2012<br />
MtCO 2 e<br />
14<br />
12<br />
10<br />
8<br />
6<br />
4<br />
2<br />
0<br />
CarbonFix<br />
The Gold Standard<br />
ISO-14064<br />
ACR<br />
CAR<br />
Plan Vivo<br />
"Pure" VCS<br />
"Pure VCS"<br />
2011: 36 Mt<br />
2012: 29 Mt<br />
CDM<br />
Independent Carbon Standard Co-benefits/Project Area<br />
Label<br />
Notes: Based on 70 MtCO e associated with <strong>the</strong> use of an independent third-party project standard.<br />
2<br />
Source: <strong>Forest</strong> <strong>Trends</strong>’ Ecosystem Marketplace. State of <strong>the</strong> Voluntary Carbon Markets 2013.<br />
CCX<br />
FSC forest area<br />
CCB + VCS<br />
CCB + ISO-14064<br />
J-VER<br />
CFI (Australia)<br />
Domestic<br />
Volume 2011 Volume 2012 Average price 2011 Average price 2012<br />
The Gold Standard + CDM<br />
J-VER<br />
2012:<br />
$85/tCO 2 e<br />
CA Offset Protocols<br />
$15<br />
$13<br />
$11<br />
$9<br />
$7<br />
$5<br />
$3<br />
$1<br />
-$1<br />
$/tCO 2 e
2012 2011<br />
year forward contracts were discounted from <strong>the</strong>re,”<br />
explains E+Carbon’s Cathy Diam. “Buyers see that<br />
<strong>the</strong> price has dropped quite a bit and hesitate to<br />
sign new multi-year contracts without knowing<br />
how much lower <strong>the</strong> price might go.”<br />
For those project types like renewables where <strong>the</strong><br />
average price was higher for early-stage offsets ra<strong>the</strong>r<br />
than for issued offsets, <strong>the</strong> reversal in price trend<br />
can be explained by <strong>the</strong> large existing supply of oldvintage<br />
issued offsets on <strong>the</strong> market, paired with some<br />
buyers’ preference to catalyze new project activities.<br />
3.5 Offset Project Registries: Tracking <strong>the</strong> Trades<br />
Whereas standards guide <strong>the</strong> development of offset<br />
projects and verifi able offsets, registries provide a<br />
crucial clearinghouse for tracking offsets, facilitating<br />
changes of offset ownership and, ultimately, offset<br />
retirement. Increasingly, a registry account also serves<br />
a rite of passage for offset suppliers and buyers,<br />
indicating <strong>the</strong>ir organization cleared a registry’s<br />
intensive client approval process.<br />
Registries as a whole reported record activity again in<br />
2012 as registry use and offset issuance have become<br />
a key requirement for market participation. Of <strong>the</strong> 312<br />
State of <strong>the</strong> Voluntary Carbon Markets 2013 41<br />
Figure 38: Market Share and Average Price by Project Stage, Popular Project Types 2011-2012<br />
Gold Standard Household<br />
VCS Afforestation/Reforestation<br />
VCS REDD<br />
CAR Methane<br />
Gold Standard Wind<br />
Gold Standard Household<br />
VCS Efficiency + Fuel Switch<br />
VCS Renewables<br />
VCS: All <strong>Forest</strong>ry<br />
VCS REDD<br />
VCS Afforestation/Reforestation<br />
$9.6<br />
$5.6<br />
$7 $7 $13<br />
$3.2<br />
$7.5<br />
$5.3<br />
$3.8<br />
$6<br />
$19<br />
$14.5<br />
Project Design Document (PDD) Undergoing validation Validated Issued<br />
Notes: Based on 50 MtCO e in 2012 and 4 MtCO e associated with use of select project standards,<br />
2 2<br />
project types and project stages.<br />
Source: <strong>Forest</strong> <strong>Trends</strong>’ Ecosystem Marketplace. State of <strong>the</strong> Voluntary Carbon Markets 2013.<br />
$7.6<br />
$6.4<br />
$3.5<br />
$6<br />
$2.4<br />
$6<br />
$11<br />
$12.7<br />
$1.8<br />
$8.8<br />
$7.8<br />
$7.4<br />
$12.4<br />
$7.6<br />
0% 10% 20% 30% 40% 50% 60% 70% 80% 90% 100%<br />
MtCO 2 e of verifi ed offsets that have ever been issued<br />
and tracked on a registry, 21% of this volume (66<br />
MtCO 2 e) was issued in 2012. As also seen in 2011,<br />
much of this volume was made up of older vintage<br />
offsets issued by VCS renewable energy projects,<br />
corresponding with <strong>the</strong> voluntary market’s dominant<br />
offset transaction activities in 2012.<br />
While <strong>the</strong> volume of offsets retired on a registry rose<br />
for major registries run by Markit and APX (17 MtCO 2 e,<br />
up 60%), <strong>the</strong> overall volume of retirements was pulled<br />
downward due to lower offset retirement rates through<br />
<strong>the</strong> CCX Offsets Registry. If CCX historical and 2012<br />
retirement volumes are removed, 2012 represented a<br />
record year for offset retirements (18 MtCO 2 e in 2012).<br />
Underlying <strong>the</strong>ir overall growth in activity, registries<br />
in 2012 worked to adjust <strong>the</strong>ir infrastructure in order<br />
to better facilitate activities among various market<br />
players along <strong>the</strong> offset supply chain, while partnering<br />
to support emerging domestic programs for both<br />
carbon and o<strong>the</strong>r environmental assets. These and<br />
o<strong>the</strong>r trends are highlighted in this section.<br />
Major registries see record activity, new functionality<br />
APX – servicing CAR, VCS and, most recently, ACR<br />
– experienced signifi cant growth, issuing 34 MtCO e, 2<br />
$8<br />
$7<br />
3. Market Infrastructure: Standards and Registries
42 State of <strong>the</strong> Voluntary Carbon Markets 2013<br />
3. Market Infrastructure: Standards and Registries<br />
38%<br />
Figure 39: Market Share of Issued Offsets<br />
by Registry, 2012<br />
0.5% 0.3%<br />
3% 3%<br />
4%<br />
52%<br />
APX<br />
Markit<br />
K-VER Registry<br />
GHG Clean Projects Registry<br />
CDC Climat<br />
CFI Registry<br />
J-VER Registry<br />
Sources: APX, Markit, J-VER, K-VER, CDC Climat, GHG<br />
CleanProjects Registry, and <strong>the</strong> AU CFI Registry.<br />
or 55% of all volumes that APX registries have issued<br />
over time. Last year, APX focused signifi cant effort on<br />
implementing new registry functionality to align ACR<br />
and CAR registries with <strong>the</strong> California compliance<br />
program’s Compliance Instrument Tracking System<br />
Service.<br />
“Registry activity is markedly higher already<br />
in 2013, than it was toward <strong>the</strong> end of 2012,”<br />
reports Lars Kvale, Head of Environmental Markets<br />
at APX. “This [uptick] is related mostly to California<br />
compliance-eligible projects.”<br />
The Markit Environmental Registry – which services<br />
10 carbon standards – also saw heightened activity,<br />
issuing 25 MtCO 2 e in 2012, or 34% of all offsets ever<br />
issued by Markit.<br />
Following through on its stated interest in exploring<br />
auction platforms to provide market transparency<br />
and liquidity, Markit North America signed on as<br />
auction administrator for California’s cap-and-trade<br />
program in 2012. Markit also enhanced a bid-andoffer<br />
functionality on its own registry system, not as an<br />
execution-based platform but as a platform facilitating<br />
introductions.<br />
Infrastructure providers ramp up support for<br />
jurisdictional programs<br />
As domestic carbon programs launch, major<br />
registries are increasingly targeting <strong>the</strong>ir support to<br />
jurisdictional programs – all subnational to date. In<br />
2012, ACR and CAR registries, both underpinned<br />
by APX – became offi cial Offset Project Registries<br />
20%<br />
10%<br />
Figure 40: Number of Registered Projects<br />
by Project Category, 2012<br />
3% 3%<br />
22%<br />
42%<br />
Renewables<br />
<strong>Forest</strong>ry and land use<br />
Methane<br />
Energy efficiency and fuel switch<br />
O<strong>the</strong>r<br />
Gas<br />
Sources: ACR, CAR, CarbonFix, CCB, CCX, CFI, The Gold<br />
Standard, J-VER, K-VER, Panda Standard, <strong>the</strong> Pacifi c<br />
Carbon Trust, Plan Vivo, VER+, VCS,<br />
and <strong>the</strong> Woodland Carbon Code.<br />
(“OPRs”) under California’s new cap-and-trade<br />
program and saw an uptick in new projects listed and<br />
offsets coming online for use under state-approved<br />
Early Action Quantifi cation Methodologies and<br />
California’s compliance offset protocols.<br />
In Latin America, Markit signed an MOU with Brazil’s<br />
state of Acre to develop a registry for <strong>the</strong> state’s<br />
voluntary Program of Incentives for Environmental<br />
Services. Markit is <strong>the</strong> fi rst registry to establish a<br />
program to issue and track REDD offsets at <strong>the</strong> state<br />
level that will facilitate linkages with Acre’s partners in<br />
Brazil. In July 2013, <strong>the</strong> UK’s Woodland Carbon Code<br />
registry will also go live on Markit.<br />
As o<strong>the</strong>r emerging markets like Ghana, Kenya,<br />
Uganda, Chile, and Thailand consider obtaining<br />
registry infrastructure to support emerging capacity<br />
for project development and corresponding demand<br />
for offsets, major registries are looking to provide<br />
customizable options to develop jurisdictional registries<br />
at reasonable cost.<br />
“There needs to be fl exibility in working with states<br />
and o<strong>the</strong>r governments in order to determine<br />
<strong>the</strong> right level of automation,” says Kathy Benini,<br />
Markit’s Managing Director and Global Head of<br />
Environmental Products, who acknowledges <strong>the</strong> lessexpensive<br />
alternatives like open-source software or<br />
even using Excel to manage project lists that are<br />
at jurisdictions’ disposal. “We offer governments a<br />
fl exible platform and work with <strong>the</strong>m on how to phase<br />
<strong>the</strong>ir programs in order to have <strong>the</strong> appropriate level<br />
of technology supporting <strong>the</strong>ir programs as <strong>the</strong>y<br />
evolve.”
Providers, partnerships see fl ux<br />
Table 9: Offset Issuance and Retirement by Registry, Historical and 2012<br />
ACR, which has traditionally maintained a standardspecifi<br />
c ACR registry, launched a new registry in<br />
partnership with APX in <strong>the</strong> fi rst half of 2012 that is<br />
built to serve both voluntary and compliance users. In<br />
early 2013, The Gold Standard moved its own registry<br />
platform from APX to Markit. The VCS registry system<br />
– spread across three registry providers – saw an<br />
increase in issuance activity on Markit and APX but a<br />
drop in activity on CDC Climat, which phased out its<br />
services to VCS projects by <strong>the</strong> end of 2012 for what<br />
it described as strategic reasons.<br />
Registries support beyond-carbon dialogue<br />
Registry providers – particularly Markit – continued<br />
to explore ways to provide supporting infrastructure<br />
for new markets for water and biodiversity benefi ts<br />
in addition to servicing co-benefi ts standards for<br />
carbon offset projects. This refl ects a broader push by<br />
market participants to recognize environmental assets<br />
beyond carbon emissions reductions, as well as <strong>the</strong><br />
potential for “stacking” or bundling various ecosystem<br />
assets coming from <strong>the</strong> same project area.<br />
State of <strong>the</strong> Voluntary Carbon Markets 2013 43<br />
Registry Issued, All Years Issued, 2012 Retired, All Years Retired, 2012<br />
MtCO 2 e<br />
Markit 75 25 23 11<br />
APC 63 34 11 6<br />
CCX 89 0 26 2<br />
K-VER 15 2 8 0.1<br />
CDC Climat 10 2 2 0.3<br />
GHG CleanProjects 5 2 0.7 0.4<br />
Blue Registry 4 0 1 0.01<br />
CFI 0.3 0.3 0 0<br />
J-VER 0.2 0.2 N/A N/A<br />
TOTAL 312 76 66 20<br />
Sources: Markit, APX, CCX Offsets Registry, Korea GHG Reduction Registry, CDC Climat, GHG CleanProjects Registry,<br />
BlueRegistry, Australia’s Clean Energy Regulator Registry of Offsets Projects, Japan Verifi ed Emissions Reduction Registry.<br />
The customer isn’t always right<br />
In line with revisions made by Markit, APX, and ACR<br />
to ramp up client admission requirements, market<br />
entrants offering offsets to individuals as fi nancial<br />
investments have hit a wall when trying to obtain<br />
accounts on major registries. Particularly in <strong>the</strong><br />
UK, <strong>the</strong> country’s Financial Services Authority and<br />
Insolvency Service became more active in 2012 in<br />
warning individual investors against participating in<br />
<strong>the</strong> carbon markets and conducting investigations<br />
against those potentially involved in scam activities.<br />
As one of <strong>the</strong> market’s few lines of defense against<br />
fraudulent activities in <strong>the</strong> carbon offset value chain,<br />
major registries continue to take an active role in<br />
vetting new market entrants seeking accounts on <strong>the</strong>ir<br />
registries.<br />
3.6 Registry-<strong>Report</strong>ed Activity in 2012<br />
Figures 39 and 40 and Table 9 exhibit <strong>the</strong> volume<br />
offsets issued and retired by various offset project<br />
registries, as well as <strong>the</strong> types of projects registered<br />
under various standards. For <strong>the</strong> fi rst time this year,<br />
this information is made available in full in this report<br />
3. Market Infrastructure: Standards and Registries
44 State of <strong>the</strong> Voluntary Carbon Markets 2013<br />
3. Market Infrastructure: Standards and Registries<br />
as both our research and market participants make<br />
greater use of registry information services.<br />
As in previous years, Markit Environmental Registry and<br />
APX Inc. were <strong>the</strong> most active registry service providers<br />
in <strong>the</strong> offset marketplace – as <strong>the</strong> virtual “homes” of<br />
most major offset programs. While <strong>the</strong> Markit registry<br />
platform has issued <strong>the</strong> largest volume of offsets across<br />
all years (75 MtCO 2 e), standards utilizing <strong>the</strong> APX<br />
platform issued a larger volume in 2012. Even if 2012’s<br />
6.4 MtCO 2 e Gold Standard issuance is removed, APX<br />
issued volumes were slightly higher than Markit’s (27.8<br />
MtCO 2 e). The rest of APX issuance volumes came<br />
from ACR (3 MtCO 2 e), CAR (1 MtCO 2 e) and, most<br />
prominently, VCS (14.7 MtCO 2 e). Ano<strong>the</strong>r 19.7 MtCO 2 e<br />
from VCS were issued on <strong>the</strong> Markit platform, where,<br />
in our 2013-14 report, Gold Standard issuance and<br />
retirement will also be tracked.<br />
While 96% of issued offsets were housed on <strong>the</strong>se<br />
registries or CDC Climat (which phased out operations<br />
in late 2012), we tracked a smaller volume of activity<br />
from o<strong>the</strong>r active registries.<br />
Domestic registries like <strong>the</strong> Clean Energy Regulator’s<br />
offset register under Australia’s Carbon Farming Initiative<br />
issued <strong>the</strong>ir fi rst offsets in 2012. The Chicago Climate<br />
Exchange Offsets Registry Program, fi rst launched in<br />
2011 following <strong>the</strong> close of CCX’s exchange platform,<br />
also oversaw some OTC activity for offsets from<br />
projects developed using CCX protocols. The CCX<br />
Registry never<strong>the</strong>less reported a signifi cant drop in <strong>the</strong><br />
volume of offsets retired. Registries seeing
<strong>Maneuvering</strong> <strong>the</strong> <strong>Mosaic</strong> State of <strong>the</strong> Voluntary Carbon Markets 2013<br />
4. Details of <strong>the</strong> Deals<br />
Buyers and Contract Structures
46 State of <strong>the</strong> Voluntary Carbon Markets 2013<br />
4. Details of <strong>the</strong> Deals: Buyers and Contract Structures<br />
4. Details of <strong>the</strong> Deals:<br />
Buyers and Contract Structures<br />
Every major trend in offset supply is infl uenced by<br />
buyer preferences – and every offset buyer brings<br />
to <strong>the</strong> market a unique motivation for offsetting and<br />
varying criteria that guide <strong>the</strong>ir purchases. No one<br />
is more attuned to <strong>the</strong>se motives and preferences<br />
than <strong>the</strong> offset supplier responsible for meeting <strong>the</strong>ir<br />
demands.<br />
This section describes <strong>the</strong> market’s “buy” side<br />
according to offset suppliers that responded to our<br />
survey. In 2012, 189 survey respondents reported<br />
buyer types alongside <strong>the</strong>ir transacted volumes. While<br />
2012 KEY FINDINGS<br />
some survey respondents may only be able to offer a<br />
best guess about <strong>the</strong> fate <strong>the</strong>ir offsets, <strong>the</strong> information<br />
in this section aims to connect <strong>the</strong> dots between elusive<br />
offset buyers and disaggregated offset suppliers and<br />
to contextualize market trends in 2012.<br />
4.1 Who Buys Offsets?<br />
Buyers offset a variety of activities, including <strong>the</strong>ir<br />
personal, employee, event, product, or overall corporate<br />
emissions. They may also buy offsets to prepare<br />
for <strong>the</strong> emergence of a future regulated carbon market.<br />
• In 2012, <strong>the</strong> private sector was behind 90% of offset purchases. Here, multinational corporations<br />
in North America and Europe transacted <strong>the</strong> largest offset volume of any business category (27<br />
MtCO 2 ). Close behind <strong>the</strong>se organizations were offset buyers from domestic small- to medium-sized<br />
enterprises, 82% of which were Europe-based.<br />
• Last year, offset retailers were <strong>the</strong> voluntary market’s most active offset buyer. Overall, retailers bought<br />
or supplied 50 MtCO 2 e valued at $230 million in 2012 – roughly 51% of all transacted offsets and 45%<br />
of market value.<br />
• Among offset end users, manufacturing companies topped <strong>the</strong> chart, transacting 8 MtCO 2 e in 2012.<br />
Energy utilities were next in line, transacting 7.2 MtCO 2 e and primarily based in Europe (90%). The<br />
transportation sector – particularly aviation – was behind ano<strong>the</strong>r 4 MtCO 2 e of transacted offsets.<br />
Individual offset purchases remained small (1.4 MtCO 2 e) but grew 17% from our 2011 market survey.<br />
• As in all previous years, CSR ranked at <strong>the</strong> top of <strong>the</strong> list of offsetting motivations, behind 14.3 MtCO 2 e of<br />
transacted offsets, a volume 33% less than in 2011 as some buyer intentions shifted to “demonstrating<br />
climate leadership in <strong>the</strong>ir industry” or in policy, particularly when <strong>the</strong> buyer is a “fi rst mover” in <strong>the</strong>ir<br />
sector and in <strong>the</strong> EU and US where a carbon price policies was weak to non-existent.<br />
• Survey fi ndings indicate a relationship between <strong>the</strong> types of offsets being contracted and buyers’<br />
business activities or environmental impacts. Examples of sectoral offsetting relationships are seen<br />
among buyers in agricultural and forest products sectors; <strong>the</strong> food and beverage industry; and <strong>the</strong><br />
manufacturing sector.<br />
• In 2012, suppliers reported transacting coffsets to buyers in 29 countries around <strong>the</strong> globe, from both<br />
developed and developing countries. Buyers in <strong>the</strong> EU remained <strong>the</strong> voluntary offset market’s primary<br />
source of demand for international offsets from all active project regions.
13%<br />
10%<br />
Figure 41: Market Share by Buyer Organization Type, OTC 2012<br />
1.9% 1% 1% 0.2% 0.1%<br />
31%<br />
36%<br />
Within <strong>the</strong>se divisions, buyers hail from an array of<br />
sectors, business types, and in some cases carbon<br />
market roles 6 .<br />
Private sector buys lion’s share of offsets, NGO<br />
purchases grow<br />
In 2012, <strong>the</strong> private sector was behind 90% of offset<br />
purchases. Here, multinational corporations in North<br />
America and Europe – from consultants Bain &<br />
Company to eBay – transacted <strong>the</strong> largest offset volume<br />
of any business category (27 MtCO e – Figure 41).<br />
2<br />
Close behind <strong>the</strong>se organizations were offset buyers<br />
from domestic small-to-medium-sized enterprises,<br />
82% of which were Europe-based. Suppliers explain<br />
that buyers of this size are prevalent in <strong>the</strong> EU simply<br />
because <strong>the</strong>ir awareness of carbon offsetting is raised<br />
by <strong>the</strong> presence of <strong>the</strong> EU ETS, whereas in North<br />
America, carbon offsetting is not such a household<br />
topic, so less common among small businesses.<br />
Domestic corporations – think energy utilities and<br />
domestic transportation operators – transacted<br />
ano<strong>the</strong>r 9.8 MtCO 2 e, followed by buyers in a “general<br />
private sector” category.<br />
Ano<strong>the</strong>r 8% of market share is split among nongovernmental<br />
organizations (“NGOs”), <strong>the</strong> public<br />
sector, and individual buyers – twice <strong>the</strong> share <strong>the</strong>se<br />
5%<br />
State of <strong>the</strong> Voluntary Carbon Markets 2013 47<br />
Multinational corporation<br />
Small to medium-sized enterprise<br />
Domestic corporation<br />
O<strong>the</strong>r private sector buyer<br />
O<strong>the</strong>r not-for-profit / NGO<br />
Individuals<br />
National government / public agency<br />
Conservation-focused NGO<br />
Development-focused NGO<br />
Development multilateral<br />
Notes: Based on 75 MtCO e associated with a buyer organization type.<br />
2<br />
Source: <strong>Forest</strong> <strong>Trends</strong>’ Ecosystem Marketplace. State of <strong>the</strong> Voluntary Carbon Markets 2013.<br />
types purchased in 2011. NGO buyers transacted<br />
4.4 MtCO 2 e, more than <strong>the</strong> triple <strong>the</strong>ir 2011 market<br />
participation. While a large proportion of <strong>the</strong>se buyers<br />
were unidentifi ed, suppliers reported that 13% of NGO<br />
buyers run conservation-focused programs while<br />
ano<strong>the</strong>r 4% were development-focused. The public<br />
sector made up a collective 2% of market share, hailing<br />
from governments in South Korea and Turkey, as well<br />
as a few UN agencies and development multilaterals.<br />
The public sector’s share is expected to grow in<br />
2013 based on examples like <strong>the</strong> one of German<br />
development bank KfW’s which contributed $24<br />
million to Acre state’s REDD development efforts that<br />
includes some offset purchase volume; and Australia’s<br />
$250 million commitment to buy domestic non-Kyoto<br />
compliant offsets.<br />
While individual offsetting programs are some of<br />
<strong>the</strong> most public-facing offset offerings (à la travel<br />
offsetting or o<strong>the</strong>r point-of-sale offset options),<br />
purchases remained small (1.4 MtCO 2 e) but grew<br />
17% from our 2011 market survey.<br />
In reality, individual emissions from discrete activities<br />
are low, and opportunities for individual offsetting are<br />
growing fewer as offset retailers target <strong>the</strong>ir energies<br />
toward “upstream” emitters – like utilities, industrial<br />
facilities, manufacturers, shipping companies, and<br />
6 Because it is often diffi cult to connect prominent buyers with <strong>the</strong> year in which <strong>the</strong>y bought offsets, this section references<br />
dozens of reportedly active offset buyers, but acknowledges that not all of <strong>the</strong>m may have contracted offsets in 2012, but<br />
instead in <strong>the</strong> prior or current year.<br />
4. Details of <strong>the</strong> Deals: Buyers and Contract Structures
48 State of <strong>the</strong> Voluntary Carbon Markets 2013<br />
4. Details of <strong>the</strong> Deals: Buyers and Contract Structures<br />
Andrea Abrahams, Global Director of Target Neutral<br />
Highlights<br />
Offi cial offset partner of <strong>the</strong> 2012 London Olympic Games<br />
What criteria drive your offset decision?<br />
1. Standard; 2. Community impact; 3. Vintage; 4. Project location; 5. Relationship to supply chain<br />
What is your motivation for offsetting?<br />
“To work with our customers on jointly taking action to reduce <strong>the</strong> environmental impact caused from <strong>the</strong><br />
use of our products.”<br />
Is <strong>the</strong> voluntary offset market mature? How could it improve?<br />
“Yes it is mature, especially due to <strong>the</strong> work of <strong>the</strong> International Carbon Reduction and Offset Alliance<br />
(ICROA) to set a Code of Best Practice, review standards and methodologies, and expose unscrupulous<br />
organizations.”<br />
Offset project types<br />
Olympic portfolio: VCS+CCB A/R, Kenya; VCS biomass, China; Gold Standard landfi ll, Turkey; Gold<br />
Standard wind, New Caledonia; CAR landfi ll methane, United States; VCS + SOCIALCARBON biomass,<br />
Brazil.<br />
retail product suppliers, where offsetting can be more<br />
effi ciently embedded into products and services<br />
supplied downstream. Even <strong>the</strong> latest variation of a<br />
“climate neutral credit card”, launched by South Pole<br />
Carbon and Swiss Cornèrcard in late 2011, offsets<br />
users’ emissions using <strong>the</strong> card’s marketing budget<br />
ra<strong>the</strong>r than taking <strong>the</strong> traditional route of letting<br />
cardholders cash in “points”, as airlines like air SWISS<br />
permit for members’ earned mileage points.<br />
In o<strong>the</strong>r efforts to incentivize individual action, offset<br />
retailer BP Target Neutral offered to offset for free<br />
<strong>the</strong> travel emissions of all 2012 London Olympics<br />
attendees, who could sign up online or at <strong>the</strong> event<br />
– and over 500,000 did so. Airline operator TUI Travel<br />
features an “opt-out” function for its holiday packages,<br />
whereby if buyers don’t actively opt out of <strong>the</strong> offset<br />
option, <strong>the</strong>ir travel emissions are offset. Virgin America<br />
fl ights enable travelers to purchase offsets from <strong>the</strong><br />
touch screen on <strong>the</strong> back of airplane seats – making a<br />
direct connection between <strong>the</strong> offset purchase choice<br />
and <strong>the</strong> activity being offset.<br />
4.2 Which Business Sectors Actively Offset Their<br />
Emissions?<br />
If and how companies choose to offset <strong>the</strong>ir emissions<br />
is often determined by <strong>the</strong>ir line of work. Some buyers<br />
choose to offset because <strong>the</strong>ir business is primarily<br />
Table 10: Buyer Profi le: BP Target Neutral<br />
Source: <strong>Forest</strong> <strong>Trends</strong>’ Ecosystem Marketplace. State of <strong>the</strong> Voluntary Carbon Markets 2013.<br />
consumer-facing (like retail operations) or to offer<br />
offset options to <strong>the</strong>ir customers (like <strong>the</strong> transportation<br />
sector). Still o<strong>the</strong>rs, because of supply chain or<br />
regulatory risks and opportunities (like manufacturers<br />
and <strong>the</strong> fi nancial sector).<br />
Last year, offset retailers were <strong>the</strong> voluntary market’s<br />
most active offset buyer. Carbon offset retailers<br />
contributed signifi cant value to <strong>the</strong> market, picking up<br />
over half of all project developers’ transacted volumes<br />
and providing multiple services to offset end users.<br />
Overall, retailers bought or supplied 50 MtCO 2 e valued<br />
at $230 million in 2012, roughly 51% of all transacted<br />
offsets and 45% of market value.<br />
As described on Section 2.1, a large proportion of<br />
retailers’ 2012 transaction volumes (both purchases<br />
and sales) was comprised of inexpensive renewable<br />
energy offsets for which <strong>the</strong>y could obtain a suffi cient<br />
margin in order to sometimes sell more expensive<br />
offset types at cost or at a loss, while continuing to<br />
pay project developers average or above-average<br />
prices (depending on <strong>the</strong> project type). This “basket<br />
approach” is also refl ected in Figure 42, which<br />
illustrates a common retail strategy taken to remain<br />
profi table while continuing to add value to projects<br />
and clients. Of all retailer offset buyers captured in<br />
<strong>the</strong>se fi ndings, 83% were based in Europe.
Figure 42: Transacted Volume Sold to and by Retailers, OTC 2012<br />
Renewables<br />
<strong>Forest</strong>ry and land use<br />
Household device<br />
Gases<br />
Energy efficiency and fuel switch<br />
Methane<br />
Among offset end users, manufacturing companies<br />
topped <strong>the</strong> chart, transacting 8 MtCO 2 e in 2012. Twothirds<br />
of this volume was contracted to North Americabased<br />
manufacturers like Chevrolet, while ano<strong>the</strong>r<br />
30% went to manufacturers in <strong>the</strong> UK.<br />
Energy utilities were next in line, transacting 7.2 MtCO 2 e<br />
and primarily based in Europe (90%). Even though<br />
European utilities are capped under <strong>the</strong> EU ETS,<br />
State of <strong>the</strong> Voluntary Carbon Markets 2013 49<br />
Sold to retailers Sold by retailers<br />
13.6 Mt 9.5 Mt<br />
5.4 Mt<br />
2.5 Mt<br />
2.2 Mt<br />
1.5 Mt<br />
1 Mt<br />
1.9 Mt<br />
1.9 Mt<br />
1.5 Mt<br />
Source: <strong>Forest</strong> <strong>Trends</strong>’ Ecosystem Marketplace. State of <strong>the</strong> Voluntary Carbon Markets 2013.<br />
3%<br />
2%<br />
3%<br />
2%<br />
4%<br />
6%<br />
4%<br />
7%<br />
13%<br />
Figure 43: Market Share by Buyer Sector, 2012<br />
5%<br />
13%<br />
38%<br />
1 Mt<br />
2.5 Mt<br />
companies like Germany’s ENTEGA offer customers<br />
carbon- or “climate-neutral” energy products, typically<br />
supporting co-benefi ts-heavy international offset<br />
projects. Suppliers say this type of action is likely to<br />
escalate if EU policy makers fail to address <strong>the</strong> region’s<br />
defl ated carbon price.<br />
Companies in <strong>the</strong> transportation sector – particularly<br />
aviation – were ano<strong>the</strong>r signifi cant offset buyer in<br />
Carbon Market<br />
Manufacturing<br />
Energy<br />
Transportation (air, rail, etc.)<br />
Finance / insurance<br />
Agriculture / forestry<br />
Events / entertainment<br />
Retail product market<br />
Communication / information<br />
Food and beverage<br />
Tourism<br />
O<strong>the</strong>r / mixed<br />
Notes: Based on 57 MtCO e associated with a buyer organization type.<br />
2<br />
Source: <strong>Forest</strong> <strong>Trends</strong>’ Ecosystem Marketplace. State of <strong>the</strong> Voluntary Carbon Markets 2013.<br />
4. Details of <strong>the</strong> Deals: Buyers and Contract Structures
50 State of <strong>the</strong> Voluntary Carbon Markets 2013<br />
4. Details of <strong>the</strong> Deals: Buyers and Contract Structures<br />
2012, behind ano<strong>the</strong>r 4 MtCO 2 e of transacted offsets.<br />
This sector was represented by dozens of names<br />
worldwide, like Hostelling International, Qantas, Kenya<br />
Airways, TUI Travel, Spirit of Japan Travel agency,<br />
Virgin America and Virgin Atlantic, United Airlines,<br />
Amtrak, and Lufthansa. Suppliers say that, despite <strong>the</strong><br />
transportation sector’s enormous carbon footprint, this<br />
volume is not larger because most companies’ offset<br />
programs still rely on individual travelers to voluntarily<br />
“opt in” to an offset transaction – and often not at <strong>the</strong><br />
point of sale or travel.<br />
Offsetting sporting and o<strong>the</strong>r events featured<br />
prominently among a few regions’ top buyer<br />
motivations in 2012 – of which one of <strong>the</strong> most<br />
recognizable was BP Target Neutral’s 2012 London<br />
Olympic Games offsetting program, which set a<br />
record for <strong>the</strong> largest number of individual attendees<br />
to offset <strong>the</strong>ir journey to a single event. A follow-up<br />
assessment of <strong>the</strong> program’s performance, however,<br />
said that uptake could have been stronger if, over <strong>the</strong><br />
course of <strong>the</strong> event, due media attention had been<br />
paid to global sustainability issues, including climate<br />
change. The Commission review concluded, “It will<br />
be important for future events to try and establish<br />
a baseline of changed consumer preferences<br />
resulting from engagement in travel offset<br />
programmes so that learnings can be ga<strong>the</strong>red<br />
Derek Sabori, Senior Director, Department of Sustainability<br />
about what works best and why, during and after<br />
<strong>the</strong> programme has been implemented.” O<strong>the</strong>r<br />
signifi cant event offset programs included US-based<br />
utility Entergy’s offsetting of <strong>the</strong> 2012 Superbowl XLVI<br />
and ongoing preparations for <strong>the</strong> 2014 FIFA World<br />
Cup, hosted in Rio de Janeiro, Brazil.<br />
4.3 What Motivated Offset Buyers in 2012?<br />
Refl ecting offset retailers’ sizable demand in 2012,<br />
<strong>the</strong> most common buyer motivation behind offset<br />
transactions was resale. Beyond this, Table 12<br />
describes offset end buyers motivations, which<br />
saw a signifi cant shift last year when we added a<br />
new motivation to our list of survey options – that of<br />
demonstrating climate leadership within a buyer’s<br />
industry or in policy. This option was added in <strong>the</strong><br />
2012-13 survey based on feedback from several<br />
prominent offset buyers in 2011. As it turns out, <strong>the</strong>y<br />
weren’t alone in this motivation, which was <strong>the</strong> second<br />
most popular reason for private sector offset end use<br />
purchases, globally.<br />
As in all previous years, though, CSR ranked at <strong>the</strong><br />
top of <strong>the</strong> list, behind 14.3 MtCO 2 e of transacted<br />
offsets, a volume 33% less than in 2011. Suppliers say<br />
this decline is not only a function of <strong>the</strong> new survey<br />
question, which inherently overlaps with some CSR<br />
Highlights<br />
2012: Offset company-hosted surfi ng events, in addition to parent company Kering’s (formerly PPR Group)<br />
existing offsetting commitment<br />
What criteria drive your offset decision?<br />
1. Community impact; 2. Standard; 3. Relationship to supply chain; 4. Project location; 5. Vintage<br />
What is your motivation for offsetting?<br />
“For all of our effort to reduce our environmental impact, we realized that we still have a carbon footprint.<br />
As we move along with our carbon reduction initiatives, <strong>the</strong> idea of offsetting what’s left is becoming more<br />
tangible.”<br />
Is <strong>the</strong> voluntary offset market mature? How could it improve?<br />
“Without a crash course on offsetting or someone to walk you through it, [offsetting] can be very<br />
overwhelming and easily bypassed and also hard to justify as an expense when pushing <strong>the</strong> idea up <strong>the</strong><br />
company ladder – because it’s such a unique market.”<br />
Offset project types<br />
Volcom portfolio: VCS + CCB REDD in Kenya<br />
Table 11: Buyer Profi le: Volcom, Inc.<br />
Source: <strong>Forest</strong> <strong>Trends</strong>’ Ecosystem Marketplace. State of <strong>the</strong> Voluntary Carbon Markets 2013.
intentions and resources. It also speaks to voluntary<br />
buyers’ increasingly holistic take on offsetting as a<br />
“one-to-many” key to fi nancially incentivizing internal<br />
and external climate, social and political action.<br />
“We need to go fur<strong>the</strong>r than just having CSR,” said<br />
Puma General Manager Martyn Bowen in a speech<br />
about <strong>the</strong> company’s REDD offset investments.<br />
“We need to go fur<strong>the</strong>r than just doing less bad.<br />
We need to start doing more good.”<br />
Indeed, media and NGO communities have not always<br />
been kind to companies’ choice to offset, to <strong>the</strong> extent<br />
that those who continue to operate in this space have<br />
formed increasingly sophisticated arguments for<br />
offsetting. It also might explain why, year-on-year, <strong>the</strong><br />
volume of offsets transacted explicitly for marketing<br />
and public relations purposes continues to fall down <strong>the</strong><br />
list of motivations (down 71% from 2011). In its place,<br />
demonstrating corporate leadership – particularly<br />
when <strong>the</strong> buyer is a “fi rst mover” in <strong>the</strong>ir sector and in<br />
<strong>the</strong> EU and US where carbon price policies are weak<br />
to non-existent – increasingly motivates corporates<br />
who really want to offset. And in some cases, that’s<br />
exactly how <strong>the</strong>y’re communicating it – “because we<br />
wanted to.”<br />
“The more we as a company learn about offsetting and<br />
how important <strong>the</strong>se programs are, it just becomes<br />
more important,” says clothing brand Volcom’s Senior<br />
Table 13: Buyer Profi le: Interface, Inc.<br />
Buddy Hay, Assistant VicePresident, Sustainable Strategies<br />
State of <strong>the</strong> Voluntary Carbon Markets 2013 51<br />
Table 12: Offset End Users’ Top Offsetting<br />
Motivations, 2012<br />
Motivation<br />
Ranking by %<br />
Share<br />
CSR 34%<br />
Demonstrating climate leadership 26%<br />
Pre-compliance 19%<br />
PR / branding 10%<br />
Climate-driven mission / philanthropy 9%<br />
Notes: Based on 42 MtCO e associated with an offset<br />
2<br />
end user motivation.<br />
Source: <strong>Forest</strong> <strong>Trends</strong>’ Ecosystem Marketplace.<br />
State of <strong>the</strong> Voluntary Carbon Markets 2013.<br />
Sustainability Director Derek Sabori. “As far as our<br />
con su mers go, I haven’t had any feedback on our<br />
program and think it’s a bit too esoteric to resonate<br />
with <strong>the</strong>m. But it’s a large concept that you have to<br />
appreciate no matter what. We’ve committed to it<br />
and will keep doing it.”<br />
O<strong>the</strong>r examples of this kind of offsetting activism include<br />
both The Walt Disney Company’s and Microsoft’s<br />
self-imposed internal carbon tax levied on business<br />
Highlights<br />
Large-scale offset buyer for 10 years<br />
What criteria drive your offset decision?<br />
1. Standard; 2. Vintage; 3. Project location; 4. Community impact; 5. Relationship to supply chain<br />
What is your motivation for offsetting?<br />
“To provide our customers with a product that is carbon neutral for <strong>the</strong> full life-cycle – from raw material<br />
extraction to end of life of <strong>the</strong> project – in keeping with our company’s Mission Zero goal.”<br />
Is <strong>the</strong> voluntary offset market mature? How could it improve?<br />
“Yes. When <strong>the</strong> market today—with numerous projects available, globally recognized standards and<br />
web-based registries—is compared with <strong>the</strong> market 10 years ago, <strong>the</strong>re is a tremendous difference that<br />
provides <strong>the</strong> structure and accountability needed to ensure that you are buying quality offsets.”<br />
Offset project types<br />
Examples from current portfolio: VCS A/R, Guatemala; VCS + SOCIALCARBON biomass, Brazil; VCS fuel<br />
switching, US; VCS wind, China; VCS+CCB REDD, Kenya<br />
Source: <strong>Forest</strong> <strong>Trends</strong>’ Ecosystem Marketplace. State of <strong>the</strong> Voluntary Carbon Markets 2013.<br />
4. Details of <strong>the</strong> Deals: Buyers and Contract Structures
52 State of <strong>the</strong> Voluntary Carbon Markets 2013<br />
4. Details of <strong>the</strong> Deals: Buyers and Contract Structures<br />
divisions that incentivizes internal emissions reductions<br />
while operations realize <strong>the</strong> real business cost of carbon<br />
and also leverage <strong>the</strong> revenues raised to support <strong>the</strong>ir<br />
international offset programs. Also at REDD Talks, an<br />
event hosted by REDD campaign Code REDD in April<br />
2013, Microsoft’s Tamara “TJ” DiCaprio said that pricing<br />
carbon within <strong>the</strong> company has led to a sea change. “It<br />
was very important to start speaking about carbon in<br />
terms of dollars,” she said. “The impact on <strong>the</strong> business<br />
has been signifi cant. Folks are engaged now.”<br />
The desire to offset emissions regardless of <strong>the</strong> activity’s<br />
“esoteric” nature also extends to o<strong>the</strong>r motivations, even<br />
branding and public relations. US-based Interface, Inc.<br />
purchases approximately 400,000 MtCO 2 e every year<br />
to make <strong>the</strong>ir product carbon neutral. Buddy Hay, who is<br />
in charge of <strong>the</strong> offset purchases for Interface, says that<br />
perhaps <strong>the</strong>re may only a small subset of customers who<br />
fully appreciate carbon neutrality, but he still believes<br />
<strong>the</strong> company’s Cool Carpets campaign gives <strong>the</strong>m a<br />
market advantage. Talking about Interface’s carbon<br />
initiatives “gives our salespeople ano<strong>the</strong>r reason to get<br />
in front of <strong>the</strong>ir customer,” he says.<br />
Finance/insurance<br />
Manufacturing<br />
Carbon market<br />
Events/entertainment<br />
Retail product market<br />
Transportation (aviation, rail, etc.)<br />
Mixed/o<strong>the</strong>r<br />
Communication/information<br />
Food and beverage<br />
Agriculture/forestry<br />
4.4 Are Companies Considering Their Supply Chain in<br />
Offset Purchase or Project Investment Decisions?<br />
Both Volcom and PUMA brands are subsidiary brands<br />
of Kering (formerly PPR Group) which took an early<br />
stake in REDD project developer Wildlife Works. Here,<br />
PUMA’s employment of <strong>the</strong> Kasigau Corridor project’s<br />
sustainable clothing factory into its production chain<br />
highlights offsetters’ growing interest in supporting<br />
projects that have a real or symbolic relationship to<br />
<strong>the</strong>ir business model.<br />
Despite <strong>the</strong> fact that supply chain management features<br />
prominently in <strong>the</strong> recent offset market conversation,<br />
no 2012-13 survey respondents reported buyers that<br />
supported projects directly impacting <strong>the</strong>ir scope 3<br />
emissions or sphere of infl uence (a.k.a. “insetting”).<br />
Even so, Ecosystem Marketplace has tracked a few<br />
companies that are taking this approach to mitigate<br />
climate risks to <strong>the</strong>ir business models or stakeholders.<br />
One example is US-based energy utility Entergy’s<br />
support to Tierra Resources for <strong>the</strong> development<br />
of a delta wetland restoration project methodology<br />
Figure 44: Buyer Sectors’ Demand by Project Category, OTC 2012<br />
Energy<br />
Tourism<br />
0% 10% 20% 30% 40% 50% 60% 70% 80% 90% 100%<br />
Renewables <strong>Forest</strong>ry and agriculture Methane<br />
Clean cookstoves and water purifiers Gases Efficiency and fuel switching<br />
O<strong>the</strong>r<br />
Notes: Based on 57 MtCO e associated with a buyer organization type.<br />
2<br />
Source: <strong>Forest</strong> <strong>Trends</strong>’ Ecosystem Marketplace. State of <strong>the</strong> Voluntary Carbon Markets 2013.
Volume<br />
purchased<br />
(Million tonnes)<br />
43.4 M<br />
29.6 M<br />
5.7 M<br />
1.9 M<br />
0.3 M<br />
to be piloted in Entergy’s sou<strong>the</strong>astern US service<br />
region. Chuck Barlow, Entergy’s vice president of<br />
environmental strategy and policy, describes <strong>the</strong><br />
project’s potential risk mitigating implications for <strong>the</strong>ir<br />
service area infrastructure. “With operations that<br />
include Louisiana, Mississippi, and Texas, Entergy<br />
values wetlands as a fi rst line of defense against<br />
storm surge and fl ooding, and <strong>the</strong>ir protection and<br />
restoration are vital to <strong>the</strong> sustainability of coastal<br />
Louisiana,” Barlow says.<br />
Ano<strong>the</strong>r insetting example is Swiss retail group Coop’s<br />
direct investment in <strong>the</strong> development of a Gold<br />
Standard clean cookstove aimed at benefi tting <strong>the</strong><br />
community in and around Kenya’s Oserian Flower<br />
Farm – one of Co-op’s suppliers of Fairtrade- certifi ed<br />
roses. “As a responsible retail company it is natural<br />
for us to engage in projects that improve <strong>the</strong><br />
living conditions for <strong>the</strong> people working along our<br />
supply chains” notes Peter Küng, Co-op’s Head of<br />
Purchasing Flowers & Plants, in <strong>the</strong> context of its<br />
2012 media outreach.<br />
While our report survey did not track any direct<br />
insetting on <strong>the</strong> part of 2012 buyers, analysis does<br />
indicate a relationship between <strong>the</strong> types of offsets<br />
State of <strong>the</strong> Voluntary Carbon Markets 2013 53<br />
Figure 45: Transacted Volume, Value and Average Price by Buyer Region, OTC 2012<br />
Buyer region<br />
value<br />
($ Million)<br />
204.9 M<br />
142.9 M<br />
14.3 M<br />
35.4 M<br />
2.6 M<br />
Buyer region<br />
Europe<br />
North<br />
America<br />
Oceania<br />
Asia<br />
Latin<br />
America<br />
36%<br />
9%<br />
Buyer share<br />
of market value<br />
4% 1%<br />
Notes: Based on 81 MtCO e associated with a buyer region.<br />
2<br />
Source: <strong>Forest</strong> <strong>Trends</strong>’ Ecosystem Marketplace. State of <strong>the</strong> Voluntary Carbon Markets 2013.<br />
being contracted and buyers’ business activities or<br />
environmental impacts. While not analyzed in this<br />
report, suppliers and buyers also describe <strong>the</strong> important<br />
connection between where <strong>the</strong>y do business and <strong>the</strong><br />
choice of offset project location. As seen in Figure 44,<br />
noteworthy examples sectoral offsetting relationships<br />
are seen among buyers in <strong>the</strong> agricultural and forest<br />
products sector (73% of offsets transacted from <strong>the</strong><br />
land-use and forestry sectors); <strong>the</strong> food and beverage<br />
industry (74% of offsets transacted from <strong>the</strong> landuse<br />
and forestry sectors); and manufacturing sector<br />
(80% of offsets transacted from energy effi ciency and<br />
renewable energy projects).<br />
4.5 Where Are Offset Buyers Located?<br />
51%<br />
This report examines buyers’ market share not only<br />
by <strong>the</strong> region, but also <strong>the</strong> country where <strong>the</strong>y or <strong>the</strong>ir<br />
businesses are located. In 2012, suppliers reported<br />
transacting offsets to buyers in 29 countries around <strong>the</strong><br />
globe, representing three more country locations than<br />
in 2011, and from both developed and developing<br />
countries.<br />
Regional market dynamics are explored in more<br />
depth in <strong>the</strong> report section Regional Market Deep<br />
4. Details of <strong>the</strong> Deals: Buyers and Contract Structures
54 State of <strong>the</strong> Voluntary Carbon Markets 2013<br />
4. Details of <strong>the</strong> Deals: Buyers and Contract Structures<br />
Table 14: Volume and Value Transacted by Buyer<br />
Region and Top Country Locations, OTC 2012<br />
Location<br />
Volume<br />
(MtCO 2 e)<br />
Value<br />
($ Million)<br />
Europe 43.4 $205<br />
Of which United<br />
Kingdom<br />
Of which<br />
Ne<strong>the</strong>rlands<br />
22 $80<br />
5 $24<br />
Of which France 4.8 $31<br />
Of which Germany 4.6 $22.5<br />
Of which<br />
Switzerland<br />
4.5 $44<br />
Of which Sweden 0.4 $3<br />
Of which Spain 0.2 $1.4<br />
North America 29.6 $143<br />
Of which United<br />
States<br />
28.6 $137<br />
Of which Canada 1 $6.4<br />
Oceania 5.7 $14<br />
Of which Australia 5.6 $14<br />
Asia 2 $35<br />
Of which Japan 0.5 $19<br />
Of which Korea 0.15 $1.6<br />
Latin America 0.3 $3<br />
Of which Brazil 0.2 $1.5<br />
% Share<br />
(Volume)<br />
54%<br />
37%<br />
7%<br />
2%<br />
0.4%<br />
Source: <strong>Forest</strong> <strong>Trends</strong>’ Ecosystem Marketplace.<br />
State of <strong>the</strong> Voluntary Carbon Markets 2013.<br />
Dive. At a high level, buyers in <strong>the</strong> EU remained <strong>the</strong><br />
voluntary offset market’s primary source of demand for<br />
international offsets from all active project regions –<br />
even transacting a small volume of offsets from North<br />
America. A full 39% of offsets sold to this region were<br />
contracted to offset retailers to supply to <strong>the</strong>ir end<br />
clients. Combined, European retail offset suppliers are<br />
<strong>the</strong> world’s primary hub for purely voluntary carbon<br />
management services.<br />
Offset buyers in <strong>the</strong> US were reported as <strong>the</strong> most<br />
active offset market in a single country. In contrast<br />
to European buyers and in keeping with previous<br />
years’ fi ndings, US-based offset buyers continued to<br />
primarily seek offsets from projects within <strong>the</strong>ir border.<br />
While some suppliers don’t see this dynamic changing<br />
any time soon, o<strong>the</strong>rs point to Microsoft’s high-profi le,<br />
internationally-based offset portfolio as a sign that<br />
multinational corporations’ offset choices may begin<br />
to refl ect <strong>the</strong>ir growing awareness of offsetting as a<br />
tool to address <strong>the</strong>ir international business impacts<br />
and risks.<br />
Beyond Europe and North America, offsetting in<br />
developing country regions remained muted in 2012.<br />
Developing regions worldwide reported carbon price<br />
mechanisms under development, however, that may<br />
eventually turn some locations from international<br />
sources of offset supply into regional sources of<br />
demand. Recent examples include several countrylevel<br />
proposals to <strong>the</strong> World Bank’s Partnership for<br />
Market Readiness (PMR) that describe counties<br />
preparing to design or implement domestic carbon<br />
price mechanisms. Costa Rica and Turkey, for<br />
example, aim to harness voluntary market activities<br />
to inform or underpin <strong>the</strong>ir near-term efforts. O<strong>the</strong>r<br />
programs, including some of China’s domestic<br />
pilots and South Africa’s draft carbon tax, indicate a<br />
willingness to recognize offsets certifi ed to standards<br />
that were originally developed for voluntary buyers.<br />
Offset suppliers have long awaited this kind of<br />
regulatory affi rmation of voluntary market maturity<br />
and new market development, but are realizing<br />
that developing country-based offsetters require a<br />
signifi cant amount of up-front capacity building.<br />
“Buyers in Latin America are generally not yet an<br />
educated market,” points out South Pole Carbon’s<br />
Christian Dannecker, “and even if <strong>the</strong>y know to seek<br />
out tonnes that use a credible standard, sometimes<br />
<strong>the</strong>re is no supply available in <strong>the</strong>ir country or <strong>the</strong> offset<br />
price is too high because it’s targeted at international<br />
buyers.”<br />
Colombia’s emerging voluntary market, as well as<br />
corporate engagement programs through <strong>the</strong> Santiago<br />
Climate Exchange, have already begun engaging <strong>the</strong><br />
domestic private sector in order to build both domestic<br />
supply and capacity for offset market engagement.<br />
These efforts have begun to pay off, seeing<br />
prominent purchases of domestic offsets from notable<br />
companies including Brazil’s Natura Cosméticos;<br />
Chilean wine producer Concha y Toro; and Brazilian<br />
media conglomerate Grupo Abril. Elsewhere, Hilton<br />
Asia announced a regional events offsetting program<br />
to support Asia-based forestry and clean cookstove
100%<br />
90%<br />
80%<br />
70%<br />
60%<br />
50%<br />
40%<br />
30%<br />
20%<br />
10%<br />
Figure 46: Historical Market Share, Transacted<br />
Volume by Payment Method<br />
0%<br />
2008 2009 2010 2011 2012<br />
Spot Pre-payment Pay on delivery Options<br />
Notes: Based on 65.5 MtCO 2 e associated<br />
with a contract type.<br />
Source: <strong>Forest</strong> <strong>Trends</strong>’ Ecosystem Marketplace.<br />
State of <strong>the</strong> Voluntary Carbon Markets 2013.<br />
projects, while state-owned South African Airways<br />
said it was exploring <strong>the</strong> possibility of implementing a<br />
voluntary domestic forestry offset project.<br />
4.6 What Were <strong>the</strong> Terms of Payment and Offset<br />
Delivery?<br />
Offsets contracted voluntarily are obtained “over-<strong>the</strong>counter,”<br />
where transactions are guided by several<br />
types of contract structures, including:<br />
Spot transaction: Offsets and payment are exchanged<br />
instantaneously. Some organizations also accept<br />
payments to retire offsets on <strong>the</strong> payee’s behalf. This<br />
type of transaction may be included in this category<br />
or in <strong>the</strong> “pre-payment” category, depending on <strong>the</strong><br />
offset project’s stage.<br />
Pre-payment versus Pay-on-Delivery (POD): Future<br />
offset delivery (may be near or distant future) is paid<br />
for up front (Pre-Pay) or upon delivery (POD). Prepayment<br />
is typically preferable to project developers<br />
seeking up front project fi nancing, but may incur a<br />
discount depending on <strong>the</strong> potential delivery risk<br />
incurred by <strong>the</strong> buyer.<br />
Firm versus Unit-Contingent delivery: Contracts also<br />
specify <strong>the</strong> quantity of offsetss to be delivered, ei<strong>the</strong>r<br />
100%<br />
90%<br />
80%<br />
70%<br />
60%<br />
50%<br />
40%<br />
30%<br />
20%<br />
10%<br />
0%<br />
State of <strong>the</strong> Voluntary Carbon Markets 2013 55<br />
Figure 47: Transacted Volume by Vintage<br />
and Buyer Type, OTC 2012<br />
PRE-2006<br />
2006<br />
2007<br />
2008<br />
Retailer Offset end user<br />
2009<br />
2010<br />
2011<br />
2012<br />
2013<br />
2014<br />
2015<br />
2016<br />
POST-2016<br />
Notes: Based on 65.5 MtCO 2 e associated<br />
with a contract type.<br />
Source: <strong>Forest</strong> <strong>Trends</strong>’ Ecosystem Marketplace.<br />
State of <strong>the</strong> Voluntary Carbon Markets 2013.<br />
as a “fi rm” volume or a fl exible volume contingent upon<br />
how many offsets <strong>the</strong> project eventually issues. Pricing<br />
for <strong>the</strong>se different options can vary according to lots of<br />
o<strong>the</strong>r factors that are described throughout this report.<br />
In 2012, a sizeable portion of market value (64%<br />
associated with a contract type or $170 million) was<br />
paid to offset sellers at <strong>the</strong> point of transaction ra<strong>the</strong>r<br />
than offset delivery – primarily via spot contracts<br />
(35.6 MtCO 2 e, up 25% from 2011) and pre-payment<br />
for future delivery (8.7 MtCO 2 e, down 1% from 2011).<br />
Ano<strong>the</strong>r $97.5 million will be paid in future years, if and<br />
when <strong>the</strong> projects under contract deliver verifi able<br />
reductions. As seen in Figure 46, this fi nding refl ects a<br />
signifi cant shift in contract structures favoring upfront<br />
payments as <strong>the</strong> volume of verifi ed tonnes has grown<br />
over time, boosting both offset supply and buyer<br />
confi dence that projects are capable of verifying GHG<br />
reductions and delivering offsets.<br />
Some project developers say that <strong>the</strong> year’s lower<br />
reporting of investment in new project activities is<br />
partly related to just this – a focus on offset delivery<br />
and ensuring sustainability of existing projects ra<strong>the</strong>r<br />
than piloting new projects.<br />
“Now that we have issued credits, we’re focusing<br />
on moving those ra<strong>the</strong>r than on doing complicated<br />
4. Details of <strong>the</strong> Deals: Buyers and Contract Structures
56 State of <strong>the</strong> Voluntary Carbon Markets 2013<br />
4. Details of <strong>the</strong> Deals: Buyers and Contract Structures<br />
new contracts,” says Conservation International’s<br />
Agustin Silvani of <strong>the</strong> organization’s Peru-based<br />
REDD project. “Offset issuance gave us some<br />
breathing room. Once you get into a cycle of<br />
verifying reductions every year or two, you can<br />
focus your energies on fi nding <strong>the</strong> capital to<br />
support <strong>the</strong> project.”<br />
The way in which offset payment and delivery are<br />
contracted does ultimately infl uence <strong>the</strong>ir price, as<br />
seen in Table 15. Here, spot contracts see <strong>the</strong> lowest<br />
unit prices, though this price is <strong>the</strong> aggregation of<br />
millions of contracted tonnes, <strong>the</strong> prices for which vary<br />
highly by o<strong>the</strong>r factors like project type and standard<br />
(Figure 38).<br />
Contracts specifying a fi rm delivery of tonnes (as<br />
opposed to a delivery volume that is contingent<br />
upon <strong>the</strong> volume of tonnes issued to a project) were<br />
associated with <strong>the</strong> highest average prices. This<br />
refl ects a lower risk to <strong>the</strong> buyer if <strong>the</strong> contract places<br />
a liability on <strong>the</strong> offset supplier to make up any shortfall<br />
with tonnes from o<strong>the</strong>r projects in <strong>the</strong> marketplace;<br />
from future issuances from <strong>the</strong> same projects; or via<br />
refund or o<strong>the</strong>r arrangement.<br />
With regard to forward transactions, as seen in Figure<br />
47 we tracked a larger volume of offsets from future<br />
vintages contracted by offset end users, ra<strong>the</strong>r than<br />
by offset retailers. As seen in several regional fi gures<br />
that track price by vintage, <strong>the</strong> vast majority of forward<br />
contracts were associated with offset projects in North<br />
America and thus represent pre-compliance activity,<br />
ra<strong>the</strong>r than purely voluntary offset project investment.<br />
On <strong>the</strong> purely voluntary side of <strong>the</strong> marketplace (i.e.,<br />
<strong>the</strong> market for offsets from projects in developing<br />
countries) less than a dozen forward contracts<br />
occurred and primarily between project developers<br />
and (again) end buyers of forest carbon offsets.<br />
Table 15: Transacted Volume and Average Price by<br />
Payment and Delivery Terms<br />
Payment<br />
Type<br />
POD<br />
Pre-pay<br />
POD<br />
Pre-pay<br />
Delivery<br />
Type<br />
Volume<br />
(MtCO 2 e)<br />
Average Price<br />
Spot 35.6 M $3.4/t<br />
Unit<br />
contingent<br />
Unit<br />
contingent<br />
Mix, unit<br />
contingent<br />
and fi rm<br />
Mix, unit<br />
contingent<br />
and fi rm<br />
13.1 M $4.2/t<br />
4.7 M $5.5/t<br />
2.1 M $5.5/t<br />
1.3 M $7/t<br />
POD Firm 3 M $9.3/t<br />
Pre-pay Firm 2.7 M $9.3/t<br />
Notes: Based on 65.5 MtCO e associated with a<br />
2<br />
contract structure.<br />
Source: <strong>Forest</strong> <strong>Trends</strong>’ Ecosystem Marketplace.<br />
State of <strong>the</strong> Voluntary Carbon Markets 2013.<br />
As one offset retailer puts it, <strong>the</strong> retail sector’s lack of<br />
forward offset contracting is “not for lack of trying.”<br />
They and o<strong>the</strong>r retailers explain that <strong>the</strong>ir investments<br />
are primarily tied to individual offset clients’ demand<br />
for supporting new project activities, which may<br />
remain piecemeal and small as long as abundant<br />
supplies of issued offsets are available for <strong>the</strong> full<br />
range of project types.
<strong>Maneuvering</strong> <strong>the</strong> <strong>Mosaic</strong> State of <strong>the</strong> Voluntary Carbon Markets 2013<br />
5. Regional Market Deep Dive<br />
Where’s, Who’s, and How’s<br />
of Voluntary Offsetting in 2012
58 State of <strong>the</strong> Voluntary Carbon Markets 2013<br />
5. Regional Market Deep Dive: Where’s, Who’s, and How’s of Voluntary Offsetting in 2012<br />
5. Regional Market Deep Dive: Where’s, Who’s,<br />
and How’s of Voluntary Offsetting in 2012<br />
5.1 Introduction<br />
Voluntary carbon offsets are not a standardized<br />
commodity, but are instead a product market where<br />
preferences, prices, and projects vary greatly by region.<br />
While analyzing project location is one of many ways to<br />
“cut <strong>the</strong> cake,” where a supplier or <strong>the</strong>ir offset projects<br />
call home is a starting point to understand regional<br />
contributions to market-wide volume and value. This<br />
section explores regional trends through <strong>the</strong> lens of<br />
fi ndings that have been presented in previous sections.<br />
A global summary of <strong>the</strong>se fi ndings can be found on<br />
Section 2.3.<br />
5.2 Explanation of Figures<br />
Figures 49, 50, 54 and 55 illustrate <strong>the</strong> volume of<br />
offsets that have ever been issued and retired by major<br />
registries, by vintage and for all years, for projects in<br />
each respective region.<br />
In <strong>the</strong> same fi gures, <strong>the</strong> “Primary Transactions” shape<br />
summarizes (by vintage) all volumes ever reported in<br />
our survey as sold by a project developer to an initial<br />
buyer. In <strong>the</strong>ory, <strong>the</strong> difference between this transaction<br />
volume and <strong>the</strong> volume of issued offsets indicates<br />
offsets that have not yet found an initial buyer. In reality,<br />
this survey is limited in its ability to track all offset<br />
transactions. Therefore, <strong>the</strong>se primary transaction<br />
volumes should be considered conservative. It is also<br />
critical to understand that while issued offsets may not<br />
yet have been transacted, <strong>the</strong>ir verifi cation confi rms<br />
that emissions reductions have occurred – hence, from<br />
an environmental standpoint <strong>the</strong>y have still made an<br />
impact.<br />
When transaction volumes shown are higher than<br />
issued volumes for a particular vintage (Latin<br />
American transaction volumes from 2009-2011 are a<br />
good example, Section 5.5) and particularly for post-<br />
2012 vintage offset transaction volumes, it is likely that<br />
offsets have been forward sold and not yet issued.<br />
Finally, percent values reported in Tables 17, 19, 21<br />
and 23 are based on <strong>the</strong> volumes associated with<br />
individual questions. In some cases, this data is too<br />
thin and so regional analysis is omitted to protect<br />
respondents’ confi dentiality.<br />
5.3 Asia: Branching Out from Renewables<br />
As in previous years, demand for offsets from<br />
Asia-based projects was dominated by low priced<br />
renewable energy offsets that met with European<br />
buyers in search of affordable, available supplies<br />
(see “Issued”, Figure 49) to fi ll <strong>the</strong>ir portfolios. In<br />
a dramatic turn from previous years, however,<br />
renewable energy offsets occupied a smaller slice<br />
of Asia’s project mix – which was replaced by a<br />
growing proportion of offsets transacted from energy<br />
effi ciency, fuel switching, and forestry offsets. Overall,<br />
Asia-based projects were behind 37% of all offset<br />
transactions, but valued only at $103 million owing to<br />
Asia’s declining offset prices.<br />
With <strong>the</strong> continued collapse of CDM prices and <strong>the</strong><br />
EU’s ban on CDM offsets from non-LDC countries<br />
that are registered post-2012, suppliers in Asia’s most<br />
active developing countries – China and India – sought<br />
refuge in <strong>the</strong> voluntary markets as an alternative to<br />
<strong>the</strong> CDM. While 98% of all offsets were transacted to<br />
overseas buyers and largely into <strong>the</strong> secondary market,<br />
suppliers acknowledged a limited but growing potential<br />
to tap into domestic demand in select countries where<br />
governments are cultivating emerging or nascent<br />
domestic emissions trading schemes.<br />
Of <strong>the</strong> total volume of offsets supplied from Asiabased<br />
projects, 11 MtCO 2 e of offsets were supplied<br />
from China, down from 16 MtCO 2 e in 2011. The fall in<br />
transaction volume was owed to a signifi cant scaling<br />
back of voluntary market activity by one large regional<br />
supplier, paired with a slow year as suppliers awaited<br />
more clarity around project eligibility and demand from<br />
China’s seven voluntary emissions trading schemes,<br />
which are scheduled to launch in 2013 and will tap into<br />
some free allowances in <strong>the</strong> fi rst few years of operation.<br />
Given China’s large existing offset supply, many<br />
project developers have been slow to embark on new<br />
projects until suffi cient demand can soak up existing<br />
inventories—potentially accommodating industrial gas<br />
offsets banned by <strong>the</strong> EU ETS post-2012.
From<br />
To<br />
To support <strong>the</strong> new cap-and-trade pilots, China’s<br />
National Develop ment and Reform Commission<br />
(NDRC) is set to issue Chinese Certifi ed Emission<br />
Reductions (CCERs) from unregistered CDM projects<br />
and voluntary projects. Domestic initiatives like <strong>the</strong><br />
Panda Standard – China’s fi rst voluntary carbon<br />
standard – are in <strong>the</strong> process of seeking NDRC’s<br />
approval of <strong>the</strong>ir methodologies as eligible to generate<br />
CCERs. Governments in China’s fi ve participating cities<br />
and two provinces are setting <strong>the</strong>ir own limits on offset<br />
location and project type, as well as <strong>the</strong> percentage<br />
State of <strong>the</strong> Voluntary Carbon Markets 2013 59<br />
Figure 48: Flow of Transacted Volumes by Offset Supplier and Buyer Region, OTC 2012<br />
From To<br />
↑<br />
North America<br />
Latin America<br />
Africa<br />
Asia<br />
Oceania<br />
Europe<br />
↑<br />
From<br />
To<br />
From<br />
From<br />
From<br />
North America Latin America Asia Oceania Europe<br />
20.3 M<br />
-<br />
-<br />
-<br />
1.2 M<br />
1.1 M<br />
0.7 M<br />
2.5 M<br />
0.3 M<br />
1.5 M<br />
*Values smaller than 0.1 Million (M) are not shown on map.<br />
0.2 M<br />
-<br />
-<br />
-<br />
-<br />
To<br />
0.3 M<br />
Notes: Based on 80 MtCO 2 associated with ei<strong>the</strong>r offset project or buyer location.<br />
Source: <strong>Forest</strong> <strong>Trends</strong>’ Ecosystem Marketplace. State of <strong>the</strong> Voluntary Carbon Markets 2013.<br />
-<br />
1.3 M<br />
-<br />
-<br />
1.5 M<br />
0.03 M*<br />
1 M<br />
1.8 M<br />
-<br />
of offsets that emitters will be able to use against <strong>the</strong>ir<br />
emissions reduction targets under each scheme.<br />
Projects in India were behind <strong>the</strong> bulk of 2012<br />
voluntary transactions from Asia, transacting 12<br />
tCO 2 e, up from 7 MtCO 2 e in 2011. “Earlier <strong>the</strong>re<br />
was a trend to own pre-CDM credits on <strong>the</strong> VCS<br />
markets and go for <strong>the</strong> CDM after registration, but<br />
<strong>the</strong> price crash has forced many players to go<br />
straight to <strong>the</strong> voluntary market and bypass <strong>the</strong><br />
CDM,” notes Kishore Butani, Owner of CARBONyatra,<br />
an India-based supplier.<br />
To<br />
2.8 M<br />
3.9 M<br />
21.5 M<br />
1.7 M<br />
0.4 M<br />
From<br />
To<br />
5. Regional Market Deep Dive: Where’s, Who’s, and How’s of Voluntary Offsetting in 2012
60 State of <strong>the</strong> Voluntary Carbon Markets 2013<br />
5. Regional Market Deep Dive: Where’s, Who’s, and How’s of Voluntary Offsetting in 2012<br />
Table 16: Asia by <strong>the</strong> Numbers, 2012<br />
Reductions / Year Total, 2012<br />
# Survey respondents<br />
in region<br />
% Change<br />
from 2011<br />
32 No Change<br />
Volume supplied 29 MtCO 2 e +4%<br />
Average price $3.5/tCO 2 e -9%<br />
Value $103 M -5%<br />
Volume purchased<br />
domestically<br />
1.9 MtCO 2 e -35%<br />
Source: <strong>Forest</strong> <strong>Trends</strong>’ Ecosystem Marketplace.<br />
State of <strong>the</strong> Voluntary Carbon Markets 2013.<br />
Going into 2012, it was assumed that large-scale<br />
renewable energy project developers would migrate<br />
from <strong>the</strong> carbon market to o<strong>the</strong>r incentives like <strong>the</strong><br />
renewable energy certifi cate (“REC”) market that<br />
might enjoy a more stable policy environment or lower<br />
project development costs. In India, however, defi citridden<br />
state electricity boards reportedly fell behind on<br />
payments committed for RECs, so that some project<br />
developers refocused away from both <strong>the</strong> CDM and<br />
REC markets in search of business from voluntary offset<br />
buyers instead.<br />
Japan, historically <strong>the</strong> market with <strong>the</strong> highest reported<br />
prices for voluntary carbon offsets, has supported<br />
domestic project development primarily through<br />
its government-administered J-VER and J-CDM<br />
programs which <strong>the</strong> government has merged into<br />
<strong>the</strong>J-Credit Scheme mechanism this year. In 2012,<br />
J-VER transactions were valued at $19M. To date,<br />
buyers have been primarily motivated by CSR and<br />
philanthropy, with a preference for forestry.<br />
“Until <strong>the</strong> next COP in November [2013], <strong>the</strong> demandside<br />
picture of J-Credits will still be unclear,” cautions<br />
Kazuyoshi Sasaki, Secretary General of Japan’s<br />
Certifi cation Center on Climate Change. “There is<br />
a bit of lack in direction as project developers wait<br />
to hear more about how <strong>the</strong> J-Credit Scheme might<br />
work.”<br />
Elsewhere in Asia, over 3 MtCO 2 e were transacted<br />
from projects in Taiwan and South Korea. As South<br />
Korea readies its emissions trading scheme for a<br />
2015 launch, <strong>the</strong> Korea Verifi ed Emissions Reductions<br />
scheme (K-VER) has been broadening its expertise<br />
across project types, its primary verifi er KEMCO<br />
earning accreditation in 2012 as a VCS validation/<br />
verifi cation body.<br />
Last year, K-VER also provided capacity building<br />
support to Thailand’s equivalent program (T-VER),<br />
which is set to launch this October and covers a broad<br />
range of project types. Among volumes reported<br />
for Sou<strong>the</strong>ast Asia, Thailand, Cambodia, Indonesia,<br />
Malaysia, and <strong>the</strong> Philippines toge<strong>the</strong>r accounted<br />
for ano<strong>the</strong>r 3 MtCO 2 e in transactions. In <strong>the</strong> Lower<br />
Mekong Region, and Vietnam, capacity-building<br />
Figure 49: Issued, Transacted, Retired Volumes (All Years) and Average Price (2012) by Vintage: Asia<br />
MtCO 2 e<br />
20<br />
18<br />
16<br />
14<br />
12<br />
10<br />
8<br />
6<br />
4<br />
2<br />
0<br />
Pre-2006<br />
2006<br />
2007<br />
2008<br />
2009<br />
2010<br />
2011<br />
Issued Historical primary transactions Retired Price by vintage, 2012<br />
Source: <strong>Forest</strong> <strong>Trends</strong>’ Ecosystem Marketplace. State of <strong>the</strong> Voluntary Carbon Markets 2013.<br />
2012<br />
2013<br />
2014<br />
2015<br />
2016<br />
2017+<br />
$14<br />
$12<br />
$10<br />
$8<br />
$6<br />
$4<br />
$2<br />
$0<br />
$/tCO 2 e
Table 17: Asia: Transacted Ofset Types and Offset Buyers, OTC 2012<br />
continues to dominate efforts in timber-exporting<br />
countries like Laos, Cambodia, and Vietnam, with<br />
project development still in relatively early stages<br />
and operating largely off of a funds-based ra<strong>the</strong>r than<br />
market-based approach.<br />
5.4 North America: Domestic Programs Shape <strong>the</strong><br />
Market<br />
It’s hardly surprising that in 2012, North American<br />
voluntary offset market participants paid much<br />
attention to <strong>the</strong> unfolding of California’s cap-andtrade<br />
program – as well as <strong>the</strong> state’s preparations<br />
to connect with Quebec via a linked compliance<br />
program in 2013. In terms of transacted offset<br />
volume, California market preparations remained<br />
fairly steady in 2012 compared to <strong>the</strong> previous year,<br />
but escalating pre-compliance offset prices drove<br />
many purely voluntary buyers toward offset types that<br />
are ineligible for California use, such as renewable<br />
energy.<br />
North American buyers purchased 29.6 MtCO 2 e<br />
of offsets in 2012, a small increase from <strong>the</strong> 29.2<br />
MtCO 2 e acquired <strong>the</strong> previous year. The average<br />
price of <strong>the</strong>se transactions was $6.7/tCO 2 e – 11%<br />
higher than in 2011. If one includes a handful of large,<br />
low-priced transactions of CCX offsets, however, <strong>the</strong><br />
average price for North American offsets fell to $5.5/<br />
tCO 2 e in 2012.<br />
Top Transacted Offset Types, Asia-Based Offsets, 2012<br />
State of <strong>the</strong> Voluntary Carbon Markets 2013 61<br />
Project Category Project Stage Standard Use<br />
Renewables 63% Issued 67% VCS 87%<br />
Effi ciency & Fuel Switch 18% PDD 17% CCX 5.4%<br />
<strong>Forest</strong>ry 15% Verifi ed (not yet issued) 16% The Gold Standard 5%<br />
Top Buyers of Asia-Based Offsets, 2012<br />
Buyer Locations Buyer Sectors Buyer Motivations<br />
Europe 82% Carbon Market 45% Resale, Voluntary 45%<br />
North America 9% Energy 13% CSR 23%<br />
Asia 5% Finance/Insurance 11% Climate Leadership 11%<br />
Notes: Based on 31 MtCO associated with ei<strong>the</strong>r offset project or buyer location. Survey respondents may not answer<br />
2<br />
every question pertaining to buyers – thus percentages pertaining to buyer sector and motivation may not be aligned.<br />
Source: <strong>Forest</strong> <strong>Trends</strong>’ Ecosystem Marketplace. State of <strong>the</strong> Voluntary Carbon Markets 2013.<br />
The total value of North American demand for both<br />
domestic and international offsets was $143 million,<br />
with 64% of that value attributed to California-eligible<br />
projects. The region supplied only 23 MtCO 2 e offsets<br />
in 2012, down 25% from <strong>the</strong> previous year, with <strong>the</strong><br />
total market value declining by $27 million to $151<br />
million.<br />
While sales volumes in <strong>the</strong> North American offset<br />
market grew by a slight 1% in 2012, Patrick Pfeiffer,<br />
Director of Trading at developer EOS Climate, predicts,<br />
“If <strong>the</strong> US [economy] continues to recover, you’ll<br />
Table 18: North America by <strong>the</strong> Numbers, 2012<br />
Reductions / Year Total, 2012<br />
# Survey respondents<br />
in region<br />
% Change<br />
from 2011<br />
93 -8%<br />
Volume supplied 23 MtCO 2 e -24%<br />
Average price $6.7/ tCO 2 e +11%<br />
Value $151 M -15%<br />
Volume purchased<br />
domestically<br />
30 MtCO 2 e +1%<br />
Source: <strong>Forest</strong> <strong>Trends</strong>’ Ecosystem Marketplace.<br />
State of <strong>the</strong> Voluntary Carbon Markets 2013.<br />
5. Regional Market Deep Dive: Where’s, Who’s, and How’s of Voluntary Offsetting in 2012
62 State of <strong>the</strong> Voluntary Carbon Markets 2013<br />
5. Regional Market Deep Dive: Where’s, Who’s, and How’s of Voluntary Offsetting in 2012<br />
Figure 50: Issued, Transacted, Retired Volumes (All Years) and Average Price (2012) by Vintage: North America<br />
MtCO 2 e<br />
25<br />
20<br />
15<br />
10<br />
5<br />
0<br />
Pre-2006<br />
2006<br />
2007<br />
2008<br />
2009<br />
2010<br />
see a continued increase in voluntary purchases in<br />
<strong>the</strong> US.”<br />
In terms of purely voluntary activity in 2012, a big surprise<br />
came in <strong>the</strong> form of a signifi cant volume of transacted<br />
offsets certifi ed through <strong>the</strong> legacy CCX program,<br />
making CCX <strong>the</strong> third most contracted standard in <strong>the</strong><br />
region and contributing to an overall rise in volumes<br />
last year. A total of 8.3 MtCO 2 e of CCX offsets traded<br />
2011<br />
Issued Historical primary transactions Retired Price by vintage, 2012<br />
Source: <strong>Forest</strong> <strong>Trends</strong>’ Ecosystem Marketplace. State of <strong>the</strong> Voluntary Carbon Markets 2013.<br />
$14<br />
$12<br />
$10<br />
hands, a level of activity driven primarily by voluntary<br />
buyers’ desire to replenish <strong>the</strong>ir portfolios, particularly<br />
with offsets valued at an average $0.1/tCO 2 e.<br />
The CCX offset registry remained open in response<br />
to customer demand, but <strong>the</strong>re is no longer a legally<br />
binding obligation for retirement among <strong>the</strong> program’s<br />
original participants. Only seven transaction days<br />
occurred in <strong>the</strong> generally illiquid market last year and<br />
Table 19: North America: Transacted Offset Types and Offset Buyers, OTC 2012<br />
Top Transacted Offset Types, North America-Based Offsets, 2012<br />
Project Category Project Stage Standard Use<br />
<strong>Forest</strong>ry + Land Use 30% Issued 66% CAR 30%<br />
Gases (ODS + N 2 O) 24.5% Undergoing Validation 17% VCS 25%<br />
Methane 24% Validated 13.5% CCX 21.5%<br />
2012<br />
2013<br />
2014<br />
Top Buyers of North America-Based Offsets, 2012<br />
Buyer Locations Buyer Sectors Buyer Motivations<br />
North America 94%<br />
2015<br />
2016<br />
2017+<br />
$8<br />
$6<br />
$4<br />
$2<br />
$0<br />
$/tCO 2 e<br />
Manufacturing 40% Pre-compliance 34%<br />
Events/Entertainment 19% Climate Leadership 20%<br />
Europe 5% Energy 16% Resale, Voluntary 20%<br />
Notes: Based on 53 MtCO 2 associated with ei<strong>the</strong>r offset project or buyer location. Survey respondents may not answer<br />
every question pertaining to buyers – thus percentages pertaining to buyer sector and motivation may not be aligned.<br />
Source: <strong>Forest</strong> <strong>Trends</strong>’ Ecosystem Marketplace. State of <strong>the</strong> Voluntary Carbon Markets 2013.
BOX 3: California Activity Steady, While Prices on <strong>the</strong> Rise<br />
State of <strong>the</strong> Voluntary Carbon Markets 2013 63<br />
California solidifi ed its environmental credentials in 2006 with <strong>the</strong> passage of <strong>the</strong> Global Warming<br />
Solutions Act (AB 32), which pledged to reduce <strong>the</strong> state’s GHG emissions to 1990 levels by 2020.<br />
A key element of <strong>the</strong> plan to comply with <strong>the</strong> landmark legislation was adoption of a cap-and-trade<br />
program, <strong>the</strong> fi rst such comprehensive program in <strong>the</strong> US. Despite signifi cant challenges, <strong>the</strong> program<br />
offi cially launched in January 2013 – and with it expectations of increased interest in offsets bound for<br />
<strong>the</strong> California compliance market.<br />
Activity in <strong>the</strong> offset market for California compliance held steady last year as market designers and<br />
participants ensured <strong>the</strong> program was defi nitely a “go.” About 9.7 MtCO 2 e of pre-compliance offsets<br />
were transacted in 2012, just shy of 10 MtCO 2 e transacted in 2011. But <strong>the</strong> prices for California offsets<br />
are climbing, with <strong>the</strong> total value of <strong>the</strong>se offsets increasing by about $6 million last year while <strong>the</strong> average<br />
price rose by an average $1.3/tCO 2 e.<br />
Technical, legal challenges prevent California growth<br />
Three key factors stunted growth in California offset transactions in 2012: a lack of clarity about <strong>the</strong><br />
process for converting or establishing offi cial California offsets; <strong>the</strong> buyers’ liability provisions that<br />
California regulators have insisted on attaching to compliance offsets; and a lawsuit fi led by Citizens<br />
Climate Lobby and Our Children’s Earth Foundation challenging <strong>the</strong> cap-and-trade program’s offset<br />
protocols. But recent developments have cleared <strong>the</strong> way for a boost in California compliance offset<br />
activity in 2013, including a judge’s dismissal of <strong>the</strong> petition challenging <strong>the</strong> California Air Resources<br />
Board’s (ARB’s) approach to determining offset project additionality in January. (Continued on next page.)<br />
MtCO 2 e<br />
Figure 51: Change in Transacted Volume and Average Price, California Offset Types, 2011-2012<br />
5<br />
4<br />
3<br />
2<br />
1<br />
0<br />
$9.2<br />
$8<br />
$11<br />
$10<br />
0.3<br />
1<br />
2 4 2.0 3 1 1<br />
$8<br />
Notes: Based on 9.7 MtCO 2 e associated with California pre-compliance demand. ‘CAR and CARB <strong>Forest</strong>ry’ refers to CAR<br />
early action and CARB-approved protocol forestry offsets and consists of CAR/CARB IFM and CAR avoided conversion. “Not<br />
Specifi ed” includes both CAR early action and CARB-approved protocols for which a project type was unknown/not reported.<br />
“O<strong>the</strong>r” includes coal mine and waste water methane, CAR agricultural N 2 O, and landfi ll methane from multiple standards.<br />
$9.6<br />
Source: <strong>Forest</strong> <strong>Trends</strong>’ Ecosystem Marketplace. State of <strong>the</strong> Voluntary Carbon Markets 2013.<br />
$7<br />
$10<br />
$8.3<br />
0.5<br />
2<br />
$5.5<br />
ODS General CCOs General CRTs <strong>Forest</strong>ry Livestock O<strong>the</strong>r<br />
Volume 2011 Volume 2012 Average price 2011 Average price 2012<br />
$4<br />
1.5<br />
$12<br />
$10<br />
$8<br />
$6<br />
$4<br />
$2<br />
$0<br />
$/tCO 2 e<br />
5. Regional Market Deep Dive: Where’s, Who’s, and How’s of Voluntary Offsetting in 2012
64 State of <strong>the</strong> Voluntary Carbon Markets 2013<br />
5. Regional Market Deep Dive: Where’s, Who’s, and How’s of Voluntary Offsetting in 2012<br />
Box 3: Continued<br />
California regulators also made some progress in <strong>the</strong> development of <strong>the</strong> offset program. In December,<br />
<strong>the</strong> ARB designated both ACR and CAR as offset project registries (“OPRs”) and Early Action Offset<br />
Programs (“EAOPs”), allowing <strong>the</strong> two programs to issue offsets under <strong>the</strong> ARB compliance offset protocols<br />
and early action quantifi cation methodologies, although <strong>the</strong>se Registry Offset Credits and Early Action<br />
offsets must pass through several additional hurdles post-issuance , before becoming valid compliance<br />
instruments. The ARB also dissolved some market uncertainty in 2012 when it released desk verifi cation<br />
guidelines – approving verifi ers and establishing a computer system for tracking offsets.<br />
The buyers’ liability provisions remain an issue for <strong>the</strong> California pre-compliance market. Under <strong>the</strong>se provisions,<br />
regulated entities that surrender offsets for compliance can be held accountable for faulty or fraudulent<br />
offsets. If <strong>the</strong> ARB invalidates <strong>the</strong> submitted offsets, <strong>the</strong> entity will once again face a compliance ob ligation,<br />
which brokers say has been a major reason offsets have been discounted compared to allowances.<br />
The invalidation risk has led to <strong>the</strong> emergence of different grades of offset contracts. California Carbon<br />
Offsets (“CCOs”) are offsets issued by <strong>the</strong> ARB under regulation-based offset protocols. For “Golden”<br />
CCOs, <strong>the</strong> seller retains <strong>the</strong> responsibility to replace any invalidated compliance offsets. Meanwhile,<br />
early-action offsets are generated under four ARB-approved early action quantifi cation methodologies<br />
(generating Early Action Offsets ei<strong>the</strong>r as Climate Reserve Tonnes or “CRTs”, or ACR Emissions Reduction<br />
Tonnes or “ERTs”) that are eligible to be converted into ARB-issued offsets after a desk review. CRT deals<br />
have dominated in <strong>the</strong> past, but brokers reported a growing volume of transacted CCOs in 2012 at<br />
substantially higher prices (Figure 51).<br />
ODS remains top choice for California pre-compliance<br />
The destruction of ODS sourced from domestic material remains <strong>the</strong> preferred project type for those<br />
looking for pre-compliance California offsets. Buyers are reassured by <strong>the</strong> quality and accuracy of <strong>the</strong><br />
emissions reductions created by <strong>the</strong>se projects, a critical consideration when regulators retain <strong>the</strong> right<br />
to force buyers to replace invalidated credits. ODS developers are hopeful that <strong>the</strong> ARB will support<br />
<strong>the</strong> eventual inclusion of ODS sourced from developing countries, but destruction projects sourced<br />
with foreign material are currently ineligible. In 2012, 4 MtCO 2 e of ODS pre-compliance offsets were<br />
transacted at an average $9.2/tCO 2 e – a 13% increase in price and twice <strong>the</strong> volume dealt in 2011.<br />
Livestock activity slight, but pipeline looks strong<br />
Pre-compliance transactions of offsets from livestock methane projects remained small, behind only 0.5<br />
MtCO 2 e of transacted offsets last year, but future activity is expected to rise with suppliers reporting an<br />
anticipated 14 MtCO 2 e in <strong>the</strong>ir fi ve-year pipeline (Figure 53). With California’s offset market projected to<br />
be short in future years, demand for livestock offsets is likely to increase substantially, though <strong>the</strong>y are<br />
disadvantaged as small projects that need to be aggregated to form meaningful volumes.<br />
<strong>Forest</strong>ry offset prices, pipeline on <strong>the</strong> rise<br />
Transaction volumes for IFM offsets bound for California buyers grew 44% last year, buoyed by a price<br />
increase of an average $1.3/tCO 2 e over 2011. By several accounts, forestry projects may produce <strong>the</strong><br />
most volume long term, as well. IFM project developers reported <strong>the</strong> largest 5-year pipeline, expecting<br />
to generate 42 MtCO 2 e of offsets in 2013-2017. <strong>Forest</strong>ry offsets currently comprise 54% of expected<br />
volumes from projects already registered to CAR, while ano<strong>the</strong>r analysis from ACR estimates that forestry<br />
has suffi cient technical capacity to generate <strong>the</strong> program’s largest offset volumes over <strong>the</strong> same period<br />
(Figure 52). Urban forestry is <strong>the</strong> fourth approved project type for California’s program and a project<br />
by <strong>the</strong> City of Santa Monica to add 1,000 trees was listed with CAR last year. Because urban forestry<br />
projects are costly and challenging for developers, however, <strong>the</strong> protocol is not expected to produce a<br />
signifi cant number of offsets for California’s compliance program. (Continued on next page.)
Box 3: Continued<br />
State of <strong>the</strong> Voluntary Carbon Markets 2013 65<br />
Project types on <strong>the</strong> California horizon?<br />
As seen in Figure 52, suppliers’ projected pipeline from 2013-2017 (85 MtCO 2 e) is signifi cantly higher than<br />
what ACR analysts estimate to be projects’ technical capacity to bring offsets to market (44 MtCO 2 e over<br />
<strong>the</strong> same period) – and well below <strong>the</strong> volume that compliance entities can actually surrender over those<br />
fi ve years (120 MtCO 2 e total). A few market participants point out, however, that not all compliance entities<br />
are likely to use <strong>the</strong>ir entire allowable volume of offsets, as small to medium-sized companies in particular<br />
may fi nd <strong>the</strong> allowance market more accessible and less confusing. They may also have less internal<br />
capacity than large emitters to actively engage in <strong>the</strong> offset market.<br />
For those companies that are concerned about <strong>the</strong> risk of offset undersupply, <strong>the</strong> board recently announced<br />
its consideration of protocols for rice cultivation and coal mine methane capture projects for future program<br />
use, and most observers believe it is likely that <strong>the</strong> two protocols will be approved in some form. ACR’s<br />
estimate includes prospective “o<strong>the</strong>r” new protocols in <strong>the</strong> coal mine methane capture and rice cultivation<br />
categories. Transactions are occurring for coal mine methane projects ahead of possible approval by <strong>the</strong><br />
ARB, and while no deals were reported for rice projects in 2012, Ecosystem Marketplace has tracked a<br />
few projects being piloted under both CAR and ACR programs.<br />
However, <strong>the</strong> overall price and volume for offsets o<strong>the</strong>r than <strong>the</strong> approved project types both declined<br />
in 2012. Developers say it is hard to justify investing in potential compliance protocols, given <strong>the</strong> ARB’s<br />
track record of considering, but ultimately declining acceptance of certain project types – as well as <strong>the</strong><br />
snail’s pace of <strong>the</strong> approval or disapproval process. For example, in 2012 <strong>the</strong> ARB ultimately decided not<br />
to proceed with an oil/gas fugitive emissions protocol (e.g., retrofi tting of high-bleed pneumatic device)<br />
that it had been considering since <strong>the</strong> sector will be capped in 2015. “If it’s not approved by <strong>the</strong> [ARB],<br />
we’re not taking <strong>the</strong> risk that it might be,” says TerraPass CEO Erin Craig. (Continued on next page.)<br />
Figure 52: Projected California Offset Demand and Supply, Supplier-<strong>Report</strong>ed, CAR Registered Projects’<br />
Offsets Pipeline, and ACR-Estimated Technical Capacity for Emissions Reductions, 2013-2017<br />
MtCO 2 e<br />
120 M<br />
100 M<br />
80 M<br />
60 M<br />
40 M<br />
20 M<br />
0 M<br />
37 M<br />
2011 Survey Respondent<br />
Pipeline<br />
85 M<br />
2012 Survey Respondent<br />
Pipeline<br />
Notes: Based on 86 MtCO e associated with survey-reported California compliance offset project pipelines. “O<strong>the</strong>r” includes coal<br />
2<br />
mine and waste water methane; CAR agricultural N O and landfi ll methane from multiple standards. California-eligible CRT issuance,<br />
2<br />
retirement and estimated annual reductions supplied by CAR. Technical issuance capacity estimates provided by ACR and<br />
elaborated in <strong>the</strong> standard’s 2012 report, “Compliance Offset Supply Forecast For California’s Cap-and-Trade Program (2013-2020)”.<br />
Source: <strong>Forest</strong> <strong>Trends</strong>’ Ecosystem Marketplace. State of <strong>the</strong> Voluntary Carbon Markets 2013.<br />
11 M<br />
Cali-eligible CRTs Issued:<br />
Historical<br />
44 M<br />
Technical issuance<br />
capacity: '13-'17<br />
Project type: IFM ODS Livestock O<strong>the</strong>r Estimated Cali compliance offset demand '13-'17<br />
5. Regional Market Deep Dive: Where’s, Who’s, and How’s of Voluntary Offsetting in 2012
66 State of <strong>the</strong> Voluntary Carbon Markets 2013<br />
5. Regional Market Deep Dive: Where’s, Who’s, and How’s of Voluntary Offsetting in 2012<br />
Box 3: Continued<br />
In September, Tierra Resources’ carbon offset<br />
methodology for delta wetland restoration was<br />
approved by <strong>the</strong> ACR. Utility Entergy Corp,<br />
through its environmental initiatives fund, paid for<br />
<strong>the</strong> methodology as well as <strong>the</strong> fi rst pilot project<br />
to discharge treated municipal wastewater to help<br />
restore <strong>the</strong> wetland’s function and increase carbon<br />
sequestration. The wetlands methodology pilot<br />
focuses on <strong>the</strong> Mississippi Delta, but work will begin<br />
soon to expand <strong>the</strong> protocol to California. ACR and<br />
Tierra hope to complete and publish <strong>the</strong> protocol<br />
within 12 to 18 months from project inception.<br />
“We’re hoping it will increase <strong>the</strong> business case for<br />
investment into <strong>the</strong> wetlands,” says Sarah Mack,<br />
President and CEO, Tierra Resources.<br />
REDD offsets still a long way off<br />
Project developers report that nearly 36 MtCO 2 e of<br />
REDD offsets are being developed targeting North<br />
American compliance programs. The ARB has so<br />
far indicated that <strong>the</strong> only sources of acceptable<br />
REDD offsets would come from Acre, Brazil, and Chiapas, Mexico, two areas with which <strong>the</strong> state has a<br />
memorandum of understanding, and those offsets could come into <strong>the</strong> program as late as 2017-18, as<br />
<strong>the</strong> ARB still has to fi nalize <strong>the</strong> regulations governing international offsets.<br />
Carbonfund.org Foundation developed <strong>the</strong> fi rst VCS plus CCB-validated REDD project in Acre, which<br />
contracted its fi rst offsets to UK-based voluntary offset retailer The CarbonNeutral Company in early<br />
2013. “We’re hopeful California will accept international REDD projects, which would be a huge<br />
plus for <strong>the</strong> REDD markets and shows <strong>the</strong> infl uence California has on <strong>the</strong> voluntary markets,” says<br />
Brian McFarland, Director of Carbon Projects and Origination.<br />
Potential legal challenges remain an area of uncertainty for <strong>the</strong> California program. In November, <strong>the</strong><br />
California Chamber of Commerce fi led a lawsuit to invalidate <strong>the</strong> state’s fi rst offi cial auction by claiming<br />
that <strong>the</strong> ARB exceed its authority under AB 32 in conducting auctions that raise revenues for <strong>the</strong> state.<br />
But with <strong>the</strong> program offi cially up and running, most market participants say that offset buyers understand<br />
that some of <strong>the</strong>se environmental markets will always have regulatory or legal risks and are fairly comfortable<br />
with <strong>the</strong> idea that California’s cap-and-trade program is here to stay.<br />
<strong>the</strong> bulk of offset volumes were contracted by parties<br />
offsetting <strong>the</strong>ir carbon footprints, explains Stephen<br />
McComb, Manager of North American markets for<br />
CCX administrator IntercontinentalExchange.<br />
Landfi ll gas projects, once sought for <strong>the</strong>ir potential<br />
acceptance into a US state or federal cap-and-trade<br />
program, lost <strong>the</strong>ir luster for pre-compliance buyers<br />
since California regulators confi rmed that <strong>the</strong>y would<br />
not be permitted. US buyers purchased 2.8 MtCO 2 e of<br />
landfi ll project offsets last year, representing 13% of US<br />
project type market share and valued at roughly $6.8<br />
Figure 53: Survey Respondents’ Estimated<br />
5-Year California Offset Pipeline by Project Type,<br />
2013-2017<br />
2 M; 2%<br />
14 M; 17%<br />
26 M; 30%<br />
2 M; 2%<br />
42 M; 49%<br />
IFM<br />
ODS<br />
Livestock<br />
Coal Mine Methane<br />
O<strong>the</strong>r<br />
Notes: Based on 86 MtCO e associated with<br />
2<br />
survey-reported California compliance offset project<br />
pipelines. “O<strong>the</strong>r” includes coal mine and waste water<br />
methane, CAR agricultural N O, and landfi ll methane<br />
2<br />
from multiple standards<br />
Source: <strong>Forest</strong> <strong>Trends</strong>’ Ecosystem Marketplace.<br />
State of <strong>the</strong> Voluntary Carbon Markets 2013.<br />
million – but down from 2011’s 3.4 MtCO 2 e valued at<br />
$15 million.<br />
The escalating prices commanded by Californiaeligible<br />
offsets – including ozone depleting substance<br />
(ODS) destruction, forestry, and livestock methane<br />
projects developed to CAR protocols – pushed some<br />
voluntary buyers away from <strong>the</strong>se historically “goto”<br />
project types. In <strong>the</strong>ir place, buyers turned <strong>the</strong>ir<br />
attention to o<strong>the</strong>r project types like US-based wind<br />
installations, transportation, A/R, energy effi ciency,<br />
and N 2 O management.
Understanding that pre-compliance offset transaction<br />
volumes again hovered around <strong>the</strong> 10 MtCO 2 e mark,<br />
remaining demand from North American buyers (19.8<br />
MtCO 2 e) was motivated by voluntary climate action. As<br />
seen in Table 19, <strong>the</strong> most prominent voluntary actors<br />
were those companies desiring to demonstrate climate<br />
leadership within <strong>the</strong>ir industry or at a policy level.<br />
Almost one third of North American offset demand was<br />
attributed to multinational corporations, which were<br />
behind $38 million of offset market value.<br />
US-based buyers have reportedly developed a more<br />
positive and sophisticated attitude toward offsets<br />
– with <strong>the</strong> launch of <strong>the</strong> California market and recent<br />
rejection of a lawsuit challenging <strong>the</strong> state’s use of<br />
offsets clearing <strong>the</strong> way for a more supportive stance<br />
toward offset projects.<br />
“They [offsets] are no longer being trashed in <strong>the</strong><br />
press, <strong>the</strong>y’re being defended,” says Erin Craig,<br />
Chief Executive Offi cer of developer TerraPass,<br />
when describing North America’s changing market<br />
dynamic.<br />
In Canada, forestry projects accounted for more than<br />
half of <strong>the</strong> region’s relatively scarce offset market activity.<br />
Canada’s offset market may grow in coming months,<br />
primarily in response to <strong>the</strong> planned link between<br />
California and Quebec’s cap-and-trade systems via<br />
<strong>the</strong> Western Climate Initiative (WCI). In April 2012,<br />
California governor Jerry Brown signed off on <strong>the</strong><br />
proposed linkage, which <strong>the</strong> California Air Resources<br />
Board (ARB) is scheduled to fi nalize in June 2013.<br />
While this survey did not track any pre-compliance<br />
offset activity in Quebec in 2012, that could change<br />
this year, says Lenny Hochschild, managing director<br />
for brokerage Evolution Markets. Provincial regulators<br />
have approved for compliance use an ODS offset<br />
project type, as well as offsets from methane capture at<br />
manure storage and landfi ll facilities. Analysts note that<br />
offset demand from regulated entities in Quebec will be<br />
signifi cantly smaller than among entities in California.<br />
British Columbia remains a member of WCI, Inc.<br />
(successor to <strong>the</strong> Western Climate Initiative), but is not<br />
as far along in plans for a possible regional linkage. In<br />
<strong>the</strong> province, late 2012 was marked by a controversial<br />
audit that criticized <strong>the</strong> credibility of offsets purchased<br />
by <strong>the</strong> Pacifi c Carbon Trust for use in <strong>the</strong> region’s Carbon<br />
Neutral Government program. The British Columbia<br />
Offi ce of <strong>the</strong> Auditor General’s report questioned <strong>the</strong><br />
provincial government’s carbon neutrality claims, an<br />
argument that was rejected by <strong>the</strong> Ministry of <strong>the</strong><br />
Environment and organizations such as <strong>the</strong> VCS and<br />
Offsetters Climate Solutions. David Rokoss, Director of<br />
State of <strong>the</strong> Voluntary Carbon Markets 2013 67<br />
Corporate Development for Offsetters, attributed <strong>the</strong><br />
dispute to politics, in anticipation of <strong>the</strong> May 14 provincial<br />
election, and says that his company has not<br />
“had any fallout from it.” He explains, “Companies and<br />
groups we deal with had a couple of questions, but<br />
under stand <strong>the</strong> projects much better than <strong>the</strong> auditor<br />
did.”<br />
5.5 Latin America: REDD Rebounds But Prices Lag<br />
With several Latin American countries taking different<br />
routes to reach a low-carbon economy, it is no surprise<br />
that 2012 heralded several regional shifts regarding<br />
volume, price, standards, policies, and more. The<br />
volume of offsets transacted from Latin America-based<br />
projects remained steady at 7.3 MtCO 2 e, while a<br />
27% drop in <strong>the</strong> region’s average offset price led to a<br />
$21-million decrease in overall value.<br />
Despite this lower market value, Latin American<br />
project developers reported a banner year for REDD<br />
projects, as <strong>the</strong> global forest carbon scheme mobilized<br />
project and policy developments in countries like<br />
Mexico, Brazil, Colombia, Peru, and Chile and sparked<br />
amplifi ed interest in REDD among <strong>the</strong> private and<br />
public sectors. Overall, forestry and land-use project<br />
offsets were behind 58% of all regional transactions.<br />
Representing a signifi cant shift in Latin American<br />
project activities, <strong>the</strong> region’s second most popular<br />
project type was clean cookstove distribution. A<br />
full 28% (1.6 MtCO 2 e) of all clean cookstove project<br />
offsets were transacted from Latin America-based<br />
projects in several country locations including Peru,<br />
Haiti, El Salvador, Guatemala, and Honduras. This is<br />
a signifi cant uptick in <strong>the</strong> number of Latin American<br />
Table 20: Latin America by <strong>the</strong> Numbers, 2012<br />
Reductions / Year Total, 2012<br />
# Survey respondents<br />
in region<br />
% Change<br />
from 2011<br />
43 No Change<br />
Volume supplied 7.3 MtCO 2 e +1%<br />
Average price $8.3/ tCO 2 e -27%<br />
Value $61 M -25%<br />
Volume purchased<br />
domestically<br />
0.3 MtCO 2 e -81%<br />
Source: <strong>Forest</strong> <strong>Trends</strong>’ Ecosystem Marketplace.<br />
State of <strong>the</strong> Voluntary Carbon Markets 2013.<br />
5. Regional Market Deep Dive: Where’s, Who’s, and How’s of Voluntary Offsetting in 2012
68 State of <strong>the</strong> Voluntary Carbon Markets 2013<br />
5. Regional Market Deep Dive: Where’s, Who’s, and How’s of Voluntary Offsetting in 2012<br />
clean cookstove projects that successfully tapped into<br />
carbon fi nance – with 2012 being <strong>the</strong> fi rst survey year<br />
we have suffi cient data to report <strong>the</strong>se market activities.<br />
On <strong>the</strong> forestry side, 2012 saw Latin American<br />
governments form closer ties with independent<br />
standards such as <strong>the</strong> VCS, ACR, and CCB Standards.<br />
ACR claimed its fi rst verifi ed forest carbon project in<br />
Latin America with Brazil’s Boa Vista A/R project. O<strong>the</strong>r<br />
standards also expanded <strong>the</strong>ir regional footprint, with<br />
<strong>the</strong> VCS reporting new validations for both forest and<br />
energy projects in Belize, Brazil, Chile, Peru, and<br />
Uruguay.<br />
Overall, 63% of transacted offsets employed VCS,<br />
three fourths of which were combined with CCB<br />
certifi cation – a substantial contrast to 2011, when only<br />
47% of transacted offsets used <strong>the</strong> VCS. A full 89% of<br />
transacted forestry offsets were reported alongside<br />
an independent standard in 2012 compared to 67%<br />
in 2011. As more projects are validated and verifi ed<br />
by independent standards in Latin America, market<br />
participants expect a gradual trend toward <strong>the</strong>ir use.<br />
On <strong>the</strong> policy front, Latin American countries including<br />
Colombia, Costa Rica, and Chile are moving ahead<br />
with proposals to develop domestic carbon schemes<br />
and to potentially seek regional linkages with <strong>the</strong><br />
support of <strong>the</strong> VCS and World Bank’s Partnership for<br />
Market Readiness (“PMR”). Costa Rica advanced <strong>the</strong><br />
development of its C-Neutral Standard and voluntary<br />
carbon market in 2012, in pursuit of carbon neutrality by<br />
2021. The country’s program will initially be voluntary<br />
as it builds capacity to potentially impose sectoral<br />
emissions caps in future. In <strong>the</strong> meantime, voluntary<br />
offsets for <strong>the</strong> program can be developed in <strong>the</strong> energy,<br />
transportation, agriculture, solid waste management,<br />
and sustainable construction sectors – and to a variety<br />
of standards including VCS, The Gold Standard and<br />
Costa Rica’s own Costa Rica carbon offset units.<br />
In 2012, Colombia-based Fundacion Natura also took<br />
a fi rst step in domestic program development when it<br />
partnered with VCS to jointly establish <strong>the</strong> necessary<br />
framework for a Colombian voluntary carbon market.<br />
Fundacion Natura’s Roberto Leon Gomez explains<br />
that <strong>the</strong> Colombian Low Carbon Development Strategy<br />
is trying to involve <strong>the</strong> transportation sector, cement<br />
plants, and cattle ranching businesses by promoting<br />
different channels – including carbon offseting – for<br />
reducing emissions. “Companies in Colombia are<br />
now starting to understand <strong>the</strong> advantages of<br />
getting involved in <strong>the</strong> early stages of development<br />
of a carbon market,” he says and is optimistic that<br />
Colombian companies’ desire for domestic projects<br />
will spur demand.<br />
The Santiago Climate Exchange (SCX) continued to<br />
support domestic capacity for carbon management as<br />
<strong>the</strong> country compiled its submission to <strong>the</strong> PMR that<br />
includes a strongly suggested exploration of domestic<br />
offset potential for a future emissions trading schemes.<br />
Most recently, SCX launched a mechanism to pair a<br />
future vintage reduction (via forward contract) with an<br />
Figure 54: Issued, Transacted, Retired Volumes (All Years) and Average Price (2012) by Vintage: Latin America<br />
MtCO 2 e<br />
6<br />
5<br />
4<br />
3<br />
2<br />
1<br />
0<br />
Pre-2006<br />
2006<br />
2007<br />
2008<br />
2009<br />
2010<br />
2011<br />
Issued Historical primary transactions Retired Price by vintage, 2012<br />
Source: <strong>Forest</strong> <strong>Trends</strong>’ Ecosystem Marketplace. State of <strong>the</strong> Voluntary Carbon Markets 2013.<br />
2012<br />
2013<br />
2014<br />
2015<br />
2016<br />
2017+<br />
$14<br />
$12<br />
$10<br />
$8<br />
$6<br />
$4<br />
$2<br />
$0<br />
$/tCO 2 e
Top Transacted Offset Types, Latin America-Based Offsets, 2012<br />
existing, inexpensive issued unit to address buyers’<br />
desire to catalyze new project development while still<br />
being able to make immediate and credible claims to<br />
carbon neutrality.<br />
All of <strong>the</strong>se programs accommodate international<br />
investment and demand for domestic offsets, but<br />
have primarily focused on building capacity for<br />
domestic offset purchases and project development.<br />
It is currently unclear to what extent such discussions<br />
will infl uence domestic offset demand in <strong>the</strong> shortterm.<br />
Buyers of Latin American offsets – primarily<br />
from projects in Peru (3.4 MtCO 2 e) and Brazil (2.5<br />
MtCO 2 e) – sought <strong>the</strong>se regional offsets mainly for<br />
resale to purely voluntary and future compliance end<br />
users in Europe and Oceania, while North American<br />
companies were behind a slight 19% of all Latin<br />
America offset transaction volumes. At <strong>the</strong> same time,<br />
domestic demand fell to less than 1 MtCO 2 e, regionwide.<br />
The year 2012 also saw <strong>the</strong> Brazilian state of Acre<br />
and Mexican state of Chiapas still taking steps to<br />
formalize joint environmental goals with <strong>the</strong> US state<br />
of California. News surrounding California’s stance<br />
on accepting international, sector-based offsets<br />
(beginning with REDD, which could be acknowledged<br />
starting in 2015) piqued <strong>the</strong> interest of international<br />
actors last year.<br />
State of <strong>the</strong> Voluntary Carbon Markets 2013 69<br />
Project Category Project Stage Standard Use<br />
<strong>Forest</strong>ry + Land Use 58% Issued 45% VCS 63%<br />
Household Device<br />
Distribution<br />
Table 21: Latin America: Transacted Offset Types and Offset Buyers, OTC 2012<br />
24% Validated 44% The Gold Standard 25%<br />
Renewables 14% Verifi ed (not yet issued) 8.5% CCX 8%<br />
Top Buyers of Latin America-Based Offsets, 2012<br />
Buyer Locations Buyer Sectors Buyer Motivations<br />
Europe 47% Carbon Market 54% Resale, Voluntary 31%<br />
Oceania 26% Tourism 16% Resale, Pre-compliance 26.4%<br />
North America 19% Retail Product Market 14% Climate Leadership 15%<br />
Notes: Based on 7.6 MtCO associated with ei<strong>the</strong>r offset project or buyer location. Survey respondents may not answer<br />
2<br />
every question pertaining to buyers – thus percentages pertaining to buyer sector and motivation may not be aligned.<br />
Source: <strong>Forest</strong> <strong>Trends</strong>’ Ecosystem Marketplace. State of <strong>the</strong> Voluntary Carbon Markets 2013.<br />
California’s policy has received mixed reviews from<br />
both foreign and domestic stakeholders. Indigenous<br />
communities from Latin American states have voiced<br />
support, opposition, and indecisiveness about <strong>the</strong><br />
REDD offsets program through testimony, letters,<br />
and meetings with <strong>the</strong> ARB. Meanwhile, <strong>the</strong> REDD<br />
Offsets Working Group released a report on various<br />
architectural options for REDD in California’s program<br />
in early 2013 which it will pass on to all three subnational<br />
governments for review in <strong>the</strong> coming months.<br />
Table 22: Africa by <strong>the</strong> Numbers, 2012<br />
Reductions / Year Total, 2012<br />
# Survey respondents<br />
in region<br />
% Change<br />
from 2011<br />
20 +67%<br />
Volume supplied 8 MtCO 2 e +4%<br />
Average price $8.3/ tCO 2 e +6%<br />
Value $66 M +10%<br />
Volume purchased<br />
domestically<br />
70 State of <strong>the</strong> Voluntary Carbon Markets 2013<br />
5. Regional Market Deep Dive: Where’s, Who’s, and How’s of Voluntary Offsetting in 2012<br />
Figure 55: Issued, Transacted, Retired Volumes (All Years) and Average Price (2012) by Vintage: Africa<br />
MtCO 2 e<br />
5<br />
4<br />
3<br />
2<br />
1<br />
0<br />
Pre-2006<br />
2006<br />
2007<br />
2008<br />
2009<br />
2010<br />
Source: <strong>Forest</strong> <strong>Trends</strong>’ Ecosystem Marketplace. State of <strong>the</strong> Voluntary Carbon Markets 2013.<br />
5.6 Africa: Record Activity, Regulations Move Market<br />
Forward<br />
Offsets transacted from Africa-based projects reached<br />
new heights in 2012, benefi tting from intensifying buyer<br />
interest in supporting projects with strong additional<br />
benefi ts to <strong>the</strong> region’s ecology and communities. Last<br />
year, African project offset transactions were valued<br />
at $66 million as <strong>the</strong> average price for <strong>the</strong> region’s<br />
record activity (8 MtCO 2 e transacted) rose slightly to<br />
$8/tCO 2 e.<br />
As a region, Africa has traditionally played a small<br />
role in <strong>the</strong> CDM, where project development<br />
historically favored least-cost development of largescale<br />
projects in China, India, and Brazil. Registered<br />
Africa-based CDM projects make up 3% of all CDM<br />
registrations, globally. This may change, following <strong>the</strong><br />
EU’s decision to only allow new project registrations<br />
from Least Developed Countries (“LDCs”) after 2013,<br />
with a few exceptions. The going compliance price for<br />
CERs, however, does not exactly inspire new project<br />
development.<br />
The voluntary market for carbon offsets is slightly kinder<br />
to Africa-based activities, where <strong>the</strong>se projects have<br />
historically made up 3% of <strong>the</strong> VCS project portfolio<br />
and an even larger 8% from The Gold Standard.<br />
Looking at offset issuance by region, African projects<br />
2011<br />
Issued Historical primary transactions Retired Price by vintage, 2012<br />
$14<br />
$12<br />
$10<br />
were behind 4% of all VCS issuances and 18% of Gold<br />
Standard volumes.<br />
In 2012, both programs reported signifi cantly sized<br />
projects in <strong>the</strong> region, harnessing two mechanisms –<br />
REDD (VCS) and <strong>the</strong> suppressed demand 7 baseline<br />
approach (The Gold Standard) – that intro duce <strong>the</strong><br />
potential for massive offset generation from nonindustrial<br />
sources. VCS saw <strong>the</strong> verifi cation of offsets<br />
generated from its largest REDD project to date – <strong>the</strong><br />
Mai Ndombe project in <strong>the</strong> Democratic Republic of <strong>the</strong><br />
Congo (“DRC”), which has <strong>the</strong> potential to generate<br />
and issue over 5 MtCO 2 e annually. The Gold Standard<br />
likewise saw ano<strong>the</strong>r large issuance from <strong>the</strong> LifeStraw<br />
water fi ltration distribution project that employs<br />
suppressed demand to account for annual emissions<br />
reductions. Since verifying offsets in 2011, <strong>the</strong> project<br />
is capable of issuing 2.1 MtCO 2 e annually and so far<br />
actually issued 2.7 MtCO 2 e in 2011-12.<br />
Africa is also <strong>the</strong> only region where both Gold Standardcertifi<br />
ed and regular CERs make <strong>the</strong> “top three” list of<br />
guiding standards behind transacted offsets. In most<br />
cases, surveyed project developers reportedly used <strong>the</strong><br />
CDM versus going straight to a voluntary market-only<br />
standard in order to keep a foot in both marketplaces<br />
– in case compliance market CER prices got a boost<br />
from any EU decision to restrict offset supply. Some<br />
developers reportedly contracted a proportion of <strong>the</strong>ir<br />
7 See Ecosystem Marketplace’s 2012 State of <strong>the</strong> Voluntary Carbon Markets report for a description and discussion around<br />
suppressed demand available here: http://www.forest-trends.org/publication_details.php?publicationID=3164<br />
2012<br />
2013<br />
2014<br />
2015<br />
2016<br />
2017+<br />
$8<br />
$6<br />
$4<br />
$2<br />
$0<br />
$/tCO 2 e
portfolio to buyers in both markets (with <strong>the</strong> smaller<br />
proportion going to voluntary buyers), while o<strong>the</strong>rs<br />
turned <strong>the</strong>ir attention squarely to <strong>the</strong> voluntary offset<br />
market, where <strong>the</strong>y took a hit in terms of transaction<br />
volumes. In all cases, <strong>the</strong> majority of CERs associated<br />
with this volume (less than .5 MtCO 2 e) were from clean<br />
cookstove projects.<br />
As in Latin America, Africa is a region where <strong>the</strong> volume<br />
of offsets transacted outpaces <strong>the</strong> volume of offsets<br />
verifi ed and issued on a registry. As seen in Figure 55,<br />
this equates to 5.5 MtCO 2 e that has not yet been issued<br />
or retired but was transacted by project developers for<br />
future delivery. Of this, 1 MtCO 2 e was contracted in<br />
2012 – and primarily for reductions occurring in 2012<br />
that were soon to issue. The remainder was forwardcontracted<br />
by project developers in previous years.<br />
As seen in Figure 55’s 2012 per-vintage average price,<br />
Africa-based projects did not see signifi cant demand<br />
for future offset delivery, due in part to dynamics<br />
discussed in Section 4.6.<br />
Africa-based offsets were primarily transacted to<br />
European buyers, of which a growing proportion was<br />
end users motivated by CSR and climate leadership<br />
(Table 23). In contrast to <strong>the</strong> 2011 marketplace, when<br />
Africa’s largest buyer was <strong>the</strong> European offset retail<br />
market, in 2012 a larger volume of offsets were sold<br />
Top Transacted Offset Types, Africa-Based Offsets, 2012<br />
State of <strong>the</strong> Voluntary Carbon Markets 2013 71<br />
Project Category Project Stage Standard Use<br />
Household Device<br />
Distribution<br />
59% Issued 84% The Gold Standard 63%<br />
<strong>Forest</strong>ry + Land Use 32% PDD 7% VCS 31%<br />
Energy Effi ciency and Fuel<br />
Switching<br />
Table 23: Africa: Transacted Offset Types and Offset Buyers, OTC 2012<br />
8% Validated 6%<br />
Top Buyers of Africa-Based Offsets, 2012<br />
CDM/CDM + The Gold<br />
Standard<br />
Buyer Locations Buyer Sectors Buyer Motivations<br />
Europe 85%<br />
Transportation (aviation,<br />
Rail, Rental)<br />
4.7%<br />
40% CSR 37%<br />
North America 14% Carbon Market 17% Climate Leadership 20%<br />
Oceania 1% Energy 14% Resale, Voluntary 20%<br />
Notes: Based on 7.6 MtCO associated with ei<strong>the</strong>r offset project or buyer location. Survey respondents may not answer<br />
2<br />
every question pertaining to buyers – thus percentages pertaining to buyer sector and motivation may not be aligned.<br />
Source: <strong>Forest</strong> <strong>Trends</strong>’ Ecosystem Marketplace. State of <strong>the</strong> Voluntary Carbon Markets 2013.<br />
by retailers to end users as supply became available.<br />
Likewise, <strong>the</strong> volume of offsets supplied by project<br />
developers fell from 6 MtCO 2 e in 2011 (79% of<br />
transacted volume) to 4.7 MtCO 2 e in 2012 – or 60% of<br />
all transacted offsets from African projects.<br />
Alongside <strong>the</strong> African offset market’s quickening<br />
pace of development, decision-makers in <strong>the</strong> region<br />
signifi cantly boosted <strong>the</strong> region’s offset policy profi le.<br />
Throughout 2012, <strong>the</strong> South African government<br />
contemplated allowing <strong>the</strong> surrender of offsets from<br />
South Africa-based VCS, Gold Standard, and CDM<br />
projects against compliance obligations under its<br />
draft national carbon tax. In mid-2013, <strong>the</strong> government<br />
released a draft policy discussion paper that included<br />
this provision.<br />
The paper, which references <strong>the</strong> voluntary offset<br />
market’s performance over time (including fi ndings<br />
from this report series), states, “Carbon offset projects<br />
can… potentially generate sustainable development<br />
benefi ts within South Africa, including channeling<br />
capital to projects that facilitate rural development,<br />
create employment, restore landscapes, reduce land<br />
degradation, protect biodiversity, and encourage<br />
energy effi ciency and low carbon growth.”<br />
“Offsets will play a considerable role in South African<br />
carbon pricing by placing least cost mitigation<br />
5. Regional Market Deep Dive: Where’s, Who’s, and How’s of Voluntary Offsetting in 2012
72 State of <strong>the</strong> Voluntary Carbon Markets 2013<br />
5. Regional Market Deep Dive: Where’s, Who’s, and How’s of Voluntary Offsetting in 2012<br />
options directly in <strong>the</strong> hands of taxpayers” observes<br />
domestic offset retailer Promethium Carbon’s Harmke<br />
Immink. “A hybrid carbon tax/trading mechanism is<br />
innovative and places South Africa at <strong>the</strong> forefront<br />
of developing carbon pricing options.”<br />
The discussion draft notes that a policy paper<br />
elaborating <strong>the</strong> tax’s offset provisions will be released<br />
later in 2013. The existing draft states that eligible project<br />
activities could include forestry and land-use, waste,<br />
community-based and municipal energy effi ciency<br />
and renewable energy, electricity transmission and<br />
distribution effi ciency, small-scale renewable energy<br />
(up to 15 MW), and transport projects – and potentially<br />
rejects <strong>the</strong> eligibility of industrial gas project offsets.<br />
As of mid-2013, <strong>the</strong> VCS project database reports<br />
two registered South Africa-based projects that have<br />
issued offsets (out of 6), while ano<strong>the</strong>r 13 projects<br />
have been registered to The Gold Standard. The CDM<br />
features a signifi cantly larger project portfolio of 41<br />
projects with registered PDDs, 10 of which have so far<br />
issued CERs.<br />
5.7 Oceania: Suppliers Operate in <strong>the</strong> Shadow of<br />
Compliance Markets<br />
In 2012, voluntary carbon offset suppliers in Australia<br />
and New Zealand reacted to new developments in<br />
<strong>the</strong>ir respective domestic compliance carbon markets,<br />
which are candidates for a future market linkage, yet<br />
seemingly divergent in strategy.<br />
While suppliers in New Zealand’s forestry-heavy<br />
market struggled to attract domestic demand within<br />
Table 24: Oceania by <strong>the</strong> Numbers, 2012<br />
Reductions / Year Total, 2012<br />
# Survey respondents<br />
in region<br />
% Change<br />
from 2011<br />
24 +4%<br />
Volume supplied 7.3 MtCO 2 e +>100%<br />
Average price $8.8/ tCO 2 e -32%<br />
Value $65 M +>100%<br />
Volume purchased<br />
domestically<br />
5.7 MtCO 2 e +>100%<br />
Source: <strong>Forest</strong> <strong>Trends</strong>’ Ecosystem Marketplace.<br />
State of <strong>the</strong> Voluntary Carbon Markets 2013.<br />
a diffi cult policy environment, Australian suppliers –<br />
also facing signifi cant policy uncertainty – managed<br />
an upswing in demand to transact 90% of Oceania’s<br />
volume, partly in anticipation of Australia’s $23/tCO 2 e<br />
federal fi xed price carbon scheme, which launched in<br />
July 2012 and will transition to a market-set price after<br />
three years. All told, <strong>the</strong> region supplied 7.3 MtCO 2 e<br />
of transacted offsets (a >100% increase from 2011)<br />
at an average price that was none<strong>the</strong>less lower ($8.8/<br />
tCO 2 e) as pre-compliance ra<strong>the</strong>r than purely voluntary<br />
drivers took hold.<br />
Possibilities for project development under Australia’s<br />
government-administered Carbon Farming Initiative<br />
(CFI) – focused on Kyoto-compliant abatement<br />
in domestic agriculture, forestry, land use – are<br />
broadening as methodologies are slowly approved<br />
for compliance use. One MtCO 2 e in Kyoto and non-<br />
Kyoto CFI offsets have been issued to date, drawing<br />
primarily from landfi ll gas, piggery, and waste<br />
diversion projects. A number of savannah burning<br />
and A/R projects have also been registered in <strong>the</strong> CFI<br />
pipeline.<br />
The fi rst CFI contract was signed in July 2012, when<br />
Australian airline Qantas agreed to buy up to 1.5<br />
MtCO2e in credits from a revegetation project to help<br />
comply with <strong>the</strong> carbon tax, with a small proportion<br />
for voluntary use. The agreement fell through in<br />
early 2013. While suppliers transacted CFI units to<br />
pre-compliance and voluntary buyers, <strong>the</strong> market<br />
generally remained cautious toward large, long-term<br />
commitments given <strong>the</strong> uncertainty created by <strong>the</strong><br />
upcoming federal elections this September. Suppliers<br />
say that <strong>the</strong> CFI, which enjoys bipartisan support,<br />
is most likely around to stay, but CFI demand and<br />
terms of project eligibility could potentially undergo<br />
dramatic change.<br />
As one Australian market participant explains,<br />
“Depending on <strong>the</strong> outcome of <strong>the</strong> next election<br />
and how that affects <strong>the</strong> CFI, it’s possible that,<br />
instead of emitters being <strong>the</strong> main purchaser of<br />
compliance-grade credits, <strong>the</strong> government will<br />
become <strong>the</strong> largest customer in <strong>the</strong> marketplace<br />
and CFI credits will be bought and sold through an<br />
open government tender process.”<br />
Australian buyers took a relatively balanced portfolio<br />
approach in 2012, drawing from a mix of 60% of offsets<br />
from international projects and 40% from domestic<br />
projects approved under <strong>the</strong> government-administered<br />
National Carbon Offset Standard (NCOS), with some<br />
limited carbon neutrality claims.
Domestic project development using independent<br />
third-party standards remained quiet due to anticipation<br />
around <strong>the</strong> CFI and <strong>the</strong> dearth of relevant non-Kyoto<br />
land. This did not stop some Australian players from<br />
engaging in project development overseas, particularly<br />
in Sou<strong>the</strong>ast Asia, with an eye to generating larger<br />
volumes of offsets at lower costs.<br />
In New Zealand, voluntary offset transaction volume<br />
fell by over 50% in 2012. With just 19% of offsets sold<br />
to domestic voluntary buyers, both Kyoto units and<br />
VERs generated through <strong>the</strong> country’s governmentadministered<br />
Permanent <strong>Forest</strong> Sink Initiative (PFSI)<br />
tapped into a limited stock of offshore voluntary<br />
buyers in Canada, Germany, and Japan. Suppliers<br />
say voluntary demand has diminished not just by<br />
domestic buyers due to restrictive guidelines on<br />
offsetting and carbon neutrality claims established<br />
by <strong>the</strong> country’s Fair Trading Act of 1996, but also by<br />
overseas buyers due to <strong>the</strong> infl ux of competing offsets<br />
from VCS REDD and o<strong>the</strong>r projects.<br />
While selling to <strong>the</strong> occasional voluntary buyer, New<br />
Zealand project developers still rely on business from<br />
<strong>the</strong> domestic compliance market via New Zealand’s<br />
ETS, which continues to tank <strong>the</strong> price of domestic<br />
offsets with its unrestricted import of low-priced<br />
international Kyoto units.<br />
Because New Zealand’s government has opted not to<br />
participate in <strong>the</strong> Kyoto Protocol’s second commitment<br />
period, domestic emitters will no longer be able to<br />
access Kyoto units starting 2015. While it is unclear<br />
what emissions reduction target <strong>the</strong> government will<br />
pursue in place of its Kyoto target, suppliers anticipate<br />
that <strong>the</strong> scrapping of Kyoto units could help recover<br />
domestic prices. Price recovery will also depend on<br />
how heavily <strong>the</strong> government intends to infl uence<br />
pricing starting 2015 – whe<strong>the</strong>r through auctioning<br />
limits to infl uence supply or through price support<br />
measures like a fl oor price.<br />
Although <strong>the</strong> PFSI has revolved around <strong>the</strong> issuance<br />
of Kyoto units (AAUs) to date, New Zealand’s Ministry<br />
of Primary Industries has committed to run <strong>the</strong> PFSI<br />
independently of Kyoto. Landowners working within<br />
PFSI have a termination right to exit <strong>the</strong>ir 50+-year<br />
covenants with <strong>the</strong> Crown by June 30 this year. While<br />
some may exit, o<strong>the</strong>rs await clarity on what type of new<br />
domestic compliance unit will replace PFSI-generated<br />
Kyoto units. The Ministry is slated to provide guidance<br />
by year end on whe<strong>the</strong>r suppliers can claim domestic<br />
compliance units under <strong>the</strong> PFSI starting 2014 or<br />
whe<strong>the</strong>r AAUs will still be issued until 2015.<br />
State of <strong>the</strong> Voluntary Carbon Markets 2013 73<br />
To bolster <strong>the</strong> value of <strong>the</strong>ir offsets in <strong>the</strong> meantime,<br />
some suppliers are considering a divide-andconquer<br />
method whereby <strong>the</strong>y sell current vintages of<br />
compliance units into voluntary markets, while pushing<br />
older vintages to compliance buyers.<br />
“There is also some interest to convert compliance<br />
units into some kind of voluntary credit to be traded<br />
on a voluntary registry,” says Ollie Belton, Analyst<br />
at Permanent <strong>Forest</strong>s New Zealand, noting that <strong>the</strong><br />
price spreads between VERs and NZ units [NZUs<br />
and NZ AAUs] would likely need to be greater<br />
before conversion would make sense.<br />
“Right now it’s a lot of ambition, time and money<br />
without guaranteed payback, so it’s really unclear<br />
as to whe<strong>the</strong>r it’s worth it.”<br />
5.8 EU and Non-EU Europe: EU Demand Soars, Turkey<br />
Standards Shift<br />
While <strong>the</strong> EU’s participation in <strong>the</strong> Kyoto Protocol<br />
prevents regional suppliers from generating offsets,<br />
voluntary buyers in EU member countries have<br />
become <strong>the</strong> largest source of demand for <strong>the</strong> vast<br />
majority of <strong>the</strong> developing world’s offsets. EU-based<br />
fi rms provide project fi nance and/or offset demand<br />
for suppliers in every region – including a small<br />
proportion of offsets from North America – at a pace<br />
that is ever growing. In 2012, EU-based buyers<br />
were <strong>the</strong> source of 40% of OTC offset market value.<br />
European offset suppliers transacted one third of all<br />
offsets transacted world-wide, representing 38% of<br />
overall market value ($196 million).<br />
European offset demand grew 34%, from 33 MtCO 2 e<br />
in 2011 to 43.4 MtCO 2 e in 2012. A full half of <strong>the</strong>se<br />
Table 25: Europe by <strong>the</strong> Numbers, 2012<br />
Reductions / Year Total, 2012<br />
# Survey respondents<br />
in region<br />
% Change<br />
from 2011<br />
83 -8%<br />
Volume supplied 1.5 MtCO 2 e +3%<br />
Volume purchased<br />
domestically<br />
Value of domestic<br />
purchased<br />
$43.4/ tCO 2 e +34%<br />
$205 M<br />
Source: <strong>Forest</strong> <strong>Trends</strong>’ Ecosystem Marketplace.<br />
State of <strong>the</strong> Voluntary Carbon Markets 2013.<br />
5. Regional Market Deep Dive: Where’s, Who’s, and How’s of Voluntary Offsetting in 2012
74 State of <strong>the</strong> Voluntary Carbon Markets 2013<br />
5. Regional Market Deep Dive: Where’s, Who’s, and How’s of Voluntary Offsetting in 2012<br />
offsets were sourced from projects in Asia (almost all<br />
renewable energy) with ano<strong>the</strong>r 9% (4 MtCO 2 e) from<br />
Africa-based projects. EU-based suppliers say that <strong>the</strong><br />
<strong>the</strong> region’s continued and predominant demand for<br />
renewable energy project offsets is largely attributable<br />
to <strong>the</strong> “portfolio” approach to fulfi lling offsetting<br />
commitments, as described in sections 2.1 and 4.2.<br />
Even before renewable energy offsets were as lowpriced<br />
as <strong>the</strong>y are in today’s marketplace, however, <strong>the</strong><br />
EU was <strong>the</strong> prominent buyer location.<br />
Just over half (52%) of all offsets transacted to EU-based<br />
buyers in 2012 were sold to carbon offset retailers –<br />
who ei<strong>the</strong>r re-sold <strong>the</strong> offsets under new contracts or<br />
procured offset volumes to fi ll existing client needs.<br />
While most of <strong>the</strong>se contracts were with buyers located<br />
within close range, a few EU retailers reported stepping<br />
up <strong>the</strong>ir work in o<strong>the</strong>r regions with emerging markets.<br />
Particularly as North American buyers like Microsoft<br />
begin to consider international offsets – refl ecting<br />
<strong>the</strong>ir multinational environmental footprint – EU-based<br />
suppliers say <strong>the</strong> US market in particular is catching<br />
<strong>the</strong> attention of retailers in search of new sources of<br />
demand. A few suppliers interviewed for this report<br />
noted that <strong>the</strong> EU market has heavily relied on a few<br />
prominent multi-year contracts with large companies<br />
that are due to run out. Suppliers are concerned that<br />
those buyers might allocate <strong>the</strong>ir CSR resources to<br />
activities o<strong>the</strong>r than offsetting in <strong>the</strong> future.<br />
Despite <strong>the</strong>se concerns, purely voluntary offsetting by<br />
end users motivated 18 MtCO 2 e of volumes transacted<br />
in <strong>the</strong> region – most of that supplied by EU-based<br />
suppliers. Of this volume, buyers sought 6 MtCO 2 e to<br />
make good on <strong>the</strong>ir CSR commitments. Close behind,<br />
ano<strong>the</strong>r 5.4 MtCO 2 e was purchased to demonstrate<br />
climate leadership within buyers’ industries or –<br />
according to suppliers – to demonstrate action in<br />
<strong>the</strong> face of <strong>the</strong> region’s weak response to its faltering<br />
carbon price.<br />
“The EU voted against putting pressure on EU<br />
enterprises, which led to less upward pressure<br />
on <strong>the</strong> carbon price,” explains Bertrand Ramé<br />
of French retailer Love <strong>the</strong> World. “As a result of<br />
this decision, corporations that are willing to do<br />
something meaningful about <strong>the</strong>ir emissions will<br />
have to do it voluntarily – through <strong>the</strong> voluntary<br />
offset market.” Retailers expect this motivation will<br />
become stronger in coming months.<br />
Due to technical limitations to regional supply, a small<br />
proportion of <strong>the</strong> world’s offset were sourced from EUbased<br />
projects. The vast majority of <strong>the</strong> 1.5 MtCO 2 e<br />
transacted from European projects was from methane<br />
projects in Germany that were registered with <strong>the</strong><br />
Chicago Climate Exchange (“CCX”) in <strong>the</strong> fi rst half of<br />
<strong>the</strong> last decade – before <strong>the</strong> Kyoto Protocol came into<br />
force. These offsets were included among <strong>the</strong> CCX’s<br />
handful of large, low-priced transactions to US-based<br />
buyers in 2012 (along with several o<strong>the</strong>r non-US project<br />
locations).<br />
Though <strong>the</strong> region is limited in its ability to generate<br />
offsets, <strong>the</strong> UK’s Woodland Carbon Code – administered<br />
by <strong>the</strong> UK <strong>Forest</strong>ry Commission to incentivize<br />
woodland creation – supports <strong>the</strong> creation of a pertonne<br />
unit that UK-based companies can purchase<br />
as an environmental credit. The UK Department for<br />
Environment, Food and Rural Affairs (DECC) allows<br />
UK companies to claim any support for Woodland<br />
Carbon Code projects against <strong>the</strong>ir annual emissions<br />
reporting – <strong>the</strong> lone case of a national government<br />
allowing voluntary offsetting claims against mandatory<br />
emissions reporting.<br />
In response to this opportunity, <strong>the</strong> UK <strong>Forest</strong>ry<br />
Commission has engaged with Markit Environmental<br />
Registry to chart a course for moving away from <strong>the</strong><br />
program’s internal registry system and instead host <strong>the</strong><br />
Woodland Carbon Units (WCUs) on Markit’s platform.<br />
This report survey tracked a smaller volume of WCUs<br />
contracted in 2012, presumably related to a lower<br />
program response rate.<br />
Turning to non-EU member offset supply locations in<br />
Europe, Turkey was <strong>the</strong> region’s primary source of<br />
offset supply – and <strong>the</strong> 7th largest source of offsets<br />
globally. Transaction volumes from Turkey-based<br />
projects none<strong>the</strong>less fell by 31% in 2012, as a function<br />
of competing lower-priced renewables from Asiabased<br />
projects, as well as buyers’ shift in attention to<br />
Table 26: Non-EU Europe by <strong>the</strong> Numbers, 2012<br />
Reductions / Year Total, 2012<br />
# Survey respondents<br />
in region<br />
% Change<br />
from 2011<br />
8 +100%<br />
Volume supplied 3.2 MtCO 2 e -31%<br />
Average price $5/ tCO 2 e -42%<br />
Value $16 M -60%<br />
Source: <strong>Forest</strong> <strong>Trends</strong>’ Ecosystem Marketplace.<br />
State of <strong>the</strong> Voluntary Carbon Markets 2013.
new locations and sources of supply for Gold Standard<br />
offsets. In 2012, we also did not track offset volumes<br />
from a relatively sizeable market participant that had<br />
responded in previous years. Had <strong>the</strong>y reported <strong>the</strong><br />
same volume as in 2011-12, market volume still would<br />
have fallen by 16%.<br />
The voluntary offset market in Turkey experienced<br />
several signifi cant changes in 2012, which infl uenced<br />
<strong>the</strong> region’s falling price and project composition. While<br />
Turkey has traditionally been a source of Gold Standard<br />
wind and, in recent years, some hydropower offsets for<br />
EU-based buyers, in 2012 a larger volume ofoffsets<br />
were sourced from VCS projects in <strong>the</strong> country and at<br />
prices that signifi cantly weighted down <strong>the</strong> regional<br />
average.<br />
In 2012, <strong>the</strong> region’s share of Turkey-based offsets<br />
transacted from Gold Standard projects fell from 72%<br />
(3.2 MtCO 2 e) to 56% (1.8 MtCO 2 e). Offsets from Turkey’s<br />
Gold Standard projects sold for an average $7.2/tCO 2 e<br />
– signifi cantly higher than <strong>the</strong> regional average, which<br />
was pulled down by ano<strong>the</strong>r 1.4 MtCO 2 e of transacted<br />
VCS offsets priced at an average $2/tCO 2 e.<br />
Last year, Turkey-based offset suppliers expressed<br />
concerns about <strong>the</strong> increasingly large volume of<br />
offsets that were eligible for issuance from hydropower<br />
projects. Indeed, <strong>the</strong> region’s mix of transacted<br />
State of <strong>the</strong> Voluntary Carbon Markets 2013 75<br />
project types also changed with <strong>the</strong> growth in VCS<br />
market share. Large hydro projects, which occupied<br />
a 2% share of Turkey-based offsets in 2012, grew <strong>the</strong>ir<br />
market share to 14% in 2012. Hydropower projects of<br />
all sizes supplied 1.3 MtCO 2 e of transacted offsets from<br />
Turkey – up from 0.8 MtCO 2 e in 2011. Gold Standard<br />
offset project developers in <strong>the</strong> region also complained<br />
about a “bottleneck” in new Gold Standard project<br />
approval. Notes one offset supplier, “We had to turn<br />
down a lot of demand last year because <strong>the</strong>re were<br />
simply no new credits issued.”<br />
These changes in Turkey’s market dynamic come at a<br />
sensitive time for <strong>the</strong> region, as Turkey’s government<br />
contemplates <strong>the</strong> development of a national MRV<br />
framework and potential establishment of a domestic<br />
emissions trading scheme to impact <strong>the</strong> energy sector.<br />
Turkey has been closely engaged with tracking and<br />
registering voluntary offset projects, as <strong>the</strong> only real<br />
carbon market in <strong>the</strong> non-EU member country.<br />
Turkey’s recent proposal submission to <strong>the</strong> PMR<br />
state that <strong>the</strong> country desires to harness <strong>the</strong> lessons<br />
learned from its voluntary markets experience to<br />
inform a domestic ETS and sector mitigation. In<br />
particular, <strong>the</strong> government has expressed its desire<br />
to “link current VCM projects with any future marketbased<br />
mechanisms in order to let emissions reduction<br />
projects continue to benefi t from new market(s).”<br />
.<br />
5. Regional Market Deep Dive: Where’s, Who’s, and How’s of Voluntary Offsetting in 2012
<strong>Maneuvering</strong> <strong>the</strong> <strong>Mosaic</strong> State of <strong>the</strong> Voluntary Carbon Markets 2013<br />
6. Projections<br />
Striking a New Balance
78 State of <strong>the</strong> Voluntary Carbon Markets 2013<br />
6. Projections: Striking a New Balance<br />
MtCO 2 e<br />
Figure 57: Market Projections, Supplier-Estimated Project Pipeline Volume and Value, 2013-2017<br />
$1,192<br />
180<br />
$709<br />
160<br />
140<br />
120<br />
100<br />
80<br />
60<br />
40<br />
20<br />
0<br />
REDD<br />
Cookstoves<br />
$178<br />
Affor./Refor.<br />
Notes: Based on 351 MtCO e pipeline targeted toward voluntary buyers as reported by suppliers, excluding estimates >50<br />
2<br />
MtCO e and pre-compliance market volumes, which are discussed in Box 3.<br />
2<br />
Source: <strong>Forest</strong> <strong>Trends</strong>’ Ecosystem Marketplace. State of <strong>the</strong> Voluntary Carbon Markets 2013.<br />
Removing a few large outlier responses from this<br />
estimate (>50 MtCO2e over fi ve years), <strong>the</strong> total volume<br />
of tonnes targeted toward purely voluntary buyers<br />
that suppliers expect to bring to market over <strong>the</strong> next<br />
fi ve years is closer to 351 MtCO 2 e. Measuring <strong>the</strong>se<br />
estimates against <strong>the</strong> current average price for each<br />
project type (Figure 57), <strong>the</strong> total value of suppliers’<br />
offset pipeline adds an estimated $2.7b over fi ve years<br />
(or $535 million/year) to <strong>the</strong> potential fi nancial needs of<br />
existing projects described at <strong>the</strong> top of this section.<br />
It is important to recognize, though, that projects do<br />
not necessarily have to sell every tonne in order to<br />
continue supporting project activities.<br />
To absorb <strong>the</strong>se volumes, and according to survey respondents’<br />
back-of-<strong>the</strong>-envelope predictions, suppliers<br />
expect an average market growth rate of 17% in 2012-<br />
2020. Based on <strong>the</strong> voluntary carbon market’s historical<br />
average price of $5.9/tCO 2 e, suppliers’ predictions<br />
place market value at $2.3 billion in 2020. Ano<strong>the</strong>r predictive<br />
measure – that of recent years’ average growth<br />
rate for voluntary offset demand (13% from years 2008<br />
to 2012) – estimates 2020 market value at $1.6 billion.<br />
6.2 Supplier Estimate Details<br />
$58 $59<br />
Wind<br />
$84 $113<br />
This year, 87 survey respondents predicted <strong>the</strong> overall<br />
transaction volume of <strong>the</strong> voluntary carbon markets<br />
in 2012, as well as projected market size and growth<br />
through 2020. With all responses weighted evenly, this<br />
N 2 O<br />
Energy efficiency<br />
Water filters<br />
Large hydro<br />
$35 $82 $59 $15 $17 $25 $44<br />
Not specified<br />
IFM<br />
Run-of-River hydro<br />
Landfill methane<br />
Biomass<br />
year’s respondents slightly overestimated <strong>the</strong> 2012<br />
market in which <strong>the</strong>y sold offsets, predicting that <strong>the</strong><br />
market transacted 112 MtCO 2 e in 2012. This is only 11<br />
MtCO 2 e more than was actually tracked.<br />
Looking ahead, suppliers forecasted a 54% growth rate<br />
for <strong>the</strong> 2013 market, expecting that <strong>the</strong>y and <strong>the</strong>ir peers<br />
will transact 172 MtCO 2 e in <strong>the</strong> current year. To achieve<br />
this predicted sales volume in 2013, suppliers would<br />
need to transact 71 MtCO 2 e more than <strong>the</strong>y did in 2012.<br />
Future year estimates (2013-2020) are more conservative<br />
than volumes predicted by our 2012 survey<br />
participants participating in <strong>the</strong> 2011 offset market.<br />
Suppliers say this more conservative growth rate<br />
is restrained by <strong>the</strong> market’s emerging picture of<br />
steady but limited year-on-year demand – but shows<br />
continued growth based on <strong>the</strong> expected emergence<br />
of domestic offset demand from developing markets<br />
outside of North America and <strong>the</strong> EU.<br />
6.3 Predicted Standard Utilization<br />
Biogas<br />
$800<br />
$700<br />
$600<br />
$500<br />
$400<br />
$300<br />
$200<br />
$100<br />
$0<br />
$/tCO 2 e<br />
Third-party standards play a powerful role in shaping<br />
<strong>the</strong> voluntary carbon market, offering guidance to<br />
project developers in <strong>the</strong> mainstream and niche<br />
markets. With all of <strong>the</strong> choices available, we asked<br />
suppliers to weigh in on which standards <strong>the</strong>y plan<br />
to use in 2013. Participants were given <strong>the</strong> option to<br />
select an unlimited number of standards from our list
– including internally created standards and a writein<br />
option. Each response was given equal weight<br />
regardless of suppliers’ transaction volume. Figure 58<br />
shows <strong>the</strong> number of respondents that selected each<br />
standard. As responses are not volume-weighted, a<br />
standard’s popularity does not necessarily equate to<br />
market share in 2013.<br />
In keeping with previous years’ trends, <strong>the</strong> VCS was<br />
again reported as <strong>the</strong> most sought-after certifi cation,<br />
with 118 organizations (27% of respondents) planning<br />
to use <strong>the</strong> standard in 2013 – 2 fewer than in 2012. As<br />
seen fur<strong>the</strong>r down <strong>the</strong> chart, at least 43 respondents<br />
intend to tag VCS forestry certifi cation with <strong>the</strong> CCB<br />
Standards as well.<br />
Close behind <strong>the</strong> VCS, The Gold Standard gained<br />
signifi cant traction with as many responses as were<br />
tracked for <strong>the</strong> VCS in <strong>the</strong> previous year – and <strong>the</strong><br />
largest growth in predicted usage numbers of any<br />
standard. This includes some responses that were<br />
once attributed to <strong>the</strong> CarbonFix Standard, which will<br />
now fall within The Gold Standard’s jurisdiction.<br />
Next in line were suppliers that expect to sell offsets<br />
certifi ed to CDM methodologies in 2013 – which saw 6<br />
more responses than in 2012. CAR retained its fourth<br />
place ranking among carbon accounting standards<br />
in 2013, but <strong>the</strong> number of organizations planning to<br />
140<br />
120<br />
100<br />
80<br />
60<br />
40<br />
20<br />
0<br />
118<br />
Figure 58: Market Projections, Supplier-Estimated Standard Utilization, 2013<br />
99<br />
VCS<br />
Gold Standard<br />
51<br />
CDM<br />
43<br />
CCB Standards<br />
28<br />
CAR<br />
SOCIAL CARBON<br />
23 21 18 12<br />
California Offset Regs<br />
ACR<br />
State of <strong>the</strong> Voluntary Carbon Markets 2013 79<br />
use <strong>the</strong> standard or its registry fell by 2 respondents<br />
in 2012. So, too, did prospective users of California<br />
Compliance Offset regulation-based protocols, which<br />
fell by 4 responses in our 2013 survey.<br />
Predicted 2013 usage numbers for ACR were also<br />
down by 4 responses, though intended use of its<br />
registry (presumably as a California compliance<br />
program Offset Project Registry) increased by 12<br />
responses to 34 users.<br />
6.4 The Year Ahead: Striking a New Balance<br />
As seen in <strong>the</strong> mosaic of project types, regional trends<br />
and unpredictable drivers of offset demand presented<br />
in this report, our analysis should be viewed only as a<br />
starting point for understanding demand in <strong>the</strong> current<br />
year which continues to evolve as both offset buyers<br />
and suppliers innovate new ways to mitigate GHGs,<br />
infl uence policy, and communicate <strong>the</strong>ir purchases<br />
and successes.<br />
Already in 2013, major organizations ranging from<br />
Microsoft to <strong>the</strong> United Nations Environment Programme<br />
have renewed or made new offsetting commitments. On<br />
<strong>the</strong> “sell” side, programs like <strong>the</strong> UN Foundation’s Global<br />
Alliance for Clean Cookstoves and campaigns Code<br />
REDD and Whole World Water are expanding <strong>the</strong>ir<br />
efforts to raise public awareness of voluntary carbon<br />
ISO-14064<br />
Notes: Based on 436 unique responses.<br />
Source: <strong>Forest</strong> <strong>Trends</strong>’ Ecosystem Marketplace. State of <strong>the</strong> Voluntary Carbon Markets 2013.<br />
8<br />
VER+<br />
CCX<br />
Pacific Carbon Standard<br />
5 5 2 1 1 1<br />
NZ PFSI<br />
Internal<br />
J-VER<br />
K-VER<br />
6. Projections: Striking a New Balance
80 State of <strong>the</strong> Voluntary Carbon Markets 2013<br />
6. Projections: Striking a New Balance<br />
fi nance’s contributions to forest conservation and<br />
sustainable development. Meanwhile, offset suppliers<br />
are experimenting with crowd-funding, collective<br />
purchase auctions, and wrapping inexpensive issued<br />
offsets with forward sales of offsets from early-stage<br />
projects to support both existing and future offset<br />
project development.<br />
Offset suppliers remain concerned that <strong>the</strong> collapse<br />
of an EU carbon price and exclusion of a host of<br />
CDM projects post-2012 will channel an oversupply<br />
of compliance instruments into <strong>the</strong> voluntary markets.<br />
Ecosystem Marketplace will continue to closely track<br />
this trend throughout <strong>the</strong> year.<br />
While concerns about <strong>the</strong> fate of millions of CERs<br />
drive some suppliers to distance <strong>the</strong>mselves and<br />
<strong>the</strong>ir products from <strong>the</strong> Kyoto offset market, o<strong>the</strong>rs are<br />
focusing on connecting with emerging compliance<br />
programs – in California, Australia, South Africa,<br />
China, and various regions in Latin America. Here,<br />
offset infrastructure providers and market participants<br />
are working to bridge <strong>the</strong> gap between voluntary and<br />
compliance programs. As some offsetting activities in<br />
<strong>the</strong>se regions shift from voluntary, “pre-compliance”<br />
preparations to full-blown compliance market<br />
participation, fi ndings around market size and makeup<br />
in this report series will no doubt change substantially<br />
in future editions.<br />
In <strong>the</strong> midst of this dynamic marketplace, voluntary<br />
offset market players are also changing <strong>the</strong>ir pitch<br />
from simply offsetting carbon emissions to relating<br />
<strong>the</strong>ir on-<strong>the</strong>-ground experience to broader policy and<br />
corporate sustainability objectives.<br />
This involves highlighting <strong>the</strong> offset project market’s<br />
potential for rapid response to mitigation opportunities<br />
that can supplement slower-moving fund-based<br />
actions. Some market players are focused on<br />
communicating lessons learned about verifi cation<br />
and reults-based fi nance models. Still o<strong>the</strong>rs are<br />
developing a new lexicon around <strong>the</strong> delivery of<br />
vulnerability reduction, health, and o<strong>the</strong>r public<br />
benefi ts associated with private sector interventions.<br />
Through a combination of <strong>the</strong>se and o<strong>the</strong>r efforts to<br />
raise <strong>the</strong> offset product market profi le, suppliers strive<br />
to remain relevant as climate policy makers target ever<br />
more scalable solutions.
<strong>Maneuvering</strong> <strong>the</strong> <strong>Mosaic</strong> State of <strong>the</strong> Voluntary Carbon Markets 2013<br />
ANNEXES
82 State of <strong>the</strong> Voluntary Carbon Markets 2013<br />
ANNEXES<br />
In early 2013, we surveyed standards and registries<br />
to explore <strong>the</strong> volume and types of offsets that have<br />
been tracked through <strong>the</strong>ir systems, as well as<br />
how each standard’s structure and scope impacts<br />
uptake. Tracked information varied slightly by each<br />
infrastructure provider, but what we were able to obtain<br />
is reported in <strong>the</strong> following section – along with seven<br />
years’ worth of historical State of <strong>the</strong> Voluntary Carbon<br />
Markets survey data.<br />
At <strong>the</strong> top of each standard’s profi le – created for most<br />
standards with more than one year’s worth of available<br />
transaction data (including 2012) – we present a<br />
summary of <strong>the</strong> standard and basic price and volume<br />
information. The bottom half of each profi le is dedicated<br />
to basic information about <strong>the</strong> standards’ geographic<br />
and technical scope; use of third-party verifi cation<br />
for various project activities; <strong>the</strong> number of projects<br />
validated by project category through <strong>the</strong> end of 2012;<br />
and <strong>the</strong> market share for different types of offsets that<br />
were transacted under each standard in 2012 only.<br />
In between <strong>the</strong>se quantitative and qualitative sections,<br />
a series of ratios explore <strong>the</strong> relationships between<br />
available, transacted, and retired offset volumes.<br />
ANNEX 1: Standards<br />
Issued-to-Transacted Ratio: This ratio compares<br />
<strong>the</strong> volume of offsets issued by a registry according<br />
to <strong>the</strong> featured standard against volume of offsets<br />
that suppliers have reported transacting, for all years<br />
and in 2011. In some cases, transaction volumes are<br />
higher than issuance volumes – this captures both<br />
market turnover and forward sales.<br />
Issued-to-Retired Ratio: This ratio compares <strong>the</strong><br />
volume of offsets issued by a registry according to <strong>the</strong><br />
featured standard against <strong>the</strong> volume of offsets that<br />
registries have reported retiring from that standard, for<br />
all years and in 2011.<br />
A note on our methods<br />
In this section, we rely exclusively on registries’<br />
retirement data and not <strong>the</strong> retired volumes we track<br />
in our survey, as registries’ retired volumes are more<br />
comprehensive. The proportion of market supply that is<br />
associated with unreported, private activities remains<br />
unknown. Also, we include a key for <strong>the</strong> “Validated and<br />
Transacted Projects by Type” charts at <strong>the</strong> bottom of<br />
each page.
A.1.1 Carbon Project Accounting Standards<br />
American Carbon Registry - ACR Standard (Version 2.1, 2010)<br />
State of <strong>the</strong> Voluntary Carbon Markets 2013 83<br />
ACR, founded in 1996, is a non-profi t enterprise of Winrock International. ACR currently has three published standards, all of which<br />
underwent scientifi c peer review. In 2012, ACR was approved as an Offset Project Registry for California’s cap-and-trade program,<br />
under which it will help oversee <strong>the</strong> listing, verifi cation and, issuance of offsets being developed using <strong>the</strong> California Air Resources<br />
Board’s compliance or early-action offset protocols. New guidelines ACR released in 2012 include <strong>the</strong> world’s fi rst methodology for<br />
deltaic wetland restoration, a nested REDD standard, as well as methodologies for truck stop electrifi cation and agricultural N O. 2<br />
Utilization Average Price Transacted (Mt) # Projects Validated Volume Retired (Mt)<br />
All Years $4.4 12.3 68 2.9<br />
2012 $7.4 0.5 0 0.05<br />
Ratios Issued : Transacted Issued : Retired<br />
All Years 3 to 1 13 to 1<br />
2012 7 to 1 58 to 1<br />
Standard Type<br />
Standard Scope<br />
Carbon accounting + tagged cobenefi<br />
ts<br />
Transacted Project Types,<br />
2012 (by % Share)<br />
Validated Projects by Type<br />
(by Count, through 2012)<br />
2 1<br />
Asset Generated Carbon offset<br />
Eligible Countries All<br />
Verification Required for:<br />
11%<br />
49%<br />
8<br />
5<br />
Projects<br />
Methodologies<br />
√<br />
√<br />
40%<br />
16<br />
36<br />
Emissions Reductions √<br />
Co-benefi ts Tagged<br />
MAX. time b/w<br />
verifi cations (years):<br />
6<br />
AFOLU Renewables Methane Gases<br />
Energy Effi ciency & Fuel Switch O<strong>the</strong>r<br />
CarbonFix Standard – CarbonFix (Version 3.2, 2011)<br />
The CarbonFix Standard applies to afforestation, reforestation, natural regeneration, and agro-forestry projects that demonstrate a<br />
commitment to socio-economic and ecological responsibility. In September 2012 The Gold Standard acquired CarbonFix in order<br />
to support its expansion into land use and forestry. Existing CarbonFix projects are being hosted by The Gold Standard and will<br />
transition into Gold Standard projects if <strong>the</strong>y meet <strong>the</strong> rules under The Gold Standard version 3.0.<br />
Utilization Average Price Transacted (Mt) # Projects Validated Volume Retired (Mt)<br />
All Years $13.9 0.5 8 0.04<br />
2012 $17.5 0.04 3 N/A<br />
Ratios Issued : Transacted Issued : Retired Issued : Buffer<br />
All Years 3 to 2 16 to 1 N/A<br />
2012 9 to 1 N/A 0.03<br />
Standard Type<br />
Standard Scope<br />
Carbon accounting + embedded<br />
co-benefi ts<br />
Transacted Project Types,<br />
2012 (by % Share)<br />
Validated Projects by Type<br />
(by Count, through 2012)<br />
Asset Generated Carbon offset<br />
Eligible Countries All<br />
Projects<br />
Verification Required for:<br />
√<br />
100%<br />
8<br />
Methodologies √<br />
Emissions Reductions √<br />
Co-benefi ts √<br />
MAX. time between<br />
verifi cations (years)<br />
5<br />
AFOLU Renewables Methane Gases<br />
Energy Effi ciency & Fuel Switch O<strong>the</strong>r<br />
ANNEXES
84 State of <strong>the</strong> Voluntary Carbon Markets 2013<br />
ANNEXES<br />
Chicago Climate Exchange – CCX (Several publications 2003 - 2012)<br />
After retiring its voluntary cap-and-trade scheme in 2010, in 2011 CCX launched <strong>the</strong> Chicago Climate Exchange Offsets Registry<br />
Program to register verifi ed emissions reductions based on a comprehensive set of established protocols.<br />
Utilization Avgerage Price Transacted (Mt) # Projects Validated Volume Retired (Mt)<br />
All Years $1 21 343 26<br />
2012 $0.12 8 0 2<br />
Standard Type<br />
Standard Scope<br />
Carbon accounting only<br />
Transacted Project Types,<br />
2012 (by % Share)<br />
Validated Projects by Type<br />
(by Count, through 2012)<br />
Asset Generated Carbon offset<br />
Eligible Countries All<br />
25<br />
Verification Required for:<br />
121<br />
Projects √<br />
73<br />
15<br />
1%<br />
15%<br />
45%<br />
0.1%<br />
Methodologies √<br />
Emissions Reductions √<br />
Co-benefi ts N/A<br />
MAX. time between<br />
verifi cations (years)<br />
5<br />
Climate Action Reserve – CAR (Program Manual, 2011)<br />
CAR is a non-profi t carbon offset registry and standards-setting body. CAR has so far developed several carbon offset protocols for<br />
use in <strong>the</strong> US and in some cases Mexico. In 2012, CAR became an Offset Project Registry for California’s cap-and-trade program,<br />
under which it will help oversee <strong>the</strong> registration and issuance of offsets being developed using <strong>the</strong> California Air Resources Board’s<br />
compliance or early-action offset protocols. So far, four of CAR protocols have been approved for use in <strong>the</strong> new compliance<br />
market. New guidelines released by CAR in 2012 include specifi cations for coal mine methane and nitrogen management.<br />
Utilization Average Price Transacted (Mt) # Projects Validated Volume Retired (Mt)<br />
All Years $6.9 49 177 5.4<br />
2012 $7.1 6.7 51 2.3<br />
Ratios: Issued : Transacted Issued : Retired<br />
Asset Generated Carbon offset<br />
Eligible Countries: US & Mexico<br />
Projects<br />
Verification Required for:<br />
√<br />
Methodologies √<br />
Emissions Reductions √<br />
Co-benefi ts N/A<br />
MAX. time between<br />
verifi cations (years):<br />
6<br />
AFOLU Renewables Methane Gases<br />
Energy Effi ciency & Fuel Switch O<strong>the</strong>r<br />
All Years 3 to 5 5 to 1<br />
2012 3 to 2 4 to 1<br />
Standard Scope<br />
Transacted Project Types, Validated Projects by Type<br />
Standard Type Carbon accounting only<br />
2012 (by % Share) (by Count, through 2012)<br />
Note: Only reports publicly available data on <strong>the</strong> CAR APX Registry.<br />
39%<br />
32%<br />
18%<br />
50%<br />
31<br />
109<br />
17 4<br />
135<br />
AFOLU Renewables Methane Gases<br />
Energy Effi ciency & Fuel Switch O<strong>the</strong>r<br />
* Because CAR does not have a formalized validation stage, <strong>the</strong> number of projects in this category represents <strong>the</strong> very fi rst time that a<br />
project is verifi ed, as a proxy for validation.
The Gold Standard – GS (Version 2.2, 2012)<br />
State of <strong>the</strong> Voluntary Carbon Markets 2013 85<br />
The Gold Standard, traditionally focused on renewable energy and energy effi ciency, is increasingly taking a landscape approach,<br />
with plans to release its A/R requirements and <strong>Forest</strong>ry & Land Use framework in October 2013. The standard body conducts inhouse<br />
audits of all projects – twice during project development and before registration – and reviews all auditor reports. Projects<br />
must score “positive” in two of three categories (environment, social, economic, and technological development) against 12<br />
development indicators.<br />
Utilization Average Price Transacted (Mt) # Projects Validated Volume Retired (Mt)<br />
All Years $11.4 36 226 4.6<br />
2012 $9.3 9 81 2<br />
Ratios Issued : Transacted Issued : Retired<br />
All Years 1 to 3 2 to 1<br />
2012: 2 to 3 3 to 1<br />
Standard Type<br />
Asset Generated<br />
Standard Scope<br />
Carbon accounting + embedded<br />
co-benefi ts<br />
Carbon offset<br />
Transacted Project Types,<br />
2012 (by % Share)<br />
6%<br />
Validated Projects by Type<br />
(by Count, through 2012)<br />
Eligible Countries: All<br />
Projects<br />
Verification Required for:<br />
√<br />
3%<br />
8<br />
Methodologies √<br />
Emissions Reductions √<br />
91%<br />
218<br />
Co-benefi ts √<br />
MAX. time between<br />
verifi cations (years):<br />
5<br />
AFOLU Renewables Methane Gases<br />
Energy Effi ciency & Fuel Switch O<strong>the</strong>r<br />
Plan Vivo Standard – Plan Vivo (Second Edition, 2008)<br />
Plan Vivo certifi es forestry offset programs, ensuring that livelihood needs are considered and built into project design, and local<br />
income sources are diversifi ed to reduce poverty and tackle <strong>the</strong> root causes of deforestation and land degradation. In 2012, Plan<br />
Vivo undertook a public consultation process on an updated set of standard guidelines, which it plans to release soon.<br />
Utilization Average Price Transacted (Mt) # Projects Validated Volume Retired (Mt)<br />
All Years $7.5 1.4 8 1.1<br />
2012: $7 0.3 1 0.2<br />
Ratios Issued : Transacted Issued : Retired<br />
All Years 0.9 to 1 0.9 to 1<br />
2012 1.2 to 1 1.1 to 1<br />
Standard Scope<br />
Standard Type<br />
Carbon accounting + embedded<br />
co-benefi ts<br />
Transacted Project Types,<br />
2012 (by % Share)<br />
Validated Projects by Type<br />
(by Count, through 2012)<br />
Asset Generated Carbon offset<br />
Eligible Countries Developing countries<br />
Projects<br />
Verification Required for:<br />
√<br />
Methodologies √<br />
Emissions Reductions √<br />
Co-benefi ts √<br />
MAX. time between<br />
verifi cations (years):<br />
5<br />
100%<br />
AFOLU Renewables Methane Gases<br />
Energy Effi ciency & Fuel Switch O<strong>the</strong>r<br />
8<br />
ANNEXES
86 State of <strong>the</strong> Voluntary Carbon Markets 2013<br />
ANNEXES<br />
VER+ (Version 2.0, 2008)<br />
The VER+ Standard is a voluntary offset standard launched by project verifi er TÜV SÜD for projects that are not eligible for CDM or<br />
JI accreditation but follow <strong>the</strong> CDM and JI project design methodologies. Projects wishing to receive VER+ accreditation may only<br />
be validated and verifi ed by UNFCCC-accredited Designated Operating Entities or AIE organizations.<br />
Utilization Average Price Transacted (Mt) # Projects Validated Volume Retired (Mt)<br />
All Years $5.7 3.5 34 1<br />
2012 $18.1 0.02 0 0.01<br />
Ratios Issued : Transacted Issued : Retired<br />
All Years 1 to 1 4 to 1<br />
2012 N/A N/A<br />
Standard Scope<br />
Transacted Project Types, Validated Projects by Type<br />
Standard Type Carbon accounting only<br />
2012 (by % Share) (by Count, through 2012)<br />
Asset Generated Carbon offset<br />
Eligible Countries All<br />
Projects<br />
Verification Required for:<br />
√<br />
Methodologies √<br />
Emissions Reductions √<br />
Co-benefi ts<br />
MAX. time between<br />
verifi cations (years):<br />
N/A<br />
Verified Carbon Standard – VCS (Version 3, 2011)<br />
Founded in 2005 by <strong>the</strong> Climate Group, <strong>the</strong> International Emissions Trading Association, <strong>the</strong> World Economic Forum, and <strong>the</strong> World<br />
Business Council for Sustainable Development, <strong>the</strong> Verifi ed Carbon Standard has become one of <strong>the</strong> world’s most widely used<br />
carbon accounting standards, which now aims to pioneer efforts to develop standardized methods that will streamline <strong>the</strong> project<br />
approval process, reduce transaction costs and enhance transparency. Across <strong>the</strong> world, projects using <strong>the</strong> VCS Standard have<br />
issued more than 120 million offsets.<br />
Utilization Average Price Transacted (Mt) # Projects Validated Volume Retired (Mt)<br />
All Years $5.0 155 935 31<br />
2012 $5.2 34 206 16<br />
Ratios Issued : Transacted Issued : Retired<br />
All Years 7 to 10 4 to 1<br />
2012 1 to 1 2 to 1<br />
Standard Scope<br />
Transacted Project Types, Validated Projects by Type<br />
Standard Type<br />
Carbon accounting + tagged cobenefi<br />
ts<br />
2012 (by % Share)<br />
4% 1%<br />
(by Count, through 2012)<br />
5 4<br />
Asset Generated Carbon offset<br />
54<br />
Eligible Countries All<br />
80<br />
Verification Required for:<br />
34%<br />
96<br />
Projects √<br />
Methodologies √<br />
61%<br />
696<br />
Emissions Reductions √<br />
Co-benefi ts √<br />
MAX. time between<br />
verifi cations (years):<br />
none<br />
100%<br />
AFOLU Renewables Methane Gases<br />
Energy Effi ciency & Fuel Switch O<strong>the</strong>r<br />
AFOLU Renewables Methane Gases<br />
Energy Effi ciency & Fuel Switch O<strong>the</strong>r<br />
4<br />
3<br />
3<br />
24
A.1.2 Project Co-Benefits Programs<br />
State of <strong>the</strong> Voluntary Carbon Markets 2013 87<br />
Climate, Community & Biodiversity Standards – CCB Standards (2nd edition, 2008)<br />
The CCB Standards are project-design criteria for evaluating land-based carbon mitigation projects’ community and biodiversity cobenefi<br />
ts. As a co-benefi ts only standard, GHG reductions must be verifi ed against ano<strong>the</strong>r underlying carbon standard. Transaction<br />
volumes below are from carbon projects tagged with CCB certifi cation. In 2012, CCB and <strong>the</strong> Verifi ed Carbon Standard introduced<br />
a joint project approval and offset issuance process.<br />
Utilization Average Price Transacted (Mt) # Projects Validated Volume Retired (Mt)<br />
All Years $9.5 36 59 1.2<br />
2012 $8.3 13 15 0.7<br />
Standard Scope<br />
Standard Type Co-benefi ts only<br />
Asset Generated Certifi cate<br />
Eligible Countries All<br />
Projects<br />
Verification Required for:<br />
√<br />
Methodologies √<br />
Emissions Reductions<br />
Co-benefi ts √<br />
AFOLU Renewables Methane Gases<br />
MAX. time b/w<br />
verifi cations (years):<br />
5<br />
Energy Effi ciency & Fuel Switch O<strong>the</strong>r<br />
SOCIALCARBON Standard (Version 5.0, 2013)<br />
The SOCIALCARBON Standard is a certifi cation program based on <strong>the</strong> sustainable livelihoods approach that requires project<br />
developers to apply Standard indicators that correlate with six aspects of <strong>the</strong> project: social, human, fi nancial, natural, biodiversity,<br />
and carbon. SOCIALCARBON is ano<strong>the</strong>r “stacking” standard to be paired with a carbon accounting standard.<br />
Utilization Average Price Transacted (Mt) # Projects Validated Volume Retired (Mt)<br />
Projects √<br />
Methodologies √<br />
Emissions Reductions<br />
Co-benefi ts √<br />
MAX. time between<br />
verifi cations (years):<br />
5<br />
Transacted Project Types,<br />
2012 (by % Share)<br />
100%<br />
Validated Projects by Type<br />
(by Count, through 2012)<br />
All Years $6.5 4.6 52 1.9<br />
2012 $4.3 1.4 2 0.9<br />
Standard Scope<br />
Transacted Project Types, Validated Projects by Type<br />
Standard Type Co-benefi ts only<br />
2012 (by % Share) (by Count, through 2012)<br />
Asset Generated Certifi cate<br />
4% .08%<br />
Eligible Countries All<br />
9<br />
Verification Required for:<br />
96%<br />
59<br />
43<br />
AFOLU Renewables Methane Gases<br />
Energy Effi ciency & Fuel Switch O<strong>the</strong>r<br />
ANNEXES
88 State of <strong>the</strong> Voluntary Carbon Markets 2013<br />
ANNEXES<br />
A.1.3 Domestic (Country- or Region-Specific) Programs<br />
Carbon Farming Initiative – CFI (2011)<br />
Enabled by <strong>the</strong> Carbon Credits (CFI) Act 2011 and launched in 2011 as a part of <strong>the</strong> Australian Government’s Clean Energy<br />
Future Plan, <strong>the</strong> CFI is <strong>the</strong> fi rst national scheme to regulate <strong>the</strong> creation and trade of carbon offsets from farming, landfi ll, and<br />
forestry. The CFI uses legislation- and methodology-specifi c requirements along with positive and negative lists to determine project<br />
additionality. An independent expert committee, <strong>the</strong> Domestic Offsets Integrity Committee, assesses offset methodologies and<br />
advises <strong>the</strong> Minister for Climate Change and Energy Effi ciency on <strong>the</strong>ir approval. The Clean Energy Regulator is responsible for<br />
operating <strong>the</strong> CFI.<br />
Utilization Average Price Transacted (Mt) # Projects Validated Volume Retired (Mt)<br />
2012 $12.7 4 22 0<br />
Ratios Issued : Transacted Issued : Retired<br />
2012 1 to 10<br />
Standard Scope<br />
None retired<br />
Transacted Project Types, Validated Projects by Type<br />
Standard Type Carbon accounting only<br />
2012 (by % Share) (by Count, through 2012)<br />
Asset Generated Carbon offset<br />
Eligible Countries Australia<br />
Verification Required for:<br />
Projects<br />
Methodologies √<br />
Emissions Reductions √<br />
Co-benefi ts √<br />
MAX. time b/w<br />
verifi cations (years):<br />
6<br />
Japan Verified Emissions Reduction Scheme – J-VER (2008)<br />
Japan’s Ministry of <strong>the</strong> Environment (MOEJ) launched <strong>the</strong> J-VER voluntary offsetting scheme as an effort “by and for Japan,”<br />
with Japan-only internal methodologies (based on ISO-14064), internal registry, and complementary Voluntary Carbon Offsetting<br />
Activities including Japan Carbon Offset Scheme Neutral that toge<strong>the</strong>r comprise a purely domestic scheme. J-VER and J-CDM –<br />
<strong>the</strong> o<strong>the</strong>r part of Japan’s domestic voluntary offset scheme – merged into <strong>the</strong> J-Credit Scheme in 2013.<br />
Utilization Average Price Transacted (Mt) # Projects Validated Volume Retired (Mt)<br />
All Years $96 0.6 242 N/A<br />
2012 $85 0.4 62 N/A<br />
Ratios Issued : Transacted Issued : Retired Issued : Buffer<br />
All Years 1 to 3 N/A<br />
2012 1 to 2 N/A<br />
Standard Scope<br />
Transacted Project Types, Validated Projects by Type<br />
Standard Type Carbon accounting only<br />
2012 (by % Share) (by Count, through 2012)<br />
Asset Generated Carbon offset<br />
Eligible Countries Japan<br />
30<br />
Verification Required for:<br />
Projects<br />
Methodologies<br />
√<br />
√<br />
70<br />
132<br />
7<br />
2 1<br />
Unknown<br />
Emissions Reductions √<br />
Co-benefi ts N/A<br />
MAX. time between<br />
verifi cations (years):<br />
N/A<br />
100%<br />
18<br />
AFOLU Renewables Methane Gases<br />
Energy Effi ciency & Fuel Switch O<strong>the</strong>r<br />
AFOLU Renewables Methane Gases<br />
Energy Effi ciency & Fuel Switch O<strong>the</strong>r<br />
3<br />
1
Korea Verified Emissions Reduction Program – K-VER (2005)<br />
State of <strong>the</strong> Voluntary Carbon Markets 2013 89<br />
Administered by Korea’s Ministry of Trade, Industry & Energy (MOTIE) and Korea Energy Management Corporation (KEMCO),<br />
<strong>the</strong> K-VER program launched in 2005. A government purchase program incentivizes development of projects which can utilize<br />
CDM methodologies or propose <strong>the</strong>ir own approaches based on ISO standards. In 2012, K-VER’s primary verifi er KEMCO earned<br />
accreditation as a VCS validation/verifi cation body.<br />
Utilization Average Price Transacted (Mt) # Projects Validated Volume Retired (Mt)<br />
All Years $4.6 7.6 323 7.6<br />
2012 $11.2 0.1 75 0.1<br />
Ratios Issued : Transacted Issued : Retired<br />
All Years 2 to 1 2 to 1<br />
2012 16.5 to 1 16.5 to 1<br />
Standard Scope<br />
Transacted Project Types, Validated Projects by Type<br />
Standard Type Carbon accounting only<br />
2012 (by % Share) (by Count, 2012 only)<br />
Asset Generated Carbon offset<br />
Eligible Countries Republic of Korea<br />
Projects<br />
Verification Required for:<br />
√<br />
Methodologies √<br />
Emissions Reductions √<br />
Co-benefi ts<br />
MAX. time between<br />
verifi cations (years):<br />
N/A<br />
2<br />
AFOLU Renewables Methane Gases<br />
Energy Effi ciency & Fuel Switch O<strong>the</strong>r<br />
NZ Permanent <strong>Forest</strong> Sink Initiative – PFSI (<strong>Forest</strong>s Act 1949, Part 3B, 2006)<br />
New Zealand’s PFSI offers landowners of permanent forests established after 1 January 1990 <strong>the</strong> opportunity to earn Kyoto<br />
Protocol Assigned Amount Units (AAUs) for <strong>the</strong> carbon sequestered by <strong>the</strong>ir forests since 1 January 2008. Because New Zealand’s<br />
government has opted not to participate in <strong>the</strong> Kyoto Protocol’s second commitment period, domestic emitters will no longer be<br />
able to access Kyoto units starting 2015. The Ministry of Primary Industries has committed to run <strong>the</strong> PFSI independently of Kyoto<br />
and is slated to provide guidance soon on what type of new domestic compliance unit will replace PFSI-generated Kyoto units.<br />
Utilization Average Price Transacted (Mt) # Projects Validated Volume Retired (Mt)<br />
All Years $10.6 1.5 43 0.05<br />
2012 $4.3 0.5 UNKNOWN 0.004<br />
Ratios Issued : Transacted Issued : Retired<br />
All Years 1 to 5 4 to 1<br />
2012 None issued None issued<br />
Standard Scope<br />
Transacted Project Types, Validated Projects by Type<br />
Standard Type Carbon accounting only<br />
2012 (by % Share) (by Count, through 2012)<br />
Asset Generated Allowances (AAUs)<br />
Eligible Countries New Zealand<br />
Projects<br />
Verification Required for:<br />
√<br />
Methodologies √<br />
Emissions Reductions √<br />
Co-benefi ts N/A<br />
MAX. time between<br />
verifi cations (years):<br />
N/A<br />
31%<br />
100%<br />
69%<br />
10<br />
43<br />
65<br />
AFOLU Renewables Methane Gases<br />
Energy Effi ciency & Fuel Switch O<strong>the</strong>r<br />
ANNEXES
90 State of <strong>the</strong> Voluntary Carbon Markets 2013<br />
ANNEXES<br />
Pacific Carbon Standard – PCS (Version 1, 2011)<br />
The Pacifi c Carbon Standard defi nes <strong>the</strong> requirements for developing offsets to be recognized as Pacifi c Carbon Units (PCU). This<br />
standard was developed by Pacifi c Carbon Trust, a British Columbia Crown corporation tasked with sourcing offsets to meet <strong>the</strong><br />
provincial government’s carbon neutrality commitment. Originally exclusively owned and transacted by Pacifi c Carbon Trust, PCUs<br />
are now transacted by o<strong>the</strong>r parties for <strong>the</strong> voluntary market.<br />
Utilization Average Price Transacted (Mt)* # Projects Validated Volume Retired (Mt)<br />
All Years $25 0.1 33 1.1<br />
2012 $25 0.07 6 0.8<br />
Ratios Issued : Transacted Issued : Retired<br />
All Years 8 to 1 1 to 1<br />
2012 9 to 1 4 to 5<br />
Standard Scope<br />
Transacted Project Types, Validated Projects by Type<br />
Standard Type Carbon accounting only<br />
2012 (by % Share) (by Count, 2012 only)<br />
Asset Generated<br />
Eligible Countries<br />
Carbon offset<br />
British Columbia<br />
0.4%<br />
0.04%<br />
12%<br />
3<br />
2<br />
Projects<br />
Verification Required for:<br />
√<br />
4<br />
Methodologies √<br />
18<br />
Emissions Reductions √<br />
87%<br />
6<br />
Co-benefi ts N/A<br />
MAX. time between<br />
verifi cations (years):<br />
N/A<br />
AFOLU Renewables Methane Gases<br />
Energy Effi ciency & Fuel Switch O<strong>the</strong>r<br />
*Transaction volumes here solely capture volumes contracted to voluntary buyers, and hence do not capture <strong>the</strong> Pacifi c Carbon<br />
Standard’s compliance market activities.<br />
Woodland Carbon Code – WCC (Version 1.1, 2012)<br />
Given <strong>the</strong> UK’s lack of domestic incentives for local action on forestry, <strong>the</strong> <strong>Forest</strong>ry Commission created <strong>the</strong> WCC to offset domestic<br />
forestry projects using certifi cates. The WCC uses <strong>the</strong> project-based method to test additionality and requires projects to meet<br />
<strong>the</strong> UK <strong>Forest</strong>ry Standard’s environmental/social criteria. While projects cannot generate offsets due to <strong>the</strong> double-monetization<br />
issue, <strong>the</strong> WCC shares features with international standards like a buffer pool, project-grouping mechanism, and independent<br />
certifi cation. The <strong>Forest</strong>ry Commission oversees <strong>the</strong> development of methodologies. The WCC will go live on Markit in July 2013.<br />
Utilization Average Price Transacted (Mt) # Projects Validated Volume Retired (Mt)<br />
2012 $3.5 0.1 19 N/A<br />
Ratios Issued : Transacted Issued : Retired<br />
2012 N/A N/A<br />
Standard Type<br />
Standard Scope<br />
Carbon accounting + embedded<br />
co-benefi ts<br />
Transacted Project Types,<br />
2012 (by % Share)<br />
Validated Projects by Type<br />
(by Count, through 2012)<br />
Asset Generated Certifi cate<br />
Eligible Countries United Kingdom<br />
Projects<br />
Verification Required for:<br />
√<br />
100% 19<br />
Methodologies √<br />
Emissions Reductions √<br />
Co-benefi ts<br />
MAX. time between<br />
verifi cations (years):<br />
10*<br />
* Verifi cation is required at Year 5, than every 10 years<br />
AFOLU Renewables Methane Gases<br />
Energy Effi ciency & Fuel Switch O<strong>the</strong>r
A.1.4 Standards to Watch<br />
Brasil Mata Viva – Plano de Deselvolvimento<br />
Sustentável Brasil Mata Viva (2011)<br />
Brasil Mata Viva is a payment for environmental<br />
services standard with a forest carbon accounting<br />
component. Through its application, <strong>the</strong> BMV<br />
Methodology aims to generate resources for <strong>the</strong><br />
introduction of new sustainable technologies for land<br />
use and <strong>the</strong> establishment of production units, to<br />
add value to areas’ rural production, re-composition,<br />
and recovery. Under <strong>the</strong> standard, projects generate<br />
Sustainability Credit Units (“UCSVT BMV Certifi cates”)<br />
following certifi cation performed by third-party auditors<br />
like <strong>the</strong> UNESP University, TÜV Rheinland, and public<br />
intstitutions for environmental and social management<br />
like <strong>the</strong> Instituto de Desenvolvimento Econômico<br />
e Socioambiental (IDESA). BMV currently has four<br />
certifi ed nuclei of project activities in Brazil (Xingu,<br />
Arinos, Madeira, and Teles Pires) and ano<strong>the</strong>r nucleus<br />
(Araguaia) in <strong>the</strong> process of validation.<br />
California Air Resources Board Protocols – ARB<br />
Protocols (2011)<br />
The California Air Resources Board (ARB) within<br />
California’s Environmental Protection Agency has<br />
developed a cap-and-trade program under AB32<br />
that draws from existing voluntary carbon market<br />
infrastructure. Approved in 2011, <strong>the</strong> ARB Protocols<br />
were adapted from existing protocols developed by<br />
California’s Climate Action Reserve (CAR). So far, <strong>the</strong>y<br />
consist of four protocols covering livestock manure,<br />
ozone-depleting substances, and urban and o<strong>the</strong>r<br />
forest management. The protocols are outlined in<br />
California’s cap-and-trade regulation and will not be<br />
issued by ARB until <strong>the</strong> program start date. The ARB<br />
recently announced its consideration of protocols<br />
for rice cultivation and coal mine methane capture<br />
projects for future program use.<br />
Global Conservation Standard – GCS<br />
(Version 1.2, 2011) 8<br />
Launched in March 2011, <strong>the</strong> GCS is a not-for-profi t<br />
NGO registered in Offenburg, Germany, designed<br />
to make conservation pay for landowners and local<br />
populations worldwide based on <strong>the</strong> stock volume<br />
of measurable ecosystem service benefi ts through<br />
issuance and sales of Conservation Credit Units<br />
8 http://www.globalconservationstandard.org; http://mgregistry.com<br />
9 http://www.pandastandard.org<br />
10 http://cees.columbia.edu/<strong>the</strong>-rainforest-standard<br />
State of <strong>the</strong> Voluntary Carbon Markets 2013 91<br />
(CCUs). Its fi rst methodology quantifi es CCUs based on<br />
carbon stocks in vegetation. On additionality, <strong>the</strong> GCS<br />
does not issue or generate offsets that compensate<br />
emissions. Thus, additionality as defi ned under ISO<br />
14064-2, <strong>the</strong> Kyoto Protocol, and o<strong>the</strong>r emerging<br />
standards is not applicable to <strong>the</strong> Global Conservation<br />
Standard. Conservation Areas are monetized based<br />
on <strong>the</strong> accounting for <strong>the</strong> existing ecosystem services<br />
and reinvested in sustainable socioeconomic activities<br />
and capacity-building programs within <strong>the</strong> Commercial<br />
Buffer Zone. The GCS encourages <strong>the</strong> use of additional<br />
certifi cation schemes like VCS, FSC, RSPO, or organic<br />
farming in project areas. The standard’s MG Registry<br />
will record CCU issuance, ownership, retirement, and<br />
project details.<br />
Panda Standard (Version 1, 2009) 9<br />
Partners China Beijing Environment Exchange and<br />
BlueNext, with <strong>the</strong> support of Winrock International,<br />
founded <strong>the</strong> Panda Standard as <strong>the</strong> fi rst voluntary<br />
carbon standard designed specifi cally for China<br />
in order to support <strong>the</strong> nascent Chinese carbon<br />
market and encourage investment into <strong>the</strong> domestic<br />
rural economy. Governed by <strong>the</strong> Panda Standard<br />
Association, <strong>the</strong> Panda Standard focuses on promo<br />
ting Agriculture, <strong>Forest</strong>ry, and O<strong>the</strong>r Land-Use<br />
(AFOLU) offset projects with poverty alleviation benefi ts.<br />
The standard determines additionality using both<br />
standardized and project- based methods. Launched<br />
at COP 15 in Copenhagen in December 2009, Panda<br />
Standard Version 1.0 describes <strong>the</strong> core procedures of<br />
its project certifi cation scheme. At <strong>the</strong>16th Conference<br />
of <strong>the</strong> Parties in Cancun in December 2010, BlueNext,<br />
<strong>the</strong> Agence Française de Développement (AFD), and<br />
CBEEX signed a Memorandum of Understanding to<br />
support a 15,000-ha Bamboo plantation as <strong>the</strong> fi rst<br />
pilot project for <strong>the</strong> Panda Standard. A methodology<br />
for <strong>the</strong> revegetation of degraded land was fi nalized<br />
and approved by <strong>the</strong> Technical Committee and led to<br />
<strong>the</strong> registration of <strong>the</strong> Panda Standard’s fi rst project in<br />
2012.<br />
The Rainforest Standard (2012) 10<br />
Launched at Rio+20 on June 28, 2012 by fi ve leading<br />
environmental trust funds based in fi ve Amazon Basin<br />
countries (Bolivia, Brazil, Columbia, Ecuador, and Peru)<br />
and Columbia University’s Center for Environment,<br />
Economy, and Society, The Rainforest Standard (RFS)<br />
is <strong>the</strong> fi rst carbon standard to incorporate biodiversity<br />
ANNEXES
92 State of <strong>the</strong> Voluntary Carbon Markets 2013<br />
ANNEXES<br />
outcomes and socio-cultural/socio-economic impacts<br />
into carbon accounting. In collaboration with environmental<br />
agencies across Latin America, The RFS was<br />
designed specifi cally for REDD to create long-term<br />
economic incentives resulting from <strong>the</strong> sale of forest<br />
carbon offsets. The RFS aims to conserve forests and<br />
biodiversity in tandem with <strong>the</strong> provision of sustainable<br />
benefi ts to forest owners and forest-dwelling people.<br />
Swiss Charter Standard – Swiss Charter<br />
(Climate Protection by Recycling, 2009) 11<br />
Run by SENS International, <strong>the</strong> Swiss Charter was<br />
launched in 2009 to support recycling projects<br />
that reduce ozone-depleting chlorofl uorocarbons<br />
(CFCs) in emerging economies. Its design keeps in<br />
mind VCS/CDM technical requirements, featuring<br />
double validation of new methodologies and a<br />
project development path with methodology and<br />
PDD validation followed by verifi cation. Projects must<br />
trigger at least two impetuses in <strong>the</strong> ecological, social,<br />
economic, and technological fi elds. Additional social<br />
and environmental benefi ts must be demonstrated not<br />
only in a monitoring report, but in separate disclosure<br />
of corporate tax accounting outlining funds spent<br />
on capacity-building and o<strong>the</strong>r relevant activities.<br />
Swiss Charter also requires “natural additionality”:<br />
investment case calculations cannot be used to<br />
support additionality assumptions. Projects underlying<br />
offsets must not be able to yield revenue per se.<br />
Three Rivers Standard – Three Rivers<br />
(Version 0.1, 2011) 12<br />
The Three Rivers Standard is <strong>the</strong> fi rst voluntary standard<br />
based in western China, located in an area that<br />
includes <strong>the</strong> headwaters of <strong>the</strong> Yellow, Yangtze, and<br />
Mekong Rivers. Initiated by <strong>the</strong> Qinghai Environment<br />
and Energy Exchange (QHEX) in collaboration<br />
with o<strong>the</strong>r Chinese and international partners, <strong>the</strong><br />
standard applies to mitigation activities conducted<br />
in China and will cover a range of sectors. Standard<br />
documents were released in 2012 following a public<br />
consultation process based on <strong>the</strong> ISEAL Code of<br />
Good Practice for standard setting and in compliance<br />
with relevant ISO standards. Three Rivers allows<br />
for both project-based, performance-based and/or<br />
technology standard additionality tests. Specifi cations<br />
for agriculture, forestry, grassland, and livestock<br />
projects are under development, with registration of<br />
<strong>the</strong> fi rst project planned by <strong>the</strong> end of 2012. AFOLU<br />
project methodologies that have been approved by<br />
<strong>the</strong> CDM and VCS may be automatically approved<br />
by Three Rivers, but may also be subject to a review<br />
and revision process to account for China-specifi c<br />
conditions. Requirements for social and environmental<br />
impacts of projects are based on national laws and<br />
supplemented by guidance from o<strong>the</strong>r domestic and<br />
international initiatives.<br />
The Women’s Carbon Standard – WCS (2013) 13<br />
Developed by <strong>the</strong> Bangkok-based Women Organizing<br />
for Change in Agriculture and Natural Resource<br />
Management (WOCAN), <strong>the</strong> Women’s Carbon<br />
Standard (WCS) was founded in early 2013 as <strong>the</strong><br />
fi rst co-benefi ts standard focused specifi cally on<br />
integrating and measuring women’s empowerment<br />
and participation in carbon mitigation projects. The<br />
WCS is a set of project design and implementation<br />
requirements that complement existing compliance<br />
or voluntary carbon standards, allowing carbon<br />
project developers to integrate <strong>the</strong> WCS into current<br />
methodologies. The certifi cation will examine six core<br />
elements: assets and income – allowing women to be<br />
empowered by controlling <strong>the</strong>ir own assets — health,<br />
food security, time, and leadership. The project does<br />
not have to meet <strong>the</strong> standard’s requirements on all of<br />
<strong>the</strong> elements, but must receive a score of 51 points<br />
or higher to receive WOCAN’s stamp of approval. To<br />
date, <strong>the</strong> WCS has three pilot technologies underway<br />
with <strong>the</strong> support of <strong>the</strong> Asian Development Bank<br />
in Cambodia (biogas digesters), Laos (improved<br />
cookstoves), and Vietnam (waste management).<br />
A.1.5 O<strong>the</strong>r Programs<br />
Costa Rica C-Neutral Standard – C-Neutral (2012)<br />
Targeting purely domestic users through 2021, Costa<br />
Rica’s new C-Neutral Standard is <strong>the</strong> fi rst measure<br />
launched in a long line of mitigation actions necessary<br />
to meet <strong>the</strong> country’s 2021 deadline for achieving<br />
carbon neutrality. The Standard recognizes VCS,<br />
Gold Standard, and CDM offsets for offsetting, as<br />
well as program-specifi c methodologies that will<br />
generate Costa Rican Carbon Units (UCCs). The<br />
standard uses project-based additionality testing and<br />
covers a variety of project types including forestry<br />
and land use, energy, methane, fuel switching, N O, 2<br />
11 http://www.sens-international.org/fi leadmin/user_upload/sens-international/SENS_International/Downloads/091028_SENS_<br />
Int_Brosch%C3%BCre_E.pdf<br />
12 http://www.threeriversstandard.com/uploads/soft/111115/ThreeRiversStandard.pdf<br />
13 http://www.womenscarbon.org/
and transportation. The program will use an internal,<br />
program-administered registry or external registry<br />
depending on <strong>the</strong> type of offsets transacted. The<br />
standard originated with <strong>the</strong> 2007 National Climate<br />
Change Strategy, which established <strong>the</strong> 2021<br />
carbon neutral goal, a Climate Change Directorate,<br />
and <strong>the</strong> resulting C-Neutral Standard. The program<br />
is administered by <strong>the</strong> Climate Change Directorate<br />
under <strong>the</strong> Ministry of Environment.<br />
ISO-14064-2 (2006) 14<br />
The International Organization for Standardization<br />
launched ISO 14064 in 2006 as a three-part set of<br />
policy-neutral, voluntary GHG accounting standards.<br />
ISO 14064-2 is an offset standard protocol that<br />
provides defi nitions and procedures to account for<br />
GHG reductions, intended for use in conjunction with<br />
an established offset program. ISO 14064-2 is not<br />
prescriptive about elements that apply to <strong>the</strong> policies<br />
of a particular GHG program such as additionality<br />
criteria, project eligibility dates, or co-benefi ts. ISO<br />
14064 is program-neutral and <strong>the</strong> requirements of <strong>the</strong><br />
program under which ISO is used take precedence<br />
to ISO rules. For example, ISO 14064-2 contains no<br />
formal requirements for additionality determination<br />
but offers general guidelines. The guidelines for<br />
additionality tools generally assume a project-specifi c<br />
approach. However, since <strong>the</strong> requirements of a GHG<br />
program take precedence over specifi c ISO 14064-<br />
2 requirements, ISO 14064-2 allows performance<br />
standards to be used, where this is prescribed by<br />
a GHG program. VCS is ISO 14064-compatible, <strong>the</strong><br />
Canadian GHG Offset Protocols will draw from ISO<br />
14064-2, and <strong>the</strong> Climate Action Reserve is adapting<br />
<strong>the</strong>ir quantifi cation protocols to ISO 14064 standards.<br />
Australia’s National Carbon Offset Standard – NCOS<br />
(Version 2, 2012) 15<br />
The NCOS was initiated by government directive,<br />
largely based on ISO 14064, 14040, <strong>the</strong> GHG<br />
Protocol, and Australia’s National Greenhouse and<br />
Energy <strong>Report</strong>ing Act 2007. The NCOS provides<br />
a voluntary standard for organizations to reduce<br />
State of <strong>the</strong> Voluntary Carbon Markets 2013 93<br />
carbon pollution beyond Australia’s national targets<br />
as part of <strong>the</strong> NCOS Carbon Neutral Program, which<br />
certifi es products or business operations as carbon<br />
neutral under <strong>the</strong> NCOS. Administered by Low Carbon<br />
Australia (previously <strong>the</strong> Australian Carbon Trust),<br />
<strong>the</strong> Carbon Neutral Program replaced Greenhouse<br />
Friendly - <strong>the</strong> Australian government’s former voluntary<br />
offset program - in 2010. Organizations can purchase<br />
from a range of eligible offsets, including Australian<br />
Carbon Credit Units (ACCUs) issued under <strong>the</strong><br />
Carbon Farming Initiative, offsets issued under <strong>the</strong><br />
former Greenhouse Friendly, Carbon Units issued<br />
under Australia’s Carbon Price Mechanism (starting<br />
July 2015), international units issued under <strong>the</strong> Kyoto<br />
Protocol, and offsets issued under The Gold Standard,<br />
and VCS. No specifi c project types or technologies<br />
are required beyond meeting independent standard<br />
criteria. However, offsets issued from REDD and<br />
o<strong>the</strong>r AFOLU projects must apply NCOS-approved<br />
methodologies.<br />
International Carbon Reduction and Offset Alliance –<br />
ICROA (Programme and Policy Framework, 2009) 16<br />
Founded in 2008, ICROA is an international nonprofi<br />
t organization made up of <strong>the</strong> leading carbon<br />
reduction and offset providers in <strong>the</strong> voluntary carbon<br />
market. Its members operate across Europe, North<br />
America, and Australia. ICROA is a program of <strong>the</strong><br />
International Emissions Trading Association (IETA) and<br />
has an independent Secretariat and Advisory Board<br />
comprised of experts from <strong>the</strong> voluntary carbon offset<br />
fi eld. The primary aim of ICROA is to promote best<br />
practice in <strong>the</strong> voluntary carbon market. Members<br />
demonstrate quality services through adherence<br />
to a Code of Best Practice. ICROA members sign<br />
up to and publically report against <strong>the</strong> Code, which<br />
provides specifi c requirements for how companies<br />
provide <strong>the</strong>ir carbon foot printing, greenhouse gas<br />
reduction advice, and offset services. Members are<br />
audited against <strong>the</strong> code by third-party independent<br />
verifi ers. ICROA currently allows CDM/JI, The Gold<br />
Standard, Carbon Fix, ACR, VCS, and CAR standards<br />
for its members offset services.<br />
14 http://www.co2offsetresearch.org/policy/ISO14064.html; http://www.scribd.com/doc/55419582/Making-Sense-of-The<br />
15 http://www.climatechange.gov.au/ncos<br />
16 http://www.icroa.org<br />
ANNEXES
94 State of <strong>the</strong> Voluntary Carbon Markets 2013<br />
ANNEXES<br />
Carbon Accounting Standards<br />
American Carbon Registry The Gold Standard<br />
Governed by: Winrock International / ACR Advisory Council Governed by: The Gold Standard Foundation<br />
Affi liated Registry: APX, Inc. Affi liated Registry: Markit Environmental Registry, APX Inc.<br />
Website: www.americancarbonregistry.org Website: http:// www.cdmgoldstandard.org<br />
CarbonFix Standard Plan Vivo Standard<br />
Governed by: CarbonFix e.V., acquired by GS in 2012 Governed by: Plan Vivo Foundation<br />
Affi liated Registry Markit Environmental Registry Affi liated Registry: Markit Environmental Registry<br />
Website: http:// www.carbonfi x.info Website: http:// www.planvivo.org<br />
Chicago Climate Exchange VER+<br />
Governed by: Offsets Committee Governed by: TÜV SÜD Industrie Service GmbH<br />
Affi liated Registry: CCX Affi liated Registry: BlueRegistry<br />
Website: http://www.<strong>the</strong>ice.com/ccx Website: http://www.blue-registry.com<br />
Climate Action Reserve Verifi ed Carbon Standard<br />
Governed by: Climate Action Reserve Governed by: VCS Association<br />
Affi liated Registry: APX Inc. Affi liated Registry: Markit, APX Inc., CDC Climat (until ‘13)<br />
Website: http:// www.climateactionreserve.org Website: http://www.v-c-s.org<br />
Co-Benefi ts Programs<br />
Climate, Community and Biodiversity Standards SOCIALCARBON<br />
Governed by: Climate, Community & Biodiversity Alliance Governed by:<br />
Instituto Ecológica Palmas (Ecologica<br />
Institute)<br />
Affi liated Registry: Markit Environmental Registry, APX Inc. Affi liated Registry: Markit, Social Carbon Registry<br />
Website: http://www.climate-standards.org Website: http://www.socialcarbon.org<br />
Domestic (Country- or Region-Specifi c) Programs<br />
Brasil Mata Viva Carbon Farming Initiative<br />
Governed by:<br />
Working Group FEPAF/UNESP/IMEI/<br />
IDESAM<br />
Governed by: Australia Clean Energy Regulator<br />
Affi liated Registry: BTAAB Registry Affi liated Registry: Internal<br />
Website: http:// brasilmataviva.com.br/index.php Website:<br />
http://www.climatechange.gov.au/<br />
reducing-carbon/carbon-farming-initiative<br />
J-VER K-VER<br />
Governed by: Ministry of Environment of Japan Governed by: Korea Ministry of Knowledge Economy<br />
Affi liated Registry: Internal Affi liated Registry: Internal<br />
Website: http://j-ver.go.jp Website: http://kver.kemco.or.kr<br />
NZ Permanent <strong>Forest</strong> Sink Initiative Pacifi c Carbon Standard<br />
Governed by: NZ Ministry for Primary Industries Governed by: Pacifi c Carbon Trust<br />
Affi liated Registry: NZ Emissions Unit Register<br />
http://www.mpi.govt.nz/forestry/funding-<br />
Affi liated Registry: Markit Environmental Registry<br />
Website:<br />
programmes/permanent-forest-sinkinitiative.aspx<br />
Website: http://www.pacifi ccarbontrust.com<br />
Governed by:<br />
Woodland Carbon Code<br />
UK <strong>Forest</strong>ry Commission<br />
Affi liated Registry: Internal, Markit July 2013+<br />
Table 27: Carbon and Co-benefi ts Programs: Where to Find Them<br />
Website: http://www.forestry.gov.uk/carboncode
Infrastructure<br />
Provider<br />
APX<br />
Australia's<br />
Clean Energy<br />
Regulator<br />
Registry of<br />
Offsets Projects<br />
BlueRegistry<br />
Chicago Climate<br />
Exchange Offset<br />
Registry<br />
CDC Climat<br />
(Caisse des<br />
Dépôts)<br />
GHG<br />
CleanProjects<br />
Registry<br />
Japan Verifi ed<br />
Emission<br />
Reduction<br />
(J-VER) Registry<br />
Korea GHG<br />
Reduction<br />
Registry<br />
Markit<br />
Environmental<br />
Registry<br />
Market<br />
Position<br />
Infrastructure<br />
Internal<br />
Quasiindependent<br />
Internal CCX<br />
Infrastructure<br />
Independent<br />
Internal J-VER<br />
Internal K-VER<br />
Infrastructure/Independent<br />
ANNEX 2: Registries and<br />
Registry Infrastructure Providers<br />
Entities Served<br />
(in case of<br />
Infrastructure<br />
Provider)<br />
VCS, American<br />
Carbon Registry,<br />
Climate Action<br />
Reserve, The Gold<br />
Standard<br />
Carbon Farming<br />
Initiative<br />
VER+ and o<strong>the</strong>rs<br />
Transparency<br />
Project info<br />
public; Account<br />
info public;<br />
Listing eligibility<br />
requirements clear<br />
Most project<br />
info public;<br />
Some account<br />
info public;<br />
Listing eligibility<br />
requirements clear<br />
Project info public;<br />
List of account<br />
holders public;<br />
Listing eligibility<br />
requirements clear<br />
Project info public;<br />
List of account<br />
holders public;<br />
Listing eligibility<br />
requirements clear<br />
Projects<br />
Listed<br />
State of <strong>the</strong> Voluntary Carbon Markets 2013 95<br />
As of 12/31/2012* In 2012 Only<br />
VERs Issued VERs retired<br />
Projects<br />
Listed<br />
VERs<br />
Issued<br />
VERs retired<br />
– 62,647,050 10,961,590 431 34,326,435 6,323,607<br />
22 348,110 –0 22 348,110 0<br />
34 3,811,381 1,026,003 0 0 11,500<br />
343 88,958,500 25,967,528 – 0 1,816,493<br />
VCS No public info 9,944,381 2,030,838 – 1,825,565 289,955<br />
Not applicable<br />
VCS; Carbon Fix;<br />
CCB Standards;<br />
ISO 14064; The<br />
Gold Standard;<br />
Permanent <strong>Forest</strong><br />
Sink Initiative; Plan<br />
Vivo; Social Carbon;<br />
Pacifi c Carbon<br />
Trust, Swiss Charter<br />
Standard, New<br />
Zealand Projects to<br />
Reduce Emissions<br />
(Pre-2008)<br />
Table 28: Registry Infrastructure Providers<br />
Project information<br />
public; List<br />
of account<br />
holders public;<br />
Listing eligibility<br />
requirements clear<br />
No project info<br />
public; Some<br />
account info<br />
public; Listing<br />
eligibility<br />
requirements clear<br />
Project information<br />
public; List<br />
of account<br />
holders public;<br />
Listing eligibility<br />
requirements clear<br />
Most project<br />
info public;<br />
Some account<br />
info public;<br />
Listing eligibility<br />
requirements clear<br />
96 4,985,177 667,498 11 1,977,800 377,258<br />
242 169,118 N/A – 169,000 N/A<br />
– 14,518,306 7,555,827 75 2,396,963 145,072<br />
609 75,183,826 22,630,791 172 25,427,388 11,017,066<br />
*Total refers to <strong>the</strong> entire volume of VERs or projects registered during <strong>the</strong> lifetime of <strong>the</strong> registry as of December 2012, except where o<strong>the</strong>rwise noted.<br />
ANNEXES
96 State of <strong>the</strong> Voluntary Carbon Markets 2013<br />
ANNEXES<br />
ANNEX 3: Offset Supplier Directory<br />
Offset Supplier Web address<br />
Ag Methane Advisors, LLC www.agmethaneadvisors.com<br />
AGT advancedgobaltrading.com<br />
ALLCOT Group www.allcot.com<br />
AMBIO S.C. de R.L.<br />
www.<strong>the</strong>redddesk.org/countries/mexico/info/<br />
resources/organisations/cooperativa_ambio_sc_de_rl<br />
Amerex Energy www.amerexenergy.com<br />
Anthrotect www.anthrotect.com<br />
Armajaro www.armajaro.com<br />
Atlântica Simbios C. S. A. Ltda.<br />
www.forestcarbonportal.com/project/carbon-fi x-terraboa<br />
Australian Carbon Traders www.australiancarbontraders.com<br />
Bio Assets Ativos Ambientais Ltda. www.bioassets.com.br<br />
BioCarbon www.biocarbongroup.com<br />
BioCarbon Partners www.biocarbonpartners.com<br />
Biofi lica www.biofi lica.com.br<br />
Bischoff & Ditze Energy GmbH www.bd-energy.com<br />
Blue Source, LLC www.bluesource.com<br />
Blue Ventures Conservation www.blueventures.org<br />
Bonneville Environmental Foundation www.b-e-f.org<br />
Bosques Amazónicos www.bosques-amazonicos.com<br />
BP Target Neutral www.bptargetneutral.com<br />
Brighter Planet www.brighterplanet.com<br />
Brinkman & Associates Reforestation www.brinkmanforest.ca<br />
Brokers Carbon www.brokerscarbon.com<br />
C&D Consultores www.cydconsultores.cl<br />
C2Invest www.c2invest.net<br />
Camco Clean Energy www.camcocleanenergy.com<br />
Canopy www.canopy.org.au<br />
Carbon Clear Limited www.carbon-clear.com<br />
Carbon Neutral (AU) www.carbonneutral.com.au<br />
Carboneutral www.carboneutral.cl<br />
Carbonfund.org Foundation, Inc. www.carbonfund.org<br />
CarbonSinkGroup www.carbonsink.it<br />
CARBONyatra www.carbonyatra.com<br />
Carbosur www.carbosur.com.uy<br />
Cassinia Environmental www.cassinia.com<br />
CECEP Wind-Power Corporation www.cecwpc.cn<br />
CERPD www.cerpd.com
CF Partners www.cf-partners.com<br />
Clean Air Action Corp www.cleanairaction.com<br />
ClearSky Climate Solutions www.clearskyclimatesolutions.com<br />
Climate Bridge www.climatebridge.com<br />
Climate Clean www.climateclean.net<br />
Climate Friendly Pty Ltd www.climatefriendly.com<br />
Climate Neutral Group www.climateneutralgroup.com<br />
ClimateCare www.climatecare.org<br />
ClimatePartner GmbH www.climatepartner.com<br />
ClimeCo Corporation www.climeco.com<br />
CLP Wind Farms (India) Private Limited www.clpindia.in<br />
C-O2 Consultants www.c-o2.org<br />
co2balance UK Ltd www.co2balance.com<br />
CO2logic www.co2logic.com<br />
Conservation Carbon Company(Pvt) Ltd www.conservecarbon.org<br />
Conservation International www.conservation.org<br />
Cool Planet Energy Pty Ltd www.coolplanet.com.au<br />
CoolClimate Holding, Inc. www.atmosclear.org<br />
Credible Carbon www.crediblecarbon.com<br />
E+Carbon www.persistentenergypartners.com<br />
Easy-Carbon Consultancy Co.Ltd. www.easy-carbon.com/english/<br />
Eco2librium www.eco2librium.net<br />
EcoAct www.eco-act.com<br />
Ecoinvest SA www.ecoinvestservices.com<br />
EcoPlanet Bamboo www.ecoplanetbamboo.com<br />
Ecoprogresso www.ecoprogresso.pt<br />
ecosur america www.ecosur-america.com<br />
Ecosystem Services LLC www.ecosystemservicesllc.com<br />
ECOTRUST www.ecotrust.or.ug<br />
egluro limited www.egluro.com<br />
EKO Asset Management Partners www.ekoamp.com<br />
Emergent Ventures International www.emergent-ventures.com<br />
Emission Reduction Company www.emissionreductionco.com<br />
Eneco www.eneco2.com<br />
EnergetixClimate/HELPS www.helpsintl.org<br />
Energy Mad Ltd www.energymad.com/nz/<br />
Entergy www.entergy.com<br />
Environmental Capital LLC www.encapllc.com<br />
Environmental Credit Corp. www.envcc.com<br />
EOS Climate, Inc. www.eosclimate.com<br />
ERA Carbon Offsets Ltd www.offsetters.ca<br />
Evolution Markets www.evomarkets.com<br />
Face <strong>the</strong> Future www.face-<strong>the</strong>future.com<br />
State of <strong>the</strong> Voluntary Carbon Markets 2013 97<br />
ANNEXES
98 State of <strong>the</strong> Voluntary Carbon Markets 2013<br />
ANNEXES<br />
Fair Recycling Foundation (previously: SENS<br />
Internation<br />
www.fair-recycling.com<br />
FairClimateFund BV www.fairclimatefund.nl<br />
Finite Carbon www.fi nitecarbon.com<br />
Floresta www.fl oresta.com<br />
<strong>Forest</strong> Carbon Ltd www.forestcarbon.co.uk<br />
<strong>Forest</strong> Carbon Offsets LLC www.forestcarbonoffsets.net<br />
<strong>Forest</strong> Finance Service GmbH www.co2ol.de<br />
<strong>Forest</strong>s Alive www.forestsalive.com<br />
Foundation myclimate - The Climate Protection<br />
Partnership<br />
www.myclimate.org<br />
Fundación Moisés Bertoni www.mbertoni.org.py/v1/<br />
FutureCamp Climate GmbH www.future-camp.de<br />
General Carbon www.general-carbon.com<br />
GERES www.co2solidaire.org<br />
GFA Consulting Group www.gfa-group.de<br />
Green Energy Corporation Ltd www.greenenergy.hpage.co.in<br />
GREEN EVOLUTION SA www.green-evolution.eu<br />
Green Mountain Energy Company www.greenmountain.com<br />
Green Resources www.greenresources.no<br />
Greenfl eet www.greenfl eet.com.au<br />
Greenoxx NGO www.greenoxx.com<br />
Greenwood Trading AG www.greenwood-trading.com<br />
Grupo Ecológico Sierra Gorda I.A.P. www.sierragorda.net<br />
GTE CARBON www.gte.uk.com<br />
Guizhou Honor Carbon Asset Management Co www.hy-carbon.net<br />
Hivos Foundation www.hivos.org<br />
IdleAir, LLC www.idleair.com<br />
IFS Growth www.ifsgrowth.co.nz<br />
Impact Carbon www.impactcarbon.org<br />
Improved Cook Stoves for East Africa Limited www.ugandacarbon.org<br />
Initiative Développement (ID) www.id-ong.org<br />
Instituto Ação Verde<br />
www.acaoverde.org.br/v2/mostra_projeto.<br />
php?projeto=2<br />
Instituto Perene www.perene.org.br<br />
Iowa Farm Bureau www.iowafarmbureau.com<br />
Karbone www.karbone.com<br />
KDF Energy www.kdfenergy.com<br />
Korea Energy Management Corporation www.kemco.or.kr<br />
Lavola 1981, SA www.lavola.com<br />
Lee International www.go-worldlee.com<br />
Less Emissions Inc. www.less.ca<br />
Livelihoods Venture www.livelihoods.eu<br />
Logicor (Group) ltd www.logicor.co.uk
Love <strong>the</strong> World www.love<strong>the</strong>world.com<br />
Mavi Consultants www.maviconsultants.com<br />
Microsol en.microsol-int.com<br />
Mikro-Tek www.mikro-tek.com<br />
State of <strong>the</strong> Voluntary Carbon Markets 2013 99<br />
Mountain Association for Community Economic<br />
Development<br />
www.maced.org<br />
Mozambique Carbon Intiatives LDA www.mozcarbon.co.mz<br />
Mpingo Conservation & Development Initiative www.mpingoconservation.org<br />
Nationaal Groenfonds www.nationaalgroenfonds.nl<br />
NativeEnergy, Inc. www.nativeenergy.com<br />
Nature Services Peru www.natureservicesperu.com<br />
Nedbank Capital www.capital.nedbank.co.za/capital/home<br />
Neutralize Carbono www.neutralizecarbono.com.br<br />
New <strong>Forest</strong>s www.newforests.com.au<br />
Nexus-Carbon for Development www.nexus-c4d.org<br />
Nollen Group www.nollengroup.com<br />
Nova Institute www.nova.rg.za<br />
Oaxaca Environmental Services (SAO)<br />
Origins Carbon<br />
www.sao.org.mx<br />
Pacifi c Carbon Trust www.pacifi ccarbontrust.com<br />
Pacifi c <strong>Forest</strong> Alliance www.pacifi cforestalliance.org<br />
Pacifi c <strong>Forest</strong> Trust https://pacifi cforest.org<br />
Pangolin Associates www.pangolinassociates.com<br />
Permanent <strong>Forest</strong>s International Limited www.permanentforests.com<br />
PrimaKlima -weltweit- e.V. www.prima-klima-weltweit.de<br />
Pro-Climate www.proclimate.org<br />
Proyecto Mirador www.proyectomirador.org<br />
Recast Energy www.recastenergy.com<br />
SCS Global Services www.scsglobalservices.com<br />
Sindicatum Sustainable Resources<br />
Socio-eCO2nomix-Global<br />
www.sindicatum.com<br />
South Pole Carbon Asset Management Ltd. www.southpolecarbon.com<br />
SPVS www.spvs.org.br<br />
Strategic HSE Systems INC www.strategichsesystems.com<br />
Sustainable Capital Group Panama www.scgpanama.com<br />
Sustainable Carbon www.sustainablecarbon.com<br />
Swire Pacifi c Offshore www.swire.com.sg<br />
Taking Root www.takingroot.org<br />
TerraPass www.terrapass.com<br />
Terraprima www.terraprima.pt<br />
The CarbonNeutral Company www.carbonneutral.com<br />
The Climate Trust www.climatetrust.org<br />
The Cochabamba Project www.cochabamba.coop<br />
ANNEXES
100 State of <strong>the</strong> Voluntary Carbon Markets 2013<br />
ANNEXES<br />
The Conservation Fund www.conservationfund.org<br />
The Nature Conservancy www.nature.org<br />
The Paradigm Project www.<strong>the</strong>paradigmproject.org<br />
The Pure Project www.purprojet.com<br />
The Trend is Blue Ltd www.<strong>the</strong>trendisblue.com<br />
The Trust for Public Land www.tpl.org<br />
Tianjin Climate Exchange www.chinatcx.com<br />
TLR Energy Inc www.tlrenergy.com<br />
UNIQUE forestry and land use www.unique-forst.de<br />
Unisfera / Planetair www.planetair.ca<br />
UpEnergy www.upenergygroup.com<br />
Verus Carbon Neutral www.verus-co2.com<br />
Vestergaard Frandsen www.carbonforwater.com<br />
WeAct Pty. Ltd. www.weact.com.au<br />
Wildlife Works www.wildlifeworks.com<br />
Wind to Market SA www.w2m.es<br />
World Land Trust www.worldlandtrust.org<br />
World Wide Carbon LLC www.worldwidecarbonllc.com<br />
Yesilfi kir www.yesilfi kir.com<br />
Yorkshire Dales Millennium Trust www.ydmt.org
timber of <strong>the</strong> 21st century<br />
Sponsors and Supporters<br />
Premium Sponsor<br />
Sponsors<br />
Supporters<br />
State of <strong>the</strong> Voluntary Carbon Markets 2013 101<br />
Sponsors and Supporters
102 State of <strong>the</strong> Voluntary Carbon Markets 2013<br />
Sponsors and Supporters<br />
Premium Sponsor<br />
SCX | Santiago Climate Exchange (www.scx.cl) aims to redefi ne climate<br />
change mitigation and adaptation as a source of corporate competitiveness<br />
and social and environmental inclusiveness.<br />
SCX offers prime CO 2 Neutral certifi cation for products & services differentiation<br />
and works with organizations looking to link <strong>the</strong>ir climate engagement with<br />
<strong>the</strong>ir core business – not relying solely on CSR policies. SCX specialists have<br />
been active players in country discussions regarding baseline scenarios for<br />
climate change, cap-and-trade options, green taxes, and market instruments<br />
for environmental regulation.<br />
SCX was founded by ten leading corporate players in Chile, with <strong>the</strong> aim to<br />
develop new business models that foster green investment and sustainability<br />
practices in <strong>the</strong> country and <strong>the</strong> rest of <strong>the</strong> Latin American region. Today,<br />
SCX is an active catalyst for innovations that change <strong>the</strong> paradigm of<br />
climate change as a source of costs into a more proactive one where public<br />
awareness is translated into opportunities for local development. Thus, SCX<br />
seeks to become <strong>the</strong> Latin American hub for ecosystem market building<br />
ra<strong>the</strong>r than a platform limited to traditional exchange.
Sponsors<br />
State of <strong>the</strong> Voluntary Carbon Markets 2013 103<br />
Baker & McKenzie (www.bakermckenzie.com) was <strong>the</strong> fi rst law fi rm to<br />
recognize <strong>the</strong> importance of global efforts to address climate change and<br />
<strong>the</strong> importance of such legal developments to our clients. Our dedicated<br />
team has worked on numerous pioneering deals, including writing <strong>the</strong> fi rst<br />
carbon contracts, setting up <strong>the</strong> fi rst carbon funds and advising on <strong>the</strong> fi rst<br />
structured carbon derivative transactions.<br />
Our team has worked extensively in <strong>the</strong> voluntary carbon market over <strong>the</strong> past<br />
fi fteen years, beginning with early forestry transactions between Australia<br />
and Japan in <strong>the</strong> late 1990s. Our team is involved in <strong>the</strong> development of<br />
market standards and infrastructure and has represented clients on many<br />
early voluntary market transactions and deals under <strong>the</strong> Voluntary Carbon<br />
Standard, including a number of REDD transactions. We have worked closely<br />
with marketmakers such as Markit and <strong>the</strong> Voluntary Carbon Standard.<br />
ClimateCare (www.climatecare.org) mobilises <strong>the</strong> power and scale of private<br />
fi nance to deliver projects with positive environmental and social impacts<br />
around <strong>the</strong> world.<br />
We combine <strong>the</strong> vision of a social enterprise and <strong>the</strong> commercial experience<br />
of an investment bank. Leveraging mainstream funding, we profi tably deliver<br />
some of <strong>the</strong> largest, most successful corporate sustainability initiatives in <strong>the</strong><br />
world.<br />
From offi ces in Africa, Europe and Asia Pacifi c we help many of <strong>the</strong> world’s<br />
leading brands, organisations and governments scale up <strong>the</strong> impact of <strong>the</strong>ir<br />
initiatives. By investing <strong>the</strong>ir resources in projects that directly combat climate<br />
change and poverty, improve health and increase community welfare, we<br />
build better futures for millions of people around <strong>the</strong> world.<br />
Ecoinvest (www.ecoinvestservices.com) is a leading VER and CER offset<br />
wholesaler and has been a pioneer in <strong>the</strong> emissions reduction advisory<br />
business since 1999. We hold a large portfolio of innovative and attractive<br />
projects from a range of methodologies and standards including forestry,<br />
renewable energy, cookstoves and agriculture in underdeveloped countries<br />
around <strong>the</strong> world, all with strong community benefi ts. We have advised over<br />
100 projects spanning diverse sectors and can offer bespoke offsetting and<br />
insetting opportunities that are closely aligned to your business.We also offer<br />
a range of services related to Carbon & Water Footprinting, Supply Chain<br />
Management and Consultancy to help companies measure and report <strong>the</strong>ir<br />
carbon, water and energy usage which improves effi ciency, complies with<br />
regulation and saves money.<br />
Sponsors and Supporters
104 State of <strong>the</strong> Voluntary Carbon Markets 2013<br />
Sponsors and Supporters<br />
timber of <strong>the</strong> 21st century<br />
EcoPlanet Bamboo (http://www.ecoplanetbamboo.com) is a global<br />
developer of commercial bamboo plantations. We believe that sustainably<br />
produced bamboo can replace increasingly endangered tropical timber for<br />
all engineered wood products and biomass resources. EcoPlanet Bamboo’s<br />
mission is to grow a global resource base that can contribute to making<br />
bamboo <strong>the</strong> timber of <strong>the</strong> 21st century.<br />
EcoPlanet Bamboo conserves and, where possible, expands natural forest<br />
within its areas of operation. Our Nicaragua plantations are certifi ed under <strong>the</strong><br />
FSC’s <strong>Forest</strong> Management category. We work closely with local communities to<br />
maintain a strong focus on sustainable environmental and social development,<br />
and to adhere to high standards of corporate social responsibility. EcoPlanet<br />
Bamboo’s fi rst two bamboo plantations have been validated by <strong>the</strong> VCS, not<br />
only sequestering atmospheric carbon dioxide but also reducing emissions<br />
from deforestation through <strong>the</strong> provision of a sustainable alternative fi ber to<br />
<strong>the</strong> harvesting of natural forest. EcoPlanet Bamboo’s VCS validation goes<br />
hand in hand with Gold Level CCBA certifi cation for high biodiversity impacts<br />
and positive social impact, including <strong>the</strong> creation of 350 jobs in communities<br />
that were previously suffering from severe poverty.<br />
The <strong>Forest</strong> Carbon Group AG (FCG) (www.forestcarbongroup.de)<br />
Sustainability has nothing to do with charity. It is an integral part of<br />
entrepreneurship. It is about gradually incorporating ecological assets into<br />
<strong>the</strong> corporate balance sheets. We have to set a price for nature in order to<br />
preserve it and continue to be able to use it economically. For this reason,<br />
<strong>Forest</strong> Carbon Group AG initiates, fi nances, develops and markets forest<br />
projects throughout <strong>the</strong> world. Intact forests are protected, degraded forests<br />
are reforested and o<strong>the</strong>rs are sustainably managed. Our business model<br />
enables people in <strong>the</strong> poorest regions of <strong>the</strong> world to break <strong>the</strong> vicious cycle<br />
of deforestation, environmental degradation and poverty, and improve <strong>the</strong>ir<br />
economical as well as social conditions. We also support organisations in<br />
North America and Europe to fund nature conservation. At <strong>the</strong> same time<br />
we enable companies mostly in industrial countries to position <strong>the</strong>mselves<br />
strategically through investing in <strong>the</strong>se projects, to develop new business<br />
opportunities and to secure existing ones. The company is headquartered in<br />
Frankfurt am Main, Germany.<br />
The Global Alliance for Clean Cookstoves (www.cleancookstoves.org) is<br />
a public-private partnership led by <strong>the</strong> United Nations Foundation to save<br />
lives, improve livelihoods, empower women, and protect <strong>the</strong> environment by<br />
creating a thriving global market for clean and effi cient household cooking<br />
solutions. The Alliance’s 100 by ‘20 goal calls for 100 million households<br />
to adopt clean and effi cient cookstoves and fuels by 2020. The Alliance<br />
works with hundreds of partners worldwide to help overcome <strong>the</strong> market<br />
barriers that currently impede <strong>the</strong> production, deployment, and use of clean<br />
cookstoves and fuels in developing countries. The Alliance and its partners<br />
are engaged in a number of activities to achieve our 100 by ‘20 goal: setting<br />
standards; commissioning research; implementing monitoring and evaluation<br />
mechanisms; injecting investor and donor funds into <strong>the</strong> sector to support<br />
entrepreneurship and innovation; and raising awareness about household air<br />
pollution.
State of <strong>the</strong> Voluntary Carbon Markets 2013 105<br />
Love <strong>the</strong> World (www.love<strong>the</strong>world.com) is a leader in environmental advisory<br />
services and is particularly active in supporting enterprises in developing<br />
<strong>the</strong>ir carbon strategy. Our main expertise is to assist our clients in measuring,<br />
reducing and off-setting carbon footprints generated by activities, products<br />
and events.<br />
We are a team of environmental professionals always seeking innovative ways<br />
to create value whilst contributing to <strong>the</strong> fi ght against global warming. We<br />
also assist enterprises in creating <strong>the</strong> most appropriate communication tools<br />
in order to share <strong>the</strong>ir environmental commitments with clients, employees<br />
and business partners.<br />
Last but not least, part of our revenue is going into <strong>the</strong> “Love <strong>the</strong> World<br />
endowment fund”, whose role is to fi nance non-profi t organizations in line<br />
with our clients’ values and objectives (social, medical, environmental, etc…).<br />
Sponsors and Supporters
The Family of<br />
<strong>Forest</strong> <strong>Trends</strong> Initiatives<br />
The Family of<br />
<strong>Forest</strong> <strong>Trends</strong> Initiatives<br />
Using innovative financing to promote <strong>the</strong><br />
conservation of coastal and marine ecosystem services<br />
Using innovative The financing Family to of promote <strong>the</strong><br />
A The global Family platform<br />
<strong>Forest</strong> of <strong>Forest</strong> for transparent<br />
conservation of coastal <strong>Trends</strong> and marine <strong>Trends</strong> Initiatives ecosystem Initiatives information<br />
services<br />
on ecosystem service payments and markets<br />
Using innovative The Family financing of to promote <strong>the</strong><br />
conservation <strong>Forest</strong> of coastal and marine ecosystem services<br />
<strong>Forest</strong><br />
<strong>Trends</strong><br />
Trade<br />
Initiatives<br />
& Finance<br />
A global platform for transparent information<br />
Bringing sustainability to trade and financial<br />
investments<br />
on ecosystem<br />
in <strong>the</strong><br />
service<br />
global<br />
payments<br />
market for<br />
and<br />
forest<br />
markets<br />
products<br />
A global platform for transparent information<br />
on ecosystem Using innovative service financing payments to promote and markets <strong>the</strong><br />
conservation of coastal and marine ecosystem services<br />
Water Initiative<br />
<strong>Forest</strong> Trade & Finance<br />
A global platform for transparent information<br />
Protecting on ecosystem watershed service services payments through and markets and<br />
Using innovative financing to promote <strong>the</strong><br />
incentives conservation A that global complement of platform coastal and for conventional transparent marine ecosystem information management<br />
services<br />
on ecosystem service payments and markets<br />
Bringing sustainability to trade and financial<br />
investments in <strong>the</strong> global market for forest products<br />
<strong>Forest</strong> Trade & Finance<br />
Building capacity for local <strong>Forest</strong> communities Trade & Finance and governments<br />
Bringing sustainability to trade and and financial<br />
to engage A global financial<br />
Bringing in platform emerging for transparent<br />
sustainability environmental information<br />
to trade and financial markets<br />
investments<br />
investments on ecosystem in<br />
in<br />
<strong>the</strong><br />
<strong>the</strong><br />
global service payments market for and for<br />
forest markets forest<br />
products<br />
products<br />
investments in <strong>the</strong> global market for forest products<br />
<strong>Forest</strong> Trade & Finance<br />
Building Business capacity and Biodiversity for local communities Offsets Program, and governments<br />
developing,<br />
testing and supporting best practice in biodiversity offsets<br />
Business Bringing and Biodiversity sustainability Offsets to trade Program, and financial developing,<br />
testing<br />
investments<br />
to engage and supporting<br />
in <strong>the</strong> global<br />
Building capacity in emerging best practice<br />
market for forest products<br />
for local communities environmental in biodiversity<br />
and governments markets offsets<br />
to engage in emerging environmental markets<br />
Building capacity for local communities and governments<br />
to engage in emerging environmental markets<br />
Building Building Business capacity and for Biodiversity for local communities Offsets Program, and and governments<br />
developing, governments<br />
to testing engage to engage and in supporting in emerging best environmental practice in biodiversity markets offsets<br />
Building Business a and market-based Biodiversity program Offsets to Program, address developing,<br />
water-quality<br />
testing (nitrogen) and supporting problems in best <strong>the</strong> practice Chesapeake in biodiversity Bay and beyond offsets<br />
Business and Biodiversity Offsets Program, developing,<br />
testing and supporting best practice in biodiversity offsets<br />
Communities and Markets<br />
The Family of<br />
Building a market-based program to address water-quality<br />
Supporting Business local<br />
(nitrogen)<br />
and<br />
problems<br />
Biodiversity communities<br />
in <strong>the</strong><br />
Offsets to make<br />
Chesapeake<br />
Program, informed<br />
Bay<br />
developing, decisions<br />
and beyond<br />
regarding testing and <strong>the</strong>ir supporting best practice in biodiversity offsets<br />
<strong>Forest</strong> participation Incubator<br />
<strong>Trends</strong> in Initiatives<br />
environmental markets,<br />
streng<strong>the</strong>ning <strong>the</strong>ir territorial rights<br />
Building a market-based program to address water-quality<br />
Linking local producers and communities<br />
(nitrogen) problems in <strong>the</strong> Chesapeake Bay and beyond<br />
to ecosystem service markets<br />
Incubator<br />
Building Building a market-based a market-based Linking local program producers program to and to address communities address water-quality water-quality<br />
(nitrogen) (nitrogen) problems to in ecosystem in <strong>the</strong> <strong>the</strong> Chesapeake Chesapeake service markets Bay Bay and beyond<br />
Learn more about our programs at and beyond<br />
www.forest-trends.org<br />
Incubator<br />
Learn more about our programs at<br />
Using innovative financing<br />
www.forest-trends.org<br />
financing to to promote <strong>the</strong> <strong>the</strong><br />
conservation Linking of local coastal of coastal producers and and marine and ecosystem communities<br />
Incubator ecosystem services<br />
to ecosystem service markets<br />
Linking local Incubator<br />
producers and communities<br />
to ecosystem service markets<br />
Linking Public-Private local producers Co-Finance and Initiative communities<br />
Creating Learn innovative, more about our programs at<br />
A global to ecosystem integrated,<br />
platform for service and<br />
transparent markets efficient financing<br />
Learn more about our programs at information<br />
to support<br />
on www.forest-trends.org<br />
<strong>the</strong> transition to low emissions and zero<br />
ecosystem www.forest-trends.org<br />
service payments and markets<br />
deforestation land use<br />
Learn more about our programs at<br />
www.forest-trends.org<br />
<strong>Forest</strong> Trade & Finance<br />
Learn more about our programs at www.forest-trends.org<br />
Bringing sustainability to trade and financial<br />
investments in <strong>the</strong> global market for forest products