Self-ordering of Au(111) vicinal surfaces and application to ...
Self-ordering of Au(111) vicinal surfaces and application to ...
Self-ordering of Au(111) vicinal surfaces and application to ...

Create successful ePaper yourself
Turn your PDF publications into a flip-book with our unique Google optimized e-Paper software.
INSTITUTE OF PHYSICS PUBLISHING JOURNAL OF PHYSICS: CONDENSED MATTER<br />
J. Phys.: Condens. Matter 15 (2003) S3363–S3392 PII: S0953-8984(03)70844-3<br />
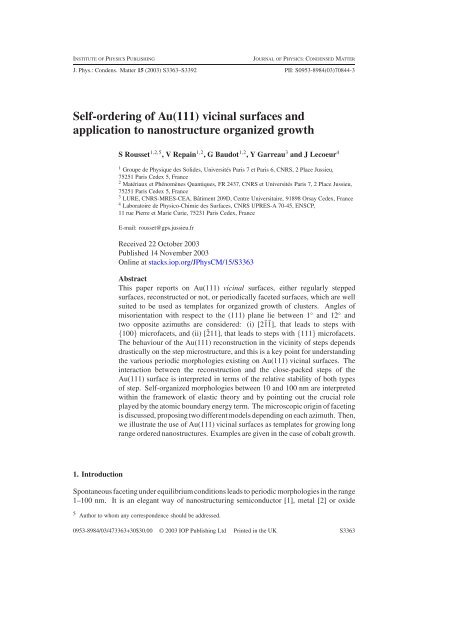
<strong>Self</strong>-<strong>ordering</strong> <strong>of</strong> <strong>Au</strong>(<strong>111</strong>) <strong>vicinal</strong> <strong>surfaces</strong> <strong>and</strong><br />
<strong>application</strong> <strong>to</strong> nanostructure organized growth<br />
1. Introduction<br />
SRousset 1,2,5 ,VRepain 1,2 ,GBaudot 1,2 ,YGarreau 3 <strong>and</strong> J Lecoeur 4<br />
1 Groupe de Physique des Solides, Universités Paris 7 et Paris 6, CNRS, 2 Place Jussieu,<br />
75251 Paris Cedex 5, France<br />
2 Matériaux et Phénomènes Quantiques, FR 2437, CNRS et Universités Paris 7, 2 Place Jussieu,<br />
75251 Paris Cedex 5, France<br />
3 LURE, CNRS-MRES-CEA, Bâtiment 209D, Centre Universitaire, 91898 Orsay Cedex, France<br />
4 Labora<strong>to</strong>ire de Physico-Chimie des Surfaces, CNRS UPRES-A 70-45, ENSCP,<br />
11 rue Pierre et Marie Curie, 75231 Paris Cedex, France<br />
E-mail: rousset@gps.jussieu.fr<br />
Received 22 Oc<strong>to</strong>ber 2003<br />
Published 14 November 2003<br />
Onlineat stacks.iop.org/JPhysCM/15/S3363<br />
Abstract<br />
This paper reports on <strong>Au</strong>(<strong>111</strong>) <strong>vicinal</strong> <strong>surfaces</strong>, either regularly stepped<br />
<strong>surfaces</strong>, reconstructed or not, or periodically faceted <strong>surfaces</strong>, which are well<br />
suited <strong>to</strong> beusedastemplates for organized growth <strong>of</strong> clusters. Angles <strong>of</strong><br />
misorientation with respect <strong>to</strong> the (<strong>111</strong>) plane lie between 1 ◦ <strong>and</strong> 12 ◦ <strong>and</strong><br />
two opposite azimuths are considered: (i) [2¯1¯1], that leads <strong>to</strong> steps with<br />
{100} micr<strong>of</strong>acets, <strong>and</strong> (ii) [¯211], that leads <strong>to</strong> steps with {<strong>111</strong>} micr<strong>of</strong>acets.<br />
The behaviour <strong>of</strong> the <strong>Au</strong>(<strong>111</strong>) reconstruction in the vicinity <strong>of</strong> steps depends<br />
drastically on the step microstructure, <strong>and</strong> this is a key point for underst<strong>and</strong>ing<br />
the various periodic morphologies existing on <strong>Au</strong>(<strong>111</strong>) <strong>vicinal</strong> <strong>surfaces</strong>. The<br />
interaction between the reconstruction <strong>and</strong> the close-packed steps <strong>of</strong> the<br />
<strong>Au</strong>(<strong>111</strong>) surface is interpreted in terms <strong>of</strong> the relative stability <strong>of</strong> both types<br />
<strong>of</strong> step. <strong>Self</strong>-organized morphologies between 10 <strong>and</strong> 100 nm are interpreted<br />
within the framework <strong>of</strong> elastic theory <strong>and</strong> by pointing out the crucial role<br />
played by the a<strong>to</strong>mic boundary energy term. The microscopic origin <strong>of</strong> faceting<br />
is discussed, proposing two differentmodels depending on each azimuth. Then,<br />
we illustrate the use <strong>of</strong> <strong>Au</strong>(<strong>111</strong>) <strong>vicinal</strong> <strong>surfaces</strong> as templates for growing long<br />
range ordered nanostructures. Examples are given in the case <strong>of</strong> cobalt growth.<br />
Spontaneous faceting under equilibrium conditions leads <strong>to</strong> periodic morphologies in the range<br />
1–100 nm. It is an elegant way <strong>of</strong> nanostructuring semiconduc<strong>to</strong>r [1], metal [2] or oxide<br />
5 <strong>Au</strong>thor <strong>to</strong> whom any correspondence should be addressed.<br />
0953-8984/03/473363+30$30.00 © 2003 IOP Publishing Ltd Printed in the UK S3363
S3364 SRousset et al<br />
<strong>surfaces</strong>. The faceting phenomenon in which the surface morphology rearranges in<strong>to</strong> a hill<strong>and</strong>-valley<br />
structure has been known since the turn <strong>of</strong> the century, as morphology changes were<br />
observed on macroscopic metal catalysts by optical methods [3–7]. Then, micron-sized facets<br />
were observed by electron microscopy, for example on copper crystal <strong>surfaces</strong> under oxygen<br />
absorption [6]. Theoretical work identified the faceting origin early as due <strong>to</strong> the surface free<br />
energy anisotropy <strong>and</strong> a link with the equilibrium shape <strong>of</strong> crystallites was established [8, 9].<br />
From a phase transition point <strong>of</strong> view, the analogy between the break-up <strong>of</strong> a surface in<strong>to</strong> a hill<strong>and</strong>-valley<br />
morphology <strong>and</strong> the phase separation <strong>of</strong> a binary solution is now well established.<br />
In the case <strong>of</strong> faceting, the surface orientation, or the step density, plays the same role as does<br />
the concentration in describing the binary fluid phase separation, <strong>and</strong> a number <strong>of</strong> orientational<br />
phase diagrams have been successfully proposed for <strong>vicinal</strong>s <strong>of</strong> <strong>Au</strong>(100) [10], Pt(100) [11]<br />
<strong>and</strong> Si(113) [12, 13].<br />
Since the step density is the order parameter <strong>to</strong> describe the faceting <strong>of</strong> clean <strong>surfaces</strong>, the<br />
surface free energy can be written as a general development versus the step density. If θ is the<br />
<strong>vicinal</strong> angle, i.e. the angle <strong>of</strong> misorientationwith respect <strong>to</strong> the close packed surface defined<br />
by θ = 0, L the terrace width <strong>and</strong> h the step height, tan θ = h/L is proportional <strong>to</strong> the step<br />
density. Thus the surface free energy projected on the reference plane θ = 0 can be written as<br />
γ(θ)= γ0 + β<br />
(1)<br />
h | tan θ| + δ| tan θ|2 + g| tan θ| 3<br />
where some <strong>of</strong> these terms are clearly unders<strong>to</strong>od [14]. γ0 is thesurface free energy <strong>of</strong> the (<strong>111</strong>)<br />
reference plane, β is the step free energy <strong>and</strong> g is the step–step interaction. These three terms,<br />
<strong>to</strong>gether with a repulsive interaction between steps (g > 0), describe the surface free energy<br />
<strong>of</strong> a regular stable <strong>vicinal</strong> surface. However, other terms are necessary in order <strong>to</strong> explain the<br />
faceting instability <strong>and</strong> various microscopic mechanisms lead <strong>to</strong> their existence. For example,<br />
the presence <strong>of</strong> a surface reconstruction also leadst<strong>of</strong>aceting. Indeed, in a general way, a<br />
reconstruction induces that γ0, β <strong>and</strong> g are functions <strong>of</strong> the <strong>vicinal</strong> angle θ. Themostfamous<br />
exampleisthe(7×7)–(1×1) transition where the Si(<strong>111</strong>) <strong>vicinal</strong> <strong>surfaces</strong> misoriented <strong>to</strong>wards<br />
the [¯211] direction are faceted for temperatures below the phase transition [15, 16]. The phase<br />
separation between a reconstructed (7 × 7) Si(<strong>111</strong>) facet <strong>and</strong> a non-reconstructed stepped<br />
phase has been interpreted as a loss <strong>of</strong> convexity <strong>of</strong> the surface free energy when the surface<br />
free energy curves for the reconstructed <strong>and</strong> unreconstructed structures intersect. In the case<br />
<strong>of</strong> <strong>Au</strong>(100) [17, 18, 10] <strong>and</strong> Pt(100) [11] the observation <strong>of</strong> faceting has been interpreted in<br />
terms <strong>of</strong> local minima in the surface free energy, called magic <strong>vicinal</strong>s, when the terrace width<br />
is commensurate or nearly commensurate with the reconstruction, leading <strong>to</strong> the possibility <strong>of</strong><br />
optimal registry [19].<br />
In the case <strong>of</strong> <strong>Au</strong>(<strong>111</strong>) <strong>vicinal</strong> <strong>surfaces</strong>, there are two experimental facts that strongly<br />
indicate that they should be unstable <strong>to</strong>wards faceting: (i) the gold equilibrium crystal shape<br />
displays sharp edges around the facets <strong>and</strong> (ii) the <strong>Au</strong>(<strong>111</strong>) surface is reconstructed.<br />
The macroscopic observation <strong>of</strong> gold equilibrium crystal shape (ECS) has been obtained<br />
after deposition on two different substrates, either graphite [20, 21] or α-SiC [22] <strong>and</strong> examined<br />
by scanning electron microscopy. All these experimental investigations agree on the fact that<br />
gold ECS displays discontinuous facet <strong>to</strong> <strong>vicinal</strong> transitions. This appears as sharp edges<br />
around both the (<strong>111</strong>) <strong>and</strong> (100) facets. More recently, the interpretation <strong>of</strong> such a shape has<br />
been revisited by Bonzel et al [23] by adding the fourth term in equation (1). Although the link<br />
between the macroscopic ECS <strong>and</strong> the microscopic interpretation <strong>of</strong> the surface free energy<br />
development <strong>of</strong> a <strong>vicinal</strong> surface is not yet unders<strong>to</strong>od, sharp edges clearly mean that <strong>Au</strong>(<strong>111</strong>)<br />
<strong>vicinal</strong> <strong>surfaces</strong> are unstable <strong>to</strong>wards faceting. This result is also confirmed by observation<br />
<strong>of</strong> sharp edges on periodic pr<strong>of</strong>iles annealed at 1023 K [24] or by determining the faceting<br />
morphologies <strong>of</strong> <strong>Au</strong>(<strong>111</strong>) stepped <strong>surfaces</strong> either by using x-ray scattering [25–27] or scanning
<strong>Self</strong>-<strong>ordering</strong> <strong>of</strong> <strong>Au</strong>(<strong>111</strong>) <strong>vicinal</strong> <strong>surfaces</strong> <strong>and</strong> <strong>application</strong> <strong>to</strong> nanostructure organized growth S3365<br />
(a) (b)<br />
√3<br />
15 nm<br />
22<br />
110 nm<br />
Figure 1. TwoSTM images zooming out the reconstruction <strong>of</strong> <strong>Au</strong>(<strong>111</strong>). (a) A<strong>to</strong>mic resolution<br />
showingthe22× √ 3reconstruction <strong>of</strong> the <strong>Au</strong>(<strong>111</strong>) surface. Corrugation is 0.3 nm. The rectangular<br />
unit cell is drawn. (b) The secondary herringbone reconstruction seen on a larger area, also called<br />
the chevron phase. White lines are discommensuration lines.<br />
tunnelling microscopy (STM) [28, 29, 2]. It is worth noting that <strong>Au</strong>(<strong>111</strong>) <strong>vicinal</strong>s have also<br />
been studied under an electrochemical environment [30, 31].<br />
The microscopic origin <strong>of</strong> the <strong>Au</strong>(<strong>111</strong>) <strong>vicinal</strong> faceting instability has <strong>to</strong> be searched for<br />
in the famous 22 × √ 3reconstruction <strong>of</strong> the <strong>Au</strong>(<strong>111</strong>) surface [32–34]. This reconstruction has<br />
been described within a Frenkel–Kon<strong>to</strong>rova (FK) model [35–38]. It involves a non-uniform<br />
compression <strong>of</strong> the surface a<strong>to</strong>ms along the [1¯10] direction, with domain walls, also called<br />
linear discommensurations, separating surface regions with the correct (fcc) stacking from<br />
regions with a faulted (hcp) stacking sequence (see figure 1(a)). Each discommensuration<br />
incorporates an additional one-half <strong>of</strong> an a<strong>to</strong>m relative <strong>to</strong> the bulk (<strong>111</strong>) planes. The periodicity<br />
between faulted regions (LD = 65 Å) corresponds <strong>to</strong> 22 a<strong>to</strong>ms. The reconstructed layer is<br />
4% denser than the bulk (<strong>111</strong>) planes. Further energy minimization <strong>of</strong> a very small strain<br />
energy associated with the anisotropy <strong>of</strong> the stress relief in the 22 × √ 3reconstruction leads<br />
<strong>to</strong> asecondary reconstruction pattern called the herringbone reconstruction or the chevron<br />
phase [34, 39, 40], <strong>of</strong> which the periodicity is about 300 Å (see figure 1(b)). The thermal<br />
behaviour <strong>of</strong> <strong>Au</strong>(<strong>111</strong>) was investigated using x-ray scattering [41–43]. The periodicity <strong>of</strong> the<br />
22 × √ 3reconstruction seems <strong>to</strong> exist at any temperature studied (from 300 <strong>to</strong> 1250 K, the<br />
melting temperature <strong>of</strong> gold being 1337 K) [41, 42]. However above 865 K, the herringbone<br />
reconstruction loses long range order, <strong>and</strong> a first-order phase transition is completed at 880 K.<br />
The high temperature phase is called a discommensuration fluid phase. As far as we know<br />
no link has been established between this phase transition <strong>and</strong> the faceting morphology <strong>of</strong><br />
<strong>Au</strong>(<strong>111</strong>) <strong>vicinal</strong> <strong>surfaces</strong>.<br />
One difficulty comes from the fact that introducing steps on the surface changes the<br />
microscopic structure <strong>of</strong> the reconstruction. For example, as soon as the <strong>vicinal</strong> angle is larger<br />
than one degree, the herringbone reconstruction cannot exist any longer since the periodicity<br />
<strong>of</strong> this reconstruction is larger than the terrace width. Therefore, any investigation <strong>of</strong> the role<br />
played by the reconstruction on the stability <strong>of</strong> <strong>Au</strong>(<strong>111</strong>) <strong>vicinal</strong>s should start with a systematic<br />
study <strong>of</strong> the influence <strong>of</strong> steps on the reconstruction. We will report on such a study in section 3.<br />
The paper is organized as follows. The next section details the experimental preparation <strong>of</strong><br />
<strong>Au</strong> <strong>vicinal</strong>s under ultra-high vacuum conditions <strong>and</strong> the techniques (mainly a combination <strong>of</strong><br />
scanning tunnelling microscopy (STM) <strong>and</strong> grazing incidence x-ray diffraction (GIXD)) used<br />
for determining both the macroscopic <strong>and</strong> the a<strong>to</strong>mic structures <strong>of</strong> the <strong>surfaces</strong>. All the sample
S3366 SRousset et al<br />
Table 1. {100} step <strong>vicinal</strong> <strong>surfaces</strong>: summary <strong>of</strong> the nominal angles <strong>of</strong> misorientation θ, number<br />
<strong>of</strong> a<strong>to</strong>mic rows in each terrace n <strong>and</strong> terrace widths W. The Miller indices are (n +1, n − 1, n − 1)<br />
<strong>and</strong> the terrace width is calculated using W = (n − 1/3) ∗ 0.25.<br />
θ (deg) n W (nm)<br />
<strong>Au</strong>(12, 11, 11) 2.38 23 5.7<br />
<strong>Au</strong>(11, 9, 9) 5.57 10 2.4<br />
<strong>Au</strong>(433) 8.05 7 1.7<br />
<strong>Au</strong>(755) 9.45 6 1.4<br />
<strong>Au</strong>(322) 11.4 5 1.2<br />
orientations studied are also summarized in this experimental section. Section 3 elucidates<br />
the interaction between close-packed steps <strong>and</strong> reconstruction as studied directly by STM on<br />
a<strong>Au</strong>(<strong>111</strong>) sample. Section 4 is devoted <strong>to</strong> the experimental determination <strong>of</strong> <strong>Au</strong>(<strong>111</strong>) <strong>vicinal</strong><br />
morphology, i.e. both the a<strong>to</strong>mic structure <strong>and</strong> the long range order. In section 5, interpretation<br />
<strong>of</strong> the experimental results is given concerning the faceting origin <strong>of</strong> <strong>Au</strong>(<strong>111</strong>) <strong>vicinal</strong>s. Two<br />
different models for explaining the microscopic origin <strong>of</strong> <strong>Au</strong>(<strong>111</strong>) <strong>vicinal</strong> faceting are explained<br />
depending on which azimuth <strong>surfaces</strong> are cut. Finally, a phase diagram is proposed in section 6<br />
for these <strong>surfaces</strong> <strong>and</strong> we summarize the existence <strong>of</strong> known magic <strong>vicinal</strong>s. Section 7 focuses<br />
on the interpretation <strong>of</strong> the long range order found on the faceted <strong>surfaces</strong>. The interplay<br />
between a<strong>to</strong>mic order <strong>and</strong> mesoscopic order is studied within the framework <strong>of</strong> Marchenko’s<br />
model [44]. The role played by the edge energy is highlighted in this section. Finally, section 8<br />
showshow <strong>Au</strong>(<strong>111</strong>) <strong>vicinal</strong>s can be used for growing organized nanostructures.<br />
2. Experimental details<br />
2.1. <strong>Au</strong> samples<br />
Except for the study presented in section 3,which has been performed by using a <strong>Au</strong>(<strong>111</strong>) single<br />
crystal, all samples are <strong>Au</strong>(<strong>111</strong>) <strong>vicinal</strong> <strong>surfaces</strong> which are single crystals cut by spark erosion<br />
<strong>to</strong> produce discs <strong>of</strong> either 4, 9 or 12 mm in diameter <strong>and</strong> 2 mm in thickness, depending on each<br />
sample. Many different samples have been studied, but all <strong>of</strong> them are cut within the [0¯11] zone<br />
axis. Thus all steps are parallel <strong>to</strong> this close-packed [0¯11]direction since gold is a face-centred<br />
cubic (fcc) crystal. Two opposite azimuths have been investigated (see figure 2). For <strong>vicinal</strong>s<br />
oriented <strong>to</strong>wards [¯211], steps exhibit {<strong>111</strong>} micr<strong>of</strong>acets; this is the case for <strong>Au</strong>(11, 12, 12),<br />
<strong>Au</strong>(788), <strong>Au</strong>(455), <strong>Au</strong>(577) <strong>and</strong> <strong>Au</strong>(233). We have also investigated morphologies <strong>of</strong> <strong>Au</strong>(12,<br />
11, 11), <strong>Au</strong>(11, 9, 9), <strong>Au</strong>(433), <strong>Au</strong>(755) <strong>and</strong> <strong>Au</strong>(322) which are oriented <strong>to</strong>wards [2¯1¯1], whose<br />
steps exhibit {100} micr<strong>of</strong>acets. The crystallographic parameters <strong>of</strong> these <strong>surfaces</strong> such as the<br />
angle <strong>of</strong> misorientation θ,thenumber n <strong>of</strong> a<strong>to</strong>mic rows in each terrace <strong>and</strong> the corresponding<br />
terrace widths are summarized in tables 1 <strong>and</strong> 2. Angles <strong>of</strong> misorientation with respect <strong>to</strong> the<br />
reference plane <strong>Au</strong>(<strong>111</strong>) range between 2 ◦ <strong>and</strong> 12 ◦ .<br />
2.2. Experimental procedure<br />
The sample ex situ preparation is described elsewhere[30, 2]. Once introduced in<strong>to</strong> the UHV<br />
chamber, with a base pressure <strong>of</strong> 3 × 10 −11 mbar, the sample is prepared using repeated<br />
cycles <strong>of</strong> sputtering with argon ions (typically at an argon pressure <strong>of</strong> 5 × 10 −5 mbar, <strong>and</strong> a<br />
voltage <strong>of</strong> 600 V) <strong>and</strong> annealing at 800 K. Observations are made in situ by STM experiments.<br />
STM images were taken first with a home-made microscope [28, 29], then with a variable<br />
temperature STM from Omicron.
<strong>Self</strong>-<strong>ordering</strong> <strong>of</strong> <strong>Au</strong>(<strong>111</strong>) <strong>vicinal</strong> <strong>surfaces</strong> <strong>and</strong> <strong>application</strong> <strong>to</strong> nanostructure organized growth S3367<br />
[-211]<br />
(11,12,12)<br />
(788)<br />
(455)<br />
n(<strong>111</strong>)x(<strong>111</strong>) n(<strong>111</strong>)x(100)<br />
[<strong>111</strong>]<br />
{<strong>111</strong>} steps {100} steps<br />
(577)<br />
(233)<br />
[0-11]<br />
(433)<br />
(755)<br />
(322)<br />
[2-1-1]<br />
(12,11,11)<br />
(11,9,9)<br />
Figure 2. Schematic diagram <strong>of</strong> <strong>Au</strong>(233) <strong>and</strong> <strong>Au</strong>(322) <strong>surfaces</strong> which are characteristic <strong>of</strong> <strong>Au</strong>(<strong>111</strong>)<br />
<strong>vicinal</strong> <strong>surfaces</strong> studied in this paper: n(<strong>111</strong>)×(<strong>111</strong>) i.e. with a miscut angle along the [¯211] azimuth<br />
({<strong>111</strong>} type steps) <strong>and</strong> n(<strong>111</strong>)×(100) i.e. with a miscut angle along the [2¯1¯1] azimuth ({100} type<br />
steps). n is the number <strong>of</strong> a<strong>to</strong>mic rows in each terrace. The bot<strong>to</strong>m <strong>of</strong> the drawing summarizes the<br />
nominal <strong>vicinal</strong> planes studied in the paper regarding the azimuth.<br />
Table 2. {<strong>111</strong>} step <strong>vicinal</strong> <strong>surfaces</strong>: summary <strong>of</strong> the nominal angles <strong>of</strong> misorientation θ, number<br />
<strong>of</strong> a<strong>to</strong>mic rows in each terrace n <strong>and</strong> terrace widths W. The Miller indices are (n − 2, n, n) <strong>and</strong><br />
the terrace width is calculated using W = (n − 2/3) ∗ 0.25.<br />
θ (deg) n W (nm)<br />
<strong>Au</strong>(11, 12, 12) 2.27 24 5.83<br />
<strong>Au</strong>(788) 3.51 16 3.83<br />
<strong>Au</strong>(455) 5.76 10 2.33<br />
<strong>Au</strong>(577) 8.47 7 1.58<br />
<strong>Au</strong>(233) 10.0 6 1.33<br />
GIXD experiments were performed in a UHV diffrac<strong>to</strong>meter on beam line DW 12 at<br />
LURE-DCI (Orsay). The macroscopic surface normal is aligned with the diffrac<strong>to</strong>meter<br />
rotation axis ω in order <strong>to</strong> keep the incident angle constant at a critical angle (∼0.3 ◦ for<br />
wavelength 0.827 Å) during the scans <strong>and</strong> using Z-axis geometry. The <strong>vicinal</strong> orientation was<br />
checked in situ by localization <strong>of</strong> Bragg peaks <strong>and</strong> the corresponding <strong>vicinal</strong> angle was taken<br />
in<strong>to</strong> account in the program for using the hexagonal coordinate system for the (<strong>111</strong>) fcc terrace<br />
structure, described in the next paragraph.
S3368 SRousset et al<br />
(a)<br />
C hex<br />
B hex<br />
a<br />
A hex<br />
c<br />
b<br />
L=0<br />
L=1<br />
L=2<br />
(b)<br />
B* hex<br />
A* hex<br />
[-2,1,1]<br />
Figure 3. (a) Surface (<strong>111</strong>) where the lattice vec<strong>to</strong>rs are drawn. (b) Schematic diagram <strong>of</strong> the<br />
reciprocal space.<br />
All crystallographic directions (hkl), mentioned here, are defined in the conventional<br />
cubic coordinate system describing the fcc gold crystal with lattice parameter a = 4.08 Å.<br />
However, the(<strong>111</strong>) a<strong>to</strong>mic planes <strong>of</strong> an fcc crystal are hexagonally close packed. It is therefore<br />
convenient <strong>to</strong> employ a hexagonal coordinate system when describing the scattering from a<br />
(<strong>111</strong>) fcc surface. The reciprocal axes (A ∗ , B ∗ , C ∗ )are deduced from a hexagonal coordinate<br />
system in real space with vec<strong>to</strong>rs (A, B, C) drawninfigure 3. Vec<strong>to</strong>rs A <strong>and</strong> B are in the<br />
terrace plane with A = B = a/ √ 2 = 2.88 Å, whereas C is along the perpendicular [<strong>111</strong>]cubic<br />
direction, with C = 3h = 7.05 Å, h being the step height, h = a/ √ 3 = 2.35 Å. In<br />
the reciprocal space (see figure 3(b)), A ∗ = B ∗ = 4π/ √ 3A = 2.52 Å −1 for the (H ,K )<br />
plane normal <strong>to</strong> the [<strong>111</strong>]cubic direction <strong>and</strong> C ∗ = 2π/C = 0.89 Å −1 for the L index. In<br />
this coordinate system, the hexagonal reciprocal space indices H , K <strong>and</strong> L are related <strong>to</strong> the<br />
conventional cubic indices h, k <strong>and</strong> l by the transformations H =−h/2+k/2, K =−k/2+l/2<br />
<strong>and</strong> L = h + k +l. The component <strong>of</strong> the scattering vec<strong>to</strong>r in the (<strong>111</strong>)cubic plane is determined<br />
by H <strong>and</strong> K ,while the out-<strong>of</strong>-plane scattering vec<strong>to</strong>r is given by L. Since the hexagonal unit<br />
cell in real space (A, B, C) isnot primitive, bulk Bragg peaks do not appear for each integer<br />
value <strong>of</strong> L,but they should satisfy the condition 2H + K + L = 3n,whichleads <strong>to</strong> a periodicity<br />
<strong>of</strong> 3C ∗ along the C ∗ axis, as can be seen in figure 3(b).<br />
Once the gold surface is well prepared, cobalt evaporation is performed using a 2 mm<br />
diameter cobalt rod directly heated by electron bombardment (Iem = 12 mA, HV = 800 V).<br />
The pressure during the process is below 2 × 10 −10 mbar. Typical flux rate is 1 ML min −1 .<br />
The flux calibration is made using an in situ quartz microbalance.<br />
3. Interaction between steps <strong>and</strong> reconstruction on <strong>Au</strong>(<strong>111</strong>)<br />
Stepped <strong>surfaces</strong> <strong>of</strong>ten exhibit properties which depend on the interactions between steps <strong>and</strong><br />
reconstructions [14]. In this section we report on a systematic behaviour between the closepacked<br />
steps on <strong>Au</strong>(<strong>111</strong>) <strong>and</strong> the 22 × √ 3reconstruction. This result, <strong>of</strong> particular interest
<strong>Self</strong>-<strong>ordering</strong> <strong>of</strong> <strong>Au</strong>(<strong>111</strong>) <strong>vicinal</strong> <strong>surfaces</strong> <strong>and</strong> <strong>application</strong> <strong>to</strong> nanostructure organized growth S3369<br />
(a)<br />
[-2,1,1]<br />
{100}<br />
{<strong>111</strong>}<br />
(b)<br />
{<strong>111</strong>}<br />
{100}<br />
Figure 4. (a) Schematic <strong>to</strong>p view <strong>of</strong> a (<strong>111</strong>) surface showing two a<strong>to</strong>mic levels <strong>and</strong> both kinds <strong>of</strong><br />
close packed steps. One is made <strong>of</strong> a {<strong>111</strong>} micr<strong>of</strong>acet <strong>and</strong> the other <strong>of</strong> a {100} micr<strong>of</strong>acet. (b) STM<br />
image <strong>of</strong> a <strong>Au</strong>(<strong>111</strong>) surface. Size is 100 nm × 90 nm. The image is recorded at T = 150 K. The<br />
corrugation due <strong>to</strong> the terrace levels has been subtracted in order <strong>to</strong> enhance the reconstruction lines.<br />
Inset isthe raw image which displays the a<strong>to</strong>mic grey levels. Four terraces are clearly seen, each<br />
one associated with a grey level <strong>and</strong> one being a plateau crossing the whole image from bot<strong>to</strong>m<br />
left <strong>to</strong> the upper right. {<strong>111</strong>} steps are indicated by full lines <strong>and</strong> {100} ones by dotted lines.<br />
Orientation <strong>of</strong> steps is consistent with (a) (from [46]).<br />
formanaging new nanostructured substrates, is interpreted in terms <strong>of</strong> the relative stability <strong>of</strong><br />
both types <strong>of</strong> step.<br />
The 22× √ 3reconstruction is easily recognized on STM images by the presence <strong>of</strong> stacking<br />
fault lines which are lines <strong>of</strong> highest corrugation onthe surface, also called discommensuration<br />
lines. It has been observed on <strong>Au</strong>(<strong>111</strong>) [34] that these lines are very <strong>of</strong>ten found perpendicular <strong>to</strong><br />
thesteps. However, discommensuration lines which do not correspond <strong>to</strong> a usual compression<br />
direction also exist, parallel <strong>to</strong> the step edges [34]. STM experiments performed on a <strong>Au</strong>(<strong>111</strong>)<br />
surface demonstrate that this behaviour can be unambiguously associated with the a<strong>to</strong>mic<br />
structure <strong>of</strong> steps [45, 46]. Two types <strong>of</strong> close-packed step can be found on a (<strong>111</strong>) surface. A<br />
descending step along the [¯211] azimuth presents a {<strong>111</strong>} micr<strong>of</strong>acet, whereas an ascending<br />
step along the same azimuth is made <strong>of</strong> a {100} micr<strong>of</strong>acet (see figure 4(b)). We have indeed<br />
found on some wide <strong>Au</strong>(<strong>111</strong>) terraces a mona<strong>to</strong>micheight plateau which gives the opportunity<br />
<strong>to</strong> observe on the same image both types <strong>of</strong> close-packed step. Indeed, two opposite steps<br />
along the same azimuth have a different a<strong>to</strong>mic structure (see figure 4). As seen in figure 4,<br />
when the discommensuration lines cross an ascending step, they are no longer present on the<br />
other side <strong>of</strong> the plateau. Moreover, a discommensuration line parallel <strong>to</strong> the step edge is<br />
found at the bot<strong>to</strong>m <strong>of</strong> the corresponding descending step. This effect can be systematically<br />
attributed <strong>to</strong> the type <strong>of</strong> step, since it is clear that when the steps are rotated by 60 ◦ the effect<br />
is reversed. Indeed, a rotation <strong>of</strong> 60 ◦ exchanges the crystallographic structure <strong>of</strong> the steps (see<br />
figure 4). A Laue x-ray diffraction pattern allows us <strong>to</strong> attribute unambiguously one type <strong>of</strong><br />
step <strong>to</strong> each structural effect.<br />
When the step is crossed by the lines <strong>of</strong> the reconstruction (which is the effect usually<br />
known), it is made <strong>of</strong> a {<strong>111</strong>} micr<strong>of</strong>acet. On the other h<strong>and</strong>, when the step is, apriori,made<br />
<strong>of</strong> a {100} micr<strong>of</strong>acet, the bot<strong>to</strong>m <strong>of</strong> the step encountersaline <strong>of</strong> stacking fault parallel <strong>to</strong> the<br />
step edge. Knowing that the smallest area on the 22 × √ 3reconstruction corresponds <strong>to</strong> hcp<br />
stacking, a<strong>to</strong>ms closest <strong>to</strong> the descending step edge are in fcc sites. This is easily unders<strong>to</strong>od<br />
since these a<strong>to</strong>ms are closest <strong>to</strong> the a<strong>to</strong>ms underneath the step which are in the bulk stacking.<br />
Moreover, a<strong>to</strong>mic resolution <strong>of</strong> a step edge clearly shows that the stacking fault associated<br />
90nm
S3370 SRousset et al<br />
with thereconstruction remains unchanged until the last a<strong>to</strong>mic row <strong>of</strong> the upper terrace [45].<br />
Thus, the initially {100} micr<strong>of</strong>acet structure <strong>of</strong> a step is transformed in<strong>to</strong> local portions <strong>of</strong><br />
{<strong>111</strong>} micr<strong>of</strong>acet where the upper a<strong>to</strong>ms are in hcp sites. In contrast, the a<strong>to</strong>mic structure <strong>of</strong><br />
an initially {<strong>111</strong>} step edge remains unchanged when it is crossed by the discommensuration<br />
lines. These results strongly suggest an energetic interpretation for the observed behaviour.<br />
For metals like gold or platinum, the step energy <strong>of</strong> {<strong>111</strong>} type steps has been found <strong>to</strong> be<br />
lower than that<strong>of</strong>{100} type steps [47]. This can be easily unders<strong>to</strong>od if one considers the<br />
a<strong>to</strong>mic density <strong>of</strong> each kind <strong>of</strong> step. Thus, the behaviour <strong>of</strong> the reconstruction in the vicinity<br />
<strong>of</strong> steps, which is described above, can be interpreted as a way <strong>of</strong>minimizing the step energy<br />
<strong>of</strong> an initially {100} step edge.<br />
Once first observed, we checked that this effect was systematically found on numerous<br />
areas <strong>of</strong> the surface where steps are present [46]. In addition, we have intentionally fabricated<br />
both types <strong>of</strong> step on the <strong>Au</strong>(<strong>111</strong>) surface by making holes with ion argon sputtering. It has<br />
been demonstrated [48] that a layer-by-layer removal regime can be found when the <strong>Au</strong>(<strong>111</strong>)<br />
surface is sputtered at a temperature between 120 <strong>and</strong> 220 ◦ C. In this regime, two-dimensional<br />
isl<strong>and</strong>s <strong>of</strong> surface vacancies are formed,hexagonalinshape <strong>and</strong> one layer deep. Therefore, they<br />
display both types <strong>of</strong> step, as can be seen in figure 5. As shown in figure 5, the reconstruction<br />
is present everywhere around the holes, although strongly disordered due <strong>to</strong> the high density <strong>of</strong><br />
steps in all directions. More interesting is the way the reconstruction can be found at the bot<strong>to</strong>m<br />
<strong>of</strong> these vacancy isl<strong>and</strong>s. The most systematic structural effect is that one edge <strong>of</strong> the hexagon<br />
out <strong>of</strong> every two is crossed by discommensuration lines, perpendicular <strong>to</strong> it. By comparing the<br />
orientation <strong>of</strong> the hexagon with the preceding observations,edges crossed by the reconstruction<br />
lines can be unambiguously attributed <strong>to</strong> {<strong>111</strong>} type steps. As previously discussed, it is clear<br />
that a<strong>to</strong>ms closest <strong>to</strong> the bot<strong>to</strong>m <strong>of</strong> {100} type steps are in fcc stacking. Again, the existence <strong>of</strong><br />
the reconstruction on the <strong>to</strong>p <strong>of</strong> the step edge transforms locally the step in portions <strong>of</strong> the {<strong>111</strong>}<br />
micr<strong>of</strong>acet <strong>and</strong> thus lowers its energy. As visible in figure 5, due <strong>to</strong> the complex arrangement<br />
<strong>of</strong> reconstruction between the holes, it sometimes happens that the discommensuration lines<br />
do not reach the <strong>to</strong>p <strong>of</strong> a {<strong>111</strong>} step. Then there is no reconstruction at the bot<strong>to</strong>m <strong>of</strong> the<br />
corresponding step edge. This behaviour is consistent with our energetic argument which<br />
favours keeping the {<strong>111</strong>} step structure unchanged. Additional pro<strong>of</strong> <strong>of</strong> such an interaction<br />
between reconstruction <strong>and</strong> steps can be found in experiments that we have performed on single<br />
crystals with <strong>Au</strong>(<strong>111</strong>) <strong>vicinal</strong> <strong>surfaces</strong> <strong>and</strong> that will be described below in the next section.<br />
4. Equilibrium morphology <strong>of</strong> <strong>Au</strong>(<strong>111</strong>) <strong>vicinal</strong>s<br />
In this section we report on structural determinations <strong>of</strong> <strong>Au</strong>(<strong>111</strong>) <strong>vicinal</strong> equilibrium<br />
morphologies. The reasons for interpreting these morphologies as equilibrium ones are the<br />
following.<br />
(i) Hundreds <strong>of</strong> preparation cycles on all <strong>surfaces</strong> have been performed, until the morphology<br />
no longer evolves. Indeed, faceted <strong>surfaces</strong> exhibited different morphologies at the very<br />
beginning.<br />
(ii) The annealing time was also varied from a flash up <strong>to</strong> 48 h without any modification<br />
observed at room temperature.<br />
(iii) The cooling rate has been varied from a natural flash <strong>to</strong> a slow rate (a few hours for<br />
cooling down <strong>to</strong> room temperature). The evolution <strong>of</strong> the morphology from the highest<br />
temperature <strong>of</strong> annealing has been followed with x-rays <strong>and</strong> shows that the cooling rate<br />
has no effect <strong>and</strong> that the faceting morphology evolves with temperature in a reversible<br />
way for temperature above 700 K [26].
<strong>Self</strong>-<strong>ordering</strong> <strong>of</strong> <strong>Au</strong>(<strong>111</strong>) <strong>vicinal</strong> <strong>surfaces</strong> <strong>and</strong> <strong>application</strong> <strong>to</strong> nanostructure organized growth S3371<br />
[-2,1,1]<br />
200 nm 73 nm<br />
(a)<br />
[-2,1,1]<br />
Figure 5. STM images <strong>of</strong> a <strong>Au</strong>(<strong>111</strong>) surface; argon ions sputtered at 200 ◦ C. (a) Inset, raw STM<br />
image showing four a<strong>to</strong>mic levels <strong>and</strong> the vacancy isl<strong>and</strong>s bounded by mona<strong>to</strong>mic steps. The same<br />
image is shown where the corrugation due <strong>to</strong> the terrace levels has been subtracted in order <strong>to</strong><br />
enhance the reconstruction lines. (b) STM image <strong>of</strong> a few vacancy isl<strong>and</strong>s. T = 300 K. Inset,<br />
the raw STM image. The same image is shown where the corrugation due <strong>to</strong> the terrace levels has<br />
been subtracted in order <strong>to</strong> enhance the reconstruction lines (from [46]).<br />
4.1. Structure <strong>of</strong> stable <strong>vicinal</strong>s<br />
Stable <strong>vicinal</strong>s <strong>of</strong> <strong>Au</strong>(<strong>111</strong>) can be divided in<strong>to</strong> two classes depending on whether the terraces<br />
are reconstructed or not.<br />
4.1.1. Stable unreconstructed <strong>vicinal</strong> <strong>surfaces</strong>: <strong>Au</strong>(322), <strong>Au</strong>(755) <strong>and</strong> <strong>Au</strong>(233). <strong>Au</strong>(322),<br />
<strong>Au</strong>(755) <strong>and</strong> <strong>Au</strong>(233) <strong>surfaces</strong> have been investigated using both STM, low-energy electron<br />
diffraction (LEED) <strong>and</strong> GIXD. Their morphology is similar <strong>to</strong> an a<strong>to</strong>mic staircase, where steps<br />
are all one a<strong>to</strong>m high (h = 0.235 nm), <strong>and</strong> equally spaced across the surface. STM images<br />
allow precise determination <strong>of</strong> terrace width his<strong>to</strong>grams. The <strong>Au</strong>(322) substrate is misoriented<br />
by an angle <strong>of</strong> 11.4 ◦ along the [2¯1¯1] azimuth <strong>and</strong> displays mona<strong>to</strong>mic steps regularly spaced<br />
with an averaged terrace width distribution <strong>of</strong> 1.2 nm (see figure 6). No reconstruction is seen on<br />
such a surface. LEED <strong>and</strong> GIXD measurements also suggest that there is no reconstruction.<br />
The <strong>Au</strong>(755) surface is cut in the same azimuth as the (322) surface. It is also a regular<br />
stepped surface without any reconstruction. The <strong>Au</strong>(233) surface has the same number n = 6<br />
<strong>of</strong> a<strong>to</strong>mic rows in each terrace as the <strong>Au</strong>(755) surface but it is misoriented in the opposite<br />
azimuth. Angles <strong>of</strong> misorientation with respect <strong>to</strong> the (<strong>111</strong>) plane are concentrated around 10 ◦<br />
for all three stable unreconstructed <strong>surfaces</strong>. When the <strong>surfaces</strong> investigated display a much<br />
smaller misorientation angle, i.e. about 4 ◦ or below, terraces become reconstructed.<br />
4.1.2. Stable reconstructed <strong>vicinal</strong> <strong>surfaces</strong>: <strong>Au</strong>(788) <strong>and</strong> <strong>Au</strong>(11, 12, 12). <strong>Au</strong>(788) <strong>and</strong><br />
<strong>Au</strong>(11, 12, 12) are stable regularly stepped <strong>surfaces</strong>, with mona<strong>to</strong>mic steps like the former<br />
<strong>vicinal</strong>s. But now all terraces are reconstructed, as can be determined both using STM images<br />
<strong>and</strong> GIXD spectra. The <strong>Au</strong>(788) surface is misoriented by 3.5 ◦ with respect <strong>to</strong> the (<strong>111</strong>)<br />
orientation <strong>to</strong>wards the [¯211] azimuthal direction. The step crystallographic structure is {<strong>111</strong>}<br />
<strong>and</strong> each terrace contains 16 a<strong>to</strong>mic rows (see figure 7(a)). After the surface preparation, the<br />
sample displays 10 µm defect free areas with a roughness < 1nm. Itshowsall over the<br />
(b)
S3372 SRousset et al<br />
(a)<br />
50 nm<br />
(b)<br />
(c)<br />
Pr<strong>of</strong>iles (a.u.)<br />
20 nm<br />
0,5 1,0 1,5 2,0<br />
Terraces Width (nm)<br />
Figure 6. (a), (b) STM images <strong>of</strong> the <strong>Au</strong>(322) surface. All steps are mona<strong>to</strong>mic in height. (c)<br />
Terrace width distribution. The statistics has been done over 15 images <strong>and</strong> 30 000 widths.<br />
(a)<br />
(b)<br />
[01-1]<br />
150 nm<br />
[-211]<br />
[-211]<br />
(c)<br />
20000<br />
Pr<strong>of</strong>iles<br />
0<br />
2 3 4 5 6<br />
Terrace width (nm)<br />
(d) [-211]<br />
Figure 7. (a) Schematic <strong>to</strong>p view <strong>of</strong> a (788) non-reconstructed surface. Steps are 0.235 nm high<br />
<strong>and</strong> close packed. The crystallographic structure <strong>of</strong> the step edge is a {<strong>111</strong>} micr<strong>of</strong>acet. Terraces<br />
are (<strong>111</strong>) planes <strong>and</strong> consist <strong>of</strong> 16 a<strong>to</strong>mic rows. The terrace width is 3.83 nm <strong>and</strong> the associated<br />
miscut angle with respect <strong>to</strong> the (<strong>111</strong>) plane is 3.52 ◦ <strong>to</strong>wards the [¯211] azimuthal direction. (b)<br />
STM image <strong>of</strong> our single-crystal (788) sample. It displays a very regular <strong>and</strong> straight step array.<br />
(c) Terrace width distribution <strong>of</strong> the (788) surface measured over 40 different images <strong>and</strong> 80 000<br />
terrace pr<strong>of</strong>iles. The Gaussian fit (full curve) is centred at 3.9 nm <strong>and</strong> has a full width at half<br />
maximum <strong>of</strong> 0.85 nm. (d) LEED pattern <strong>of</strong> the specular spot taken at E = 23 eV (from [90]).<br />
surface a regular pattern <strong>of</strong> mona<strong>to</strong>mic steps, 0.235 nm high (see figures 7(b) <strong>and</strong> (c)), with a<br />
terrace width distribution centred at 3.9 nm <strong>and</strong> with a 0.85 nm full width at half maximum.<br />
The surface is reconstructed <strong>and</strong> discommensuration lines run perpendicular <strong>to</strong> the step edges,<br />
in agreement with the systematic behaviour <strong>of</strong> the reconstruction found in the vicinity <strong>of</strong><br />
{<strong>111</strong>} micr<strong>of</strong>aceted steps, as shown in section 3. However, it should be pointed out that the<br />
periodicity <strong>of</strong> the reconstruction along the steps is greater on the <strong>vicinal</strong> area than on wide
<strong>Self</strong>-<strong>ordering</strong> <strong>of</strong> <strong>Au</strong>(<strong>111</strong>) <strong>vicinal</strong> <strong>surfaces</strong> <strong>and</strong> <strong>application</strong> <strong>to</strong> nanostructure organized growth S3373<br />
(a)<br />
[-211]<br />
45 nm<br />
(b)<br />
fcc<br />
hcp<br />
11,5 nm<br />
[-211]<br />
Figure 8. STMimages <strong>of</strong> the <strong>Au</strong>(788) surface. The corrugation due <strong>to</strong> the terrace levels has been<br />
subtracted in order <strong>to</strong> enhance the reconstruction lines. (a) At large scale, the discommensuration<br />
lines are running perpendicular <strong>to</strong> the step edges. However, within a terrace, they display a ‘V’<br />
shape. (b) A<strong>to</strong>mic resolution image. The dotted line is a guide <strong>to</strong> the eye <strong>to</strong> observe the fcc <strong>to</strong> hcp<br />
stacking transition through a discommensuration line. No surface dislocation can be found on this<br />
surface structure (from [90]).<br />
<strong>Au</strong>(<strong>111</strong>) terraces, in agreement with the fact that steps partially relieve stress. The LEED<br />
pattern (see figure 7(d)) indicates the good long range order (on a macroscopic scale) <strong>of</strong> both<br />
the stepped surface <strong>and</strong> the reconstruction since we can see up <strong>to</strong> the third diffraction peak order<br />
in both directions. Due <strong>to</strong> the presence <strong>of</strong> steps, the discommensuration lines are disturbed<br />
<strong>and</strong> no longer run perpendicular <strong>to</strong> the close-packed direction. Indeed, it can be seen from the<br />
images that, instead <strong>of</strong> being perfectly parallel over the whole terrace, these lines form a ‘V’<br />
shape within terraces (see figure 8(b)). As a consequence, following the observation made on<br />
a<strong>Au</strong>(<strong>111</strong>) surface near a {<strong>111</strong>} step [46], the fcc domain width decreases approaching the<br />
upper part <strong>of</strong> the step (see figure 8). This is consistent with the fact that the fcc domain should<br />
be larger near the bot<strong>to</strong>m <strong>of</strong> the step since it is the bulk stacking <strong>of</strong> gold. It is worth noting that<br />
the exact a<strong>to</strong>mic arrangement near the step edge is not known. How the hcp surface stacking<br />
changes in<strong>to</strong> an fcc stacking in the bulk is still an open question.<br />
The <strong>Au</strong>(11, 12, 12) surface, which is misoriented with respect <strong>to</strong> <strong>Au</strong>(<strong>111</strong>) by a <strong>vicinal</strong><br />
angle <strong>of</strong> 2.31 ◦ ,displays a similar behaviour <strong>to</strong> the <strong>Au</strong>(788) surface. Terrace width distribution<br />
has been measured from STM images over 30 images <strong>and</strong> 200 terraces. It is quite narrow since<br />
about 60% <strong>of</strong> the terrace widths equal the average terrace width value 〈L〉 =5.8nm[49].<br />
From a nanostructuration point <strong>of</strong> view, these <strong>surfaces</strong> are patterned in two dimensions at<br />
ananometre scale:<br />
(i) along the [¯211] direction, the periodicity is the terrace width <strong>and</strong> is linked <strong>to</strong> the miscut<br />
angle [50];<br />
(ii) along the [01¯1] direction, the periodicity is 7.2 nm, fixed by the reconstruction, <strong>and</strong> does<br />
not vary significantly with the miscut angle.<br />
Such patterned substrates at a nanometre scale have been successfully used in order <strong>to</strong> serve as a<br />
template for two-dimensional long range ordered growth <strong>of</strong> uniform cobalt nanostructures [51].<br />
This will be shown in the last section <strong>of</strong> this paper.
S3374 SRousset et al<br />
(a) (c)<br />
(b) (d)<br />
20 nm<br />
INTENSITY (arb. units)<br />
6000<br />
5000<br />
4000<br />
3000<br />
2000<br />
1000<br />
[1,-2,0]<br />
(i)<br />
δ<br />
A<br />
2 δD<br />
0<br />
-0,08 -0,06 -0,04 -0,02 0,00 0,02 0,04 0,06 0,08<br />
(ii)<br />
K<br />
(i)<br />
ξ (UNITS OF A*)<br />
Figure 9. Faceted morphology <strong>of</strong> <strong>Au</strong>(455). (a) Three-dimensional STM image <strong>of</strong> the faceted<br />
<strong>Au</strong>(455) showing the long range order <strong>of</strong> the hill-<strong>and</strong>-valley morphology. The scan area is<br />
1.4 µm × 1.4 µm. (b) STM image zooming in on a frontier between facets. All steps are<br />
mona<strong>to</strong>mic, <strong>of</strong> height 2.35 Å. (c), (d) X-ray scattering results obtained on the faceted <strong>Au</strong>(455)<br />
surface. (d) Transverse scan obtained on the faceted <strong>Au</strong>(455) surface along the [1, −2, 0] direction,<br />
showing two satellites, separated by a distance 2δD .Aschematic diagram <strong>of</strong> the projected reciprocal<br />
space in the (H, K )plane is displayed in the upper part. (i) is the position <strong>of</strong> the scan shown below.<br />
(ii) is the direction <strong>of</strong> a typical H -scan showing the quadruplet drawn in grey. Satellites <strong>of</strong> phase<br />
A are indicated by small black dots.<br />
4.2. Morphology <strong>and</strong> a<strong>to</strong>mic structure <strong>of</strong> faceted <strong>vicinal</strong>s<br />
4.2.1. Results on unstable <strong>vicinal</strong>s with {<strong>111</strong>} step edges. Two<strong>vicinal</strong> <strong>surfaces</strong>, <strong>Au</strong>(455) <strong>and</strong><br />
<strong>Au</strong>(577), have been investigated. When the surface undergoes a specific preparation under<br />
electrochemical environment [30, 26], prior <strong>to</strong> in situ UHV treatment, aperiodic array <strong>of</strong><br />
mona<strong>to</strong>mic steps (2.3 Å high) is readily found on <strong>Au</strong>(455) <strong>and</strong> <strong>Au</strong>(577), in close resemblance<br />
with the ideal bulk termination. After the UHV in situ treatment described in the experimental<br />
section above, the hill-<strong>and</strong>-valley structure is obtained on both <strong>surfaces</strong> (see figure 9(a)).<br />
Zooming on the hill-<strong>and</strong>-valley morphology reveals that both sides are portions <strong>of</strong> stepped<br />
<strong>surfaces</strong> (see figure 9(b)) whose terrace widths are wA = 31 ± 3Å<strong>and</strong>wB = 12 ± 1Å. The<br />
corresponding <strong>vicinal</strong> angles with respect <strong>to</strong> (<strong>111</strong>) are θA = 4 ◦ <strong>and</strong> θB = 10 ◦ .The10 ◦ facet<br />
is the <strong>Au</strong>(233) which is one <strong>of</strong> the stable <strong>surfaces</strong> described above. The determination <strong>of</strong> this<br />
orientation is even more precise than what we can measure from STM images. Indeed, the fact<br />
that <strong>Au</strong>(577) is faceted, although its misorientation angle is very close <strong>to</strong> that <strong>of</strong> <strong>Au</strong>(233) (see<br />
table 2), is the best pro<strong>of</strong> that <strong>Au</strong>(233) must be exactly the orientation corresponding <strong>to</strong> the<br />
smallest terraces found on both <strong>Au</strong>(455) <strong>and</strong> <strong>Au</strong>(577) [52]. For <strong>Au</strong>(455) STM images reveal<br />
that the faceted morphology presents a super-periodicity <strong>of</strong> about 180 nm (see figure 9(a)).<br />
The extent <strong>of</strong> each phase is found, using statistical analysis <strong>of</strong> STM images, <strong>to</strong> be 80 nm for the<br />
10.0 ◦ phase <strong>and</strong> 100 nm for the 4.0 ◦ phase. For <strong>Au</strong>(577) the period was found <strong>to</strong> be 260 nm<br />
<strong>and</strong> the extents LA <strong>and</strong> LB <strong>of</strong> phases A <strong>and</strong> B are LA = 80 nm <strong>and</strong> LB = 180 nm.<br />
2 δD<br />
δA δB
<strong>Self</strong>-<strong>ordering</strong> <strong>of</strong> <strong>Au</strong>(<strong>111</strong>) <strong>vicinal</strong> <strong>surfaces</strong> <strong>and</strong> <strong>application</strong> <strong>to</strong> nanostructure organized growth S3375<br />
(a) (b)<br />
(c)<br />
78 nm 40 nm<br />
2000 nm<br />
Figure 10. STMimages <strong>of</strong> the <strong>Au</strong>(12, 11, 11) surface. (a) STM image <strong>of</strong> one <strong>vicinal</strong> facet (large<br />
terraces) <strong>of</strong> the <strong>Au</strong>(12, 11, 11). (b) STM image <strong>of</strong> the other <strong>vicinal</strong> facet (small terraces) <strong>of</strong> <strong>Au</strong>(12,<br />
11, 11). (c) 3D view <strong>of</strong> <strong>Au</strong>(12, 11, 11) faceted morphology.<br />
(a) (b) (c)<br />
32 nm 53 nm 53 nm<br />
Figure 11. STM images <strong>of</strong> the <strong>Au</strong>(12, 11, 11) surface where the corrugation due <strong>to</strong> the terrace<br />
levels has been subtracted in order <strong>to</strong> enhanced the surface reconstruction. (a) Small terrace <strong>vicinal</strong><br />
facet: one discommensuration line is running parallel <strong>to</strong>the steps. (b) Large terraces next <strong>to</strong> small<br />
ones. The reconstruction on the large terraces exhibits a ‘viaduct’ pattern. (c) Large terraces away<br />
from the border with small terraces. The reconstruction pattern induces a periodic super-kink array.<br />
It is worth noting that the 4.0 ◦ orientational phase is close <strong>to</strong> the previous (788)<br />
surface. Moreover, all terraces <strong>of</strong> this phase are found <strong>to</strong> be reconstructed with lines <strong>of</strong><br />
discommensurations crossing the steps perpendicularly. This has been demonstrated using<br />
STM images, LEED patterns [29] <strong>and</strong> GIXD [26]. Each <strong>vicinal</strong> facet gives rise <strong>to</strong> a specific<br />
splitting <strong>of</strong> LEED spots at a given energy, as expected for a uniformly stepped surface. As<br />
aconsequence, diffraction spots for the faceted morphology are indeed quadruplets as in<br />
figures 9(c) <strong>and</strong> (d). The spacing <strong>of</strong> inner spots (respectively outer spots) reflects the <strong>vicinal</strong><br />
period <strong>of</strong> phase 1 (respectively phase 2). In addition, figures 9(c) <strong>and</strong> (d) show that satellites<br />
<strong>of</strong> phase 1 spots are visible along the [0¯11]direction. The related period in real space is about<br />
7nm. This reconstruction is consistent both with what is observed on <strong>Au</strong>(<strong>111</strong>) surface STM<br />
images [34, 45], where the {<strong>111</strong>} steps are crossedperpendicularly by the discommensuration<br />
lines, <strong>and</strong> the findings <strong>of</strong> the stable reconstructed <strong>Au</strong>(788) <strong>and</strong> <strong>Au</strong>(11, 12, 12) <strong>surfaces</strong>.<br />
4.2.2. Results on <strong>vicinal</strong>s with {100} step edges. Let us first examine the morphology <strong>of</strong> a<br />
<strong>vicinal</strong> surface misoriented <strong>to</strong>wards [2¯1¯1] by a 2.38 ◦ angle. The <strong>Au</strong>(12, 11, 11) surface phase<br />
separates in<strong>to</strong> two different stepped areas forming a hill-<strong>and</strong>-valley morphology. The long<br />
range order distance <strong>of</strong> the hill-<strong>and</strong>-valley structure is about 500 nm, as shown in figure 10(c).<br />
Zooming in<strong>to</strong> the facets exhibits that both facets are reconstructed <strong>vicinal</strong> portions with different<br />
terrace widths (see figures 10(a) <strong>and</strong> (b)). The smallest terraces which display a 〈L〉 =4.56 nm<br />
average exhibit a white line <strong>of</strong> higher corrugationinthe middle <strong>of</strong> each terrace, <strong>and</strong> parallel <strong>to</strong><br />
the step edge (see figure 11(a)). This reconstruction is in remarkable agreement with findings
S3376 SRousset et al<br />
(a) (b)<br />
240 nm 70 nm<br />
Figure 12. STM images <strong>of</strong> the <strong>Au</strong>(433) faceted surface. (a) Large scale STM image <strong>of</strong> <strong>Au</strong>(433).<br />
Only the super-periodicity is resolved at this scale. (b) STM image <strong>of</strong> a smaller <strong>Au</strong>(433) area where<br />
all a<strong>to</strong>mic steps are clearly seen.<br />
on the interaction between steps <strong>and</strong> reconstruction deduced from STM images taken on a<br />
<strong>Au</strong>(<strong>111</strong>) surface (see section 3).<br />
The largest terraces found on the <strong>Au</strong>(12, 11, 11) faceted morphology have an 〈L〉 =<br />
8.23 nm average width, corresponding <strong>to</strong> a 1.6 ◦ misorientation with respect <strong>to</strong> (<strong>111</strong>). Their<br />
a<strong>to</strong>mic structure is quite complicated. Two different structures have been observed in the same<br />
conditions. The first one (see figure 11(b)) consists in one line parallel <strong>to</strong> the steps <strong>and</strong> followed<br />
by periodic arches. We will refer <strong>to</strong> it as the ‘viaduct’ structure. Such a structure is found in the<br />
vicinity <strong>of</strong> a facet edge. The second structure (seefigure 11(c)) was not reported before, but it<br />
is a nice example <strong>of</strong> what patterns are formed in order <strong>to</strong> minimize the sum <strong>of</strong> the surface <strong>and</strong><br />
step energies. Indeed, the ‘viaduct’ structure does not transform many portions <strong>of</strong> {100} in<strong>to</strong><br />
{<strong>111</strong>} micr<strong>of</strong>acets. In order <strong>to</strong> change a larger proportion <strong>of</strong> steps, the discommensuration line<br />
should cross a {100} step edge. However, we have never observed such a crossing. Instead, the<br />
steps are faceted by presenting periodic super-kinks made <strong>of</strong> {<strong>111</strong>} micr<strong>of</strong>acets large enough<br />
<strong>to</strong> be crossed by a stacking fault line. The complete structure <strong>of</strong> this reconstruction is difficult<br />
<strong>to</strong> describe accurately but it leads <strong>to</strong> an almost complete transformation <strong>of</strong> the {100} step edge<br />
in<strong>to</strong> a less energetic {<strong>111</strong>} step edge.<br />
Increasing the misorientation angles, we have investigated two <strong>vicinal</strong>s <strong>Au</strong>(11, 9, 9) <strong>and</strong><br />
<strong>Au</strong>(433) whose angles are between 4 ◦ <strong>and</strong> 9 ◦ .The first surprising result is that, although two<br />
different terrace widths are found all over the surface, a very small faceting periodicity is found.<br />
For<strong>Au</strong>(433), one large terrace (width wA = 4.0nm)separatesonaverage six steps so that the<br />
overall morphology displays a periodicity <strong>of</strong> D = 11.5nm(seefigure 12). The short terraces<br />
display a 1.4 nm average width. For <strong>Au</strong>(11, 9, 9) a stable morphology is found consisting <strong>of</strong><br />
aperiodic succession (period about 7 nm) <strong>of</strong> one large terrace (width wA = 4.2nm)followed<br />
by one or two short terraces (wB = 1.4 nm) (see figure 13). Short terraces both in <strong>Au</strong>(433)<br />
<strong>and</strong> <strong>Au</strong>(11, 9, 9) have the same value consistent with that <strong>of</strong> <strong>Au</strong>(755) which has been found<br />
<strong>to</strong> be stable. The interpretation <strong>of</strong> the presence <strong>of</strong> larger terraces which are <strong>of</strong> similar width<br />
for these two <strong>surfaces</strong> but also very close <strong>to</strong> the value <strong>of</strong> the smallest terraces <strong>of</strong> the faceted<br />
<strong>Au</strong>(12, 11, 11) was not straightforward since no reconstruction was seen on STM images <strong>of</strong><br />
both <strong>Au</strong>(433) <strong>and</strong> <strong>Au</strong>(11, 9, 9). GIXD was the most powerful technique in determining the<br />
exact a<strong>to</strong>mic structure in this case, as explained below.<br />
The presence or not <strong>of</strong> a reconstruction on <strong>Au</strong>(11, 9, 9) was resolved by GIXD<br />
measurements [2]. We used the hexagonal (HKL)coordinate system convenient for the (<strong>111</strong>)
<strong>Self</strong>-<strong>ordering</strong> <strong>of</strong> <strong>Au</strong>(<strong>111</strong>) <strong>vicinal</strong> <strong>surfaces</strong> <strong>and</strong> <strong>application</strong> <strong>to</strong> nanostructure organized growth S3377<br />
(a)<br />
(d)<br />
(e)<br />
(b) (c)<br />
fcc<br />
{100} {<strong>111</strong>}<br />
fcc<br />
hcp<br />
discommensuration<br />
line<br />
Figure 13. Morphology <strong>and</strong> a<strong>to</strong>mic structure <strong>of</strong> <strong>Au</strong>(11, 9, 9). (a) Large scale STM image <strong>of</strong> <strong>Au</strong>(11,<br />
9, 9). The area is 200 nm × 200 nm, where about 40 super-periods are clearly visible. A<strong>to</strong>mic<br />
steps are not resolved. (b) STM image <strong>of</strong> a smaller <strong>Au</strong>(11, 9, 9) area (40 nm × 40 nm) taken<br />
under UHV where all a<strong>to</strong>mic steps are clearly seen. (c) L positions versus H <strong>of</strong> the main peaks<br />
observed in the H -scans at K = 2. Straight lines are guides <strong>to</strong> the eyes. (d) The open circles<br />
display typical GIXD H -scans recorded at anti-Bragg conditions but for different values <strong>of</strong> K <strong>and</strong><br />
L. Lines display the calculated spectra deduced from our model. (e) Schematic <strong>to</strong>p view (upper<br />
part) <strong>and</strong> side view (lower part) <strong>of</strong> the a<strong>to</strong>mic structure showing the surface reconstruction on the<br />
large terrace. The {100} step (respectively {<strong>111</strong>} step) has been highlighted by a white rectangle<br />
(respectively triangle). The stacking sequence <strong>of</strong> <strong>to</strong>pmost a<strong>to</strong>ms, hcp or fcc, is indicated above<br />
each terrace.<br />
fcc terrace structure [26], recalled in section 2. Performing H -scans (scans perpendicular <strong>to</strong><br />
the step edge) at different L-values (the L-direction is perpendicular <strong>to</strong> the terraces) reveals<br />
that all diffraction rods are parallel <strong>and</strong> oriented perpendicular <strong>to</strong> the macroscopic surface<br />
(see figure 13(c)). The slope <strong>of</strong> the rods (5.7 ◦ )<strong>and</strong>thedistance between them giving a<br />
periodicity <strong>of</strong> 6.9 nm are both consistent with the expected morphology shown in figure 13(b).<br />
However, experimental spectra, all obtained by scanning in the anti-phase conditions but at<br />
different positions <strong>of</strong> the reciprocal space, drastically differ in their intensity distribution (see<br />
figure 13(d)). On the <strong>Au</strong>(11, 9, 9) surface, we did not observe any satellite peak characteristic<br />
<strong>of</strong> the usual <strong>Au</strong>(<strong>111</strong>)-22 × √ 3reconstruction. Following our findings on the interaction<br />
between steps <strong>and</strong> reconstruction on a <strong>Au</strong>(<strong>111</strong>) surface, we developed an a<strong>to</strong>mic model <strong>of</strong> the<br />
surface in order <strong>to</strong> reproduce the GIXD spectra. This model includes a discommensuration<br />
line parallel <strong>to</strong> the step edges on the larger terraces, which respects the surface symmetry<br />
but which is not in any usual direction known for the 22 × √ 3reconstruction. This line<br />
is similar <strong>to</strong> what is observed on the small terraces <strong>of</strong> the faceted <strong>Au</strong>(12, 11, 11) surface<br />
(see figures 11(a) <strong>and</strong> (b)). In our model, a<strong>to</strong>ms <strong>of</strong>the large terraces which are near the<br />
descending step are in hcp sites whereas those near the ascending step are in fcc sites (see<br />
figure 13(e)). The smaller terraces remain unreconstructed. Our model also includes two<br />
different arrangements found within the super-period, i.e. whether the large terrace is followed<br />
fcc
S3378 SRousset et al<br />
by one (structure 1) or two (structure 2) short terraces (see figure 13(b)). The terrace widths w1<br />
<strong>and</strong> w2,aswell as the proportion p <strong>of</strong> structure 2, have been determined by statistics over STM<br />
images. The proportion p <strong>of</strong> structure 2 is found <strong>to</strong> be about 70%. Thus, the model contains<br />
three parameters: the correlation coefficient q <strong>of</strong> the <strong>ordering</strong> between the two structures<br />
(q = 0corresponds <strong>to</strong> completely segregated phases <strong>and</strong> q = 1corresponds <strong>to</strong> a r<strong>and</strong>om<br />
mixturebetween the two structures), the width <strong>and</strong> the position <strong>of</strong> the discommensuration line.<br />
As shown in figure 13(d), the introduction <strong>of</strong> the discommensuration line accounts for the<br />
strongly different spectra obtainedinthe anti-phase condition, <strong>and</strong> the agreement between the<br />
experimental data (open circle) <strong>and</strong> the calculatedspectra (full curve) is excellent. Parameters<br />
deduced from the calculations are the following: q = 0.45, the discommensuration line width<br />
is six a<strong>to</strong>ms <strong>and</strong> the fcc (respectively hcp) stacking domain on the large terrace contains seven<br />
(respectively five) a<strong>to</strong>mic rows (see figure 13(e)). Although this reconstruction is unusual, it<br />
is again consistent with previous works on the <strong>Au</strong>(<strong>111</strong>) surface [45]: a discommensuration<br />
line is systematically observed parallel <strong>to</strong> the step edge at the bot<strong>to</strong>m <strong>of</strong> {100} steps whereas<br />
{<strong>111</strong>} steps are always crossed by discommensuration lines. This was interpreted by a step<br />
energy minimization. This effect is even more important in the case <strong>of</strong> the <strong>Au</strong>(11, 9, 9) surface.<br />
Indeed, the descending step edges <strong>of</strong> the larger terraces are transformed in<strong>to</strong> {<strong>111</strong>} step edges<br />
(see figure 13(e)) which is known <strong>to</strong> be energetically favourable. The particular behaviour<br />
<strong>of</strong> the reconstruction is thus strongly governed by step energetic arguments. It should also<br />
be mentioned that the existence <strong>of</strong> such stacking fault lines has been suggested on a Pt(<strong>111</strong>)<br />
<strong>vicinal</strong> surface with {100} steps [53].<br />
4.3. Summary <strong>of</strong> <strong>Au</strong>(<strong>111</strong>) <strong>vicinal</strong> morphology<br />
Both the mesoscopic order (periodically faceted or not) <strong>and</strong> the a<strong>to</strong>mic structure (reconstructed<br />
terraces or not) are elucidated on all <strong>surfaces</strong>.<br />
The determination <strong>of</strong> a<strong>to</strong>mic structure on each terrace is one <strong>of</strong> the most crucial issues.<br />
Results described above suggest that there is a critical angle θc such that for θ > θc stable<br />
<strong>vicinal</strong>s are not reconstructed,whereas for θ
<strong>Self</strong>-<strong>ordering</strong> <strong>of</strong> <strong>Au</strong>(<strong>111</strong>) <strong>vicinal</strong> <strong>surfaces</strong> <strong>and</strong> <strong>application</strong> <strong>to</strong> nanostructure organized growth S3379<br />
small <strong>to</strong> be real thermodynamic phases. We try <strong>to</strong> elucidate this point in the next section by<br />
developing models for faceting in <strong>Au</strong>(<strong>111</strong>) <strong>vicinal</strong>s.<br />
5. Microscopic origin <strong>of</strong> faceting in <strong>Au</strong>(<strong>111</strong>) <strong>vicinal</strong> <strong>surfaces</strong><br />
In this section, we will explain that the reason for faceting <strong>of</strong> {100} micr<strong>of</strong>aceted stepped<br />
<strong>surfaces</strong> is mainly the terrace energy modulation explained by an FK model, whereas we<br />
suggest that faceting <strong>of</strong> {<strong>111</strong>} micr<strong>of</strong>aceted stepped <strong>surfaces</strong> is due <strong>to</strong> a competition between<br />
the step energy term <strong>and</strong> the terrace energy term. In these models the reconstruction is always<br />
the driving force for the faceting transition but the exact a<strong>to</strong>mic structure is linked <strong>to</strong> the<br />
different models.<br />
5.1. Frenkel–Kon<strong>to</strong>rova model <strong>of</strong> faceting for <strong>vicinal</strong>s with {100} step edges<br />
In the case <strong>of</strong> {100} step <strong>vicinal</strong> <strong>surfaces</strong>, we have found the existence <strong>of</strong> either one terrace<br />
or a complete <strong>vicinal</strong> area showing a reconstruction with one discommensuration line parallel<br />
<strong>to</strong> each step. This occurs when the terrace width is about 4 nm (4.2 nm on <strong>Au</strong>(11, 9, 9) <strong>and</strong><br />
4.6 nm on <strong>Au</strong>(12, 11, 11)). Now we justify the stability <strong>of</strong> such a phase by thermodynamics<br />
arguments.<br />
Since the microscopic structure <strong>of</strong> the discommensuration line (see figure 13(e)) found<br />
on <strong>Au</strong>(11, 9, 9) consists <strong>of</strong> a purely uniaxial compression in the direction perpendicular <strong>to</strong> the<br />
step edges, it allows us <strong>to</strong> develop a one-dimensional model <strong>to</strong> explain the faceting properties.<br />
The stressed terrace energy per unit area E1 is calculated as a function <strong>of</strong> the terrace width<br />
L using an FK model [36, 54]. For simplicity, we have assumed that hcp <strong>and</strong> fcc sites are<br />
equidistant <strong>and</strong> energetically equivalent. Furthermore, we consider the asymp<strong>to</strong>tic case <strong>of</strong><br />
infinite spring strengths, whose validity has been discussed in previous work [55]. In this case,<br />
the only boundary condition is that the first a<strong>to</strong>m <strong>of</strong> the FK chain is fixed in a trough <strong>of</strong> the<br />
substrate potential (corresponding <strong>to</strong> the first a<strong>to</strong>m which is not a surface a<strong>to</strong>m as shown in<br />
the inset <strong>of</strong> figure 14). Since the fundamental FK parameter P0 [36] which defines the misfit<br />
between the surface <strong>and</strong> the bulk a<strong>to</strong>ms is not known for the <strong>Au</strong>(11, 9, 9) reconstruction, we<br />
assume that the a<strong>to</strong>mic surface density should be similar <strong>to</strong> the <strong>Au</strong>(<strong>111</strong>) reconstructed surface<br />
<strong>and</strong> thus we take P0 = 22. The graph <strong>of</strong> E1, showninfigure 14, displays several minima<br />
which correspond <strong>to</strong> terrace widths locked by the reconstruction. For a <strong>vicinal</strong> surface, the<br />
surface energy per unit area also includes the step energy cost E2 = B/L <strong>and</strong> the repulsive<br />
elastic interaction energy between steps, E3 = C/L 3 . These contributions, where B <strong>and</strong> C<br />
have been deduced from the experimental data <strong>of</strong> Wang <strong>and</strong> Wynblatt [22], are also shown<br />
in figure 14. The curve <strong>of</strong> the <strong>to</strong>tal energy per unit area E clearly displays an additional<br />
minimum associated with unreconstructed terraces, 1.4 nm wide. Finally, the <strong>to</strong>tal energy<br />
curve is not convex <strong>and</strong> the tie bar construction applied <strong>to</strong> a <strong>Au</strong>(11, 9, 9) surface predicts<br />
that a phase separation will occur between one reconstructed phase composed <strong>of</strong> 6.5 nm wide<br />
terraces with a discommensuration line parallel <strong>to</strong>the steps <strong>and</strong> a non-reconstructed phase<br />
with terraces 1.4 nm wide. This is indeed in good agreement with our observations. The<br />
value <strong>of</strong> the reconstructed terraces could certainly be improved by taking in<strong>to</strong> account the real<br />
shape <strong>of</strong> the potential <strong>and</strong> the non-asymp<strong>to</strong>tic case. However, as P0 is not perfectly known,<br />
we believe that this simple feature gives all the physical arguments for the underst<strong>and</strong>ing <strong>of</strong><br />
faceting. In particular, it is in good agreement with the finding that the <strong>Au</strong>(322) is a stable<br />
non-reconstructed surface. Indeed, the value for the non-reconstructed terrace width is less<br />
sensitive than reconstructed terrace width <strong>to</strong> refinements in E1.<br />
The model predicts the instability <strong>of</strong> the <strong>Au</strong>(12, 11, 11) surface. The surface should<br />
separate in<strong>to</strong> two reconstructed phases: (i) small terraces with one line <strong>of</strong> discommensuration,
S3380 SRousset et al<br />
E/L(eV/Å)<br />
P(s)<br />
0,03<br />
0,02<br />
0,01<br />
6.5 nm<br />
<strong>Au</strong>(11,9,9)<br />
1.4 nm<br />
0,00<br />
0,00 0,02 0,04 0,06 0,08 0,10 0,12<br />
3<br />
2<br />
1<br />
Large terraces<br />
0<br />
0,0 0,5 1,0<br />
s<br />
1,5 2,0<br />
1/L(Å -1 )<br />
P(s)<br />
2<br />
1<br />
Small terraces<br />
0<br />
0,0 0,5 1,0<br />
s<br />
1,5 2,0<br />
Figure 14. Upper part: calculated energy E per unit area <strong>of</strong> a <strong>Au</strong>(<strong>111</strong>) <strong>vicinal</strong> surface with {100}<br />
steps. We have also drawn the stressed terrace energy E1,thestepenergy contribution E2 <strong>and</strong> the<br />
the energy E3 due <strong>to</strong> the elastic interaction between steps. E1 is calculated using the FK model<br />
schematically represented in the inset. The tie construction which explains the <strong>vicinal</strong> surface<br />
faceting behaviour is also indicated. Lower part: experimental terrace width distribution measured<br />
for the large <strong>and</strong> small terraces found on <strong>Au</strong>(11, 9, 9).<br />
<strong>and</strong> (ii) large terraces with two lines. The first phase is indeed observed (see figure 11(a)).<br />
The model therefore enables us <strong>to</strong> predict the stability <strong>of</strong> the (988) surface with one<br />
discommensuration line parallel <strong>to</strong> the steps oneach terrace. However, the observed a<strong>to</strong>mic<br />
structure <strong>of</strong> the large terraces on the faceted <strong>Au</strong>(12, 11, 11) is more complicated as seen in<br />
figures 11(b) <strong>and</strong> (c). We have explained it by a minimization <strong>of</strong> step energy which is not taken<br />
in<strong>to</strong> account in our model. Furthermore, our model is purely one dimensional, whereas larger<br />
terraces display a 2D pattern for the reconstruction.<br />
Finally, another remark concerns the prediction <strong>of</strong> themodel compared <strong>to</strong> experimental<br />
measurements. We want <strong>to</strong> point out that the twolocal minima 6.5 <strong>and</strong> 1.4 nm associated<br />
with the tie bar construction discussed above do not have the same physical origin. One is<br />
clearly associated with a magic <strong>vicinal</strong> locking since it corresponds <strong>to</strong> a local minimum in the<br />
FK curve. On the other h<strong>and</strong>, the second minimum (at 1.4 nm) is just due <strong>to</strong> the competition<br />
between E1 <strong>and</strong> E2. Therefore, the convexity <strong>of</strong> these two minima is not the same. This effect<br />
can be seen experimentally studying the terrace width fluctuations [56]. One can observe that<br />
the smaller terraces have larger fluctuations than the larger terraces (see figure 14). This is<br />
in agreement with the fact that the second derivative <strong>of</strong> the <strong>to</strong>tal energy curve for the first<br />
minimum is smaller than for the second one.
<strong>Self</strong>-<strong>ordering</strong> <strong>of</strong> <strong>Au</strong>(<strong>111</strong>) <strong>vicinal</strong> <strong>surfaces</strong> <strong>and</strong> <strong>application</strong> <strong>to</strong> nanostructure organized growth S3381<br />
As aconclusion, this simple model gives all the physical arguments for underst<strong>and</strong>ing<br />
the faceting phenomena <strong>and</strong> gives a reasonable quantitative agreement with the experiment.<br />
It definitively explains the value for the unreconstructed terrace width. The stability <strong>and</strong> the<br />
a<strong>to</strong>mic structure <strong>of</strong> the (988) surface is also clearly unders<strong>to</strong>od within this model. More<br />
generally, it is the first time that a purely analytical model <strong>of</strong> FK type has given a good<br />
description for faceting phenomena. Furthermore, this approach explains the close relationship<br />
between the microscopic surface structure <strong>and</strong> the faceting process in order <strong>to</strong> underst<strong>and</strong> how<br />
the reconstruction can lock some terrace widths.<br />
5.2. Model <strong>of</strong> faceting for <strong>vicinal</strong>s with {<strong>111</strong>} step edges<br />
In the case <strong>of</strong> {<strong>111</strong>} step <strong>vicinal</strong> <strong>surfaces</strong>, reconstructed terraces consist in discommensuration<br />
lines crossing the step perpendicularly <strong>to</strong> the step edges. The step lattice breaks the symmetry<br />
<strong>of</strong> the three possible domains known for the 22 × √ 3reconstruction <strong>and</strong> one only is stabilized.<br />
We have <strong>to</strong> note that the stress relief associated with the reconstruction occurs in the direction<br />
parallel <strong>to</strong> the steps <strong>and</strong> we do not expect any modulation <strong>of</strong> the reconstructed terrace energy<br />
as a function <strong>of</strong> its width. Therefore, instead <strong>of</strong> the previous FK model, we will rather consider<br />
the one initially proposed by Williams <strong>and</strong> Jeong [57, 14] in order <strong>to</strong> explain the faceting <strong>of</strong> Si<br />
(<strong>111</strong>) <strong>vicinal</strong> <strong>surfaces</strong> driven by the (7 × 7) reconstruction. This model is well suited when the<br />
reference plane exists in two different structural phases (here the 22 × √ 3reconstruction <strong>and</strong><br />
the (1 × 1) terraces, respectively for large <strong>and</strong> small terraces). Each phase can individually be<br />
described by a curve <strong>of</strong> the form <strong>of</strong> equation (1) without the quadratic term <strong>and</strong> with different<br />
values <strong>of</strong> the parameters. Thus, we write<br />
<strong>and</strong><br />
γR(θ) = γ0,R + βR<br />
h | tan θ| + gR| tan θ| 3<br />
γNR(θ) = γ0,NR + βNR<br />
h | tan θ| + gNR| tan θ| 3<br />
(3)<br />
where R <strong>and</strong> NR identify respectively the reconstructed <strong>and</strong> non-reconstructed phases.<br />
γ0,R βNR,the free energy curves intersect each other. This<br />
means that the existence <strong>of</strong> the reconstruction increases the step free energy. Since steps are<br />
crossed by the reconstruction, their a<strong>to</strong>mic structure is disturbed <strong>and</strong> therefore it is reasonable<br />
<strong>to</strong> assume that their energy can only increase. Indeed, without the reconstruction, the steps<br />
have the lowest step energy due <strong>to</strong> their initial {<strong>111</strong>} micr<strong>of</strong>aceted structure. More generally,<br />
since a step is a one-dimensional object, compared <strong>to</strong> a surface which is two dimensional, it<br />
can be assumed that the a<strong>to</strong>mic rearrangement leading <strong>to</strong> a minimization <strong>of</strong> the free energy<br />
<strong>of</strong> the surface does not lower the step energy. As a result, the two curves intersect each other<br />
<strong>and</strong> the envelope <strong>of</strong> the two curves loses overall convexity. Thus phase separation will occur<br />
between two phases determined by the usual tie bar construction as illustrated in figure 15,<br />
where the parameter values have been calculated in order <strong>to</strong> describe both the stability <strong>of</strong> the<br />
<strong>Au</strong>(788) <strong>and</strong> the instability <strong>of</strong> the <strong>Au</strong>(455) surface.<br />
Taking the value gR = gNR = 68 meV Å−2 fitted from the gold crystallite equilibrium<br />
shape [22], we deduce the value <strong>of</strong> γ0 = γ0,NR −γ0,R <strong>and</strong> β = βR −βNR which allows us <strong>to</strong><br />
describe a phase transition in<strong>to</strong> a θA = 4.0◦ <strong>vicinal</strong> phase <strong>and</strong> a θB = 10.0◦ <strong>vicinal</strong> phase with<br />
(2)
S3382 SRousset et al<br />
γ (meV.A -2 )<br />
90<br />
85<br />
<strong>Au</strong>(788)<br />
γ NR<br />
γ R<br />
<strong>Au</strong>(455)<br />
0,0 0,1<br />
tan( θ)<br />
0,2<br />
Figure 15. Surface energy as a function <strong>of</strong> the step density. The full line represents the energy <strong>of</strong><br />
a non-reconstructed surface <strong>and</strong> the dotted line represents the energy <strong>of</strong> a reconstructed surface.<br />
respect <strong>to</strong> the (<strong>111</strong>) orientation. Resolving the geometric equation for the tie bar condition,<br />
we find<br />
<strong>and</strong><br />
γ0 = 2g(tan 3 θB − tan 3 θA) (4)<br />
β = 3gh(tan 2 θB − tan 2 θA). (5)<br />
h = 2.35 Å is the mona<strong>to</strong>mic step height on a <strong>Au</strong>(<strong>111</strong>) surface. γ0 = 0.7 meVÅ −2 <strong>and</strong><br />
β = 12.5 meVÅ −1 are found. These values depend on g, forwhichthevaluecan be<br />
discussed. From the fit <strong>of</strong> the equilibrium shape <strong>of</strong> gold crystallites, γ0 = 84 meV Å −2 <strong>and</strong><br />
β = 80 meV Å −1 . The gain in surface energy due <strong>to</strong> the reconstruction is very small but<br />
consistent with previous investigations [58, 59]. It is worth noting that this experimental value<br />
does not take in<strong>to</strong> account the further energy minimization due <strong>to</strong> the secondary herringbone<br />
reconstruction [39]. The variation in step energyismuchhigher <strong>and</strong> thus raises the question<br />
<strong>of</strong> why the discommensuration lines cross these step edges. We have already shown that in<br />
the case <strong>of</strong> {100} steps, modifying locally the reconstruction leads <strong>to</strong> a decrease <strong>of</strong> the step<br />
energy. In the case <strong>of</strong> {<strong>111</strong>} steps, in order <strong>to</strong>decrease the step energy, the lines have <strong>to</strong> avoid<br />
the step edge in the upper terrace <strong>to</strong>gether within the lower terrace (non-reconstructed {<strong>111</strong>}<br />
step). But this will cost surface free energy, <strong>and</strong> therefore a fine balance between the step<br />
energy <strong>and</strong> the surface energy will take place, which is not taken in<strong>to</strong> account precisely in<br />
our model. Finally, the values found for γ0 <strong>and</strong> β sound reasonable <strong>and</strong> we believe that<br />
the mechanism explained above is responsible for the faceting <strong>of</strong> {<strong>111</strong>} step <strong>vicinal</strong> <strong>surfaces</strong>.<br />
Experimental determination or calculation for γ0 <strong>and</strong> β would validate or disprove this<br />
model.<br />
6. Phase diagram <strong>and</strong> magic <strong>vicinal</strong>s<br />
Combining knowledge from experimental observations on <strong>Au</strong>(<strong>111</strong>) <strong>vicinal</strong> <strong>surfaces</strong> <strong>and</strong> models<br />
for the origin <strong>of</strong> faceting, we can summarize the stability <strong>of</strong> <strong>surfaces</strong> misoriented between 2 ◦<br />
<strong>and</strong> 12 ◦ in two opposite azimuths. Of course, we are not considering a real phase diagram<br />
in the sense that we have not studied the morphology temperature dependence. Thus, what
<strong>Self</strong>-<strong>ordering</strong> <strong>of</strong> <strong>Au</strong>(<strong>111</strong>) <strong>vicinal</strong> <strong>surfaces</strong> <strong>and</strong> <strong>application</strong> <strong>to</strong> nanostructure organized growth S3383<br />
we call stable is the morphology obtained after the in situ preparation described above. We<br />
believe this is representative <strong>of</strong> an equilibrium morphology obtained at 700 K.<br />
When the <strong>surfaces</strong> are cut <strong>to</strong>wards [2¯1¯1],exhibiting {100} micr<strong>of</strong>aceted steps, due <strong>to</strong> the<br />
FK model, only a few <strong>surfaces</strong> are stable between 1.7 ◦ <strong>and</strong> 11.4 ◦ :<strong>Au</strong>(755) <strong>and</strong> <strong>Au</strong>(322) are<br />
not reconstructed, whereas <strong>Au</strong>(988) <strong>and</strong> <strong>Au</strong>(17, 16, 16) are reconstructed. For <strong>Au</strong>(988), the<br />
reconstruction consists in one single line <strong>of</strong> discommensuration parallel <strong>to</strong> the steps located<br />
almost in the middle <strong>of</strong> each terrace.<br />
This means that the majority <strong>of</strong> <strong>surfaces</strong> are unstable <strong>and</strong> will present a faceted morphology<br />
under the st<strong>and</strong>ard preparation in UHV. We expect that <strong>surfaces</strong> misoriented by a <strong>vicinal</strong> angle<br />
between 1.7 ◦ <strong>and</strong> 3.2 ◦ will separate in<strong>to</strong> two reconstructed <strong>vicinal</strong> portions whose angles are<br />
1.7 ◦ <strong>and</strong> 3.2 ◦ . Due <strong>to</strong> the possible number <strong>of</strong> a<strong>to</strong>mic rows, this result concerns about 15<br />
different <strong>vicinal</strong> <strong>surfaces</strong>. When the angle <strong>of</strong> misorientation lie between 3.2 ◦ <strong>and</strong> 9.4 ◦ ,there<br />
is evidence that the surface will separate in<strong>to</strong> area with terraces similar <strong>to</strong> the terraces <strong>of</strong> the<br />
(988) surface <strong>and</strong> a area with non-reconstructed terraces similar <strong>to</strong> the terraces <strong>of</strong> the (755)<br />
surface.<br />
In the opposite azimuth, the model proposed for explaining the faceting phenomena<br />
is different. The instability diagram is restricted between 4.0 ◦ <strong>and</strong> 10.0 ◦ . We expect<br />
that all <strong>vicinal</strong>s between 4.0 ◦ <strong>and</strong> 2.3 ◦ (<strong>Au</strong>(11, 12, 12)) are stable <strong>and</strong> reconstructed with<br />
discommensuration lines crossing the steps perpendicularly as observed for the (788) <strong>and</strong> (11,<br />
12, 12) <strong>surfaces</strong>. This corresponds <strong>to</strong> about ten different <strong>vicinal</strong>s. The 4.0 ◦ surface should be<br />
stable but as far as we know it has not yet been observed. This nominal (677) surface should<br />
display two a<strong>to</strong>mic rows less than the (788). On the other h<strong>and</strong>, all <strong>vicinal</strong>s steeper than the<br />
(233) surface should be stable <strong>and</strong> unreconstructed. Our model also predicts that <strong>surfaces</strong><br />
below 2.3 ◦ are stable. However, for a low miscut angle, we expect <strong>to</strong> find the herringbone<br />
structure <strong>of</strong> the <strong>Au</strong>(<strong>111</strong>) reconstruction. The energy minimization associated with this structure<br />
may lead <strong>to</strong> some faceting phenomena which are not included in our model <strong>and</strong>, therefore, we<br />
cannot make any reliable predictions for miscut smaller than 2.3 ◦ .<br />
Let us compare these results with what is known on the stability <strong>of</strong> <strong>Au</strong>(<strong>111</strong>) <strong>vicinal</strong>s.<br />
If we compare with observations <strong>of</strong> equilibrium shape, we cannot explain the discontinuity<br />
angle at the sharp edges <strong>of</strong> the <strong>Au</strong>(<strong>111</strong>) facet. This angle has been found <strong>to</strong> be either 15 ◦ by<br />
Heyraud <strong>and</strong> Me<strong>to</strong>is [60, 61], 19 ◦ by Wang <strong>and</strong> Wynblatt [22] or 21 ◦ more recently [23]. It is<br />
in any case much greater than the stable <strong>vicinal</strong> <strong>surfaces</strong> found here. This raises the question<br />
<strong>of</strong> the comparison between ECS <strong>and</strong> flat <strong>vicinal</strong> <strong>surfaces</strong>. Experiments performed on periodic<br />
annealed pr<strong>of</strong>iles have revealed the existence <strong>of</strong> stable facets whose angles are 3.7 ◦ <strong>and</strong> 11.7 ◦ .<br />
Although these angles are close <strong>to</strong> those <strong>of</strong> (322), (788) <strong>and</strong> (988) stable orientations, others<br />
are lacking for complete consistency. Maybe the resolution on such systems, both ECS <strong>and</strong><br />
periodic pr<strong>of</strong>iles, is not sufficient <strong>to</strong> identify all orientations. Also, as far as we know such<br />
experiments have not reported any differences related <strong>to</strong> the azimuths. Other magic <strong>Au</strong>(<strong>111</strong>)<br />
<strong>vicinal</strong>s have been predicted [62] or reported [25] but the azimuths were different.<br />
7. Mesoscopic self-<strong>ordering</strong> on <strong>Au</strong>(<strong>111</strong>) <strong>vicinal</strong> <strong>surfaces</strong><br />
7.1. Introduction<br />
<strong>Self</strong>-<strong>ordering</strong> on solid <strong>surfaces</strong> has been recognized as a promising alternative for growing<br />
uniform nanostructures with regular sizes <strong>and</strong> spacings [63, 64]. Despite the fact that a great<br />
variety <strong>of</strong> systems <strong>and</strong> geometries are concerned [65–67], long range elastic interaction is the<br />
common physical driving force <strong>of</strong> this phenomenon [68]. Spontaneous periodically faceted<br />
morphology has been reported for stepped <strong>surfaces</strong> at equilibrium [53, 1, 69, 57, 70, 29].<br />
In this case, the elastic strain field results from a discontinuity <strong>of</strong> the intrinsic surface stress
S3384 SRousset et al<br />
tensor which appears on the facet frontier [68, 44]. A theoretical prediction is that, in such<br />
<strong>surfaces</strong>, the period results from a compromise between the energy gain induced by bulk elastic<br />
relaxation <strong>and</strong> the local energy cost <strong>of</strong> the facet edges [44]. However, although a lot <strong>of</strong> work<br />
has been concentrated on elastic relaxations, little is known about boundary energy terms. The<br />
self-<strong>ordering</strong> <strong>of</strong> <strong>Au</strong>(<strong>111</strong>) <strong>vicinal</strong> <strong>surfaces</strong> provides a unique opportunity <strong>to</strong> point out the crucial<br />
role <strong>of</strong> the boundary energy cost.<br />
We have seen above that the mesoscopic order on these <strong>surfaces</strong> drastically varies with<br />
different <strong>vicinal</strong>s [29], ranging from 10 <strong>to</strong> 500 nm. We compare pairs <strong>of</strong> <strong>surfaces</strong> which are<br />
misoriented by a similar angle with respect <strong>to</strong> (<strong>111</strong>) but in opposite azimuths. This is the<br />
case for <strong>Au</strong>(11, 9, 9) <strong>and</strong> <strong>Au</strong>(455), for which the <strong>vicinal</strong> angle is about 6 ◦ .The<strong>Au</strong>(11, 9, 9)<br />
surface is misoriented by a 5.57 ◦ angle <strong>to</strong>wards the [2¯1¯1] azimuth, <strong>and</strong> presents {100} steps.<br />
The <strong>Au</strong>(455) surface is misoriented by a similar angle, 5.76 ◦ ,but <strong>to</strong>wards the opposite azimuth,<br />
thus it presents {<strong>111</strong>} steps. The faceting <strong>of</strong> these <strong>surfaces</strong> displays periodically faceted<br />
morphology with different periods: a 180 nm period is observed on <strong>Au</strong>(455) whereas a shorter<br />
7nmperiodisobtainedon<strong>Au</strong>(11,9,9). Thereisafac<strong>to</strong>r <strong>of</strong> 25 between both periods <strong>of</strong> faceting.<br />
In the following we examine how the a<strong>to</strong>mic structure interplays with the mesoscopic order<br />
using the elastic continuum model proposed by Marchenko [44].<br />
When a phase separation occurs on a <strong>vicinal</strong> surface, the discontinuities <strong>of</strong> the surface<br />
stress tensor at the edges between two facets generate lines <strong>of</strong> local forces which lead <strong>to</strong><br />
long range bulk elastic relaxations (see figure 16). Marchenko demonstrated that, in order<br />
<strong>to</strong> minimize the elastic energy, the surface morphology evolves <strong>to</strong>wards the lowest possible<br />
period. However, there is a competition between this elastic energy gain <strong>and</strong> the local edge<br />
energy cost, C1. Theorder <strong>of</strong> magnitude <strong>of</strong> the period is given by κ = 2πa exp (1+C1/C2),<br />
where a is an a<strong>to</strong>mic cut-<strong>of</strong>f distance, <strong>and</strong> C2 evaluates the bulk elastic relaxations [44].<br />
7.2. Elastic energy gain<br />
The first step is <strong>to</strong> evaluate the elastic energy gain C2. C2 = ((1 − ν 2 )F 2 )/(πY ) where ν is<br />
the Poisson ratio <strong>and</strong> Y is theYoung modulus. The force F per unit length exerted on the edge<br />
between two adjacent facets with different stresses σA <strong>and</strong> σB is F = σA + σB (see figure 16).<br />
The elastic energy gain is therefore related <strong>to</strong> the surface stress tensor <strong>of</strong> each facet forming the<br />
hill-<strong>and</strong>-valley structure. Molecular dynamics calculations have been performed in order <strong>to</strong><br />
evaluate the surface stress <strong>of</strong> <strong>vicinal</strong> <strong>surfaces</strong> versus the step density for both azimuths studied<br />
here. Results are shown in figure 17. This simulation does not take in<strong>to</strong> account surface<br />
reconstructions which are able <strong>to</strong> lower the surface stress. On <strong>Au</strong>(<strong>111</strong>), it has been found<br />
that the surface stress is 20% smaller on the reconstructed surface than on the unreconstructed<br />
surface [40]. Using the curves <strong>of</strong> figure 17, we can evaluate the forces located at the edges<br />
<strong>of</strong> facets on the <strong>Au</strong>(<strong>111</strong>) <strong>vicinal</strong>s studied here. Wetake the <strong>Au</strong>(<strong>111</strong>) surface stress value<br />
σ0 = 173 meV Å −2 [71] as reference, which has been calculated for a non-reconstructed<br />
surface. In the case where the terraces are reconstructed (i.e. <strong>Au</strong>(11, 9, 9) <strong>and</strong> <strong>Au</strong>(12, 11, 11)),<br />
we will take the value <strong>of</strong> the surface stress <strong>to</strong> be 20% lower. Knowing the crystallographic<br />
orientation <strong>of</strong> each facet, we can evaluate the elastic energy gain C2. Valuesarereported in<br />
table 3 (A denotes the less misoriented facet whereas B is the more misoriented one).<br />
7.3. Role <strong>of</strong> the edge energy in the mesoscopic order<br />
The elastic energy gain being evaluated, it isnownecessary <strong>to</strong> estimate the local edge energy<br />
cost C1. Wewill first calculate C1 for <strong>Au</strong>(455) <strong>and</strong> <strong>Au</strong>(11, 9, 9) which are the model <strong>surfaces</strong><br />
detailed here. The precise knowledge <strong>of</strong> the surface a<strong>to</strong>mic structure allows us <strong>to</strong> estimate the<br />
local energy cost C1 <strong>to</strong> insert one phase in<strong>to</strong> the other. This insertion is schematically shown
<strong>Self</strong>-<strong>ordering</strong> <strong>of</strong> <strong>Au</strong>(<strong>111</strong>) <strong>vicinal</strong> <strong>surfaces</strong> <strong>and</strong> <strong>application</strong> <strong>to</strong> nanostructure organized growth S3385<br />
Figure 16. Scheme for a faceted periodic morphology, showing the surface stresses <strong>of</strong> facets<br />
(from [29]).<br />
Variation <strong>of</strong> the surface stress with θ<br />
0.80<br />
0.60<br />
σ 100(θ)/σ(0)<br />
σ <strong>111</strong>(θ)/σ(0)<br />
0.40<br />
0.0 0.2 0.4<br />
tan θ<br />
0.6 0.8<br />
Figure 17. A<strong>to</strong>mistic calculations for the variation <strong>of</strong> the surface stress σ on <strong>vicinal</strong>s <strong>of</strong> <strong>Au</strong>(<strong>111</strong>)<br />
with miscut around the [1¯10] direction. (△) <strong>vicinal</strong>s with {<strong>111</strong>} steps, () <strong>vicinal</strong>s with {100}<br />
steps (from [29]).<br />
Table 3. Calculated surface stresses σA <strong>and</strong> σB for each faceted <strong>surfaces</strong>. From these values<br />
we deduce F, which is the force per unit length exerted on the facet edge <strong>and</strong> Celas which is the<br />
energetic character called C2 in the text.<br />
σA (meV Å −2 ) σB (meV Å −2 ) F (pN at. −1 ) Celas (meV Å −1 )<br />
<strong>Au</strong>(455) 149 126 115 0.3<br />
<strong>Au</strong>(11, 9, 9) 165 142 130 0.4<br />
<strong>Au</strong>(12, 11, 11) 170 165 29 0.02<br />
in figure 18 where step configurations are drawn before (upper part) <strong>and</strong> after (lower part) one<br />
phase has been inserted in<strong>to</strong> the other. By definition, C1 is the difference between the surface<br />
energies <strong>of</strong> the two configurations ignoring the elastic contribution, which is already taken<br />
in<strong>to</strong> account via the C2 parameter. The term <strong>of</strong> first order is the difference in step energies.
S3386 SRousset et al<br />
(a) (b)<br />
<strong>Au</strong>(4,5,5) <strong>Au</strong>(11,9,9)<br />
-<br />
[211]<br />
- -<br />
[211]<br />
Figure 18. Spontaneous periodic faceting <strong>of</strong> <strong>vicinal</strong>s with {<strong>111</strong>} steps (a) <strong>and</strong> <strong>vicinal</strong>s with<br />
{100} steps (b). In each case a schematic step arrangement configuration before (upper part) <strong>and</strong><br />
after (lower part) one phase has been inserted in<strong>to</strong> the other is drawn. The two terraces <strong>of</strong> the<br />
unreconstructed phase are in grey (i.e. they have an fcc stacking). The hcp a<strong>to</strong>mic stacking fault<br />
on the two terraces <strong>of</strong> the reconstructed phase is represented by a hatched area. Arrows indicate<br />
edges between <strong>vicinal</strong> phases. Step structures are indicated by triangles for {<strong>111</strong>} steps <strong>and</strong> full<br />
black squares for {100} steps (from [2]).<br />
It can be seen in figure 18(a) that inserting one phase in<strong>to</strong> the other for <strong>Au</strong>(455) transforms<br />
two {<strong>111</strong>} steps in<strong>to</strong> a periodic succession <strong>of</strong> {<strong>111</strong>} <strong>and</strong> {100} step portions. Due <strong>to</strong> the<br />
higher step energy for the {100} steps, this result in alocal energy cost C1. Anestimation <strong>of</strong><br />
this term using the {<strong>111</strong>} <strong>and</strong> {100} step energies [22, 47] as well as the proportion <strong>of</strong> hcp<br />
stacking along the step gives a few meV Å −1 . Following Marchenko’s model, it leads <strong>to</strong> a<br />
micronic period for <strong>vicinal</strong> <strong>surfaces</strong> with {<strong>111</strong>} steps, not far from our observations <strong>of</strong> about<br />
200 nm. However, it is not expected <strong>to</strong> obtain a quantitative agreement, taking in<strong>to</strong> account the<br />
roughness <strong>of</strong> our estimation <strong>to</strong>gether with the very high sensitivity <strong>of</strong> the exponential function.<br />
More interesting is the comparison with the <strong>Au</strong>(11, 9, 9) surface. Indeed, comparing steps<br />
in the upper <strong>and</strong> lower parts <strong>of</strong> figure 18(b) shows that no difference in step energies appears<br />
when one phase is inserted in<strong>to</strong> the other. In this case, additional effects must be invoked <strong>to</strong><br />
evaluate C1. Ithas been recently proposed that C1 could result from the modification <strong>of</strong> the<br />
terrace widths in the vicinity <strong>of</strong> the frontier due <strong>to</strong> its asymmetric environment [66]. Following<br />
this work, we assumed a few per cent variation <strong>of</strong>the edge terraces so that the edge energy cost
<strong>Self</strong>-<strong>ordering</strong> <strong>of</strong> <strong>Au</strong>(<strong>111</strong>) <strong>vicinal</strong> <strong>surfaces</strong> <strong>and</strong> <strong>application</strong> <strong>to</strong> nanostructure organized growth S3387<br />
can be evaluated from our FK model. It is found <strong>to</strong> be a few tenths <strong>of</strong> meV Å −1 .Thisvalue is<br />
probably overestimated since the calculations <strong>of</strong> Liu et al concern a much more asymmetric<br />
case than ours. However, this gives an upper limit for C1 which is at the most equal <strong>to</strong> C2.<br />
Thus, Marchenko’s model predicts the smallest possible period that can be realized with the<br />
two favoured terrace widths. This is indeed what we observe on the <strong>Au</strong>(11, 9, 9) surface. Of<br />
course, the validity <strong>of</strong> the Marchenko model has <strong>to</strong> be discussed in the case <strong>of</strong> such a small<br />
phase extent but it is known that the elastic theory provides correct results until a few a<strong>to</strong>mic<br />
distances. Therefore, our results strongly suggest that the difference in C1 between both types<br />
<strong>of</strong> <strong>vicinal</strong> <strong>Au</strong>(11, 9, 9) <strong>and</strong> <strong>Au</strong>(455) is responsible for their drastically different mesoscopic<br />
faceted morphologies. Thus, <strong>Au</strong>(<strong>111</strong>) <strong>vicinal</strong> <strong>surfaces</strong> provide aunique opportunity <strong>to</strong> point<br />
out the crucial role played by the boundary energy cost in the self-<strong>ordering</strong> phenomena [2].<br />
Surprisingly, although the edge energy cost is not thedriving force for the periodic faceting, it<br />
is able <strong>to</strong> moni<strong>to</strong>r the value <strong>of</strong> the period. This is indeed <strong>of</strong> primordial interest for numerous<br />
<strong>application</strong>s <strong>of</strong> self-ordered systems.<br />
Now, let us examine the more complex case <strong>of</strong> <strong>Au</strong>(12, 11, 11). Difficulty arises due<br />
<strong>to</strong> the fact that the a<strong>to</strong>mic structure <strong>of</strong> the largest terraces found on the faceted morphology<br />
changes depending on whether it is close <strong>to</strong> the facet edge or not. The large terraces display<br />
more frequently the complex structure shown in figure 11(c) <strong>and</strong> called ‘structure c’ below.<br />
However, the so-called ‘viaduct’ or ‘b’ structure (see figure 11(b)) is always found in the vicinity<br />
<strong>of</strong> the smallest terrace phase. Underst<strong>and</strong>ing the periodicity in this case is much complicated<br />
since now the surface free energy is changing with the hill-<strong>and</strong>-valley periodicity, which has<br />
not been taken in<strong>to</strong> account previously. Two possibilities can apply. When both structures<br />
have almost the same energy, the surface will seek the smallest period possible. Indeed, the<br />
edge energy cost between the ‘viaduct’ structure <strong>and</strong> the small reconstructed terrace is <strong>of</strong> the<br />
same order <strong>of</strong> magnitude as in the case <strong>of</strong> <strong>Au</strong>(11, 9, 9) for the same structural reasons. When<br />
there is an energetic difference between both structures, the largest terrace phase will display<br />
only the complex structure c (except very close <strong>to</strong> the small terrace in order not <strong>to</strong> perturb such<br />
asmallterrace phase). In this case, the period will be great, since having the smallest period<br />
will have a cost in energy due <strong>to</strong> the creation <strong>of</strong> morebstructure. Unfortunately, we do not<br />
know the difference in energy between structures b <strong>and</strong> c. However, it is worth noting that the<br />
very smallvalue <strong>of</strong> C2 for this particular surface justifies the large periodicity indeed observed.<br />
8. Application for self-assembled growth <strong>of</strong> nanostructures<br />
Achieving a high degree <strong>of</strong> order in periodic arrays <strong>of</strong> uniform nanometre size clusters has<br />
become one <strong>of</strong> the greatest solid state physics challenges in the last few years. Methods for<br />
assembling arbitrary a<strong>to</strong>mic scale structures have been proposed involving scanning probe<br />
assisted lithography [72]. Another promising way is <strong>to</strong> use self-organization phenomena<br />
[68, 73]. The advantage <strong>of</strong> this parallel processing technique is <strong>to</strong> organize regular<br />
nanostructures over macroscopic areas with a high spatial density. It has been demonstrated<br />
that strained-relief patterned substrates such as dislocation networks can serve as templates<br />
for growing uniform regularly spaced nanostructures [64, 74, 75, 63, 76, 77]. However,<br />
intrinsic defects such as step edges hamper the achievement <strong>of</strong> long range ordered arrays <strong>of</strong><br />
nanostructures since steps are <strong>of</strong>ten the main defect killing the surface dislocation network’s<br />
coherence. Steps can also favour large cluster growth which hinders the uniformity <strong>of</strong><br />
nanostructure sizes. Since macroscopic averaging methods are still commonly used for<br />
measuring physical properties <strong>of</strong> the nanostructures, these defects represent major drawbacks.<br />
In order <strong>to</strong> overcome these difficulties, we proposed recently a novel approach based on strain<br />
relief <strong>vicinal</strong> patterned substrates for two-dimensional (2D) self-ordered growth.
S3388 SRousset et al<br />
(a)<br />
(b)<br />
(c)<br />
40 nm 165 nm<br />
Figure 19. STM images <strong>of</strong> Co on <strong>Au</strong>(788) at room temperature. (a) Raw image <strong>of</strong> 0.15 ML<br />
coverage <strong>of</strong> Co on <strong>Au</strong>(788). (b) The corrugation due <strong>to</strong> terrace levels has been subtracted in order<br />
<strong>to</strong> observe the isl<strong>and</strong> positions compared <strong>to</strong> the discommensuration lines. (c) 0.4 ML <strong>of</strong> Co on<br />
<strong>Au</strong>(788).<br />
The basic idea is taking advantage <strong>of</strong> different morphology found on <strong>Au</strong>(<strong>111</strong>) <strong>vicinal</strong><br />
<strong>surfaces</strong> in order <strong>to</strong> use these <strong>surfaces</strong> as templatesfor the growth <strong>of</strong> organized nanostructures.<br />
Using <strong>vicinal</strong> <strong>surfaces</strong> as templates was originally proposed for achieving the growth <strong>of</strong><br />
nanowires, <strong>and</strong> therefore entering the world <strong>of</strong> one-dimensional nanostructures [78]. Magnetic<br />
Fe nanowires have be grown on stepped W(110) [79] <strong>and</strong> have been investigated by spinpolarized<br />
STM [80]. Recently, Co a<strong>to</strong>mic chains have been achieved by decoration <strong>of</strong> a<br />
<strong>vicinal</strong> Pt surface [81] <strong>and</strong> ferromagnetism has been measured in such chains [82]. The main<br />
characteristic <strong>of</strong> <strong>vicinal</strong> <strong>surfaces</strong> is that the step array keeps its coherence over the whole<br />
sample which is <strong>of</strong> macroscopic size. Here we want <strong>to</strong> combine the <strong>vicinal</strong> step array with<br />
astrainrelief pattern which will result in a 2D self-ordered growth with long range order.<br />
Best c<strong>and</strong>idates for such 2D growth have been found <strong>to</strong> be the <strong>Au</strong>(<strong>111</strong>) <strong>vicinal</strong> <strong>surfaces</strong> cut<br />
in the [¯211] azimuth, whose steps exhibit {<strong>111</strong>} micr<strong>of</strong>acets, <strong>and</strong> with misorientation angle<br />
lying between 2 ◦ <strong>and</strong> 4 ◦ .Pro<strong>to</strong>types are <strong>Au</strong>(11, 12, 12) <strong>and</strong> <strong>Au</strong>(788) orientations described in<br />
section 4.<br />
We recall that the <strong>Au</strong>(788) surface is patterned in two dimensions:<br />
(i) along the [¯211] direction, the periodicity is the terrace width 3.9 nm <strong>and</strong> can be changed<br />
with a different miscut angle [50];<br />
(ii) along the [01¯1] direction, the periodicity is 7.2 nm, fixed by the reconstruction, <strong>and</strong> does<br />
not vary significantly with the miscut angle.<br />
The LEED pattern indicates the good long range order (on a macroscopic scale) <strong>of</strong> both<br />
the stepped surface <strong>and</strong> the reconstruction since we can see up <strong>to</strong> the third diffraction<br />
peak order in both directions. This is a major difference from the earlier works on<br />
self-organized growth obtained using dislocation networks on close-packed <strong>surfaces</strong> as<br />
templates [64, 75, 63, 76, 77, 74].<br />
Due <strong>to</strong> a place exchange mechanism at the crossing <strong>of</strong> the reconstruction lines <strong>and</strong> the<br />
step edges a 2D superlattice <strong>of</strong> two monolayer (ML) high cobalt nanodots is grown on the<br />
<strong>Au</strong>(788) surface at room temperature (see figure 19(b)). Although the advantage <strong>of</strong> using such<br />
asubstrateis<strong>to</strong>improvethelongrange order <strong>of</strong> the organized growth, there are a lot <strong>of</strong> local<br />
defects in the organized structure <strong>and</strong> the isl<strong>and</strong> size distribution achieved at room temperature<br />
is not very sharp [51].
<strong>Self</strong>-<strong>ordering</strong> <strong>of</strong> <strong>Au</strong>(<strong>111</strong>) <strong>vicinal</strong> <strong>surfaces</strong> <strong>and</strong> <strong>application</strong> <strong>to</strong> nanostructure organized growth S3389<br />
(a) (b)<br />
60 nm<br />
Figure 20. Details <strong>of</strong> the 0.2 ML deposition <strong>of</strong> Co on <strong>Au</strong>(788) at 130 K. (a) Raw STM image. (b)<br />
The corrugation due <strong>to</strong> terrace levels has been subtracted in order <strong>to</strong> observe the isl<strong>and</strong> positions<br />
compared <strong>to</strong> the discommensuration lines (from [90]).<br />
(a) [-2,1,1] (b)<br />
[-2,1,1]<br />
Figure 21. (a) STM image (175 × 175 nm 2 )<strong>of</strong>0.4 ML deposition <strong>of</strong> cobalt at room temperature<br />
on <strong>Au</strong>(11, 12, 12). (b) STM image (150 × 150 nm 2 )<strong>of</strong>0.4 ML deposition <strong>of</strong> cobalt at room<br />
temperature on <strong>Au</strong>(233) (from [91]).<br />
In order <strong>to</strong> improve the local order <strong>of</strong> this dot array we have performed experiments<br />
with different substrate temperatures. It has been shown in the Ag/Ag(2 ML)/Pt(<strong>111</strong>) system<br />
that lowering the deposition substrate temperature can inhibit some diffusion processes across<br />
discommensuration lines <strong>and</strong> so leads <strong>to</strong> an organized growth [64]. In this case, Brune et al<br />
[64] found that T 110 K is the best temperature <strong>to</strong> get a well ordered array. Following this<br />
idea, we have deposited a sub-monolayer coverage <strong>of</strong> Co on <strong>Au</strong>(788) cooled down <strong>to</strong> 130 K.<br />
Since we havetaken the subsequent STM images at room temperature, we could expect a<br />
different arrangement compared <strong>to</strong> the non-annealed case. Figure 20 shows an STM image <strong>of</strong><br />
the cobalt growth. At a first glance, it looks like a perfect rectangular array <strong>of</strong> nanodots. We<br />
can estimate over many images that the proportion <strong>of</strong> defects in this array is about 1%. Few<br />
micron areas show the same perfection <strong>of</strong> isl<strong>and</strong> organization [51]. The isl<strong>and</strong> size distribution<br />
is narrower than that measured for the room temperature deposition on <strong>Au</strong>(788) <strong>and</strong> even on<br />
<strong>Au</strong>(<strong>111</strong>).<br />
It is interesting <strong>to</strong> remark that the terrace width value can be moni<strong>to</strong>red very easily by<br />
changing the surface misorientation angle. This degree <strong>of</strong> freedom allows us <strong>to</strong> tune one <strong>of</strong>
S3390 SRousset et al<br />
the periodicities <strong>of</strong> the cobalt dot array. This is illustrated by the case <strong>of</strong> the <strong>Au</strong>(11, 12, 12)<br />
substrate where we obtain an almost square cell for the dot array as shown in figure 21(a). In<br />
this case the terrace width is 5.6 nm which is close <strong>to</strong> the reconstruction period. For interacting<br />
nanostructures (magnetic dipolar interactions, elastic interactions via the substrate, ...)the<br />
isotropy <strong>of</strong> the superlattice is an important parameter. Although this is <strong>of</strong> great interest <strong>to</strong><br />
vary the symmetry <strong>of</strong> the lattice cell one has <strong>to</strong> be careful that changing the terrace width<br />
can be destructive for the strain relief pattern. In figure 21(b) we show the example <strong>of</strong> cobalt<br />
deposition on the <strong>Au</strong>(233) surface. In this case the terrace width is 1.4 nm, a value that does<br />
not lead <strong>to</strong> a reconstruction within the terraces. As a consequence, we observe no organization<br />
when the cobalt deposition is performed on this substrate (see figure 21(b)).<br />
9. Conclusions<br />
In this paper, we have given a complete overview <strong>of</strong> our recent work on <strong>Au</strong>(<strong>111</strong>) <strong>vicinal</strong><br />
<strong>surfaces</strong>. Special emphasis has been placed on the self-<strong>ordering</strong> properties. Since gold <strong>surfaces</strong><br />
are commonly used as substrates in a wide variety <strong>of</strong> fields, such as organic molecules [83],<br />
magnetism [84] or heterogeneous catalysis [77], <strong>vicinal</strong> <strong>surfaces</strong> are ideal templates for<br />
nanostructuring <strong>application</strong>s, since they provide periods between 1 <strong>and</strong> 100 nm, with a<br />
coherence over the whole macroscopic samples. We have shown in detail what morphologies<br />
can be expected by using gold <strong>vicinal</strong> <strong>surfaces</strong>.<br />
(i) Regular <strong>vicinal</strong>s with step periodicity between 1 <strong>and</strong> 4 nm. Terraces are reconstructed or<br />
not.<br />
(ii) Faceted morphologies allow us <strong>to</strong> vary the long range order periodicity between 5 <strong>and</strong><br />
500 nm.<br />
The key point in underst<strong>and</strong>ing these morphologies comes from the interaction between<br />
reconstruction <strong>and</strong> step edges. Elucidating this interaction leads <strong>to</strong> two fundamental<br />
consequences:<br />
(i) two different models have proposed for underst<strong>and</strong>ing the faceting properties <strong>and</strong><br />
(ii) the mesoscopic faceting periodicity has been linked <strong>to</strong> the local a<strong>to</strong>mic order <strong>of</strong> the facet<br />
edge.<br />
Open questions on <strong>Au</strong>(<strong>111</strong>) <strong>vicinal</strong> <strong>surfaces</strong> are still<br />
(i) the comparison with the gold crystallite equilibrium shape which displays large angles <strong>of</strong><br />
discontinuity at the <strong>Au</strong>(<strong>111</strong>) facet sharp edges [20–23],<br />
(ii) the comparison with the magic <strong>vicinal</strong> obtained from annealed periodic pr<strong>of</strong>iles [24] <strong>and</strong><br />
(iii) the temperature behaviour <strong>and</strong> the role <strong>of</strong> the phase transition <strong>to</strong>wards the fluid phase<br />
[41, 42].<br />
However, we have shown that reconstructed <strong>vicinal</strong> <strong>surfaces</strong> are well suited for 2D growth<br />
<strong>of</strong> nanostructures. Gold <strong>vicinal</strong> <strong>surfaces</strong> spontaneously exhibit such a pattern but it is likely<br />
that every well known epitaxial dislocation network (metal systems [85–87, 64], <strong>and</strong> also<br />
semiconduc<strong>to</strong>rs [88, 89]) will display similar patterns on <strong>vicinal</strong> <strong>surfaces</strong>.<br />
Acknowledgments<br />
This work has been supported by the Conseil Régional d’Ile de France (CRIF) <strong>and</strong> the<br />
Université Paris7. Co-workers J M Berroir, B Croset, H Ellmer, V Etgens, P Hecquet,<br />
JKlein, S Gauthier, F Pourmir <strong>and</strong> B Salanon who have contributed <strong>to</strong> the work presented here<br />
are acknowledged. Discussions with P Zeppenfeld, C Cohen <strong>and</strong> L Barbier were very helpful.
<strong>Self</strong>-<strong>ordering</strong> <strong>of</strong> <strong>Au</strong>(<strong>111</strong>) <strong>vicinal</strong> <strong>surfaces</strong> <strong>and</strong> <strong>application</strong> <strong>to</strong> nanostructure organized growth S3391<br />
References<br />
[1] Song S, Yoon M, Mochrie S, Stephenson G <strong>and</strong> Milner S 1997 Surf. Sci. 372 37<br />
[2] Repain V, Berroir J, Croset B, Rousset S, Garreau Y, Etgens V <strong>and</strong> Lecoeur J 2000 Phys. Rev. Lett. 84 5367<br />
[3] Rosenhain W 1902 Proc. R. Soc. A 70 252<br />
[4] Rosenhain W <strong>and</strong> Ewen D 1912 J. Inst. Met. 8 149<br />
[5] Fonda G 1923 Phys. Rev. 21 343<br />
[6] Stephanopoulos M F <strong>and</strong> Schmidt L 1979 Prog. Surf. Sci. 9 83<br />
[7] Moore A 1963 Metal Surfaces vol 256, ed W D Robertson <strong>and</strong> N A Gjostein (Metals Park, OH: American<br />
Society for Metals) p 155<br />
[8] Wulff G 1901 Z. Kristallogr. 34 449<br />
[9] Herring C 1951 Phys. Rev. 82 87<br />
[10] Watson G, Gibbs D, Zehner D, Yoon M <strong>and</strong> Mochrie S 1998 Surf. Sci. 407 59<br />
[11] Yoon M, Mochrie S, Zehner D, Watson G <strong>and</strong> Gibbs D 1994 Phys. Rev. B 49 16702<br />
[12] Song S <strong>and</strong> Mochrie S 1994 Phys. Rev.Lett. 73 995<br />
[13] Song S, Mochrie S <strong>and</strong> Stephenson G 1995 Phys. Rev.Lett. 74 5240<br />
[14] Jeong H <strong>and</strong> Williams E 1999 Surf. Sci. Rep. 34 171<br />
[15] Phaneuf R, Williams E <strong>and</strong> Bartelt N 1988 Phys. Rev. B 38 1984<br />
[16] Phaneuf R, Williams E <strong>and</strong> Bartelt N 1987 Phys. Rev. Lett. 58 2563<br />
[17] Samson Y, Rousset S, Gauthier S <strong>and</strong> Klein J 1994 Surf. Sci. 315 L969<br />
[18] Sot<strong>to</strong> M <strong>and</strong> Boulliard J 1989 Surf. Sci. 214 97<br />
[19] Bar<strong>to</strong>lini A, Ercolessi F <strong>and</strong> Tossati E 1989 Phys. Rev.Lett. 63 872<br />
[20] Heyraud J <strong>and</strong> Me<strong>to</strong>is J 1980 J. Cryst. Growth 50 571<br />
[21] Heyraud J <strong>and</strong> Me<strong>to</strong>is J 1980 Acta Metall. 28 1789<br />
[22] Wang Z <strong>and</strong> Wynblatt P 1998 Surf. Sci. 398 259<br />
[23] Emundts A, Bonzel H, Wynblatt P, Thürmer K, Reutt-Robey J <strong>and</strong> Williams E 2001 Surf. Sci. 481 13<br />
[24] Bonzel H, Breuer U, Voigtländer B <strong>and</strong> Zeldov E 1992 Surf. Sci. 272 10<br />
[25] Watson G M, Gibbs D, Song S, S<strong>and</strong>y A, Mochrie S <strong>and</strong> Zehner D M 1995 Phys. Rev. B 52 12329<br />
[26] Rousset S, Berroir J, Repain V, Garreau Y, Etgens V, Lecoeur J <strong>and</strong> Pinchaux R 1999 Surf. Sci. 443 265<br />
[27] Garreau Y, Repain V, Berroir J, Rousset S, Etgens V <strong>and</strong> Lecoeur J 2000 Physica B 283 223<br />
[28] Pourmir F, Rousset S, Gauthier S, Sot<strong>to</strong> M, Klein J, Lecoeur J <strong>and</strong> Bellier J 1995 Surf. Sci. 324 L337<br />
[29] Rousset S, Pourmir F, Berroir J, Klein J, Lecoeur J, Hecquet P <strong>and</strong> Salanon B 1999 Surf. Sci. 422 33<br />
[30] Lecoeur J <strong>and</strong> Bellier J 1992 J. Electroanal. Chem. 337 197<br />
[31] Lecoeur J <strong>and</strong> Rousset S 2002 J. Electroanal. Chem. 519 18<br />
[32] Harten U, Lahee A, Toennis J <strong>and</strong> Wöll C 1985 Phys. Rev. Lett. 54 2619<br />
[33] Wöll C, Chiang S, Wilson R <strong>and</strong> Lippel P 1989 Phys. Rev. B 39 7988<br />
[34] Barth J, Brune H, Ertl G <strong>and</strong> Behm R 1990 Phys. Rev. B 42 9307<br />
[35] Frenkel Y <strong>and</strong> Kon<strong>to</strong>rova T 1938 Zh. Eksp. Teor. Fiz. 8 1340<br />
[36] Frank F <strong>and</strong> der Merwe J V 1948 Proc. R. Soc. A 198 205<br />
[37] El-Batanouny M, Burdick S, Martini K <strong>and</strong> Stanci<strong>of</strong>f P 1987 Phys. Rev.Lett. 58 2762<br />
[38] Ravelo R <strong>and</strong> El-Batanouny M 1989 Phys. Rev. B 40 9574<br />
[39] Narasimhan S <strong>and</strong> V<strong>and</strong>erbilt D 1992 Phys. Rev.Lett. 69 1564<br />
[40] Bach C, Giesen M, Ibach H <strong>and</strong> Einstein T 1997 Phys. Rev. Lett. 78 4225<br />
[41] Huang K, Gibbs D, Zehner D, S<strong>and</strong>y A <strong>and</strong> Mochrie S 1990 Phys. Rev. Lett. 65 3313<br />
[42] S<strong>and</strong>y A, Mochrie S, Zehner D, Huang K <strong>and</strong> Gibbs D 1991 Phys. Rev. B 43 4667<br />
[43] Abernathy D, Gibbs D, Grübel G, Huang K, Mochrie S, S<strong>and</strong>y A <strong>and</strong> Zehner D 1993 Surf. Sci. 283 260<br />
[44] Marchenko V 1981 Sov. Phys.—JETP 54 605<br />
[45] Repain V, Berroir J, Rousset S <strong>and</strong> Lecoeur J 1999 Europhys. Lett. 47 435<br />
[46] Repain V, Berroir J, Rousset S <strong>and</strong> Lecoeur J 2000 Appl. Surf. Sci. 162/163 30<br />
[47] Michely T <strong>and</strong> Comsa G 1991 Surf. Sci. 256 217<br />
[48] Michely T, Besocke K <strong>and</strong> Comsa G 1990 Surf. Sci. 230 L135<br />
[49] Mugarza A, Mascaraque A, Repain V, Rousset S, Altmann K, Himpsel F, Koroteev Y, Chulkov E, de Abajo F<br />
G<strong>and</strong> Ortega J E 2002 Phys. Rev. B 66 245419<br />
[50] Repain V, Berroir J, Rousset S <strong>and</strong> Lecoeur J 2000 Surf. Sci. 447 L152<br />
[51] Repain V, Baudot G, Ellmer H <strong>and</strong> Rousset S 2002 Europhys. Lett. 58 730<br />
[52] Rousset S, Pourmir F, Gauthier S, Lacaze E, Sot<strong>to</strong> M, Klein J <strong>and</strong> Lecoeur J 1996 J. Vac. Sci. Technol. B 14<br />
1131<br />
[53] Yoon M, Mochrie S, Zehner D, Watson G <strong>and</strong> Gibbs D 1995 Surf. Sci. 338 225<br />
[54] Mansfield M <strong>and</strong> Needs R 1990 J. Phys.: Condens. Matter 2 2361
S3392 SRousset et al<br />
[55] Croset B <strong>and</strong> de Beauvais C 2000 Phys. Rev. B 61 3039<br />
[56] Einstein T <strong>and</strong> Pierre-Louis O 1999 Surf. Sci. 424 L299<br />
[57] Williams E 1994 Surf. Sci. 299/300 502<br />
[58] Ibach H 1997 Surf. Sci. Rep. 29 193<br />
[59] Goyhenex C <strong>and</strong> Bulou H 2001 Phys. Rev. B 63 235404<br />
[60] Heyraud J <strong>and</strong> Me<strong>to</strong>is J 1983 Surf. Sci. 128 334<br />
[61] Heyraud J <strong>and</strong> Me<strong>to</strong>is J 1986 Surf. Sci. 177 213<br />
[62] Bilalbegovic G, Ercolessi F <strong>and</strong> Tossati E 1992 Europhys. Lett. 18 163<br />
[63] Chambliss D, Wilson R <strong>and</strong> Chiang S 1991 Phys. Rev. Lett. 66 1721<br />
[64] Brune H, Giovannini M, Bromann K <strong>and</strong> Kern K 1998 Nature 394 451<br />
[65] Fruchart O, Klaua M, Barthel J <strong>and</strong> Kirschner J 1999 Phys. Rev. Lett. 83 2769<br />
[66] Liu F, Ters<strong>of</strong>f J <strong>and</strong> Lagally M 1998 Phys. Rev. Lett. 80 1268<br />
[67] Teichert C 2002 Phys. Rep. 365 335<br />
[68] Shchukin V <strong>and</strong> Bimberg D 1999 Rev. Mod. Phys. 71 1125<br />
[69] Zuo J, Zehner D, Wendelken J, Warmack R <strong>and</strong> Yang H 1994 Surf. Sci. 301 223<br />
[70] Ozcomert J, Pai W, Bartelt N <strong>and</strong> Reutt-Robey J 1994 Phys. Rev. Lett. 72 258<br />
[71] Needs R <strong>and</strong> Mansfield M 1989 J. Phys.: Condens. Matter 1 7555<br />
[72] Eigler D <strong>and</strong> Schweizer E 1990 Nature 344 524<br />
[73] Sun S, Murray C, Weller D, Folks L <strong>and</strong> Moser A 2000 Science 287 1989<br />
[74] Voigtländer B, Meyer G <strong>and</strong> Amer N 1991 Phys. Rev. B 44 10354<br />
[75] Voigtländer B, Meyer G <strong>and</strong> Amer N 1991 Surf. Sci. 225 L529<br />
[76] Altman E <strong>and</strong> Col<strong>to</strong>n R 1994 Surf. Sci. 304 L400<br />
[77] Stephenson A, Baddeley C,Tikhov M <strong>and</strong> Lambert R 1998 Surf. Sci. 398 172<br />
[78] Himpsel F, Ortega J, Mankey G <strong>and</strong> Willis R 1998 Adv. Phys. 47 511<br />
[79] Hauschild J, Elmers H <strong>and</strong> Gradmann U 1998 Phys. Rev. B 57 R677<br />
[80] Pietzsch O, Kubetzka A, Bode M <strong>and</strong> Wiesendanger R 2000 Phys. Rev. Lett. 84 5212<br />
[81] Gambardella P, Blanc M, Bürgi L, Kuhnke K <strong>and</strong> Kern K 2000 Surf. Sci. 449 93<br />
[82] Gambardella P, Dallmeyer A, Maiti K, Malagoli M, Eberhardt W, Kern K <strong>and</strong> Carbone C 2002 Nature 416 301<br />
[83] Marchenko O <strong>and</strong> Cousty J 2000 Phys. Rev. Lett. 84 5363<br />
[84] Chappert C <strong>and</strong> Bruno P 1988 J. Appl. Phys. 64 5736<br />
[85] Barth J, Behm R <strong>and</strong> Ertl G 1995 Surf. Sci. 341 62<br />
[86] Meyer J, Schmid P <strong>and</strong> Behm R 1995 Phys. Rev. Lett. 74 3864<br />
[87] Günther C, Vrijmoeth J, Hwang R <strong>and</strong> Behm R 1995 Phys. Rev. Lett. 74 754<br />
[88] Horn-Von-Hoegen M, Falou A, Pietsch H, Müller B <strong>and</strong> Henzler M 1993 Surf. Sci. 298 29<br />
[89] Böhringer M, Molinas-Mata P, Artacho E <strong>and</strong> Zegenhagen J 1995 Phys. Rev. B 51 9965<br />
[90] Repain V, Baudot G, Ellmer H <strong>and</strong> Rousset S 2002 Mater. Sci. Eng. B 96 178<br />
[91] Baudot G, Rohart S, Repain V, Ellmer H, Girard Y <strong>and</strong> Rousset S 2003 Appl. Surf. Sci. 212/213 360