Information briefs and risk analyses for species under consideration ...
Information briefs and risk analyses for species under consideration ...
Information briefs and risk analyses for species under consideration ...

Create successful ePaper yourself
Turn your PDF publications into a flip-book with our unique Google optimized e-Paper software.
from observer data in the squid trawl fishery did not identify orange perch as being<br />
within the top 50 bycatch <strong>species</strong> by weight 1 .<br />
Environmental conditions<br />
6 No in<strong>for</strong>mation is available.<br />
Protected <strong>species</strong> interactions<br />
7 None known.<br />
Stock Assessment<br />
8 There are no estimates of current or reference biomass, or sustainable yield.<br />
Social, Economic, Cultural <strong>In<strong>for</strong>mation</strong><br />
Commercial fishery characteristics, methods 2<br />
9 Over the last five fishing years orange perch has been taken as a bycatch in 26 target<br />
fisheries, predominantly those taken by bottom trawl. The amount of orange perch<br />
taken in each fishery varies significantly by year. The sea perch, squid <strong>and</strong> silver<br />
warehou target fisheries are responsible <strong>for</strong> most of the orange perch catch over the<br />
last five years with small amounts also taken in ling, barracouta, jack mackerel <strong>and</strong><br />
white warehou fisheries. In the most recent fishing year 18% of the estimated catch of<br />
orange perch was targeted.<br />
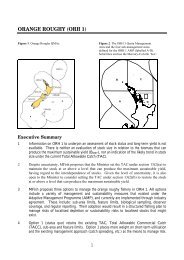
10 Catch of orange perch has a widespread geographic distribution. For the fishing years<br />
2002/03 – 2006/07 total reported l<strong>and</strong>ings of orange perch from the EEZ was 485 t.<br />
The following table summarises the total reported catch by FMA <strong>for</strong> these fishing<br />
years.<br />
FMA1 FMA2 FMA3 FMA4 FMA5 FMA6 FMA7 FMA8 FMA9 FMA10<br />
0 t 1 t 27 t 303 t 118 t 0 t 26 t 1 t 0 t 11 t<br />
11 Total reported l<strong>and</strong>ings (t) <strong>for</strong> each of the cited fishing years is shown in the following<br />
table.<br />
2002/03 2003/04 2004/05 2005/06 2006/07<br />
115 t 19 t 29 t 105 t 217 t<br />
12 The percentage of total reported catch <strong>for</strong> each fishing year discarded or l<strong>and</strong>ed is<br />
shown in the following table.<br />
2002/03 2003/04 2004/05 2005/06 2006/07<br />
Discarded 0% 39% 12% 0% 0%<br />
L<strong>and</strong>ed 100% 61% 87% 100% 100%<br />
1<br />
Anderson, O.F. (2004) Fish discards <strong>and</strong> non-target fish catch in the trawl fisheries <strong>for</strong> arrow squid, jack<br />
mackerel, <strong>and</strong> scampi in New Zeal<strong>and</strong> waters. New Zeal<strong>and</strong> Fisheries Assessment Report 2004/10. 61 p.<br />
2<br />
Tables showing figures as percentages may not sum to 100% as percentages are rounded to the nearest whole<br />
number.<br />
47