Information briefs and risk analyses for species under consideration ...
Information briefs and risk analyses for species under consideration ...
Information briefs and risk analyses for species under consideration ...

Create successful ePaper yourself
Turn your PDF publications into a flip-book with our unique Google optimized e-Paper software.
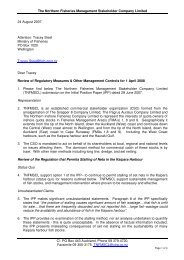
Table 1: Total l<strong>and</strong>ings (kg) of whelk by Fisheries Management Area (FMA) 1988/89 –<br />
2006/07<br />
Fishing<br />
Year FMA1 FMA2 FMA3 FMA4 FMA5 FMA6 FMA7 FMA8 FMA9<br />
1988/89 825<br />
1989/90 21,683<br />
1990/91 44,976<br />
1991/92 26,935<br />
1992/93 21 18 1,762<br />
1993/94 135 49,278<br />
1994/95 707 545 21,458 593<br />
1995/96 89 178 *27,832<br />
1996/97 2 174 144 150 3 8,959<br />
1997/98 102 884<br />
1998/99 223 2,205 2,470 150 570<br />
1999/00 2,286 7,953 3,250 790 80<br />
2000/01 10,467 17,497 3,538 4,765 141<br />
2001/02 1,474 3,995 515 1,755 2<br />
2002/03 212 20 4 780 77<br />
2003/04 35 491 335 4,217<br />
2004/05 8 58 335 228 47<br />
2005/06 212 32<br />
2006/07 405 425<br />
Total 471 1105 16,835 31,820 9780 8910 182,107 593 47<br />
* Data has been corrected by removing a suspected data entry error.<br />
13 Data on target <strong>species</strong> <strong>and</strong> fishing methods is derived from estimated catch data<br />
reported on catch-ef<strong>for</strong>t returns, which is generally less reliable than l<strong>and</strong>ings data.<br />
From 1988/89 to 1997/98 the majority of whelk catch was targeted (Table 2). Since<br />
1998/99 the majority of estimated catch of whelk has been taken as bycatch in<br />
fisheries targeting oyster or finfish such as hoki, flo<strong>under</strong> <strong>and</strong> red cod (Table 2).<br />
16