Iceland - Gallup Pakistan
Iceland - Gallup Pakistan
Iceland - Gallup Pakistan

Create successful ePaper yourself
Turn your PDF publications into a flip-book with our unique Google optimized e-Paper software.
Prepared on<br />
December 31, 2011<br />
Global Barometer on Hope and Despair<br />
<strong>Iceland</strong><br />
Trend data: 1977-2011<br />
(for all years for which data are available)<br />
Volume 2: Country Report Series<br />
WIN—<strong>Gallup</strong> International<br />
Celebrating 34 years of The World’s Leading Global Barometer (1977-2011)<br />
Courtesy:<br />
The preparation of this Report and compilation of the trend data (1977-2011) has been done with the courtesy of <strong>Gallup</strong> <strong>Pakistan</strong><br />
(www.gallup.com.pk) and Gilani Research Foundation (www.gilanifoundation.com) as a public service for members of <strong>Gallup</strong><br />
International Association. For any further details please contact: Rushna.Shahid@gallup.com.pk<br />
Disclaimer: <strong>Gallup</strong> International Association or its members are not related to <strong>Gallup</strong> Inc., headquartered in Washington D.C which is no<br />
longer a member of <strong>Gallup</strong> International Association. <strong>Gallup</strong> International Association does not accept responsibility for opinion polling<br />
other than its own. We require that our surveys be credited fully as <strong>Gallup</strong> International (not <strong>Gallup</strong> or <strong>Gallup</strong> Poll). For further details see<br />
website: www.<strong>Gallup</strong>-international.com
WIN—<strong>Gallup</strong> International<br />
Trend of Hope and Despair in <strong>Iceland</strong><br />
1977-2011<br />
(for all years for which data are available)<br />
FOREWORD<br />
The World’s First and the Leading<br />
Global Barometer<br />
The Global Barometer of Hope and Despair, conducted on the eve of every new year<br />
since 1977, happens to be the world’s first Global Barometer. It was initiated and led by<br />
the renowned pollster Dr. George <strong>Gallup</strong> in that year and has since been conducted<br />
annually by research institutes affiliated with <strong>Gallup</strong> International and other associated<br />
research institutions. In 2011 we will be celebrating 34 years of its success.<br />
In 1977 the world was still a stranger to modern computing machines on everyone’s<br />
desk. It was a world in which the old Main Frame computers were available to the<br />
fortunate. Others performed their tasks in more primitive ways. The mode of<br />
communication was the Post Office supplemented by what was known as the<br />
“Telegraph and Telex Machine”. Despite these limitations, the first Global Barometer was<br />
conducted by 22 <strong>Gallup</strong> International Association members across the globe. They<br />
included all the G7 countries as well as key countries from all continents. The number of<br />
countries has since risen considerably and the survey now covers a highly representative<br />
sample of global population. In 2011 the survey covers 58 countries from all parts of Asia,<br />
Africa, Latin America and Australasia.<br />
Considering that the Global Barometer was initiated in 1977 under conditions which<br />
would now seem primitive by way of international communications as well as<br />
information technology, the archives of the Global Barometer were not in a position to<br />
present trend data in usable form. It has taken some effort to construct time series data.<br />
It was a proud privilege for <strong>Gallup</strong> <strong>Pakistan</strong> to have accomplished that task in 2010.<br />
Despite being relatively limited in its scope, the trend data information is now usable and<br />
amendable to updation. It has been updated for the latest year (EOY: 2011)<br />
In the covers of these pages you will find a simple computation of the top lines of<br />
country data for all years when the survey was conducted in that country. We hope that<br />
we will further refine these Reports, in due course of time.<br />
We would particularly like to thank the team at <strong>Gallup</strong> <strong>Pakistan</strong> as well as Ms. Armida<br />
Wagman at the <strong>Gallup</strong> International Secretariat who in 2010 helped compile the trend<br />
data for the first 33 years of the series. We very much hope that with the active support<br />
of the Expert Group on Opinion Research (details on the Blog of the Group) at WIN-<br />
<strong>Gallup</strong> International we will be able to further pursue this task.<br />
Jean-Marc Leger<br />
President WIN-<strong>Gallup</strong> International<br />
and<br />
Dr. Ijaz Shafi Gilani<br />
Chair, Expert Group on Opinion Research<br />
WIN-<strong>Gallup</strong> International (gilani@gallup.com.pk)<br />
December 20, 2011<br />
[ 2 ]
1- Panel of Experts<br />
Matthew<br />
Warshaw<br />
Afghanistan<br />
John<br />
Smurthwaite<br />
Malaysia<br />
WIN—<strong>Gallup</strong> International<br />
WIN-<strong>Gallup</strong> International Team of<br />
END OF YEAR SURVEY: 2011<br />
OPINION RESEARCH GROUP<br />
2- Research Team for EOY 2011 (<strong>Gallup</strong> <strong>Pakistan</strong>)<br />
Manzer Ehsan<br />
Helio<br />
Gastaldi<br />
Brazil<br />
Natalia<br />
Ivanisheva<br />
Russia<br />
Dave<br />
Scholz<br />
Canada<br />
Carlos<br />
Clavero<br />
Spain<br />
Hammad Irshad<br />
Celine<br />
Bracq<br />
France<br />
Tahmina Shoaib<br />
Trend of Hope and Despair in <strong>Iceland</strong><br />
1977-2011<br />
(for all years for which data are available)<br />
Inahiro<br />
Suzuki<br />
Japan<br />
Margit<br />
Cleveland<br />
Kenya<br />
3- Project Managers 4- Team Head 5- President WIN-GIA<br />
Sara Rushna Klaus-Peter Dr. Ijaz Shafi<br />
Salam Shahid Schoeppner Gilani Jean-March Langer<br />
<strong>Pakistan</strong> <strong>Pakistan</strong> Germany <strong>Pakistan</strong> Canada<br />
Elida<br />
Medarovska<br />
Macedonia<br />
[ 3 ]
6- Global Research Team<br />
WIN—<strong>Gallup</strong> International<br />
Trend of Hope and Despair in <strong>Iceland</strong><br />
1977-2011<br />
(for all years for which data are available)<br />
(In alphabetical order of Country Name)<br />
Name/Company/Country Picture Name/Company/Country Picture<br />
Assen Blagoev<br />
ACSOR-Surveys<br />
Afghanistan<br />
Marc Dumoulin<br />
Dedicated Research<br />
Belgium<br />
Zhou Xin<br />
CRC-Research<br />
China<br />
Tim Wilson<br />
Tebbutt Research<br />
Fiji Islands<br />
Christy Szeto<br />
Consumer Search<br />
Group<br />
Hong<br />
Kong<br />
Gerardo Tuñón Corti<br />
IBOPE Inteligência<br />
Argentina<br />
Aida Hadziavdic-<br />
Begovic Mareco Index<br />
Bosnia<br />
Bosnia<br />
Cristina Querubin<br />
Centro Nacional de<br />
Consultoria<br />
Colombia<br />
Jari Pajuen<br />
Taloustutkimus Oy<br />
Finland<br />
Vilborg Helga<br />
Hardardottir<br />
Capacentlceland<br />
<strong>Iceland</strong><br />
Aram Navasardyan<br />
MPG LLC<br />
Armenia<br />
Laure IBOPE<br />
Inteligencia<br />
Brazil<br />
Jan Trojacek MARECO<br />
Praha<br />
Czech Republic<br />
Celine Bracq<br />
BVA<br />
France<br />
Yashwant Deshmukh<br />
C Voter<br />
India<br />
Bianca Mazzaferro<br />
Colmar Brunton<br />
Australia<br />
Mila Grigorova<br />
BBSS<br />
Bulgaria<br />
*<br />
Roger Elsted<br />
DMA/ Research<br />
Denmark<br />
Merab Pachulia<br />
GORBI<br />
Georgia<br />
Dr. Munqih Dagher<br />
IIACSS<br />
Iraq<br />
Ingrid Lusk<br />
Osterreichischesc<br />
<strong>Gallup</strong>-Institute<br />
Austria<br />
Arnauld Zeufack<br />
RMS Cameroon<br />
Cameroon<br />
Carlos A. Cordova<br />
Cedatos<br />
Ecuador<br />
*<br />
Johaness Huxoll<br />
TNS Emnid<br />
Germany<br />
Sinead Mooney<br />
Red C Research and<br />
Marketing<br />
Ireland<br />
Ashraf Hajiyev<br />
SIAR Media<br />
Azerbaijan<br />
Sarah Weill<br />
Leger Marketing<br />
Canada<br />
Dr.Sherine Zaklama<br />
Rada Research & Public<br />
Relations Co.<br />
Egypt<br />
Femi Laoye<br />
RMSI Ghana<br />
Ghana<br />
Paolo Colombo<br />
DOXA<br />
Italy<br />
[ 4 ]
*<br />
Hisako Kumada<br />
Nippon Research<br />
Center (NRC)<br />
Japan<br />
Imre van Rooijen<br />
Market Response<br />
Netherlands<br />
*<br />
Olga Wiatr<br />
MARECO Polska<br />
Poland<br />
Luciano Miguel<br />
Instituto DYM, S.A<br />
Spain<br />
Beth Owen<br />
Indochina Research<br />
Vietnam<br />
Hyunjeong Jung<br />
<strong>Gallup</strong> Korea<br />
Korea<br />
Josiah Kimanzi<br />
RMS Nigeria<br />
Nigeria<br />
Marius Bobi<br />
TNS CSOP<br />
Romania<br />
Dr. Johan Lilliecreutz<br />
CMA Research<br />
Sweden<br />
WIN—<strong>Gallup</strong> International<br />
Selim Saad<br />
REACH<br />
Lebanon<br />
Fatima Idrees<br />
<strong>Gallup</strong> <strong>Pakistan</strong><br />
<strong>Pakistan</strong><br />
Natalia Lvanisheva<br />
ROMIR<br />
Russian Federation<br />
Barbara Schumacher<br />
ISOPUBLIC<br />
Switzerland<br />
Trend of Hope and Despair in <strong>Iceland</strong><br />
1977-2011<br />
(for all years for which data are available)<br />
Inga Nausediene<br />
UAB RAIT<br />
Lithuania<br />
Dr. Nabil Kukali<br />
Palestine<br />
Mohammad M.Aayed<br />
PARC<br />
Saudi Arabia<br />
Nebil Belaam<br />
EMRHOD<br />
Tunisia<br />
Ivana Todevska<br />
BRIMA<br />
Macedonia<br />
Gustavo Yrala<br />
DATUM international<br />
Peru<br />
Sladjana Brakus<br />
TNS Medium <strong>Gallup</strong><br />
Serbia<br />
PervinOlgun Barem<br />
Research<br />
Turkey<br />
Christian Batte<br />
BJ Group<br />
Morocco<br />
*<br />
Lawrence A. Dugan<br />
Asia Research<br />
Organization<br />
Philippines<br />
Patson Gasura<br />
Topline Research<br />
Solution<br />
South Africa<br />
Cindy Kaminski<br />
Trig<br />
USA<br />
[ 5 ]
WIN—<strong>Gallup</strong> International<br />
Trend of Hope and Despair in <strong>Iceland</strong><br />
1977-2011<br />
(for all years for which data are available)<br />
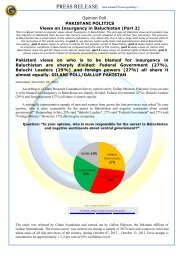
Graph for Hope and Despair in<br />
<strong>Iceland</strong> for Year 2011<br />
Question: So far as you are concerned do you think that 2012 will be<br />
better or worse than 2011?<br />
Worse<br />
21%<br />
Source: Annual Global Barometer on Hope and Despair conducted by affiliates of WIN-<strong>Gallup</strong> International Association. See details on:<br />
www.gallup.com.pk, www.gallup-international.com/<br />
(Note applicable for all tables ahead): Rounding off to 100:<br />
When the total does not add up to 100, it is because of rounding off issues.<br />
Better<br />
25%<br />
Same<br />
54%<br />
DK/NR<br />
0%<br />
[ 6 ]
90<br />
80<br />
70<br />
60<br />
50<br />
40<br />
30<br />
20<br />
10<br />
0<br />
1980 1981 1982 1983 1984 1985 1986 1987 1988 1989<br />
WIN—<strong>Gallup</strong> International<br />
38<br />
35<br />
31<br />
39<br />
The trend of<br />
Hope and Despair in <strong>Iceland</strong><br />
(1977-2011)<br />
80<br />
70<br />
60<br />
50<br />
40<br />
30<br />
20<br />
10<br />
0<br />
38<br />
33 32<br />
HOPE<br />
43<br />
55<br />
43 41<br />
46<br />
39<br />
47<br />
Trend of Hope and Despair in <strong>Iceland</strong><br />
1977-2011<br />
(for all years for which data are available)<br />
1980-1989 1990-1999<br />
90<br />
90<br />
2000-2011<br />
1990 1991 1992 1993 1994 1995 1996 1997 1998 1999<br />
80<br />
70<br />
60<br />
50<br />
40<br />
30<br />
20<br />
10<br />
0<br />
45 43 47<br />
29 29 35 34 29<br />
4<br />
11<br />
19 25<br />
2000 2001 2002 2003 2004 2005 2006 2007 2008 2009 2010 2011<br />
Note: Reported for all the years for which survey was carried out and data are available.<br />
Percent of Respondents<br />
Year 1985 1987 1988 1989 1990 1991 1992 1993 1994 1995 1996 1997 1998 1999 2000 2001 2002 2003 2004 2005 2006 2007 2008 2009 2010 2011<br />
Hope 38 35 31 39 38 33 32 43 55 43 41 46 39 47 45 43 47 29 29 35 34 29 4 11 19 25<br />
Source: Annual Global Barometer on Hope and Despair conducted by affiliates of WIN-<strong>Gallup</strong> International Association. See details on: www.gallup.com.pk, www.gallup-international.com/<br />
[ 7 ]
90<br />
80<br />
70<br />
60<br />
50<br />
40<br />
30<br />
20<br />
10<br />
0<br />
WIN—<strong>Gallup</strong> International<br />
1980-1989<br />
3 3<br />
11<br />
1980 1981 1982 1983 1984 1985 1986 1987 1988 1989<br />
6<br />
90<br />
80<br />
70<br />
60<br />
50<br />
40<br />
30<br />
20<br />
10<br />
0<br />
3<br />
DESPAIR<br />
10<br />
38<br />
15<br />
8<br />
11 9 8 7 8<br />
1990 1991 1992 1993 1994 1995 1996 1997 1998 1999<br />
Trend of Hope and Despair in <strong>Iceland</strong><br />
1977-2011<br />
(for all years for which data are available)<br />
1990-1999 2000-2011<br />
90<br />
80<br />
70<br />
60<br />
50<br />
40<br />
30<br />
20<br />
10<br />
0<br />
10<br />
24<br />
9 7 6 6 6<br />
10<br />
67<br />
42<br />
26 21<br />
2000 2001 2002 2003 2004 2005 2006 2007 2008 2009 2010 2011<br />
Note: Reported for all the years for which survey was carried out and data are available.<br />
Percent of Respondents<br />
Year 1985 1987 1988 1989 1990 1991 1992 1993 1994 1995 1996 1997 1998 1999 2000 2001 2002 2003 2004 2005 2006 2007 2008 2009 2010 2011<br />
Despair 3 3 11 6 3 10 38 15 8 11 9 8 7 8 10 24 9 7 6 6 6 10 67 42 26 21<br />
Source: Annual Global Barometer on Hope and Despair conducted by affiliates of WIN-<strong>Gallup</strong> International Association. See details on: www.gallup.com.pk, www.gallup-international.com/<br />
[ 8 ]
90<br />
80<br />
70<br />
60<br />
50<br />
40<br />
30<br />
20<br />
10<br />
0<br />
WIN—<strong>Gallup</strong> International<br />
57<br />
59<br />
56<br />
1980 1981 1982 1983 1984 1985 1986 1987 1988 1989<br />
49<br />
80<br />
70<br />
60<br />
50<br />
40<br />
30<br />
20<br />
10<br />
0<br />
55<br />
NO CHANGE<br />
52<br />
23<br />
37<br />
32<br />
41<br />
49<br />
41<br />
49<br />
42<br />
Trend of Hope and Despair in <strong>Iceland</strong><br />
1977-2011<br />
(for all years for which data are available)<br />
1980-1989 1990-1999<br />
90<br />
90<br />
2000-2011<br />
1990 1991 1992 1993 1994 1995 1996 1997 1998 1999<br />
80<br />
70<br />
60<br />
50<br />
40<br />
30<br />
20<br />
10<br />
0<br />
42<br />
32<br />
40<br />
61 61<br />
55<br />
57 59<br />
29<br />
47<br />
54 54<br />
2000 2001 2002 2003 2004 2005 2006 2007 2008 2009 2010 2011<br />
Note: Reported for all the years for which survey was carried out and data are available.<br />
Percent of Respondents<br />
Year 1985 1987 1988 1989 1990 1991 1992 1993 1994 1995 1996 1997 1998 1999 2000 2001 2002 2003 2004 2005 2006 2007 2008 2009 2010 2011<br />
Hope 57 59 56 49 55 52 23 37 32 41 49 41 49 42 42 32 40 61 61 55 57 59 29 47 54 54<br />
Source: Annual Global Barometer on Hope and Despair conducted by affiliates of WIN-<strong>Gallup</strong> International Association. See details on: www.gallup.com.pk, www.gallup-international.com/<br />
[ 9 ]
WIN—<strong>Gallup</strong> International<br />
Hope and Despair in <strong>Iceland</strong><br />
Trend of Hope and Despair in <strong>Iceland</strong><br />
1977-2011<br />
(for all years for which data are available)<br />
Question: So far as you are concerned do you think that 2012 will be<br />
better or worse than 2011?<br />
Percent of Respondents<br />
Serial # Year Better Same Worse DK/NR<br />
1 1985 38 57 3 2<br />
2 1987 35 59 3 3<br />
3 1988 31 56 11 2<br />
4 1989 39 49 6 6<br />
5 1990 38 55 3 4<br />
6 1991 33 52 10 5<br />
7 1992 32 23 38 7<br />
8 1993 43 37 15 5<br />
9 1994 55 32 8 5<br />
10 1995 43 41 11 5<br />
11 1996 41 49 9 1<br />
12 1997 46 41 8 5<br />
13 1998 39 49 7 5<br />
14 1999 47 42 8 3<br />
15 2000 45 42 10 3<br />
16 2001 43 32 24 1<br />
17 2002 47 40 9 4<br />
18 2003 29 61 7 3<br />
19 2004 29 61 6 4<br />
20 2005 35 55 6 4<br />
21 2006 34 57 6 3<br />
22 2007 29 59 10 2<br />
23 2008 4 29 67 0<br />
24 2009 11 47 42 0<br />
25 2010 19 54 26 .<br />
26 2011 25 54 21 0<br />
Source: Annual Global Barometer on Hope and Despair conducted by affiliates of WIN-<strong>Gallup</strong> International Association. See details on:<br />
www.gallup.com.pk, www.gallup-international.com/<br />
[ 10 ]
WIN—<strong>Gallup</strong> International<br />
Trend of Hope and Despair in <strong>Iceland</strong><br />
1977-2011<br />
(for all years for which data are available)<br />
Economic prosperity in <strong>Iceland</strong><br />
Question: Compared with this year, in your opinion, will next year<br />
be a year of economic prosperity, economic difficulty or remain the<br />
same?<br />
Percent of Respondents<br />
Serial # Years Economic prosperity Remain the same Economic Difficulty DK/NR<br />
1 1988 2 25 71 2<br />
2 1997 34 48 9 9<br />
3 1998 11 68 14 7<br />
4 1999 6 67 23 4<br />
5 2000 6 57 35 2<br />
6 2001 12 40 46 2<br />
7 2002 17 58 19 6<br />
8 2003 15 62 15 8<br />
9 2004 14 64 17 6<br />
10 2005 9 65 21 5<br />
11 2006 12 66 15 7<br />
12 2007 6 46 44 4<br />
13 2008 3 6 91 0<br />
14 2009 12 47 41 2<br />
15 2010 6 38 57 .<br />
16 2011 11 46 42 1<br />
Source: Annual Global Barometer on Hope and Despair conducted by affiliates of WIN-<strong>Gallup</strong> International Association. See details on:<br />
www.gallup.com.pk, www.gallup-international.com/<br />
[ 11 ]
WIN—<strong>Gallup</strong> International<br />
Unemployment in <strong>Iceland</strong><br />
Trend of Hope and Despair in <strong>Iceland</strong><br />
1977-2011<br />
(for all years for which data are available)<br />
Question: In the next 12 months do you expect the number of<br />
unemployed in … (YOUR COUNTRY) to increase a lot, to increase<br />
slightly, remain the same, fall slightly or fall a lot?<br />
Percent of Respondents<br />
Serial # Years<br />
Increase a<br />
lot<br />
Increase<br />
slight<br />
Remain the<br />
same<br />
Fall<br />
Slight<br />
Fall a<br />
lot<br />
DK/NR<br />
1 1997 1 13 42 37 3 4<br />
2 1998 3 14 55 21 2 5<br />
3 1999 1 14 66 13 1 5<br />
4 2000 3 19 64 9 1 4<br />
5 2001 23 44 25 5 1 2<br />
6 2002 12 39 29 13 2 5<br />
7 2003 7 25 42 19 1 5<br />
8 2004 4 20 49 16 2 8<br />
9 2005 3 12 66 12 2 5<br />
10 2006 3 24 59 8 1 4<br />
11 2007 3 41 44 9 1 2<br />
12 2008 72 21 2 2 2 0<br />
13 2009 14 39 29 17 1 1<br />
14 2010 15 35 28 21 2 .<br />
Source: Annual Global Barometer on Hope and Despair conducted by affiliates of WIN-<strong>Gallup</strong> International Association. See details on:<br />
www.gallup.com.pk, www.gallup-international.com/<br />
[ 12 ]
WIN—<strong>Gallup</strong> International<br />
Employment in <strong>Iceland</strong><br />
Trend of Hope and Despair in <strong>Iceland</strong><br />
1977-2011<br />
(for all years for which data are available)<br />
Question: Are you now in paid employment - either full time or<br />
part time?<br />
Percent of Respondents<br />
Serial # Years Full time Part time No<br />
1 1997 57 19 24<br />
2 1998 55 20 25<br />
3 1999 58 20 22<br />
4 2000 60 20 20<br />
5 2001 57 19 24<br />
6 2002 54 21 24<br />
7 2003 58 21 21<br />
8 2004 54 20 27<br />
9 2005 55 21 25<br />
10 2006 59 18 24<br />
11 2007 67 19 14<br />
12 2008 61 19 19<br />
13 2009 57 14 29<br />
14 2010 60 14 26<br />
Source: Annual Global Barometer on Hope and Despair conducted by affiliates of WIN-<strong>Gallup</strong> International Association. See details on:<br />
www.gallup.com.pk, www.gallup-international.com/<br />
[ 13 ]
WIN—<strong>Gallup</strong> International<br />
Job security in <strong>Iceland</strong><br />
Trend of Hope and Despair in <strong>Iceland</strong><br />
1977-2011<br />
(for all years for which data are available)<br />
Question: Do you think your present job is safe, or do you think<br />
there's a chance you may become unemployed?<br />
Percent of Respondents<br />
Serial # Years Present job safe<br />
Chance of<br />
unemployment<br />
DK/NR<br />
1 1997 85 14 1<br />
2 1998 87 11 2<br />
3 1999 66 10 24<br />
4 2000 88 11 1<br />
5 2001 85 13 2<br />
6 2002 80 17 3<br />
7 2003 81 16 4<br />
8 2004 86 11 4<br />
9 2005 87 11 2<br />
10 2006 91 8 1<br />
11 2007 83 12 5<br />
12 2008 69 31 .<br />
13 2009 73 26 1<br />
14 2010 72 28 0<br />
Source: Annual Global Barometer on Hope and Despair conducted by affiliates of WIN-<strong>Gallup</strong> International Association. See details on:<br />
www.gallup.com.pk, www.gallup-international.com/<br />
[ 14 ]
WIN—<strong>Gallup</strong> International<br />
Ease of Job in <strong>Iceland</strong><br />
Trend of Hope and Despair in <strong>Iceland</strong><br />
1977-2011<br />
(for all years for which data are available)<br />
Question: If you became unemployed, do you think you'd be able to<br />
find a new job fairly quickly, or do you think it might take longer?<br />
Percent of Respondents<br />
Serial # Years New job quickly May take longer<br />
Wouldn’t<br />
look<br />
DK/NR<br />
1 1997 65 25 . 10<br />
2 1998 74 19 2 5<br />
3 1999 58 15 . 27<br />
4 2000 75 20 . 5<br />
5 2001 28 65 7 0<br />
6 2002 31 59 0 10<br />
7 2003 58 30 0 12<br />
8 2004 67 24 0 10<br />
9 2005 14 78 0 8<br />
10 2006 77 14 0 9<br />
11 2007 79 9 3 9<br />
12 2008 47 47 6 .<br />
13 2009 53 40 5 2<br />
14 2010 56 38 5 1<br />
Source: Annual Global Barometer on Hope and Despair conducted by affiliates of WIN-<strong>Gallup</strong> International Association. See details on:<br />
www.gallup.com.pk, www.gallup-international.com/<br />
[ 15 ]
WIN—<strong>Gallup</strong> International<br />
Celebrating 34 years of The World’s Leading Global Barometer (1977-2011)<br />
For more details :<br />
Rushna Shahid Irene Zuettel<br />
Assisting <strong>Gallup</strong> International <strong>Gallup</strong> International<br />
Opinion Research Group Zurich<br />
Tele: +92-51-2655630 Tele: +41 (0) 44 806 6650<br />
Fax : +92-51-2655632 Fax : +41 (0) 44 806 6660<br />
Email: rushna.shahid@gallup.com.pk Email:jirene.zuettel@gallup-international.com<br />
Disclaimer: <strong>Gallup</strong> International Association is not related to <strong>Gallup</strong> Inc., headquartered in Washington D.C which is no longer a member of<br />
<strong>Gallup</strong> International Association. <strong>Gallup</strong> International Association does not accept responsibility for opinion polling other than its own. For<br />
further details see website: www.<strong>Gallup</strong>-international.com