
Create successful ePaper yourself
Turn your PDF publications into a flip-book with our unique Google optimized e-Paper software.
• TRADING TACTICS:<br />
Progressive entry<br />
technique<br />
• JAPAN:<br />
Land of the partially<br />
rising sun<br />
• THE “OTHER” DOLLAR:<br />
Canadian buck stuck?<br />
• HOW “G” MEETINGS<br />
impact the FX market<br />
• BIG PICTURE:<br />
What the pros know<br />
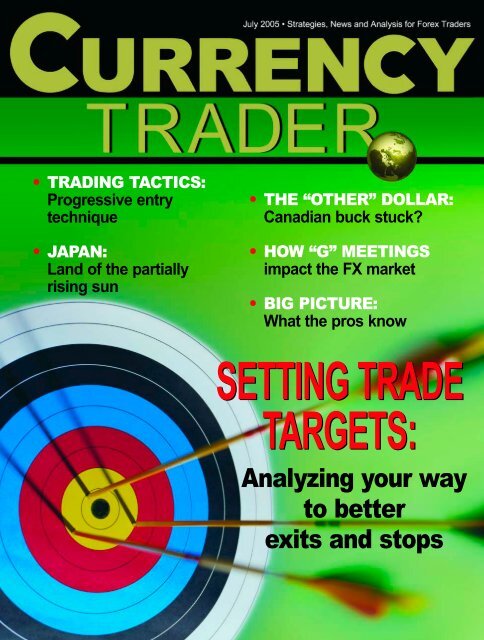
SETTING TRADE<br />
TARGETS:<br />
Analyzing your way<br />
to better<br />
exits and stops
CONTENTS<br />
Contributors . . . . . . . . . . . . . . . . . . . . .6<br />
Letters . . . . . . . . . . . . . . . . . . . . . . . . . .8<br />
Forex Resources . . . . . . . . . . . . . . . . .9<br />
Industry News<br />
Eurex begins trading<br />
currency futures . . . . . . . . . . . . . . . .10<br />
Eurex is entering the currency futures<br />
market and will offer 10 currency pairs.<br />
By Jeff Ponczak<br />
Global Economy<br />
Japanese yen . . . . . . . . . . . . . . . . . .12<br />
Analysts debate the import of the recent<br />
economic data out of Japan and the<br />
prospects for the yen in the months to come.<br />
By Currency Trader Staff<br />
Canadian dollar:<br />
2004 top likely to hold . . . . . . . . . . . .14<br />
An in-depth look at the economic growth<br />
prospects, central bank outlook, and other<br />
factors affecting the Canadian dollar.<br />
By Currency Trader Staff<br />
Spot Check<br />
Dollar/Swiss . . . . . . . . . . . . . . . . . . . .18<br />
Has the U.S. dollar/Swiss franc train already<br />
left the station?<br />
By Currency Trader Staff<br />
Big Picture<br />
What professional <strong>trade</strong>rs know<br />
that you don’t . . . . . . . . . . . . . . . . . .22<br />
What separates the pros from the posers<br />
in trading?<br />
By Barbara Rockefeller<br />
Trading Strategies<br />
Finding price <strong>targets</strong><br />
and risk points . . . . . . . . . . . . . . . . . .26<br />
Simple calculations can prevent guesswork<br />
when it comes to stop placement and profit<br />
taking, no matter what kind of trading system<br />
you use.<br />
By Thom Hartle<br />
Progressive entry technique . . . . . . .32<br />
Entering a <strong>trade</strong> in stages is sometimes<br />
better than going in all at once.<br />
By Boris Schlossberg<br />
continued on p. 4<br />
2 July 2005 • CURRENCY TRADER
CONTENTS<br />
“G” meetings:<br />
Do they move the market? . . . . . . . . .34<br />
A look at the impact of G7/G8 meetings on the<br />
dollar on the eve of July’s annual meeting.<br />
By David Bukey and Carlise Peterson<br />
Calendar . . . . . . . . . . . . . . . . . . . . . . .36<br />
Have a question about something you’ve seen in<br />
Currency Trader?<br />
Submit your editorial queries or comments to<br />
webmaster@currency<strong>trade</strong>rmag.com.<br />
Looking for an advertiser?<br />
Consult the list below and click on the company name for a direct link to the ad in this month’s<br />
FXCM Refco<br />
Gain Capital<br />
Chicago Expo<br />
ChoiceTrade<br />
issue of Currency Trader.<br />
Index of Advertisers<br />
Currency Futures<br />
CME engages retail <strong>trade</strong>rs . . . . . . . .37<br />
The futures exchange wants to bring more<br />
retail <strong>trade</strong>rs into the currency futures market.<br />
By Carlise Peterson<br />
International Market Summary . . .38<br />
Global News Briefs . . . . . . . . . . . . .40<br />
Forex Diary . . . . . . . . . . . . . . . . . . . . .42<br />
Key Concepts and Definitions . . . .43<br />
FX Praxis<br />
Forex For Small Speculators<br />
WorldCupAdvisor.com<br />
Forex Expo Moscow<br />
4 July 2005 • CURRENCY TRADER
A publication of Active Trader ®<br />
For all subscriber services:<br />
www.currency<strong>trade</strong>rmag.com<br />
Editor-in-chief: Mark Etzkorn<br />
metzkorn@currency<strong>trade</strong>rmag.com<br />
Managing editor: Molly Flynn<br />
mflynn@currency<strong>trade</strong>rmag.com<br />
Associate editor: Carlise Peterson<br />
cpeterson@currency<strong>trade</strong>rmag.com<br />
Associate editor: David Bukey<br />
dbukey@currency<strong>trade</strong>rmag.com<br />
Contributing editor: Jeff Ponczak<br />
jponczak@currency<strong>trade</strong>rmag.com<br />
Editorial assistant and<br />
Webmaster: Kesha Green<br />
kgreen@currency<strong>trade</strong>rmag.com<br />
Art director: Laura Coyle<br />
lcoyle@currency<strong>trade</strong>rmag.com<br />
President: Phil Dorman<br />
pdorman@currency<strong>trade</strong>rmag.com<br />
Publisher,<br />
Ad sales East Coast and Midwest:<br />
Bob Dorman<br />
bdorman@currency<strong>trade</strong>rmag.com<br />
Ad sales<br />
West Coast and Southwest only:<br />
Allison Ellis<br />
aellis@currency<strong>trade</strong>rmag.com<br />
Classified ad sales: Mark Seger<br />
mseger@currency<strong>trade</strong>rmag.com<br />
Volume 2, Issue 7. Currency Trader is published monthly by TechInfo, Inc.,<br />
150 S. Wacker Drive, Suite 880, Chicago, IL 60606. Copyright © 2005<br />
TechInfo, Inc. All rights reserved. Information in this publication may not be<br />
stored or reproduced in any form without written permission from the publisher.<br />
The information in Currency Trader magazine is intended for educational purposes<br />
only. It is not meant to recommend, promote or in any way imply the<br />
effectiveness of any trading system, strategy or approach. Traders are advised<br />
to do their own research and testing to determine the validity of a trading idea.<br />
Trading and investing carry a high level of risk. Past performance does not<br />
guarantee future results.<br />
CONTRIBUTORS<br />
CONTRIBUTORS<br />
Thom Hartle is a private <strong>trade</strong>r<br />
and president of Market Analytics Inc.<br />
(www.thomhartle.com). In a career<br />
spanning more than 20 years, Hartle<br />
has been a commodity account executive<br />
for Merrill Lynch, vice president of<br />
financial futures for Drexel Burnham Lambert, <strong>trade</strong>r for<br />
the Federal Home Loan Bank of Seattle, and editor for<br />
nine years of Technical Analysis of Stocks & Commodities<br />
magazine.<br />
Barbara Rockefeller (www.rts-forex.com) is an<br />
international economist with a focus on foreign<br />
exchange. She has worked as a forecaster, <strong>trade</strong>r, and consultant<br />
at Citibank and other financial institutions, and<br />
currently publishes two daily reports on foreign<br />
exchange. Rockefeller is the author of Technical Analysis<br />
for Dummies (2004), 24/7 Trading Around the Clock, Around<br />
the World (John Wiley & Sons, 2000), The Global Trader<br />
(John Wiley & Sons, 2001), and How to Invest<br />
Internationally, published in Japan in 1999. A book tentatively<br />
titled How to Trade FX is in the works.<br />
Boris Schlossberg is a senior currency<br />
strategist at Forex Capital Markets<br />
in New York. He is also a guest lecturer<br />
at www.fxstreet.com, covering proper<br />
risk management, <strong>trade</strong>r psychology,<br />
and true market structure. Schlossberg is<br />
a frequent commentator for Reuters and Dow Jones/CBS<br />
Marketwatch currency and bond market sections. He has<br />
been an independent <strong>trade</strong>r since 1999, trading a variety<br />
of instruments including stocks, options, futures, and<br />
currencies.<br />
6 July 2005 • CURRENCY TRADER
LETTERS<br />
Code name:<br />
Pharos<br />
In each issue of Currency Trader<br />
you feature a currency trading<br />
system. In the June edition,<br />
you published “Pharos FX<br />
System.” Where can I get the<br />
Wealth-Lab code for this?<br />
—Alex Hinder<br />
Switzerland<br />
Not a fake letter<br />
Iam a subscriber to Currency<br />
Trader, your excellent magazine<br />
on forex trading. I have yet to see<br />
a better forex magazine. I love my electronic<br />
copies so much, I want to obtain<br />
hard copies so I can read them when<br />
I’m away from my computer.<br />
—Patrick<br />
The code is proprietary, but we are<br />
working to get a version to post on our<br />
code page (www.active<strong>trade</strong>rmag.com<br />
/code.htm).<br />
Thank you very much. You’ll have<br />
to print out your favorite pages of<br />
Currency Trader — it’s electronic only<br />
because we have a global readership<br />
we want to reach at the same time each<br />
month. Try printing out the pages that<br />
don’t require color in black-and-white<br />
to save on ink and printing time.<br />
The FX option<br />
Iwould like to know where I could<br />
go to read up on forex options, in<br />
particular what the different<br />
strategies are called vs. regular<br />
options. Are “spreads” call “spreads”<br />
in forex? For example, can you place a<br />
bull call spread in forex — that is can<br />
you buy and sell two call options at<br />
the same time?<br />
Spot forex options are a breed apart,<br />
actually. The article “Forex options” in<br />
the June issue of Options Trader<br />
explains the terminology and illustrates<br />
different kinds of strategies.
FOREX RESOURCES<br />
MetaQuotes Software<br />
Corp. has released<br />
MetaTrader 4, the latest version<br />
of their forex trading<br />
system. MetaTrader 4 is<br />
designed to organize brokerage<br />
services for forex, CFD,<br />
and futures. It includes both<br />
a client terminal to be<br />
installed on the <strong>trade</strong>r’s<br />
computer and back office<br />
components to process trading<br />
operations on the broker’s<br />
side. MetaTrader 4’s<br />
client terminal processes a<br />
wide array of orders: market<br />
orders, pending orders (buy<br />
stop, buy limit, sell stop, sell<br />
limit), stop loss and take<br />
profit, and trailing stop.<br />
eSignal and Hotspot<br />
FX Inc. announced the<br />
availability of Hotspot FX’s<br />
foreign exchange data via<br />
eSignal’s market data and news platforms. Hotspot FX is<br />
known for its multibank data, and its participating banks<br />
are fully integrated into the Hotspot FX marketplace, providing<br />
ongoing liquidity and a virtual clearinghouse network.<br />
eSignal products are available for purchase online or<br />
by calling (800) 833-1228. Visit eSignal’s Web site<br />
(www.esignal.com) for a complete list of features and pricing<br />
options.<br />
To <strong>trade</strong> on Hotspot FX, individuals, broker/dealers, and<br />
FCMs representing retail <strong>trade</strong>rs can establish omnibus or<br />
direct accounts with Hotspot FX’s fully regulated Futures<br />
Commission Merchant (FCM). To <strong>trade</strong> on Hotspot FXi,<br />
Hotspot FX’s institutional marketplace, establish an<br />
account with any of the top-rated clearing banks and prime<br />
brokers in Hotspot FXi’s network.<br />
CNBC World’s new and only global program,<br />
“Foreign Exchange,” brings together the worldwide<br />
resources of CNBC and Dow Jones providing up-to-theminute<br />
news and analysis about the forex market. “Foreign<br />
Exchange” is anchored by The Wall Street Journal’s Bob<br />
O’Brien in New York with Dow Jones Newswires’ Nick<br />
Hastings reporting from London. The 15-minute show airs<br />
weekdays at 8:30 a.m. ET.<br />
Forex Revolution: An Insider’s Guide to the Real World of Foreign Exchange Trading<br />
By Peter Rosenstreich<br />
Financial Times Prentice Hall, 2005<br />
Hardback, 277 pages<br />
$34.95<br />
Rosenstreich gives an overview of foreign exchange trading without touting any particular<br />
trading strategy. Real trading experiences are supplemented with basic definitions. The<br />
book’s last three chapters cover fundamental and technical trading methods and currency<br />
trends, among other topics.<br />
CURRENCY TRADER • July 2005 9
MARKET NEWS BY JEFF PONCZAK<br />
Eurex vs. the CME<br />
Eurex begins trading currency futures<br />
Eurex, the world’s top derivatives<br />
exchange by volume,<br />
had virtually no success<br />
the first time it tried to<br />
compete against an established U.S.<br />
futures market. However, that’s not<br />
stopping the Frankfurt, Germanybased<br />
exchange from trying<br />
again.<br />
In mid-June, Eurex<br />
announced it would<br />
begin trading currency<br />
futures, competing with<br />
not only the Chicago<br />
Mercantile Exchange,<br />
which has the lion’s share<br />
of exchange-<strong>trade</strong>d currency<br />
futures volume,<br />
but also the enormous<br />
interbank market.<br />
“Our core strengths lie<br />
in the equity, fixed<br />
income, and index markets,” says<br />
Rudolf Ferscha, CEO of Eurex. “The<br />
foreign exchange market is adjacent to<br />
those markets and very often linked<br />
directly to <strong>trade</strong> on those markets.<br />
“The system we have — the infrastructure,<br />
the trading engine — is very<br />
suitable to high-volume financial products,<br />
so we will have very low marginal<br />
costs added to what we run currently.<br />
We don’t need to reinvent the<br />
wheel.”<br />
The futures will <strong>trade</strong> on Eurex U.S.<br />
because the American exchange can<br />
<strong>trade</strong> 23 hours a day, something the<br />
European platform is not capable of.<br />
“Forex fills the gaping hole in the<br />
financial asset category Eurex is trading,”<br />
Ferscha says. “We are trading<br />
them on Eurex U.S. because they can<br />
<strong>trade</strong> 23 hours a day and also because<br />
the main users of futures in the FX<br />
space are American, and there is a very<br />
established behavior in the states that<br />
uses FX futures rather than using the<br />
interbank or other venues to express<br />
views on what is going on in the forex<br />
market.”<br />
Eurex will begin with 10 currency<br />
pairs: The Euro, British pound, Japanese<br />
yen, Swiss franc, Canadian dollar, and<br />
Australian dollar, vs. the U.S. dollar, and<br />
the Euro vs. yen, Euro vs. pound, Euro<br />
vs. franc, and pound vs. yen.<br />
“We wanted to start with the core<br />
products,” says Satish Nandapurkar,<br />
CEO of Eurex U.S. “These<br />
are the ones where we<br />
could really bring the market<br />
making together with<br />
the end users immediately<br />
from the U.S. and Europe.<br />
But these are by no means<br />
the only FX products we<br />
will ever have.<br />
“This is a complete commitment<br />
into the FX space,<br />
and as such we will enter<br />
into the market and we<br />
will expand the market as<br />
we see customer demand.<br />
Going into some of these emerging<br />
markets currencies as we get established<br />
is a good way to go.”<br />
Early fall launch<br />
The products will begin trading Sept.<br />
23, and each contract will have a<br />
notional value of $250,000 — twice<br />
that of a CME contract. All fees will be<br />
waived for the remainder of 2005,<br />
although the standard fee will be 50<br />
cents per contract side.<br />
“If you add in clearing fees, our con-<br />
tracts will cost between $5 and $8 per<br />
million, which makes us competitive<br />
with OTC and much cheaper than existing<br />
exchange fees,” Nandapurkar says.<br />
Eurex will set up an incentive program<br />
through the end of 2007 that will<br />
allow market makers and proprietary<br />
trading firms that do a minimum volume<br />
and/or provide continuous twosided<br />
markets to get free or reduced<br />
trading costs and participate in a revenue-sharing<br />
plan.<br />
“We are changing the model,”<br />
Nandapurkar says. “Many electronic<br />
platforms are charging their liquidity<br />
providers for the privilege of providing<br />
liquidity. We’re enfranchising the liquidity<br />
providers by waiving their fees<br />
and letting them share in our success.”<br />
Besides the 23-hour trading day, the<br />
decision to list the products on Eurex<br />
U.S. also gives the floundering<br />
exchange another chance at making an<br />
impact in the derivatives world. In<br />
announcing its decision to <strong>trade</strong> currency<br />
futures, Eurex U.S. also announced it<br />
would no longer actively promote its<br />
U.S. treasury products (see “Eurex U.S.<br />
shifts from Treasuries to currencies,”<br />
Active Trader, September 2005).<br />
“We are refocusing our resources<br />
toward index and FX products,”<br />
Nandapurkar says. “The window of<br />
opportunity with treasuries has<br />
passed. The existing treasury products<br />
Euro ETF coming soon?<br />
Rydex Investments has applied for permission to <strong>trade</strong> the first-ever currency<br />
ETF pegged to the price of the Euro. The Euro Currency Trust would<br />
<strong>trade</strong> under the symbol FXE if approved by the Securities and Exchange<br />
Commission.<br />
Each share of the ETF will represent 40 Euros, and the price will be based<br />
on the Federal Reserve Bank of New York’s noon buying rate. So, if the rate<br />
is 1.25, the ETF will be priced at $50.<br />
Although the ETF represents a cheap way to <strong>trade</strong> the Euro, it may have<br />
difficulty drawing customers, as currency <strong>trade</strong>rs aren’t likely to switch and<br />
lose the 50- or 100-to-1 leverage available to them in the spot forex and currency<br />
futures markets, while other <strong>trade</strong>rs may be leery of anything associated<br />
with the forex market.<br />
10 July 2005 • CURRENCY TRADER
will remain listed but no new sales,<br />
marketing or incentive programs will<br />
be initiated.<br />
Nandapurkar blames anti-competitive<br />
measures by the CME and<br />
Chicago Board of Trade for Eurex<br />
U.S.’s failure to compete with the<br />
CBOT in the treasury market.<br />
“The delays in the Global Clearing<br />
Link, which we feel were impacted by<br />
efforts by our competitors, and also<br />
predatory pricing by the CBOT put<br />
into place when they cut their fees to<br />
zero right when we launched, really<br />
pushed us past that window [of<br />
opportunity] and are the key aspects<br />
of our anti-trust litigation against the<br />
CBOT and CME.”<br />
Ferscha says he hopes Phase II of the<br />
Global Clearing Link, which will completely<br />
link Eurex U.S. and Eurex customers,<br />
both from a clearing and trading<br />
standpoint, will be approved<br />
quickly.<br />
And, while Eurex’s direct competitor<br />
on the exchange side will be the<br />
CME, there are numerous players in<br />
the forex arena.<br />
“We are competing with all venues<br />
that are active in forex,” Ferscha says.<br />
“Many are interbank, many are whitelabels<br />
(i.e., introducing brokers), and<br />
many are cleared by prime brokerages<br />
and so on. So we are competing with a<br />
multitude of players, and I think that’s a<br />
good thing. We are delivering the product<br />
at a low cost, and we can do that<br />
because it is only a marginal cost to us.”<br />
The CME has already made efforts<br />
to tap into the spot forex market by<br />
hooking up with Reuters.<br />
Nandapurkar says Eurex is exploring<br />
similar arrangements.<br />
“Forex is a fragmented space, and<br />
we are always interested in knowing<br />
what’s going on,” he says. “As we are<br />
a new player, it is our desire to talk to<br />
all different marketplaces and under-<br />
stand if there is some way we can<br />
work together.”<br />
Nandapurkar also says Eurex has<br />
plans to list options on the currency<br />
futures, but no timetable for that has<br />
been announced.<br />
The CME is not concerned with<br />
Eurex’s recent decision to drop<br />
Treasuries and pick up Forex.<br />
“We are refocusing our resources toward index and FX products. The<br />
window of opportunity with treasuries has passed.”<br />
— Satish Nandapurkar, CEO Eurex U.S.<br />
CME lowers fees for forex<br />
hedge funds and CTAs<br />
Beginning Aug. 1, the CME will<br />
introduce a one-year incentive<br />
program designed to attract large<br />
hedge funds and commodity trading<br />
advisors (CTAs) to its foreign<br />
exchange markets. Large hedge<br />
funds and CTAs with more than $2<br />
billion under management will be<br />
eligible to <strong>trade</strong> CME forex products<br />
on Globex for $0.60 per side,<br />
vs. the current electronic trading<br />
fee of $1.60.<br />
“We are clearly well ahead of them,”<br />
says Rick Sears, director of foreign<br />
exchange at the CME. “We already<br />
compete with a whole host of platforms,<br />
and we’ve had FX futures for 34<br />
years. We have a lot of competition.<br />
We’ve lowered prices for hedge funds<br />
and CTAs — we are well aware of our<br />
competition.”<br />
HIT YOUR MARK!<br />
Advertise in<br />
Active Trader and Currency Trader Magazines<br />
Contact Bob Dorman<br />
Ad sales East Coast<br />
and Midwest<br />
bdorman@active<strong>trade</strong>rmag.com<br />
(312) 775-5421<br />
Allison Ellis<br />
Ad sales West Coast<br />
and Southwest<br />
aellis@active<strong>trade</strong>rmag.com<br />
(626) 497-9195<br />
Mark Seger<br />
Account Executive<br />
mseger@active<strong>trade</strong>rmag.com<br />
(312) 377-9435<br />
CURRENCY TRADER • July 2005 11
GLOBAL ECONOMY<br />
As of mid-June, U.S. dollar/Japanese<br />
yen bulls<br />
have pressed the<br />
USD/JPY rate to the<br />
highest levels seen in 2005 — up to<br />
109.70. However, some ana-<br />
lysts believe the recent up<br />
move is running out of steam<br />
and the odds favor a reversal<br />
to lower levels in the months<br />
ahead — despite some strong<br />
economic numbers recently.<br />
Analysts have pointed to<br />
signs of improvement in the<br />
Japanese economy as a factor<br />
supporting the yen. In the first<br />
quarter, GDP data surprised<br />
economists with an unexpected<br />
4.9-percent annualized<br />
reading. Most market watchers<br />
had only expected a 2.6 percent<br />
gain.<br />
“In general, things are looking<br />
more constructive in the<br />
economy,” says Robert Sinche,<br />
head of global currency strategy<br />
at Bank of America.<br />
“Corporate sector balance sheets and<br />
profitability are looking quite solid.”<br />
The Ministry of Finance’s most<br />
recent Financial Statements Statistics of<br />
Corporations by Industry report suggests<br />
Japan’s corporate sector is performing<br />
well despite higher oil prices<br />
and a slowdown in foreign demand.<br />
On an all-industries basis, sales rose<br />
1.5 percent quarter-on-quarter, the<br />
fastest growth in three quarters.<br />
Japanese yen<br />
Strong first quarter Japanese GDP growth surprised analysts, and some market watchers believe the<br />
dollar/yen has topped out for the time being.<br />
Also, Sinche points out “nominal<br />
wages were actually up on a yearover-year<br />
basis [this spring]. For years<br />
households have been looking at<br />
declining nominal wages.”<br />
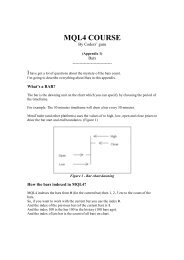
FIGURE 1 — DOLLAR/YEN<br />
U.S. dollar/Japanese yen (USD/JPY), daily<br />
Sizzling pace to slow?<br />
Despite these impressive-looking<br />
growth numbers, many Japan watchers<br />
don’t expect the Japanese economy<br />
to keep up that growth pace through<br />
the remainder of the year.<br />
“Much of the growth reflected a<br />
rebound from special factors that<br />
depressed growth in the fourth quarter,<br />
including earthquakes, typhoons, and<br />
unseasonably warm weather,” explains<br />
Peter Morgan, chief economist at HSBC<br />
Securities Japan. “The growth from<br />
here is likely to be slower.”<br />
The slow growth of Japanese<br />
The U.S. dollar/Japanese yen recently made new 2005 highs, but market watchers are<br />
looking for signs of weakness.<br />
27 4 11 18 25 1 8 15 22 29 6 13 20 27 3 10 17 24 31 7 14 21 28 7 14 21 28 7 11 18 25 2 9 16 23 30 6 13 20<br />
October November December 2005 February March April May June<br />
Source: eSignal<br />
BY CURRENCY TRADER STAFF<br />
exports and possible economic slowdowns<br />
in the U.S. and China are factors,<br />
which could also weigh on<br />
Japanese growth prospects throughout<br />
the remainder of 2005.<br />
Nonetheless, Jim Glassman, senior<br />
economist at JP Morgan Chase in New<br />
York is upbeat on the overall outlook<br />
for the Japanese economy.<br />
“In general, we feel things are turning<br />
better there,” he says. “I don’t<br />
12 July 2005 • CURRENCY TRADER<br />
112.0<br />
111.0<br />
110.0<br />
109.0<br />
108.0<br />
107.0<br />
106.0<br />
105.0<br />
104.0<br />
103.0<br />
102.0
elieve anyone thinks, ‘OK, we are off<br />
to the races now,’ but we expect<br />
Japan’s growth in the quarters ahead<br />
to be around 2 percent.”<br />
Deflation continues to be a concern<br />
in Japan, and until it disappears, most<br />
analysts don’t see significant yen<br />
appreciation. However, it appears the<br />
end of that cycle may be near.<br />
“At -1.2 percent year-overyear,<br />
deflation is still significant<br />
at the GDP level,” Morgan<br />
says.<br />
However, he also says at the<br />
core consumer price index<br />
(CPI) level, deflation doesn’t<br />
look as bad, with a recent -0.2<br />
percent year-over-year reading.<br />
He expects CPI growth to<br />
stay negative in 2005, but turn<br />
positive in 2006.<br />
When looking at the Far<br />
East as a whole, Brian Dolan,<br />
director of research at Gain<br />
Capital, is optimistic.<br />
“The Asian region continues<br />
to be quite strong and there are<br />
few signs it’s slowing,” he<br />
says. “Taiwan, Korea, and Singapore<br />
are all doing very well. The Asian trajectory<br />
still looks very solid.”<br />
That compares favorably to Europe<br />
and the U.S., where most analysts<br />
expect slowing growth this year.<br />
Goose eggs:<br />
Monetary policy still on hold<br />
The Bank of Japan’s (BOJ) overnight<br />
rate remains at zero and many analysts<br />
believe the zero-interest rate policy is<br />
likely to persist through year-end.<br />
Recent comments from the BOJ reiterated<br />
the Bank’s commitment to an easy<br />
monetary policy stance, while deflation<br />
continues to linger.<br />
“They are not anywhere near ready<br />
to pull the plug on the zero-interest<br />
rate policy,” says Glassman.<br />
Looking ahead, Glassman says key<br />
economic factors to watch are structural<br />
improvement and increased consumer<br />
spending.<br />
Dollar/yen toppy near 110.00<br />
Given the overall strength in the Asian<br />
region, Dolan believes the dollar/yen<br />
is close to a top in the 110.00 area as of<br />
mid-June. Ultimately, he looks for dollar/yen<br />
to retreat and consolidate in<br />
the 104.00/105.00 zone in the fall<br />
months. However, as signs emerge of<br />
FIGURE 2 — EURO/YEN<br />
Euro/Japanese yen (EUR/JPY), daily<br />
additional strength in the Japanese<br />
and Asian region overall, he expects a<br />
move toward the 100/98.00 region by<br />
year-end.<br />
Dolan’s advice: “Look for the<br />
opportunity to buy yen on the crosses<br />
(non-dollar cross rates), and buy yen on<br />
dollar strength into the 109.00/111.00<br />
area,” he says. “Be prepared right now<br />
for some consolidation around<br />
104.00/105.00. But <strong>trade</strong>rs need to<br />
keep an eye on the downside. When<br />
the 104.00/104.20 area is broken, it will<br />
unleash a flood of yen buying.”<br />
Sinche calls risk/reward levels<br />
attractive for the short side at current<br />
levels, around 109.00 in mid June.<br />
“We are near the upper end of the<br />
dollar/yen range,” he says.<br />
While China continues to be a wild<br />
card, some analysts now expect flexibility<br />
in its currency (which is currently<br />
pegged to the U.S. dollar) as early as<br />
this summer, which ultimately should<br />
support the yen.<br />
Sinche sees potential for the dollar/yen<br />
to retreat back below 105.00 in<br />
the near term and overall hover in a<br />
103.00/109.00 range in the second half.<br />
On the crosses<br />
Most analysts believe the yen is a<br />
strong buy on many major crosses,<br />
Few analysts see the Euro holding up against the yen in the near future.<br />
13 20 27 3 10 17 24 31 7 14 21 28 7 14 21 28 4 11 18 25 2 9 16 23 30 6 13 20<br />
2005<br />
Source: eSignal<br />
February March April May June<br />
including the Euro/yen (EUR/JPY),<br />
Swiss franc (CHF/JPY), and the British<br />
pound (GBP/JPY).<br />
“The European economy and the<br />
UK continue to stagnate, with no plan<br />
or ammunition to rejuvenate growth,”<br />
says Dolan. “[I don’t see] anything in<br />
the next couple of years which will<br />
help the European economy to<br />
rebound, while the Asian region is the<br />
story for the next several years.”<br />
The EUR/JPY rate, which was trading<br />
around 131.50 mid-June, could fall<br />
toward 130.00 initially, but eventually<br />
retreat to the 124.00/125.00 area in the<br />
second half, according to Dolan.<br />
Tom Rogers, senior currency analyst<br />
at Thomson Financial, agrees. He sees<br />
potential for Euro/yen to retreat to the<br />
126.00/125.00 area.<br />
“There is interest to sell Euro/yen,”<br />
he says. “People hate the Euro because<br />
of all the political stuff that is going on<br />
over there. There is no real hope for<br />
Euro/yen.”<br />
CURRENCY TRADER • July 2005 13<br />
142.0<br />
140.0<br />
138.0<br />
136.0<br />
134.0<br />
132.0
GLOBAL ECONOMY continued<br />
After scoring 11 1/2 year<br />
highs vs. the U.S. dollar<br />
in late 2004, the<br />
Canadian dollar has<br />
backed off those lofty levels in the first<br />
half of 2005. The surge in the greenback<br />
has played a part in the decline of<br />
the U.S. dollar/Canadian dollar<br />
(USD/CAD) rate (Figure 1), but internal<br />
Canadian dynamics also have contributed<br />
to the depreciation in the<br />
Canadian currency.<br />
Given the stronger U.S. dollar, the<br />
Bank of Canada’s (BOC) concern for<br />
significant currency appreciation, and<br />
the negative interest rate differential<br />
between Canada and the U.S., the<br />
$1.17 USD/CAD level set in<br />
November 2004 may represent an<br />
important top for the Canadian dollar<br />
vs. the U.S. buck, analysts say.<br />
Canadian economy:<br />
Not great, but still good<br />
While Canadian growth data may not<br />
look stellar, it is in positive territory<br />
and is supported by strong internal<br />
consumer demand.<br />
Recent economic numbers have<br />
elicited surprise on the upside. For<br />
example, the May employment report<br />
revealed 35,000 new jobs vs. forecasts<br />
for a 16,000 increase. Also, on the <strong>trade</strong><br />
Canadian dollar:<br />
2004 top likely to hold<br />
Canada has enjoyed good news on the domestic economic front recently.<br />
Is it enough to bring the Canadian dollar back to its lofty 2004 levels vs. the U.S. buck?<br />
BY CURRENCY TRADER STAFF<br />
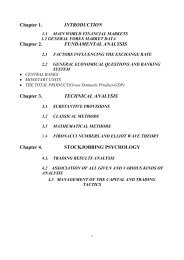
FIGURE 1 — ROUGH RIDE IN '05<br />
The USD/CAD low in November 2004 marked the height of the Canadian<br />
dollar's rise against the U.S. buck. Since then, the USD/CAD rate has zig<br />
zagged higher.<br />
U.S. dollar/Canadian dollar (USD/CAD), daily<br />
Dec. 2005 Feb. March April May June<br />
Source: TradeStation<br />
front, there was a higher-than-expected<br />
C$5.1 billion (vs. a C$4.5 billion<br />
estimate) April surplus.<br />
The latest gross domestic product<br />
(GDP) numbers have come in under<br />
the BOC’s 3-percent growth target; the<br />
first quarter saw a 2.3 percent reading.<br />
Johnathon Basile, economist at Credit<br />
Suisse First Boston, expects second-<br />
quarter GDP to come in at 2.9 percent.<br />
Looking into the second half, Basile is<br />
more upbeat, with a forecast for 3.7<br />
percent GDP growth for both the third<br />
and fourth quarters.<br />
The inflation picture remains relatively<br />
well-contained, as core CPI<br />
inflation eased to a 1.7-percent yearover-year<br />
reading in April, which<br />
14 July 2005 • CURRENCY TRADER<br />
1.26<br />
1.24<br />
1.22<br />
1.20<br />
1.18
FIGURE 2 — THREE-YEAR RUN<br />
The Canadian dollar's big run vs. the U.S. dollar began at the beginning of<br />
2002, when the USD/CAD rate was up around 1.61.<br />
U.S. dollar/Canadian dollar (USD/CAD), monthly<br />
1996 1997 1998 1999 2000 2001 2002 2003 2004 2005<br />
Source: TradeStation<br />
remains below the BOC’s 2-percent<br />
target rate.<br />
Too much currency strength?<br />
A longer-term monthly chart of<br />
USD/CAD (Figure 2) shows a substantial<br />
appreciation in the Canadian<br />
currency from January 2002, when the<br />
pair was trading at $1.61, to the<br />
USD/CAD bottom in November<br />
2004.<br />
By the end of 2004, economists said<br />
the hefty appreciation in the Canadian<br />
currency actually began to dampen<br />
the export sector and was a factor in<br />
slowing the growth.<br />
“BOC members weren’t too happy<br />
with the strength in the Canadian dollar,”<br />
says Tim Mazanec, senior forex<br />
strategist at Investors Bank and Trust.<br />
“A dollar-seventeen was too strong.”<br />
Fourth quarter 2004 GDP data came<br />
in at 3.0 percent. But the weakening of<br />
the export sector, with 3-percent annualized<br />
declines in both the third and<br />
fourth quarters in 2004, translated into<br />
slower economic growth in early 2005.<br />
However, domestic demand seems<br />
to have stepped in to fill at least some<br />
of the void.<br />
“There has been a reversal in the<br />
drivers of growth in Canada,”<br />
explains Charmaine Buskas, economist<br />
at Economy.com. “In 2003 and<br />
2004, exports were driving the economy.<br />
But by the end of 2004, exports<br />
started to soften as we saw a very<br />
strong currency. We also had a slowdown<br />
in global and U.S. demand for<br />
Canadian exports.”<br />
Nonetheless, a surge in domestic<br />
demand, with improving employment<br />
numbers and signs of stronger retail<br />
sales data, has been carrying the<br />
Canadian economy.<br />
“Domestic demand is a very large<br />
portion of the Canadian economy,”<br />
says Buskas. “But I don’t think the<br />
Canadian consumer has enough<br />
wherewithal to pick up the entire<br />
drop-off from the export side.”<br />
continued on p. 16<br />
CURRENCY TRADER • July 2005 15<br />
1.60<br />
1.55<br />
1.50<br />
1.45<br />
1.40<br />
1.35<br />
1.30<br />
1.25<br />
1.20<br />
At ChoiceTrade<br />
we are all about "Choices"<br />
Choices in products,<br />
service and price.<br />
~NOW~<br />
Trade Options for as low as<br />
75 /contract ¢<br />
LOW COMMISSIONS<br />
NO TRADE FEE<br />
21+ contract <strong>trade</strong>s — each contract 75¢<br />
20 or less contract <strong>trade</strong>s — 99¢ / contract (min $5.00)<br />
Unmatched service<br />
and support<br />
Yes, we have the price<br />
that’s right.<br />
Yes, we’ve got the tools.<br />
And when the need arises,<br />
we’re there for you!<br />
Unlike most active <strong>trade</strong>r<br />
brokers, we haven’t<br />
forgotten that even the<br />
savviest <strong>trade</strong>r expects<br />
customer service that can be<br />
depended upon at<br />
critical moments.<br />
Open an account today<br />
and see what everyone is<br />
talking about!<br />
Come visit us at:<br />
www.choice<strong>trade</strong>.com<br />
Member NASD / SIPC
GLOBAL ECONOMY continued<br />
Key economic challenge<br />
“The domestic economy is in good<br />
shape, but it still needs to work<br />
through an inventory adjustment,”<br />
Basile says. He points to the manufacturing<br />
sector, particularly vehicle production<br />
and auto parts, as an area that<br />
still presents challenges to the<br />
Canadian growth picture.<br />
“Demand and supply got out of balance,”<br />
he adds. “Supply ran too fast<br />
after the shock of the currency appreciation<br />
in 2004.”<br />
Basile also believes the surplus of<br />
autos in the U.S. is a negative factor for<br />
Canada.<br />
“We had too many light trucks and<br />
bigger SUVs in the U.S. that weren’t<br />
selling,” he says. “[General Motors]<br />
notably had trouble selling bigger<br />
SUVs. There was an inventory problem<br />
in the U.S.; dealer lots were overstocked<br />
and they had to cut production<br />
in the U.S. and Canada.”<br />
However, looking beyond the summer<br />
months, Basile believes the inventory<br />
adjustment will be resolved.<br />
Pointing to his 3.7 percent GDP forecasts<br />
for the third and fourth quarters,<br />
which are above BOC forecasts, he<br />
explains, “I think we will get a bigger<br />
swing from inventories.”<br />
Negative interest-rate<br />
differentials<br />
Most analysts think the BOC is currently<br />
on hold, with the bank-lending<br />
rate sitting at 2.5 percent. However,<br />
most forecasters see a potential tightening<br />
as early as the Sept. 7 BOC meeting,<br />
especially if faster growth numbers<br />
emerge. But given the overall gap<br />
between Canadian and U.S. rates, this<br />
differential should continue to act as a<br />
bearish factor for the Canadian dollar<br />
FIGURE 3 — THE EURO PLAY<br />
Some analysts believe the EUR/CAD rate could continue to weaken because of<br />
perceived political bickering and continued economic malaise in Europe.<br />
Euro/Canadian dollar (EUR/CAD), daily<br />
Dec. 2005 Feb. March April May June<br />
Source: TradeStation<br />
in the months ahead.<br />
“The spread between short-term<br />
rates favors the U.S. dollar and it doesn’t<br />
look like the Fed will stop its tightening<br />
anytime soon,” Basile says.<br />
His forecast for the U.S. fed funds<br />
rate is 4 percent by year-end, vs. a<br />
3-percent Canadian bank rate.<br />
“The rate spread has turned in favor<br />
of U.S. assets,” agrees Buskas. “Global<br />
investors looking for yield have turned<br />
to the U.S.”<br />
Dollar/Canada forecast<br />
Most analysts believe the $1.17 area in<br />
dollar/Canada will not be revisited<br />
anytime soon. In fact, most favor a<br />
continuation of the recent uptrend,<br />
with <strong>targets</strong> around $1.27 over a threemonth<br />
horizon and $1.30 over a<br />
twelve-month horizon.<br />
“I don’t expect us to retest $1.17 or<br />
even $1.20,” says Mazanec.<br />
He points to $1.28 as his year-end<br />
target for the USD/CAD rate.<br />
“I’d be buying dips in<br />
dollar/Canada,” he says.<br />
On the crosses<br />
In recent weeks, the Canadian dollar<br />
appreciated significantly vs. the Euro,<br />
as Euro/Canadian dollar (EUR/USD)<br />
has moved from the $1.60 area in May<br />
to $1.50 in mid June (Figure 3). Traders<br />
looking for opportunities on the crosses<br />
may want to consider a short<br />
Euro/long Canadian dollar play, given<br />
the struggling economic picture seen<br />
in the Euro zone, according to Jamie<br />
Coleman, managing analyst at IFR-<br />
Forex Watch.<br />
“Sell strength toward $1.56, with a<br />
target at $1.49 and then $1.42,” he says.<br />
Coleman actually called buying the<br />
Canadian dollar vs. the Euro (rather<br />
than the U.S. dollar) “a safer plan<br />
because the U.S. dollar will continue to<br />
strengthen.”<br />
Questions or comments? Click here.<br />
16 July 2005 • CURRENCY TRADER<br />
1.66<br />
1.64<br />
1.62<br />
1.60<br />
1.58<br />
1.56<br />
1.54<br />
1.52<br />
1.50
SPOT CHECK<br />
FIGURE 1 — USD/CHF, DAILY<br />
The strength of the current dollar/Swiss rally is shown by how long two common<br />
oscillators — the relative strength index (RSI) and stochastics — have been at<br />
or near their typical overbought levels.<br />
U.S. dollar/Swiss franc (USD/CHF), monthly<br />
Source: TradeStation<br />
U.S. dollar/Swiss franc (USD/CHF), daily<br />
Stochastic<br />
RSI<br />
February March April May June<br />
Source: TradeStation<br />
FIGURE 2 — LONG-TERM PERSPECTIVE<br />
In late 2004, the USD/CHF rate virtually matched its 1995 low of 1.1172. May<br />
and June 2005 were particularly strong months for the currency pair.<br />
1995 2000 2005<br />
In mid-June, much of the news<br />
in the forex world revolved<br />
around the implications of the<br />
EU constitution no-votes on<br />
the Euro, whether the U.S. dollar<br />
would be able to sustain its first-half<br />
performance, and whether Japan’s<br />
recent strong economic numbers<br />
would continue to buoy the yen.<br />
The fact that the U.S. dollar/Swiss<br />
franc rate (USD/CHF) had gained the<br />
most ground over the preceding three<br />
months of any major currency pair<br />
(up more than 800 pips, or 7 percent,<br />
as of June 29) managed to slip under<br />
the radar. Is there more room for the<br />
dollar to gain ground against the<br />
franc, or has the explosive part of the<br />
rally already completed?<br />
“Swiss miss” (Currency Trader, May<br />
2005) pointed out the strength in the<br />
dollar/Swiss rate was driven by<br />
somewhat unexpected dollar bullishness<br />
early in the year against a backdrop<br />
of persistent Swiss economic<br />
malaise.<br />
Even then, however, some analysts<br />
were predicting a temporary decline<br />
in the dollar/Swiss. As of late June, it<br />
hadn’t happened. The currency pair<br />
has essentially marched upward without<br />
interruption since April 21, and<br />
virtually every off-the-shelf momen-<br />
18 July 2005 • CURRENCY TRADER<br />
1.28<br />
1.26<br />
1.24<br />
1.22<br />
1.20<br />
1.18<br />
1.16<br />
80<br />
50<br />
20<br />
80<br />
50<br />
20<br />
1.8<br />
1.7<br />
1.6<br />
1.5<br />
1.4<br />
1.3<br />
1.2<br />
Dollar/Swiss<br />
Statistics argue for at least<br />
a temporary drop in the<br />
USD/CHF rate, but<br />
trend-followers are long and<br />
history shows conspicuous<br />
examples of the market<br />
extending its trend.<br />
BY CURRENCY TRADER STAFF
FIGURE 3 — MEETING RESISTANCE<br />
tum indicator (stochastics, RSI, et al.)<br />
has been signaling the market as<br />
“overbought” since mid May — a testament<br />
to the strength of the uptrend<br />
as well as the inefficacy of such tools<br />
(Figure 1).<br />
The issue now is whether an<br />
inevitable (not to be confused with<br />
“imminent”) decline in the<br />
dollar/Swiss will be a temporary<br />
pause in a longer-term up move, or an<br />
actual trend reversal.<br />
In December 2004 USD/CHF just<br />
missed matching its 1995 low of 1.1172<br />
before embarking on the first leg of its<br />
current uptrend (Figure 2), a development<br />
that no doubt caught the attention<br />
of chart watchers who were wondering<br />
if the market would successfully<br />
test this level.<br />
Figure 3 shows the currency pair at<br />
another notable technical level — the<br />
resistance implied by the August and<br />
September 2004 highs around 1.2850.<br />
Given the dramatic run-up in spring<br />
2005, this level would be a likely technical<br />
candidate to at least temporarily<br />
turn back the market, as many chartoriented<br />
<strong>trade</strong>rs would be compelled<br />
to take profits on existing long positions<br />
while others would look to go<br />
short. Similarly, a breakout above this<br />
level would trigger a flurry of technical<br />
buying.<br />
Figure 3 also shows something else:<br />
<strong>trade</strong> signals from a representative<br />
breakout system that triggered a long<br />
position (based on surpassing the 24week<br />
high) the week of May 20. This<br />
trigger level was determined by calculating<br />
the average and median<br />
number of weeks for the 20 look-back<br />
periods with the highest net profit<br />
over the past 30 years. The range was<br />
12 weeks to 36 weeks, the average<br />
24.9 weeks, and the median was 24<br />
weeks, so 24 was selected as a representative<br />
value. The point is many<br />
trend-following approaches are likely<br />
long this currency pair. The June 24<br />
Source: TradeStation<br />
high of 1.2841 missed the Aug. 6, 2004<br />
high by 16 points (pips); a solid move<br />
Source: TradeStation<br />
above 1.2857 — which coincides with the fact that the<br />
aforementioned resistance level will trigger more buying<br />
from technical systems going long on a move above the 52-<br />
The market has reached resistance implied by the August and September 2004<br />
highs — just as it has completed an eighth consecutive week of higher highs<br />
and higher lows (potentially nine if the pair closes the week ending July 1 with a<br />
higher low). The <strong>trade</strong> signals are representative of longer-term trend following<br />
systems, which would put many trend-followers on the long side today.<br />
U.S. dollar/Swiss franc (USD/CHF), weekly<br />
The market has surpassed its current nine-week run of higher highs and lows only<br />
during the three weeks ending Feb. 21, 1997, after which the market dropped.<br />
U.S. dollar/Swiss franc (USD/CHF), weekly<br />
July October 1997 April July<br />
week high. (As of mid-morning on June 29, the USD/CHF<br />
rate had rallied to 1.2858.)<br />
continued on p. 20<br />
CURRENCY TRADER • July 2005 19<br />
Buy<br />
2004 April July October 2005 April July<br />
FIGURE 4 — CONTINUED RALLY<br />
2<br />
1<br />
1.32<br />
1.30<br />
1.28<br />
1.26<br />
1.24<br />
1.22<br />
1.20<br />
1.18<br />
1.16<br />
1.14<br />
1.45<br />
1.40<br />
1.35<br />
1.30<br />
1.25<br />
1.20
SPOT CHECK continued<br />
Reality check: What<br />
the numbers say<br />
Now let’s look at what<br />
some quantitative analysis<br />
says about the actual price<br />
behavior. Statistical analysis<br />
on the daily and weekly<br />
time frames indicates the<br />
market is in a relatively<br />
unique situation. As of June<br />
29, the dollar/Swiss had<br />
posted nine weeks of consecutive<br />
higher weekly<br />
highs and lows — something<br />
it has done only three<br />
times before, and then only<br />
in string of three consecutive<br />
weeks from Feb. 7 to<br />
Feb. 21, 1997 (Figure 4). The<br />
market moved sideways to<br />
lower after the third week<br />
in this series.<br />
Considering consecutive<br />
higher highs only painted a<br />
more bearish picture based<br />
on 16 prior instances. Six<br />
weeks after concluding nine<br />
weeks of consecutive higher<br />
highs, USD/CHF was<br />
down more than 2 percent<br />
68.7 percent of the time — despite the fact that five of these<br />
occurrences were consecutive weeks of gains from Feb. 8,<br />
1985 to March 8, 1985 (which means the longest streak of<br />
consecutive weeks of higher highs is 13).<br />
Another model of the current market condition produced<br />
similar results. The USD/CHF on June 24 made the highest<br />
high in 26 weeks and gained more than .1000 over the previous<br />
26 weeks; the low 25 weeks ago was the lowest low in<br />
26 weeks. Eight other instances of this pattern produced<br />
mixed results over the following twelve weeks, with more<br />
TABLE 1 — USD/CHF PERFORMANCE AFTER 1,100-PIP GAIN OVER 10 WEEKS<br />
After rallying 1,100 points (pips) or more over 10 weeks, the market has shown a tendency to<br />
move lower.<br />
Week 1 LUM LDM W2 LUM LDM W3 LUM LDM<br />
Avg. -0.02% 1.13% -1.04% 0.03% 1.72% -1.60% -0.06% 2.17% -2.04%<br />
Med. 0.19% 0.96% -0.75% 0.31% 1.36% -0.94% 0.17% 1.93% -1.57%<br />
Std. 1.83% 0.89% 1.32% 2.45% 1.37% 1.69% 3.16% 1.70% 2.10%<br />
%>0 56.32% 55.17% 51.72%<br />
W4 LUM LDM W5 LUM LDM W6 LUM LDM<br />
Avg. -0.12% 2.57% -2.46% -0.28% 2.91% -2.85% -0.70% 3.14% -3.31%<br />
Med. -0.05% 2.28% -2.10% -0.25% 2.43% -2.26% -0.15% 2.67% -2.51%<br />
Std. 3.52% 2.01% 2.41% 4.05% 2.28% 2.70% 4.54% 2.39% 3.10%<br />
%>0 48.28% 45.98% 48.28%<br />
W7 LUM LDM W8 LUM LDM W9 LUM LDM<br />
Avg. -0.92% 3.37% -3.68% -1.05% 3.57% -4.04% -1.10% 3.75% -4.41%<br />
Med. -0.36% 2.78% -2.87% -0.51% 3.29% -3.38% -0.29% 3.42% -3.47%<br />
Std. 4.68% 2.49% 3.37% 4.90% 2.54% 3.59% 5.40% 2.65% 3.86%<br />
%>0 45.98% 47.13% 47.13%<br />
W10 LUM LDM W11 LUM LDM W12 LUM LDM<br />
Avg. -1.17% 4.09% -4.86% -1.20% 4.07% -4.95% -1.47% 4.28% -5.24%<br />
Med. -0.17% 3.62% -3.79% -1.08% 3.67% -3.81% -1.66% 3.67% -4.20%<br />
Std. 5.51% 2.68% 3.86% 5.46% 2.84% 4.03% 5.60% 2.92% 4.03%<br />
%>0 45.98% 47.13% 44.83%<br />
Legend: Avg = average gain/loss; Med = median gain loss; Std = standard deviation; %>0 = percentage of gains;<br />
LUM = largest up move, measured from the closing price of the final bar of the pattern to the highest high of each weekly interval;<br />
LDM = largest down move, measured from the closing price of the final bar of the pattern to the lowest low of each weekly interval.<br />
gains than losses at most of the weekly intervals, but several<br />
large losses skewed the results lower.<br />
These statistics are not overly exciting (and unfortunately<br />
they are based on relatively small sample sizes), but they<br />
support a bearish perspective over the next several weeks<br />
— with the caveat that conspicuous cases in the past (1985<br />
and 1997, for example) underscore the market’s potential to<br />
continue rallying ferociously.<br />
The rally from April 22 to June 29 spanned 10 weeks and<br />
1,100 pips (.1100 points). Table 1 shows the performance of<br />
the USD/CHF pair following previous rallies of 1,100 pips<br />
over 10 weeks. This time, there were 87 prior instances, and<br />
after mixed results the first few weeks, on average, the bias<br />
was to the downside.<br />
On the fundamental side, there is little on the near-term<br />
horizon that argues for a change in a bearish outlook for the<br />
Swiss franc — Switzerland’s export-driven economy is<br />
unlikely to rebound overnight. The outlook for the U.S.<br />
buck is what will continue to drive the pair.<br />
A final note: As it posted a strong first half of 2005 after<br />
pundits had warned it was on its deathbed at the end of 2004,<br />
it’s reasonable to wonder if the greenback isn’t ready for<br />
some kind of correction now that almost everyone has turned<br />
dollar bull. However, that doesn’t mean the relative values of<br />
the dollar and the Swiss franc are poised to invert. <br />
20 July 2005 • CURRENCY TRADER
Options Trader is<br />
a monthly, full-feature<br />
electronic magazine<br />
covering trading strategies,<br />
systems, market analysis,<br />
news and commentary<br />
for options <strong>trade</strong>rs.<br />
Sign up now for<br />
a free subscription. Register at<br />
www.options<strong>trade</strong>rmag.com.<br />
All you need to register is<br />
an email address.<br />
Sign up now<br />
for a<br />
FREE<br />
subscription!<br />
Each month you can download the<br />
current issue from the Internet using<br />
technology that combines the high-quality<br />
look and feel of a print magazine with<br />
the interactive features of Web content.<br />
Subscribe now!<br />
www.options<strong>trade</strong>rmag.com
THE BIG PICTURE<br />
What professional <strong>trade</strong>rs know<br />
that you don’t<br />
Most professionals don’t have amazing powers or secret knowledge,<br />
but they do know how do things such as taking losses and avoiding getting<br />
“married” to a particular market outlook.<br />
The professionals’ “secret”<br />
is not a trading rule like<br />
“buy the opening breakout<br />
if yesterday’s close<br />
was at the high.” Each <strong>trade</strong>r has his<br />
own trading rules, and each set of rules<br />
is equally valid — there is more than<br />
FIGURE 1 — EURO BUYING OPPORTUNITY?<br />
one right (profitable) way to <strong>trade</strong> a<br />
market.<br />
You can find trading rules for each<br />
style of trading, generally organized<br />
according to how long you plan to<br />
hold positions. Trading rules can be<br />
roughly categorized as belonging to<br />
The Euro has broken out above a down trendline, and the stochastic oscillator is rising<br />
sharply. Should you buy the Euro?<br />
Stochastic Oscillator (46.02)<br />
Euro (EUR), daily<br />
BY BARBARA ROCKEFELLER<br />
18 25 2 9 16 23 31 6 13 20 27 4<br />
May June July<br />
Data source: Reuters; Charts: MetaStock<br />
the day-trading style (holding period<br />
of minutes), swing trading style (holding<br />
period of a few hours to a few<br />
days), and position trading (holding<br />
period of several days to several<br />
months).<br />
The secret is that professionals<br />
know the difference between a<br />
good loss and a bad loss.<br />
The good loss<br />
How can any loss be “good,”<br />
you ask? A good loss is the<br />
result of taking the right position<br />
given the information<br />
available at the time. You<br />
weighed the information —<br />
fundamental, technical, or<br />
both — and believed you had<br />
a realistic expectation of a<br />
profit. You took the position,<br />
but the fates intervened and<br />
threw a fresh piece of information<br />
into the market, or a new<br />
participant with different<br />
ideas. Your position turned<br />
into a loser, and your riskmanagement<br />
rules forced you<br />
to exit with a loss. Next case.<br />
Notice how many assumptions<br />
about the trading business<br />
are embedded in the preceding<br />
sentences. First, you<br />
gathered a lot of information<br />
to make the trading decision.<br />
22 July 2005 • CURRENCY TRADER<br />
90<br />
80<br />
70<br />
60<br />
50<br />
40<br />
30<br />
20<br />
10<br />
1.31<br />
1.30<br />
1.29<br />
1.28<br />
1.27<br />
1.26<br />
1.25<br />
1.24<br />
1.23<br />
1.22<br />
1.21<br />
1.20<br />
1.19
It doesn’t matter whether the<br />
decision was largely or even<br />
entirely informed by technical<br />
indicators. Technical indicators<br />
distill market sentiment,<br />
and are as valid a decision tool<br />
as any other. In fact, most<br />
forex market observers believe<br />
about 90 percent of all forex<br />
<strong>trade</strong>rs use technical analysis<br />
in some form.<br />
Second, if you had a realistic<br />
expectation of profit, you<br />
had an idea of the probable<br />
scope of the upcoming move<br />
— in other words, a profit target.<br />
This is an important difference<br />
between professionals<br />
and amateurs: Professionals<br />
know where they plan to exit a<br />
<strong>trade</strong>, whereas most amateurs<br />
do not. Moreover, amateurs<br />
kick themselves for exiting a<br />
<strong>trade</strong> too early, no matter how<br />
stupendous their gain. If the<br />
price continued to move further,<br />
they mourn the lost opportunity.<br />
Professionals make note of this, but<br />
they don’t get emotional about it.<br />
To evaluate a <strong>trade</strong>, however, you<br />
need more than the profit expectation.<br />
You also need to know the potential<br />
loss. Let’s say you can realistically<br />
expect to make $1,000 on the <strong>trade</strong>. Are<br />
you willing to lose $3,000 to make<br />
$1,000? No. You would soon be out of<br />
the trading business if your <strong>trade</strong>s had<br />
that risk-reward profile.<br />
If you want to keep losses smaller<br />
than gains, your stop-loss exit point<br />
has to be a smaller distance away from<br />
the entry point than the expected profit-taking<br />
level. If you expect to make<br />
$1,000, your stop has to deliver a loss<br />
of less than $1,000. Traders would love<br />
to get a 3:1 or higher reward-risk ratio,<br />
meaning a $3 gain for every $1 loss. In<br />
FIGURE 2 — FALSE BREAKOUT<br />
The Euro failed to sustain the upward momentum. The chart offered clues the breakout<br />
was going to fail, but if you had a preconceived notion the Euro was oversold and should<br />
rise — and you couldn’t let go of the idea — you might have stuck with a losing <strong>trade</strong>.<br />
Stochastic Oscillator (30.63)<br />
Euro (EUR), daily<br />
4 11 18 25 2 9 16 23 31 6 13 20 27 4<br />
April May June July<br />
Data source: Reuters; Charts: MetaStock<br />
practice, they are sometimes lucky to<br />
get 1.5:1.<br />
Professionals with losing <strong>trade</strong>s<br />
already know how big the loss will be<br />
— say $350 in the case here — and<br />
therefore it hurts less when they have<br />
to take it. The loss is not a surprise and<br />
it’s also not a disaster.<br />
Professional <strong>trade</strong>rs are always<br />
Professionals know where they plan to exit a <strong>trade</strong>;<br />
most amateurs do not.<br />
ready to move on to the next case.<br />
Losses are a natural part of trading.<br />
Everyone takes losses. Anyone who<br />
can’t take losses either doesn’t have<br />
enough capital to be trading in the first<br />
place, or lacks the psychological makeup<br />
to be a <strong>trade</strong>r. Professionals can<br />
ride out losses both financially and<br />
psychologically; they are confident<br />
about their trading abilities even as<br />
they contemplate taking a loss, and<br />
even after they take it.<br />
The bad loss<br />
If a “good” loss is one where you made<br />
the right decision but lost anyway, a<br />
“bad” loss is one where you made a<br />
bad decision and took a loss, or made<br />
the right trading decision but applied<br />
the wrong risk-management rules. A<br />
bad trading decision, by definition, is<br />
one in which you didn’t start out with<br />
a positive expectancy of a gain.<br />
When you get the price direction<br />
wrong, it’s almost always the result of<br />
ignoring important factors or chart<br />
indicators because you are looking for<br />
what you want to see instead of what is<br />
really there. This is a critical difference<br />
between professionals and amateurs.<br />
Professionals clearly see what they are<br />
looking at and are able to restrain their<br />
prejudices and preconceptions about<br />
what “should” be there.<br />
For example, look at the chart in<br />
Figure 1. The Euro has broken out<br />
above a down trendline, and the stochastic<br />
oscillator is rising sharply. The<br />
rising stochastic means the Euro had<br />
been oversold and is now in the<br />
continued on p. 24<br />
CURRENCY TRADER • July 2005 23<br />
90<br />
80<br />
70<br />
60<br />
50<br />
40<br />
30<br />
20<br />
10<br />
1.31<br />
1.30<br />
1.29<br />
1.28<br />
1.27<br />
1.26<br />
1.25<br />
1.24<br />
1.23<br />
1.22<br />
1.21<br />
1.20<br />
1.19
THE BIG PICTURE continued<br />
process of correcting upward. On the<br />
last bar, the close is below the close the<br />
day before and below the open — two<br />
important warnings — but the upside<br />
breakout is compelling. You buy the<br />
Euro. (Actually, some professionals<br />
bought the Euro, too, but they didn’t<br />
buy them for a sustained holding period.)<br />
What happened next?<br />
Figure 2 shows the Euro failed to sustain<br />
the upward move. The correction<br />
fizzled. The next day after the warning<br />
bar, the Euro put in a higher high than<br />
the day before, but not higher than the<br />
previous two days. It’s an old rule that<br />
you want a three-day high (and prefer-<br />
ably a three-day higher close, too) before<br />
you buy into a new move. This is a rule<br />
you could use if you are a swing-<strong>trade</strong>r<br />
or a position <strong>trade</strong>r. There is no doubt<br />
that some day-<strong>trade</strong>rs made money<br />
going long the Euro on the day after the<br />
warning day — the Euro did venture<br />
higher — but they had to be nimble to<br />
exit with a gain. It was not a well-judged<br />
<strong>trade</strong> for anyone other than a day-<strong>trade</strong>r.<br />
For a real position <strong>trade</strong>r, it was not even<br />
tempting. The position <strong>trade</strong>r would<br />
have required a close (or two or three)<br />
over the 10-day or 20-day moving averages,<br />
too. Instead, the price surpassed<br />
the 10-day moving average only once,<br />
and never surpassed the 20-day moving<br />
average.<br />
This move was, therefore, a false<br />
breakout, and a pretty minor one, at<br />
that. The chart gave plenty of clues<br />
that the breakout was going to fail, but<br />
if you were enamored of the idea the<br />
Euro was oversold and should rise, it<br />
was easy to talk yourself into buying<br />
it, and then taking a loss when the<br />
breakout failed.<br />
Let’s say you saw the warning signs<br />
but decided to change your usual<br />
timeframe. You thought you could easily<br />
switch timeframe concepts to daytrading<br />
when your usual style is<br />
swing-trading. Unless you sit down<br />
and carefully recalculate potential<br />
gains and losses for the new timeframe,<br />
you will not have realistic<br />
expectations for the <strong>trade</strong>.<br />
Changing timeframes is not something<br />
you can do intuitively or on-thefly.<br />
You need to apply a little arithmetic<br />
to arrive at new parameters.<br />
Otherwise, you are just guessing,<br />
which is always the wrong tactic in<br />
trading. Trading is a business that<br />
requires business tools. (We may think<br />
that in the end almost every trading<br />
decision is little more than an educated<br />
guess, anyway, but there is a vast dif-<br />
Amateurs would rather be right than make money,<br />
while professionals are willing to admit they are<br />
wrong, and make money anyway.<br />
ference between an unfounded guess<br />
and an educated guess.)<br />
The outcome of guessing is to apply<br />
the wrong risk-management rules. You<br />
could buy the Euro the day after the<br />
warning day and make a profit, but<br />
you would have had to adjust your<br />
gain/loss expectations considerably.<br />
Let’s say you are used to swingtrading<br />
over a three-day period. The<br />
daily average range is 120 points and<br />
your aim is to capture 75 percent of<br />
that (90 points) per <strong>trade</strong>. You are willing<br />
to lose 45 points per <strong>trade</strong> for a<br />
gain/loss ratio of 2:1. These metrics<br />
are part of your trading plan. (The<br />
other part is your technique for identifying<br />
the direction and strength of the<br />
upcoming move.) Now you shift to a<br />
day-trading mode, where you intend<br />
to get in and out in three hours. What<br />
is the maximum, minimum, and average<br />
gain you can expect? If you don’t<br />
know, you can’t set a reasonable stop<br />
or a reasonable profit target.<br />
In this instance, the hourly average<br />
range shrinks to only 20 points. Let’s<br />
say you plan to hold for three hours,<br />
meaning the maximum gain you could<br />
expect would be 60 points. To aim for<br />
75 percent of that move would be to<br />
target a 45-point profit, and if you keep<br />
your stop at half that, you would exit<br />
on a drop of 23 points below your<br />
entry. As it happens, you would have<br />
made the 45 points if you had entered<br />
at the Chicago open. But how many<br />
<strong>trade</strong>rs can change gears like this?<br />
Professional <strong>trade</strong>rs can change<br />
gears like this. If the market is offering<br />
a messy situation, they develop a new<br />
strategy to take advantage of it — in<br />
this instance, changing the timeframe<br />
of the <strong>trade</strong>. If the world is going to<br />
hell in a handbasket, they don’t judge<br />
it — they find the currency most<br />
affected, and <strong>trade</strong> it short.<br />
The flexibility of the professional<br />
<strong>trade</strong>r extends to the asset being <strong>trade</strong>d,<br />
too. If their usual currency starts<br />
trading dead flat, they can shift to a<br />
different one. When the Canadian dollar<br />
gets stuck in a sideways range, they<br />
turn attention to, as an example, the<br />
Swiss franc. Are all the major-<strong>trade</strong>d<br />
currencies moribund? What’s happening<br />
in the exotics (the lesser-<strong>trade</strong>d<br />
currencies such as the Swedish krona<br />
and Mexican peso)?<br />
The big-picture perspective<br />
That brings us to the final point: professionals<br />
believe there is always<br />
something to <strong>trade</strong>. Amateurs may<br />
complain the market isn’t trending like<br />
it used to, or it’s too choppy.<br />
Professionals don’t have the luxury of<br />
complaining about the market. It’s<br />
their job to make money no matter<br />
what the market is doing. Amateurs<br />
would rather be right than make<br />
money, while professionals are willing<br />
to admit they are wrong, and make<br />
money anyway.<br />
The lesson is that to <strong>trade</strong> like a professional,<br />
you have to work a little<br />
harder (seeing the warning signs in the<br />
bar configuration), be ruthless in abandoning<br />
preconceived ideas about what<br />
“should” happen (taking the loss), and<br />
adapt your trading style (switching<br />
timeframes). Then you can have confidence<br />
that the market is a playground<br />
in which you can make money, and not<br />
a battlefield on which you will suffer<br />
more losses than gains.<br />
For information on the author see p. 6.<br />
24 July 2005 • CURRENCY TRADER
TRADING STRATEGIES<br />
Finding price <strong>targets</strong><br />
and risk points<br />
BY THOM HARTLE<br />
There’s more to trading than entry setups. To get the most out<br />
of a trading approach, you have to move beyond the obvious.<br />
Find out how to analyze <strong>trade</strong>s to determine the best places<br />
to set stops and take profits.<br />
Most new <strong>trade</strong>rs are focused on finding entry signals for their<br />
<strong>trade</strong>s. They spend time studying indicators and technical<br />
patterns, looking to create combinations that lead to “highprobability”<br />
entry points. After finding reasonable setups,<br />
many <strong>trade</strong>rs stop their research and start placing <strong>trade</strong>s, ignoring the question<br />
of where to exit.<br />
If they become dissatisfied with how their <strong>trade</strong>s turn out, they might review<br />
any number of popular trading books, which will inform them to “let your<br />
profits run and limit your losses.” The idea is to capture the occasional big<br />
winners that will more than make up for a larger number of<br />
small losses. However, a profitable <strong>trade</strong> will often turn<br />
into a loss, leaving <strong>trade</strong>rs wishing they had exited<br />
earlier. After suffering through a few<br />
such <strong>trade</strong>s, conflicts can start to<br />
form in the <strong>trade</strong>r’s mind<br />
that lead<br />
to second-guessing and<br />
other psychological pitfalls that<br />
hinder trading.<br />
The solution is to research exit strategies to the<br />
same degree as entry setups. With the addition of<br />
sound exit strategies, trading reaches a point<br />
where it is more about following procedures and<br />
less about moment-to-moment judgment.<br />
One way to determine exit points is to walk<br />
through <strong>trade</strong>s individually and analyze maximum<br />
favorable excursion (MFE) and maximum<br />
26 July 2005 • CURRENCY TRADER
adverse excursion (MAE) statistics.<br />
This analysis can be applied to both<br />
historical back-tests and to track realtime<br />
<strong>trade</strong>s.<br />
Best- and worst-case<br />
scenarios<br />
Maximum favorable excursion and<br />
maximum adverse excursion were<br />
terms coined by John Sweeney and<br />
detailed in his book, Campaign Trading:<br />
Tactics and Strategies to Exploit the<br />
Markets (Wiley Finance Editions,<br />
1996). MFE is the largest open profit<br />
attained during a <strong>trade</strong>. The MAE is<br />
the largest open loss while in a <strong>trade</strong>.<br />
For example, Figure 1 is a 45-minute<br />
Euro/U.S. dollar (EUR/USD) chart<br />
with the moving average convergence-divergence<br />
(MACD) histogram,<br />
which is the difference between the<br />
MACD line and the signal line. For<br />
illustration purposes, the chart shows<br />
an entry based on a simple momentum<br />
strategy: Hold a long position if<br />
5/9/05<br />
the histogram bars are rising, and hold<br />
a short position if the histogram bars<br />
are falling. When the histogram bars<br />
change direction, the <strong>trade</strong> is exited.<br />
At point A, the histogram bar turns up for the first<br />
time, so the <strong>trade</strong> is to go long at 1.2798 and exit when<br />
the histogram bar turns down (point B, 1.2828) — a 30pip<br />
gain. The <strong>trade</strong>’s MFE was 47 pips and the MAE was<br />
9 pips. In this example, the profit was 30 pips, which<br />
means approximately one-third of the open profit was<br />
lost before the <strong>trade</strong> was exited.<br />
Reviewing positions this way reveals that <strong>trade</strong>s fall<br />
into one of three categories, as shown in Figure 2. Group<br />
1 consists of the type of <strong>trade</strong>s everyone likes — when<br />
the position becomes profitable immediately and there<br />
is no open loss (MAE), and the <strong>trade</strong> is exited near the<br />
highest open profit (MFE). Group 2 <strong>trade</strong>s go into negative<br />
territory, but recover and are closed out for profits.<br />
Group 3 <strong>trade</strong>s might be profitable at first and then<br />
reverse to become losses, or they are losses from the<br />
start and never recover.<br />
A trading strategy can be tailored to manage risk in a<br />
more intelligent fashion by putting it in sync with typical<br />
market volatility. There are two objectives. The first<br />
continued on p. 28<br />
FIGURE 1 — MFE AND MAE<br />
MFE is the largest open profit attained during a <strong>trade</strong>. The MAE is the largest<br />
open loss while in a <strong>trade</strong>. For this long <strong>trade</strong>, the MFE was 47 pips, the MAE<br />
was 9 pips, and the profit was 30 pips, which means the exit captured a little<br />
less than two thirds of the potential.<br />
Euro/U.S. dollar (EUR/USD), 45-minute<br />
CURRENCY TRADER • July 2005 27<br />
A<br />
A<br />
MAE<br />
MFE<br />
Source: Fibonacci Trader (www.fibonacci<strong>trade</strong>r.com)<br />
FIGURE 2 — TRADE BREAKDOWN<br />
B<br />
B<br />
1.2840<br />
1.2830<br />
1.2820<br />
1.2810<br />
1.2800<br />
1.2790<br />
1.2780<br />
-0.00058<br />
-0.00045<br />
-0.00033<br />
Trades can be placed in one of three categories — <strong>trade</strong>s<br />
that become profitable immediately and are exited near the<br />
highest open profit, <strong>trade</strong>s that go into negative territory but<br />
recover and become profitable, and <strong>trade</strong>s that turn into losses<br />
quickly and never recover.<br />
Maximum favorable excursion<br />
Maximum adverse excursion<br />
Group 1<br />
Group 2<br />
Group 3
TRADING STRATEGIES continued<br />
Gann swing trading<br />
In his book, A W. D. Gann Treasure Discovered<br />
(1996), Robert Krausz detailed the “two-bar<br />
swing” concept: If price makes two consecutive<br />
higher highs, the swing is up. If price makes two<br />
consecutive lower lows, the swing is down.<br />
If price <strong>trade</strong>s above a previous peak defined by<br />
an up swing and a down swing, the trend is up. If<br />
price <strong>trade</strong>s below a previous valley defined by a<br />
down swing and an up swing, the trend is now<br />
down.<br />
In Figure A, if the trend is up, the price swings<br />
are denoted by a solid green line. If the trend is<br />
down, the swings are marked with a dashed red<br />
line.<br />
FIGURE 3 — BUY SETUP<br />
If the trend is up, the system goes long when the market pulls back by forming<br />
a pivot low.<br />
Long<br />
1<br />
2<br />
Pivot low<br />
Euro/U.S. dollar (EUR/USD), 45-minute<br />
3<br />
Exit<br />
1<br />
Long<br />
3<br />
2<br />
Pivot low<br />
5/10/05<br />
Source: Fibonacci Trader (www.fibonacci<strong>trade</strong>r.com)<br />
FIGURE A — TWO-BAR SWING TECHNIQUE<br />
Swing<br />
is up<br />
2<br />
is to determine the point at which<br />
<strong>trade</strong>s that are likely to be Group 3<br />
<strong>trade</strong>s can be exited sooner, but not<br />
too soon as to remove the chance of<br />
them becoming Group 2 <strong>trade</strong>s.<br />
The second objective is to find a<br />
high-probability target point at which<br />
to take profits. This profit level should<br />
be a level <strong>trade</strong>s reach on a regular<br />
basis. Traders can take complete profits<br />
at this point, or take partial profits<br />
and use the trend-following rule to<br />
exit the remainder of the position.<br />
However, to perform this analysis,<br />
the trading strategy must consist of set<br />
procedures — as opposed to discretionary<br />
procedures, which cannot be<br />
back tested. Don’t think you will<br />
know when to pick a “good” entry<br />
signal vs. a “bad” one. If you think<br />
you will be able to determine in realtime<br />
trading which buy setups will<br />
work and which won’t, you’re <strong>setting</strong><br />
yourself up for emotional turmoil and<br />
poor decision making.<br />
This analysis is best applied to trading<br />
strategies that reverse when an<br />
entry signal in the opposite direction<br />
occurs. If the strategy uses a predeter-<br />
28 July 2005 • CURRENCY TRADER<br />
1<br />
1<br />
2<br />
Swing<br />
is down<br />
1.2870<br />
1.2860<br />
1.2850<br />
1.2840<br />
1.2830<br />
1.2820<br />
1.2810<br />
1<br />
Swing<br />
is up<br />
2<br />
Valley is broken<br />
Trend is now down<br />
1<br />
2<br />
Swing<br />
is down<br />
Peak is broken<br />
Trend is now up<br />
Swing<br />
is up<br />
1 2<br />
Source: Fibonacci Trader (www.fibonacci<strong>trade</strong>r.com)<br />
1<br />
2<br />
1<br />
Swing<br />
is down<br />
2
mined profit limit, for example, the<br />
MFE analysis will be cut short.<br />
Testing a swing-trading<br />
strategy<br />
A strategy for trading 45-minute bars<br />
of the EUR/USD will be used to illustrate<br />
the application of MFE and MAE<br />
analysis. The strategy tracks the market<br />
trend, and if the trend is up, it buys<br />
after a pullback has occurred. If the<br />
trend is down, the strategy goes short<br />
after a rally.<br />
The trend is determined using a<br />
concept devised from Gann swing<br />
trading: If the market makes three consecutive<br />
higher highs, the “swing” is<br />
up until the market makes three consecutive<br />
lower lows, at which point<br />
the swing is down. The trend turns up<br />
when price breaks above (by a certain<br />
number of ticks) a previous resistance<br />
point established by a swing peak. The<br />
trend turns down when a previous<br />
support level formed by a swing bottom<br />
is broken by a certain number of<br />
ticks.<br />
This strategy uses a two-bar swing<br />
rule. Figure 3 is an example of a buy<br />
setup. If the trend is up, go long when:<br />
1. The market pulls back by forming<br />
a pivot low and then trading<br />
five pips above the high of the<br />
low bar, which is the setup bar.<br />
(The setup bar cannot be the high<br />
bar of the recent uptrend and<br />
entry cannot occur at the trend’s<br />
previous high or new high.)<br />
2. If not filled in the next bar when<br />
the bar is an inside bar, the buy<br />
signal moves to five pips above<br />
the high of the inside bar, which<br />
becomes the new setup bar.<br />
3. If filled, place an initial stop five<br />
pips below the setup bar’s low.<br />
4. If long, once a bar makes a low<br />
continued on p. 30<br />
FIGURE 4 — SELL SETUP<br />
Sell setups reverse the rules of long <strong>trade</strong>s. If the trend is down, the system<br />
goes short when the market rallies and forms a pivot high.<br />
Euro/U.S. dollar (EUR/USD), 45-minute<br />
1 2 Pivot high<br />
3<br />
Exit<br />
Short<br />
1<br />
Pivot high<br />
2<br />
3<br />
Short<br />
5/3/05<br />
Source: Fibonacci Trader (www.fibonacci<strong>trade</strong>r.com)<br />
FIGURE 5 — MFE AND MAE ANALYSIS<br />
The gain was 15 pips, but the average MFE was 20 pips. This implies some<br />
<strong>trade</strong>s had open profits that vanished by the time the positions were exited.<br />
Points (pips)<br />
0.0080<br />
0.0060<br />
0.0040<br />
0.0020<br />
0.0000<br />
-0.0020<br />
-0.0040<br />
-0.0060<br />
CURRENCY TRADER • July 2005 29<br />
Exit<br />
MFE MAE P/L<br />
1.2865<br />
1.2860<br />
1.2855<br />
1.2850<br />
1.2845<br />
1.2840<br />
1.2835<br />
1.2830<br />
1.2825<br />
1.2820
TRADING STRATEGIES continued<br />
TABLE 1 — INITIAL INTRADAY SWING-TRADE SYSTEM RESULTS<br />
Testing the swing strategy over two weeks of 45-minute EUR/USD bars resulted in 25 <strong>trade</strong>s (eight winners vs. 16 losers<br />
and one breakeven) with an overall loss of 107 pips. The average winner was a 15-pip gain and the average loser was a<br />
14-pip loss.<br />
Date Time Open High Low Close # L/S Entry MFE MAE Exit P/L<br />
4/18/05 1:30 1.2904 1.2908 1.2877 1.2881 1 S 1.2899 0.0026 -0.0005 1.2887 0.0012<br />
4/18/05 13:30 1.2964 1.2999 1.2956 1.2998 2 L 1.2987 0.0057 -0.0019 1.3018 0.0031<br />
4/18/05 21:00 1.3010 1.3021 1.3007 1.3020 3 L 1.3020 0.0011 -0.0012 1.3008 -0.0012<br />
4/19/05 1:30 1.3014 1.3032 1.3008 1.3027 4 L 1.3030 0.0005 -0.0017 1.3013 -0.0017<br />
4/19/05 9:00 1.3034 1.3036 1.2996 1.3003 5 L 1.3036 0.0000 -0.0045 1.2991 -0.0045<br />
4/19/05 19:30 1.3030 1.3057 1.3022 1.3055 6 L 1.3036 0.0041 -0.0005 1.3051 0.0015<br />
4/20/05 0:00 1.3060 1.3065 1.3054 1.3059 7 L 1.3070 0.0012 -0.0007 1.3070 0.0000<br />
4/20/05 6:45 1.3067 1.3076 1.3057 1.3063 8 L 1.3076 0.0000 -0.0023 1.3053 -0.0023<br />
4/20/05 13:30 1.3043 1.3046 1.2988 1.2996 9 S 1.3033 0.0046 -0.0022 1.3055 -0.0022<br />
4/20/05 18:00 1.3085 1.3098 1.3077 1.3094 10 L 1.3092 0.0011 -0.0016 1.3080 -0.0012<br />
4/21/05 0:00 1.3085 1.3106 1.3078 1.3100 11 L 1.3095 0.0016 -0.0007 1.3094 -0.0001<br />
4/21/05 22:30 1.3056 1.3059 1.3040 1.3051 12 S 1.3041 0.0024 -0.0016 1.3039 0.0002<br />
4/22/05 19:30 1.3053 1.3076 1.3044 1.3071 13 L 1.3059 0.0017 -0.0004 1.3055 -0.0004<br />
4/25/05 8:15 1.3027 1.3035 1.3016 1.3030 14 S 1.3016 0.0062 -0.0017 1.2977 0.0039<br />
4/25/05 15:00 1.2976 1.2978 1.2952 1.2973 15 S 1.2966 0.0014 -0.0022 1.2988 -0.0022<br />
4/25/05 22:30 1.2995 1.2999 1.2984 1.2988 16 S 1.2988 0.0013 -0.0013 1.3001 -0.0013<br />
4/26/05 7:30 1.3006 1.3010 1.2982 1.2990 17 S 1.2995 0.0030 -0.0003 1.2990 0.0005<br />
4/26/05 14:15 1.2993 1.2997 1.2973 1.2988 18 S 1.2975 0.0032 -0.0013 1.2971 0.0004<br />
4/26/05 23:15 1.2988 1.2991 1.2978 1.2982 19 S 1.2976 0.0013 -0.0003 1.2979 -0.0003<br />
4/27/05 9:45 1.2922 1.2923 1.2909 1.2915 20 S 1.2910 0.0001 -0.0024 1.2934 -0.0024<br />
4/27/05 15:00 1.2974 1.2982 1.2955 1.2967 21 S 1.2955 0.0037 -0.0016 1.2943 0.0012<br />
4/27/05 20:15 1.2933 1.2936 1.2923 1.2931 22 S 1.2927 0.0016 -0.0007 1.2928 -0.0001<br />
4/28/05 5:15 1.2923 1.2931 1.2917 1.2926 23 S 1.2917 0.0000 -0.0019 1.2936 -0.0019<br />
4/28/05 17:15 1.2914 1.2916 1.2889 1.2895 24 S 1.2895 0.0016 -0.0005 1.2900 -0.0005<br />
4/29/05 10:30 1.2958 1.2972 1.2953 1.2963 25 L 1.2968 0.0005 -0.0020 1.2948 -0.0020<br />
above the setup bar’s high, thes top moves up to five<br />
pips below the low of the most recent bar or, if a<br />
pivot-low forms, five pips below thepivot low.<br />
Figure 4 shows a sell setup which reverses the rules of a<br />
long <strong>trade</strong>.<br />
Table 1 contains the results of testing this strategy over<br />
two weeks of 45-minute EUR/USD bars. The system<br />
assumes the moment a bar closes, the position can be<br />
entered at the same price on the next bar.<br />
There were only eight winning <strong>trade</strong>s (16 losers, 1<br />
breakeven), for a total loss of 107 pips. The average winner<br />
was 15 pips and the average loser was 14 pips. However,<br />
the average MFE was 20 pips and the average MAE was 14<br />
pips. This implies some <strong>trade</strong>s had open profits that vanished<br />
by the time they were exited.<br />
Figure 5 shows the profit/loss (P/L), MFE, and MAE for<br />
all the <strong>trade</strong>s sorted by MAE. The majority of the large losing<br />
<strong>trade</strong>s had very little, if any, positive MFE and most of<br />
these <strong>trade</strong>s had MAEs larger than -20 pips. This suggests<br />
<strong>setting</strong> the maximum stop-loss point at 20 pips could reduce<br />
the size of the worst losses without giving up profits.<br />
The average MFE was 20 pips, and <strong>trade</strong>s reached an open<br />
profit of 10 pips or more 76 percent of the time. Taking this<br />
information into account and <strong>setting</strong> a 10-pip target and a 20pip<br />
stop for each <strong>trade</strong>, a second back-test resulted in the<br />
equity line shown in Figure 6. Using the MFE-MAE analysis<br />
to set <strong>trade</strong> management parameters transformed this losing<br />
system to a profitable one on a hypothetical back-test.<br />
This is only the first step — the research and development<br />
of the procedures. The next step would be to review<br />
more data (from a different period), as these parameters<br />
30 July 2005 • CURRENCY TRADER
and procedures may be working only<br />
because of a volatility level unique to<br />
0.0120<br />
the particular time period that was<br />
tested. (This article has shown “in-<br />
0.0100<br />
sample” development of trading<br />
parameters and procedures. Applying<br />
0.0080<br />
these to other price data is called “out-<br />
0.0060<br />
of-sample” testing.)<br />
Also, keep in mind that volatility<br />
0.0040<br />
does trend. Therefore, procedures that<br />
worked or did not work two years ago<br />
0.0020<br />
will not necessarily perform similarly<br />
0.0000<br />
today. The lesson is that once you have<br />
settled on a trading approach based on<br />
-0.0020<br />
both in-sample and out-of-sample<br />
testing, this MFE and MAE analysis<br />
should be performed on real-time<br />
<strong>trade</strong>s on a regular basis. Then you can<br />
adjust your procedures to exploit the current market conditions.<br />
When you are trading in real-time you can compare how<br />
well you are executing your strategy under the pressure of<br />
real-time conditions vs. what the procedures call for you to<br />
be doing. This ongoing training process helps raise your<br />
trading skills to a level above trading on hunches.<br />
Moving beyond simple <strong>trade</strong> setups<br />
Developing trading strategies goes well beyond finding setups<br />
to generate buy and sell signals. The results of using maximum<br />
Other articles by Thom Hartle detailing MAE and MFE<br />
analysis:<br />
“On-target trading,”(Active Trader, July 2001).<br />
Taking profits is a balancing act: Hold on too long and you<br />
risk giving back your gains. Get out too soon and your<br />
gains might not be worth holding on to. You can establish<br />
intelligent profit <strong>targets</strong> by using a scientific approach.<br />
“Taking the guesswork out of stop orders,” (Active Trader,<br />
October 2001). Stops work best when they are based on<br />
thorough understanding of market conditions. Here’s<br />
analysis you can use to make your stops more effective.<br />
“The method <strong>trade</strong>r,” (Active Trader, April 2004).<br />
The trading world is filled with truisms and generalities, but<br />
there are no magical indicators or secret recipes when it<br />
comes to trading well. Profitable trading is grounded in how<br />
you approach your trading.<br />
FIGURE 6 — REVISED SYSTEM RESULTS<br />
Using the information from Figure 5 and <strong>setting</strong> a 10-pip target and a 20-pip<br />
stop for each <strong>trade</strong> resulted in the equity line shown in Figure 6. The system<br />
was transformed from a losing to a winning approach.<br />
Points (pips)<br />
1 3 5 7 9 11 13<br />
Trades<br />
15 17 19 21 23 25<br />
Related reading<br />
favorable excursion and maximum adverse excursion analysis<br />
led to developing procedures for managing the risk and taking<br />
profits at more opportune points than simply waiting for the<br />
market to reverse direction enough to stop you out.<br />
The most valuable lesson is that having tested procedures<br />
moves you from worrying about what the market will do<br />
and toward taking the appropriate action based on what the<br />
market actually does. <br />
For information on the author see p. 6.<br />
Questions or comments? Click here.<br />
More information on the Gann swing trading technique:<br />
“Retracement tendencies,” (Active Trader, March 2004).<br />
Learn how to objectively define trends and retracements,<br />
and use the Gann swing technique to find patterns in price<br />
behavior.<br />
More information on system testing:<br />
“The optimization trap,”by Dennis Meyers (Active Trader,<br />
November 2001). Learn how to conduct realistic out-ofsample<br />
testing and avoid historical back-testing pitfalls.<br />
Special notice: From August 1 to 31, these articles will be<br />
available for 30 percent off through the Active Trader online<br />
store (www.active<strong>trade</strong>rmag.com/purchase_articles.htm).<br />
You can download them directly to your computer as PDF<br />
files for easy viewing and printing.<br />
CURRENCY TRADER • July 2005 31
TRADING STRATEGIES<br />
Unlike the stock market,<br />
which can be affected<br />
by many companyspecific<br />
factors, the<br />
currency market is almost uniformly<br />
focused on macroeconomic trends.<br />
In the stock market, prices can rise<br />
in the morning on good news from<br />
Microsoft only to collapse later in the<br />
day on a warning from General<br />
Motors. In the currency market, however,<br />
price moves driven by major fundamental<br />
adjustments are more likely<br />
to continue. As a result, many <strong>trade</strong>rs<br />
like to buy breakouts and sell breakdowns<br />
with the goal of capturing<br />
additional price movement in the<br />
direction of the original price thrust.<br />
If it was truly that simple, however,<br />
every forex breakout <strong>trade</strong>r would be a<br />
multi-millionaire. In reality, the breakout<br />
<strong>trade</strong>, like every setup, requires<br />
nuanced understanding and proper<br />
Progressive<br />
entry technique<br />
A staggered <strong>trade</strong>-entry approach allows you to be more flexible<br />
and structure your <strong>trade</strong> depending on market developments.<br />
BY BORIS SCHLOSSBERG<br />
planning and execution to be profitable.<br />
The <strong>trade</strong>-management approach<br />
outlined here, which enters a<br />
position incrementally based on price<br />
movement after the initial <strong>trade</strong> signal,<br />
should provide you with some ideas<br />
for your own trading.<br />
Fibonacci ratios<br />
and dividing by three<br />
Human beings love to classify things<br />
into threes. Drinks come small, medium,<br />
and large. Steaks are prepared<br />
rare, medium, and well-done. We<br />
In reality, the breakout <strong>trade</strong>, like every setup,<br />
requires nuanced understanding and proper<br />
planning and execution to be profitable.<br />
often take two steps back to take one<br />
step forward. This natural inclination<br />
to divide things into thirds applies to<br />
trading as well.<br />
Most <strong>trade</strong>rs are aware Fibonacci<br />
ratios are present in everything from<br />
the organization of flower petals to the<br />
optimum spacing of facial f e a t u res. The<br />
two most common Fibonacci ratios are<br />
38.2 percent and 61.9 percent.<br />
Although some <strong>trade</strong>rs attach an<br />
almost mystical importance to<br />
Fibonacci numbers, there is a far more<br />
pragmatic approach to these percentages:<br />
They essentially divide price<br />
action into thirds.<br />
Fibonacci ratios can be used to<br />
apply an incremental entry technique<br />
that helps reduce risk.<br />
Trend or countertrend<br />
You can use Fibonacci ratios regardless<br />
of whether you enter a position expecting<br />
immediate continuation or if<br />
you’re trading on a pullback. Because<br />
trend trading is usually a more common<br />
technique for most <strong>trade</strong>rs, let’s<br />
look at that approach first.<br />
Say you spot a strong breakout on<br />
an hourly chart of the Euro/U.S. dollar<br />
rate (EUR/USD). Although it’s impossible<br />
to be sure the move will follow<br />
through, a trend <strong>trade</strong>r would go long<br />
in anticipation of further upside price<br />
movement.<br />
To <strong>trade</strong> this setup, you could use<br />
the following technique: Enter only<br />
half your total <strong>trade</strong> size on the breakout,<br />
add a quarter more if the <strong>trade</strong><br />
goes your way at 138.2 percent of the<br />
initial breakout move, and enter the<br />
32 July 2005 • CURRENCY TRADER
final quarter at 161.8 percent of the<br />
move.<br />
For example, if the high of the<br />
breakout bar was 1.3250, the length of<br />
the breakout candle was 100 pips and<br />
you wanted to commit a total of 20<br />
mini lots (requiring approximately<br />
$2,000 in margin) to the <strong>trade</strong>, you<br />
would do the following:<br />
1. Buy 10 lots at 1.3250 (initial<br />
level).<br />
2. Buy 5 lots at 1.3288 (the low of<br />
the breakout bar plus 138.2<br />
percent of the length of the bar).<br />
3. Buy 5 lots at 1.3311 (the low of<br />
the breakout bar plus 161.8<br />
percent of the length of bar).<br />
Average cost = 1.3275.<br />
4. Place a sell stop-loss order at<br />
1.3150 (low of the breakout bar).<br />
This strategy is known as “pressing<br />
the <strong>trade</strong>” and is a variation of an idea<br />
in Josh Lukeman’s book The Market<br />
Maker’s Edge (McGraw-Hill, 2003).<br />
This concept has several advantages.<br />
First, it minimizes risk by committing<br />
only half the capital at the beginning of<br />
the <strong>trade</strong>. In this case, if the <strong>trade</strong><br />
moves against the position, you would<br />
lose only $1,000 instead of the full<br />
$2,000 investment. On the other hand,<br />
if the <strong>trade</strong> becomes profitable, you<br />
would add 50 percent more capital to<br />
the <strong>trade</strong> without significantly increasing<br />
your average cost.<br />
Reversing the process:<br />
Averaging down<br />
The same entry strategy can be<br />
reversed to add to a <strong>trade</strong> at more<br />
favorable prices in a pullback situation.<br />
Let’s use the same example but<br />
assume there is strong chance of a<br />
retracement. You would make an initial<br />
purchase of five mini lots (one-<br />
quarter of the total position) at 1.3250,<br />
add another five lots at 1.3212 (a 38.2percent<br />
retracement of the move) and,<br />
finally, add the remaining half of the<br />
<strong>trade</strong> — 10 lots — at 1.3188 (a 61.8-percent<br />
retracement of the move). Overall,<br />
the position would look like this:<br />
1. Buy 5 lots at 1.3250 (initial level).<br />
2. Buy 5 lots at 1.3212 (38.2 percent<br />
retracement of the entry bar).<br />
3. Buy 10 lots at 1.3188 (61.8<br />
percent retracement of the entry<br />
bar). Average cost = 1.3209.<br />
4. Stop 1.3150.<br />
In this case, using a stop of 1.3150<br />
and target 1.3350, you would earn<br />
$1,410 for every $590 of risk if the<br />
move retraced all the way to 61.8<br />
Fibonacci level. Indeed, the <strong>trade</strong><br />
would already be profitable even if<br />
price simply returned to the initial<br />
entry point.<br />
A note on paying the spread<br />
Unlike many other financial markets,<br />
retail spot forex trading is almost<br />
always a spread market — that is, you<br />
buy at the offer and sell at the bid,<br />
always paying the spread between the<br />
two as a transaction cost. For that reason<br />
alone, successful scalping is<br />
extremely difficult in spot forex.<br />
For example, assume you enter a long<br />
scalp <strong>trade</strong> with an expected profit of 10<br />
pips and a stop-loss 10 pips below the<br />
entry point. If you pay a typical threepip<br />
spread, you could earn only seven<br />
pips profit but you stand to lose 13 pips<br />
if the <strong>trade</strong> goes against you.<br />
Potential drawbacks<br />
Every trading approach has its drawbacks.<br />
In the first example, you are<br />
vulnerable to a quick reversal if price<br />
just reaches the 161.8-percent target<br />
level and then quickly falls back<br />
through the original entry level — and<br />
perhaps through the stop — resulting<br />
Unlike many other financial markets, retail spot<br />
forex trading is almost always a spread market —<br />
that is, you buy at the offer and sell at the bid,<br />
always paying the spread between the two as<br />
a transaction cost.<br />
in a larger loss than if you had simply<br />
entered all at once at the original price<br />
of 1.3250. In the second example you<br />
are vulnerable to being under-invested<br />
if price moves favorably right away<br />
and over-invested in a losing position<br />
if it doesn’t.<br />
Ultimately, these strategies can help<br />
you to better manage positions by<br />
responding to market action. As<br />
Lukeman contends in his book, professionals<br />
understand prices are always<br />
fluid and they never make the mistake<br />
of committing all their speculative<br />
capital to a single price point. <br />
For information on the author see p. 6.<br />
Questions or comments? Click here.<br />
CURRENCY TRADER • July 2005 33
TRADING STRATEGIES<br />
“G” meetings: Do they move the market?<br />
With the annual G7/G8 meeting scheduled for early July,<br />
we look at how these summits tend to impact the U.S. dollar.<br />
Of the many economic numbers<br />
and market events forex<br />
<strong>trade</strong>rs tend to monitor, the<br />
annual Group of Seven/Group of Eight<br />
(G7/G8) meetings, which are summits<br />
of many of the world’s most economically<br />
influential nations, tend to get less<br />
attention than more frequent events<br />
such as the monthly employment<br />
report.<br />
The G8 meeting this month has<br />
attracted little attention outside the narrow<br />
range of economic policy wonks<br />
and currency desk <strong>trade</strong>rs, but there is<br />
evidence these gatherings can be tied to<br />
certain behavior patterns in the U.S.<br />
dollar.<br />
Is the G7 — or G8, depending on<br />
who’s involved — a major event to the<br />
currency market? And how can currency<br />
<strong>trade</strong>rs take advantage of meeting<br />
days, regardless of the meeting’s outcome?<br />
History of the G8<br />
The G8 has its roots in the 1973 oil crisis<br />
and subsequent global recession. It led<br />
the U.S. to form the Library Group, a<br />
gathering of senior financial officials<br />
from the U.S., Europe, and Japan, to discuss<br />
economic issues. In 1975 French<br />
President Valéry Giscard d’Estaing invited<br />
the heads of state of six major industralized<br />
democracies to a summit and<br />
proposed regular meetings.<br />
The participants agreed to an annual<br />
meeting organized under a rotating<br />
presidency, forming what was then the<br />
Group of Six: France, West Germany,<br />
Italy, Japan, UK, and the U.S. At the following<br />
year’s summit in Puerto Rico, it<br />
became the Group of Seven (G7) when<br />
Canada joined.<br />
Following the end of the Cold War in<br />
1991, Russia (then the USSR) began to<br />
meet with the G7 after the main summit.<br />
Russia was allowed to participate<br />
more fully beginning at the 1998<br />
Birmingham summit. At the urging of<br />
former U.S. President Bill Clinton, the<br />
BY DAVID BUKEY AND CARLISE PETERSON<br />
Group of Seven became the Group of<br />
Eight, because the Russians began<br />
attending most sessions.<br />
The presidency of the G8 rotates<br />
among the member states annually,<br />
with the new president assuming<br />
responsibility on the first of the year.<br />
The country holding the presidency<br />
hosts a series of less important meetings<br />
leading up to a mid-year, threeday<br />
summit with the heads of state.<br />
This year, the summit will be held July<br />
6 to 9 in Gleneagle, Scotland.<br />
They discuss health, law enforcement,<br />
labor, and other issues of mutual<br />
or global concern. Some meetings feature<br />
only the original G7, and there also<br />
is a “G8+5” meeting for the finance<br />
ministers of the full G8, as well as<br />
China, Mexico, India, Brazil, and South<br />
Africa.<br />
The annual summits are often the<br />
focus of anti-globalization movement<br />
protests, such as what occurred at the<br />
27th G8 summit in Genoa in 2001.<br />
The location of the summit meetings<br />
rotates annually among member coun-<br />
Average gain/loss (%)<br />
0.15<br />
0.10<br />
0.05<br />
0<br />
-0.05<br />
-0.10<br />
-0.15<br />
-0.20<br />
tries in the order in which each nation<br />
joined the group: France, U.S., UK,<br />
Germany, Japan, Italy, Canada, Russia.<br />
Impact on the U.S. dollar<br />
To determine how currency markets<br />
have behaved surrounding annual<br />
meetings of the G7/G8 countries, we<br />
analyzed the Federal Reserve’s nominal<br />
U.S. dollar major currencies index<br />
around each of these 30 events since the<br />
group’s formation in 1975.<br />
Figure 1 shows the average daily gains<br />
or losses on the 10 days before the summit,<br />
each of the meeting’s three days<br />
(MDs 1 to 3), and the 10 subsequent<br />
days.<br />
Overall, the U.S. dollar tended to<br />
slide in anticipation of meetings. The<br />
dollar sold off in the second week prior<br />
to these events and then <strong>trade</strong>d sideways<br />
on the five days leading up to<br />
them. The index fell an average 0.36<br />
percent from the 10th to the seventh<br />
day, but moved less than 0.05 percent<br />
(up or down) from the sixth day to the<br />
day before meetings.<br />
FIGURE 1 — ANNUAL MEETING’S INFLUENCE ON THE U.S. DOLLAR<br />
Although the Fed's U.S. dollar major currencies index tended to sell off the second<br />
week prior to annual G7 meetings since the group's 1975 founding, it went<br />
nowhere in the five days leading up to the event. However, the greenback rose<br />
an average 0.12 percent on the day following the meeting's end before it fell 0.20<br />
percent the next day — the largest move (up or down) in the analysis window.<br />
U.S. dollar major currencies index before/after G7/G8 meetings<br />
(1975 to 2004)<br />
Day -10<br />
Day -9<br />
Day -8<br />
Day -7<br />
Day -6<br />
Day -5<br />
Day -4<br />
Day -3<br />
Day -2<br />
Day -1<br />
MD 1<br />
MD 2<br />
MD 3<br />
Day 1<br />
Day 2<br />
Day 3<br />
Day 4<br />
Day 5<br />
Day 6<br />
Day 7<br />
Day 8<br />
Day 9<br />
Day 10<br />
Days before, during (MD 1, MD 2, MD 3), and after G7/G8 meetings<br />
34 July 2005 • CURRENCY TRADER
The dollar’s most intriguing pattern<br />
appeared after the summit: It climbed<br />
an average 0.12 percent on day 1 before<br />
dropping off a cliff the next day (-0.20<br />
percent) — the study’s largest daily<br />
move in either direction. Although the<br />
index headed higher in the remaining<br />
eight days, it posted gains on just five<br />
of those days and no distinct pattern<br />
emerged.<br />
Table 1 divides the analysis period<br />
into three sections: The 10 days prior to<br />
the summit, its three-day duration, and<br />
the following 10 days. The table compares<br />
each day’s average performance<br />
to its median and shows its benchmark<br />
(a loss of less than 0.01 percent) as well<br />
as maximum and minimum moves.<br />
Standard deviations and percentage of<br />
gains are also shown.<br />
The U.S. dollar’s average values<br />
match their medians, which implies<br />
Figure 1’s gains and losses are fairly<br />
accurate. However, there are two exceptions<br />
to this rule. For instance, day -4’s<br />
median is more bullish than its average<br />
(0.12 vs. -0.02 percent, respectively), and<br />
the opposite scenario occurred on day 3<br />
(-0.09 vs. 0.08 percent).<br />
Each day’s percentage of gains also<br />
reinforces the U.S. dollar’s pattern of<br />
slumping prior to G7 meetings and<br />
rebounding, somewhat, after them. For<br />
example, eight of the 10 days before<br />
these events have a win percentage of<br />
less than 50 percent, which means the<br />
index is likely to lose ground during<br />
this period. Similarly, five of the subsequent<br />
10 days have win percentages<br />
greater than 50, and day 2’s biggest loss<br />
(0.20 percent) also has just a 33.33-percent<br />
change of losing ground.<br />
This year’s meeting<br />
The G8 met in June of this year, and<br />
kept up pressure on developing Asian<br />
economies to adopt market-based<br />
exchange rates. But the meeting produced<br />
no clues as to when China will<br />
relax the peg of its renminbi currency to<br />
the dollar. This topic is expected to be<br />
the center of huge debate at the meeting<br />
in July.<br />
Traders have said, judging from the<br />
reduction in dollar/yen positions, that<br />
it appears the threat of Chinese revaluation<br />
still remains. This is especially<br />
true following China’s announcement<br />
of plans to attend the G8 Summit.<br />
Traders do not seem to be worried<br />
about a slide in the dollar before the<br />
July meeting (the dollar was up for the<br />
week as of June 30), but some say they<br />
are cautious about the days leading up<br />
to the summit. Edinburgh, Scotland,<br />
will likely shut down during the<br />
protests that routinely accompany G8<br />
meetings, as a local business leader<br />
called on businesses to close amid security<br />
fears. Financial institutions such as<br />
the Royal Bank of Scotland and<br />
Standard Life are seen as likely <strong>targets</strong><br />
of the anti-G8 demonstration.<br />
Questions or comments? Click here.<br />
TABLE 1 — U.S. DOLLAR STATS<br />
Overall, these statistics reinforce the U.S. dollar index's pattern of falling in anticipation of G7/G8 meetings and rebounding<br />
after them. (Day 2's sell-off is one major exception to this rule.)<br />
Day -10 Day -9 Day -8 Day -7 Day -6 Day-5 Day -4 Day -3 Day -2 Day -1<br />
Instances 30 30 30 30 30 30 30 30 30 30<br />
Average: -0.05% -0.12% -0.11% -0.09% -0.02% -0.01% -0.02% -0.04% 0.02% 0.02%<br />
Median: -0.04% -0.16% -0.13% -0.06% -0.05% -0.03% 0.12% -0.06% -0.02% 0.08%<br />
Benchmark: 0.00% 0.00% 0.00% 0.00% 0.00% 0.00% 0.00% 0.00% 0.00% 0.00%<br />
Max: 0.54% 1.26% 0.75% 1.04% 0.89% 0.75% 0.80% 0.93% 1.15% 0.79%<br />
Min: -1.03% -0.98% -1.28% -1.48% -0.64% -0.66% -1.22% -0.76% -0.97% -1.48%<br />
Standard deviation: 0.32% 0.39% 0.42% 0.52% 0.34% 0.32% 0.49% 0.39% 0.42% 0.41%<br />
Pct. > 0: 33.33% 36.67% 33.33% 43.33% 43.33% 43.33% 60.00% 36.67% 46.67% 60.00%<br />
Meeting Meeting Meeting<br />
Day 1* Day 2* Day 3*<br />
Instances 28 16 7<br />
Average: -0.01% 0.10% 0.07%<br />
Median: 0.03% 0.07% 0.02%<br />
Benchmark: 0.00% 0.00% 0.00%<br />
Max: 0.65% 0.79% 0.61%<br />
Min: -1.31% -0.61% -0.27%<br />
Standard deviation: 0.41% 0.48% 0.29%<br />
Pct. > 0: 50.00% 62.50% 57.14%<br />
* Not all G7/G8 meetings have lasted three days. MDs 1 to 3 have<br />
less than 30 instances because they track the U.S. dollar’s gains and<br />
losses during days in which the G7/G8 met and the U.S. dollar <strong>trade</strong>d.<br />
Otherwise, the index <strong>trade</strong>d consecutively from Day -1 to Day 1<br />
(the day preceding and following the summit, respectively).<br />
Day 1 Day 2 Day 3 Day 4 Day 5 Day 6 Day 7 Day 8 Day 9 Day 10<br />
Instances 30 30 30 30 30 30 30 30 30 30<br />
Average: 0.12% -0.20% 0.08% 0.05% 0.01% 0.06% -0.04% 0.14% -0.01% -0.01%<br />
Median: 0.15% -0.15% -0.09% 0.05% 0.00% 0.02% 0.01% 0.09% -0.02% 0.07%<br />
Benchmark: 0.00% 0.00% 0.00% 0.00% 0.00% 0.00% 0.00% 0.00% 0.00% 0.00%<br />
Max: 1.02% 0.59% 1.13% 0.74% 0.80% 1.36% 0.66% 0.96% 1.69% 0.59%<br />
Min: -0.95% -1.23% -0.56% -1.38% -0.58% -0.97% -0.68% -0.92% -0.78% -1.00%<br />
Standard deviation: 0.43% 0.44% 0.44% 0.41% 0.36% 0.52% 0.31% 0.40% 0.47% 0.33%<br />
Pct. > 0: 63.33% 33.33% 43.33% 56.67% 50.00% 56.67% 50.00% 70.00% 36.67% 56.67%<br />
CURRENCY TRADER • July 2005 35
GLOBAL ECONOMIC CALENDAR JULY/AUGUST MONTH<br />
Monday Tuesday Wednesday Thursday Friday Saturday<br />
Legend<br />
CPI: Consumer Price Index<br />
ECB: European Central Bank<br />
GDP: Gross Domestic Product<br />
FOMC: Federal Open Market<br />
4<br />
Japan: Monetary<br />
base<br />
11<br />
Great Britain:<br />
PPI<br />
5 6<br />
Great Britain:<br />
Monetary Policy<br />
Committee meeting<br />
Germany: Orders<br />
received and<br />
manufacturing turnover<br />
G7 meeting<br />
12<br />
Japan:<br />
Corporate<br />
goods price<br />
index<br />
Great Britain:<br />
CPI<br />
13<br />
U.S.: Trade<br />
balance<br />
Japan: Balance<br />
of payments<br />
Great Britain:<br />
Employment<br />
7<br />
ECB: Governing council<br />
meeting<br />
Great Britain: Monetary<br />
Policy Committee meeting<br />
Australia: Official reserve<br />
assets<br />
G7 meeting<br />
14<br />
U.S.: Retail sales; CPI<br />
Japan: Monetary survey<br />
Canada: Manufacturing<br />
survey<br />
Germany: CPI<br />
15<br />
U.S.: PPI<br />
Germany:<br />
Bankruptcies<br />
8<br />
U.S.: Employment;<br />
Wholesale<br />
inventories<br />
Germany:<br />
Production index;<br />
Foreign <strong>trade</strong><br />
G7 meeting<br />
Italy: Balance of<br />
payments<br />
18 19<br />
20<br />
21<br />
22<br />
23<br />
Germany: PPI<br />
25 26<br />
Japan: Corporate<br />
service price index<br />
1<br />
U.S.: ISM report<br />
Japan: Account<br />
balances<br />
2<br />
Japan: Monetary<br />
base<br />
Australia: Index of<br />
commodity prices<br />
Committee<br />
ISM: Institute for Supply<br />
Management<br />
PPI: Producer Price Index<br />
Great Britain:<br />
Capital issues<br />
Canada:<br />
Wholesale <strong>trade</strong>;<br />
Leading indicators<br />
27<br />
U.S.: Durable<br />
goods<br />
3<br />
Great Britain:<br />
Monetary Policy<br />
Committee<br />
meeting<br />
U.S.: Leading<br />
indicators<br />
ECB: Governing<br />
council meeting<br />
28<br />
Canada:<br />
Employment<br />
Germany:<br />
Employment<br />
4<br />
ECB: Governing Council<br />
meeting<br />
Great Britain: Monetary<br />
Policy Committee meeting<br />
Germany: Orders received<br />
and manufacturing<br />
turnover<br />
1<br />
U.S.: ISM report<br />
Japan: Account balances<br />
Germany: Retail turnover<br />
Great Britain: Productivity<br />
Australia: Index of<br />
commodity prices<br />
Canada: CPI;<br />
Retail <strong>trade</strong><br />
Great Britain:<br />
GDP<br />
The information on this page is subject to change. Currency Trader is not responsible for the accuracy of calendar dates beyond press time.<br />
36 July 2005 • CURRENCY TRADER<br />
1 6<br />
9<br />
29<br />
U.S.: GDP<br />
Canada: GDP<br />
Germany: Retail turnover<br />
Australia: International reserves<br />
and foreign currency liquidity<br />
Italy: International reserves and<br />
foreign currency liquidity<br />
5<br />
U.S.:<br />
Employment<br />
Germany:<br />
Production<br />
index<br />
6<br />
2
CURRENCY FUTURES BY CARLISE PETERSON<br />
CME engages retail <strong>trade</strong>rs<br />
The Chicago Mercantile Exchange<br />
(CME) is trying to<br />
attract the spot foreign<br />
exchange <strong>trade</strong>rs by instituting<br />
a retail partner program with<br />
nine futures commission merchants<br />
(FCMs) in the U.S. and three in Europe<br />
(UK, Spain, and Denmark).<br />
The goal is to attract new <strong>trade</strong>rs,<br />
such as active stock <strong>trade</strong>rs and cash<br />
forex <strong>trade</strong>rs, into the futures marketplace,<br />
as well as “extend the life” of<br />
existing <strong>trade</strong>rs, according to Mark<br />
Omens, associate director of equity<br />
products at the CME.<br />
This year the CME is promoting E-<br />
Mini futures and options and forex<br />
futures and options. They’ve conducted<br />
50 live and online seminars this<br />
year, and they held 23 live workshops<br />
and 148 online seminars last year. They<br />
also started a CME seminar of the<br />
month program which highlights<br />
upcoming product launches, such as<br />
exchange-<strong>trade</strong>d fund futures (ETFs),<br />
as well as topics relevant to the target-<br />
CURRENCY FUTURES SNAPSHOT<br />
as of 6/23/05<br />
The information does NOT constitute <strong>trade</strong> signals. It is intended only to provide a brief synopsis of each market’s<br />
liquidity, direction, and levels of momentum and volatility. See the legend for explanations of the different fields.<br />
Contract Pit Elec Exch Vol OI 10-day % 20-day % 60-day % Volatility<br />
sym sym move rank move rank move rank ratio/% rank<br />
Euro FX EC 6E CME 132.8 133.9 -1.62% 42% -4.32% 85% -6.93% 82% .19 / 3%<br />
Japanese yen JY 6J CME 42.5 135.7 -1.46% 62% -0.45% 7% -1.06% 20% .25 / 7%<br />
Canadian dollar CD 6C CME 27.2 72.9 1.91% 100% 2.60% 88% -1.23% 31% .53 / 81%<br />
British pound BP 6B CME 26.4 69.2 -0.25% 24% -1.17% 26% -3.45% 63% .22 / 7%<br />
Swiss franc SF 6S CME 25.4 60.8 -2.03% 80% -3.64% 69% -6.25% 84% .16 / 5%<br />
Australian dollar AD 6A CME 15.7 67.1 0.73% 33% 0.96% 35% 0.21% 4% .64 / 85%<br />
Mexican peso MP 6M CME 11.4 93.2 1.16% 50% 0.30% 12% 4.07% 95% .28 / 22%<br />
U.S. dollar index DX NYBOT 4.1 23.4 1.23% 42% 3.09% 63% 5.66% 84% .22 / 8%<br />
Euro / Japanese yen EJ NYBOT 1.1 11.1 -0.15% 0% -3.97% 100% 5.94% 96% .25 / 32%<br />
Euro / Swiss franc RZ NYBOT 0.8 12.0 0.43% 50% -0.68% 68% -0.68% 52% .38 / 42%<br />
Note: Average volume and open interest data includes both pit and side-by-side electronic contracts (where applicable). Price activity is based on pit-<strong>trade</strong>d contracts.<br />
LEGEND:<br />
Sym: Ticker symbol.<br />
Vol: 30-day average daily volume, in thousands.<br />
OI: 30-day open interest, in thousands.<br />
10-day move: The percentage price move from the<br />
close 10 days ago to today’s close.<br />
20-day move: The percentage price move from the<br />
close 20 days ago to today’s close.<br />
60-day move: The percentage price move from the<br />
close 60 days ago to today’s close.<br />
ed audience. The partner firms promote<br />
the seminars as well.<br />
“Our definition of an active <strong>trade</strong>r is<br />
a committed, sophisticated, online<br />
<strong>trade</strong>r — and an individual whose<br />
sole income is not just trading,<br />
necessarily,” Omens says.<br />
“When you look at retail, it<br />
could be a [person] who <strong>trade</strong>s<br />
one to three times a month, or<br />
every day, all day long. We want<br />
to provide a sound understanding of<br />
futures trading for everyone and want<br />
to help them become better <strong>trade</strong>rs.”<br />
The average retail account lasts just<br />
12 to 15 months, and most new <strong>trade</strong>rs<br />
don’t make it past six months, Omens<br />
says. He feels there is a big difference<br />
between trading in the spot markets<br />
and trading futures.<br />
“We need to educate them,” he says.<br />
“Some [new <strong>trade</strong>rs] just start trading<br />
really recklessly.”<br />
Omens says the CME’s “Webinars”<br />
are designed to instill the money-management<br />
knowledge that makes their<br />
The “% rank” fields for each time window (10-day<br />
moves, 20-day moves, etc.) show the percentile rank of<br />
the most recent move to a certain number of the previous<br />
moves of the same size and in the same direction.<br />
For example, the % rank for 10-day move shows how<br />
the most recent 10-day move compares to the past<br />
twenty 10-day moves; for the 20-day move, the % rank<br />
field shows how the most recent 20-day move compares<br />
to the past sixty 20-day moves; for the 60-day<br />
move, the % rank field shows how the most recent 60day<br />
move compares to the past one-hundred-twenty 60day<br />
moves. A reading of 100% means the current read-<br />
primary business successful — say, a<br />
dentist, a small-business owner, an<br />
analyst, or a retiree.<br />
“A brokerage will not give you<br />
rules,” Omens says, which is why<br />
the exchange wants to work with<br />
brokerages to educate <strong>trade</strong>rs<br />
and extend the life of existing<br />
<strong>trade</strong>rs. The CME does not give<br />
<strong>trade</strong> recommendations, but<br />
orchestrates seminars on its products,<br />
the users, and discusses leverage.<br />
Dan Gramza, the primary CME educator,<br />
focuses mainly on technical indicators.<br />
The courses do not offer buying<br />
or selling tips.<br />
The CME sends its live Webcasts to<br />
all of its customers and the brokerage<br />
firms it has partnered with, and<br />
archives them as well. Firms that are<br />
not current partners can access the<br />
seminars also.<br />
Eight U.S. brokerages are partners in<br />
the program, and there are three outside<br />
of the U.S. in London, Spain, and<br />
Denmark.<br />
ing is larger than all the past readings, while a reading<br />
of 0% means the current reading is lower than the previous<br />
readings. These figures provide perspective for<br />
determining how relatively large or small the most<br />
recent price move is compared to past price moves.<br />
Volatility ratio/% rank: The ratio is the short-term<br />
volatility (10-day standard deviation of prices) divided by<br />
the long-term volatility (100-day standard deviation of<br />
prices). The % rank is the percentile rank of the volatility<br />
ratio over the past 60 days.<br />
This information is for educational purposes only. Currency Trader provides this data in good faith, but cannot guarantee its accuracy or timeliness. Currency Trader assumes<br />
no responsibility for the use of this information. Currency Trader does not recommend buying or selling any market, nor does it solicit orders to buy or sell any market. There is<br />
a high level of risk in trading, especially for <strong>trade</strong>rs who use leverage. The reader assumes all responsibility for his or her actions in the market.<br />
37 July 2005 • CURRENCY TRADER
INTERNATIONAL MARKET SUMMARY<br />
FOREX (vs. U.S. DOLLAR)<br />
Current<br />
price vs. 1-month 3-month 6-month 52-week 52-week Previous<br />
Rank* Country Currency U.S. dollar gain/loss gain/loss gain/loss high low rank<br />
1 Canadian 0.8102 2.57% -1.39% -0.38% 0.8532 0.7243 9<br />
dollar<br />
2 Australian 0.7701 1.45% -0.21% 0.04% 0.7988 0.6852 10<br />
dollar<br />
3 Brazilian 0.4215 1.45% 13.31% 12.12% 0.4228 0.3189 1<br />
real<br />
4 British 1.8242 0.21% -2.55% -5.46% 1.955 1.7707 15<br />
pound<br />
5 Hong Kong 0.1287 0.16% 0.39% 0.16% 0.1288 0.128 4<br />
dollar<br />
6 Indian 0.02304 0.04% 0.56% 0.48% 0.02309 0.02145 2<br />
rupee<br />
7 Taiwanese 0.03192 -0.34% 0.38% 2.69% 0.03253 0.02801 3<br />
dollar<br />
8 New Zealand 0.7058 -0.52% -1.22% -1.71% 0.7464 0.6255 11<br />
dollar<br />
9 Singapore 0.5973 -0.85% -1.89% -2.09% 0.6186 0.5778 5<br />
dollar<br />
10 Japanese 0.009174 -1.05% -2.51% -5.16% 0.00983 0.00889 8<br />
yen<br />
11 South African 0.1495 -1.20% -8.09% -18.80% 0.1783 0.1427 16<br />
rand<br />
12 Russian 0.03492 -2.00% -3.41% -2.95% 0.03643 0.03414 6<br />
rouble<br />
13 Thai 0.02435 -2.01% -6.12% -5.50% 0.02621 0.0239 7<br />
baht<br />
14 Swiss 0.7843 -3.14% -6.27% -11.56% 0.8879 0.7775 14<br />
franc<br />
15 Euro 1.2086 -3.55% -7.22% -12.01% 1.3667 1.1967 12<br />
16 Swedish 0.1287 -5.67% -10.49% -16.78% 0.152 0.1276 13<br />
krona<br />
As of June 27, 2005 *based on one-month gain/loss<br />
INTEREST RATES<br />
Rank Country Rate June 27 1-month 3-month 6-month Previous<br />
1 Germany BUND 123.59 1.42% 4.73% 4.44% 2<br />
2 U.S. 10-year T-note 113.3 0.97% 4.55% 1.89% 1<br />
3 Japan Government bond 141 0.26% 1.49% 2.12% 3<br />
4 Australia 3-year bonds 94.945 0.17% 0.72% N/A 5<br />
5 U.K. Short sterling 95.39 0.14% 0.46% 0.15% 4<br />
38 July 2005 • CURRENCY TRADER
NON-U.S. DOLLAR FOREX CROSS RATES<br />
Currency 1-month 3-month 6-month 52-week 52-week<br />
Rank pair Symbol June 27 gain/loss gain/loss gain/loss high low Previous<br />
1 Canadian $ / Euro CAD/EUR 0.6706 5.91% 5.44% 10.38% 0.6743 0.5962 7<br />
2 Aussie $ / Euro AUD/EUR 0.6373 4.82% 6.54% 10.75% 0.6424 0.5643 10<br />
3 Real / Euro BRL/EUR 0.3488 4.79% 19.12% 21.53% 0.3488 0.2625 2<br />
4 Aussie $ / Franc AUD/CHF 0.9823 4.47% 5.72% 10.39% 0.9908 0.8635 9<br />
5 Pound / Euro GBP/EUR 1.5091 3.58% 4.38% 5.98% 1.52 1.4057 14<br />
6 Canadian $ / Yen CAD/JPY 88.3406 3.56% 1.09% 4.53% 89.7805 78.0564 12<br />
7 Aussie $ / Yen AUD/JPY 84.004 2.53% 2.26% 5.01% 85.01 74.49 16<br />
8 Real / Yen BRL/JPY 45.9557 2.44% 15.42% 16.43% 42.0039 34.3301 5<br />
9 Canadian $ / Pound CAD/GBP 0.4442 2.36% 1.13% 4.80% 0.454 0.397 6<br />
10 Pound / Yen GBP/JPY 199.15 1.37% 0.13% 0.05% 205.94 189.5 20<br />
11 Real / Pound BRL/GBP 0.2311 1.25% 15.45% 16.66% 0.2317 0.1748 1<br />
12 Aussie $ / Pound AUD/GBP 0.4222 1.23% 2.27% 5.19% 0.4275 0.382 8<br />
13 Franc / Euro CHF/EUR 0.6489 0.37% 0.77% 0.42% 0.6632 0.6394 13<br />
14 Real / Aussie $ BRL/AUD 0.5476 -0.02% 13.50% 12.09% 0.5555 0.4532 3<br />
15 Aussie $ / Canadian $ AUD/CAD 0.9512 -1.10% 1.18% 0.44% 0.9837 0.8863 15<br />
16 Real / Canadian $ BRL/CAD 0.5206 -1.11% 14.50% 12.49% 0.5306 0.4212 4<br />
17 Franc / Yen CHF/JPY 85.5137 -2.10% -3.68% -6.09% 91.6645 85.1568 19<br />
18 Euro / Yen EUR/JPY 132.02 -2.27% -4.38% -6.31% 141.59 130.6 17<br />
19 Franc / Pound CHF/GBP 0.4304 -3.28% -3.55% -5.69% 0.4647 0.4274 11<br />
20 Franc / Canadian $ CHF/CAD 0.9687 -5.83% -4.81% -11.12% 1.1054 0.9636 18<br />
1-month 3-month 6-month 52-week 52-week<br />
Rank Country Index June 27 gain/loss gain/loss gain/loss high low Previous<br />
1 Egypt CMA 1794.79 9.47% 10.72% 32.63% 1801.98 898.55 3<br />
2 India BSE 30 7151.08 6.20% 9.90% 8.92% 7228.21 4723.04 5<br />
3 Canada S&P/TSX composite 9998.09 3.79% 4.65% 7.11% 10075.01 8116.15 10<br />
4 Hong Kong Hang Seng 14176.04 3.25% 4.17% -0.13% 14339.06 11862.68 14<br />
5 Australia All ordinaries 4191.2 2.80% 1.42% 3.39% 4275.6 3479.3 11<br />
6 Mexico IPC 13454.73 2.40% 4.47% 4.72% 13931.32 9789.42 1<br />
7 Singapore Straits Times 2206.71 2.36% 2.50% 7.06% 2230.56 1839.33 9<br />
8 Japan Nikkei 225 11414.28 1.94% -3.04% 0.45% 11988.12 10545.89 13<br />
9 Germany Xetra Dax 4523.82 1.75% 3.98% 6.38% 4637.34 3618.58 2<br />
10 U.K. FTSE 100 5043.5 1.13% 2.40% 4.87% 5121.9 4283 8<br />
11 France CAC 40 4157.68 0.62% 1.91% 6.40% 4246.43 3452.41 6<br />
12 Switzerland Swiss Market 6191.1 0.49% 4.13% 8.17% 6307.7 5264.5 7<br />
13 Italy MIBTel 24280 0.19% -0.92% 3.37% 25155 19733 12<br />
14 Brazil Bovespa 25226 -0.11% -5.85% -2.82% 29584 20351 15<br />
15 U.S. S&P 500 1190.69 -0.68% 1.62% -1.20% 1229.1 1060.72 4<br />
Rank Country 2004 Ratio* 2003 2005 +<br />
1 Hong Kong 15.872 9.6 16.182 16.254<br />
2 Taiwan 19.013 6.2 29.266 22.619<br />
3 Japan 3.7 3.7 136.238 157.223<br />
4 Germany 96.411 3.6 51.755 110.467<br />
5 Canada 26.044 2.6 17.048 28.299<br />
6 Denmark 3.459 1.4 6.337 5.043<br />
7 France -5.41 -0.3 4.987 -9.854<br />
8 Italy -24.818 -1.5 -21.942 -23.906<br />
GLOBAL STOCK INDICES<br />
ACCOUNT BALANCE<br />
Rank Country 2004 Ratio* 2003 2005 +<br />
9 U.K. -47.044 -2.2 -30.627 0.53<br />
10 Spain -49.159 -5.0 -23.553 -54.304<br />
11 U.S. -665.938 -5.7 -530.669 -724.49<br />
12 New Zealand -6.042 -6.2 -3.284 -6.919<br />
13 Australia -39.389 -6.4 -30.242 -38.934<br />
Totals in billions of U.S. dollars<br />
*Account balance in percent of GDP; + Estimate<br />
Source: International Monetary Fund, World Economic Outlook<br />
Database, April 2005<br />
CURRENCY TRADER • July 2005 39
EUROPE<br />
GLOBAL NEWS BRIEFS<br />
Preliminary data on the United Kingdom’s Q1 2005<br />
economy showed 0.6-percent growth over the previous<br />
quarter and 2.8 percent from the first quarter of 2004. The<br />
nation’s jobless rate fell 0.1 percent between February and<br />
April to 4.7 percent, a rate that matched the same period in<br />
2004.<br />
France’s April unemployment rate remained at 10.2 percent,<br />
a 0.2-percent increase over the same month a year earlier.<br />
According to France’s National Institute for Statistics and<br />
Economic Studies (INSEE), France has entered “a less<br />
robust growth phase,” as indicated by low GDP growth in<br />
Q1 and punctuated by a softening of French exports. Even<br />
though France is experiencing “dynamic domestic demand<br />
in the form of household consumption, house purchases,<br />
and corporate investment,” an economic upturn is unlikely<br />
to happen until after Q2.<br />
“Inflation is expected to stabilize at around 1.5 percent<br />
Q2, permitting a rise in purchasing power in 2005 similar to<br />
that of 2004 and growth in consumption of a little more than<br />
2 percent,” says the INSEE. “The principal uncertainty<br />
hanging over this outlook is a failure of France’s continental<br />
neighbors to spur growth in domestic demand. The probability<br />
of such a failure would be increased if oil prices rise.”<br />
Germany’s April jobless rate fell 0.4 percent to 11.6 percent<br />
from the month before, but was 1.3 percent above the<br />
rate of April 2004.<br />
In a surprise move, Sweden’s central bank cut the country’s<br />
benchmark index rate by 50 basis points to an all-time<br />
low of 1.5 percent. The Riksbank said falling GDP growth,<br />
both in Sweden and in the Eurozone, contributed to its decision.<br />
The European Central Bank is being pressured to cut<br />
overall rates in the eurozone.<br />
ASIA & THE SOUTH PACIFIC<br />
Japan’s April unemployment rate dropped 0.1 percent<br />
compared to the previous month and fell 0.2 percent compared<br />
to April 2004.<br />
For the first time, China will allow certain foreign<br />
institutional investors to participate in its futures market.<br />
“China’s futures market is short of big institutional players,”<br />
said China’s Securities Regulatory Commission (SRC)<br />
director of futures supervision Yang Maijun. “Development<br />
of the market hasn’t caught up with investors’ demand.”<br />
China is also considering introducing market makers in<br />
trading between the renminbi and the U.S. dollar. The<br />
move is considered one of the first steps in China moving<br />
toward a more flexible renminbi.<br />
Between March and May, Hong Kong’s preliminary<br />
jobless rate decreased 0.2 percent from the December-<br />
February period and fell 1.3 percent compared to the same<br />
period last year.<br />
Australia’s Q1 economy rose 0.7 percent compared to<br />
Q4 and 1.9 percent in year-to-year comparisons, boosted by<br />
growing inventories and increases in household final consumption<br />
expenditure. The country’s jobless rate for May<br />
stabilized at 5.10 percent, which was 0.4 percent lower than<br />
in May 2004.<br />
AMERICAS<br />
Argentina’s economy grew 7.0 percent from the previous<br />
year, while the country’s May unemployment rate increased<br />
0.9 percent from the previous month. However, the jobless<br />
rate was down 1.4 percent compared to May 2004.<br />
Brazil’s May GDP increased 0.3 percent over the previous<br />
month and rose 2.9 percent compared to the same<br />
month in 2004. The country adjusted its accumulated GDP<br />
for 2004 to 4.9 percent, representing growth of 4.6 percent.<br />
The nation’s April jobless rate remained constant at 10.8<br />
percent, 2.3 percent lower than April 2004.<br />
Canada’s economy for the first quarter of 2005 grew 1<br />
percent compared to the previous quarter and increased 6.3<br />
percent compared to Q1 2004. The country’s jobless rate<br />
stayed stable at 7 percent, a 0.4-percent decrease from May<br />
2004.<br />
AFRICA<br />
Africa’s first-quarter 2005 GDP rose 3.5 percent compared<br />
to the previous quarter and increased 3.7 percent<br />
year-on-year. The growth is attributed mostly to gains in<br />
finance, real estate, and business services.<br />
CURRENCY TRADER • July 2005 40
Share Currency Trader with a friend<br />
Every month Currency Trader delivers an in-depth look at the forex market, complete with currency strategies,<br />
industry news, roundup of the global numbers, system analysis and much more.<br />
You can share the wealth by sharing Currency Trader with a friend!<br />
Follow the four simple steps below to invite your friends and colleagues to download a free copy<br />
of Currency Trader magazine.<br />
1. Go to www.currency<strong>trade</strong>rmag.com/refer.htm.<br />
2. In the form that appears, enter the name and e-mail address of each person with whom you’d like to share<br />
Currency Trader.<br />
3. Add a personal message if you’d like.<br />
4. Click Submit. We’ll send an email with your greeting and<br />
simple instructions about how to download<br />
a free copy of Currency Trader.<br />
Visit www.currency<strong>trade</strong>rmag.com for more information.
FOREX DIARY<br />
Short-term short <strong>trade</strong> sets up<br />
within longer-term uptrend.<br />
TRADE<br />
Date: Wednesday, June 29, 2005.<br />
Entry: Short the U.S. dollar/Swiss franc<br />
(USD/CHF) at 1.2825.<br />
Reason(s) for <strong>trade</strong>/setup: On June<br />
24, the USD/CHF rate marked its eight consecutive<br />
week of higher highs — a period<br />
during which it gained more than 600<br />
points. Similar patterns in the past have<br />
been followed by down moves over the next couple of<br />
weeks, although testing showed the distinct potential for<br />
future gains on a longer-term basis.<br />
As described in this month’s Spot Check, virtually every<br />
off-the-shelf momentum oscillator — e.g., the stochastic<br />
and RSI on the daily chart — has been showing the market<br />
as overbought, although the chart also reveals how long<br />
these signals can persist without the expected price correction<br />
occurring.<br />
Nonetheless, these conditions suggest technical <strong>trade</strong>rs<br />
who are already long will be looking to take profits on any<br />
sign of weakness, while others will go short — especially<br />
since the currency pair has approached the notable resistance<br />
level implied by the July and August 2004 highs.<br />
These factors should support the probabilities of the historical<br />
pattern testing. As noted, though, we will prepare to<br />
reverse and go long in anticipation of a resumption of the<br />
uptrend after this correction. Virtually every long-term<br />
trend-following system is long this currency pair, and it will<br />
take a larger correction than the one anticipated by this<br />
<strong>trade</strong> for them to reverse. However, if that happens, we are<br />
prepared to ride the market lower with a trailing stop.<br />
TRADE SUMMARY<br />
U.S. dollar/Swiss franc (USD/CHF), daily<br />
Resistance level from August to September 2004 highs<br />
Stochastic slow<br />
RSI<br />
Initial stop: If the currency pair breaks above the resistance<br />
level, it’s likely to make a run at the “round number”<br />
of 1.3000, so we’ll place the initial stop at 1.3045.<br />
Initial target: 1.2575, which is 10 pips above the June 17<br />
low; secondary target is 1.2420, 10 pips above June 8 low.<br />
RESULT<br />
Exit: Position still open.<br />
Profit/loss: -.0051.<br />
Short at 1.2825<br />
Initial target<br />
Secondary target<br />
May June July<br />
Trade executed according to plan? So far.<br />
Lesson(s): The market, not surprisingly, pushed above<br />
the resistance level not long after we entered the position.<br />
Although this is likely to trigger a fair amount of immediate<br />
technical buying, it does not negate the analysis that initiated<br />
the <strong>trade</strong>. <br />
Date Rate Entry Initial Initial IRR Exit Date P/L LOP LOL Trade<br />
stop target length<br />
6/29/05 USD/CHF 1.2825 1.3045 1.2575 1.14 1.2876 6/29/05 -.0051 .0012 -.0051 —<br />
(MTM) (0.4%)<br />
Legend: IRR — initial reward/risk ratio (initial target amount/initial stop amount); LOP — largest open profit (maximum available profit<br />
during lifetime of <strong>trade</strong>); LOL — largest open loss (maximum potential loss during life of <strong>trade</strong>); MTM — marked to market price.<br />
42 July 2005 • CURRENCY TRADER<br />
1.31<br />
1.30<br />
1.29<br />
1.28<br />
1.27<br />
1.26<br />
1.25<br />
1.24<br />
1.23<br />
1.22<br />
1.21<br />
1.20<br />
1.19<br />
100<br />
80<br />
60<br />
40<br />
20<br />
100<br />
80<br />
60<br />
40<br />
20<br />
Source: TradeStation
KEY CONCEPTS AND DEFINITIONS<br />
Moving average convergence-divergence (MACD)<br />
Although it is often grouped in with oscillators,<br />
the MACD is more of an intermediate-term<br />
trend indicator (although it can reflect overbought<br />
and oversold conditions).<br />
The default MACD line (which can also be plotted as a<br />
histogram, as is the case in the accompanying article) is created<br />
by subtracting a 26-period exponential moving average<br />
(EMA) of closing prices from a 12-period EMA of closing<br />
prices; a nine-period EMA is then applied to the MACD<br />
The Fibonacci series<br />
The Fibonacci series is a number progression in<br />
which each successive number is the sum of the<br />
two immediately preceding it: 1, 2, 3, 5, 8, 13, 21,<br />
34, 55, and so on.<br />
As the series progresses, the ratio of a number in the<br />
series divided by the immediately preceding number<br />
approaches 1.618, a number that is attributed significance<br />
by many <strong>trade</strong>rs because of it appearance in natural phenomena<br />
(the progression a shell’s spiral, for example), as<br />
well as in art and architecture (including the dimensions of<br />
the Parthenon and the Great Pyramid). The inverse, .618<br />
(.62), has a similar significance.<br />
Some <strong>trade</strong>rs use fairly complex variations of Fibonacci<br />
numbers to generate price forecasts, but a basic approach is<br />
to use ratios derived from the series to calculate likely price<br />
Bob Dorman<br />
Ad sales East Coast and Midwest<br />
bdorman@active<strong>trade</strong>rmag.com<br />
(312) 775-5421<br />
line to create a “signal line.”<br />
Allison Ellis<br />
Ad sales West Coast and Southwest<br />
aellis@active<strong>trade</strong>rmag.com<br />
(626) 497-9195<br />
MACD = EMA(C,12)-EMA(C,26)<br />
Signal line = EMA(MACD,9)<br />
Standard buy signals are given when the MACD crosses<br />
above its signal line (preferably when the indicator is at a<br />
relatively high level, reflecting an overbought condition);<br />
the opposite is true for sell signals.<br />
<strong>targets</strong>.<br />
For example, if a stock broke out of a trading range and<br />
rallied from 25 to 55, potential retracement levels could be<br />
calculated by multiplying the distance of the move (30<br />
points) by Fibonacci ratios –– say, .382, .50, and .618 –– and<br />
then subtracting the results from the high of the price move.<br />
In this case, retracement levels of 43.60 [55 - (30*.38)], 40 [55<br />
- (30*.50)] and 36.40 [55 - (30*.62)] would result.<br />
Similarly, after a trading range breakout and an up move<br />
of 10 points, a Fibonacci follower might project the size of<br />
the next leg up in terms of a Fibonacci ratio –– e.g., 1.382<br />
times the first move, or 13.82 points in this case.<br />
The most commonly used ratios are .382, .50, .618, .786,<br />
1.00, 1.382, and 1.618. Depending on circumstances, other<br />
ratios, such as .236 and 2.618, are used.<br />
Three good tools for targeting customers . . .<br />
— CONTACT —<br />
Mark Seger<br />
Account Executive<br />
mseger@active<strong>trade</strong>rmag.com<br />
(312) 377-9435<br />
July 2005 • CURRENCY TRADER 43
THIS MONTH’S ADVERTISERS<br />
Click on these boxes to link directly to these advertiser’s web sites<br />
44 July 2005 • CURRENCY TRADER