- Page 1 and 2:
Aquatic Environment and Biodiversit
- Page 3 and 4:
AEBAR 2012 Acknowledgements In addi
- Page 5 and 6:
AEBAR 2012 Contents PREFACE .......
- Page 7 and 8:
1. INTRODUCTION 1.1. Context and pu
- Page 9 and 10:
AEBAR 2012: Introduction Table 1.2:
- Page 11 and 12:
AEBAR 2012: Introduction • Impact
- Page 13 and 14:
AEBAR 2012: Introduction coastal/co
- Page 15 and 16:
AEBAR 2012: Research themes THEME R
- Page 17 and 18:
AEBAR 2012: Protected species: THEM
- Page 19 and 20:
AE&B Review: Protected species: Sea
- Page 21 and 22:
AE&B Review: Protected species: Sea
- Page 23 and 24:
AE&B Review: Protected species: Sea
- Page 25 and 26:
AE&B Review: Protected species: Sea
- Page 27 and 28:
AE&B Review: Protected species: Sea
- Page 29 and 30:
AE&B Review: Protected species: Sea
- Page 31 and 32:
AEBAR 2012: Protected species: Sea
- Page 33 and 34:
AEBAR 2012: Protected species: Sea
- Page 35 and 36:
AEBAR 2012: Protected species: Sea
- Page 37 and 38:
AEBAR 2012: Protected species: Sea
- Page 39 and 40:
AEBAR 2012: Protected species: Sea
- Page 41 and 42:
AEBAR 2012: Protected species: Sea
- Page 43 and 44:
AEBAR 2012: Protected species: Sea
- Page 45 and 46: AEBAR 2012: Protected species: Fur
- Page 47 and 48: 4.2.2. Distribution AEBAR 2012: Pro
- Page 49 and 50: AEBAR 2012: Protected species: Fur
- Page 51 and 52: AEBAR 2012: Protected species: Fur
- Page 53 and 54: AEBAR 2012: Protected species: Fur
- Page 55 and 56: AEBAR 2012: Protected species: Fur
- Page 57 and 58: a b c d e f AEBAR 2012: Protected s
- Page 59 and 60: 4.4.4. Sources of uncertainty AEBAR
- Page 61 and 62: 4.6. References AEBAR 2012: Protect
- Page 63 and 64: AEBAR 2012: Protected species: Fur
- Page 65 and 66: 5.1. Context AEBAR 2012: Protected
- Page 67 and 68: AEBAR 2012: Protected species: Seab
- Page 69 and 70: 5.2. Biology AEBAR 2012: Protected
- Page 71 and 72: AEBAR 2012: Protected species: Seab
- Page 73 and 74: AEBAR 2012: Protected species: Seab
- Page 75 and 76: AEBAR 2012: Protected species: Seab
- Page 77 and 78: AEBAR 2012: Protected species: Seab
- Page 79 and 80: AEBAR 2012: Protected species: Seab
- Page 81 and 82: AEBAR 2012: Protected species: Seab
- Page 83 and 84: AEBAR 2012: Protected species: Seab
- Page 85 and 86: AEBAR 2012: Protected species: Seab
- Page 87 and 88: AEBAR 2012: Protected species: Seab
- Page 89 and 90: It included two goals that set the
- Page 91 and 92: AEBAR 2012: Protected species: Seab
- Page 93 and 94: AEBAR 2012: Non-protected bycatch F
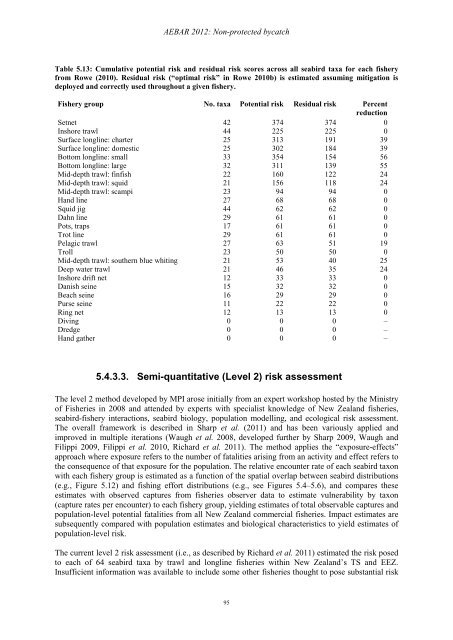
- Page 95: AEBAR 2012: Non-protected bycatch T
- Page 99 and 100: AEBAR 2012: Non-protected bycatch d
- Page 101 and 102: AEBAR 2012: Non-protected bycatch F
- Page 103 and 104: AEBAR 2012: Non-protected bycatch
- Page 105 and 106: AEBAR 2012: Non-protected bycatch 5
- Page 107 and 108: AEBAR 2012: Non-protected bycatch 5
- Page 109 and 110: AEBAR 2012: Non-protected bycatch 5
- Page 111 and 112: AEBAR 2012: Non-protected bycatch m
- Page 113 and 114: AEBAR 2012: Non-protected bycatch l
- Page 115 and 116: Trend in interactions contd. AEBAR
- Page 117 and 118: AEBAR 2012: Non-protected bycatch B
- Page 119 and 120: AEBAR 2012: Non-protected bycatch O
- Page 121 and 122: AEBAR 2012: Non-protected bycatch T
- Page 123 and 124: AEBAR 2012: Non-protected bycatch S
- Page 125 and 126: AEBAR 2012: Non-protected bycatch 6
- Page 127 and 128: AEBAR 2012: Non-protected bycatch F
- Page 129 and 130: AEBAR 2012: Non-protected bycatch F
- Page 131 and 132: AEBAR 2012: Non-protected bycatch F
- Page 133 and 134: AEBAR 2012: Non-protected bycatch F
- Page 135 and 136: AEBAR 2012: Non-protected bycatch F
- Page 137 and 138: AEBAR 2012: Non-protected bycatch 6
- Page 139 and 140: AEBAR 2012: Non-protected bycatch F
- Page 141 and 142: AEBAR 2012: Non-protected bycatch F
- Page 143 and 144: AEBAR 2012: Non-protected bycatch 6
- Page 145 and 146: AEBAR 2012: Non-protected bycatch F
- Page 147 and 148:
AEBAR 2012: Non-protected bycatch F
- Page 149 and 150:
AEBAR 2012: Non-protected bycatch 6
- Page 151 and 152:
AEBAR 2012: Non-protected bycatch F
- Page 153 and 154:
AEBAR 2012: Non-protected bycatch 6
- Page 155 and 156:
AEBAR 2012: Non-protected bycatch 6
- Page 157 and 158:
6.4. Indicators and trends AEBAR 20
- Page 159 and 160:
AEBAR 2012: Non-protected bycatch M
- Page 161 and 162:
AEBAR 2012: Benthic impacts 7. Bent
- Page 163 and 164:
AEBAR 2012: Benthic impacts board a
- Page 165 and 166:
AEBAR 2012: Benthic impacts Figure
- Page 167 and 168:
AEBAR 2012: Benthic impacts Rice (2
- Page 169 and 170:
AEBAR 2012: Benthic impacts megafau
- Page 171 and 172:
AEBAR 2012: Benthic impacts Based p
- Page 173 and 174:
7.3.2. Distribution of Fishing AEBA
- Page 175 and 176:
AEBAR 2012: Benthic impacts Baird e
- Page 177 and 178:
AEBAR 2012: Benthic impacts Figure
- Page 179 and 180:
Area (1000 sq.km) Area (1000 sq.km)
- Page 181 and 182:
AEBAR 2012: Benthic impacts changes
- Page 183 and 184:
7.3.5. Current research AEBAR 2012:
- Page 185 and 186:
7.5. References AEBAR 2012: Benthic
- Page 187 and 188:
AEBAR 2012: Benthic impacts Rowden
- Page 189 and 190:
AEBAR 2012: Ecosystem effects: NZ r
- Page 191 and 192:
AEBAR 2012: Ecosystem effects: NZ r
- Page 193 and 194:
AEBAR 2012: Ecosystem effects: NZ r
- Page 195 and 196:
AEBAR 2012: Ecosystem effects: NZ r
- Page 197 and 198:
AEBAR 2012: Ecosystem effects: NZ r
- Page 199 and 200:
AEBAR 2012: Ecosystem effects: NZ r
- Page 201 and 202:
AEBAR 2012: Ecosystem effects: NZ r
- Page 203 and 204:
AEBAR 2012: Ecosystem effects: NZ r
- Page 205 and 206:
AEBAR 2012: Ecosystem effects: NZ r
- Page 207 and 208:
AEBAR 2012: Ecosystem effects: Habi
- Page 209 and 210:
AEBAR 2012: Ecosystem effects: Habi
- Page 211 and 212:
AEBAR 2012: Ecosystem effects: Habi
- Page 213 and 214:
AEBAR 2012: Ecosystem effects: Habi
- Page 215 and 216:
AEBAR 2012: Ecosystem effects: Habi
- Page 217 and 218:
AEBAR 2012: Ecosystem effects: Land
- Page 219 and 220:
AEBAR 2012: Ecosystem effects: Land
- Page 221 and 222:
AEBAR 2012: Ecosystem effects: Land
- Page 223 and 224:
AEBAR 2012: Ecosystem effects: Land
- Page 225 and 226:
AEBAR 2012: Ecosystem effects: Land
- Page 227 and 228:
AEBAR 2012: Ecosystem effects: Land
- Page 229 and 230:
AEBAR 2012: Marine Biodiversity THE
- Page 231 and 232:
MPI Research (current) NZ Research
- Page 233 and 234:
11.1.2. Defining biodiversity AEBAR
- Page 235 and 236:
AEBAR 2012: Marine Biodiversity Mar
- Page 237 and 238:
AEBAR 2012: Marine Biodiversity New
- Page 239 and 240:
AEBAR 2012: Marine Biodiversity •
- Page 241 and 242:
AEBAR 2012: Marine Biodiversity Fig
- Page 243 and 244:
AEBAR 2012: Marine Biodiversity 11.
- Page 245 and 246:
AEBAR 2012: Marine Biodiversity sta
- Page 247 and 248:
AEBAR 2012: Marine Biodiversity to
- Page 249 and 250:
AEBAR 2012: Marine Biodiversity ACH
- Page 251 and 252:
Progression of research understandi
- Page 253 and 254:
AEBAR 2012: Marine Biodiversity and
- Page 255 and 256:
AEBAR 2012: Marine Biodiversity Sur
- Page 257 and 258:
AEBAR 2012: Marine Biodiversity wor
- Page 259 and 260:
AEBAR 2012: Marine Biodiversity dat
- Page 261 and 262:
AEBAR 2012: Marine Biodiversity Ove
- Page 263 and 264:
AEBAR 2012: Marine Biodiversity and
- Page 265 and 266:
AEBAR 2012: Marine Biodiversity 11.
- Page 267 and 268:
AEBAR 2012: Marine Biodiversity A n
- Page 269 and 270:
AEBAR 2012: Marine Biodiversity aci
- Page 271 and 272:
AEBAR 2012: Marine Biodiversity Pro
- Page 273 and 274:
AEBAR 2012: Marine Biodiversity inv
- Page 275 and 276:
AEBAR 2012: Marine Biodiversity Ros
- Page 277 and 278:
AEBAR 2012: Marine Biodiversity Spe
- Page 279 and 280:
AEBAR 2012: Marine Biodiversity spe
- Page 281 and 282:
AEBAR 2012: Marine Biodiversity maj
- Page 283 and 284:
AEBAR 2012: Marine Biodiversity mod
- Page 285 and 286:
AEBAR 2012: Marine Biodiversity iv)
- Page 287 and 288:
11.5. References AEBAR 2012: Marine
- Page 289 and 290:
AEBAR 2012: Marine Biodiversity D
- Page 291 and 292:
AEBAR 2012: Marine Biodiversity Lea
- Page 293 and 294:
AEBAR 2012: Marine Biodiversity O'D
- Page 295 and 296:
AEBAR 2012: Marine Biodiversity Thr
- Page 297 and 298:
AEBAR 2012: Marine Biodiversity Tar
- Page 299 and 300:
12. Appendices AEBAR 2012: Appendic
- Page 301 and 302:
AEBAR 2012: Appendices 14. To advis
- Page 303 and 304:
AEBAR 2012: Appendices different co
- Page 305 and 306:
AEBAR 2012: Appendices 12.3. Terms
- Page 307 and 308:
AEBAR 2012: Appendices • To devel
- Page 309 and 310:
AEBAR 2012: Appendices step aside f
- Page 311 and 312:
AEBAR 2012: Appendices 12.4. BRAG a
- Page 313 and 314:
AEBAR 2012: Appendices 15. While th
- Page 315 and 316:
AEBAR 2012: Appendices 39. The over
- Page 317 and 318:
AEBAR 2012: Appendices 12.7. OUR ST
- Page 319 and 320:
AEBAR 2012: Appendices 12.8.2. Bios
- Page 321 and 322:
AEBAR 2012: Appendices Policy 23: D
- Page 323 and 324:
AEBAR 2012: Appendices 12.8.7. Nati
- Page 325 and 326:
PROTECTED SPECIES AEBAR 2012: Appen
- Page 327 and 328:
AEBAR 2012: Appendices: Past projec
- Page 329 and 330:
PROTECTED SPECIES continued Project
- Page 331 and 332:
AEBAR 2012: Appendices: Past projec
- Page 333 and 334:
AEBAR 2012: Appendices: Past projec
- Page 335 and 336:
AEBAR 2012: Appendices: Past projec
- Page 337 and 338:
AEBAR 2012: Appendices: Past projec
- Page 339 and 340:
AEBAR 2012: Appendices: Past projec
- Page 341 and 342:
AEBAR 2012: Appendices: Past projec
- Page 343 and 344:
AEBAR 2012: Appendices: Past projec
- Page 345 and 346:
AEBAR 2012: Appendices: Past projec
- Page 347 and 348:
AEBAR 2012: Appendices: Past projec
- Page 349 and 350:
AEBAR 2012: Appendices: Past projec
- Page 351 and 352:
AEBAR 2012: Appendices: Past projec
- Page 353 and 354:
AEBAR 2012: Appendices: Past projec
- Page 355 and 356:
AEBAR 2012: Appendices: Past projec
- Page 357 and 358:
AEBAR 2012: Appendices: Past projec
- Page 359 and 360:
AEBAR 2012: Appendices: Past projec
- Page 361 and 362:
AEBAR 2012: Appendices: Past projec
- Page 363 and 364:
AEBAR 2012: Appendices: Past projec
- Page 365 and 366:
AEBAR 2012: Appendices: Past projec
- Page 367 and 368:
AEBAR 2012: Appendices: Past projec
- Page 369 and 370:
AEBAR 2012: Appendices: Past projec
- Page 371 and 372:
AEBAR 2012: Appendices: Past projec
- Page 373 and 374:
AEBAR 2012: Appendices: Past projec
- Page 375 and 376:
AEBAR 2012: Appendices: Past projec
- Page 377 and 378:
AEBAR 2012: Appendices Baird, S., 2
- Page 379 and 380:
AEBAR 2012: Appendices Clark, M., D
- Page 381 and 382:
AEBAR 2012: Appendices Grotti, M.,
- Page 383 and 384:
AEBAR 2012: Appendices MacDiarmid,
- Page 385 and 386:
AEBAR 2012: Appendices Pinkerton, M
- Page 387 and 388:
AEBAR 2012: Appendices Snelder, T.,
- Page 389:
ISBN: 978-0-478-40503-3 (print) ISB