Aquatic Environment and Biodiversity Annual Review 2012
Aquatic Environment and Biodiversity Annual Review 2012 Aquatic Environment and Biodiversity Annual Review 2012
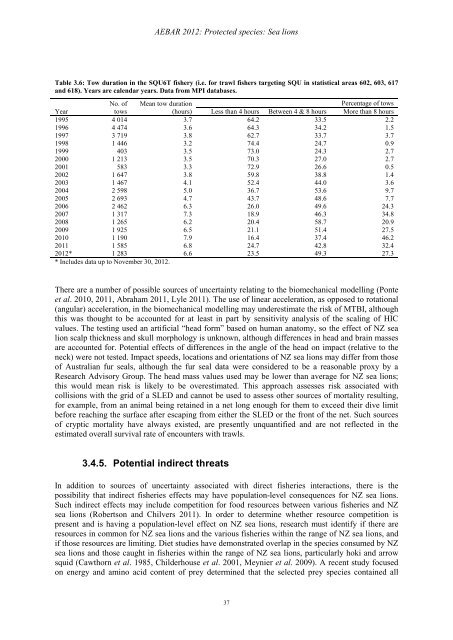
AEBAR 2012: Protected species: Sea lions Table 3.6: Tow duration in the SQU6T fishery (i.e. for trawl fishers targeting SQU in statistical areas 602, 603, 617 and 618). Years are calendar years. Data from MPI databases. No. of Mean tow duration Percentage of tows Year tows (hours) Less than 4 hours Between 4 & 8 hours More than 8 hours 1995 4 014 3.7 64.2 33.5 2.2 1996 4 474 3.6 64.3 34.2 1.5 1997 3 719 3.8 62.7 33.7 3.7 1998 1 446 3.2 74.4 24.7 0.9 1999 403 3.5 73.0 24.3 2.7 2000 1 213 3.5 70.3 27.0 2.7 2001 583 3.3 72.9 26.6 0.5 2002 1 647 3.8 59.8 38.8 1.4 2003 1 467 4.1 52.4 44.0 3.6 2004 2 598 5.0 36.7 53.6 9.7 2005 2 693 4.7 43.7 48.6 7.7 2006 2 462 6.3 26.0 49.6 24.3 2007 1 317 7.3 18.9 46.3 34.8 2008 1 265 6.2 20.4 58.7 20.9 2009 1 925 6.5 21.1 51.4 27.5 2010 1 190 7.9 16.4 37.4 46.2 2011 1 585 6.8 24.7 42.8 32.4 2012* 1 283 6.6 23.5 49.3 27.3 * Includes data up to November 30, 2012. There are a number of possible sources of uncertainty relating to the biomechanical modelling (Ponte et al. 2010, 2011, Abraham 2011, Lyle 2011). The use of linear acceleration, as opposed to rotational (angular) acceleration, in the biomechanical modelling may underestimate the risk of MTBI, although this was thought to be accounted for at least in part by sensitivity analysis of the scaling of HIC values. The testing used an artificial “head form” based on human anatomy, so the effect of NZ sea lion scalp thickness and skull morphology is unknown, although differences in head and brain masses are accounted for. Potential effects of differences in the angle of the head on impact (relative to the neck) were not tested. Impact speeds, locations and orientations of NZ sea lions may differ from those of Australian fur seals, although the fur seal data were considered to be a reasonable proxy by a Research Advisory Group. The head mass values used may be lower than average for NZ sea lions; this would mean risk is likely to be overestimated. This approach assesses risk associated with collisions with the grid of a SLED and cannot be used to assess other sources of mortality resulting, for example, from an animal being retained in a net long enough for them to exceed their dive limit before reaching the surface after escaping from either the SLED or the front of the net. Such sources of cryptic mortality have always existed, are presently unquantified and are not reflected in the estimated overall survival rate of encounters with trawls. 3.4.5. Potential indirect threats In addition to sources of uncertainty associated with direct fisheries interactions, there is the possibility that indirect fisheries effects may have population-level consequences for NZ sea lions. Such indirect effects may include competition for food resources between various fisheries and NZ sea lions (Robertson and Chilvers 2011). In order to determine whether resource competition is present and is having a population-level effect on NZ sea lions, research must identify if there are resources in common for NZ sea lions and the various fisheries within the range of NZ sea lions, and if those resources are limiting. Diet studies have demonstrated overlap in the species consumed by NZ sea lions and those caught in fisheries within the range of NZ sea lions, particularly hoki and arrow squid (Cawthorn et al. 1985, Childerhouse et al. 2001, Meynier et al. 2009). A recent study focused on energy and amino acid content of prey determined that the selected prey species contained all 37
AEBAR 2012: Protected species: Sea lions essential amino acids and were of low to medium energy levels (Meynier 2010). This may indicate that the nutritional content of prey species is not limiting the metabolic activity of NZ sea lions, although vitamin and mineral content were not considered. Meynier (2010) also developed a bioenergetic model and used it to estimate the amount of prey consumed by NZ sea lions at 17 871 tonnes (95% CI 17 738–18 000 t) per year. This is equivalent to ~30% of the tonnage of arrow squid, and ~15% of the hoki harvested annually by the fisheries in the Sub-Antarctic between 2000 and 2006 (Meynier 2010). Comparison of the temporal and spatial distributions of sea lion prey, sea lion foraging and of historical fishing extractions may help to identify the mechanisms whereby resource competition might occur (Bowen 2012). The effects of fishing on sea lion prey species are likely to be complicated by food web interactions and multispecies models may help to assess the extent to which resource competition can impact on sea lion populations, such as those currently being developed by NIWA (Project SA123098). In addition, multispecies models may provide a means for simultaneously assessing multiple drivers of sea lion population change (a review of potential causes is given in Robertson & Chilvers 2011) which may be a more effective approach than focussing on single factor explanations for the recent observed decline in NZ sea lions (Bowen 2012). 38
- Page 1 and 2: Aquatic Environment and Biodiversit
- Page 3 and 4: AEBAR 2012 Acknowledgements In addi
- Page 5 and 6: AEBAR 2012 Contents PREFACE .......
- Page 7 and 8: 1. INTRODUCTION 1.1. Context and pu
- Page 9 and 10: AEBAR 2012: Introduction Table 1.2:
- Page 11 and 12: AEBAR 2012: Introduction • Impact
- Page 13 and 14: AEBAR 2012: Introduction coastal/co
- Page 15 and 16: AEBAR 2012: Research themes THEME R
- Page 17 and 18: AEBAR 2012: Protected species: THEM
- Page 19 and 20: AE&B Review: Protected species: Sea
- Page 21 and 22: AE&B Review: Protected species: Sea
- Page 23 and 24: AE&B Review: Protected species: Sea
- Page 25 and 26: AE&B Review: Protected species: Sea
- Page 27 and 28: AE&B Review: Protected species: Sea
- Page 29 and 30: AE&B Review: Protected species: Sea
- Page 31 and 32: AEBAR 2012: Protected species: Sea
- Page 33 and 34: AEBAR 2012: Protected species: Sea
- Page 35 and 36: AEBAR 2012: Protected species: Sea
- Page 37: AEBAR 2012: Protected species: Sea
- Page 41 and 42: AEBAR 2012: Protected species: Sea
- Page 43 and 44: AEBAR 2012: Protected species: Sea
- Page 45 and 46: AEBAR 2012: Protected species: Fur
- Page 47 and 48: 4.2.2. Distribution AEBAR 2012: Pro
- Page 49 and 50: AEBAR 2012: Protected species: Fur
- Page 51 and 52: AEBAR 2012: Protected species: Fur
- Page 53 and 54: AEBAR 2012: Protected species: Fur
- Page 55 and 56: AEBAR 2012: Protected species: Fur
- Page 57 and 58: a b c d e f AEBAR 2012: Protected s
- Page 59 and 60: 4.4.4. Sources of uncertainty AEBAR
- Page 61 and 62: 4.6. References AEBAR 2012: Protect
- Page 63 and 64: AEBAR 2012: Protected species: Fur
- Page 65 and 66: 5.1. Context AEBAR 2012: Protected
- Page 67 and 68: AEBAR 2012: Protected species: Seab
- Page 69 and 70: 5.2. Biology AEBAR 2012: Protected
- Page 71 and 72: AEBAR 2012: Protected species: Seab
- Page 73 and 74: AEBAR 2012: Protected species: Seab
- Page 75 and 76: AEBAR 2012: Protected species: Seab
- Page 77 and 78: AEBAR 2012: Protected species: Seab
- Page 79 and 80: AEBAR 2012: Protected species: Seab
- Page 81 and 82: AEBAR 2012: Protected species: Seab
- Page 83 and 84: AEBAR 2012: Protected species: Seab
- Page 85 and 86: AEBAR 2012: Protected species: Seab
- Page 87 and 88: AEBAR 2012: Protected species: Seab
AEBAR <strong>2012</strong>: Protected species: Sea lions<br />
Table 3.6: Tow duration in the SQU6T fishery (i.e. for trawl fishers targeting SQU in statistical areas 602, 603, 617<br />
<strong>and</strong> 618). Years are calendar years. Data from MPI databases.<br />
No. of Mean tow duration<br />
Percentage of tows<br />
Year<br />
tows<br />
(hours) Less than 4 hours Between 4 & 8 hours More than 8 hours<br />
1995 4 014 3.7 64.2 33.5 2.2<br />
1996 4 474 3.6 64.3 34.2 1.5<br />
1997 3 719 3.8 62.7 33.7 3.7<br />
1998 1 446 3.2 74.4 24.7 0.9<br />
1999 403 3.5 73.0 24.3 2.7<br />
2000 1 213 3.5 70.3 27.0 2.7<br />
2001 583 3.3 72.9 26.6 0.5<br />
2002 1 647 3.8 59.8 38.8 1.4<br />
2003 1 467 4.1 52.4 44.0 3.6<br />
2004 2 598 5.0 36.7 53.6 9.7<br />
2005 2 693 4.7 43.7 48.6 7.7<br />
2006 2 462 6.3 26.0 49.6 24.3<br />
2007 1 317 7.3 18.9 46.3 34.8<br />
2008 1 265 6.2 20.4 58.7 20.9<br />
2009 1 925 6.5 21.1 51.4 27.5<br />
2010 1 190 7.9 16.4 37.4 46.2<br />
2011 1 585 6.8 24.7 42.8 32.4<br />
<strong>2012</strong>* 1 283 6.6 23.5 49.3 27.3<br />
* Includes data up to November 30, <strong>2012</strong>.<br />
There are a number of possible sources of uncertainty relating to the biomechanical modelling (Ponte<br />
et al. 2010, 2011, Abraham 2011, Lyle 2011). The use of linear acceleration, as opposed to rotational<br />
(angular) acceleration, in the biomechanical modelling may underestimate the risk of MTBI, although<br />
this was thought to be accounted for at least in part by sensitivity analysis of the scaling of HIC<br />
values. The testing used an artificial “head form” based on human anatomy, so the effect of NZ sea<br />
lion scalp thickness <strong>and</strong> skull morphology is unknown, although differences in head <strong>and</strong> brain masses<br />
are accounted for. Potential effects of differences in the angle of the head on impact (relative to the<br />
neck) were not tested. Impact speeds, locations <strong>and</strong> orientations of NZ sea lions may differ from those<br />
of Australian fur seals, although the fur seal data were considered to be a reasonable proxy by a<br />
Research Advisory Group. The head mass values used may be lower than average for NZ sea lions;<br />
this would mean risk is likely to be overestimated. This approach assesses risk associated with<br />
collisions with the grid of a SLED <strong>and</strong> cannot be used to assess other sources of mortality resulting,<br />
for example, from an animal being retained in a net long enough for them to exceed their dive limit<br />
before reaching the surface after escaping from either the SLED or the front of the net. Such sources<br />
of cryptic mortality have always existed, are presently unquantified <strong>and</strong> are not reflected in the<br />
estimated overall survival rate of encounters with trawls.<br />
3.4.5. Potential indirect threats<br />
In addition to sources of uncertainty associated with direct fisheries interactions, there is the<br />
possibility that indirect fisheries effects may have population-level consequences for NZ sea lions.<br />
Such indirect effects may include competition for food resources between various fisheries <strong>and</strong> NZ<br />
sea lions (Robertson <strong>and</strong> Chilvers 2011). In order to determine whether resource competition is<br />
present <strong>and</strong> is having a population-level effect on NZ sea lions, research must identify if there are<br />
resources in common for NZ sea lions <strong>and</strong> the various fisheries within the range of NZ sea lions, <strong>and</strong><br />
if those resources are limiting. Diet studies have demonstrated overlap in the species consumed by NZ<br />
sea lions <strong>and</strong> those caught in fisheries within the range of NZ sea lions, particularly hoki <strong>and</strong> arrow<br />
squid (Cawthorn et al. 1985, Childerhouse et al. 2001, Meynier et al. 2009). A recent study focused<br />
on energy <strong>and</strong> amino acid content of prey determined that the selected prey species contained all<br />
37


