DOCUMENTATION OF LCWE DATA IN GABI 4 - GaBi Software
DOCUMENTATION OF LCWE DATA IN GABI 4 - GaBi Software DOCUMENTATION OF LCWE DATA IN GABI 4 - GaBi Software
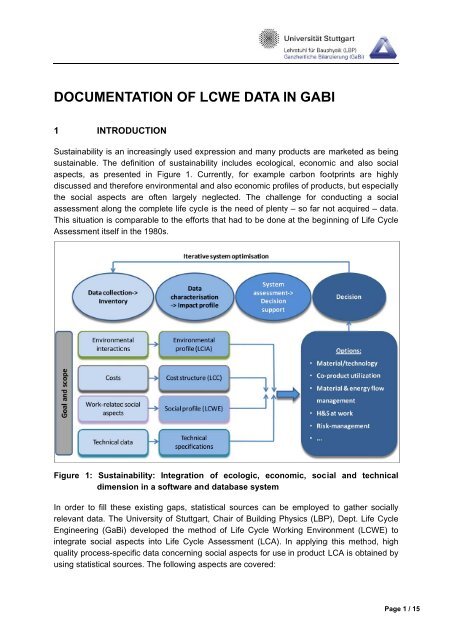
DOCCUMENNTATION OF LLCWE DATA IN GABBI 1 Sustainability is ann increasing gly used expression an nd many pr roducts are marketed as a being sustainaable. The ddefinition of f sustainabbility include es ecologic cal, econommic and als so social aspectss, as preseented in Fi igure 1. Cuurrently, fo or example carbon foootprints are highly discussed and therrefore envir ronmental aand also eco onomic prof files of prodducts, but es specially the soccial aspectss are often n largely nneglected. The challe enge for coonducting a social assessmment along the comple ete life cyclee is the nee ed of plenty y – so far nnot acquired d – data. This situuation is coomparable to t the effortts that had to be done at the beginning of Life Cycle Assessmment itself iin the 1980s s. Figure INTROODUCTION N 1: Sustaiinability: Integration of ecologic, econo omic, soccial and te echnical dimenssion in a so oftware and database e system In order to fill thesse existing gaps, stattistical sour rces can be e employedd to gather socially relevantt data. Thee University of Stuttgarrt, Chair of Building Ph hysics (LBPP), Dept. Life Cycle Engineeering (GaBii) develope ed the methhod of Life Cycle Wor rking Enviroonment (LC CWE) to integratte social asspects into Life Cycle Assessme ent (LCA). In applyingg this method, high quality pprocess-speecific data concerning c social aspe ects for use in product LCA is obta ained by using sttatistical souurces. The following asspects are covered: c Page 1 / 15
- Page 2 and 3: • AAmount andd qualification leve
- Page 4 and 5: Table 1: Social Inddicators ch hose
- Page 6 and 7: 3.4 In the seecond step, the profes
- Page 8 and 9: This steep requires an access s to
- Page 10 and 11: Table 2 Quualification Level GQL A
- Page 12 and 13: 6 The meethod develooped and th he
- Page 14 and 15: APPENNDIX In this chapter thee data
DOCCUMENNTATION<br />
<strong>OF</strong> L<strong>LCWE</strong><br />
<strong>DATA</strong> <strong>IN</strong><br />
GABBI<br />
1<br />
Sustainability<br />
is ann<br />
increasing gly used expression<br />
an nd many pr roducts are marketed as a being<br />
sustainaable.<br />
The ddefinition<br />
of f sustainabbility<br />
include es ecologic cal, econommic<br />
and als so social<br />
aspectss,<br />
as preseented<br />
in Fi igure 1. Cuurrently,<br />
fo or example carbon foootprints<br />
are<br />
highly<br />
discussed<br />
and therrefore<br />
envir ronmental aand<br />
also eco onomic prof files of prodducts,<br />
but es specially<br />
the soccial<br />
aspectss<br />
are often n largely nneglected.<br />
The challe enge for coonducting<br />
a social<br />
assessmment<br />
along the comple ete life cyclee<br />
is the nee ed of plenty y – so far nnot<br />
acquired d – data.<br />
This situuation<br />
is coomparable<br />
to t the effortts<br />
that had to be done at the beginning<br />
of Life<br />
Cycle<br />
Assessmment<br />
itself iin<br />
the 1980s s.<br />
Figure<br />
<strong>IN</strong>TROODUCTION<br />
N<br />
1: Sustaiinability:<br />
Integration<br />
of ecologic,<br />
econo omic, soccial<br />
and te echnical<br />
dimenssion<br />
in a so oftware and<br />
database e system<br />
In order<br />
to fill thesse<br />
existing gaps, stattistical<br />
sour rces can be e employedd<br />
to gather socially<br />
relevantt<br />
data. Thee<br />
University of Stuttgarrt,<br />
Chair of Building Ph hysics (LBPP),<br />
Dept. Life<br />
Cycle<br />
Engineeering<br />
(<strong>GaBi</strong>i)<br />
develope ed the methhod<br />
of Life Cycle Wor rking Enviroonment<br />
(LC CWE) to<br />
integratte<br />
social asspects<br />
into Life Cycle Assessme ent (LCA). In applyingg<br />
this method,<br />
high<br />
quality pprocess-speecific<br />
data concerning c social aspe ects for use in product LCA is obta ained by<br />
using sttatistical<br />
souurces.<br />
The following asspects<br />
are covered: c<br />
Page 1 / 15
• AAmount<br />
andd<br />
qualification<br />
level of wwork<br />
•<br />
The nexxt<br />
paragrapphs<br />
will doc cument the method tha at was applied<br />
to geneerate<br />
social l profiles<br />
for all unit<br />
processees<br />
in the Ga aBi databasse.<br />
2<br />
When thinking<br />
aboout<br />
social effects, e onee<br />
of the firs st questions s to considder<br />
is which h criteria<br />
should be measured<br />
and which w indicaators<br />
should<br />
be emp ployed to ddescribe<br />
the<br />
social<br />
implicattions<br />
of a huuman<br />
action n. For the mmethod<br />
desc cribed here,<br />
the objectiive<br />
was to integrate<br />
social aassessmentt<br />
into the already a exissting<br />
metho odology of Life L Cycle EEngineering<br />
g (LCE).<br />
That immposes<br />
somme<br />
restrictio ons upon tthe<br />
choice of indicators.<br />
Therefoore,<br />
the crit teria the<br />
employeed<br />
indicatorrs<br />
have to comply c with are describ bed in the fo ollowing.<br />
2.1<br />
The soccial<br />
goals shhould<br />
have an actual reelevance<br />
and<br />
a broad internationaal<br />
consensu us. They<br />
should iif<br />
necessaryy<br />
allow for the<br />
inclusionn<br />
of other societal<br />
or cu ultural valuees.<br />
2.2<br />
The indicators<br />
and their ascer rtainment shhould<br />
be im mpartial and revisable.<br />
2.3 CCompleteness<br />
and attributabbility<br />
1. AAll<br />
relevant goals shou uld be addreessed.<br />
2. TThe<br />
indicatoor<br />
should co over the resspective<br />
social<br />
goal co omprehensivvely.<br />
2.4 QQuantitatiiveness<br />
The inddicator<br />
shouuld<br />
compris se a quantittative<br />
meas sure in order<br />
to be agggregated<br />
over o the<br />
whole life<br />
cycle.<br />
2.5<br />
Health and safety.<br />
SELECCTION<br />
CR RITERIA FOOR<br />
<strong>IN</strong>DICA ATORS<br />
Relevancee<br />
and Con nsensus<br />
Impartialitty<br />
3. TThe<br />
indicattor<br />
should be b clearly aand<br />
complet tely attributable<br />
to the respective product<br />
or proceess.<br />
Pertinencce<br />
of indica ator sum<br />
The summ<br />
of the indicator<br />
valu ues of all pprocesses<br />
of o one site, company, industrial sector s or<br />
country should acccurately<br />
des scribe the ovverall<br />
situat tion.<br />
Page 2 / 15
2.6<br />
2.7 CComparabbility<br />
of targets<br />
andd<br />
indicator rs<br />
1. TThe<br />
goals aand<br />
indicato ors should bbe<br />
compara able in an international<br />
context.<br />
2. TThe<br />
goals aand<br />
indicato ors should bbe<br />
compara able between<br />
different iindustries.<br />
2.8<br />
The goaals<br />
and inddicators<br />
sho ould have a direct rela ation to pro oducts or prrocesses<br />
or<br />
should<br />
facilitatee<br />
to be relatted<br />
to them.<br />
2.9 AAverage<br />
vvalidity<br />
The indicators<br />
should<br />
remain valid for aveerage<br />
mode elling, i.e. useful<br />
for LCCWE<br />
databa ases.<br />
2.10 SSystem<br />
booundaries<br />
s, cut-off ccriteria,<br />
re eference sy ystem<br />
They arre<br />
chosen iin<br />
accordan nce with thee<br />
ISO 1404 40 and 140 044 (CEN 22006),<br />
whereas<br />
the<br />
“environnmental<br />
releevance”<br />
is substituted s by the “social<br />
relevanc ce”.<br />
2.11 TTemporal<br />
stability and a time sseries<br />
The callculation<br />
of the social indicators sshould<br />
be repeatable r for other ye years, which h means<br />
that timee<br />
series shoow<br />
the actu ual changess.<br />
2.12<br />
The datta<br />
collectionn<br />
should be viable undeer<br />
justifiable e effort.<br />
3<br />
The nexxt<br />
paragrapphs<br />
will exp plain the L<strong>LCWE</strong><br />
meth hod develop ped at Univversity<br />
of Stuttgart, S<br />
LBP-GaaBi.<br />
3.1<br />
No Overlaap<br />
There sshould<br />
be nno<br />
overlap between thhe<br />
different indicators to avoid doouble<br />
counting<br />
and<br />
thereforre<br />
overvaluaation<br />
of sing gle effects.<br />
Product/PProcess-re<br />
elatednesss<br />
Data availlability/eff<br />
fort<br />
<strong>LCWE</strong>E<br />
METHOD D DESCRIPPTION<br />
Indicatorss<br />
chosen for f integraation<br />
into LCA<br />
Table 1 shows thhe<br />
indicators<br />
chosen to be inte egrated into o the Life<br />
methodology<br />
basinng<br />
on the cr riteria descrribed<br />
above.<br />
Cycle Eng gineering<br />
Page 3 / 15
Table 1:<br />
Social Inddicators<br />
ch hosen<br />
Qualiffied<br />
workingg<br />
time<br />
3.2<br />
Heaalth<br />
and Safeety<br />
In geneeral,<br />
both, a bottom-up p and a topp-down<br />
app proach for data d acquissition<br />
do ex xist. The<br />
bottom-up<br />
approacch<br />
would be<br />
the separate<br />
acquis sition of dat ta for everyy<br />
unit proce ess. The<br />
top-dowwn<br />
approachh<br />
correspon nds to the prorating<br />
of aggregate a data d to single<br />
processe es.<br />
3.2.1<br />
Applyingg<br />
this approach,<br />
social<br />
indicatoors<br />
have to o be collec cted for eaach<br />
process s in the<br />
producttion<br />
chain. HHere<br />
the pr roblem occuurs<br />
that suc ch data is ra arely availaable<br />
at the moment, m<br />
becausee<br />
a meaningful<br />
use and comprrehensive<br />
approach a for f such inndicators<br />
was w non-<br />
existentt<br />
so far. The<br />
initiation n of a conntinuous<br />
as scertainment<br />
of this data<br />
would be cost<br />
intensivve<br />
and time consuming.<br />
Due to this, for the<br />
beginning g the top-down<br />
attemp pt is chosen<br />
for the L<strong>LCWE</strong><br />
meth hodology<br />
developped<br />
at the UUniversity<br />
of o Stuttgart. . Neverthele ess, the da ata acquisitiion<br />
for ever ry single<br />
processs<br />
remains thhe<br />
middle-te erm to long-term<br />
goal because b of its more preecise<br />
result ts.<br />
3.2.2<br />
Group<br />
Data acquuisition<br />
me ethod<br />
Indica ator<br />
General Qualification n level A (GQ QL A)<br />
General Qualification n level B (GQ QL B)<br />
General Qualification n level C (GQ QL C)<br />
General Qualification n level D (GQ QL D)<br />
General Qualification n level E (GQ QL E)<br />
Total worki ing time<br />
Lethal acc cidents<br />
Non-lethal accidents a<br />
Separatee<br />
data acq quisition foor<br />
unit pro ocesses<br />
Prorationn<br />
of aggre egated datta<br />
to singl le process s<br />
Statisticcal<br />
data cooncerning<br />
social s issuees<br />
is available<br />
for most m of thee<br />
highly de eveloped<br />
countriees,<br />
for somee<br />
of them de etailed enouugh<br />
to use them t in the <strong>LCWE</strong> metthodology.<br />
To proraate<br />
this dataa<br />
down to process p leveel,<br />
the follow wing assum mptions are aapplied:<br />
Unit<br />
[sec c]<br />
[sec c]<br />
[sec c]<br />
[sec c]<br />
[sec c]<br />
[sec c]<br />
[case es]<br />
[case es]<br />
1. TThe<br />
social impacts of f a processs<br />
are propo ortional rela ated to the amount of f human<br />
llabour<br />
of the<br />
process.<br />
Page 4 / 15
2. TThe<br />
amounnt<br />
of human n labour of a process is i related to o the effort made to ad dd value<br />
bby<br />
processiing<br />
(which is<br />
equivalennt<br />
to the add ded-value itself).<br />
The aboove<br />
assumpptions<br />
are valid<br />
within tthe<br />
same in ndustry and in the samee<br />
country only.<br />
In contrrast<br />
to the ssituation<br />
for r environmeental<br />
Input-O Output table es, the amoount<br />
of hum man work<br />
is very well correlated<br />
with the<br />
econommic<br />
value ad dded of a process. Thhe<br />
precision<br />
of the<br />
results tthat<br />
can bee<br />
reached is s hence higgh<br />
enough to t be used as a reasonable<br />
starti ing point<br />
for modelling<br />
on the<br />
product le evel.<br />
Figure 2 shows thhe<br />
different t steps of tthe<br />
approac ch developed<br />
at the UUniversity<br />
Stuttgart<br />
aiming aat<br />
the calcuulation<br />
of pro ocess speccific<br />
<strong>LCWE</strong> data. d<br />
Figure 2: Generattion<br />
of proc cess-specific<br />
social information<br />
n<br />
In the foollowing<br />
parragraphs,<br />
th he steps shoown<br />
in Figu ure 2 are de escribed in mmore<br />
detail. .<br />
3.3 GGeneral<br />
qqualificatio<br />
on level off<br />
jobs<br />
In the first step, single pro ofessions aare<br />
allocate ed to different<br />
qualifiication<br />
leve els. The<br />
classificcation<br />
is made<br />
accord ding to the Internation nal Standar rd Classificcation<br />
of Ed ducation<br />
(UNESCCO<br />
<strong>IN</strong>STITUTTE<br />
FOR STATISTICS<br />
19997).<br />
This cla assification was develooped<br />
in 199 97 by the<br />
UNESCCO<br />
in orderr<br />
to classify y and charaacterize<br />
diff ferent school<br />
types annd<br />
school systems. s<br />
The ISCCED<br />
addreesses<br />
the required r quualification<br />
of a job po osition rathher<br />
than the<br />
actual<br />
qualificaation<br />
of the employees s. It classifiees<br />
seven dif fferent quali ification leveels<br />
(Level 0 – Level<br />
6). In thhe<br />
course of the development<br />
oof<br />
this meth hod Level 0, Level 1 and Level 2 were<br />
combineed<br />
to one leevel.<br />
The distinctions<br />
mmade<br />
in thes se levels for<br />
the require red qualifica ation of a<br />
job are not relevant<br />
enough to o be kept in the classification<br />
for th he developeed<br />
method.<br />
Page 5 / 15
3.4<br />
In the seecond<br />
step,<br />
the profes ssion distribution<br />
per industry<br />
is ca alculated viaa<br />
a matrix based b on<br />
the SICC<br />
code (OCCCUPATIONA<br />
AL HEALTH AND SAFE ETY ADM<strong>IN</strong>IS STRATION 1992).<br />
In th he table<br />
elementts<br />
of the maatrix,<br />
the nu umber of poositions<br />
of each e profession<br />
in every<br />
single industry<br />
is<br />
presentted.<br />
From thhis,<br />
the emp ployee profile<br />
of each industry<br />
can n be identifieed.<br />
3.5 SSeconds<br />
oof<br />
labour per VA<br />
The secconds<br />
of labour<br />
per va alue added are derive ed from the U.S. Economic<br />
Census<br />
(U.S.<br />
CENSUSS<br />
BUREAU 11997).<br />
This s statistic ggives<br />
inform mation abou ut the nummber<br />
of employees,<br />
averagee<br />
number off<br />
production n workers, pproduction<br />
workers' ho ours, cost of contract work w and<br />
the valuue<br />
added. TThe<br />
value ad dded given in the statis stic is calcu ulated from tthe<br />
income through<br />
the salee<br />
of the prooduced<br />
goo ods less thee<br />
expenditu ures for aux xiliary mateerials,<br />
interm mediates<br />
and/or resources and the expenditurees<br />
for sub bcontracting g. The value<br />
added for the<br />
calculattion<br />
of the sseconds<br />
of labour per VA – relation<br />
is theref fore correctted<br />
by this number.<br />
The woorking<br />
time is only qu uoted for wworkers,<br />
no ot for appo ointees. It iis<br />
assumed d in the<br />
methodology,<br />
that an appointe ee works the<br />
same hou urs per year r as a workeer.<br />
3.6 QQualificattional<br />
labo our profilee<br />
of the ind dustry<br />
In the next<br />
step, thhe<br />
total work king time peer<br />
value add ded can be broken dowwn<br />
with the e support<br />
of the taables<br />
and mmatrixes<br />
ge enerated in the steps before. b The result is a qualificatio on profile<br />
of each industry per<br />
value ad dded generrated.<br />
This qualification n profile shhows<br />
the am mount of<br />
workingg<br />
time in eacch<br />
of the fiv ve qualificattion<br />
levels to t generate one Euro vvalue<br />
added d. These<br />
values, same as thhe<br />
total wor rking to gennerate<br />
one Euro E value added, varry<br />
between different<br />
industriees.<br />
3.7<br />
For thee<br />
calculationn<br />
of non-fa atal injuriess,<br />
two kinds s of data are a availabble<br />
(UNITED STATES<br />
DEPARTTMENT<br />
<strong>OF</strong> LAABOR<br />
1999) : The injuriees<br />
listed as injury rates s, as well ass<br />
absolute numbers n<br />
of injuries<br />
per inddustry.<br />
The injury ratees<br />
present the numbe ers of injurries<br />
per pe erformed<br />
workingg<br />
time. Thesse<br />
rates are e corresponnding<br />
with the<br />
risk of th he employeees<br />
to get in njured in<br />
the speecific<br />
industrry.<br />
The abs solute ratess<br />
give the to otal number<br />
of injuriess<br />
without ta aking the<br />
total number<br />
of emmployees<br />
in the specificc<br />
industry in nto account t. In the conntext<br />
of the e method<br />
describeed<br />
here, thhe<br />
non – fa atal injuriess<br />
have to be b related to t the totall<br />
working time<br />
and<br />
respectively<br />
to the<br />
value ad dded in orrder<br />
to cla assify them m to the ddifferent<br />
pro ocesses.<br />
Therefoore,<br />
the ratee<br />
of non-fata al injuries iss<br />
used.<br />
3.8<br />
Employeee<br />
profile of f the indusstry<br />
Rate of noon-fatal<br />
injuries<br />
perr<br />
VA<br />
Rate of fatal<br />
injuries<br />
per VA<br />
The fataal<br />
injuries aare<br />
also collected<br />
and ppublished<br />
by b the U. S. Departmennt<br />
of Labor (UNITED<br />
STATES DEPARTMEENT<br />
<strong>OF</strong> LAB BOR 1999). For the fa atal injuries s only absoolute<br />
numb bers are<br />
Page 6 / 15
available.<br />
A statemment<br />
concer rning the rissk<br />
of fatal in njuries in the<br />
different industries therefore<br />
is not poossible.<br />
In orderr<br />
to relate thhe<br />
fatal injuries<br />
to the ttotal<br />
workin ng time and hence to thhe<br />
value added,<br />
the<br />
workingg<br />
time for eevery<br />
industry<br />
has to be available.<br />
For the reasons exxplained<br />
in the last<br />
paragraaph,<br />
values should no ot be drawnn<br />
from diff ferent sourc ces. So vaalues<br />
from different<br />
tables, generated based on th he source mmentioned<br />
above on non-fatal n annd<br />
fatal injuries,<br />
are<br />
used: TThe<br />
total woorking<br />
time for each inddustry<br />
is de erived from the non-fattal<br />
injuries rate and<br />
from thee<br />
absolute nnumber<br />
of non-fatal n injuries.<br />
3.9 SSocial<br />
Proofile<br />
of the e industryy<br />
The soccial<br />
profile ffor<br />
each ind dustry includdes<br />
the wo orking time in different qualification<br />
levels,<br />
the non-fatal<br />
and the<br />
fatal inju uries, each related to one o Euro of f value addeed<br />
generate ed in the<br />
respective<br />
industryy.<br />
3.10<br />
Prices forr<br />
<strong>GaBi</strong>-Flows<br />
For relaating<br />
the social<br />
data to o LCA proceess<br />
data, th he value added<br />
of eachh<br />
LCA proc cess has<br />
to be iddentified.<br />
Thhis<br />
is done by calculating<br />
the delta<br />
of prices<br />
between the output and the<br />
input floows<br />
of eachh<br />
process. Therefore, for all mate erials, intermediate<br />
prooducts<br />
or products, p<br />
as well as variouss<br />
energy fl luxes, whicch<br />
go in an nd out of processes, p prices hav ve to be<br />
determined<br />
and asssigned.<br />
Sin nce the prooduct<br />
prices s depend on n a dynamicc<br />
market, th he same<br />
referencce<br />
period ffor<br />
both the e prices annd<br />
for the identificatio on of the vvalue<br />
added d of the<br />
industriees<br />
should be selected d. In this ccase<br />
the calculation<br />
is<br />
made wiith<br />
annual average<br />
values oof<br />
the same<br />
reference e period. A foreign trade<br />
statistic is used to provide co onsistent<br />
price daata<br />
(U.S. CEENSUS<br />
BURE EAU 2002A, U.S. CENSU US BUREAU 2002B). 2<br />
For moost<br />
of the fflows,<br />
price es can be calculated regarding quantities and total value v of<br />
exported<br />
commodiities.<br />
In cas ses where tthis<br />
is not possible, p pr rices are esstimated<br />
pe er expert<br />
judgemeent<br />
using tthe<br />
assump ptions that tthere<br />
are no n negative e value adddeds<br />
and th hat price<br />
ranges can be esttimated<br />
on the basis oof<br />
the lowe er price of a preliminaary<br />
product and the<br />
higher pprice<br />
of a suubsequent<br />
product. p This<br />
kind of es stimation ha as an impacct<br />
on the res sult if<br />
1. tthe<br />
according<br />
flow pas sses from onne<br />
industry into anothe er industry aand<br />
2. tthe<br />
social pprofile<br />
of bot th industriess<br />
varies.<br />
3.11 VValue<br />
Addded<br />
of GaB Bi-Processses<br />
In orderr<br />
to calculatte<br />
the value added of a single proc cess, the to otal value off<br />
the incoming<br />
flows<br />
is subtrracted<br />
fromm<br />
the total value of thhe<br />
outgoing g flows of a process. The total value is<br />
calculatted<br />
by multiplying<br />
the amount of the flow wi ith its price and then bby<br />
summing g up the<br />
values oof<br />
all flows.<br />
Page 7 / 15
This steep<br />
requires an access s to a life cyycle<br />
model on a unit process levvel<br />
of the particular p<br />
productt.<br />
Furthermore,<br />
as consistent<br />
ass<br />
possible data d are necessary<br />
foor<br />
all econ nomically<br />
relevantt<br />
material and<br />
energy flows, f whichh<br />
flow in and<br />
out the un nit processees.<br />
3.12<br />
To geneerate<br />
a LCWWE<br />
process s data set, each individ dual proces ss must be classified to<br />
one of<br />
the variious<br />
industrries.<br />
Subse equently, thee<br />
social pro ofile of the industry is multiplied with the<br />
value addded<br />
of the individual process. p In doing this, the reference<br />
to one EEuro<br />
of valu ue added<br />
is lost aand<br />
the induustry<br />
profile is scaled on<br />
a unit pro ocess.<br />
3.13<br />
In the ccourse<br />
of the<br />
balance calculation, c the values of unit processes<br />
are e summarize ed along<br />
the valuue<br />
chain according<br />
to o the summmarization<br />
of o LCA inventory<br />
dataa<br />
and can thus be<br />
evaluateed<br />
equally.<br />
3.14<br />
Process DData<br />
Sets<br />
Evaluationn<br />
Processinng<br />
of Data(-sets)<br />
in the Softw ware<br />
In the cclassic<br />
LCAA<br />
the particu ular processses<br />
are sc caled accord ding to theiir<br />
connectio ons over<br />
input annd<br />
output floows.<br />
Beside es, the elemmentary<br />
flow ws, which exceed e the system bou undaries<br />
and thus<br />
cause an impact, are e scaled witth<br />
the factor<br />
of their or riginal proceess.<br />
In this way, w the<br />
contribuution<br />
of eaach<br />
individu ual processs<br />
to the fu unction of the t total sy system is weighted w<br />
correctlyy.<br />
By includding<br />
social data into LLCA<br />
datase ets, the sam me weightinng<br />
principle es apply,<br />
thus leaading<br />
to correct<br />
results that can bee<br />
evaluated in accordance<br />
to LCAA<br />
results.<br />
3.15 GGeneratioon<br />
of Indic cators andd<br />
Evaluatio on<br />
In classsic<br />
LCA methodolo ogy, the summation n is follo owed by classificatio on and<br />
characteerization.<br />
Inn<br />
contrast, the indicattors<br />
for the social aspects<br />
are chhosen<br />
the way w that<br />
they eaach<br />
build iits<br />
own cla ass. The sstep<br />
of the e classification<br />
as relation<br />
of particular p<br />
contribuutors<br />
to a ppotential<br />
kin nd of impacct<br />
therefore is superflu uous. Withinn<br />
each clas ss, there<br />
are no contributorrs<br />
that hav ve to be vvalued<br />
differently.<br />
Com mpared to a consider ration of<br />
ecologiccal<br />
values, a characte erization thherefore<br />
is not necess sary. This can be seen<br />
as a<br />
fundamental<br />
differrence<br />
between<br />
ecologgical<br />
LCA and social aspects cconsideratio<br />
on within<br />
LCA; in case of the<br />
ecologica al LCA the interim bala ance of mass<br />
and eneergy<br />
flows is s drown.<br />
These flows are then misca alculated inn<br />
respect to t their va arious envirronmental<br />
impacts.<br />
Howeveer,<br />
when eexamining<br />
social asppects,<br />
the indicators are seleccted<br />
so th hat they<br />
correspond<br />
directlyy<br />
with a soc cial aspect. The evalua ation of indic cators howeever<br />
can be e done in<br />
analogyy<br />
to the claassic<br />
LCA-m method: Eaach<br />
indicato or receives s its own immpact<br />
category<br />
(or<br />
rather for each impact ca ategory a described indicator is to be found) an nd each<br />
characteerization<br />
factor<br />
gets the<br />
value onee.<br />
Page 8 / 15
3.16 VValidity<br />
As explained<br />
abovve,<br />
a respec ctive validitty<br />
of a resu ult depends on the seleection<br />
of th he social<br />
indicatoors,<br />
on their<br />
ability to o be summmed<br />
up, on an ability to be weiighted<br />
that can be<br />
comparred<br />
with maaterial<br />
and energy e flowws<br />
and, of course, c on the availabbility<br />
of data a for the<br />
unit proocesses.<br />
AAll<br />
these co onditions aare<br />
given fo or the wor rking time values in different<br />
qualificaation<br />
levels,<br />
the non-fa atal and fataal<br />
injuries presented<br />
ab bove. If there<br />
is a poss sibility to<br />
relate thhem<br />
to the basic value e working timme,<br />
also for r other socia al factors too<br />
be develo oped, the<br />
criteriass<br />
of summinng<br />
up and weighting w caan<br />
be accomplished.<br />
The T availabbility<br />
of data a is to be<br />
proved separatelyy,<br />
and a ge eneral validdity<br />
or rath her reasona ableness sshould<br />
be used u as<br />
primary selection ccriterion.<br />
4<br />
To showw<br />
the potenntials<br />
and va alidate the feasibility of o the asses ssment metthod,<br />
it was s applied<br />
in severral<br />
projects so far. There<br />
are princcipally<br />
two possibilities<br />
p to use the <strong>LCWE</strong> method:<br />
1.<br />
Use of thee<br />
comprehe ensive andd<br />
consistent<br />
backgrou und databaase.<br />
The da ata was<br />
ccalculated<br />
aas<br />
explained<br />
above.<br />
2. GGathering<br />
oof<br />
own, project<br />
and proocess<br />
specific<br />
data. The<br />
data can be inserted d directly<br />
in the <strong>LCWE</strong><br />
tab, when n creating a new proce ess.<br />
For the example, ddata<br />
from the<br />
backgrouund<br />
databas se is used in n order to sshow<br />
the application<br />
of the mmethod.<br />
Twoo<br />
different kinds k of plasstic<br />
are com mpared.<br />
4.1<br />
Concernning<br />
the soccial<br />
implicat tions, the wwhole<br />
production<br />
phase e of the diffeerent<br />
alternatives<br />
is<br />
assesseed<br />
including<br />
all upstr ream valuee<br />
chains (p production and supplly<br />
of all precursor p<br />
substannces,<br />
operatting<br />
supplie es, auxiliary materials, energies etc.).<br />
In the ffollowing,<br />
thhe<br />
results for the asssessment<br />
of o two route es will be sshown<br />
exemplarily:<br />
Polyethylene<br />
fibress<br />
production n and the prroduction<br />
of f Polyethyle ene terephthhalate<br />
(PET T) fibres.<br />
4.2<br />
EXAMMPLE<br />
Descriptioon<br />
of the assessed a system<br />
Results<br />
Table 2 shows thee<br />
working time t distribbution<br />
into the t general<br />
qualificatioon<br />
levels ( GQL) in<br />
secondss,<br />
that is reelated<br />
to jobs<br />
with thee<br />
respective e qualificatio on level ass<br />
requireme ent. Jobs<br />
with a GGQL<br />
A do hhave<br />
the hig ghest qualiffication<br />
as prerequisite<br />
p e, Jobs withh<br />
a GQL E relate to<br />
work wwith<br />
low qualification<br />
requirement<br />
r ts. The tot tal working time, beinng<br />
the sum m of the<br />
numberrs<br />
listed under<br />
the diff ferent GQLLs,<br />
is the su um of all human<br />
labouur<br />
employe ed in the<br />
producttion<br />
of 1 kg plastic.<br />
As Table<br />
2 and FFigure<br />
3 pre esent, the plastic PET T production<br />
requires considerab bly more<br />
human labour thaan<br />
PE prod duction. This<br />
is cause ed by the more compplex<br />
manuf facturing<br />
processs<br />
for PET than<br />
for PE.<br />
Page 9 / 15
Table 2<br />
Quualification<br />
Level<br />
GQL A [s]<br />
GQL B [s]<br />
GQL C [ss]<br />
GQL D [ss]<br />
GQL E [s]<br />
Tottal<br />
working tiime<br />
[s]<br />
Lethhal<br />
accidents [cases]<br />
Non-leethal<br />
accidennts<br />
[cases]<br />
The graaphics<br />
also show that in i industriall<br />
process ch hains rather<br />
few jobs wwithout<br />
qua alification<br />
and witth<br />
a very high qualifi ication cann<br />
be found.<br />
Industry requires a minimum level of<br />
qualificaation<br />
and only<br />
few peo ople with a very high qualification<br />
q n on the maanagement<br />
level. A<br />
higher sshare<br />
of wworkers<br />
with hout qualificcation<br />
is ra ather found in the serrvice<br />
sector<br />
(sales,<br />
direct seervices<br />
etc. ).<br />
250,0<br />
200,0<br />
150,0<br />
100,0<br />
50,0<br />
Qualified working time in [s] 2: Working<br />
0,0<br />
time and accidents a fo for the prod duction of 1 kg PE annd<br />
1 kg PET T<br />
Quualifiedd<br />
Workking<br />
Timme<br />
PE<br />
Figure 3: Qualifiedd<br />
working time for thhe<br />
production<br />
of 1 kg PE and PEET<br />
PE<br />
1.4<br />
11.0<br />
14.4<br />
15.1<br />
7.6<br />
49.5<br />
3,23E-07<br />
5,45E-10<br />
Figure 4 and Figurre<br />
5 show the<br />
amount of non-leth hal and letha al accidentss<br />
for the pro oduction<br />
of 1 kg PE or PET. . The numb bers are verry<br />
small as they are related<br />
to thee<br />
functional unit of 1<br />
kilogramm.<br />
PET<br />
PET<br />
9.9<br />
61.1<br />
72.5<br />
59.4<br />
27.2<br />
230.1<br />
11,06E-06<br />
11,03E-09<br />
GQL<br />
E [s]<br />
GQL<br />
D [s]<br />
GQL<br />
C [s]<br />
GQL<br />
B [s]<br />
GQL<br />
A [s]<br />
Page 10 / 15
Non‐lethal accidents [cases]<br />
Figure 4: Non-lethhal<br />
acciden nts caused by the pro oduction of f 1 kg PE aand<br />
PET<br />
The geeneral<br />
results<br />
are sim milar to quaalified<br />
work king time: There are significant tly more<br />
accidennts<br />
when producing<br />
a kg of PETT<br />
than PE.<br />
Again thi is is due to the more e labour<br />
intensivve<br />
and moree<br />
complex manufacturi<br />
m ng process of PET.<br />
Lethal accidents [cases]<br />
1,20E‐09<br />
1,00E‐09<br />
8,00E‐10<br />
6,00E‐10<br />
4,00E‐10<br />
2,00E‐10<br />
0,00E+00<br />
1,20E‐066<br />
1,00E‐066<br />
8,00E‐077<br />
6,00E‐077<br />
4,00E‐077<br />
2,00E‐077<br />
0,00E+000<br />
NNon‐lethhal<br />
accidents<br />
PE<br />
Lethal<br />
accideents<br />
PE<br />
PPET<br />
Figure 5: Lethal aaccidents<br />
caused c by tthe<br />
produc ction of 1 kg g PE and PPET<br />
PET<br />
Page 11 / 15
6<br />
The meethod<br />
develooped<br />
and th he respectivve<br />
backgrou und database<br />
is a firstt,<br />
promising attempt<br />
to addreess<br />
the social<br />
pillar of sustainabilit<br />
s ty in the sco ope of the well w establisshed<br />
metho od of Life<br />
Cycle AAssessmennt<br />
and Life e Cycle Enngineering.<br />
Social eff fects that would hav ve been<br />
neglecteed<br />
by an LLCA<br />
can be e included aand<br />
show remarkable<br />
results. Prooblem<br />
shifting<br />
from<br />
the environmental<br />
realm to the e social fieldd<br />
can be av voided.<br />
The exaample<br />
showws,<br />
that the results of thhe<br />
<strong>LCWE</strong> method m can be used simmilarly<br />
to the e results<br />
of an LLCA:<br />
Informmation<br />
is pr resented onn<br />
a unit pro ocess level<br />
and also project or process<br />
specific informatioon<br />
can be inserted. IInformation<br />
about soc cial issues is summa able and<br />
scalablee<br />
as the LCCA<br />
user is fa amiliar with from the environment<br />
e tal LCA. In the compre ehensive<br />
backgroound<br />
databaase,<br />
informa ation for alll<br />
unit processes<br />
regard ding the quaalified<br />
work king time<br />
and lethhal<br />
and noon-lethal<br />
ac ccidents is available. Additionally y, informatiion<br />
concern ning the<br />
following<br />
indicatorss<br />
can be ins serted in thee<br />
<strong>GaBi</strong> softw ware in the <strong>LCWE</strong> tab by the user r:<br />
AActual<br />
wommen<br />
employment<br />
CChild<br />
labour<br />
<br />
<br />
<br />
<br />
<br />
<br />
Discussioon<br />
and out tlook<br />
Holistic and forwaard-looking<br />
decisions must be based b on a broad baasis<br />
of all relevant<br />
information.<br />
The soocial<br />
dimens sion of humman<br />
actions clearly mus st be considdered.<br />
Discrimination<br />
in job ac ccess<br />
Forced laboour<br />
Hazardous child labour<br />
No collectivve<br />
bargainin ng<br />
No right to oorganise<br />
Unequal remuneration<br />
All inforrmation<br />
has to be in relation<br />
to working<br />
time in<br />
seconds.<br />
Howeveer,<br />
it has to be stated that due too<br />
the above mentioned restrictionss<br />
for indicators,<br />
not<br />
all relevvant<br />
social information can be acccounted<br />
for r by this me ethod, so faar.<br />
Additional<br />
social<br />
effects hhave<br />
to be considered in future deevelopment<br />
t of the meth hodology.<br />
As all <strong>LCWE</strong><br />
data currently pr resent in thee<br />
<strong>GaBi</strong> data abase is de erived from US statistic cs, it can<br />
be regaarded<br />
valid for all coun ntries holdinng<br />
similar economic e and a socio-ecconomic<br />
co onditions<br />
than thee<br />
US.<br />
Using thhe<br />
<strong>LCWE</strong> ddata<br />
for decision<br />
makinng,<br />
it has to be conside ered that ass<br />
the data is s derived<br />
from staatistics,<br />
it dooes<br />
not rep present exacct<br />
site spec cific situations<br />
and shoould<br />
only be e used to<br />
comparre<br />
for exammple<br />
genera al product options. For<br />
the com mparison off<br />
social aspects<br />
of<br />
different<br />
suppliers, company-s specific dataa<br />
has to be used.<br />
To conclude<br />
with, , the social<br />
database can be used<br />
as a hotspot daatabase<br />
in order to<br />
examinee<br />
the main contributor rs to social profiles along<br />
the pro ocess chainns<br />
of produ ucts. For<br />
these mmain<br />
contributors,<br />
site specific s soccial<br />
data can n be gathere ed in a secoond<br />
step in order to<br />
get a more<br />
precisee<br />
picture of the t social immplications<br />
of a produc ct.<br />
Page 12 / 15
6<br />
LITERRATURE<br />
NATIONNAL<br />
CROSSSWALK<br />
SERVICCE<br />
CENTERR<br />
(1997) )<br />
OCCUPPATIONAL<br />
HEALTHH<br />
ANDD<br />
SAFETYY<br />
ADM<strong>IN</strong>I-<br />
STRATIION<br />
(1992)<br />
UNESCCO<br />
<strong>IN</strong>STITUUTE<br />
FORR<br />
STATISSTICS<br />
(1997) )<br />
UNITEDD<br />
STATESS<br />
DEPARRTMENT<br />
LABORR<br />
(1999)<br />
<strong>OF</strong>F<br />
NATIONA AL CROSSWAALK<br />
SERVIC CE CENTER (1997): NOOICC<br />
Maste er Crosswallk,<br />
Version 4.3. National<br />
Crosswa alk Service Center. C<br />
Online: http://www.x<br />
h xwalkcenter.org/index.<br />
php.<br />
OCCUPA ATIONAL HEAALTH<br />
AND SA AFETY ADM<strong>IN</strong> NISTRATION (1992): Sta andard<br />
Industria al Classificaation<br />
(SIC) system. s United<br />
States Department<br />
of Labor;<br />
Occupat tional Health<br />
and Safet ty Administr ration.<br />
Online: http://www.o<br />
h osha.gov/pl ls/imis/sic_m manual.htmml;<br />
http://ww ww.census.ggov/epcd/w<br />
www/sic.html.<br />
UNESCO O <strong>IN</strong>STITUTEE<br />
FOR STATISTICS<br />
(1997 7): Internatio ional Standa ard<br />
Classific cation of Edducation<br />
ISC CED 1997. UNESCO U Innstitute<br />
for Statistics. S<br />
Online:<br />
http://ww ww.unesco.oorg/education/informat<br />
tion/nfsunessco/doc/isced_1997.httm<br />
; http://w www.uis.uneesco.org/ev_<br />
_en.php?ID D=7433_2011&ID2=DO_<br />
_TOPIC.<br />
UNITED STATES S DEPPARTMENT<br />
<strong>OF</strong> O LABOR (1999):<br />
US Fa Fatal and No on-Fatal<br />
Injuries and a illnessees.<br />
United States S Depa artment of LLabor<br />
and Bureau B of<br />
Labor St tatistics.<br />
Online:<br />
http://ww ww.bls.gov/iiif/oshwc/os<br />
sh/os/ostb06 641.pdf; htttp://www.bls<br />
s.gov/iif/oshhw<br />
c/osh/os s/ostb0642.ppdf.<br />
U.S. CENSUSS<br />
U.S. CEN NSUS BUREAAU<br />
(1997): 1997 1 Econo omic Censuus.<br />
General Summary<br />
BUREAAU<br />
(1997) Mining and a Manufaacturing,<br />
Ind dustry Summ mary Constr truction. U.S S. Census<br />
Bureau. Online: httpp://www.cen<br />
nsus.gov/pr rod/ec97/977m31s-gs.pdf;<br />
http://ww ww.census.ggov/prod/ec<br />
c97/97c23-is.pdf;<br />
http://ww ww.census.ggov/prod/ec<br />
c97/97n21-g gs.pdf.<br />
U.S. IMPORTS<br />
<strong>OF</strong>F<br />
MERCHHANDISE<br />
U.S. IMP PORTS <strong>OF</strong> MEERCHANDISE<br />
E (2002A): History H DVDD-ROM.<br />
U.S S. Census<br />
Bureau.<br />
(2002AA)<br />
Online: http://www.c<br />
h census.gov v/foreign-<br />
trade/ref ference/prooducts/catalo<br />
og/imphisto ory.html.<br />
U.S. EEXPORTS<br />
<strong>OF</strong>F<br />
MERCHHANDISE<br />
U.S. EXP PORTS <strong>OF</strong> MMERCHANDIS<br />
SE 2002B: History H DVD-ROM.<br />
U.S.<br />
Census<br />
Bureau.<br />
(2002BB)<br />
Online: http://www.c<br />
h census.gov v/foreign-<br />
trade/ref ference/prooducts/catalo<br />
og/exphistoory.html. Page 13 / 15
APPENNDIX<br />
In this chapter thee<br />
data sources<br />
are aaddressed,<br />
which serv ve as a bassis<br />
for the method<br />
developped<br />
at the UUniversity<br />
Stuttgart. S Thhe<br />
particular<br />
statistics should s meeet<br />
various criteria c to<br />
be usedd<br />
in this metthod.<br />
These e criteria aree<br />
as well sp pecified in th he followingg<br />
paragraph hs.<br />
U.S. Ecconomic<br />
CCensus<br />
The “U. .S. Econommic<br />
Census” ” (http://wwww.census.g<br />
gov/) is a comprehenssive<br />
data co ollection,<br />
that givees<br />
a detaileed<br />
review of o the American<br />
economy.<br />
It is fulfilled<br />
by thee<br />
“Census Bureau”, B<br />
the Ameerican<br />
demmographic<br />
ag gency. Thee<br />
results are e gathered every five yyears,<br />
whereas<br />
the<br />
collecteed<br />
basic datta<br />
include to o a large exxtent<br />
the sta atistics of all a US comppanies.<br />
At th he same<br />
time, thhe<br />
data collection<br />
for the t agriculture<br />
and the e authoritie es takes plaace<br />
in para allel. The<br />
data coollection<br />
is based on a clear struuctured<br />
cla assification of the whoole<br />
econom my into a<br />
strictly hierarchicaal<br />
system of o industriaal<br />
sectors and subse ectors – the<br />
so calle ed North<br />
Americaan<br />
Industry Classification<br />
Standarrd<br />
(NAICS). . It is import tant that noot<br />
the companies<br />
as<br />
a wholee,<br />
but the single<br />
locatio on of these ccompanies<br />
as minimum m unit are listed.<br />
It allo ows both<br />
a betterr<br />
spatial ressolution<br />
and d a better reesolution<br />
ac ccording to activity, as a company y can be<br />
active inn<br />
different ssectors.<br />
The<br />
NAICS cclassifies<br />
1179<br />
various industries, 1070 of which w are<br />
coveredd<br />
in the U.S.<br />
Economic c Census.<br />
The datta<br />
is provideed<br />
for free and a is suppposed<br />
to ser rve several purposes. The following<br />
fields<br />
of appliccation<br />
exemmplify<br />
this:<br />
CCompaniess<br />
can comp pare their ssales<br />
figure es with thos se for theirr<br />
whole ind dustry. It<br />
aallows<br />
themm<br />
to calcula ate their maarket<br />
share in order to check theirr<br />
performan nce or to<br />
ddefine<br />
new targets.<br />
CCompaniess<br />
can also compare thheir<br />
business<br />
ratio wit th average numbers from f the<br />
U.S. Census<br />
as a benchmark b<br />
to assess s their per rformance with those e of the<br />
cconcurrent<br />
organizatio ons.<br />
CCompaniess<br />
which sell their goodss<br />
or service es to other companies c can find in the U.S.<br />
CCensus<br />
neew<br />
target industriess.<br />
Besides,<br />
producer rs learn ffrom<br />
the material<br />
cconsumptioon<br />
statistics more abouut<br />
the indust tries that co onsume theiir<br />
products.<br />
CCompaniess<br />
can use the data tto<br />
determin ne their sa ales areas, to place a target<br />
aadvertisemeent<br />
and to find f the besst<br />
locations for f their new w establishmments.<br />
<br />
Important kkey<br />
figures about a the eeconomic<br />
de evelopment t as monthlyy<br />
retail sale es or the<br />
ggross<br />
domeestic<br />
produc ct are baseed<br />
on the da ata of the U.S. U Censuss.<br />
Associati ions and<br />
tthe<br />
press analyze th he data to identify ec conomic circumstancees<br />
and to forecast<br />
ddevelopments.<br />
TThe<br />
legislattive<br />
body uses<br />
the datta<br />
for the preparation<br />
p and assesssment<br />
of ne ew laws.<br />
TThe<br />
state and local authorities a monitor the e Census data d to undderstand<br />
economic<br />
bbasics<br />
and to decide whether w theey<br />
should se ettle new businesses<br />
oor<br />
keep the e already<br />
eexisting<br />
onees.<br />
Page 14 / 15
CConsultantss<br />
and researchers<br />
maake<br />
use of the data to o analyze tthe<br />
change es in the<br />
industries’ sstructure<br />
or r in the spattial<br />
resolutio on. These data d are nott<br />
explicitly collected c<br />
ffor<br />
the usee<br />
in the me ethod. Neveertheless<br />
th hey work well w for the developed method<br />
bbecause<br />
of f the level of o detail andd<br />
their basis s on the clear<br />
hierarchical<br />
structure<br />
of the<br />
industries’ cclassificatio<br />
on.<br />
In the 22002<br />
U.S. EEconomic<br />
Census C the data for th he year 200 02 are colleected.<br />
In De ecember<br />
2002 data<br />
collecttion<br />
questio onnaires wwere<br />
sent to<br />
more than<br />
5 millioon<br />
compan nies, the<br />
deadlinee<br />
was set oon<br />
the 12th h of February<br />
2003. Du ue to adapt tion of the ddata<br />
entry forms to<br />
the individual<br />
industries,<br />
there e exist noww<br />
more than n 600 differ rent versionns.<br />
Only some<br />
very<br />
small coompanies<br />
ddo<br />
not rece eive questioonnaires.<br />
Fo or them the e data alreaady<br />
available<br />
at the<br />
federal authorities’ ’ are used. These autthorities<br />
pro ovide basic c data as loocation<br />
and d kind of<br />
businesss,<br />
sales figures,<br />
wage es and salarries,<br />
numbe er of employ yees and foorm<br />
of organization.<br />
The U.SS.<br />
Econommic<br />
Census is enshrineed<br />
in title 13 of the United U Stattes<br />
Code. The law<br />
commitss<br />
organizatiions<br />
to send d back the ffilled<br />
forms and awards<br />
penalties in case companies<br />
omit this.<br />
Besides, , the law sw wears the CCensus<br />
Bu ureau to sec crecy. No ddata<br />
are pu ublished,<br />
which disclose<br />
the identity or activity a of an<br />
individual l or a company.<br />
Standaard<br />
Industtry<br />
Classif fication (SSIC)<br />
The Staandard<br />
Induustry<br />
Classi ification (SIC)-Code<br />
is s a four-digit<br />
numerical<br />
code assigned<br />
by<br />
the U.SS.<br />
governmeent<br />
to the business<br />
esttablishment<br />
ts to identify y the primaary<br />
business s activity<br />
of the eestablishmeent<br />
(http://w www.osha.gov/pls/imis/<br />
/sic_manual.html).<br />
Thee<br />
classificat tion was<br />
developped<br />
to facilitate<br />
the collection,<br />
ppresentation<br />
n and analy ysis of datta;<br />
and to promote<br />
uniformity<br />
and comparability<br />
in the preesentation<br />
of statistic cal data coollected<br />
by various<br />
agenciees<br />
of the federal go overnment, state age encies and d private oorganization<br />
ns. The<br />
classificcation<br />
coveers<br />
all eco onomic acttivities:<br />
agr riculture, fo orestry, fisshing,<br />
hunting<br />
and<br />
trappingg;<br />
mining; cconstruction<br />
n; manufactturing;<br />
trans sportation; communicaations,<br />
elec ctric, gas<br />
and sanitary<br />
services;<br />
whole esale tradee;<br />
retail trade;<br />
finance e; insurance ce and real<br />
estate;<br />
servicess;<br />
and publiic<br />
administr ration.<br />
The Burreau<br />
of Labbour<br />
Statistics<br />
is a unit of U.S. Department<br />
of f Labour. Thhis<br />
unit is in n charge<br />
for the ffact-finding<br />
for the fede eral governnment<br />
in the e wide field of occupattional<br />
econo omy and<br />
occupattional<br />
statistics.<br />
US Impport/Export<br />
History<br />
The data<br />
about “UU.S.<br />
Expor rts of Mercchandise”<br />
(U U.S. CENSU US BUREAU 2002B) an nd “U.S.<br />
Imports of Merchaandise”<br />
(U.S S. CENSUS BUREAU 20 002A) are gathered g annd<br />
provided d by the<br />
U.S. Ceensus<br />
Bureau.<br />
The export<br />
statistiics<br />
contain data about t the value and the qu uantity of<br />
9.000 vvarious<br />
goods,<br />
which were w exporrted<br />
from th he USA; the e import staatistics<br />
prov vide this<br />
information<br />
for 177.000<br />
differ rent importeed<br />
goods. Depending g on the uunit<br />
the quantity<br />
is<br />
specifieed<br />
in, an aveerage<br />
price of the goodds<br />
can be calculated c based b on thhese<br />
data. The T data<br />
are alsoo<br />
available ffor<br />
the past t years. For r the method d described d here, dataa<br />
from the re eference<br />
year 2002<br />
was useed.<br />
Page 15 / 15


