Link - Federal Transit Administration - U.S. Department of ...
Link - Federal Transit Administration - U.S. Department of ...
Link - Federal Transit Administration - U.S. Department of ...

Create successful ePaper yourself
Turn your PDF publications into a flip-book with our unique Google optimized e-Paper software.
Characteristics <strong>of</strong><br />
BUS RAPID TRANSIT<br />
for Decision-Making<br />
Photo courtesy <strong>of</strong> Los Angeles<br />
County Metropolitan Transportation Authority<br />
United States<br />
<strong>Department</strong> <strong>of</strong> Transportation<br />
Project No. FTA-FL-26-7109.2009.1<br />
February 2009<br />
<strong>Federal</strong> <strong>Transit</strong> <strong>Administration</strong><br />
Office <strong>of</strong> Research, Demonstration and Innovation
Characteristics <strong>of</strong><br />
Bus Rapid TRansiT<br />
for decision-Making<br />
FTa project Manager: Helen M. Tann<br />
Transportation Program Specialist<br />
<strong>Federal</strong> <strong>Transit</strong> <strong>Administration</strong><br />
Office <strong>of</strong> Research, Demonstration and Innovation<br />
1200 New Jersey Ave, SE<br />
Washington, DC 20590<br />
principal investigator: dennis Hinebaugh<br />
Director, National BRT Institute<br />
Center for Urban Transportation Research<br />
University <strong>of</strong> South Florida (USF)<br />
4202 E. Fowler Ave, CUT100<br />
Tampa, FL 33620<br />
funded by the <strong>Federal</strong> <strong>Transit</strong> <strong>Administration</strong><br />
© February 2009 <strong>Federal</strong> <strong>Transit</strong> <strong>Administration</strong><br />
U.S. <strong>Department</strong> <strong>of</strong> Transportation
NOTICE<br />
This document is disseminated under the sponsorship <strong>of</strong> the United<br />
States <strong>Department</strong> <strong>of</strong> Transportation in the interest <strong>of</strong> information<br />
exchange. The United States government assumes no liability for its<br />
contents or use there<strong>of</strong>. The United States Government does not<br />
endorse products or manufacturers. Trade or manufacturers’ names<br />
appear herein solely because they are considered essential to the<br />
objective <strong>of</strong> this report.
REPORT DOCUMENTATION PAGE Form<br />
Approved<br />
OMB No.<br />
0704-0188<br />
Public reporting burden for this collection <strong>of</strong> information is estimated to average 1 hour per response, including the time for reviewing<br />
instructions, searching existing data sources, gathering and maintaining the data needed, and completing and reviewing the collection<br />
<strong>of</strong> information. Send comments regarding this burden estimate or any other aspect <strong>of</strong> this collection <strong>of</strong> information, including<br />
suggestions for reducing this burden, to Washington Headquarters Services, Directorate for Information Operations and Reports,<br />
1215 Jefferson Davis Highway, Suite 1204, Arlington, VA 22202-4302, and to the Office <strong>of</strong> Management and Budget, Paperwork<br />
Reduction Project (0704-0188), Washington, DC 20503.<br />
3. REPORT TYPE AND<br />
DATES COVERED<br />
1. AGENCY USE ONLY (Leave blank) 2. REPORT DATE<br />
February 2009<br />
5. FUNDING<br />
NUMBERS<br />
4. TITLE AND SUBTITLE<br />
Characteristics <strong>of</strong> Bus Rapid <strong>Transit</strong> for Decision-Making (CBRT)<br />
6. AUTHOR(S)<br />
Roderick B. Diaz (editor) Dennis Hinebaugh, National Bus Rapid <strong>Transit</strong> Institute (Director)<br />
FL-26-7109<br />
8. PERFORMING<br />
ORGANIZATION<br />
REPORT NUMBER<br />
7. PERFORMING ORGANIZATION NAME(S) AND ADDRESS(ES)<br />
FL-26-7109-05<br />
National Bus Rapid <strong>Transit</strong> Institute<br />
Center for Urban Transportation Research<br />
University <strong>of</strong> South Florida<br />
4202 E. Fowler Avenue, CUT100<br />
Tampa, FL 33620<br />
10. SPONSORING/<br />
MONITORING<br />
AGENCY REPORT<br />
NUMBER<br />
FTA-FL-26-7109.2009.1<br />
9. SPONSORING/MONITORING AGENCY NAME(S) AND ADDRESS(ES)<br />
U.S. <strong>Department</strong> <strong>of</strong> Transportation<br />
<strong>Federal</strong> <strong>Transit</strong> <strong>Administration</strong><br />
Office <strong>of</strong> Research, Demonstration and Innovation (TRI)<br />
1200 New Jersey Avenue, SE<br />
Washington, DC 20590<br />
11. SUPPLEMENTARY NOTES<br />
12b. DISTRIBUTION<br />
CODE<br />
12a. DISTRIBUTION/AVAILABILITY STATEMENT<br />
Available From: National Bus Rapid <strong>Transit</strong> Institute, Center for Urban Transportation Research,<br />
University <strong>of</strong> South Florida, 4202 E. Fowler Avenue, CUT100, Tampa, FL 33620<br />
Also available through NBRTI web site: https://www.nbrti.org<br />
13. ABSTRACT<br />
The Characteristics <strong>of</strong> Bus Rapid <strong>Transit</strong> for Decision-Making (CBRT) report was prepared to provide transportation planners and<br />
decision makers with basic information and data to support the development and evaluation <strong>of</strong> bus rapid transit concepts as one <strong>of</strong><br />
many options during alternatives analyses and subsequent project planning. This report provides information on BRT systems in a<br />
single, easy to use reference tool for transportation planners in selecting from the large array <strong>of</strong> BRT elements and integrating them<br />
into comprehensive systems.<br />
The CBRT report explores BRT through a progression <strong>of</strong> three different perspectives. First, seven major elements <strong>of</strong> BRT are presented<br />
along with their respective features and attributes. Second, the BRT elements are related to attributes <strong>of</strong> system performance. Finally,<br />
the benefits <strong>of</strong> BRT systems are discussed. This order <strong>of</strong> the discussion suggests the relationship between BRT elements, system<br />
performance and system benefits. BRT systems are constructed by choosing and integrating among BRT elements. The integration<br />
<strong>of</strong> elements improves system performance and improves the experience for customers. Improvements to system performance (in<br />
combination with features <strong>of</strong> BRT elements) generate benefits to transit agencies and communities.<br />
15. NUMBER OF<br />
PAGES<br />
410<br />
14. SUBJECT TERMS<br />
16. PRICE CODE<br />
Bus Rapid <strong>Transit</strong>, BRT, <strong>Transit</strong>, Public Transportation, Characteristics<br />
20. LIMITATION<br />
OF ABSTRACT<br />
19. SECURITY CLASSIFICATION<br />
OF ABSTRACT<br />
Unclassified<br />
18. SECURITY CLASSIFICATION<br />
OF THIS PAGE<br />
Unclassified<br />
17. SECURITY CLASSIFICATION<br />
OF REPORT<br />
Unclassified<br />
NSN 7540-01-280-5500 Standard Form 298 (Rev. 2-89)<br />
iii
This information document was updated and revised for the United States <strong>Department</strong><br />
<strong>of</strong> Transportation’s (U.S. DOT) <strong>Federal</strong> <strong>Transit</strong> <strong>Administration</strong> (FTA)<br />
by a consortium <strong>of</strong> organizations led by the National Bus Rapid <strong>Transit</strong> Institute<br />
(NBRTI) at the Center for Urban Transportation Research, University <strong>of</strong> South<br />
Florida. The consortium includes Booz Allen Hamilton, Inc., STV Incorporated,<br />
TranSystems, Washington Group International, and Weststart-CALSTART.<br />
Roderick Diaz was the principal editor <strong>of</strong> this document, with editorial contributions<br />
from Lisa Callaghan Jerram, Georges Darido, and Paul Schimek. Contributing<br />
authors include Jennifer Flynn, Cheryl Thole, Alasdair Cain, and Victoria Perk<br />
<strong>of</strong> the National Bus Rapid <strong>Transit</strong> Institute; Richard Laver and Travis Dunn <strong>of</strong><br />
Booz Allen Hamilton; Pilar Rodriguez and Rosemary Gerty <strong>of</strong> TranSystems; Paul<br />
Schimek <strong>of</strong> Washington Group International; and Greg Moscoe and Lawrence<br />
Wnuk <strong>of</strong> Weststart-CALSTART. Additional data on international BRT systems<br />
was collected by Graham Currie <strong>of</strong> Monash University and Daniel Haufschild<br />
<strong>of</strong> MRC McLean Hazel. Other contributors include Wendy Teague, report design;<br />
Patricia Ball, copy editing; and Pamella Clark and Lisa Ravenscr<strong>of</strong>t, process<br />
coordinators. FTA Project Manager was Helen Tann, Transportation Program<br />
Specialist.<br />
We are grateful to Renee Haider <strong>of</strong> the National <strong>Transit</strong> Institute and to the<br />
NBRTI Advisory Board for external review and feedback:<br />
auTHOR aCKnOWLEdGMEnTs<br />
Joseph Calabrese, Greater Cleveland (Ohio) Regional <strong>Transit</strong> Authority<br />
Rex Gephart, Los Angeles County Metropolitan Transportation Authority<br />
Alan Danaher, Parsons Brinckerh<strong>of</strong>f<br />
Cliff Henke, Parsons Brinckerh<strong>of</strong>f<br />
Peter Koonce, ITS Consultant<br />
Herb Levinson, Private Consultant<br />
Ted Orosz, New York City <strong>Transit</strong><br />
Lurae Stuart, APTA<br />
Stefano Viggiano, Lane <strong>Transit</strong> District, Eugene, Oregon<br />
Bill Vincent, Breakthrough Technologies<br />
David Wohlwill, Port Authority <strong>of</strong> Allegheny County, Pennsylvania<br />
Nigel Wilson, MIT<br />
Sam Zimmerman, World Bank<br />
v
TaBLE OF COnTEnTs<br />
EXECUTIVE SUMMARY ...............................................................................................................E-1<br />
CHAPTER 1: INTRODUCTION—NEED AND PURPOSE ........................................1-1<br />
What is BRT? ....................................................................................................................................1-1<br />
BRT in the Transportation Planning Process ..................................................................1-2<br />
Intended Use <strong>of</strong> the CBRT Report ...................................................................................... 1-3<br />
Structure and Content <strong>of</strong> CBRT ...........................................................................................1-4<br />
CHAPTER 2: MAJOR ELEMENTS OF BRT ........................................................................2-1<br />
Running Way .................................................................................................................................. 2-3<br />
Stations ............................................................................................................................................ 2-19<br />
Vehicles ...........................................................................................................................................2-42<br />
Fare Collection ............................................................................................................................2-61<br />
Intelligent Transportation Systems (ITS) .......................................................................2-80<br />
Service and Operating Plans ..............................................................................................2-120<br />
Branding Elements ..................................................................................................................2-134<br />
Integration <strong>of</strong> BRT Elements into BRT Systems .......................................................2-139<br />
CHAPTER 3: BRT ELEMENTS AND SYSTEM PERFORMANCE .......................... 3-1<br />
Travel Time ...................................................................................................................................... 3-2<br />
Reliability ....................................................................................................................................... 3-43<br />
Image and Identity ....................................................................................................................3-73<br />
Passenger Safety and Security ...........................................................................................3-113<br />
System Capacity ...................................................................................................................... 3-148<br />
Accessibility ............................................................................................................................... 3-168<br />
CHAPTER 4: BRT SYSTEM BENEFITS ................................................................................ 4-1<br />
Higher Ridership ........................................................................................................................... 4-2<br />
Capital Cost Effectiveness ......................................................................................................4-20<br />
Operating Cost Efficiency ......................................................................................................4-26<br />
<strong>Transit</strong>-Supportive Land Development ........................................................................ 4-30<br />
Environmental Quality .......................................................................................................... 4-36<br />
CHAPTER 5: CONCLUSIONS AND SUMMARY .......................................................... 5-1<br />
Summary <strong>of</strong> BRT Experience .................................................................................................. 5-1<br />
Sustaining the CBRT Report ...................................................................................................5-6<br />
Closing Remarks ............................................................................................................................ 5-7<br />
APPENDIX A: REFERENCES .....................................................................................................A-1<br />
APPENDIX B: GLOSSARY OF BRT TERMS .....................................................................B-1<br />
vii
LisT OF EXHiBiTs<br />
No. Page<br />
1-1 <strong>Transit</strong> Investment Planning and Project Development Process ...........1-2<br />
1-2 Characteristics <strong>of</strong> BRT in Project Planning and Development ............... 1-3<br />
1-3 Characteristics <strong>of</strong> Bus Rapid <strong>Transit</strong> for Decision-Making<br />
(CBRT) Report ..................................................................................................................1-4<br />
2-1A Summary <strong>of</strong> Effects <strong>of</strong> Running Way Elements on System<br />
Performance .................................................................................................................... 2-10<br />
2-1B Summary <strong>of</strong> Effects <strong>of</strong> Running Way Elements on System<br />
Benefits .............................................................................................................................. 2-12<br />
2-2A Experience with BRT Running Ways On-Street-Only Projects ............. 2-14<br />
2-2B Experience with BRT Running Ways Projects with Off-Street<br />
Components ................................................................................................................... 2-16<br />
2-3A Summary <strong>of</strong> Effects <strong>of</strong> Station Elements on System Performance ....2-29<br />
2-3B Summary <strong>of</strong> Effects <strong>of</strong> Station Elements on System Benefits ...............2-31<br />
2-4 Experience with BRT Stations ................................................................................2-35<br />
2-5A Summary <strong>of</strong> Effects <strong>of</strong> Vehicle Elements on System<br />
Performance ..................................................................................................................2-50<br />
2-5B Summary <strong>of</strong> Effects <strong>of</strong> Vehicle Elements on System Benefits .............2-51<br />
2-6 Experience with BRT Vehicles................................................................................2-55<br />
2-7 Estimated Operating & Maintenance Costs for Fare Collection<br />
System Elements ...........................................................................................................2-62<br />
2-8 Summary <strong>of</strong> Effects <strong>of</strong> Fare Collection Elements on System<br />
Performance ....................................................................................................................2-69<br />
2-9 Summary <strong>of</strong> Effects <strong>of</strong> Fare Collection Elements on System<br />
Benefits ..............................................................................................................................2-70<br />
2-10 Experience with BRT Fare Collection ................................................................ 2-74<br />
2-11 Summary <strong>of</strong> Effects <strong>of</strong> ITS Elements on System Performance .............2-96<br />
2-12 Summary <strong>of</strong> Effects <strong>of</strong> ITS Elements on System Benefits ........................2-98<br />
2-13 BRT Communications Schematic ..................................................................... 2-100<br />
2-14 TCIP Standards ............................................................................................................2-103<br />
2-15 Experience with BRT and ITS ...............................................................................2-105<br />
viii<br />
2-16 Demonstrated Performance for <strong>Transit</strong> Vehicle Prioritization<br />
Systems ............................................................................................................................2-116<br />
2-17 Demonstrated Performance for Service Planning and Bus<br />
Operations Management Systems ....................................................................2-116<br />
2-18 Demonstrated Performance for Passenger Information Systems ....2-117<br />
2-19 Demonstrated Performance for Safety and Security Systems ...........2-117<br />
2-20 Demonstrated Performance for <strong>Transit</strong> Vehicle Prioritization<br />
Systems ............................................................................................................................2-118<br />
2-21 Demonstrated Benefits for Service Planning and Bus Operations<br />
Management Systems ..............................................................................................2-118<br />
2-22 Demonstrated Benefits for Passenger Information Systems ..............2-119<br />
2-23 Demonstrated Benefits for Safety and Security Systems ......................2-119<br />
2-24 BRT Service Types and Typical Service Spans ..............................................2-120<br />
2-25 Summary <strong>of</strong> Effects <strong>of</strong> Service and Operations Plan Elements on<br />
System Performance .................................................................................................2-125<br />
2-26 Summary <strong>of</strong> Effects <strong>of</strong> Service and Operations Plan Elements on<br />
System Benefits ...........................................................................................................2-126<br />
2-27 Experience with BRT Service Plans ...................................................................2-128<br />
2-28 Summary <strong>of</strong> Effects <strong>of</strong> Station Elements on System Performance ......2-137<br />
2-29 Summary <strong>of</strong> Effects <strong>of</strong> Station Elements on System Benefits .............2-138<br />
3-1 Estimated Average Bus Speeds on Busways or Exclusive Freeway<br />
HOV Lanes .........................................................................................................................3-4<br />
3-2 Estimated Average Bus Speeds on Dedicated Arterial Street<br />
Bus Lanes ...........................................................................................................................3-5<br />
3-3 Estimated Average Bus Speeds in General Purpose Traffic Lanes ........3-5<br />
3-4 Busway and Freeway Bus Lane Speeds as a Function <strong>of</strong> Station<br />
Spacing .................................................................................................................................3-5<br />
3-5 BRT Elements by System and Travel Time ........................................................3-9<br />
3-6 Passenger Service Times by Floor Type ............................................................3-24<br />
3-7 Multiple Channel Passenger Service Times per Total Passenger<br />
with a High Floor Bus .................................................................................................3-24
3-8 Bus Passenger Service Times ..................................................................................3-25<br />
3-9 BRT Elements by System and Station Dwell Time......................................3-27<br />
3-10 BRT Elements by System and Wait Time and Transfer Time............... 3-36<br />
3-11 BRT Elements by System and Running Time Reliability .........................3-46<br />
3-12 BRT Elements by System and Station Dwell Time Reliability .............. 3-56<br />
3-13 BRT Elements by System and Service Reliability.........................................3-66<br />
3-14 BRT Elements by System and Brand Identity ............................................... 3-81<br />
3-15 BRT Elements by System and Contextual Design ...................................... 3-99<br />
3-16 Vehicle Accident Rates versus Shares <strong>of</strong> Exclusive ROW ......................3-114<br />
3-17 BRT Elements by System and Safety ................................................................3-117<br />
3-18 Security Incidents per Million Passenger Trips .......................................... 3-132<br />
3-19 BRT Elements by System and Security ........................................................... 3-134<br />
3-20 Different Aspects <strong>of</strong> Capacity ............................................................................ 3-148<br />
3-21 Temporal Demand for Rail <strong>Transit</strong> Service .................................................. 3-150<br />
3-22 Relationship <strong>of</strong> BRT Elements to Aspects <strong>of</strong> Person Capacity .......... 3-150<br />
3-23 Typical U.S. and Canadian BRT Vehicle Dimensions and<br />
Capacities ...................................................................................................................... 3-152<br />
3-24 Maximum Observed Peak-Hour Bus Flows, Capacities, and<br />
Passenger Flows at Peak Load Points on <strong>Transit</strong>ways ............................ 3-152<br />
3-25 BRT Elements by System and Person Capacity ..........................................3-155<br />
3-26 BRT Elements by System and Accessibility .................................................. 3-173<br />
4-1 BRT Elements by System and Ridership .............................................................4-6<br />
4-2 Per Dollar Invested, Annualized Costs Are Lower for BRT<br />
Investments with Higher Concentrations <strong>of</strong> Long-Lived Assets .........4-21<br />
4-3 Cost Effectiveness Analysis Example for Corridor with Limited<br />
Ridership Potential ......................................................................................................4-21<br />
4-4 Cost Effectiveness Analysis Example for Corridor with Limited<br />
Ridership Potential ......................................................................................................4-22<br />
4-5 Capital Cost Drivers and Sources <strong>of</strong> Cost Variability—Low-Level<br />
BRT Investment .............................................................................................................4-22<br />
4-6 Capital Cost Drivers and Sources <strong>of</strong> Cost Variability—High-Level<br />
BRT Investment .............................................................................................................4-23<br />
4-7 Capital Costs for Selected Recently-Implemented U.S. BRT<br />
Systems .............................................................................................................................4-25<br />
4-8 Decisions Impacting Operating Cost Efficiency ..........................................4-27<br />
4-9 Labor Staffing Requirements for Alternative BRT Investments ..........4-28<br />
4-10 Operating Efficiencies in the Wilshire—Whittier Metro Rapid<br />
Corridor .............................................................................................................................4-29<br />
4-11 Performance Measures for Pittsburgh West Busway Operating<br />
Cost Efficiency ...............................................................................................................4-29<br />
4-12 Performance Measures for Pittsburgh East Busway Operating<br />
Efficiency ...........................................................................................................................4-29<br />
4-13 Operating Cost per Service Unit by Type <strong>of</strong> Route for Pittsburgh<br />
East Busway .................................................................................................................... 4-30<br />
4-14 Comparison <strong>of</strong> MBTA Silver Line Washington Street Operating<br />
Costs ................................................................................................................................... 4-30<br />
4-15 MBTA Silver Line Waterfront Operating Costs, Early Results ............. 4-30<br />
4-16 Emissions and Fuel Economy Improvement Mechanisms .....................4-37<br />
4-17 U.S. EPA Emission Standards for Diesel Bus Engines ................................ 4-38<br />
4-18 New York City <strong>Transit</strong> 40-ft Bus Emissions Comparison ....................... 4-38<br />
4-19 King County <strong>Transit</strong> 60-Ft Bus Emissions Comparison, on<br />
OCTA cycle ..................................................................................................................... 4-38<br />
4-20 Emissions and Fuel Economy Estimates for 40-ft Buses,<br />
Year 2007 and Beyond .............................................................................................. 4-38<br />
4-21 Emissions Impact <strong>of</strong> Metrobus Vehicles vs. Trips Replaced .................. 4-42<br />
4-22 Percentage <strong>of</strong> BRT Riders Shifted from Private Motor Vehicles ........ 4-43<br />
4-23 Summary <strong>of</strong> U.S. BRT System Vehicle Propulsion Technologies ........4-44<br />
ix
EXECUTIVE SUMMARY<br />
Executive Summary<br />
The updated “Characteristics <strong>of</strong> Bus Rapid <strong>Transit</strong> for Decision-Making” (2009) (CBRT) report was prepared to provide transportation planners and decision makers with<br />
basic information and data to support the development and evaluation <strong>of</strong> bus rapid transit concepts as one <strong>of</strong> many options during alternatives analyses and subsequent<br />
project planning. This report provides information on BRT systems in a single, easy-to-use reference tool for transportation planners in selecting from the large array <strong>of</strong><br />
BRT elements and integrating them into comprehensive systems.<br />
The CBRT report explores BRT through a progression <strong>of</strong> three different perspectives. First, seven major elements <strong>of</strong> BRT are presented along with their respective features<br />
and attributes. Second, the BRT elements are related to attributes <strong>of</strong> system performance. Finally, the benefits <strong>of</strong> BRT systems are discussed. This order <strong>of</strong> the discussion<br />
suggests the relationship between BRT elements, system performance, and system benefits. BRT systems are constructed by choosing and integrating among BRT<br />
elements. The integration <strong>of</strong> elements improves system performance and the experience for customers. Improvements to system performance (in combination with<br />
features <strong>of</strong> BRT elements) generate benefits to transit agencies and communities.<br />
Experience with BRT Elements<br />
Experience in the United States suggests that implementation <strong>of</strong> more complex<br />
BRT system elements is just beginning. Implementation <strong>of</strong> running ways, stations,<br />
and vehicles suggest a wide variety <strong>of</strong> applications. Some <strong>of</strong> the more<br />
quickly implemented projects demonstrated the least amount <strong>of</strong> investment in<br />
BRT system elements.<br />
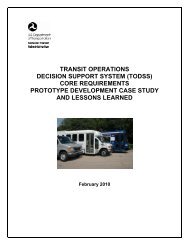
Major Elements <strong>of</strong> BRT<br />
Major Running Elements Ways <strong>of</strong> BRT<br />
Stations<br />
<br />
Running Ways<br />
Vehicles<br />
Fare<br />
Stations Collection<br />
ITS<br />
Vehicles<br />
<br />
Service<br />
Fare and Collection Operations Plan<br />
Branding Elements<br />
ITS<br />
System Performance<br />
System Performance<br />
Travel Time Savings<br />
Travel Time Savings<br />
Reliability<br />
Identity<br />
Reliability and Image<br />
Safety<br />
Identity and and Security Image<br />
<br />
Capacity<br />
Safety & Security<br />
Accessibility<br />
Capacity<br />
System Benefits<br />
Ridership<br />
Ridership<br />
Ridership<br />
Capital <strong>Transit</strong><br />
Cost Effectiveness<br />
-Supportive<br />
<br />
Land Land Development<br />
Development<br />
Operating Efficiency<br />
<strong>Transit</strong>-Supportive <br />
Environmental Environmental Land Quality<br />
Quality<br />
<br />
Development Capital Cost Effectiveness Cost Effectiveness<br />
<br />
Environmental<br />
<br />
Efficiency Operating Efficiency Quality Efficiency<br />
3<br />
r<br />
e<br />
t<br />
p<br />
a<br />
h<br />
C<br />
4<br />
r<br />
e<br />
t<br />
p<br />
a<br />
h<br />
C<br />
E-1
Executive Summary<br />
BRT ElEmEnT ExpERiEncE in ThE UniTEd STaTES inTERnaTional ExpERiEncE<br />
Running Way<br />
• BRT systems in the U.S. have incorporated all types <strong>of</strong> running ways • Use <strong>of</strong> exclusive running ways, both arterial bus lanes in transitways is<br />
‒ Running Way Segregation<br />
‒ Running Way Marking<br />
‒ Guidance (Lateral)<br />
—mixed flow arterial (Los Angeles, Oakland, Kansas City), mixed flow<br />
freeway (Phoenix), dedicated arterial lanes (Boston, Orlando), at-grade<br />
transitways (Miami, Eugene), and fully grade-separated surface transitways<br />
(Pittsburgh), and subways (Seattle, Boston).<br />
•<br />
widespread across new BRT applications in Europe, Asia, Australia, and<br />
the Americas.<br />
Use <strong>of</strong> running way guidance is evident with mostly mechanical guidance<br />
applications (Adelaide, Amsterdam, Leeds), although optical guidance<br />
• Mechanical guidance features have been incorporated into a few BRT applications ( Rouen) are functional.<br />
systems (Eugene, Cleveland). The only application <strong>of</strong> non-mechanical<br />
running way guidance was the precision docking for Las Vegas MAX with<br />
optical guidance, which has since been deactivated.<br />
• Physical barriers such as curbs and raised markers are evident in some<br />
especially-congested corridors in Latin America and Asia. Colored lane<br />
markings are used in a few cases (e.g., Auckland, London, Nagoya, Sydney,<br />
• Use <strong>of</strong> running way markings to differentiate BRT running ways and<br />
articulated brand identity was rare.<br />
Utrecht)<br />
Stations<br />
‒ Station Type<br />
‒ Platform Height<br />
‒ Platform Layout<br />
‒ Passing Capability<br />
‒ Station Access<br />
Vehicles<br />
‒ Vehicle Configuration<br />
‒ Aesthetic Enhancement<br />
‒ Passenger Circulation Enhancement<br />
‒ Propulsion<br />
E-2<br />
• The level <strong>of</strong> station design correlates strongly with the level <strong>of</strong> running<br />
way segregation. Systems with designated lanes on arterials or segregated<br />
transitways had stations with higher sophistication and more amenities.<br />
• The use <strong>of</strong> level boarding has grown in the U.S. following the example <strong>of</strong><br />
Las Vegas MAX, new applications <strong>of</strong> raised curbs in Eugene, and near-level<br />
boarding in Cleveland. No uniform approach to the vehicle platform<br />
interface has yet emerged.<br />
• Real-time schedule and/or vehicle arrival information and communications<br />
infrastructure such as public telephones and emergency telephones<br />
are starting to be installed in systems (Los Angeles Orange Line).<br />
• Early BRT systems used standard vehicles that were <strong>of</strong>ten identical to the<br />
rest <strong>of</strong> a particular agency’s fleet. Systems such as Los Angeles’ Metro<br />
Rapid, AC <strong>Transit</strong>’s Rapid Bus, and Boston’s Silver Line, are phasing in<br />
operation <strong>of</strong> 60-ft articulated buses as demand grows.<br />
• The use <strong>of</strong> vehicle configurations or aesthetic enhancements to differentiate<br />
BRT is gaining momentum. In addition to differentiated liveries<br />
and logos, agencies are procuring stylized and specialized BRT vehicles.<br />
Las Vegas represents the first use <strong>of</strong> a specialized BRT vehicle in the U.S.<br />
Other systems (Cleveland, Eugene, Los Angeles Orange Line, Oakland) are<br />
implementing stylized vehicles in both articulated and standard sizes.<br />
• As the use <strong>of</strong> exclusive running ways is more common among international<br />
BRT systems, more elaborate station types are used.<br />
• Enclosed stations are common among Latin American systems.<br />
• Use <strong>of</strong> stylized vehicles is widespread in European and Latin American<br />
BRT systems, although conventional bus configurations are still the norm<br />
worldwide.<br />
• A few systems use bi-articulated buses on trunk lines in Latin America<br />
(Curitiba, Bogotá) and Europe (Eindhoven, Utrecht, and Caen).<br />
• High-floor vehicles are common among Latin American systems. Lowfloor<br />
vehicles are becoming more widely applied elsewhere throughout<br />
the world.
Executive Summary<br />
BRT ElEmEnT ExpERiEncE in ThE UniTEd STaTES inTERnaTional ExpERiEncE<br />
Fare collection<br />
• Alternate fare collection processes are rare in the U.S. Use <strong>of</strong> pro<strong>of</strong>- • Pre-paid fare collection is the norm among BRT systems in Latin<br />
‒ Fare Collection Process<br />
‒ Fare Transaction Media<br />
‒ Fare Structure<br />
<strong>of</strong>-payment is growing (Las Vegas MAX system, Los Angeles Orange<br />
Line, Cleveland Health Line). Variations on pro<strong>of</strong>-<strong>of</strong>-payment such<br />
as free downtown zones and pay-on-exit are used in Orlando,<br />
Seattle, and Pittsburgh<br />
•<br />
America (Bogotá, Curitiba, Quito, Guayaquil) and new systems in<br />
China (Beijing, Hangzhou).<br />
Some pro<strong>of</strong>-<strong>of</strong>-payment examples are evident in Europe.<br />
• Electronic fare collection using magnetic-stripe cards or smart<br />
cards is slowly being incorporated into BRT systems, but as part <strong>of</strong><br />
agency-wide implementation rather than BRT-specific implementa-<br />
• Pay-on-board systems are still fairly common. A few systems<br />
(Eindhoven) have incorporated ticket vending machines on board<br />
vehicles.<br />
tion. Smart cards are more common than other forms <strong>of</strong> electronic • Some Australian systems (Adelaide, Brisbane, Sydney) use magfare<br />
collection.<br />
netic stripe tickets. The use <strong>of</strong> smart cards is growing across a wide<br />
variety <strong>of</strong> BRT systems (Bogotá, Pereira, and Guayaquil in Colombia;<br />
Beijing, Hangzhou, and Kunming in China).<br />
intelligent Transportation Systems<br />
‒ Vehicle Prioritization<br />
‒ Driver Assist and Automation Technology<br />
‒ Operations Management Technology<br />
‒ Passenger Information<br />
‒ Safety and Security Technology<br />
‒ Support Technologies<br />
• The most common ITS applications include <strong>Transit</strong> Signal Priority,<br />
Automatic Vehicle Location Systems, Automated Scheduling and<br />
Dispatch Systems, and Real-Time Traveler Information at Stations<br />
and on Vehicles.<br />
• Installation <strong>of</strong> security systems such as emergency telephones at<br />
stations and closed circuit video monitoring is rare, but increasing<br />
as newer, more comprehensive systems are implemented.<br />
• As in the U.S., Automatic Vehicle Location and <strong>Transit</strong> Signal Priority,<br />
and Real-Time Traveler Information are the most commonly<br />
implemented ITS systems.<br />
• Electronic guidance systems have been implemented in only a few<br />
cases (Rouen, Eindhoven).<br />
E-3
Executive Summary<br />
BRT ElEmEnT ExpERiEncE in ThE UniTEd STaTES inTERnaTional ExpERiEncE<br />
Service and operating plans • Implementations <strong>of</strong> BRT generally followed principles <strong>of</strong> greater spacing • Exclusive transitways with grade-separated operation host integrated<br />
‒ Route Length<br />
between stations, all-day service spans, and frequent service.<br />
networks <strong>of</strong> routes. (Ottawa, Brisbane, Bogotá).<br />
‒ Route Structure<br />
• Systems that use exclusive transitways (Miami-Dade’s at-grade South • Many <strong>of</strong> the Latin American systems demonstrate integrated trunk and<br />
‒ Service Span<br />
‒ Frequency <strong>of</strong> Service<br />
‒ Station Spacing<br />
‒ Method <strong>of</strong> Schedule Control<br />
•<br />
Busway and Pittsburgh’s grade-separated transitways) are operated with<br />
integrated networks <strong>of</strong> routes that include routes that serve all stops and<br />
a variety <strong>of</strong> feeders and expresses with integrated <strong>of</strong>f-line and line-haul<br />
operation.<br />
Recent examples <strong>of</strong> systems with exclusive transitways (Los Angeles<br />
Orange Line, Boston Silver Line, Eugene EmX, Cleveland Health Line).<br />
•<br />
feeder route networks (Curitiba, Quito, Bogotá, Pereira, Quito, Guayaquil).<br />
Some systems in arterial streets have overlapping BRT service patterns<br />
(Caen, Rouen), while most have either one single BRT route pattern or<br />
one BRT route operating parallel with a local service.<br />
Branding Elements<br />
‒ Marketing Classification <strong>of</strong> BRT<br />
‒ Branding Devices<br />
E-4<br />
• Most newly-launched BRT systems have been consciously marketed as<br />
distinct from local transit services with distinct BRT brands.<br />
• Use <strong>of</strong> brand names, logos, and colors is widespread.<br />
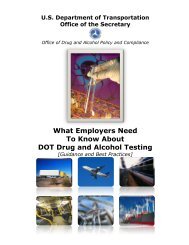
Experience with BRT System Performance<br />
System performance for BRT systems is assessed according to six key attributes<br />
—travel time, reliability, identity and image, safety and security, capacity, and<br />
accessibility. Each <strong>of</strong> the BRT system elements has different effects on system<br />
performance.<br />
BRT elements have different impacts on system performance attributes. The<br />
most direct impacts are summarized here.<br />
• Especially in the context <strong>of</strong> developing countries, implementation <strong>of</strong> BRT<br />
as a distinct brand has been used as a tool to reform and regulate the<br />
bus industries and simplify the service <strong>of</strong>ferings perceived by the public<br />
(many cases in Brazil, Colombia, and China).<br />
• Use <strong>of</strong> brand names, logos, and colors is widespread. Use <strong>of</strong> differentiated<br />
colors for other types <strong>of</strong> bus service is common in Latin America.<br />
• In some cases, it is common for the running way facility and stations to<br />
be branded, while some routes that serve them are designated like other<br />
routes in the system (Ottawa, Brisbane).
RUNNING WAY<br />
Travel<br />
Time<br />
Savings<br />
Reliability<br />
System Performance<br />
Identity<br />
and<br />
Image<br />
Safety<br />
and<br />
Security<br />
Capacity Accessibility<br />
Running Way Location x x x x x x<br />
Level <strong>of</strong> <strong>Transit</strong> Priority x x x x x<br />
Running Way Marking x x x x<br />
Running Way Guidance x x x x<br />
STATIONS<br />
Station Location and Type x x x x<br />
Passenger Amenities x x<br />
Curb Design x x x x x x<br />
Platform Layout x x x x x<br />
Passing Capability x x x<br />
Station Access x x x<br />
VEHICLES<br />
Vehicle Configuration x x x x x x<br />
Aesthetic Enhancement x x<br />
Passenger Circulation Enhancement x x x x x x<br />
Propulsion Systems x x<br />
FARE COLLECTION<br />
Fare Collection Process x x x x x<br />
Fare Media / Payment Options x x x x x<br />
Fare Structure x x x<br />
INTELLIGENT TRANSPORTATION SYSTEMS<br />
Vehicle Prioritization x x x x<br />
Intelligent Vehicle Systems x x x x x<br />
Operations Management Systems x x x x<br />
Passenger Information Systems x x x x<br />
Safety and Security Systems x<br />
SERVICE AND OPERATING PLANS<br />
Route Length x<br />
Route Structure x x x<br />
Span <strong>of</strong> Service x<br />
Frequency <strong>of</strong> Service x x x x<br />
Station Spacing x x x<br />
BRANDING ELEMENTS<br />
Marketing Classification <strong>of</strong> BRT Service x<br />
Branding Devices x<br />
Executive Summary<br />
E-5
Executive Summary<br />
BRT system performance can be assessed based on the experience <strong>of</strong> at least 40<br />
systems across the United States and the world. The experience suggests that<br />
there are concrete improvements to travel time, reliability, and capacity as well<br />
as perceptions <strong>of</strong> improvements in safety and security and image and identity.<br />
Travel Time<br />
With respect to total BRT travel times, BRT projects with more exclusive running<br />
ways generally experienced the greatest travel time savings compared to<br />
the local bus route. Exclusive transitway projects operated at speeds (including<br />
stops) between 20 and 30 miles per hour (travel time rate between 2 to 3<br />
minutes per mile), with even higher speeds demonstrated in along the portions<br />
<strong>of</strong> the routes in exclusive sections. Arterial BRT projects in mixed-flow traffic or<br />
designated lanes operated between 12 and 18 miles per hour (between 3.5 and<br />
5 minutes per mile). Demonstration <strong>of</strong> low dwell times per passenger is most<br />
evident where there are high passenger loads, pre-paid fare collection systems,<br />
and all-door level boarding (such as in many <strong>of</strong> the Latin American systems.)<br />
Reliability<br />
Performance in reliability also demonstrated a similar pattern as travel times.<br />
As expected, systems with more exclusive transitways demonstrated the most<br />
reliability and the least schedule variability and bunching. The ability to track<br />
reliability changes has been limited by the fact that most transit agencies do<br />
not regularly measure this performance attribute. Passenger surveys, however,<br />
indicate that reliability is important for attracting and retaining passengers and<br />
that passengers do respond to more reliable services. New automated vehicle<br />
location systems may allow for the objective and conclusive measurement <strong>of</strong><br />
reliability.<br />
Image and Identity<br />
Most BRT systems in the United States and internationally are successfully marketed<br />
as distinct brands <strong>of</strong> service through a combination <strong>of</strong> high quality service<br />
attributes and explicit use <strong>of</strong> branding devices. Performance in achieving a distinct<br />
brand identity for BRT has been measured by in-depth passenger surveys.<br />
The more successful BRT systems have been able to achieve a distinct identity<br />
and position in the respective region’s family <strong>of</strong> transit services. BRT passengers<br />
generally had higher customer satisfaction and rated service quality higher for<br />
BRT systems than for their parallel local transit services.<br />
E-6<br />
Safety and Security<br />
Data measuring the difference in safety and security <strong>of</strong> BRT systems as compared<br />
with the rest <strong>of</strong> the respective region’s transit system are rarely collected.<br />
Drawing conclusions about the efficacy <strong>of</strong> BRT elements in promoting safety<br />
and security is therefore premature. Data from Pittsburgh suggest that BRT<br />
operations on exclusive transitways have significantly fewer accidents per unit<br />
(vehicle mile or vehicle hour) <strong>of</strong> service than conventional local transit operations<br />
in mixed traffic. Customer perceptions <strong>of</strong> “personal safety” or security reveal<br />
that customers perceive BRT systems to be safer than the rest <strong>of</strong> the transit<br />
system. The experiences <strong>of</strong> a few newly-launched systems suggest the need for<br />
significant attention to collision prevention where buses intersect with general<br />
automobile traffic in the first few months <strong>of</strong> operation.<br />
Capacity<br />
For virtually all BRT systems implemented in the United States, capacity has not<br />
been an issue. To date, none <strong>of</strong> them have been operated at their maximum<br />
capacity. On all systems, there is significant room to expand operated capacity<br />
by operating larger vehicles, higher frequencies, or both. International cases, especially<br />
in Latin America and Asia, demonstrate abilities to host significant loads<br />
<strong>of</strong> passengers with faster travel times and reliability.<br />
Experience with BRT System Benefits<br />
The benefits <strong>of</strong> BRT system implementation are now being felt. While the most<br />
tangible benefit is additional ridership, cost effectiveness and operating efficiencies<br />
as well as increases in transit-supportive land development and environmental<br />
quality are also closely linked to the implementation <strong>of</strong> BRT systems.<br />
Ridership<br />
There have been significant increases in transit ridership in virtually all corridors<br />
where BRT has been implemented. In the United States, though much <strong>of</strong> the<br />
ridership increases have come from passengers formerly using parallel service<br />
in other corridors, passenger surveys have revealed that many trips are new to<br />
transit, either by individuals who used to drive or be driven, or individuals who<br />
used to walk, or by individuals who take advantage <strong>of</strong> BRT’s improved level <strong>of</strong><br />
service to make trips that were not made previously.<br />
Aggregate analyses <strong>of</strong> ridership survey results suggest that the ridership increases<br />
due to BRT implementation exceed those that would be expected as the result
<strong>of</strong> simple level <strong>of</strong> service improvements. This implies that the identity and passenger<br />
information advantages <strong>of</strong> BRT are attractive to potential BRT customers.<br />
Ridership gains <strong>of</strong> between 5 and 25 percent are common. Significantly greater<br />
gains, such as 85 percent in Boston’s Silver Line, represent the potential for BRT.<br />
Ridership gains are evident internationally, as well. Analysis <strong>of</strong> a few cases shows<br />
that mode shift can be just as dramatic. In many areas, system efficiency and<br />
reliability have created opportunities for more accessibility, thereby attracting<br />
passengers to the systems.<br />
Capital Cost Effectiveness<br />
BRT demonstrates relatively low capital costs per mile <strong>of</strong> investment. Recentlyimplemented<br />
BRT systems include a wide range <strong>of</strong> system types with a wide<br />
range <strong>of</strong> costs, from less capital-intensive investments on arterial streets to newly-opened<br />
exclusive transitways, which are more capital intensive. Depending<br />
on the operating environment, BRT systems are able to achieve service quality<br />
improvements (such as travel time savings <strong>of</strong> 15 to 25 percent and increases in<br />
reliability) and ridership gains that compare favorably to the capital costs and<br />
the short amount <strong>of</strong> time to implement BRT systems. Furthermore, BRT systems<br />
are able to operate with lower ratios <strong>of</strong> vehicles compared to total passengers.<br />
Operating Cost Efficiency<br />
BRT systems are able to introduce higher operating efficiency and service productivity<br />
for transit systems that incorporate them. Experience shows that<br />
when BRT is introduced into corridors and passengers are allowed to choose BRT<br />
service, corridor performance indicators (such as passengers per revenue hour,<br />
subsidy per passenger mile, and subsidy per passenger) improve. Furthermore,<br />
travel time savings and higher reliability enables transit agencies to operate more<br />
vehicle miles <strong>of</strong> service from each vehicle hour operated. In international cases,<br />
BRT implementation has improved overall system efficiency by reforming transit<br />
institutions and local transit industries and tying transit regulation to system<br />
performance.<br />
<strong>Transit</strong>-Supportive Land Development<br />
In places where there has been significant investment in transit infrastructure<br />
and related streetscape improvements (e.g., Boston, Pittsburgh, Ottawa, and<br />
Vancouver), there have been significant positive development effects. In some<br />
cases, the development has been adjacent to the transit facility, while in other<br />
Executive Summary<br />
places the development has been integrated with the transit stations. Cases<br />
such as Curitiba in Brazil demonstrate the ability for BRT to shape urban development.<br />
Even some documentation in cities such as Bogotá suggest that<br />
property values are positively affected by accessibility provided by BRT systems.<br />
Experience is not yet widespread enough to draw conclusions on the factors<br />
that would result in even greater development benefits from BRT investment,<br />
although the general principle that good transit and transit-supportive land uses<br />
are mutually reinforcing holds.<br />
Environmental Quality<br />
Documentation <strong>of</strong> the environmental impacts <strong>of</strong> BRT systems is rare. Experience<br />
does show that there is improvement to environmental quality due to a<br />
number <strong>of</strong> factors. Ridership gains suggest that some former automobile users<br />
are using transit as a result <strong>of</strong> BRT implementation. <strong>Transit</strong> agencies are serving<br />
passengers with fewer hours <strong>of</strong> operation, potential reducing emissions. Most<br />
important, transit agencies are adopting vehicles with alternative fuels, propulsion<br />
systems, and pollutant emissions controls. Implementation <strong>of</strong> BRT systems<br />
both within the United States and internationally shows that efforts to improve<br />
emissions for vehicles in the BRT system <strong>of</strong>ten result in reductions in emissions<br />
systemwide.<br />
Progress with Documenting BRT Experience<br />
While BRT systems have been under development for decades, <strong>of</strong> BRT systems<br />
has seen dramatic growth over the past decade, both in the United States and<br />
throughout the world. BRT as <strong>of</strong> 2008 represents significant progress and demonstrates<br />
the impact <strong>of</strong> the growing body <strong>of</strong> knowledge <strong>of</strong> BRT systems both in<br />
the United States and throughout the world. BRT systems are now being integrated<br />
much more consciously and comprehensively and in ways that are more<br />
meaningful and understandable for passengers and non-passengers alike. These<br />
integrated systems are being implemented as focal points to improvements to<br />
transit within their respective service areas. As such, BRT planning efforts demonstrate<br />
attention to a broader array <strong>of</strong> objectives. In addition to improving<br />
travel time and capacity, other objectives such as reliability, safety and security,<br />
and identity and image are motivating the integration <strong>of</strong> additional elements<br />
such as advanced vehicles and more elaborate stations into BRT systems. Ridership<br />
gains <strong>of</strong> between 5 and 25 percent are common. Furthermore, benefits<br />
such as transit-supportive development, environmental quality, capital cost ef-<br />
E-7
Executive Summary<br />
fectiveness, and operating efficiency are being realized and demonstrated more<br />
broadly and concretely.<br />
Many <strong>of</strong> the currently-implemented systems demonstrate the value <strong>of</strong> BRT system<br />
flexibility. Systems have been launched with small packages <strong>of</strong> BRT elements.<br />
Once success has been demonstrated, more features are added to bring even<br />
more benefits to the BRT system. Some arterial BRT systems are now planning<br />
for exclusive lanes. As technology develops, more BRT systems are incorporating<br />
electronic fare collection and Intelligent Transportation Systems. Changes<br />
to vehicle technology, spurred by greater attention to environmental impacts<br />
(both local pollutants and greenhouse gases) and new regulations, are also being<br />
incorporated into BRT systems.<br />
Documenting these projects and extended experience with existing projects in<br />
future editions <strong>of</strong> “Characteristics <strong>of</strong> Bus Rapid <strong>Transit</strong> for Decision-Making” will<br />
help to demonstrate the longer-term performance and benefits <strong>of</strong> BRT.<br />
E-8
introduction<br />
need and purpose<br />
One <strong>of</strong> the <strong>Federal</strong> <strong>Transit</strong> <strong>Administration</strong>’s (FTA) objectives is to<br />
provide local and state <strong>of</strong>ficials with the information they need<br />
to make informed transit investment decisions. With this objective<br />
in mind, “Characteristics <strong>of</strong> Bus Rapid <strong>Transit</strong> for Decision-Making”<br />
(CBRT) was prepared. It provides transportation planners and decisionmakers<br />
with basic information and data to support the development and<br />
evaluation <strong>of</strong> bus rapid transit (BRT) concepts as one <strong>of</strong> many options<br />
during alternatives analyses and subsequent project planning. This report<br />
describes the physical, operational, cost, performance, and potential<br />
benefits <strong>of</strong> BRT’s elements, both individually and combined as integrated<br />
systems. Its intended audience includes urban transportation pr<strong>of</strong>essionals<br />
and <strong>of</strong>ficials involved in developing and evaluating high performance<br />
transit systems, <strong>of</strong> which BRT is one alternative.<br />
What is Brt?<br />
“BRT Implementation Guidelines” (Levinson et al. 2003) defines BRT as:<br />
A flexible, high performance rapid transit mode that combines<br />
a variety <strong>of</strong> physical, operating and system elements into a permanently<br />
integrated system with a quality image and unique<br />
identity.<br />
This definition highlights BRT’s flexibility and the fact that it encompasses<br />
a wide variety <strong>of</strong> applications, each one tailored to a particular<br />
set <strong>of</strong> travel markets and physical environments. BRT’s flexibility derives<br />
from the fact that BRT vehicles (e.g., buses, specialized BRT vehicles)<br />
can travel anywhere there is pavement and the fact that BRT’s basic<br />
service unit, a single vehicle, is relatively small compared to train-based<br />
rapid transit modes. A given BRT corridor application might encompass<br />
route segments where vehicles operate both in mixed traffic and on a<br />
dedicated, fully grade-separated transitway with major stations. BRT is<br />
an integrated system that is designated to improve the speed, reliability,<br />
and identity <strong>of</strong> bus transit.<br />
Ch a r aC t e r i s t iC s o f Bu s ra p i d tr a n s i t f o r deCision-Ma k i n g 1-1
Introduction<br />
BRT applications can combine various route segments such as the above to provide<br />
a single-seat, no-transfer service that maximizes customer convenience. Unlike<br />
other rapid transit modes where basic route alignment and station locations are<br />
constrained by right-<strong>of</strong>-way availability, BRT can be tailored to the unique origin<br />
and destination patterns <strong>of</strong> a given corridor’s travel market. As the spatial nature <strong>of</strong><br />
transit demand changes, BRT systems can adapt to these dynamic conditions.<br />
Many <strong>of</strong> the concepts at the heart <strong>of</strong> BRT have been in use for decades. Dedicated<br />
transitways/busways, limited-stop and express services, and exclusive bus lanes<br />
have become part <strong>of</strong> the transit planning vocabulary because they have enhanced<br />
speed and reliability and thus encouraged transit usage; however, there is uncertainty<br />
among elected <strong>of</strong>ficials and even some transit pr<strong>of</strong>essionals about what BRT<br />
is and how it differs from conventional bus services and systems. This question is<br />
difficult to answer, in part because the options available for each BRT element are<br />
so extensive that there is an infinite variety <strong>of</strong> integrated BRT systems. BRT’s inherent<br />
flexibility means that no two BRT systems will look exactly the same within a<br />
given region, let alone between two different metropolitan areas.<br />
Fortunately, there is an extensive body <strong>of</strong> information and data describing each<br />
<strong>of</strong> BRT’s elements and a growing body <strong>of</strong> literature on the cumulative impacts <strong>of</strong><br />
packaging multiple elements into integrated BRT systems. This report combines<br />
both types <strong>of</strong> information in a single, easy-to-use reference tool for transportation<br />
planners generating evaluation criteria for use in selecting from the large<br />
array <strong>of</strong> BRT elements and integrating them into comprehensive systems. In addition,<br />
since the publication <strong>of</strong> the first edition <strong>of</strong> “Characteristics <strong>of</strong> Bus Rapid<br />
<strong>Transit</strong> for Decision-Making” in 2004, the body <strong>of</strong> experience with BRT both in<br />
the United States and throughout the world has grown. Information from more<br />
<strong>of</strong> these systems is presented in this edition <strong>of</strong> CBRT.<br />
Brt in tHe<br />
transportation pLanninG process<br />
Understanding BRT’s capabilities is important for assessing its performance and<br />
potential benefits during an alternatives analysis. The <strong>Federal</strong> <strong>Transit</strong> Act requires<br />
that all requests for capital assistance for New Start funds be preceded by<br />
an alternatives analysis where a full range <strong>of</strong> feasible, potentially cost-effective alternatives<br />
for addressing specific transportation needs are objectively and transparently<br />
evaluated. Despite the fact that BRT is a bona fide rapid transit concept,<br />
1-2<br />
many local planning efforts <strong>of</strong>ten do not have complete information regarding<br />
the following characteristics <strong>of</strong> BRT systems:<br />
physical and operating characteristics<br />
ridership attraction<br />
capital, operating, and maintenance costs<br />
performance in terms <strong>of</strong> speed, reliability and other measures<br />
air, noise, and other environmental impacts<br />
ability to induce sustainable, transit-oriented land uses<br />
Unfamiliarity with these characteristics <strong>of</strong> BRT affects the ability <strong>of</strong> planning to<br />
support completely informed decision-making about investments.<br />
In addition to the need for better information about BRT for use in alternatives<br />
analyses, there is also a need for information on BRT for less complex, “first cut”<br />
sketch planning exercises, where an initial list <strong>of</strong> viable, potentially desirable alternatives<br />
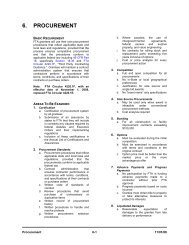
is developed. Exhibit 1-1 illustrates the relationship <strong>of</strong> the number <strong>of</strong><br />
alternatives considered during systems/sketch planning, alternatives analysis,<br />
preliminary engineering, and other planning and project development steps to<br />
the level <strong>of</strong> design detail utilized.<br />
Exhibit 1-1: <strong>Transit</strong> Investment Planning and<br />
Project Development Process
Early in the planning process, there are many alternatives available to solve a specific<br />
transportation need. Because <strong>of</strong> resource constraints, all alternatives cannot<br />
be exhaustively analyzed in detail at all planning stages. Once the universe <strong>of</strong><br />
potentially-feasible options has been narrowed down to a small number through<br />
the sketch planning process, a more detailed analysis can be undertaken. Initially,<br />
sketch planning techniques are used to establish the range <strong>of</strong> alternatives that<br />
meet screening criteria, ruling out those alternatives determined to have “fatal<br />
flaws” or with significantly lower performance than others. In essence, it sets the<br />
agenda for subsequent and more detailed alternatives analyses.<br />
Although sketch planning does not provide the level <strong>of</strong> detail necessary in the<br />
alternatives analysis process, it does require planners to grasp the universe <strong>of</strong> potential<br />
alternatives and have access to accurate and balanced information about<br />
the ability <strong>of</strong> each alternative to meet a broad set <strong>of</strong> performance, operational,<br />
and cost objectives.<br />
After a detailed alternatives analysis in support <strong>of</strong> major investment decisionmaking<br />
is performed (e.g., to support a subsequent FTA New Starts funding application),<br />
only one recommended alternative defined in terms <strong>of</strong> mode, systems<br />
concept, and general alignment will remain. At this stage, the project can advance<br />
to preliminary engineering, which uses much more detailed engineering<br />
and operations analysis and provides a complete description <strong>of</strong> the given alternative.<br />
Preliminary engineering is followed by final design and construction.<br />
intended use oF tHe cBrt report<br />
The purpose <strong>of</strong> the CBRT report is to provide a useful reference for transit and<br />
transportation planning <strong>of</strong>ficials involved in both sketch planning and detailed<br />
alternatives analyses. The report provides a detailed overview <strong>of</strong> BRT’s seven basic<br />
elements and the costs and benefits <strong>of</strong> combining them in different ways. It<br />
provides useful information to planners and decision-makers on each element<br />
and how the elements might be packaged into an integrated system to produce<br />
the maximum benefits. The report is meant to provide a description <strong>of</strong> the possibilities<br />
that BRT provides and the experience <strong>of</strong> various BRT systems around<br />
the world. As a description <strong>of</strong> practice, the CBRT report is not intended to prescribe<br />
solutions for local communities interested in implementing BRT. That<br />
task is left to the many industry guidance documents.<br />
Introduction<br />
The data provided in this report also can be used to assess the reasonableness <strong>of</strong><br />
cost estimates and ridership forecasts prepared as part <strong>of</strong> FTA alternative analyses<br />
through detailed engineering studies, ridership projections, and cost modeling.<br />
While the report does not contain the data needed to develop operating<br />
and maintenance cost models, it does provide information that can be used as<br />
a “baseline” to assess the reasonableness <strong>of</strong> forecasts produced from these requirements.<br />
In cases where more detailed alternatives development and analysis<br />
are needed before decision-makers can reach closure, the CBRT report provides<br />
practitioners with benchmark data to assess the reasonability and reliability <strong>of</strong><br />
the benefits, costs, and impact assessment results produced by more detailed<br />
analysis tools such as travel forecasting, multi-modal traffic simulation, and fullyallocated<br />
or incremental operating and maintenance cost models.<br />
Exhibit 1-2 summarizes the potential applications <strong>of</strong> the CBRT report in the planning<br />
and project development process described above. Of the three major steps<br />
described in Exhibit 1-2, the CBRT is most relevant to Systems Planning and Alternatives<br />
Analysis.<br />
Exhibit 1-2: Characteristics <strong>of</strong> BRT in<br />
Project Planning and Development<br />
Screening <strong>of</strong> Alternatives<br />
Systems Planning/<br />
Sketch Planning<br />
Task Identification and screening<br />
<strong>of</strong> broadly-defined system<br />
package concepts for<br />
refinement and analysis<br />
Level <strong>of</strong><br />
Detail <strong>of</strong><br />
Information<br />
Cost, benefit, and impact<br />
estimates at sketch planning<br />
level <strong>of</strong> detail<br />
Outcome Alternatives for further<br />
refinement and/or analysis<br />
Alternatives<br />
Analysis<br />
Definition <strong>of</strong> alternatives<br />
at both BRT<br />
element and system’s<br />
package level;<br />
check reasonability<br />
<strong>of</strong> analysis results<br />
More accurate<br />
estimates <strong>of</strong> costs,<br />
benefits, and<br />
impacts for system<br />
alternatives<br />
Single system’s package<br />
<strong>of</strong> BRT elements<br />
to bring into Project<br />
Development / Preliminary<br />
Engineering<br />
Preliminary<br />
Engineering<br />
Detailed definition <strong>of</strong><br />
each element in selected<br />
system package; assessment<br />
<strong>of</strong> reasonability <strong>of</strong><br />
specifications and cost<br />
estimates, by element<br />
Detailed cost, performance,<br />
and impact<br />
estimates to take into<br />
final design and implementation<br />
Detailed definition <strong>of</strong><br />
project to take into Final<br />
Design/implementation<br />
Note that the emphasis <strong>of</strong> the CBRT report is on front-end transit planning and<br />
development, where analytical detail is not as critical to decision-making as hav-<br />
1-3
Introduction<br />
ing knowledge <strong>of</strong> viable project alternatives. At the beginning <strong>of</strong> the planning<br />
process, the CBRT report helps senior planners and decision-makers identify<br />
the range <strong>of</strong> possibilities at both the individual element and systems level as<br />
quickly as possible. For less intensive projects, such as situations where a set <strong>of</strong><br />
simple bus corridor improvements may not require a full alternatives analysis,<br />
the CBRT’s usefulness is focused on the Screening and Systems Planning phase.<br />
More involved projects, such as those in the United States that might apply for<br />
Small Starts or Very Small Starts funding, do undertake an alternatives analysis<br />
and can therefore continue to refer to the CBRT during that phase <strong>of</strong> project<br />
development.<br />
The CBRT report also provides aggregate physical, operational, cost, and performance<br />
information useful in reducing the number to a more manageable subset<br />
for subsequent analysis or implementation, depending on the situation. For<br />
more detailed implementation guidance for later and more detailed phases <strong>of</strong><br />
project design, transportation planners and BRT system designers are encouraged<br />
to use the relevant industry standards and codes and the many implementation<br />
guidelines that have been developed to support BRT and the bus industry,<br />
such as:<br />
1-4<br />
“TCRP Report 90: Bus Rapid <strong>Transit</strong> (Volume 1: Case Studies and Volume 2:<br />
Implementation Guidelines)” (TRB 2003)<br />
“TCRP Report 118: Bus Rapid <strong>Transit</strong> Practitioner’s Guide” (including a discussion<br />
<strong>of</strong> cost and effectiveness <strong>of</strong> selected BRT components) (TRB 2007)<br />
“<strong>Transit</strong> Capacity and Quality <strong>of</strong> Service Manual” (TRB 2004)<br />
“Highway Capacity Manual” (TRB 2000)<br />
“Standard Bus Procurement Guidelines” (APTA, 1997 through 2002)<br />
“BRT Vehicle Characteristics” (FTA 2001)<br />
“ITS Enhanced Bus Rapid <strong>Transit</strong>” (FTA 2003)<br />
“Standards for Bus Rapid <strong>Transit</strong>” (APTA beginning in 2008 and continuing)<br />
structure and content oF cBrt<br />
The core <strong>of</strong> the CBRT report is organized into three related topic areas, as illustrated<br />
by Exhibit 1-3.<br />
Exhibit 1-3: CBRT Topic Areas<br />
Major Elements <strong>of</strong> BRT<br />
Major Running Elements Ways <strong>of</strong> BRT<br />
Stations<br />
<br />
Running Ways<br />
Vehicles<br />
Fare<br />
Stations Collection<br />
ITS<br />
Vehicles<br />
<br />
Service<br />
Fare and Collection Operations Plan<br />
Branding Elements<br />
ITS<br />
System Performance<br />
System Performance<br />
Travel Time Savings<br />
Travel Time Savings<br />
Reliability<br />
Identity<br />
Reliability and Image<br />
Safety<br />
Identity and and Security Image<br />
<br />
Capacity<br />
Safety & Security<br />
Accessibility<br />
Capacity<br />
System Benefits<br />
Ridership<br />
Ridership<br />
Ridership<br />
Capital <strong>Transit</strong><br />
Cost Effectiveness<br />
-Supportive<br />
<br />
Land Land Development<br />
Development<br />
Operating Efficiency<br />
<strong>Transit</strong>-Supportive <br />
Environmental Environmental Land Quality<br />
Quality<br />
<br />
Development Capital Cost Effectiveness Cost Effectiveness<br />
Environmental<br />
<br />
Efficiency Operating Efficiency Quality Efficiency<br />
Major Elements <strong>of</strong> BRT<br />
(Chapter 2)—This chapter describes seven major<br />
BRT elements, including detailed discussion <strong>of</strong> the options and associated<br />
costs for each—Running Ways, Stations, Vehicles, Fare Collection, Intelligent<br />
Transportation Systems, Service Plans, and Branding Elements. A discussion<br />
3<br />
r<br />
e<br />
t<br />
p<br />
a<br />
h<br />
C<br />
4<br />
r<br />
e<br />
t<br />
p<br />
a<br />
h<br />
C
on integrating these elements and developing a branding scheme around<br />
them completes the chapter.<br />
BRT Elements and System Performance (Chapter 3)—This chapter<br />
discusses how each BRT element contributes to transit objectives, including<br />
reducing travel times, improving reliability, providing identity and a quality<br />
image, improving safety and security, increasing capacity, and enhancing<br />
accessibility.<br />
BRT System Benefits (Chapter 4)—This chapter describes some <strong>of</strong> the<br />
most important benefits <strong>of</strong> integrated BRT systems in terms <strong>of</strong> ridership,<br />
economic development, and environmental mitigation. The chapter also<br />
includes an assessment <strong>of</strong> the impact <strong>of</strong> BRT system implementation on<br />
two important categories <strong>of</strong> transit system performance—capital costeffectiveness<br />
and operating efficiency.<br />
The three-part conceptual framework describes the function <strong>of</strong> each element as<br />
a part <strong>of</strong> an integrated package and identifies the functional interface between<br />
related elements in achieving specific performance objectives. For example, the<br />
effectiveness <strong>of</strong> certain elements is either magnified or nullified when implemented<br />
in combination with other elements. Functional interface issues like<br />
these will be carefully identified in Chapters 2 and 3.<br />
Accordingly, information on performance measures and outcomes (e.g., travel<br />
time, capacity, operating and maintenance costs, ridership) will be included to<br />
describe various BRT systems.<br />
The remainder <strong>of</strong> the report synthesizes the information presented in Chapters<br />
2, 3, and 4 and presents findings and conclusions.<br />
Chapter 5 provides a summary <strong>of</strong> BRT experience. It provides a summary <strong>of</strong><br />
how elements have been implemented, what performance objectives have<br />
been achieved, and what benefits are generated. Chapter 5 also describes how<br />
the CBRT report will be sustained as a vital source <strong>of</strong> information on BRT.<br />
Appendices include a bibliography <strong>of</strong> useful references, glossary <strong>of</strong> terms<br />
related to BRT, summaries <strong>of</strong> the BRT projects, and BRT system details and<br />
specifications.<br />
neW content in cBrt 2008<br />
The 2008 edition <strong>of</strong> the CBRT report incorporates a number <strong>of</strong> revisions and<br />
additions since the original 2004 edition. The structure <strong>of</strong> the report essentially<br />
Introduction<br />
remains the same with the same five chapters framing the discussion. Throughout<br />
the document, more information from BRT systems is presented to reflect<br />
the growing experience with BRT systems and their improved performance and<br />
the benefits they generate for transit systems and their communities:<br />
Updated and more detailed data and information on BRT systems that were<br />
presented in the 2004 edition, including evaluations <strong>of</strong> systems in Boston,<br />
Honolulu, Oakland, Las Vegas, and Los Angeles<br />
Information from systems that have begun operations in the United States<br />
Information from international BRT systems, including the results <strong>of</strong> data<br />
collection efforts in Australia, Asia, Europe, and Latin America. While not<br />
comprehensive, this data collection effort extends the exchange <strong>of</strong> information<br />
<strong>of</strong> BRT systems across the globe, creating a fuller picture <strong>of</strong> the relationships<br />
explored in the report<br />
This information is presented throughout the discussion in Chapters 2, 3, and 4.<br />
Other changes in the document include:<br />
Chapter 2<br />
Re-organized and updated discussion <strong>of</strong> BRT elements<br />
Additional discussion <strong>of</strong> “Reasons to Implement” and “Considerations/Requirements”<br />
in the discussion <strong>of</strong> each BRT element<br />
Inclusion <strong>of</strong> branding elements as a major element <strong>of</strong> BRT<br />
Revised discussion <strong>of</strong> BRT system interfaces, acknowledging interfaces with<br />
more than two elements<br />
Chapters 3 and 4<br />
Updated discussions <strong>of</strong> performance attributes and benefits<br />
More consistent structure within the discussion <strong>of</strong> each performance attribute<br />
and each benefit<br />
Addition <strong>of</strong> accessibility as a performance attribute<br />
New case studies (system performance pr<strong>of</strong>iles), research summaries, and<br />
data analysis <strong>of</strong> data relating BRT elements and performance and benefits<br />
More complete discussions and explorations <strong>of</strong> the relationship between<br />
BRT and benefits in Chapter 4<br />
1-5
Major ElEMEnts <strong>of</strong> Brt<br />
As described in Chapter 1, Bus Rapid <strong>Transit</strong> is a flexible, permanently-integrated<br />
package <strong>of</strong> rapid transit elements with a quality<br />
image and distinct identity. This chapter describes the characteristics,<br />
range <strong>of</strong> options, relative costs, and a variety <strong>of</strong> other critical<br />
planning parameters for the following seven major BRT elements.<br />
Running Ways —Running ways significantly impact travel speeds,<br />
reliability, and identity. Options range from general traffic lanes to<br />
fully-grade-separated BRT transitways.<br />
Stations—Stations,<br />
as the entry point to the system, are the single<br />
most important customer interface, affecting accessibility, reliability,<br />
comfort, safety, and security, as well as dwell times and system<br />
image. BRT station options vary from simple stops with basic<br />
shelters to complex stations and intermodal terminals with many<br />
amenities.<br />
Vehicles —BRT systems can utilize a wide range <strong>of</strong> vehicles, from<br />
standard buses to specialized vehicles. Options vary in terms <strong>of</strong> size,<br />
propulsion system, design, internal configuration, and horizontal/<br />
longitudinal control, all <strong>of</strong> which impact system performance,<br />
capacity, and service quality. Aesthetics, both internal and external,<br />
also are important for establishing and reinforcing the brand<br />
identity <strong>of</strong> the system.<br />
Fare Collection—Fare<br />
collection affects customer convenience<br />
and accessibility, as well as dwell times, service reliability, and<br />
passenger security. Options range from traditional pay-on-board<br />
methods to pre-payment with electronic fare media (e.g., smart<br />
cards).<br />
Intelligent Transportation Systems (ITS)<br />
—A wide variety <strong>of</strong><br />
ITS technologies can be integrated into BRT systems to improve<br />
BRT system performance in terms <strong>of</strong> travel times, reliability, convenience,<br />
operational efficiency, safety, and security. ITS options<br />
Ch a r aC t e r i s t iC s o f Bu s ra p i d tr a n s i t f o r deCision-Ma k i n g 2-1
Major Elements <strong>of</strong> BRT<br />
2-2<br />
include vehicle priority, operations and maintenance management, operator<br />
communications, real-time passenger information, and safety and security<br />
systems.<br />
Service and Operations Plan—Designing<br />
a service plan that meets the<br />
needs <strong>of</strong> the population and employment centers in the service area and<br />
matches the demand for service is a key step in defining a BRT system. How<br />
it is designed can impact system capacity, service reliability, and travel times,<br />
including wait and transfer times.<br />
Branding Elements—Branding<br />
Elements tie all <strong>of</strong> the various physical<br />
and service elements <strong>of</strong> BRT systems together are Branding elements. The<br />
approach to branding BRT systems packages all <strong>of</strong> the elements into a cohesive<br />
system and communicates the value <strong>of</strong> BRT elements to the traveling<br />
public.<br />
The aim <strong>of</strong> this chapter is to describe the specific discrete options available for<br />
each BRT element. Greater detail on the performance <strong>of</strong> these elements as part<br />
<strong>of</strong> comprehensive systems and in terms <strong>of</strong> how they relate to specific BRT objectives<br />
will be presented in Chapter 3.<br />
Sections 2.1 through 2.7 discuss each element according to the following structure:<br />
Description: A brief description <strong>of</strong> each element with:<br />
Role <strong>of</strong> the element—a<br />
description <strong>of</strong> the role <strong>of</strong> each element <strong>of</strong> BRT<br />
systems<br />
Element characteristics—a<br />
discussion <strong>of</strong> the primary characteristics <strong>of</strong><br />
each element<br />
options: Various options for each element characteristic, with images and<br />
costs.<br />
Implementation Issues: Two types <strong>of</strong> issues will be presented with each<br />
issue —those relevant during Project Development (planning, procurement, design,<br />
and construction) and those relevant during Operations (after commencement<br />
<strong>of</strong> service).<br />
summary <strong>of</strong> Experience: Real-world information on implementation <strong>of</strong><br />
the element in BRT systems.<br />
Since each <strong>of</strong> these elements must be combined in an integrated fashion to maximize<br />
the impact <strong>of</strong> the investment, the last section, Section 2.8, explores several<br />
different interfaces or packages <strong>of</strong> BRT elements. This discussion shows how the<br />
integration <strong>of</strong> certain BRT elements contributes to the optimal function, performance,<br />
and increased benefits.
unnIng Way<br />
Description<br />
role <strong>of</strong> the running Way in Brt<br />
The running way defines where BRT vehicles travel. It is analogous to tracks in<br />
a rail transit system. How running ways are incorporated into a BRT system is<br />
the major defining factor for the entire BRT system. Running ways are the most<br />
critical element in determining the speed and reliability <strong>of</strong> BRT services. Running<br />
ways can be the most significant cost item in the entire BRT system. Finally, as<br />
the BRT element most visible to the general public, including both existing and<br />
potential customers, running ways can have a significant impact on the image<br />
and identity <strong>of</strong> the system.<br />
Characteristics <strong>of</strong> running Way<br />
There are three primary BRT running way characteristics:<br />
1. Running Way Type—The<br />
running way type is the primary parameter<br />
when planning running ways. It is defined by two sub-characteristics<br />
– the right-<strong>of</strong>-way location and the level <strong>of</strong> running way priority.<br />
These two sub-characteristics represent the two stages <strong>of</strong> decisionmaking<br />
when defining the running way type.<br />
Right-<strong>of</strong>-Way Location—BRT can operate “on-street,” using a public<br />
right-<strong>of</strong>-way generally open to all traffic, including pedestrians and<br />
bicyclists, and providing access to all adjacent land uses. BRT can also<br />
operate “<strong>of</strong>f-street,” using an express right-<strong>of</strong>-way open to restricted<br />
types <strong>of</strong> traffic and providing access to adjacent land uses only at<br />
designated areas. On-street rights-<strong>of</strong>-way are generally never owned or<br />
operated by transit operators. Off-street rights-<strong>of</strong>-way, which include<br />
expressways (open to all traffic) and transitways (for transit vehicles<br />
only), may be owned and operated by a public transit authority or a<br />
highway authority but usually not by local governments.<br />
Level <strong>of</strong> Running Way Priority—Based on the right-<strong>of</strong>-way location,<br />
the level <strong>of</strong> priority and infrastructure investment defines how BRT<br />
vehicles operate with respect to other traffic and vehicles. Together,<br />
the right-<strong>of</strong>-way Location and the level <strong>of</strong> running way priority define<br />
the running way type.<br />
Major Elements <strong>of</strong> BRT<br />
2. Running Way Marking—Just<br />
as a track indicates where a train<br />
travels for rail transit passengers and the community, treatments or<br />
markings to differentiate a running way can effectively convey where<br />
a BRT service operates. Running ways for buses can be differentiated<br />
through a number <strong>of</strong> techniques, including pavement markings, lane<br />
delineators, alternate pavement texture, and alternate pavement color.<br />
3. Running Way Guidance—BRT<br />
running ways can be designed to<br />
accommodate vehicles equipped with automatic lateral guidance, a<br />
feature that controls the side-to-side movement <strong>of</strong> vehicles along the<br />
running way, similar to how a track defines where a train operates.<br />
Some BRT systems incorporate a form <strong>of</strong> lateral guidance to meet<br />
one or more <strong>of</strong> a variety <strong>of</strong> objectives, including reducing right-<strong>of</strong>-way<br />
width requirements and curvature, providing a smoother ride, and<br />
facilitating precision docking at stations, allowing no-step boarding<br />
and alighting. Technology for guidance varies, and can be mechanical,<br />
electro-magnetic, or optical.<br />
running Way options<br />
running Way type<br />
BRT systems are largely defined by the running way type. BRT’s flexibility means<br />
that a single BRT route can operate on several different segments <strong>of</strong> different<br />
running way types. Two sub-characteristics define the running way type—right<strong>of</strong>-way<br />
location and the level <strong>of</strong> running way priority.<br />
The various running way types are described below, in two groupings that correspond<br />
to the right-<strong>of</strong>-way location—on-street and <strong>of</strong>f-street.<br />
On-Street Running Way Types<br />
Conventional streets and roads open to all traffic are the most common type <strong>of</strong><br />
running way used by bus transit. The road system provides universal access to<br />
most locations, as buses can operate on all but the narrowest streets. Operating<br />
on ordinary streets provides flexibility in terms <strong>of</strong> providing service where it is<br />
needed.<br />
2-3
Major Elements <strong>of</strong> BRT<br />
on-street running Way types<br />
Mixed-Flow Lanes<br />
Mixed-flow lanes represent the simplest and most basic type<br />
<strong>of</strong> operation for bus service. BRT vehicles operate with other<br />
traffic (automobiles, trucks, and other buses) on existing<br />
roads. Most rubber-tired urban transit service operates on<br />
mixed flow lanes..<br />
Cost: $0. Operation on mixed-flow lanes typically does not<br />
cost transit agencies. Cost for operation and maintenance are<br />
typically borne by the municipality that owns the roadway.<br />
Mixed Flow Lanes with Queue Jumpers<br />
A queue jumper is a lane on an approach to a traffic bottleneck<br />
location that is reserved for buses or serves a bus-only<br />
movement. Bottleneck locations are usually intersections<br />
but can be non-intersection locations such as in advance <strong>of</strong> a<br />
narrower section <strong>of</strong> roadway (e.g., a bridge or a narrow urban<br />
street). There are at least two widely-used categories <strong>of</strong> queue<br />
jumpers—those with a physical lane only and those that are<br />
integrated with traffic signals.<br />
2-4<br />
Bus in Pittsburgh at a local stop<br />
Painted bus lanes separated from<br />
mixed traffic, New Zealand<br />
• Physical queue jump lanes are designated for use by transit vehicles and only allow transit<br />
vehicles to pass a queue <strong>of</strong> general traffic (“jumping the queue”) at a traffic bottleneck.<br />
When queue jump lanes are not integrated with traffic signals, they typically require a<br />
merging lane or bus bypass lanes on the far side <strong>of</strong> the bottleneck to allow the transit<br />
vehicle to safely merge into traffic.<br />
• Queue jumpers integrated with traffic signals have a special traffic signal that gives an early<br />
green light to buses, allowing them to move into the general lanes ahead <strong>of</strong> other traffic. A<br />
right-turn-only signal is <strong>of</strong>ten displayed in advance <strong>of</strong> the bus-only green to clear any rightturning<br />
vehicles from the lane.<br />
Cost: $0.10 - $0.29 million per queue jump lane section per intersection (excluding ROW acquisition).<br />
Costs can be much less if existing roadway space can be rededicated for the purposes<br />
<strong>of</strong> queue jump lanes, such as an existing right-turn lane.<br />
ReAsons to Implement<br />
• Use <strong>of</strong> mixed-flow lanes is common when<br />
constraints limit the application <strong>of</strong> additional<br />
priority measures.<br />
• Often, implementation <strong>of</strong> BRT service on<br />
mixed-flow lanes is launched as an interim<br />
step while priority measures are being planned<br />
or constructed or when congestion does not<br />
require priority measures.<br />
• Since most <strong>of</strong> the delay on urban streets is at<br />
intersections and other bottlenecks, queue<br />
jumpers can provide significant improvements<br />
in travel time without taking away travel lanes<br />
from other vehicles or widening the roadway.<br />
• Can be used to facilitate bus movements from<br />
a right-side stop to a left-turn lane in a short<br />
distance.<br />
• Can be used at non-intersection locations such<br />
as in advance <strong>of</strong> a narrower section <strong>of</strong> roadway,<br />
for example, a bridge or a narrow urban street.<br />
ConsIdeRAtIons/<br />
RequIRements<br />
• Operation in mixed-flow lanes<br />
<strong>of</strong>ten still requires coordination<br />
with local street departments<br />
or authorities to define traffic<br />
control or required pavement<br />
enhancement.<br />
• Requires coordination with the<br />
traffic signal system in order to<br />
ensure optimum functionality.
On-Street Bus Lanes<br />
Reserving lanes for the exclusive use <strong>of</strong> transit vehicles can<br />
reduce running time and improve reliability. Other vehicles<br />
are restricted from using the lane by means <strong>of</strong> police enforcement.<br />
The status <strong>of</strong> the lane is indicated by signs, pavement<br />
markings, and sometimes a physical barrier. In some cases,<br />
non-transit vehicles are allowed to share the designated lane<br />
such as turning vehicles, taxis, high-occupancy vehicles, or<br />
bicycles. Bus lanes can operate at all times or only at certain<br />
times <strong>of</strong> the day, such as peak periods. There are several types<br />
<strong>of</strong> on-street bus lanes:<br />
• Curbside—Exclusive lane is adjacent to the curb. In this case, delivery vehicles are typically<br />
permitted, at least during <strong>of</strong>f-peak hours. Lanes shared with right-turning traffic are, typically,<br />
not very effective unless treated as queue jump lanes, as previously described.<br />
• Outside <strong>of</strong> parking lane—The bus lane is to the left <strong>of</strong> a permanent parking lane. In this<br />
case, the curb flares into the parking lane at stations to become a “bus bulb.”<br />
• Center (or Median-Running)—The bus lane is in the center <strong>of</strong> the roadway. In this case, it is<br />
necessary to create a loading platform between the bus lane and the general purpose lanes<br />
at stations. Alternatively, if the vehicle has left-side doors, a central platform shared by both<br />
directions <strong>of</strong> movement can be used. Commonly, medium anterial busways are physically<br />
separated from adjacent travel lanes.<br />
• Contraflow—The bus lane runs opposite the direction <strong>of</strong> general traffic. This design is like a<br />
two-way street that operates in one direction only for general traffic. Contraflow lanes on<br />
the left side <strong>of</strong> the road require fencing because they operate contrary to the expectation <strong>of</strong><br />
pedestrians.<br />
Bus-Only Streets<br />
Entire roadways can be restricted to buses only. Bus-only<br />
streets are typically applied in central business districts as “bus<br />
malls” where many different bus services in addition to BRT<br />
services converge. Generally, access to delivery vehicles is permitted<br />
at least at some times.<br />
Curbside bus lane in San Pablo—<br />
AC <strong>Transit</strong><br />
Bus only street in pedestrian<br />
transit mall—Denver, Colorado<br />
Major Elements <strong>of</strong> BRT<br />
ReAsons Can permit to buses Implement<br />
to bypass traffic congestion, ConsIdeRAtIons/<br />
• Requires enforcement from use<br />
thus increasing the average and reducing vari- by other vehicles to retain the<br />
• Can<br />
ability<br />
permit<br />
<strong>of</strong> bus<br />
buses<br />
running<br />
to bypass<br />
speed.<br />
traffic con- RequIRements<br />
benefits <strong>of</strong> faster travel time<br />
gestion, thus increasing the average and • Requires and special reliability. analysis to determine<br />
• Increases reducing variability the visual <strong>of</strong> presence bus running <strong>of</strong> transit speed. in a whether lanes function all day or only<br />
corridor.<br />
• Public understanding <strong>of</strong> the<br />
• Increases the visual presence <strong>of</strong> transit in during peak hours.<br />
use restrictions can be more<br />
a corridor.<br />
• Requires difficult enforcement when they from apply use only by<br />
other vehicles in certain to hours. retain the benefits <strong>of</strong><br />
faster travel time and reliability.<br />
• Public understanding <strong>of</strong> the use restrictions<br />
can be more difficult when<br />
they apply only in certain hours.<br />
• Parking in curbside bus lanes is a<br />
notable problem where there are<br />
buildings with no rear access; some allowance<br />
must be made for deliveries.<br />
• Requires strategy to maintain political<br />
support.<br />
• Contraflow bus lanes may require<br />
special pedestrian safety programs or<br />
physical design treatments to address<br />
special pedestrian safety conditions.<br />
• Implementation <strong>of</strong> bus-only streets<br />
requires a plan to accommodate local<br />
access to delivery vehicles for owners<br />
and users on the affected street.<br />
• In central business districts, it may be<br />
desirable to concentrate bus routes on a<br />
single street and divert all other vehicles<br />
(except local deliveries) to a parallel street.<br />
This solution can reduce delays due to<br />
congestion while maximizing bus use <strong>of</strong><br />
restricted lanes.<br />
• Bus-only streets make it easier for customers<br />
to find downtown bus stops and to<br />
transfer between routes.<br />
2-5
Major Elements <strong>of</strong> BRT<br />
<strong>of</strong>f-street running Way types<br />
Expressway Bus Lanes<br />
Buses can operate in expressways in High Occupancy Vehicle<br />
(HOV), High Occupancy-Toll (HOT), or bus-only lanes. These<br />
can be shoulder lanes, median lanes, or contraflow lanes.<br />
Where there are peak directional flows, contraflow lanes can<br />
be created either through manually placing barriers or by the<br />
use <strong>of</strong> a “zipper” truck that can move a concrete lane barrier.<br />
Alternatively, operation <strong>of</strong> bus-only lanes, or HOV lanes with<br />
buses, can be reversible and limited to peak direction use only.<br />
Cost: $2.5 - $2.9 million per lane mile (excluding ROW acquisition)<br />
At-Grade <strong>Transit</strong>ways<br />
Roads for the exclusive use <strong>of</strong> transit vehicles can be created<br />
where there is available right-<strong>of</strong>-way, such as a railroad corridor<br />
that is no longer in use and where there is sufficient transit<br />
demand to warrant the investment that will support frequent<br />
bus service. Where there is sufficient cross-section, transitways<br />
can also operate adjacent to active rail corridors. In some<br />
cases, right-<strong>of</strong>-way for exclusive lanes may be wide enough to Orange Line, Los Angeles<br />
accommodate only one single bi-directional lane. In such situations,<br />
transit service is limited to the peak direction only or service in both directions if frequencies<br />
are low and the single-lane section is short.<br />
Cost: (not including ROW): $6.5 - 10.2 million per lane mile<br />
Grade-Separated <strong>Transit</strong>ways<br />
Grade-separated transitways traverse cross streets with overpasses<br />
or underpasses, allowing transit vehicles to operate<br />
unimpeded at maximum safe speeds between stations. They<br />
are separated from congestion along local streets at intersections<br />
and adjacent highways. Underpasses or overpasses can<br />
be used at intersections, with the bulk <strong>of</strong> the right-<strong>of</strong>-way at<br />
grade, to reduce costs.<br />
Cost: (not including ROW):<br />
Aerial transitway: $12 - $30 million per lane mile<br />
Below-grade transitway: $60 - $105 million per lane mile<br />
Additional lanes: $6.5: $10 million per additional lane mile<br />
2-6<br />
Bus and taxi lane on British<br />
motorway<br />
East Busway, Pittsburgh<br />
ReAsons to Implement<br />
• Can guarantee free-flow travel speeds at all<br />
times mitigating the impacts <strong>of</strong> recurring or<br />
intermittent congestion.<br />
• At-grade transitways reduce congestion-related<br />
delays between intersections and promote reliability<br />
<strong>of</strong> service.<br />
• Can <strong>of</strong>fer expressway-like speeds and a high<br />
degree <strong>of</strong> reliability, with few or no conflicts<br />
from other vehicles.<br />
ConsIdeRAtIons/<br />
RequIRements<br />
• Like on-street bus lanes,<br />
requires active enforcement<br />
to limit delays and congestion<br />
caused by other vehicles.<br />
• Requires attention to safety<br />
at grade crossings with cross<br />
streets including education<br />
programs, new traffic control<br />
measures, safety devices, and<br />
even the possible installation <strong>of</strong><br />
crossing gates.<br />
• Where the volume <strong>of</strong> buses<br />
is high and where there is a<br />
mix <strong>of</strong> standard and express<br />
services, multiple lanes may be<br />
necessary to add capacity and<br />
to allow passing, particularly at<br />
stations.
unning Way Markings<br />
Running way markings are effective devices for communicating to passengers<br />
and motorists that BRT running ways are present. This is important for multiple<br />
purposes: to facilitate faster travel times, and to promote safety. Secondarily,<br />
they may provide visibility for the system. Especially where running ways are for<br />
the exclusive or semi-exclusive use <strong>of</strong> transit vehicles, the special status <strong>of</strong> the<br />
running Way Markings<br />
Signs and Pavement Markings<br />
Signs and pavements markings are required regulatory<br />
devices to restrict use <strong>of</strong> the road or lane to designated<br />
vehicles. They represent a very basic running<br />
way treatment. The MUTCD also provides standards<br />
for the type <strong>of</strong> lane markings and symbols that may<br />
be used, depending on the type <strong>of</strong> vehicles allowed,<br />
the location <strong>of</strong> the lane, and the nature <strong>of</strong> the restriction.<br />
(In the 2003 edition <strong>of</strong> the MUTCD, signs<br />
for bus lanes are discussed in Section 2B.26, Preferential<br />
Only Lane Signs and pavement markings for<br />
bus lanes are discussed in Section 3B.22, Preferential<br />
Lane Word and Symbol Markings. The standard al-<br />
Example <strong>of</strong> a<br />
ground-mounted<br />
bus lane sign,<br />
MUTCD R3-11B.<br />
Pavement markings—<br />
Boston Silver Line<br />
lows for designating lanes for any combination <strong>of</strong> specific vehicles [e.g., bus, taxi, two-person<br />
carpool, bicycle]. The diamond symbol on signs and pavement markings is used only to indicate<br />
HOV lanes, that is, those that are open to cars with some minimum occupancy [e.g., 2, 3, or 4<br />
persons]. These lanes are normally open to buses also. However, lanes for buses that do not permit<br />
carpools use text-only signs such as R3-11B. The signs can be used for lanes that are in use<br />
only in certain time periods and can be used on either expressways or conventional roads.)<br />
Raised Lane Delineators<br />
Raised curbs, bollards, medians, or raised lane delineators can highlight<br />
the distinction between general purpose lanes and BRT running way<br />
lanes. The MUTCD permits such measures; preferential lanes “might be<br />
physically separated from the other travel lanes by a barrier, median, or<br />
painted neutral area.” Raised lane delineators create a physical divider<br />
that motorists can see or feel. As such, they create restrictions on use by<br />
certain classes <strong>of</strong> roadway users.<br />
LYNX Lymmo<br />
ReAsons to Implement<br />
• Used as a minimum requirement.<br />
Regulatory traffic signs are required<br />
to make lane restrictions legally<br />
enforceable.<br />
• Pavement markings can greatly<br />
increase the visibility <strong>of</strong> lane restrictions.<br />
• Deters motorists from entering a<br />
reserved lane.<br />
• Are particularly useful in locations<br />
where no turns across the reserved<br />
lane are permitted and where there<br />
is enough cross-section to provide a<br />
substantial, visible divider, such as a<br />
raised median.<br />
Major Elements <strong>of</strong> BRT<br />
lanes, or entire roadway, can be designated through signs, lane markings, barriers,<br />
and special pavement, as described below. The design, use, and placement<br />
<strong>of</strong> these devices are governed by the Manual on Uniform Traffic Control Devices<br />
(MUTCD), which is supported by the U.S. DOT <strong>Federal</strong> Highway <strong>Administration</strong><br />
(http://mutcd.fhwa.dot.gov/).<br />
ConsIdeRAtIons/<br />
RequIRements<br />
• To increase visibility and compliance, overhead<br />
lane signs should be considered in<br />
addition to or instead <strong>of</strong> ground-mounted<br />
signs.<br />
• Pavement markings require ongoing<br />
maintenance.<br />
• Some larger types <strong>of</strong> dividers could create<br />
extra safety considerations for certain<br />
classes <strong>of</strong> roadway users, especially motorcyclists<br />
or bicyclists.<br />
• As with pavement markings, dividers<br />
require ongoing maintenance.<br />
• Since dividers prevent traffic from entering<br />
the lane to make a turn or access on-street<br />
parking, such dividers may be more appropriate<br />
for permanently exclusive lanes.<br />
2-7
Major Elements <strong>of</strong> BRT<br />
Pavement Color and Material<br />
Designated BRT running ways can be identified through the<br />
use <strong>of</strong> a different pavement color and/or the use <strong>of</strong> a different<br />
pavement material, such as colored asphalt or concrete.<br />
2-8<br />
Key routes, Nagoya, Japan<br />
running Way guidance<br />
Running way guidance can be used along the line-haul portion <strong>of</strong> a route to<br />
permit higher speed travel in narrow corridors. Some guidance technologies also<br />
can be used to permit safe operation on narrow streets with frequent pedestrian<br />
use, at reduced speeds. A third application <strong>of</strong> guidance technology consists<br />
<strong>of</strong> short sections <strong>of</strong> concrete guideway used on streets to create narrow bus<br />
lanes and to prevent unauthorized vehicle use, <strong>of</strong>ten at intersection approaches.<br />
Guidance technologies can also be used for precision docking (see section on<br />
Horizontal Gap in the Stations).<br />
ReAsons to Implement<br />
• Visibly reduces the number <strong>of</strong><br />
motorists who enter a restricted lane<br />
inadvertently.<br />
• Increases the visibility and image <strong>of</strong><br />
transit services.<br />
ConsIdeRAtIons/<br />
RequIRements<br />
• Use <strong>of</strong> alternative pavement color and<br />
material may require exceptions to existing<br />
traffic control practice, especially<br />
where jurisdictions adhere to the MUTCD.<br />
The MUTCD currently does not permit<br />
colored lanes, except through its experimentation<br />
procedure. The manual also<br />
requires that colored pavement be used<br />
only to reinforce a traffic control that<br />
is legally in force at all times. However,<br />
contrasting pavement materials that have<br />
no explicit regulatory meaning, such as a<br />
concrete bus lane adjacent to an asphalt<br />
general-purpose lane, can be used.<br />
• As with pavement markings, lanes with<br />
alternate pavement color require ongoing<br />
maintenance and cleaning to maintain a<br />
consistent and clean look.
unning Way guidance<br />
Curb Guidance<br />
Vehicles can be equipped with horizontal<br />
rubber guidewheel tires that follow<br />
vertical curbs. The guidewheels are attached<br />
to arms connected to the bus<br />
steering mechanism. Buses can drive<br />
normally <strong>of</strong>f the guideway. Most systems<br />
use guidance in multiple short<br />
segments to provide dedicated lanes<br />
in congested areas. Hundreds <strong>of</strong> buses<br />
Cleveland BRT bus with guidewheels<br />
for precision docking<br />
are now used daily on more than a dozen systems in cities around the<br />
world, and, as <strong>of</strong> 2007, two additional systems were under construction<br />
in the UK.<br />
Adelaide system<br />
showing high speed<br />
operation on narrow<br />
row<br />
Single Rail Guidance<br />
There are two suppliers <strong>of</strong> systems based on a steel wheel on<br />
the vehicle following a single center rail. Several small systems<br />
have been installed (in France, Italy, and China). Vehicles are<br />
very specialized. Operation is limited to 30 kph (about 19<br />
mph) and thus is more suited to urban rather than express operation.<br />
Operating capability <strong>of</strong>f guiderail is very limited.<br />
TVR in Nancy, France<br />
The technology is more like rail than bus in that it can only<br />
operate on the guideway, thus eliminating many <strong>of</strong> the advantages that bus systems enjoy.<br />
Optical Guidance<br />
Optical guidance systems use video sensors on vehicles that<br />
read lines painted on the pavement to delineate the path <strong>of</strong><br />
the vehicle. The only infrastructure change needed to the<br />
running way is the application <strong>of</strong> pavement markings. Buses<br />
can operate with normal manual steering without the guidance<br />
system engaged. Operation is limited to 30 kph (about 19<br />
mph). The technology is useful for urban operation in narrow Rouen, France<br />
streets and pedestrian areas and for precision docking but is<br />
not suitable for high-speed line haul operation due to the possibility <strong>of</strong> guidance failure at high<br />
speeds. The only city with revenue operation is Rouen, France, but the technology was tested in<br />
Las Vegas and is under construction for Cambridge, UK.<br />
Cost: $100,000 per vehicle.<br />
ReAsons to Implement<br />
• Provides smooth operation at high speeds.<br />
Some routes with dedicated rights-<strong>of</strong>-way operate<br />
at 100 kph (62 mph). Operation is robust<br />
in severe operating conditions such as heavy<br />
precipitation. High-speed operation is possible<br />
in narrower rights-<strong>of</strong>-way, which can result in<br />
substantial cost savings where right-<strong>of</strong>-way is<br />
constrained or where bridges or underpasses<br />
may otherwise require wider sections.<br />
• Guided bus transitways are self-policing, since<br />
vehicles not equipped with guidewheels cannot<br />
operate on the guideway.<br />
•<br />
Provides guaranteed level boarding.<br />
• Compared to conventional bus systems, narrower<br />
rights-<strong>of</strong>-way can be used and precision<br />
docking with level boarding will be achieved.<br />
• Use <strong>of</strong> single rail guidance with rubber-tired<br />
vehicles may simulate light rail.<br />
• Optical guidance requires little investment in<br />
right-<strong>of</strong>-way. Its main uses are precision docking<br />
and low-speed operation on narrow rights-<strong>of</strong>way.<br />
Major Elements <strong>of</strong> BRT<br />
ConsIdeRAtIons/<br />
RequIRements<br />
• Curb-guided bus technology<br />
is non-proprietary; any bus<br />
manufacturer can equip buses<br />
with guidewheels (which are<br />
not expensive), and any agency<br />
can construct guideways at a<br />
cost similar to construction<br />
<strong>of</strong> conventional busways.<br />
Some specialty knowledge is<br />
required.<br />
• Procurement <strong>of</strong> systems is<br />
proprietary.<br />
• Because complex electronic<br />
detection and mechanical control<br />
systems are required, optical<br />
guidance adds a significant<br />
amount to the vehicle cost.<br />
• These markings must be maintained<br />
to a sufficient level <strong>of</strong><br />
contrast for the sensors to reliably<br />
detect them. Maintaining<br />
the pavement markings may<br />
also add ongoing maintenance<br />
costs.<br />
2-9
Major Elements <strong>of</strong> BRT<br />
Effects <strong>of</strong> running Way Elements on system Performance<br />
and System Benefits<br />
Exhibit 2-1 summarizes the links between the running way elements and the BRT system<br />
performance indicators and system benefits identified in Chapter 1. These links are explored<br />
further in Chapters 3 and 4.<br />
2-10<br />
Running Way<br />
Location<br />
• On-Street<br />
• Off-Street<br />
Level <strong>of</strong><br />
<strong>Transit</strong> Priority<br />
On-Street<br />
• Mixed-Flow with<br />
Queue Jumper<br />
• On-Street Bus<br />
Lane<br />
Off-Street<br />
• At-Grade<br />
<strong>Transit</strong>way<br />
• Grade<br />
Separated<br />
<strong>Transit</strong>way<br />
Exhibit 2-1A: Summary <strong>of</strong> Effects <strong>of</strong> Running Way Elements on System Performance<br />
Off-street running ways<br />
normally reduce running<br />
time more than on-street<br />
but may increase access<br />
time.<br />
System Performance<br />
Travel Time Savings Reliability Identity and Image Safety and Security Capacity Accessibility<br />
Priority measures, if<br />
effectively implemented<br />
and enforced, should<br />
reduce running time,<br />
particularly in congested<br />
situations.<br />
Off-street running ways<br />
with at-grade intersections<br />
may <strong>of</strong>fer lower travel time<br />
benefits than fully<br />
grade-separated running<br />
ways.<br />
Off-street running<br />
ways should<br />
provide greater<br />
reliability except<br />
on congested<br />
freeways.<br />
Priority measures<br />
should improve<br />
reliability.<br />
Both at-grade and<br />
grade-separated<br />
running ways<br />
demonstrate good<br />
travel time<br />
reliability.<br />
Exclusive busways can become<br />
part <strong>of</strong> the image <strong>of</strong> a BRT and<br />
the subject <strong>of</strong> a marketing a<br />
campaign. An <strong>of</strong>f-street<br />
transitway can be used as the<br />
primary branding element <strong>of</strong> a<br />
BRT. An on-street running way<br />
can be part <strong>of</strong> an overall<br />
street-scape renovation or<br />
upgrade.<br />
Clear, enforced priority for<br />
running ways operating on<br />
regular streets improves the<br />
visibility and image <strong>of</strong> transit.<br />
Both grade-separated and<br />
at-grade transitways can be<br />
used as the system’s central<br />
branding element.<br />
Segregation from other<br />
traffic and pedestrians<br />
may decrease BRT vehicle<br />
collisions compared to<br />
on-street operations.<br />
Separation <strong>of</strong> BRT<br />
vehicles from other traffic<br />
can reduce collisions.<br />
Potential conflict points<br />
such as cross-street<br />
intersections and other<br />
at-grade vehicle and<br />
pedestrian crossings must<br />
be addressed.<br />
Off-street running ways may have<br />
higher capacity due increased<br />
number and frequency <strong>of</strong> transit<br />
vehicles that the bus lanes can<br />
accommodate. Off-street running<br />
ways may allow multiple lanes,<br />
which accommodates more<br />
vehicles and express or limited<br />
stop service as well as all-stop<br />
service.<br />
Priority measures that reduce<br />
congestion delay also increase<br />
throughout.<br />
Busways that bypass street-level<br />
intersections can accommodate<br />
higher vehicle numbers and<br />
frequency.<br />
On-street<br />
running ways,<br />
are generally<br />
closer to land<br />
uses, require less<br />
walking and<br />
access time, and<br />
have fewer<br />
physical barriers.
Running Way<br />
Marking<br />
• Signage &<br />
Pavement<br />
Markings<br />
• Raised Lane<br />
Delineators<br />
• Pavement Color<br />
and Material<br />
Running Way<br />
Guidance Type<br />
• Curb Guidance<br />
• Single Rail<br />
Guidance<br />
• Optical<br />
Guidance<br />
Exhibit 2-1A: Summary <strong>of</strong> Effects <strong>of</strong> Running Way Elements on System Performance (cont’d.)<br />
Clear designation <strong>of</strong><br />
exclusive running ways can<br />
reduce unauthorized use.<br />
System Performance<br />
Major Elements <strong>of</strong> BRT<br />
Travel Time Savings Reliability Identity and Image Safety and Security Capacity Accessibility<br />
Curb guidance reduces<br />
running time, especially in<br />
narrow rights-<strong>of</strong>-way. May<br />
allow bus lanes or<br />
transitways to fit where<br />
otherwise infeasible.<br />
Clear designation<br />
<strong>of</strong> exclusive<br />
running ways can<br />
reduce unauthorized<br />
use.<br />
Precision docking<br />
allows level<br />
boarding and thus<br />
reduces boarding<br />
and alighting<br />
delay.<br />
Markings highlight that BRT<br />
running ways are a special<br />
reserved treatment. Attractive<br />
markings or pavement coloring<br />
can enhance the system’s visual<br />
image.<br />
Guidance provides a smoother<br />
ride, enhancing image.<br />
Clear designation <strong>of</strong><br />
exclusive running ways<br />
can reduce entry <strong>of</strong><br />
non-BRT vehicles and<br />
pedestrians.<br />
Curb guidance permits<br />
safer operation at higher<br />
speeds in narrow<br />
corridors.<br />
Clear designation <strong>of</strong><br />
exclusive running<br />
ways may reduce<br />
unauthorized use<br />
and thus increase<br />
throughout.<br />
Guidance may<br />
increase throughput<br />
through reduced<br />
running time and<br />
boarding delay.<br />
Guidance systems can<br />
reduce the horizontal gap<br />
between vehicles and<br />
stations, facilitating boarding<br />
for all passengers, but<br />
especially for passengers<br />
who use wheelchairs or<br />
other mobility aids.<br />
2-11
Major Elements <strong>of</strong> BRT<br />
2-12<br />
Running Way<br />
Location<br />
• On-Street<br />
• Off-Street<br />
Level <strong>of</strong><br />
<strong>Transit</strong> Priority<br />
On-Street<br />
• Queue Jumper<br />
• Arterial Bus Lane<br />
Off-Street<br />
• At-Grade<br />
<strong>Transit</strong>way<br />
• Grade<br />
Separated<br />
<strong>Transit</strong>way<br />
Running Way<br />
Marking<br />
• Signage &<br />
Pavement Markings<br />
• Raised Lane<br />
Delineators<br />
• Pavement Color &<br />
Material<br />
Running Way<br />
Guidance Type<br />
• Curb Guidance<br />
• Single Rail Guidance<br />
• Optical Guidance<br />
Off-street running ways<br />
can speed service and<br />
thus attract riders, but<br />
they may not be well<br />
located.<br />
Exhibit 2-1B: Summary <strong>of</strong> Effects <strong>of</strong> Running Way Elements on System Benefits<br />
Higher Ridership<br />
Priority measures can<br />
increase ridership to the<br />
extent that they increase<br />
service quality.<br />
Grade-separated<br />
transitways may attract<br />
more riders by ensuring<br />
higher speeds and safety<br />
from accidents with<br />
unauthorized vehicles.<br />
Running way markings<br />
help ensure compliance<br />
with priority restrictions,<br />
thus reducing delays and<br />
the potential for<br />
accidents, which may<br />
damage rider perception<br />
<strong>of</strong> service.<br />
Guidance can help<br />
improve travel times,<br />
which may bring higher<br />
ridership.<br />
Capital<br />
Cost-Effectiveness<br />
Newly-created <strong>of</strong>f-street<br />
running ways are expensive and<br />
thus need high ridership to<br />
justify their cost.<br />
Costs vary enormously,<br />
depending on type <strong>of</strong> priority<br />
treatment. In general, greater<br />
levels <strong>of</strong> transit priority correlate<br />
with higher costs.<br />
Costs vary enormously,<br />
depending on type <strong>of</strong> priority<br />
treatment. In general, greater<br />
levels <strong>of</strong> transit priority correlate<br />
with higher costs.<br />
Costs vary enormously,<br />
depending on type <strong>of</strong> priority<br />
treatment. In general, greater<br />
levels <strong>of</strong> transit priority correlate<br />
with higher costs.<br />
System Performance<br />
Operating<br />
Cost-Efficiency<br />
Higher travel speeds<br />
greatly reduce hourly<br />
operating costs.<br />
However, <strong>of</strong>f-street<br />
rights-<strong>of</strong>-way will<br />
increase maintenance<br />
costs compared to<br />
shared infrastructure.<br />
The major cost is<br />
additional enforcement.<br />
Faster speed and<br />
more riders.<br />
The major cost is<br />
additional enforcement.<br />
The major cost is<br />
additional enforcement.<br />
<strong>Transit</strong>-Supportive<br />
Land Development<br />
Off-street running ways generally <strong>of</strong>fer<br />
more opportunities for development <strong>of</strong><br />
new areas. On-street running ways may<br />
better promote redevelopment <strong>of</strong><br />
existing urban areas. On-street project<br />
that include streetscape and/or utility<br />
renovations can attract developers.<br />
More substantial running way investments<br />
may attract developers by<br />
indicating permanence and a<br />
high-quality image.<br />
More permanent running way<br />
investments tend to attract more<br />
development.<br />
Affects only through-service quality.<br />
Affects only through-service quality<br />
Environmental Quality<br />
New <strong>of</strong>f-street running ways<br />
such as busways will require<br />
considerable construction and<br />
environmental permitting.<br />
Off-street running ways may be<br />
able to isolate noise away from<br />
populated areas.<br />
Affects primarily throughservice<br />
quality. Separated<br />
running ways may permit<br />
more landscaping and bike and<br />
pedestrian paths.<br />
Grade-separated transitways<br />
will allow higher average<br />
speeds with reduced stopping,<br />
which lowers emissions.<br />
Affects only through-service<br />
quality. Certain distinctive<br />
pavement markings and<br />
colors can also create a more<br />
attractive visual impact.<br />
Curb guidance can minimize<br />
need for widening rights-<strong>of</strong>way.<br />
Other effects throughservice<br />
quality.
Planning and Implementation Issues<br />
Implementation Issues During Planning<br />
and Project Development<br />
Availability <strong>of</strong> Right-<strong>of</strong>-Way<br />
The first decision in planning a BRT project is how running ways should be configured<br />
to serve the corridor and the activity centers within it. Existing expressways<br />
or HOV lanes could be used or improved, or new transitways could be created,<br />
depending on the availability <strong>of</strong> suitable right-<strong>of</strong>-way. In most metropolitan<br />
areas, only a very limited number <strong>of</strong> possible locations for new transitways exist.<br />
Disused railway alignments are the most common locations and can provide<br />
higher speeds, with the potential to link the right-<strong>of</strong>-way with adjacent land uses<br />
and activity centers. Expressways with HOV lanes and grade-separated transitways<br />
will generally provide much higher speeds. However, using such rights-<strong>of</strong>way<br />
may increase route distance or walking time if they are not located near<br />
most origins and destinations. Without right-<strong>of</strong>-way for <strong>of</strong>f-street running ways,<br />
existing roadways would need to be incorporated into the BRT network.<br />
Public/Political Acceptance <strong>of</strong> Priority Measures<br />
Priority measures such as bus lanes on arterials or expressways require dedicating<br />
some space to transit and restricting general traffic. Where candidate bus<br />
lanes are already open to all traffic, it is <strong>of</strong>ten politically difficult to change their<br />
use. Creating bus lanes by adding to the roadway or expressway is more politically<br />
acceptable but can be expensive if the corridor does not have additional<br />
width (such as a median) that can be easily converted. The use <strong>of</strong> curb-guided<br />
buses can minimize the width requirements and also eliminate the problem <strong>of</strong><br />
unauthorized use. Queue jumpers and transit signal priority are less visible and<br />
may be more readily accepted, unless they lead to a significant degradation in<br />
intersection performance.<br />
Even when heavily used (e.g., one bus every two minutes), bus lanes can look<br />
empty compared to adjacent congested lanes. This appearance makes it politically<br />
difficult to create, maintain, and enforce exclusive bus lanes in congested areas,<br />
which are precisely the places they are most needed. Permitting certain other<br />
authorized vehicles to use the lanes, such as minibuses, taxis, motorcycles, and<br />
bicycles, may reduce this image problem without eliminating the benefits. Short<br />
stretches <strong>of</strong> bus lanes, particularly contraflow lanes, may provide a substantial<br />
share <strong>of</strong> the benefits without the appearance <strong>of</strong> wasting urban road space.<br />
Implementation Issues During Operation<br />
Major Elements <strong>of</strong> BRT<br />
Enforcement<br />
Maintaining exclusive bus lanes usually require police enforcement. Less enforcement<br />
may be needed when such lanes are visually distinct from general lanes<br />
and when violations are more noticeable. Enforcement generally requires the<br />
cooperation <strong>of</strong> a police force, <strong>of</strong>ten not under the control <strong>of</strong> the transit agency.<br />
Fines need to be high enough to deter violations with a sustainable amount <strong>of</strong><br />
enforcement activity. Physical barriers and other design measures to improve<br />
compliance must conform with standards such as the MUTCD and state highway<br />
design manuals. Enforcement strategies frequently must also accommodate<br />
the operation <strong>of</strong> vehicles from other transit agencies and from emergency services<br />
such as police, ambulance, and fire services. Busways, including those onstreet<br />
that are designed for curb-guided buses, are too narrow to be used by<br />
unauthorized traffic and therefore eliminate the need for policing.<br />
Intersection Conflicts<br />
<strong>Transit</strong>ways with at-grade intersections may increase the risk for collisions, generally<br />
from cross traffic failing to obey traffic signals. One source <strong>of</strong> this problem<br />
comes from motorists traveling on the cross street who fail to recognize that<br />
an intersection is ahead, possibly because a busway intersection may be smaller<br />
or less noticeable than many signalized urban intersections. The other source<br />
comes from motorists traveling on a street parallel to the busway who turn into<br />
the cross street and do not expect another cross street (the transitway) close to<br />
the major street. Use <strong>of</strong> crossing gates, as used on some light rail systems, may<br />
be considered, although such a solution may not conform to current practice.<br />
Other safety devices such as separate traffic signal displays may also be considered.<br />
Separate traffic signal displays, with proper phasing can be helpful.<br />
Experience with Brt running Ways<br />
Exhibit 2-2A and 2-2B present an overview <strong>of</strong> worldwide BRT systems with onstreet<br />
running ways and <strong>of</strong>f-street running ways, respectively.<br />
Among the cities included here, those in the U.S. are significantly more likely<br />
to employ an on-street running way with limited priority treatments. However,<br />
since the publication <strong>of</strong> the previous edition <strong>of</strong> ”Characteristics <strong>of</strong> BRT,” several<br />
U.S. projects with significant segments <strong>of</strong> on-street or <strong>of</strong>f-street dedicated running<br />
ways have opened (in part or in full), including the Los Angeles Orange Line,<br />
Cleveland HealthLine, the Boston Silver Line Waterfront service, and the EmX in<br />
2-13
Major Elements <strong>of</strong> BRT<br />
Eugene, Oregon. Of the 13 U.S. systems that operate exclusively on-street, most<br />
have very little or dedicated running way components, and few use queue jumpers.<br />
Las Vegas and Cleveland are the only systems to incorporate a running way<br />
lateral guidance technology; Las Vegas’ optical guidance system however, is no<br />
longer activated.<br />
In contrast, almost all <strong>of</strong> systems in the rest <strong>of</strong> the world have some <strong>of</strong>f-street<br />
component. The European systems typically combine on- and <strong>of</strong>f-street running<br />
ways, and, as such, operate primarily at-grade. BRT systems in Latin America,<br />
Australia, New Zealand, and China are more likely to operate <strong>of</strong>f-street for all or<br />
most <strong>of</strong> their routes, with both at-grade and grade-separated operation. Lateral<br />
guidance is most commonly used in Europe; <strong>of</strong> the other global systems, only<br />
Adelaide also uses a guidance technology. Finally, while BRT outside the U.S. is<br />
more likely to allow vehicle passing, it is still a minority <strong>of</strong> systems overall that<br />
have this capability.<br />
2-14<br />
Running Way Description<br />
Number <strong>of</strong> Routes<br />
Total System Route Miles<br />
• Mixed Flow Lanes<br />
• Exclusive Bus Lanes<br />
Queue Jumpers<br />
Running Way Marking Type<br />
Lateral Guidance Type<br />
Exhibit 2-2A: Experience with BRT Running Ways—On-Street-Only Projects<br />
Albuquerque<br />
Rapid Ride –<br />
Red Line<br />
On-street<br />
1<br />
13.8<br />
13.1<br />
0.7<br />
No<br />
Signage<br />
None<br />
Boston<br />
Silver Line<br />
Washington St<br />
On-street<br />
1<br />
2.4<br />
0.2<br />
2.2<br />
No<br />
Signage, striping<br />
None<br />
Chicago<br />
Express<br />
On-street<br />
3<br />
(reported data)<br />
36.7<br />
36.7<br />
No<br />
None<br />
None<br />
Cleveland<br />
Healthline<br />
On-street<br />
1<br />
7.1<br />
2.7<br />
4.4<br />
No<br />
Signage,<br />
Rumble<br />
Strips<br />
Mechanical<br />
Eugene<br />
EmX Green Line<br />
(Franklin Corridor)<br />
On-street<br />
1<br />
4<br />
1.4<br />
2.5<br />
Yes<br />
Raised delineators,<br />
pavement coloring,<br />
markings<br />
Plastic Striping<br />
Honolulu<br />
City<br />
Express<br />
On-street<br />
2<br />
27<br />
27<br />
No<br />
None<br />
None<br />
Kansas City<br />
MAX<br />
On-street<br />
1<br />
6<br />
6<br />
Along some<br />
segments at certain<br />
times <strong>of</strong> day<br />
No<br />
Pavement<br />
markings, signage<br />
None<br />
Las Vegas<br />
North Las<br />
Vegas MAX<br />
On-street<br />
1<br />
7.5<br />
3<br />
4.5<br />
One location<br />
Signage,<br />
striping<br />
Optical, no<br />
longer in use
Running Way Description<br />
Number <strong>of</strong> Routes<br />
Total System Route Miles<br />
• Mixed Flow Lanes<br />
• Exclusive Bus Lanes<br />
Queue Jumpers<br />
Running Way Marking Type<br />
Lateral Guidance Type<br />
Exhibit 2-2A: Experience with BRT Running Ways—On-Street-Only Projects (cont’d.)<br />
Los Angeles<br />
Metro<br />
Rapid<br />
On-street<br />
19<br />
229<br />
(as <strong>of</strong> 2007)<br />
229<br />
(as <strong>of</strong> 2007)<br />
Yes<br />
None<br />
None<br />
Oakland<br />
San Pablo<br />
Avenue Rapid<br />
On-street<br />
1<br />
14<br />
14<br />
No<br />
None<br />
None<br />
Sacramento<br />
Ebus<br />
On-street<br />
1<br />
12<br />
8<br />
4<br />
One location<br />
None<br />
None<br />
San Jose<br />
Rapid 522<br />
On-street<br />
1<br />
25<br />
25<br />
Two locations<br />
None<br />
None<br />
Santa Monica<br />
Lincoln Rapid<br />
On-street<br />
1<br />
10.7<br />
10.7<br />
No<br />
Signage<br />
None<br />
York Region, Ontario<br />
VIVA<br />
On-street<br />
5<br />
50<br />
50<br />
Some bus-only<br />
intersection lanes<br />
No<br />
None<br />
None<br />
Major Elements <strong>of</strong> BRT<br />
Hangzhou<br />
Line B1<br />
On-street<br />
1<br />
6.2<br />
6.2<br />
No<br />
Striping<br />
None<br />
2-15
Major Elements <strong>of</strong> BRT<br />
2-16<br />
Running Way Description<br />
Number <strong>of</strong> Routes<br />
Total System Route Miles<br />
• On-Street Mixed Flow Lanes<br />
• On-Street Exclusive Bus Lanes<br />
• Off-Street Mixed Flow<br />
• Off-Street Reserved Bus Lanes<br />
• At-Grade <strong>Transit</strong>way<br />
• Grade-Separated <strong>Transit</strong>way<br />
Type <strong>of</strong> Grade Crossing Treatments<br />
Passing Capability<br />
Running Way Marking Type<br />
Lateral Guidance Type<br />
Exhibit 2-2B: Experience with BRT Running Ways—Projects With Off-Street Components<br />
Boston<br />
Silver Line<br />
Waterfront<br />
On- and <strong>of</strong>f-street<br />
3<br />
8.99.3<br />
6.3<br />
1.0 mile in tunnel used<br />
by 3 routes<br />
None<br />
Signage<br />
None<br />
Honolulu<br />
County<br />
Express<br />
On- and<br />
<strong>of</strong>f-street<br />
1<br />
39<br />
18<br />
3.5 miles<br />
17.5 miles<br />
Using adjacent<br />
mixed-flow lanes<br />
Zipper lane<br />
concrete barrier<br />
None<br />
Los Angeles<br />
Orange Line<br />
On- and <strong>of</strong>f-street<br />
1<br />
14.5<br />
1<br />
13.5<br />
Traffic signals, signage<br />
Passing lane at each<br />
in-line station<br />
Separate ROW, signage,<br />
pavement<br />
None<br />
Miami<br />
South Dade<br />
Busway<br />
Off-street only<br />
1<br />
8<br />
8<br />
Traffic signals<br />
Bus pull-outs<br />
Separate ROW<br />
None<br />
Orlando<br />
LYMMO<br />
Off-street only<br />
1<br />
3<br />
3<br />
Traffic signals<br />
None<br />
Busway barrier,<br />
gray pavers<br />
None<br />
Phoenix<br />
RAPID<br />
On- and <strong>of</strong>f-street<br />
4<br />
75.3<br />
31.5<br />
31.5<br />
43.8<br />
None<br />
Bus pull-outs<br />
Signage<br />
None
Running Way Description<br />
Number <strong>of</strong> Routes<br />
Total System Route Miles<br />
• On-Street Mixed Flow Lanes<br />
• On-Street Exclusive Bus Lanes<br />
• Off-Street Mixed Flow<br />
• Off-Street Reserved Bus Lanes<br />
• At-Grade <strong>Transit</strong>way<br />
• Grade-Separated <strong>Transit</strong>way<br />
Type <strong>of</strong> Grade Crossing Treatments<br />
Passing Capability<br />
Running Way Marking Type<br />
Lateral Guidance Type<br />
Exhibit 2-2B: Experience with BRT Running Ways—Projects With Off-Street Components (cont’d.)<br />
East<br />
Busway<br />
Off-street<br />
only<br />
9.1<br />
0.4<br />
8.7<br />
Passing<br />
allowed<br />
Separate<br />
ROW<br />
None<br />
Pittsburgh Halifax Ottawa<br />
South<br />
Busway<br />
Off-street<br />
only<br />
4.3<br />
4.3<br />
Passing<br />
allowed<br />
Separate<br />
ROW<br />
None<br />
West<br />
Busway<br />
Off-street only<br />
5<br />
0.4<br />
4.6<br />
Signal priority<br />
(magnetic<br />
loop sensors)<br />
Passing<br />
allowed<br />
Separate<br />
ROW<br />
None<br />
Metrolink<br />
On- and<br />
<strong>of</strong>f-street<br />
Multiple<br />
23.2<br />
12.1<br />
0.5<br />
10.6<br />
None<br />
None<br />
Signage<br />
None<br />
<strong>Transit</strong>way<br />
On- and<br />
<strong>of</strong>f-street<br />
Multiple<br />
30.8<br />
2.1<br />
8.7<br />
1.2<br />
18.8<br />
Bus pull-outs<br />
Signage,<br />
pavement<br />
color<br />
None<br />
Bogotá<br />
Transmilenio<br />
Off-street only<br />
Multiple<br />
52<br />
52<br />
Bus pull-outs at<br />
many stations,<br />
some with two<br />
lanes<br />
Signage<br />
None<br />
Guayaquil<br />
Metrovia<br />
Off-street only<br />
10<br />
10<br />
No passing<br />
Signage<br />
None<br />
Major Elements <strong>of</strong> BRT<br />
Pereira<br />
Megabus<br />
Off-street only<br />
Multiple<br />
17 miles<br />
17 miles<br />
No Passing<br />
Signage<br />
None<br />
2-17
Major Elements <strong>of</strong> BRT<br />
2-18<br />
Running Way Description<br />
Number <strong>of</strong> Routes<br />
Total System Route Miles<br />
• On-Street Mixed Flow Lanes<br />
• On-Street Exclusive Bus Lanes<br />
• Off-Street Mixed Flow<br />
• Off-Street Reserved Bus Lanes<br />
• At-Grade <strong>Transit</strong>way<br />
• Grade-Separated <strong>Transit</strong>way<br />
Type <strong>of</strong> Grade Crossing Treatments<br />
Passing Capability<br />
Running Way Marking Type<br />
Lateral Guidance Type<br />
Exhibit 2-2B: Experience with BRT Running Ways—Projects With Off-Street Components (cont’d.)<br />
Utrecht<br />
Busway<br />
On- and <strong>of</strong>f-street<br />
3<br />
10.3<br />
3.5<br />
2.0<br />
4.8<br />
At-grade, underpass<br />
through<br />
roundabout,<br />
overpass canal<br />
None<br />
Signage, pavement<br />
markings and<br />
color<br />
None<br />
Adelaide<br />
Northeast<br />
Busway<br />
Off-street only<br />
7.46<br />
7.46<br />
Passing at<br />
interchanges due<br />
to single track<br />
Signage<br />
Mechanical guide<br />
Rollers on front<br />
axle<br />
Brisbane<br />
Southeast Busway<br />
Inner Northern<br />
Busway<br />
Off-street only<br />
2<br />
12<br />
8<br />
12<br />
Bus pull-outs at<br />
stations<br />
Signage<br />
None<br />
Sydney<br />
T-Ways<br />
Off-street only<br />
3<br />
34.3<br />
8.2<br />
26.1<br />
Mix <strong>of</strong> at-grade<br />
signals and<br />
grade<br />
separations<br />
Bus pull-outs at<br />
stations<br />
Signage<br />
Red Pavement<br />
None<br />
Auckland<br />
Northern<br />
Busway<br />
Off-street<br />
only<br />
3.7<br />
3.7<br />
N/A<br />
Bus pull-outs<br />
at stations<br />
Signage<br />
None<br />
Beijing<br />
Line 1 BRT<br />
Off-street only<br />
1<br />
10.3<br />
2.2<br />
8.1<br />
Mix <strong>of</strong> at-grade<br />
signals,<br />
overpasses and<br />
underpasses<br />
Multiple lanes<br />
None<br />
Kunming<br />
Busway<br />
Network<br />
Off-street<br />
only<br />
Multiple<br />
24.9<br />
24.9<br />
Signals<br />
None<br />
Striping<br />
None
statIons<br />
Description<br />
role <strong>of</strong> stations in Brt<br />
Stations form the critical link between the BRT system, its customers, and other<br />
public transit services <strong>of</strong>fered in the region. They also clearly represent the identity<br />
<strong>of</strong> a BRT system through both visual features and physical amenities. Stations,<br />
therefore, can play a significant role in distinguishing a BRT system from<br />
other public transit services, portraying a premium-type service while integrating<br />
with and enhancing the local environment.<br />
Because BRT generally serves high-demand corridors and has a limited number<br />
<strong>of</strong> stops, more customers per station can be expected compared to a typical<br />
local bus route. BRT stations must provide more comfort and amenities than<br />
standard bus stops, which in some communities have nothing more than a sign<br />
on a pole. As with rail stations, BRT stations should provide passenger comfort,<br />
passenger information, and a visible image <strong>of</strong> the system.<br />
Characteristics <strong>of</strong> stations<br />
Stations have seven primary characteristics:<br />
Station Location—Stations<br />
can be located on streets, adjacent to busways<br />
or expressways (“on-line”), or in transit centers, which serve more than<br />
one transit route and are typically <strong>of</strong>f-street.<br />
Station Type—The<br />
scale and scope <strong>of</strong> the station shelter architecture<br />
define the station type. There are varying categories <strong>of</strong> station types based<br />
on increasing size and complexity: simple shelter, enhanced shelter, station<br />
enclosure, station building, and intermodal transit center. The station type<br />
can convey the brand identity <strong>of</strong> the system and plays a role in distinguishing<br />
the BRT system from other public transit services.<br />
Passenger Amenities—Like<br />
rail stations, BRT stations typically have<br />
features to provide information about the route and the system, enhance<br />
passenger comfort and convenience, and enhance the safety and security <strong>of</strong><br />
the system. These features can also convey a brand identity and improve the<br />
image <strong>of</strong> transit, even for those who are not using the system.<br />
Curb Design—Curb<br />
design affects the ability <strong>of</strong> all customers to board and<br />
Major Elements <strong>of</strong> BRT<br />
alight, but particularly affects those who are mobility-impaired or who have<br />
strollers, bicycles, or luggage. Passengers traditionally board buses by stepping<br />
from a low curb up to the first step on the vehicle, then climbing additional<br />
steps. Given the widespread adoption <strong>of</strong> low-floor vehicles, boarding has<br />
become easier for all passengers. Platforms at the same height as vehicle floors<br />
can further enhance the customer experience and reduce dwell time. No-gap,<br />
no-step boarding and alighting can be created by increasing the platform<br />
height to meet the floor height and reducing the distance between stopped<br />
bus and curb. This approach is particularly effective when combined with<br />
pro<strong>of</strong> <strong>of</strong> payment fare collection, allowing boarding at all doors.<br />
Platform Layout—Platform<br />
length and the number <strong>of</strong> berthing spaces is<br />
a major element <strong>of</strong> station design. It affects how many vehicles can simultaneously<br />
serve a station and how passengers must position themselves along<br />
a platform to board a given service.<br />
Passing Capability—The<br />
ability <strong>of</strong> vehicles to pass each other can<br />
increase speed and reduce delay. Passing capability is important when the<br />
operating plan calls for express and local routes. When BRT vehicles operate<br />
on ordinary streets, passing is generally accomplished using adjacent general<br />
traffic lanes. With <strong>of</strong>f-street service such as an HOV lane or transitway, passing<br />
areas must be designed into the system, typically at stations.<br />
Station Access—Passengers<br />
access stations on foot, by bicycle, from a<br />
private vehicle, or from another transit service. With <strong>of</strong>f-street stations, particular<br />
consideration must be given to pedestrian and vehicle routes, as well<br />
as the provision <strong>of</strong> waiting and parking areas for motor vehicles and secure<br />
parking for bicycles. The provision <strong>of</strong> parking at BRT stations can reduce<br />
travel time for customers arriving by automobile or bicycle from outside the<br />
station area and can expand the reach <strong>of</strong> the system. If stations are located<br />
next to development such as shopping centers or <strong>of</strong>fice parks, parking areas<br />
can <strong>of</strong>ten serve both transit and adjacent land uses.<br />
station options<br />
station location<br />
Stations can be located on streets, adjacent to busways or expressways (“online”),<br />
or in transit centers, which serve more than one transit route and are<br />
typically <strong>of</strong>f-street.<br />
2-19
Major Elements <strong>of</strong> BRT<br />
station location<br />
On Street, Curb Adjacent<br />
In principle, stations can be located along any curb on a route<br />
served by BRT. The three possible types <strong>of</strong> on-street stops are<br />
near-side (with respect to the intersection), far-side, and midblock.<br />
All things being equal, far-side stops are generally more<br />
favorable, since the bus can leave the stop as soon as boarding<br />
is complete without waiting for the signal. Far-side stops also<br />
facilitate the use <strong>of</strong> transit signal priority. However, there are<br />
advantages <strong>of</strong> near-side stops, such as reducing the number<br />
<strong>of</strong> stops at a single intersection. Physical conditions, such as<br />
the location <strong>of</strong> driveways, storefronts, and trees, play a role in<br />
determining station location.<br />
On-Street, Island Platform<br />
The other configuration for on-street BRT operations is to<br />
serve an island platform, either with just one lane separated<br />
from the curb or in a center median. Such platforms serve BRT<br />
running ways that are not adjacent to the curb.<br />
2-20<br />
Basic Stop Melnea Station—<br />
Silver Line<br />
On-Street Island Platform in<br />
Curitiba—RIT<br />
ReAsons to Implement<br />
• Bus stops along a street can be located<br />
to serve any use on that street,<br />
minimizing walking time. Locating<br />
stations adjacent to the curb works<br />
with operation at the curb lane and<br />
in situations where buses have a<br />
combination <strong>of</strong> exclusive lanes and<br />
mixed flow lanes.<br />
• Serves BRT running ways that are not<br />
adjacent to the curb (either with flow<br />
or contraflow).<br />
• Separates station infrastructure more<br />
clearly from sidewalk pedestrian<br />
infrastructure.<br />
ConsIdeRAtIons/<br />
RequIRements<br />
• There is a temptation with the ease <strong>of</strong><br />
curb-adjacent stations to place stops<br />
anywhere someone might want to get<br />
<strong>of</strong>f, rather than increasing efficiency and<br />
service quality by keeping the distance<br />
between stops at least 1/4 mile (typically<br />
1/2 mile or more) for BRT service.<br />
• Building entrances set back from the<br />
street (as at shopping centers and <strong>of</strong>fice<br />
parks) increase walking distance.<br />
• Difficult to accommodate drop-<strong>of</strong>f areas<br />
or park-and-ride with on-street spots.<br />
• The transit agency generally does not<br />
control either the right-<strong>of</strong>-way or the<br />
wayside. Cooperation from other entities<br />
is necessary in designing, building,<br />
maintaining, and policing the roadway<br />
and the station area in a way favorable to<br />
transit service.<br />
• Development <strong>of</strong> pedestrian paths to the<br />
station requires consideration <strong>of</strong>:<br />
‒ protection from vehicular traffic<br />
‒ adequacy <strong>of</strong> access/egress for normal<br />
and peak loads and emergency conditions<br />
‒ compliance with accessibility guidelines<br />
• Median stations may require vehicles<br />
with left-side doors.<br />
• Station infrastructure should include<br />
safety features to protect from errant<br />
motorists
Off-Street, On-Line Station Adjacent to<br />
Land Uses<br />
When transitways are developed within their own freestanding<br />
rights-<strong>of</strong>-way or adjacent to parallel highways (rather than<br />
within them), they are served with on-line stations adjacent to<br />
land uses. At these stations, BRT vehicles stay on the running<br />
way when serving the station. Passengers have the option <strong>of</strong><br />
walking directly from the station platform to nearby neighborhoods<br />
or activity centers or connecting transit service.<br />
Off-Street, On-Line Station within<br />
Highway Right-<strong>of</strong>-Way<br />
On-line stations within highway right-<strong>of</strong>-way are similar to<br />
other on-line transitway stations but are separated from adjacent<br />
land uses by the physical infrastructure <strong>of</strong> a highway.<br />
Typically, they serve facilities such as HOV lanes. Greater allowance<br />
must be made for entrance ramps and merging areas<br />
due to the higher volume <strong>of</strong> expressway traffic. On-line stations<br />
can also be grade separated from the expressway. In this<br />
case, pedestrian bridges or underpasses are required for access<br />
to the station.<br />
Off-Street, Off-Line Station<br />
Off-line transitway stations place the station and passenger<br />
access on the side <strong>of</strong> highway infrastructure close to land uses.<br />
As they are located <strong>of</strong>f the main running way, serving these<br />
stations requires diverting BRT vehicles from the main route.<br />
Often, <strong>of</strong>f-line stations are transit centers that accommodate<br />
multiple routes. They may permit transfers from BRT service<br />
to local bus and other public transit modes, e.g., rail transit, or<br />
intercity bus and rail. <strong>Transit</strong> centers <strong>of</strong>ten have park-and-ride<br />
lots, drop-<strong>of</strong>f areas, bicycle parking, and taxi stands.<br />
Cost: $2 - $20 million per facility or higher (includes the cost<br />
<strong>of</strong> platforms, canopies, large station structure, passenger amenities,<br />
pedestrian access, auto access and facilities for all transit<br />
modes served; does not include s<strong>of</strong>t costs).<br />
Ottawa <strong>Transit</strong>way<br />
El Monte Busway<br />
Ottawa <strong>Transit</strong>way Intermodal<br />
Station<br />
ReAsons to Implement<br />
• Serves <strong>of</strong>f-street BRT running ways without<br />
unnecessary deviations with the most<br />
direct pedestrian connections to adjacent<br />
land uses.<br />
• On-line stations reduce the amount <strong>of</strong><br />
vehicle time spent away from the express<br />
facility. There is generally ample room to<br />
provide multiple bus berths, passenger<br />
amenities, and even car parking areas.<br />
• Stations can be designed to provide direct<br />
walking access to adjacent land uses.<br />
• Places passenger access closer to adjacent<br />
land uses without requiring walking across<br />
a highway.<br />
• Can serve as a downtown or regional hub<br />
for the entire system.<br />
• Provides space for access to multiple<br />
services, including BRT trunk or express<br />
service.<br />
• <strong>Transit</strong> centers, with their concentration<br />
<strong>of</strong> transit services providing many choices,<br />
have the greatest ability to influence land<br />
use decisions.<br />
Major Elements <strong>of</strong> BRT<br />
ConsIdeRAtIons/<br />
RequIRements<br />
• Attention to effective urban<br />
design linkages can enhance integration<br />
with surrounding urban<br />
districts or neighborhoods.<br />
• Stations adjacent to highways can<br />
act as buffers between highways<br />
and neighborhoods.<br />
• On-line stations are <strong>of</strong>ten further<br />
away from passenger destinations,<br />
given the location <strong>of</strong> potential<br />
transitways and existing expressways.<br />
• Off-street stations are generally<br />
much more expensive to build and<br />
maintain than on-street stations.<br />
• For stations built near expressways,<br />
traffic noise is a concern.<br />
• <strong>Transit</strong> centers may be the most<br />
effective when they combine the<br />
transfer and access functions with<br />
an important customer destination.<br />
Central Business Districts and<br />
regional shopping centers thus<br />
make good candidates for transit<br />
centers.<br />
• Generally requires a branching<br />
route structure for the main transitway<br />
facility.<br />
2-21
Major Elements <strong>of</strong> BRT<br />
Basic station types<br />
Station types are defined by the scale and scope <strong>of</strong> the infrastructure associated with<br />
the station shelter. In increasing order <strong>of</strong> scale, there are five basic BRT station types:<br />
Basic station types<br />
Simple Shelter<br />
A simple shelter is the simplest form <strong>of</strong> the five BRT station types. It consists <strong>of</strong> a “basic” transit stop with a simple shelter (<strong>of</strong>ten purchased “<strong>of</strong>f<br />
the shelf”) to protect waiting passengers from the weather. In general, this type <strong>of</strong> station has the lowest capital cost and provides the lowest<br />
level <strong>of</strong> passenger amenities.<br />
Cost: $15,000 - $20,000 per shelter (includes cost <strong>of</strong> shelter only; does not include cost <strong>of</strong> platform or s<strong>of</strong>t costs).<br />
Enhanced Shelter<br />
Enhanced BRT stations include enhanced shelters, which are <strong>of</strong>ten specially-designed for BRT to differentiate it from other transit stations<br />
and to provide additional features such as more weather protection and lighting. This BRT station type <strong>of</strong>ten incorporates additional design<br />
treatments such as walls made <strong>of</strong> glass or other transparent material, high-quality material finishes, and passenger amenities such as benches,<br />
trash cans, or pay phones. Enhanced shelters are <strong>of</strong>ten installed for on-street BRT applications to integrate with the sidewalk infrastructure.<br />
Cost: $25,000 - $35,000 per shelter (includes cost <strong>of</strong> the shelter only; does not include cost <strong>of</strong> platform or s<strong>of</strong>t costs).<br />
Station Enclosure<br />
Often based on a custom design, station enclosures are designed specifically for a BRT system and are fabricated <strong>of</strong>f site, allowing for identical<br />
and modular designs for multiple locations. The station enclosure may include level passenger boarding and alighting, a full range <strong>of</strong> passenger<br />
amenities including retail service, and a complete array <strong>of</strong> passenger information.<br />
Cost: $150,000 - $300,000 per station (lower-cost stations include cost <strong>of</strong> canopy, platform, station enclosure, and pedestrian access).<br />
Station Building<br />
The designated BRT building represents a large enclosure for passengers. Designs for station buildings are specific to each station location and<br />
<strong>of</strong>ten include enclosures for passengers waiting for both directions <strong>of</strong> travel, pedestrian passageways, accessibility features such as ramps and<br />
elevators, and grade-separated connections from one platform to another, as well as a full range <strong>of</strong> passenger amenities including retail service<br />
and a complete array <strong>of</strong> passenger information.<br />
Cost: $500,000 - $2.5 million per station (lower-cost stations include cost <strong>of</strong> canopy, platform, station enclosure, and pedestrian access;<br />
higher-cost stations are designed for higher ridership and include longer platforms and canopies, larger station structure, passenger amenities<br />
and roadway access; parking facility and s<strong>of</strong>t costs are not included.<br />
Intermodal Terminal or <strong>Transit</strong> Center<br />
The intermodal terminal or transit center is the most complex and costly <strong>of</strong> the BRT stations listed in this section. This type <strong>of</strong> BRT facility <strong>of</strong>ten<br />
will have level boarding and a host <strong>of</strong> amenities and will accommodate the transfers from BRT service to local bus and other public transit<br />
modes such as local rail transit, intercity bus, and intercity rail.<br />
Cost: $5 million - $20 million per facility or higher (includes the cost <strong>of</strong> platforms, canopies, large station structure, passenger amenities,<br />
pedestrian access, auto access, and transit mode for all transit modes served; does not include s<strong>of</strong>t costs).<br />
2-22<br />
San Pablo<br />
Rapid Bus Shelter<br />
Enhanced stop along<br />
East Busway in<br />
Pittsburgh<br />
Curitiba tube station<br />
<strong>Transit</strong> Center in<br />
Brisbane, Austrailia<br />
Intermodal Station<br />
along Miami-Dade<br />
Busway
Passenger amenities<br />
Passenger amenities can make the experience <strong>of</strong> approaching and waiting in stations<br />
attractive, comfortable, and convenient. There are a multitude <strong>of</strong> individual<br />
components that comprise passenger amenities. These can be classified into three<br />
general categories: passenger information amenities, passenger comfort and convenience<br />
amenities, and passenger security amenities. Often, these amenities are<br />
implemented as different suites <strong>of</strong> elements to create a complete experience for<br />
passengers.<br />
Passenger amenities<br />
Passenger Information Amenities<br />
Passenger information that can be provided at stations includes<br />
system name, system brand, route name or number,<br />
station name, route map, route hours or schedule, neighborhood<br />
map, and system map. Variable message signs can be<br />
used to display real-time arrival estimates or special notices.<br />
Passenger Comfort and Convenience<br />
Amenities<br />
Passenger amenities that increase physical comfort include<br />
newspaper boxes, drink and fare vending machines, trash<br />
containers, heating, cooling, and public telephones, as well as<br />
high-quality station and shelter materials and finishes, public<br />
art, and landscaping.<br />
Passenger Security/Amenities<br />
Passenger safety and security amenities include station lighting,<br />
public address systems, emergency telephones, alarms,<br />
and video camera monitoring (<strong>of</strong>ten through closed circuit<br />
television).<br />
Customer Information Display at<br />
bus stop in Boston<br />
Decorative tile flooring at a bus<br />
stop along the Orange Line<br />
Passenger Security Phone at bus stop<br />
ReAsons to Implement<br />
• Passenger information at a station is<br />
one <strong>of</strong> the basic means <strong>of</strong> communication<br />
between the transit agency and<br />
its customers. Accurate and complete<br />
information helps customers make appropriate<br />
decisions about transit trips<br />
and helps reduce anxiety.<br />
• Amenities can improve passenger<br />
comfort, particularly the quality <strong>of</strong><br />
the experience while waiting, which is<br />
frequently the least enjoyable part <strong>of</strong><br />
the transit trip. High-quality amenities<br />
can attract customers and improve the<br />
image <strong>of</strong> transit.<br />
• To improve safety and security, both<br />
actual and perceived.<br />
Major Elements <strong>of</strong> BRT<br />
ConsIdeRAtIons/<br />
RequIRements<br />
• Maintenance is required to make<br />
sure that the information is correct,<br />
current, and free <strong>of</strong> dirt and<br />
graffiti.<br />
• Amenities add both capital and<br />
maintenance costs. Poorly-maintained,<br />
non-functioning amenities<br />
do not improve the image <strong>of</strong><br />
public transit.<br />
• Passenger security amenities<br />
require institutions to support and<br />
enforce security as well as ongoing<br />
maintenance.<br />
2-23
Major Elements <strong>of</strong> BRT<br />
Curb Design<br />
Curb design affects the vertical and horizontal gap between the BRT vehicle<br />
and the platform. The Americans with Disabilities Act (ADA) Design Guidelines<br />
specify a maximum horizontal and vertical gap between vehicle and platform<br />
for new rail transit, but not for bus transit. The guidelines for rail state that the<br />
rail-to-platform height in new stations shall be coordinated with the floor height<br />
<strong>of</strong> new vehicles so that the vertical difference, measured when the vehicle is at<br />
rest, is within plus or minus 5/8 inch under normal passenger load conditions.<br />
For rapid rail, light rail, commuter rail, high speed rail, and intercity rail systems<br />
in new stations, the horizontal gap, measured when the new vehicle is at rest,<br />
shall be no greater than 3 inches (Americans with Disabilities Act Design Guidelines,<br />
http://www.access-board.gov/adaag/html/adaag.htm#tranfac).<br />
To provide rail-like service, BRT planners can seek to meet these guidelines. Reducing<br />
the vertical gap can be achieved by raising the platform height. Raised<br />
platforms can be used only where buses have a reasonably straight approach to<br />
the station. If a station is on a curving approach, some doors will be left with a<br />
wide horizontal gap. Tactile platform edges should be applied on any bus platform<br />
edge higher than 8 inches.<br />
Platforms higher than the standard height should be adopted when horizontal<br />
gaps can be reduced. Eliminating the vertical gap (by installing raised platforms)<br />
without ensuring that the horizontal gap has been eliminated at all doors<br />
is counterproductive. If the horizontal gap is too great, passengers will need to<br />
step from a raised platform to the street and then from the street onto the bus,<br />
producing considerably greater difficulty than standard height curbs. One approach<br />
to ensure that the horizontal gap is eliminated is to use a lateral guidance<br />
system, as described in the previous Running Ways section. Without a guidance<br />
system, it is necessary to use a sloped curb. Horizontal gaps most <strong>of</strong>ten occur<br />
because bus operators are trained to avoid expensive damage to tire sidewalls<br />
by avoiding contact with the curb; thus, they stay at least a few inches from the<br />
curb, and sometimes more. With a sloped curb, operators can be trained to approach<br />
closely without producing damage to the side <strong>of</strong> the vehicle.<br />
2-24
Curb Design<br />
Standard Curb Height<br />
The standard curb causes a vertical gap between the height <strong>of</strong> the<br />
station platform or the curb and the vehicle entry step or floor. The<br />
gap requires customers to step up to enter the BRT vehicle and step<br />
down to exit.<br />
Cost: $0<br />
Raised Curb<br />
A raised curb reduces the vertical gap between the platform and<br />
the vehicle floor while providing room for a fold-out wheelchair<br />
ramp. The raised curb platform height should be no less than 12<br />
inches above the height <strong>of</strong> the street or other running way. The<br />
raised curb will more closely match the height <strong>of</strong> BRT vehicle’s entry<br />
step or floor to accommodate near-level boarding.<br />
Cost: Requires an additional 6 inches <strong>of</strong> concrete depth.<br />
Level Curb<br />
Platforms level with vehicle floors (approximately 14 inches<br />
above the pavement for low-floor vehicles) facilitate boarding<br />
for wheelchairs, strollers, wheeled luggage, and people with<br />
mobility impairments and reduce boarding and alighting delay.<br />
Cost: Requires an additional 8 inches <strong>of</strong> concrete depth.<br />
Sloped Curb<br />
A smooth curb sloped correctly will prevent the base <strong>of</strong> the bus tire<br />
from scuffing the sidewall while still preventing the bus body from<br />
contacting the curb. Precast concrete curbs are sold overseas specifically<br />
for this purpose (Brett and Charcon xxxx). However, curbs<br />
with such a pr<strong>of</strong>ile can also be poured in place, the construction<br />
method used in most regions <strong>of</strong> the U.S. Existing BRT systems with<br />
sloped curbs include the Las Vegas MAX BRT, which was intended to<br />
use optical guidance to provide precision docking in connection with its<br />
raised platforms. The Eugene EmX uses smooth plastic edging to allow<br />
drivers to achieve precision docking at its raised platforms.<br />
Precast section <strong>of</strong><br />
sloped curb with<br />
marker bump<br />
(Charcon)<br />
!<br />
!<br />
!<br />
!<br />
ReAsons to Implement<br />
• This is the standard curb height; it<br />
must be used if an existing curb will<br />
not be modified.<br />
• Allows buses to sweep over curb<br />
and sidewalk without damage,<br />
facilitating bus maneuvers in tight<br />
geometries.<br />
• Reduces boarding time by facilitating<br />
boarding for walking passengers<br />
and reducing the likelihood <strong>of</strong><br />
deploying kneeling or ramps. A curb<br />
a few inches below the bus floor<br />
provides room for the thickness <strong>of</strong> a<br />
fold-out ramp. A vertical gap greater<br />
than 5/8-inch does not meet ADA<br />
Design Guidelines for rail transit.<br />
• Only this option will fully meet the<br />
ADA Design Guidelines standard for<br />
rail vehicles.<br />
• Level curbs reduce boarding time.<br />
• Allows drivers to position bus tires<br />
against curb without scraping bus<br />
body, thereby enabling a minimal<br />
horizontal gap without damage<br />
to the bus. No special guidance<br />
systems are required.<br />
Major Elements <strong>of</strong> BRT<br />
ConsIdeRAtIons/<br />
RequIRements<br />
• The step between curb and vehicle floor<br />
may delay boarding and alighting.<br />
• The vertical gap between curb and vehicle<br />
requires the use <strong>of</strong> buses with lifts or ramps<br />
to serve wheelchair passengers.<br />
• Platform must be newly-built or reconstructed<br />
and requires reconfiguration <strong>of</strong><br />
sidewalk infrastructure.<br />
• Platform must be newly-built or reconstructed<br />
and requires reconfiguration <strong>of</strong><br />
sidewalk infrastructure.<br />
• Must be sufficient room to taper platform<br />
to height <strong>of</strong> normal curb.<br />
• If no guidance system, a sloped curb must<br />
be used to permit drivers to come close<br />
enough so that wheelchair boarding is possible<br />
without the use <strong>of</strong> a ramp.<br />
• Curb must be newly installed. Drivers<br />
need to be trained to make contact with<br />
this special curb, which is contrary to their<br />
standard operating procedure.<br />
2-25
Major Elements <strong>of</strong> BRT<br />
Platform layout<br />
Platform layouts range from single-vehicle-length with a single berth (bus position),<br />
usually from 50 feet where only conventional 40-ft buses are used, to as<br />
long as 300 or more feet where multiple articulated buses can be accommodated.<br />
Platform layout<br />
Single-Vehicle-Length Platform<br />
A single vehicle length platform is the shortest platform<br />
length necessary for the entry and exit <strong>of</strong> one BRT vehicle at a<br />
time at a station.<br />
Extended Platform with Unassigned Berths<br />
Extended platforms usually accommodate no less than two<br />
vehicles and allow multiple vehicles to simultaneously load<br />
and unload passengers.<br />
Cost: Incremental cost will be a multiple <strong>of</strong> a single-vehiclelength<br />
platform based on the maximum number <strong>of</strong> vehicles<br />
accommodated.<br />
Extended Platform with Assigned Berths<br />
Extended platforms with assigned berths have all the features<br />
<strong>of</strong> extended platforms but also assign vehicles serving specific<br />
routes to specific positions on the platform. This is the longest<br />
<strong>of</strong> the two platform length options.<br />
Cost: Incremental cost will be a multiple <strong>of</strong> a single-vehiclelength<br />
platform based on the maximum number <strong>of</strong> vehicles<br />
accommodated.<br />
2-26<br />
Single length platform on<br />
Miami-Dade transitway<br />
Extended bus platform on<br />
Miami-Dade <strong>Transit</strong>way<br />
Extended bus platform with<br />
assigned berths on Miami-Dade<br />
<strong>Transit</strong>way<br />
ReAsons to Implement<br />
• Minimizes required space and cost,<br />
especially on streets where driveways<br />
and storefronts limit available<br />
platform space.<br />
• Since more than one vehicle at<br />
a time can be accommodated,<br />
multiple routes or local and express<br />
service or vehicles that have become<br />
bunched can more easily use<br />
BRT stations and running ways.<br />
• Generally used at major transfer<br />
areas or centers, such as where bus<br />
routes are feeding an express route<br />
or rail rapid transit.<br />
• Easier for passengers to understand<br />
where to board if multiple routes<br />
serve the same stations.<br />
ConsIdeRAtIons/<br />
RequIRements<br />
• If more than one bus arrives at a time, the<br />
second bus may have to wait for the first<br />
bus; this problem can be minimized by coordinating<br />
the schedules <strong>of</strong> multiple routes<br />
serving the same station and by taking appropriate<br />
measures to reduce bunching.<br />
• If on a street, can necessitate the loss <strong>of</strong><br />
more on-street parking.<br />
• With unassigned bays, multiple buses<br />
boarding simultaneously can be problematic.<br />
Passengers must run up and down<br />
the platform to find their bus. Dynamic<br />
signs can be installed telling passengers in<br />
advance what position (or berth) their bus<br />
will be located.<br />
• Can take a significant amount <strong>of</strong> space,<br />
and is generally not suitable for on-street<br />
locations.<br />
• Requires passing capability at stations
Passing Capability<br />
On busways or expressways with on-line stations, the ability <strong>of</strong> BRT vehicles to<br />
pass one another at stations is especially important for at least three reasons:<br />
in mixed flow operation, where travel times are highly variable<br />
in cases where multiple types <strong>of</strong> routes (local and express) operate along the<br />
same running way and serve uneven levels <strong>of</strong> demand or where buses operate<br />
at short headways<br />
where BRT vehicles operate at high frequencies<br />
In both cases, BRT vehicles can delay others operating on the same running way if<br />
there is no ability to pass.<br />
Passing Capability<br />
Bus Pull-Outs<br />
For both arterial BRT operation and exclusive lanes, bus pullouts<br />
at stations allow buses to pull out <strong>of</strong> the BRT running<br />
way, and thus out <strong>of</strong> the way <strong>of</strong> BRT vehicles that need to pass<br />
vehicles stopped at the stations. The bus must yield to traffic<br />
when returning to the travel lane, sometimes resulting in<br />
substantial delay.<br />
Cost: $0.05 million - $0.06 million per pull-out (per station<br />
platform)<br />
Passing Lanes at Stations<br />
Passing lanes at stations allow a vehicle in express service to<br />
pass through a station at full speed or a vehicle to overtake<br />
stopped buses.<br />
Cost: $2.5 - $2.9 million per lane mile (excluding ROW acquisition)<br />
Bus pullout at stop in New<br />
Zealand<br />
Passing lane at station in Ottawa<br />
ReAsons to Implement<br />
• Most appropriate solution for onstreet<br />
locations where it is expected<br />
that other buses, or general traffic,<br />
will be passing the stopped bus.<br />
• Permits flexible operating plans such<br />
as express service and skip-stop service,<br />
permits late vehicles to return to<br />
schedule, and facilitates emergency<br />
vehicle use <strong>of</strong> a transitway.<br />
• Promotes move reliable service,<br />
reducing congestion and queues at<br />
stations.<br />
Major Elements <strong>of</strong> BRT<br />
ConsIdeRAtIons/<br />
RequIRements<br />
• The need for BRT vehicles to merge into traffic<br />
may motivate the need for a “yield to bus”<br />
law in the local jurisdictions.<br />
• Requires greater right-<strong>of</strong>-way width. The<br />
amount <strong>of</strong> cross-section needed for a passing<br />
lane can be minimized by staggering the stations<br />
serving opposite directions so they are<br />
not directly across from each other.<br />
2-27
Major Elements <strong>of</strong> BRT<br />
station access<br />
When designing <strong>of</strong>f-street transit stops, it is important to consider pedestrian<br />
access from adjacent sites as well as connections through the roadway network<br />
to adjacent neighborhoods by automobile or non-motorized modes. Consideration<br />
should also be given to parking and drop-<strong>of</strong>f.<br />
station access<br />
Pedestrian <strong>Link</strong>ages<br />
Pedestrian linkages such as sidewalks, overpasses, and pedestrian<br />
paths are important to establish physical connections<br />
from BRT stations to adjacent sites, buildings, and<br />
activity centers.<br />
Cost: Typically included in the base cost for designated stations<br />
and intermodal terminals or transit centers.<br />
Park-and-Ride Facilities<br />
Park-and-ride lots allow stations, including those without significant<br />
development, to attract passengers from a wide area around<br />
BRT stations. Because BRT services can be easily routed <strong>of</strong>f their<br />
primary running way, regional park-and-ride facilities need not be<br />
adjacent to the primary BRT running way. This arrangement can<br />
link BRT service with existing parking lots, potentially reducing<br />
capital investment costs.<br />
2-28<br />
Pedestrian linkage to shopping<br />
center in Ottawa from transit<br />
station<br />
Park-and-ride signage<br />
ReAsons to Implement<br />
• Direct links to buildings or weatherprotected<br />
passageways provide more<br />
attractive access for passengers.<br />
• Provides access to BRT for those not<br />
near the BRT line or stations.<br />
Effects <strong>of</strong> Station Elements on System Performance and System Benefits<br />
Exhibits 2-3A and 2-3B summarize the links between station elements and the BRT<br />
performance indicators and system benefits identified in Chapter 1. These links<br />
are explored further in Chapters 3 and 4.<br />
ConsIdeRAtIons/<br />
RequIRements<br />
• Developing attractive pedestrian linkages<br />
requires coordination with adjacent land<br />
uses and property owners.<br />
• Surface parking adjacent to BRT stops can<br />
deter pedestrian access and limit opportunities<br />
for development.<br />
• Parking structures are more compact, but<br />
greatly add to the construction costs.<br />
• Facilities located away from a transitway<br />
may require buses to leave the transitway<br />
for a considerable distance, thus slowing<br />
service for through riders.
Station Location<br />
and Type<br />
• On-Street, No<br />
Shelter<br />
• On-Street, Simple<br />
• On-Street,<br />
Enhanced<br />
• Off-Street, On-Line<br />
Station<br />
• Off-Street<strong>Transit</strong><br />
Center<br />
Passenger<br />
Amenities<br />
•Information<br />
•Comfort and<br />
Convenience<br />
•Security<br />
Curb Design<br />
• Standard Curb<br />
Height<br />
• Raised Curb<br />
• Level Curb<br />
• Sloped Curb<br />
Exhibit 2-3A: Summary <strong>of</strong> Effects <strong>of</strong> Station Elements on System Performance<br />
Travel Time Savings Reliability<br />
Stops adjacent to the<br />
running way minimize<br />
delay from circuitous<br />
routing. <strong>Transit</strong> centers<br />
can reduce wait and<br />
transfer times between<br />
transit services.<br />
Off-street or <strong>of</strong>f-line<br />
stations may increase<br />
transfer times to other<br />
transit services.<br />
Complete, accurate, and<br />
up-to-date information<br />
reduces real and<br />
perceived waiting time.<br />
Reduced vertical and<br />
horizontal gaps facilitate<br />
boarding and reduce<br />
dwell time.<br />
Real-time info<br />
may provide<br />
perception <strong>of</strong><br />
reliability.<br />
Reduced vertical<br />
and horizontal<br />
gaps facilitate<br />
boarding and<br />
reduce dwell time<br />
variability,<br />
particularly if<br />
wheelchair ramps<br />
are not required.<br />
Identity and Image<br />
More distinct stations enhance<br />
the system’s brand identity and<br />
present a “high quality” image.<br />
Sta-tions can be architecturally<br />
noteworthy spaces, especially<br />
station buildings. On-street<br />
stations should complement and<br />
enhance public street-scapes.<br />
Off-street stations may mitigate<br />
noise and vibration impacts.<br />
They also provide opportunities<br />
for landscaping and sound walls.<br />
Amenities make customers feel<br />
comfortable and well-served.<br />
They can reinforce a high quality<br />
image.<br />
Level platforms present an image<br />
<strong>of</strong> advanced technology, similar<br />
to rail.<br />
System Performance<br />
Safety and Security Capacity<br />
Off-street stations may raise<br />
safety concerns if they are<br />
isolated from pedestrian and<br />
motor traffic. <strong>Transit</strong> centers and<br />
larger stops concentrate activity<br />
and thus make bus stops feel<br />
safer. On-street stations need to<br />
protect pas-sengers from<br />
motorists. Station designs can<br />
en-hance security by using<br />
transparent materials and<br />
ensuring good sightlines.<br />
Lighting, video surveillance, and<br />
positive image contribute to<br />
safety.<br />
Minimizing vertical and<br />
horizontal clearance may reduce<br />
tripping during boarding and<br />
alighting and may facilitate faster<br />
unloading during an emergency.<br />
Larger stations<br />
increase<br />
loading<br />
capacity.<br />
Reduced dwell<br />
times resulting<br />
from faster level<br />
boarding<br />
increase station<br />
throughput.<br />
Major Elements <strong>of</strong> BRT<br />
Accessibility<br />
On-street station locations,<br />
especially those where station<br />
plat-forms are adjacent to<br />
street curbs, tend to have<br />
easier access. More complex<br />
station types – station<br />
enclosures, station build-ings,<br />
and intermodal terminals or<br />
transit centers – tend to<br />
re-quire additional de-sign<br />
attention to ensure barrierfree<br />
access and ease <strong>of</strong> entry<br />
and transfers.<br />
Information amenities such as<br />
maps and real-time information<br />
can incorporate<br />
accommodations for people<br />
with vision and people with<br />
hearing impairments<br />
(real-time variable message<br />
signs).<br />
Curb designs that minimize<br />
the vertical gap between<br />
station platform and vehicle<br />
floors facilitate boarding for<br />
all groups. Level boarding<br />
treatments allow for people<br />
using wheelchairs to board<br />
without ramps. Use <strong>of</strong><br />
detectable warning strips at<br />
boarding and alighting<br />
demarcations is an effective<br />
limit setting measure and<br />
provides delineators <strong>of</strong> the<br />
station areas.<br />
2-29
Major Elements <strong>of</strong> BRT<br />
2-30<br />
Platform Layout<br />
• Single Vehicle<br />
Length<br />
• Extended with<br />
Unassigned Berths<br />
• Extended with<br />
Assigned Berths<br />
Passing Capability<br />
• Bus Pullouts<br />
• Passing Lanes at<br />
Stations<br />
Station Access<br />
• Pedestrian <strong>Link</strong>ages<br />
• Park-and-Ride<br />
Exhibit 2-3A: Summary <strong>of</strong> Effects <strong>of</strong> Station Elements on System Performance (cont’d.)<br />
Travel Time Savings Reliability<br />
Allowing multiple<br />
vehicles to load and<br />
unload facilitates lower<br />
station clearance time.<br />
Passing at stations<br />
allows for express routes<br />
and minimizes delays at<br />
stations. Bus pullouts in<br />
mixed traffic situations<br />
lead to delays.<br />
Reduced vertical and<br />
horizontal gaps facilitate<br />
boarding and reduce<br />
dwell time.<br />
Allowing multiple<br />
vehicles to load<br />
and unload<br />
reduces potential<br />
delays.<br />
Passing at stations<br />
allows for<br />
schedule<br />
maintenance and<br />
recovery.<br />
Identity and Image<br />
Long platforms with unassigned<br />
berths create confusion for<br />
passengers.<br />
Treatments to high-light station<br />
access make transit seem open,<br />
welcoming, and easy to use.<br />
System Performance<br />
Safety and Security Capacity<br />
Better pedestrian linkages<br />
facilitate integration with<br />
communities.<br />
Longer<br />
platforms limit<br />
queuing delays<br />
for vehicles<br />
waiting to load<br />
and permit a<br />
variety <strong>of</strong><br />
service options.<br />
Passing<br />
capability limits<br />
queuing delays<br />
at stations and<br />
permits a<br />
variety <strong>of</strong><br />
service options.<br />
Accessibility<br />
Platform layouts with<br />
assigned and well-signed<br />
berths create a system that it<br />
is easy to understand and<br />
navigate.<br />
Good integration to<br />
surrounding infrastructure,<br />
especially pedestrian linkages,<br />
allows barrier-free access<br />
to/from the station and<br />
between transit elements and<br />
modes.
Station Location<br />
and Type<br />
• On-Street, No<br />
Shelter<br />
• On-Street, Simple<br />
• On-Street,<br />
Enhanced<br />
• Off-Street, On-Line<br />
Station<br />
• Off-Street<strong>Transit</strong><br />
Center<br />
Passenger<br />
Amenities<br />
•Information<br />
•Comfort and<br />
Convenience<br />
•Security<br />
Curb Design<br />
• Standard Curb<br />
Height<br />
• Raised Curb<br />
• Level Curb<br />
• Sloped Curb<br />
Exhibit 2-3B: Summary <strong>of</strong> Effects <strong>of</strong> Vehicle Elements on System Performance<br />
System Performance<br />
Higher Ridership<br />
Stations that are well-located and<br />
comfortable will maximize<br />
ridership, regardless <strong>of</strong> their type.<br />
Smaller stations may reduce<br />
capacity, thus limiting ridership.<br />
Larger, more distinctive or more<br />
attractive stations may increase<br />
ridership by enhancing the<br />
system brand and image.<br />
Passenger comfort and information<br />
can shape perceptions <strong>of</strong> the<br />
service and thus have a large<br />
effect on use. Passenger<br />
information may attract riders by<br />
making the sys-tem easier to use.<br />
May affect ridership by reducing<br />
dwell time and improving<br />
convenience.<br />
Capital Cost<br />
Effectiveness<br />
Off-street stations may<br />
have significant costs for<br />
infrastructure and land<br />
acquisition.<br />
Costs are very low<br />
compared to all other<br />
aspects <strong>of</strong> infrastructure.<br />
If system design calls for<br />
new or rebuilt curbs, there<br />
is a modest additional cost<br />
associated with building a<br />
raised, level, or sloped curb<br />
rather than standard.<br />
Operating<br />
Cost Efficiency<br />
Off-street stations will<br />
have significant<br />
maintenance costs.<br />
Keeping facilities clean<br />
and information<br />
up-to-date requires a<br />
commitment to<br />
maintenance.<br />
Reduced dwell time<br />
reduces operating<br />
cost.<br />
<strong>Transit</strong>-Supportive Land<br />
Development<br />
Off-street stations create greater opportunities<br />
for station-area development. More substantial<br />
stations may attract developers by demonstrating<br />
permanence and by improving the<br />
appearance <strong>of</strong> the streetscape. On-street<br />
stations should be designed to complement the<br />
streetscape. Large median stations can be a<br />
visual barrier to crossing the street, which is<br />
desired for devel-opment in urban environments.<br />
Affects primarily through-service quality.<br />
Security is important to attracting developer<br />
interest.<br />
Affects only through-service quality. A raised<br />
curb in a median lane can inhibit pedestrians<br />
crossing the street, which is desired for<br />
development in urban environments.<br />
Major Elements <strong>of</strong> BRT<br />
Environmental<br />
Quality<br />
Off-street stations will<br />
re-quire environmental<br />
permitting. Stations<br />
adjacent to highways can<br />
act as buffers between<br />
high-ways and neighborhoods.<br />
Traffic noise at<br />
the station may be a<br />
concern.<br />
Affects only throughservice<br />
quality.<br />
Affects only throughservice<br />
quality.<br />
2-31
Major Elements <strong>of</strong> BRT<br />
2-32<br />
Platform Layout<br />
• Single Vehicle<br />
Length<br />
• Extended with<br />
Unassigned Berths<br />
• Extended with<br />
Assigned Berths<br />
Passing Capability<br />
• Bus Pullouts<br />
• Passing Lanes at<br />
Stations<br />
Station Access<br />
• Pedestrian <strong>Link</strong>ages<br />
• Park-and-Ride<br />
Exhibit 2-3B: Summary <strong>of</strong> Effects <strong>of</strong> Vehicle Elements on System Performance (cont’d.)<br />
System Performance<br />
Higher Ridership<br />
Extended platforms can increase<br />
system capacity, which affects<br />
total ridership.<br />
Passing increases system capacity,<br />
which affects total ridership.<br />
Making walking, cycling, and<br />
motoring access quicker and<br />
more pleasant reduces a<br />
significant cost <strong>of</strong> transit, and<br />
thus will increase ridership.<br />
Capital Cost<br />
Effectiveness<br />
Land costs are largest<br />
factor.<br />
Modest increase in cost.<br />
Ranges from minimal<br />
(covered walkway) to high<br />
(parking structure).<br />
Operating<br />
Cost Efficiency<br />
Increased flexibility <strong>of</strong><br />
multiple berths may<br />
reduce operating cost.<br />
Increased flexibility<br />
may reduce operating<br />
cost.<br />
<strong>Transit</strong>-Supportive Land<br />
Development<br />
Close walking access to adjacent development<br />
sup-ports TOD. Park-and-ride lots can limit<br />
TOD opportunities around stations.<br />
Environmental<br />
Quality<br />
Many berths requires<br />
more impervious<br />
surface.<br />
Can decrease station<br />
dwell time and reduce<br />
emissions.<br />
Higher car use to access<br />
transit reduces air<br />
quality and energy<br />
benefits <strong>of</strong> transit.
Implementation Issues<br />
The flexible and diverse nature <strong>of</strong> BRT presents unique issues and challenges related<br />
to station implementation.<br />
Implementation Issues During Project Development<br />
Availability <strong>of</strong> Property<br />
Just as the availability <strong>of</strong> right-<strong>of</strong>-way is an issue in the implementation <strong>of</strong> running<br />
ways, the availability <strong>of</strong> physical property for stations is a key factor in station<br />
planning. On-street BRT routes using curb lanes (either general purpose lanes<br />
or exclusive bus lanes) typically serve stations sited on existing sidewalks. Clearance<br />
for pedestrian and wheelchair traffic must be accounted for in the design<br />
<strong>of</strong> stations on public sidewalks. In some cases, additional street right-<strong>of</strong>-way is<br />
required through either partial lane realignment or a sidewalk extension (“bulbout”).<br />
Planners must balance the needs <strong>of</strong> parking, general traffic lanes, and BRT<br />
stations. In exclusive running way sections, additional real estate is required to<br />
build full stations. In some cases, station platforms must fall on opposite sides <strong>of</strong><br />
the street due to right-<strong>of</strong>-way constraints.<br />
Pedestrian Access and Safety<br />
Care must be taken to minimize potential conflicts between pedestrians and<br />
BRT vehicles in and around stations. The need to develop a strong linkage for pedestrians<br />
(including those using wheelchairs) to adjacent communities will affect<br />
the site layout for BRT stations. Because station platforms typically are not much<br />
higher than the running way through the station, pedestrians may attempt to<br />
cross to the other side, risking a collision with an oncoming BRT vehicle. Conflicts<br />
between pedestrians and BRT vehicles may occur at crossings between BRT<br />
running ways and cross streets. Some BRT designs incorporate elements that<br />
minimize this conflict. For example, the Southeast Busway in Brisbane, Australia<br />
provides elevated passageways that are used to provide access to stations.<br />
Community Integration<br />
As the primary starting point for a transit trip, stations provide the first impression<br />
<strong>of</strong> the transit system and are the primary link between the system and its<br />
surrounding community. Station design and pedestrian linkages to the surrounding<br />
community are critical in conveying an identity for the BRT system. Two key<br />
considerations are important to consider in designing stations to integrate with<br />
the community:<br />
Major Elements <strong>of</strong> BRT<br />
Landscaping and Public Art—BRT<br />
system integration into an urban setting<br />
provides an opportunity to beautify the areas around running ways and<br />
stations with landscaping and other upgraded amenities such as lighting,<br />
sidewalks, street furniture, and public art including statues and other art<br />
objects.<br />
Planning and Zoning—Planning<br />
guidelines and zoning regulations define<br />
the intensity and character <strong>of</strong> the existing and potential development<br />
around a station. It is important, therefore, to ensure that planning and<br />
zoning laws permit stations, or future stations, to be integrated with transitsupportive<br />
development. Good transit service and higher densities tend to<br />
go together. Higher density development, particularly development designed<br />
with transit use in mind, will result in higher transit use. More transit<br />
ridership, in turn, supports better transit service.<br />
Advertising<br />
<strong>Transit</strong> agencies <strong>of</strong>ten permit advertising on their facilities to earn additional revenue.<br />
BRT station design that incorporates provisions for print or electronic advertising<br />
can enhance revenue generation for the operating agency. Some transit<br />
agencies have contracted with firms that provide transit shelters in exchange for<br />
advertising revenues.<br />
Implementation Issues During operation<br />
Security<br />
Station plans should account for the possibility <strong>of</strong> crime or other security threats.<br />
Common ways <strong>of</strong> deterring crime include a high level <strong>of</strong> general lighting, surveillance<br />
cameras and equipment, emergency call boxes, closed-circuit television<br />
monitoring, extensive spot illumination, and the use <strong>of</strong> transparent materials<br />
such as glass. Passive ways <strong>of</strong> incorporating security into the design focus on<br />
openness, high visibility, and intense lighting. Unobstructed sight lines enable<br />
BRT customers to view their surroundings and be viewed within and outside <strong>of</strong><br />
the facility.<br />
2-33
Major Elements <strong>of</strong> BRT<br />
Experience with Brt stations<br />
Exhibit 2-4 summarizes station characteristics found in over 50 BRT lines or systems<br />
operating in 37 cities around the world.<br />
With U.S. BRT systems, all station and stop types are well-represented, with<br />
almost all instituting a station design that provides a significant upgrade from<br />
standard bus service stops. Several U.S. systems use multiple station design types,<br />
either because the BRT running way incorporates several different configurations<br />
or because the station must visually complement a variety <strong>of</strong> streetscape<br />
environments. Few feature fully enclosed stations as the primary station design.<br />
Approximately one-third <strong>of</strong> the U.S. BRT lines included in Exhibit 2-4 use simple<br />
stations, and another third use enhanced stations. Roughly half incorporate at<br />
least one <strong>of</strong>f-street station or transit center; these may be enclosed, such as with<br />
the Boston Silver Line, but most are not. The least-used option is the basic stop,<br />
with only around one-quarter using this option, and most using it combination<br />
with more substantial station infrastructure.<br />
Most U.S. BRT stations <strong>of</strong>fer at least a basic level <strong>of</strong> passenger amenities such<br />
as route maps, schedule information, seating, and trash containers. Off-street<br />
BRT systems with more complex stations, such as in Pittsburgh and Los Angeles,<br />
include additional amenities such as seating, public address systems, heating,<br />
and emergency telephones. Most U.S. stations still use standard height curbs;<br />
this is a function <strong>of</strong> the dominance <strong>of</strong> on-street, mixed traffic operations among<br />
U.S. BRT systems. Several cities that built dedicated guideways (both on and<br />
<strong>of</strong>f-street) have installed raised or near-level platforms, such as Cleveland and<br />
Eugene. Only a few systems feature multiple vehicle berths or passing capability.<br />
Several systems with extensive suburban operation have park-and-ride lots,<br />
including Los Angeles, Miami, and Pittsburgh.<br />
Outside the U.S., more substantial stations, <strong>of</strong>ten enclosed, are common, as a<br />
function <strong>of</strong> the greater use <strong>of</strong>f-street, dedicated running ways. Overall, BRT applications<br />
outside the U.S. are much more likely to feature raised platforms or<br />
level boarding; multiple bus berths; and passing lanes in stations. It appears to be<br />
less common outside the U.S. to build park-and-ride lots, except for Australia’s<br />
BRT applications.<br />
2-34
Station Location and Type<br />
(total in both directions)<br />
On-Street<br />
• No Shelter<br />
• Simple<br />
• Enhanced<br />
Off-Street Station<br />
<strong>Transit</strong> Center<br />
Amenities<br />
Telephone<br />
Restroom<br />
Vending<br />
Seating<br />
Trash Container<br />
Temperature Control<br />
Public Art<br />
Public Address<br />
Emergency Telephone<br />
Security Monitoring<br />
(CCTV / Police Presence)<br />
Platform Height and Length<br />
Curb Design<br />
Maximum Vehicles<br />
Accommodated<br />
Passing Capability<br />
Park-and-Ride Lots<br />
Exhibit 2-4: Experience with BRT Stations<br />
Albuquerque Boston Silver Line Chicago<br />
Rapid Ride<br />
- Red Line<br />
28<br />
2<br />
Standard curb<br />
1<br />
Washington<br />
Street<br />
4<br />
1<br />
16<br />
1<br />
X<br />
X<br />
Standard curb<br />
1<br />
- -<br />
2 0<br />
Waterfront:<br />
Airport<br />
5<br />
4<br />
Waterfront:<br />
BMIP<br />
8<br />
4 4<br />
Standard curb<br />
1 above ground, 3 underground<br />
Waterfront:<br />
City Point<br />
14<br />
226 parking spaces at South Station;<br />
street & private lots elsewhere<br />
Western Avenue<br />
Express<br />
80<br />
1<br />
Major Elements <strong>of</strong> BRT<br />
Garfield<br />
Express<br />
Standard curb<br />
Irving Park<br />
Express<br />
36 38<br />
1 1<br />
0 0 0<br />
2-35
Major Elements <strong>of</strong> BRT<br />
2-36<br />
Station Location and Type<br />
(total in both directions)<br />
On-Street<br />
• No Shelter<br />
• Simple<br />
• Enhanced<br />
Off-Street Station<br />
<strong>Transit</strong> Center<br />
Amenities<br />
Telephone<br />
Restroom<br />
Vending<br />
Seating<br />
Trash Container<br />
Temperature Control<br />
Public Art<br />
Public Address<br />
Emergency Telephone<br />
Security Monitoring<br />
(CCTV / Police Presence)<br />
Platform Height and Length<br />
Curb Design<br />
Maximum Vehicles<br />
Accommodated<br />
Passing Capability<br />
Park-and-Ride Lots<br />
Healthline<br />
EmX<br />
Exhibit 2-4: Experience with BRT Stations (cont’d.)<br />
Cleveland Eugene Honolulu<br />
36<br />
None<br />
16<br />
2<br />
X<br />
X<br />
Route A: City<br />
Express!<br />
Route B: City<br />
Express!<br />
Route C: Country<br />
Express!<br />
MAX - Main St Metropolitan Area<br />
Express (MAX)<br />
Orange<br />
Line<br />
Near level Raised curb Standard curb Standard curb Standard curb Raised curb Raised curb 8” curb Standard curb<br />
1 40' + 1 60'<br />
1<br />
1 1<br />
1 1<br />
3 60’<br />
(200') 1<br />
No No<br />
69<br />
57<br />
X X<br />
None<br />
81<br />
None None<br />
Kansas City Las Vegas Los Angeles<br />
42<br />
Bus pullouts<br />
2<br />
18<br />
2<br />
Beverages<br />
X<br />
X<br />
26<br />
2<br />
X<br />
X<br />
X<br />
X<br />
X<br />
X<br />
Passing<br />
lane at<br />
each<br />
in-line<br />
station<br />
Metro Rapid<br />
(All Routes)<br />
496<br />
116<br />
38<br />
X<br />
None 7 lots<br />
None
Station Location and Type<br />
(total in both directions)<br />
On-Street<br />
• No Shelter<br />
• Simple<br />
• Enhanced<br />
Off-Street Station<br />
<strong>Transit</strong> Center<br />
Amenities<br />
Telephone<br />
Restroom<br />
Vending<br />
Seating<br />
Trash Container<br />
Temperature Control<br />
Public Art<br />
Public Address<br />
Emergency Telephone<br />
Security Monitoring<br />
(CCTV / Police Presence)<br />
Platform Height and Length<br />
Curb Design<br />
Maximum Vehicles<br />
Accommodated<br />
Passing Capability<br />
Park-and-Ride Lots<br />
South Dade<br />
Busway MAX<br />
30<br />
X<br />
X<br />
X<br />
X<br />
Exhibit 2-4: Experience with BRT Stations (cont’d.)<br />
Miami Oakland Orlando<br />
Busway Local<br />
16<br />
X<br />
San Pablo Ave<br />
Rapid<br />
LYMMO RAPID - I-10 East RAPID - I-10<br />
West<br />
RAPID - SR-51<br />
Major Elements <strong>of</strong> BRT<br />
Standard curb Standard curb Standard curb Standard curb Standard curb Standard curb Standard curb Standard curb<br />
3 3<br />
1<br />
2 1<br />
1 1 1<br />
Bus pullouts Bus pullouts Bus pullouts Bus pullouts Bus pullouts Bus pullouts<br />
None<br />
X<br />
X<br />
X<br />
52 24<br />
18<br />
22<br />
X<br />
X<br />
None<br />
None None<br />
X X<br />
Phoenix<br />
24<br />
RAPID - I-17<br />
26<br />
X X<br />
None None<br />
2-37
Major Elements <strong>of</strong> BRT<br />
2-38<br />
Station Location and Type<br />
(total in both directions)<br />
On-Street<br />
• No Shelter<br />
• Simple<br />
• Enhanced<br />
Off-Street Station<br />
<strong>Transit</strong> Center<br />
Amenities<br />
Telephone<br />
Restroom<br />
Vending<br />
Seating<br />
Trash Container<br />
Temperature Control<br />
Public Art<br />
Public Address<br />
Emergency Telephone<br />
Security Monitoring<br />
(CCTV / Police Presence)<br />
Platform Height and Length<br />
Curb Design<br />
Maximum Vehicles<br />
Accommodated<br />
Passing Capability<br />
Park-and-Ride Lots<br />
East Busway<br />
(All Stops)<br />
16<br />
2<br />
X<br />
X<br />
X<br />
X<br />
X<br />
Raised curb<br />
16<br />
Exhibit 2-4: Experience with BRT Stations (cont’d.)<br />
Pittsburgh Sacramento San Jose<br />
South Busway<br />
16<br />
2<br />
X<br />
X<br />
X<br />
X<br />
X<br />
X<br />
Raised curb<br />
West Busway<br />
(All Stops)<br />
12<br />
2<br />
X<br />
X<br />
X<br />
Raised curb<br />
10<br />
EBus -<br />
Stockton<br />
19<br />
14<br />
0<br />
0<br />
2<br />
Santa Monica<br />
Rapid 522 Lincoln Rapid Metro<strong>Link</strong><br />
(All Routes)<br />
Standard curb<br />
2<br />
28<br />
<strong>Transit</strong>way<br />
(All Routes)<br />
Standard curb<br />
1 2 3<br />
Passing allowed Passing allowed Passing allowed None None None None Bus pullouts<br />
12<br />
X<br />
X<br />
19<br />
33<br />
4<br />
0<br />
4<br />
3 with 281 spaces;<br />
3 with 1300 spaces<br />
at commuter rail<br />
stations<br />
Standard curb Standard curb<br />
None<br />
Halifax Ottawa<br />
6<br />
6<br />
4<br />
0<br />
6<br />
28<br />
34<br />
6 8
Station Location and Type<br />
(total in both directions)<br />
On-Street<br />
• No Shelter<br />
• Simple<br />
• Enhanced<br />
Off-Street Station<br />
<strong>Transit</strong> Center<br />
Amenities<br />
Telephone<br />
Restroom<br />
Vending<br />
Seating<br />
Trash Container<br />
Temperature Control<br />
Public Art<br />
Public Address<br />
Emergency Telephone<br />
Security Monitoring<br />
(CCTV / Police Presence)<br />
Platform Height and Length<br />
Curb Design<br />
Maximum Vehicles<br />
Accommodated<br />
Passing Capability<br />
Park-and-Ride Lots<br />
VIVA<br />
(All Routes)<br />
Exhibit 2-4: Experience with BRT Stations (cont’d.)<br />
York Bogotá Guayaquil Pereira Amsterdam<br />
Transmilenio<br />
8<br />
234<br />
8 26<br />
Standard curb<br />
1<br />
Bus pullouts<br />
None<br />
Level platform<br />
Metrovia Megabus Zuidtangent Tram on Wheels Fastlink<br />
68<br />
4<br />
Level platform<br />
70<br />
4<br />
2 to 5 1 to 2<br />
Bus pullouts at<br />
many stations;<br />
some lines more<br />
than 2 lanes.<br />
No passing No passing<br />
None None<br />
Caen<br />
30<br />
4<br />
1<br />
Major Elements <strong>of</strong> BRT<br />
Edinburgh Eindhoven<br />
Phileas - Western<br />
Corridor<br />
Level platform Level platform Level platform Level platform Level platform<br />
2-39
Major Elements <strong>of</strong> BRT<br />
2-40<br />
Station Location and Type<br />
(total in both directions)<br />
On-Street<br />
• No Shelter<br />
• Simple<br />
• Enhanced<br />
Off-Street Station<br />
<strong>Transit</strong> Center<br />
Amenities<br />
Telephone<br />
Restroom<br />
Vending<br />
Seating<br />
Trash Container<br />
Temperature Control<br />
Public Art<br />
Public Address<br />
Emergency Telephone<br />
Security Monitoring<br />
(CCTV / Police Presence)<br />
Platform Height and Length<br />
Curb Design<br />
Maximum Vehicles<br />
Accommodated<br />
Passing Capability<br />
Park-and-Ride Lots<br />
Superbus<br />
Exhibit 2-4: Experience with BRT Stations (cont’d.)<br />
Leeds London Rouen Utrecht Adelaide<br />
Level platform,<br />
raised curb<br />
No passing in<br />
guideway<br />
1 park-and-ride,<br />
179 spaces<br />
Crawley<br />
62<br />
Standard curb<br />
TEOR Busway North East Busway South East Busway<br />
52<br />
Level platform<br />
No passing<br />
13<br />
Level platform<br />
No passing<br />
3 in each direction<br />
Standard curb<br />
3- and 4-bus length<br />
3; total vapacity is 1,190<br />
27 in each direction<br />
Standard curb<br />
Brisbane<br />
Standard 4; max 5<br />
Inner Northern<br />
Busway<br />
27 in each direction<br />
Standard curb<br />
Passing at interchanges Bus pullouts Bus pullouts<br />
2 stations; total <strong>of</strong><br />
759 spaces<br />
None designated
Station Location and Type<br />
(total in both directions)<br />
On-Street<br />
• No Shelter<br />
• Simple<br />
• Enhanced<br />
Off-Street Station<br />
<strong>Transit</strong> Center<br />
Amenities<br />
Telephone<br />
Restroom<br />
Vending<br />
Seating<br />
Trash Container<br />
Temperature Control<br />
Public Art<br />
Public Address<br />
Emergency Telephone<br />
Security Monitoring<br />
(CCTV / Police Presence)<br />
Platform Height and Length<br />
Curb Design<br />
Maximum Vehicles<br />
Accommodated<br />
Passing Capability<br />
Park-and-Ride Lots<br />
Liverpool-<br />
Parramatta T-Way<br />
Exhibit 2-4: Experience with BRT Stations (cont’d.)<br />
Sydney Beijing Hangzhou<br />
Kunming<br />
North-West T-Way<br />
Blacktown-Parklea<br />
North-West T-Way<br />
Parramatta-Rouse Hill<br />
22 2<br />
4 4 32<br />
40 38<br />
4 11 in each direction 18 in each direction<br />
Major Elements <strong>of</strong> BRT<br />
Line 1 Line B1 Busway Network<br />
Standard curb Standard curb Standard curb Level platform Standard curb Standard curb<br />
Standard 2 bus,<br />
Max 6 buses<br />
Bus pullouts at<br />
stations<br />
Standard 2 bus, 4<br />
at termini<br />
Bus pullouts at<br />
stations<br />
1 designated None designated<br />
Bus pullouts at<br />
stations<br />
2 designated; 300<br />
spaces<br />
Multiple lanes<br />
Multiple lanes<br />
60 m platform length<br />
None<br />
2-41
Major Elements <strong>of</strong> BRT<br />
VEHIClEs<br />
Description<br />
role <strong>of</strong> Vehicles in Brt<br />
BRT vehicles have a direct impact on speed, capacity, environmental friendliness,<br />
and comfort, both actual and perceived.<br />
Vehicles are also the BRT element in which customers spend the most time, and<br />
one <strong>of</strong> the system elements that is the most visible to non-customers. Therefore,<br />
much <strong>of</strong> the public impression <strong>of</strong> the BRT system comes from experience with<br />
vehicles. Because <strong>of</strong> this, vehicles are also the element <strong>of</strong> BRT that most passengers<br />
and non-customers associate with the BRT system’s identity. They can play<br />
an important role in successful branding.<br />
Characteristics <strong>of</strong> Vehicles<br />
Four primary attributes define BRT vehicles:<br />
2-42<br />
Vehicle Configuration—The<br />
physical configuration <strong>of</strong> BRT vehicles combines<br />
size, floor height, and body type. <strong>Transit</strong> vehicles in the United States<br />
have traditionally been high-floor vehicles with steps. In response to ADA,<br />
low-floor vehicles have become common in conventional transit operations.<br />
This is an evolutionary step that benefits bus service generally, and BRT in<br />
particular. Vehicles in most U.S. BRT applications range from low-floor, twoaxle,<br />
40- or 45-ft units to three-axle, 60-ft articulated buses. Both shorter<br />
and longer platforms may eventually find their way into the domestic BRT<br />
market, with shorter vehicles (25- to 30-ft) and longer vehicles (e.g., bi-articulated<br />
vehicles) possibly figuring in specific future deployments.<br />
Aesthetic Enhancement—Aesthetic<br />
treatments, including paint schemes<br />
and styling options that affect the appearance and configuration <strong>of</strong> the<br />
vehicle body and contribute to BRT system identity. They help to position<br />
BRT as a quality option and provide information to potential customers as<br />
to where to access BRT services. Manufacturers have responded to market<br />
demand for more stylized vehicles, <strong>of</strong>fering visually appealing windshield<br />
and window treatments as well as other exterior styling cues that suggest a<br />
rail-like quality. Interior amenities such as high-quality materials, better and<br />
more energy-efficient lighting, climate control, and sound reduction also<br />
contribute to customer perception <strong>of</strong> comfort and service quality.<br />
Passenger Circulation Enhancement—Several<br />
enhancements can be<br />
added to vehicles to expedite passenger boarding and alighting as well as<br />
circulation within the vehicle. The provision <strong>of</strong> additional and/or wider door<br />
channels, including median (left-side) doors, can improve circulation, as can<br />
various seat layouts, including those allowing for wider aisles, and alternative<br />
wheelchair securement positions.<br />
Propulsion/Fuel—Fuel<br />
propulsion systems determine the acceleration,<br />
maximum speed, fuel consumption, and emissions characteristics <strong>of</strong> BRT<br />
vehicles. Propulsion options, particularly hybrid and electric propulsion<br />
systems, can also affect the sound levels inside and outside the bus, as well<br />
as impact operating and maintenance costs. Smooth acceleration and quiet<br />
operation associated with electric drivetrains may contribute to the perception<br />
<strong>of</strong> BRT as an upgraded mode <strong>of</strong> travel, potentially attracting additional<br />
riders. Alternative fuels, including natural gas and hydrogen/natural gas<br />
blends, can favorably impact emissions, but also may affect performance<br />
and capital costs associated with fueling and maintenance infrastructure.<br />
Vehicle options<br />
Vehicle Configuration<br />
Vehicle configuration, the primary vehicle planning/design parameter, represents<br />
the combination <strong>of</strong> the length, passenger capacity, body type, and floor height <strong>of</strong><br />
the vehicle. All <strong>of</strong> these parameters affect the vehicle’s ability to transport passengers<br />
efficiently and in reasonable comfort.<br />
BRT systems can use a variety <strong>of</strong> different vehicle configurations on a single running<br />
way or within a broader transit system, with each configuration tailored to a specific<br />
service pr<strong>of</strong>ile and market. Los Angeles has both 45-ft buses and 60-ft articulated<br />
buses running in mixed traffic along some high-ridership corridors, though<br />
in its dedicated running way, 60-ft articulated vehicles are used exclusively. The<br />
Ottawa and Miami-Dade systems also illustrate flexibility in BRT fleet vehicle mix<br />
by running way type. BRT’s inherent flexibility does allow communities to launch<br />
service in phased deployments, beginning with standard 40- to 45-ft vehicles with<br />
a plan to transition or supplement with 60-ft articulated buses as demand grows.<br />
While local transit services and some BRT systems —including the highly effective<br />
systems in Bogotá, Columbia and Curitiba, Brazil—use high-floor buses<br />
(corresponding to high station platforms), the options presented here represent<br />
those options primarily available to the North American market. Many North
American transit agencies are moving toward the low-floor platform for regular<br />
as well as BRT service.<br />
Vehicle Configuration<br />
Conventional Standard<br />
Conventional standard vehicles are 40 to 45 ft in length and<br />
have a conventional (“boxy”) body. The partial low-floor variety<br />
(now the norm among urban transit applications) contains<br />
internal floors that are significantly lower (14 inches<br />
above pavement) than high floor buses. They typically have at<br />
least two doors and a rapidly deployable ramp for wheelchairbound<br />
and other mobility-impaired customers.<br />
Capacity:<br />
A typical 40-ft vehicle has seating for 35-44 patrons, expanding<br />
to between 50 and 60 seated and standing.<br />
A typical 45-ft vehicle can carry 35-52 passengers seated and<br />
60-70 seated and standing.<br />
Cost: $375,000 to $400,000<br />
Stylized Standard<br />
Stylized standard vehicles have the features <strong>of</strong> a conventional<br />
step low-floor vehicle but they also incorporate slight body<br />
modifications or additions to make the body appear more<br />
modern, aerodynamic, and attractive.<br />
Capacity:<br />
Similar to Conventional Standard vehicles <strong>of</strong> the same size.<br />
Cost: $425,000 to 450,000<br />
Conventional Articulated<br />
The longer, articulated vehicles have a higher passenger carrying<br />
capacity (50% more) than standard vehicles. Typical floors<br />
are partial low floors with steps with two or three doors.<br />
Capacity:<br />
Articulated vehicle seating capacity depends heavily on the<br />
number and placement <strong>of</strong> doors, ranging from 31 (four wide<br />
doors) to 65 (two doors) and total capacity <strong>of</strong> 80-90 passengers,<br />
including standees.<br />
Cost: $700,000 to $750,000<br />
Conventional Standard bus—<br />
Metro Rapid<br />
Stylized Standard bus—Metro<br />
Rapid<br />
Conventional Articulated—Silver<br />
Line<br />
ReAsons to Implement<br />
• Due to high volume <strong>of</strong> production,<br />
these standard buses usually <strong>of</strong>fer the<br />
lowest unit price in terms <strong>of</strong> acquisition<br />
costs.<br />
• Consistency with the rest <strong>of</strong> the fleet<br />
facilitates interchangeability and ease<br />
<strong>of</strong> maintenance.<br />
• Incremental styling changes provide<br />
some aesthetic and functional differentiation<br />
<strong>of</strong> service.<br />
• Higher capacity can absorb more<br />
peak passenger volume, provide<br />
more space and passenger comfort.<br />
Major Elements <strong>of</strong> BRT<br />
ConsIdeRAtIons/<br />
RequIRements<br />
• Capacity is limited and, in peak periods,<br />
more buses are required, which impacts<br />
operational costs in terms <strong>of</strong> maintenance,<br />
fuel, and labor.<br />
• No major impact for standard maintenance<br />
practices since most transit operations<br />
include this vehicle configuration.<br />
• May require alternative procurement<br />
methods.<br />
• May be more expensive than conventional<br />
buses.<br />
• Some limitations on routing because <strong>of</strong><br />
length.<br />
• May require modifications to maintenance<br />
facilities to accommodate larger<br />
vehicles.<br />
2-43
Major Elements <strong>of</strong> BRT<br />
Stylized Articulated (Partial Low-Floor)<br />
Stylized articulated vehicles are emerging in the U.S. to respond<br />
to the desires <strong>of</strong> BRT communities for more modern,<br />
sleeker, and more comfortable vehicles. Step-low floors, at<br />
least three doors, with two double-stream and quick-deploy<br />
ramps facilitate boarding and alighting to shorten stop dwell<br />
times.<br />
Capacity:<br />
As with other articulated vehicles, seating capacity depends<br />
heavily on the number and placement <strong>of</strong> doors ranging from<br />
31 (four wide doors) to 65 (two doors) and total capacity <strong>of</strong><br />
80-90 passengers, including standees.<br />
Cost: $800,000 to $950,000<br />
Specialized BRT Vehicles (Full Low-Floor)<br />
Specialized vehicles employ a modern, aerodynamic body<br />
that has a look similar to that <strong>of</strong> rail vehicles. Special axles and<br />
drivetrain configurations create a full low floor in the vehicle<br />
interior. They also employ advanced propulsion systems and<br />
<strong>of</strong>ten include integrated ITS components and guidance systems.<br />
Capacity:<br />
As with other articulated vehicles, seating capacity depends<br />
heavily on the number and placement <strong>of</strong> doors.<br />
2-44<br />
Stylized Articulated—Orange<br />
Line<br />
Specialized BRT Vehicle—<br />
Translohr<br />
ReAsons to Implement<br />
• Offers the same advantages as conventional<br />
articulated vehicles, with<br />
the added appeal <strong>of</strong> stylized exterior<br />
and interior design. More easily identified<br />
and brandable, differentiating<br />
them from regular service vehicles.<br />
• Incorporate what many perceive as<br />
features and amenities needed to<br />
provide rail-like experience <strong>of</strong> toplevel<br />
BRT vehicles.<br />
ConsIdeRAtIons/<br />
RequIRements<br />
• May require alternative procurement<br />
methods.<br />
• Some limitations on routing because <strong>of</strong><br />
length and turn radius.<br />
• May require modifications to maintenance<br />
facilities to accommodate larger<br />
vehicles.<br />
• Currently available only from non-American,<br />
primarily European, manufacturers.<br />
• Availability <strong>of</strong> new models is affected by<br />
the ability <strong>of</strong> transit agencies to structure<br />
procurement processes and develop fleet<br />
orders <strong>of</strong> sufficient size for manufacturers<br />
to respond and invest in the development<br />
<strong>of</strong> specialized BRT models.
aesthetic Enhancements<br />
Above and beyond the basic vehicle type, several aesthetic enhancements can be added to vehicles to enhance<br />
the attractiveness <strong>of</strong> vehicles to passengers. Selection <strong>of</strong> these features can have important impact<br />
on community and rider acceptance. New features, including streamlined styling, smooth electric propulsion,<br />
and upgraded amenities for riders, play a role in attracting riders. Market demand studies suggest that<br />
general managers <strong>of</strong> transit properties, local political and civic leaders, and community and rider groups<br />
place high stock in the image <strong>of</strong> the vehicle (WestStart-CALSTART 2004).<br />
aesthetic Enhancements<br />
Specialized Logos and Livery<br />
Specialized logos and vehicle livery (an identifying design encompassing<br />
color, paing scheme, and logos on the vehicle) are<br />
<strong>of</strong>ten used to create a specialized identity by establishing a<br />
brand and theme that patrons recognize and associate with<br />
the positive attributes <strong>of</strong> the BRT system. Studies suggest that<br />
livery and image can improve the perception <strong>of</strong> passenger<br />
wait times.<br />
Larger Windows and Enhanced Lighting<br />
The incorporation <strong>of</strong> larger windows (especially on low-floor<br />
vehicles) and interior light fixtures that allow for abundant<br />
light in day or night to provide an “open feeling” can improve<br />
the perception and reality <strong>of</strong> passenger security. Larger windows<br />
for each passenger to see in and out are important for<br />
perceived patron security. (Note that some advertising such<br />
as “bus wraps” on windows can detract from visibility and interior<br />
lighting.)<br />
Enhanced Interior Amenities<br />
Enhanced interior amenities such as more comfortable seating,<br />
higher quality materials and finishes, better lighting, and<br />
climate control can improve the perception <strong>of</strong> cleanliness,<br />
quality construction, and safety.<br />
MAX—Las Vegas, Nevada<br />
TEOR—Rouen, France<br />
Translohr—Clermont, France<br />
ReAsons to Implement<br />
• Proper application supports successful<br />
branding identification, considered<br />
essential in attracting new<br />
ridership.<br />
• Increased passenger experience <strong>of</strong><br />
comfort and security.<br />
• Improved rider experience and amenities<br />
can improve perception <strong>of</strong> BRT<br />
service and attract non-traditional<br />
transit riders.<br />
Major Elements <strong>of</strong> BRT<br />
ConsIdeRAtIons/<br />
RequIRements<br />
• Requires coordination with a broader<br />
branding campaign. Otherwise, badly<br />
conceived or poorly promoted branding<br />
campaign can result in rider confusion at<br />
worst, and little impact at best.<br />
• Requires a dedicated fleet, which may<br />
preclude operations strategies such as<br />
interlining and rotating vehicles with local<br />
transit service.<br />
• Potential slight cost increase in replacement<br />
and maintenance.<br />
• Enhanced interior materials may be more<br />
subject to wear and/or vandalism, increasing<br />
maintenance costs.<br />
2-45
Major Elements <strong>of</strong> BRT<br />
Passenger Circulation Enhancement<br />
Several features can contribute to accessibility to BRT vehicles and circulation<br />
within vehicles. These features can have important impacts on dwell time, capacity,<br />
passenger comfort, and community and rider acceptance.<br />
Passenger Circulation Enhancement<br />
Alternative Seat Layouts<br />
Alternative seat layouts can increase the aisle width within<br />
the vehicle, increasing the standing capacity <strong>of</strong> the vehicle as<br />
well as providing additional space for passenger circulation.<br />
Alternative seat layouts include transverse seating (seating<br />
placed against the sides <strong>of</strong> the vehicle) or “two and one seating.”<br />
These layouts may also convey an impression <strong>of</strong> openness<br />
and accessibility.<br />
Additional Door Channels<br />
Additional door channels on vehicles can improve circulation<br />
and facilitate boarding from and alighting to station platforms.<br />
There are two types <strong>of</strong> additional door channels:<br />
• Curb side—Additional door channels and wider doors<br />
on the traditional side <strong>of</strong> the vehicle (right side in North<br />
America) facilitate the boarding process by allowing<br />
multiple queues <strong>of</strong> passengers to enter the BRT vehicle at<br />
one time.<br />
• Opposite side—Adding doors to the opposite side <strong>of</strong> the<br />
vehicle (left side in North Amerrica) can allow for access<br />
from center platform stations in the median <strong>of</strong> an arterial,<br />
and from the curb side on one-way streets. This additional<br />
feature improves the flexibility <strong>of</strong> running ways in which<br />
the BRT system can operate and simulates the flexibility <strong>of</strong><br />
rail systems.<br />
2-46<br />
TEOR—Rouen, France<br />
Additional doors on feeder line—<br />
Bogotá, Colombia<br />
ReAsons to Implement<br />
• Properly selected seating can improve<br />
circulation, reduce dwell times,<br />
and enhance passenger comfort.<br />
• Adding door channels, particularly<br />
in conjunction with low-floor design,<br />
can significantly speed passenger<br />
access, reducing dwell time and contributing<br />
to shorter travel times.<br />
ConsIdeRAtIons/<br />
RequIRements<br />
• Requires coordination with the disabled<br />
community to determine acceptable<br />
seating configuration.<br />
• Impacts to seated passenger capacity<br />
may require adjustments to vehicle fleet<br />
orders.<br />
• Opposite side doors may require additional<br />
structural modifications to vehicle<br />
orders, potentially raising procurement<br />
costs and testing requirements.<br />
• To take full advantage <strong>of</strong> additional door<br />
channels may require alternative fare collection<br />
process, such as pro<strong>of</strong>-<strong>of</strong>-payment<br />
enforcement.
Enhanced Wheelchair Securement<br />
Conventional wheelchair securement involves the use <strong>of</strong> tiedowns,<br />
wheel locks, and belts, involving a process that takes<br />
between 60 and 200 seconds including boarding time. Alternative<br />
wheelchair securement devices are currently being explored<br />
to reduce the amount <strong>of</strong> time to secure wheelchairs in bus operation.<br />
In BRT applications, particularly in Europe, rear-facing<br />
wheelchair positions and no-gap, no-step boarding and alighting<br />
eliminate the requirement for lifts, ramps, and wheelchair<br />
securement. The transit agencies in Oakland, California and the<br />
York Region in Ontario, Canada have deployed vehicles with<br />
this seating configuration. Other types <strong>of</strong> alternative restraint<br />
systems include a four-point belt tie-down system (Kinedyne)<br />
and an automated docking system securing the rear <strong>of</strong> the<br />
wheelchair.<br />
Orange Line<br />
ReAsons to Implement<br />
• Can speed boarding and alighting <strong>of</strong><br />
disabled passengers.<br />
ConsIdeRAtIons/<br />
RequIRements<br />
Major Elements <strong>of</strong> BRT<br />
• Prices can vary considerably, as can space<br />
available for seated or standing passengers,<br />
depending on the technology<br />
selected.<br />
• Requires outreach to disabled communities<br />
to gain acceptance.<br />
2-47
Major Elements <strong>of</strong> BRT<br />
Propulsion systems<br />
Spurred by the evolution <strong>of</strong> regulations supporting clean air, the number <strong>of</strong> choices in vehicle propulsion systems<br />
is increasing. Technology is evolving to provide new propulsion systems that use cleaner, alternative fuels and new<br />
controls on emissions, resulting in reduced pollution and lower noise emissions. As new technologies are being<br />
introduced, market conditions, such as demand and cost <strong>of</strong> production, are evolving.<br />
Propulsion systems<br />
Internal Combustion Engines<br />
The internal combustion engine (ICE) fueled by ultra lowsulfur<br />
diesel (ULSD) or compressed natural gas (CNG) is the<br />
most common propulsion system today. Some transit agencies<br />
are testing other fuels such as biodiesel, diesel emulsion<br />
blends, and even Liquified Natural Gas (LNG), but these are<br />
a small fraction <strong>of</strong> transit applications. Trials and demonstrations<br />
using blends <strong>of</strong> CNG and hydrogen are yielding encouraging<br />
results. Although not yet commercially available, these<br />
hydrogen-CNG blends may provide additional emissions<br />
benefits. EPA’s 2007 and 2010 standards for NOx and PM<br />
(particulates) emissions require engines with Exhaust Gas Re-<br />
Circulation (EGR) plus exhaust after-treatment technology.<br />
Cost: CNG price increment over ULSD is approximately<br />
$60,000 per vehicle. Infrastructure capital $700,000 -<br />
$1,000,000<br />
Trolley, Dual Mode, and Electric Drives<br />
Thermal Electric Drive<br />
Electric trolley bus drives powered by overhead catenary-delivered<br />
power are still produced today and are planned in limited<br />
quantities for operation in tunnel BRT applications. Dual<br />
mode systems with an on-board Internal Combustion Engine<br />
(ICE) engine (usually diesel) can operate as a trolley and as an<br />
ICE vehicle <strong>of</strong>f the catenary for specialized operations. Also, a<br />
hybrid-electric drive, which couples an ICE to a generator, is<br />
becoming more commonly used as a drive system in transit<br />
vehicles.<br />
2-48<br />
Feeder line using Internal<br />
Combustion Engine—<br />
Transmilenio<br />
Trole electric driven bus—Quito,<br />
Ecuador<br />
ReAsons to Implement<br />
• Simplest propulsion system type,<br />
requiring almost no adjustment to<br />
existing maintenance requirements.<br />
• Lower emissions, potential increases<br />
in fuel efficiency, and associated<br />
reduction in dependence on fossil<br />
fuels. Hydrogen internal combustion<br />
engines (HICE) may help encourage<br />
hydrogen infrastructure. Bi<strong>of</strong>uels,<br />
including biodiesel and biogas, may<br />
encourage reduction in dependence<br />
on fossil fuels.<br />
• The solely electric-powered vehicles<br />
<strong>of</strong>fer substantial improvements in<br />
emissions reduction over ICE power,<br />
as well as higher torque throughout<br />
the operating range.<br />
• The dual-mode <strong>of</strong>fers flexibility in<br />
systems where some zero-emission<br />
operation is required or desired.<br />
• The hybrid-electric drive optimizes<br />
the emissions and fuel efficiency <strong>of</strong><br />
the ICE while <strong>of</strong>fering many <strong>of</strong> the<br />
benefits <strong>of</strong> the electric drive vehicle.<br />
ConsIdeRAtIons/<br />
RequIRements<br />
• With the introduction <strong>of</strong> ULSD and improved<br />
combustion and after-treatment,<br />
conventional diesel power, without the<br />
infrastructure costs, is decreasing interest<br />
in the pursuit <strong>of</strong> alternative fuels, particularly<br />
gaseous fuels.<br />
• With the majority <strong>of</strong> transit fleets using<br />
diesel ICEs, conversion to other fuels such<br />
as CNG will require conversion <strong>of</strong> maintenance<br />
and fueling facilities.<br />
• For trolley and dual-mode vehicles, installing<br />
overhead power systems have significant<br />
costs as well as aesthetic drawbacks.
Hybrid-Electric Drives<br />
Hybrid-electric drives differ from dual-mode systems in that<br />
they incorporate some type <strong>of</strong> on-board energy storage device<br />
(e.g., batteries or ultra capacitors). Though the thermal or<br />
internal combustion engines used for hybrid drives are diesel<br />
in most transit applications, in a number <strong>of</strong> cases (e.g., Denver<br />
16th Street Mall vehicles) CNG or gasoline have been used.<br />
Fuel economy gains <strong>of</strong> up to 60 percent are being claimed in<br />
urban service. Operational tests show improved range and reliability<br />
over ICE buses. Hybrid buses have entered operation<br />
in places such as New York and Seattle. More agencies seem<br />
to be gravitating to hybrids, and the differential in capital costs<br />
seems likely to decline.<br />
Cost: Price increment over diesel ICE is $150,000 to<br />
$250,000<br />
Fuel Cells<br />
Fuel cells generate electricity energy through electrochemical<br />
reactions in contrast to mechanical power produced by<br />
ICEs. Currently, most vehicle fuel cells are hydrogen proton<br />
exchange membranes (PEMs) which combine hydrogen and<br />
ambient oxygen to produce electricity. Emissions include only<br />
oxygen and water.<br />
The United States <strong>Department</strong> <strong>of</strong> Transportation sponsors<br />
the National Fuel Cell Bus Technology Development Program<br />
(NFCPB) to facilitate the development <strong>of</strong> commercially viable<br />
fuel cell bus technologies and related infrastructure. Goals <strong>of</strong><br />
the NFCBP are to advance technology, reduce production<br />
costs, and increase public acceptance <strong>of</strong> fuel cell vehicles. In<br />
addition, there are demonstrations – ongoing and planned –<br />
around the world, including California, Connecticut, British<br />
Columbia, several European cities, Japan, China, and Brazil.<br />
Cost: Currently not commercially available, demonstration<br />
vehicles are between $1.5 million and $5 million.<br />
Hybrid-electric drive bus—<br />
Denver, Colorado<br />
Fuel cells<br />
ReAsons to Implement<br />
• Offers improved performance and<br />
fuel economy with reduced emissions<br />
(e.g., <strong>of</strong> nitrogen oxides [NOx] and<br />
particulates [PM]).<br />
• Allows for a shift to cleaner propulsion<br />
systems without the capital<br />
investment in new fueling infrastructure<br />
at maintenance facilities. Offers<br />
numerous operational advantages<br />
over conventional diesel buses, such<br />
as smoother and quicker acceleration,<br />
more efficient braking, improved fuel<br />
economy, and reduced emissions.<br />
• Zero emissions and potential reduction<br />
in petroleum dependence.<br />
• Reduced vehicle noise.<br />
Major Elements <strong>of</strong> BRT<br />
ConsIdeRAtIons/<br />
RequIRements<br />
• Some added infrastructure, such as battery<br />
conditioners and overhead equipment<br />
to service battery tubs, may be<br />
required.<br />
• Battery packs are expensive, add weight,<br />
and must be replaced periodically during<br />
the vehicle’s life.<br />
• While hybrids demonstrate lower emissions,<br />
current EPA regulations do not yet<br />
acknowledge these lower emissions when<br />
determining engine compliance.<br />
• Proper maintenance <strong>of</strong> the battery pack<br />
is essential.<br />
• Current fuel cell technology cannot<br />
approach the lifespan <strong>of</strong> either current<br />
ICE or electric – hybrid or grid-supplied<br />
propulsion systems - and replacement<br />
cost is considerable.<br />
• Lack <strong>of</strong> any widespread infrastructure for<br />
fueling, the fact that most commerciallyavailable<br />
hydrogen is produced from natural<br />
gas (a fossil fuel), and lack <strong>of</strong> demand<br />
to motivate investment by manufacturers<br />
and fuel suppliers indicates that the<br />
technology remains to hold promise, but<br />
not in the near term.<br />
• The federal government has not made a<br />
significant investment in a hydrogen fueling<br />
infrastructure. These investments may<br />
be forthcoming in the future.<br />
2-49
Major Elements <strong>of</strong> BRT<br />
Effects <strong>of</strong> Vehicle Elements on System Performance and System Benefits<br />
Exhibits 2-5A and 2-5B summarize the links between the vehicle configuration, appearance, interior design,<br />
and propulsion options and the BRT system performance indicators and system benefits identified in Chapter<br />
1. These links are explored further in Chapters 3 and 4.<br />
Vehicle Configurations<br />
• Conventional Standard<br />
• Stylized Standard<br />
• Conventional Articulated<br />
• Stylized Articulated<br />
• Specialized BRT Vehicles<br />
• Floor Height<br />
Aesthetic Enhancement<br />
• Specialized Logos and<br />
Livery<br />
• Larger Windows and<br />
Enhanced Lighting<br />
• Enhanced Interior Amenity<br />
Passenger Circulation<br />
Enhancement<br />
• Alternative Seat Layout<br />
• Additional Door Channels<br />
• Left Side Doors<br />
• Enhanced Wheelchair<br />
Securement<br />
• Interior Bicycle Securement<br />
Propulsion Systems<br />
• Internal Combustion<br />
Engines<br />
• Fuel Choice (USLD, CNG)<br />
Trolley, Dual Mode and<br />
Thermal-Electric Drives<br />
Hybrid-Electric Drive Fuel<br />
Cells<br />
2-50<br />
Exhibit 2-5A: Summary <strong>of</strong> Effects <strong>of</strong> Vehicle Elements on System Performance<br />
Travel Time Savings Reliability Identity and Image<br />
Low floors reduce dwell<br />
time delays.<br />
Improved passenger<br />
circulation and disabled<br />
access, as well as multidoor<br />
boarding, reduce<br />
dwell time delays. Bike<br />
securement strategies<br />
can increase dwell times.<br />
Vehicles powered by<br />
electricity (trolley,<br />
dual-mode, and hybridelectric<br />
drives) have<br />
faster acceleration rates<br />
from stops.<br />
Low floors may<br />
reduce variation<br />
in dwell time between<br />
peak and<br />
non-peak hours.<br />
Easier disabled<br />
passenger<br />
access reduces<br />
variation in dwell<br />
time. Improved<br />
passenger<br />
circulation may<br />
reduce variation<br />
between peak and<br />
non-peak hours.<br />
Diesel buses are<br />
the most reliable<br />
technology. Early<br />
hybrids had lower<br />
reliability than<br />
diesels, but recent<br />
hybrids have good<br />
reliability.<br />
Advanced vehicles present a<br />
high-quality image and can<br />
appear rail-like. Stylized and<br />
articulated vehicles can be<br />
easily distinguished from other<br />
fleets.<br />
A distinct livery distin-guishes<br />
BRT vehicles from local buses<br />
and ties into the system<br />
branding scheme. An attractive<br />
livery can improve the image<br />
<strong>of</strong> the buses. Spacious interiors<br />
and other interior treatments<br />
improve the bus image and<br />
enhance passenger experience.<br />
Improved access to mobility<br />
impaired groups enhances<br />
image <strong>of</strong> service. Left side<br />
doors simulate rail systems.<br />
Alternative seat layouts can<br />
also simulate rail cars.<br />
Low emissions systems enhance<br />
the environmental image <strong>of</strong><br />
BRT. Some propulsion systems<br />
may create noise or vibration<br />
impacts. Hybrids reduce noise.<br />
Safety and<br />
Security<br />
Low floors may<br />
diminish tripping<br />
hazards.<br />
Larger windows<br />
and enhanced<br />
lighting improve<br />
visibility and<br />
enhance security.<br />
Easier disabled<br />
securement<br />
facilitates safety.<br />
Capacity Accessibility<br />
Larger vehicles<br />
increase system<br />
capacity.<br />
Improved passenger<br />
circulation and<br />
multi-door boarding<br />
increases vehicle<br />
throughput <strong>of</strong> BRT<br />
facilities. Interior<br />
bike securement<br />
can reduce interior<br />
capacity.<br />
Partial low-floor vehicles<br />
comply with minimum access<br />
standards for passengers<br />
with disabilities. Specialized<br />
BRT vehicles, with low floors<br />
throughout the interior allow<br />
easier access for all.<br />
Improved passenger<br />
circulation treatments<br />
facilitate boarding for people<br />
with disabilities. Enhanced<br />
wheelchair securement<br />
systems provide a safer, more<br />
accessible environment, while<br />
limiting delay for persons<br />
using wheelchairs and<br />
scooters.<br />
Propulsion systems that<br />
provide a gentler ride, such<br />
as those with electric drive,<br />
increase on-board safety and<br />
comfort.
Vehicle Configurations<br />
• Conventional Standard<br />
• Stylized Standard<br />
• Conventional Articulated<br />
• Stylized Articulated<br />
• Specialized BRT Vehicles<br />
• Floor Height<br />
Aesthetic Enhancement<br />
• Specialized Logos and<br />
Livery<br />
• Larger Windows and<br />
Enhanced Lighting<br />
• Enhanced Interior Amenity<br />
Passenger Circulation<br />
Enhancement<br />
• Alternative Seat Layout<br />
• Additional Door Channels<br />
• Left Side Doors<br />
• Enhanced Wheelchair<br />
Securement<br />
• Interior Bicycle Securement<br />
Propulsion Systems<br />
• Internal Combustion<br />
Engines<br />
• Fuel Choice (USLD, CNG)<br />
Trolley, Dual Mode and<br />
Thermal-Electric Drives<br />
Hybrid-Electric Drive Fuel<br />
Cells<br />
Exhibit 2-5B: Summary <strong>of</strong> Effects <strong>of</strong> Vehicle Elements on System Benefits<br />
Higher Ridership<br />
Stylized or specialized<br />
vehicles enhance the<br />
system brand and present<br />
a premium image, which<br />
may attract riders.<br />
Attractive vehicles may<br />
attract riders and may<br />
positively influence rider<br />
perception <strong>of</strong> system<br />
performance. Distinctive<br />
logos and livery raise<br />
vehicle pr<strong>of</strong>ile in public<br />
and make it easier to use<br />
the system.<br />
Attractive and spacious<br />
interior can make the ride<br />
more pleasant, attracting<br />
more riders.<br />
Clean propulsion systems<br />
make the bus seem more<br />
pleasant to riders and potential<br />
customers. Electric<br />
drive buses (hybrid, trolley,<br />
fuel cell) <strong>of</strong>fer a quieter<br />
and smoother ride. Clean<br />
propulsion promotes a<br />
“green image,” which may<br />
attract riders.<br />
Capital<br />
Cost-Effectiveness<br />
Cost increases with the<br />
complexity <strong>of</strong> the vehicle<br />
configuration. Specialized<br />
BRT vehicles cost the most.<br />
May require modifications<br />
to maintenance facilities to<br />
accommodate larger vehicles.<br />
Distinctive logos and livery<br />
require only a modest<br />
investment.<br />
Left-side doors may require<br />
additional structural<br />
modifications to vehicle<br />
orders, raising procurement<br />
costs and testing requirements.<br />
Hybrid-electric buses are more<br />
expensive than ICE or CNG,<br />
although prices are coming<br />
down; dual-mode buses<br />
potentially have even higher<br />
incremental costs. Fuel cell<br />
buses are pre-commercial and<br />
have a very high capital cost.<br />
System Benefits<br />
Operating Cost-Efficiency<br />
Smaller buses means that more<br />
buses must be used to meet<br />
capacity, increasing operating costs.<br />
Distinct liveries results in a dedicated<br />
BRT fleet, which affects spare ratios<br />
and impacts operating strategies.<br />
Potential increase in cost <strong>of</strong> replacing<br />
and maintaining large windows.<br />
Enhanced interior materials may be<br />
more subject to wear or vandalism.<br />
Interior securements could impede<br />
flow<br />
Battery maintenance and<br />
replacement may add costs to use<br />
<strong>of</strong> hybrid buses. Use <strong>of</strong> hybrids will<br />
reduce fuel costs. More data are<br />
being made available about life-cycle<br />
maintenance costs <strong>of</strong> hybrid buses.<br />
<strong>Transit</strong>-Supportive Land<br />
Development<br />
Stylized or specialized<br />
vehicles enhance the<br />
system brand and present a<br />
premium image, which may<br />
attract developers.<br />
Aesthetic enhancements<br />
may improve community<br />
and developer perception <strong>of</strong><br />
service, which could attract<br />
developer interest.<br />
Affects only service quality.<br />
Bus noise and emissions<br />
could be a factor in<br />
attracting development<br />
around stations. Hybrids<br />
may reduce noise and<br />
emissions. CNG can reduce<br />
emissions impacts.<br />
Major Elements <strong>of</strong> BRT<br />
Environmental<br />
Quality<br />
Larger vehicles may have<br />
greater noise impacts.<br />
Low emissions systems<br />
maximize environmental<br />
quality. Lower noise<br />
levels <strong>of</strong> electric and<br />
hybrid vehicle improve<br />
rider experience and<br />
community perception.<br />
2-51
Major Elements <strong>of</strong> BRT<br />
Implementation Issues<br />
Implementation Issues During Project Development<br />
Several major issues should be considered when selecting vehicles for BRT operation.<br />
Maintenance Requirements<br />
Maintenance and storage facilities need to be modified or expanded to accommodate<br />
BRT vehicles, depending on the scope <strong>of</strong> BRT implementation. The cost<br />
impact can be anywhere between a few million to modify an existing facility to<br />
$25 million or more to build a new one.<br />
Facilities Modification and Site Re-Design (Articulated Vehicles)—<br />
Communities planning purchase <strong>of</strong> 60-ft articulated vehicles will need<br />
facility modifications to maintenance buildings and yards if the property<br />
is currently using 40-ft vehicles. Typical modifications include extension <strong>of</strong><br />
inspection pits, installation <strong>of</strong> three-post axle-engaging hoists, modification<br />
or relocation <strong>of</strong> bus maintenance equipment, conversion to drive-through<br />
maintenance bays, and reconfiguration <strong>of</strong> parking and circulation layout <strong>of</strong><br />
yards.<br />
Facilities Modification and Site Re-Design (Hybrid and Gaseous<br />
Fuels)—As noted in the NREL study on NYC <strong>Transit</strong>, the deployment <strong>of</strong><br />
hybrid buses required the installation <strong>of</strong> battery reconditioning equipment,<br />
as well as an overhead crane for accessing the battery tubs located on the<br />
top <strong>of</strong> the bus. Similar access is usually required for servicing gas storage cylinders<br />
on top <strong>of</strong> the bus. If gaseous fueling is not extant, such a facility can<br />
have significant costs: in the case <strong>of</strong> NYC <strong>Transit</strong>, blasting and laying <strong>of</strong> new<br />
pipe for its CNG fueling facility cost in the area <strong>of</strong> $7.4 million.<br />
2-52<br />
New Facility Location—If<br />
significant numbers <strong>of</strong> new vehicles are<br />
needed, a new facility location must be identified to accommodate the BRT<br />
fleet.<br />
Fueling—Fueling<br />
facilities may also need to be modified to accommodate<br />
new vehicles and possibly longer vehicles.<br />
Availability <strong>of</strong> Desired Vehicle Configuration<br />
As market demand studies have shown, because vehicles are a highly-visible<br />
transit system element, general managers <strong>of</strong> transit properties, as well as local<br />
political and civic leaders and community and rider groups, place a significant<br />
value on the vehicle image. U.S. suppliers have responded and, as a result, domestically-manufactured<br />
vehicles have advanced not only technologically but<br />
aesthetically.<br />
Agencies looking at procuring specialized vehicles for their BRT service should<br />
keep in mind that selecting non-conventional configurations requires careful<br />
procurement planning and execution as well as coordination with relevant regulatory<br />
agencies.<br />
Regulatory Compliance<br />
New vehicle models must pass a variety <strong>of</strong> regulations to be approved for operation:<br />
Production—The<br />
federal Buy America provision requires a certain percentage<br />
<strong>of</strong> the vehicle be produced within the United States. While there<br />
are exceptions sometimes granted through a waiver process, such waivers<br />
cannot be guaranteed.<br />
Safety—Buses<br />
must satisfy regulations that govern safe operations <strong>of</strong> vehicles,<br />
such as the FTA Bus Testing Program and other safety regulations from<br />
the National Highway and Traffic Safety <strong>Administration</strong> (NHTSA). Some<br />
states also place their own standards on vehicle design, including standards<br />
on safety and design standards, such as maximum length for passenger vehicles.<br />
Some state motor vehicle regulations restrict vehicle length to 60 feet<br />
in length and 102 inches in width with axle loading <strong>of</strong> 16,000 pounds.<br />
Pollution Control—The<br />
EPA and local air quality management districts<br />
govern requirements on pollutant emissions. For example, many articulated<br />
and bi-articulated large vehicles are produced only in diesel or electric drive.<br />
Some local air quality management districts also mandate emissions technologies<br />
that vehicle manufacturers currently do not incorporate into the<br />
vehicle models they produce.<br />
Disabled Access<br />
—Many aspects <strong>of</strong> vehicles – boarding interface, interior<br />
layout, placement <strong>of</strong> fare systems, use <strong>of</strong> ITS, and wheelchair securement—<br />
must meet the requirements <strong>of</strong> ADA.
Propulsion Systems<br />
Use <strong>of</strong> clean fuel or alternative propulsion options is increasing throughout the<br />
U.S. transit industry, and many agencies with BRT systems have selected clean<br />
fuel vehicle technologies for their BRT buses.<br />
Several recent studies from the National Renewable Energy Laboratory (NREL)<br />
—one evaluating the experience <strong>of</strong> New York City <strong>Transit</strong> with hybrid and CNG<br />
buses, one on Ebus hybrid-electric buses and trolleys, and one evaluating King<br />
County Metro’s hybrid articulated buses—provide real-world data that may provide<br />
substantive guidance for agencies considering these options.<br />
As the emissions performance <strong>of</strong> diesel engines using ULSD improves and more<br />
communities are opting for hybrid powertrains, the expansion <strong>of</strong> gaseous fuels<br />
for transit seems to be slowing. As a result, engine manufacturers are reducing<br />
the number <strong>of</strong> natural gas engine models available in the transit marketplace.<br />
The previously-mentioned studies provide a number <strong>of</strong> quantified statistics on<br />
various performance aspects <strong>of</strong> the buses on a comparative basis. While the service<br />
cycles in the studies are very different, the studies do highlight some significant<br />
issues regarding performance between the different drive trains, as well as<br />
data related to reliability and maintenance costs.<br />
Implementation Issues During operation<br />
Maintenance Training<br />
New vehicles may require new maintenance skills and procedures, especially if<br />
the BRT vehicle fleet is distinct from other vehicles.<br />
Fleet Interchangeability<br />
Due to branding and service considerations, mixing BRT and regular service vehicles<br />
to address demand changes would not be optimal. Differentiation in vehicles<br />
between fleets may limit ability to procure common components and parts.<br />
Experience with Brt Vehicles<br />
Exhibit 2-6 summarizes vehicle implementations for 41 BRT applications around<br />
the world. The data on the 20 U.S. BRT service implementations reveal that a<br />
distinctive vehicle is the most commonly used BRT element in the U.S., with only<br />
a few cites running standard fleet vehicles on their BRT systems. At a minimum,<br />
most systems use a unique logo and livery to differentiate the BRT from local<br />
bus service. Vehicle configurations range from conventional standard in lengths<br />
Major Elements <strong>of</strong> BRT<br />
as short as 28 ft to 61-ft specialized BRT articulated vehicles. There are now more<br />
systems using at least some 60-ft articulated vehicles than those using only 40-ft<br />
buses.<br />
The 28- to 30-ft buses are single-door vehicles but the higher-capacity 40- to<br />
60-ft vehicles have two or three doors for use as entry and exit channels, as<br />
shown in the exhibit. The Civis, used in Las Vegas, has four doors; Cleveland and<br />
Eugene are the only U.S. systems that feature left-side boarding; both use articulated<br />
vehicles with two left-side and three right-side doors.<br />
Choices for propulsion systems reflect both the technology available at the time<br />
<strong>of</strong> vehicle purchase and transit property policy. Previously, the internal combustion<br />
engine powered by ultra low sulfur diesel (ULSD) or compressed natural gas<br />
(CNG) was the predominant choice for reduced emissions. However, in recent<br />
years, more transit agencies have sought out and purchased diesel hybrid-electric<br />
drive trains for emissions control as well as fuel savings.<br />
Several agencies use CNG buses in their BRT operations, but these are agencies<br />
that use CNG throughout their fleets; given CNG infrastructure costs, it seems<br />
unlikely that transit agencies would purchase CNG vehicles only for BRT operations.<br />
In contrast, several cities are deploying hybrid-electric buses only in their<br />
BRT service, most notably Cleveland, Eugene, and Albuquerque. In these cases,<br />
the propulsion choice seems designed to further differentiate the BRT from the<br />
conventional bus service.<br />
BRT applications in the rest <strong>of</strong> the world reflect a wide range <strong>of</strong> vehicle approaches.<br />
Latin American systems tend to use stylized articulated vehicles, reflecting the<br />
emphasis on creating a high-capacity, “rail-like” transit service. Canadian systems<br />
have adopted varied approaches, with the York VIVA investing heavily in a distinctive<br />
fleet <strong>of</strong> BRT vehicles designed to enhance the system image. By contrast,<br />
Ottawa demonstrates that it is not necessary to use the vehicle as a branding<br />
element; Ottawa operates regular fleet vehicles on its dedicated transitway. Like<br />
Canada, European systems reveal a variety <strong>of</strong> approaches, but there are some<br />
unique vehicles in use in Europe, most notably Eindhoven’s rail-like Phileas buses.<br />
Australia tends to favor high-capacity vehicles with a standard look and livery,<br />
while China also uses high-capacity vehicles but with a specialized BRT look. The<br />
use <strong>of</strong> alternative propulsion options is less common than in the U.S. Most <strong>of</strong><br />
these ciites use diesel, and few use CNG.<br />
2-53
Major Elements <strong>of</strong> BRT<br />
future Market Projects<br />
In addition to the 20 applications noted above, there are an estimated 50 to 70<br />
communities in the U.S. in some stage <strong>of</strong> planning one or more BRT corridors.<br />
Phase I <strong>of</strong> the FTA’s 2007 Bus Rapid <strong>Transit</strong> Vehicle Demand Analysis examined<br />
planned vehicle selections for 63 communities that provided insight into their potential<br />
vehicle procurements. The purpose <strong>of</strong> Phase I was to take a general snapshot<br />
<strong>of</strong> the burgeoning BRT sector and provide a foundation for Phase II <strong>of</strong> the<br />
Vehicle Demand Analysis, which focuses exclusively on “heavy-BRT” properties,<br />
quantifying the vehicle deliveries and elements for these systems over the next<br />
10 years.<br />
Some <strong>of</strong> the more interesting findings from the preliminary results <strong>of</strong> Phase I pertaining<br />
to vehicles and their deployment included the following:<br />
2-54<br />
significant plans for exclusive rights-<strong>of</strong>-way. More than 50 percent <strong>of</strong> the<br />
surveyed communities were planning on creating exclusive right-<strong>of</strong>-ways for<br />
their BRT systems within the next 10 years, an increase <strong>of</strong> more than 40 percent.<br />
This suggests the continuing growth in the use <strong>of</strong> higher capacity buses.<br />
Greater interest in larger vehicles than smaller. More BRT communities<br />
were interested in the larger, 60-ft vehicles than they were in ordering the<br />
smaller, 40-ft vehicles.<br />
Rapid growth <strong>of</strong> biodiesel. In the 2004 analysis, only one transit agency (out<br />
<strong>of</strong> 48 contacted) was interested in exploring the biodiesel fueling option.<br />
Currently, 10 percent <strong>of</strong> the respondents are using it, with substantial interest<br />
from others.<br />
preponderance <strong>of</strong> alternative fuel/advanced propulsion. A total <strong>of</strong> 75<br />
percent <strong>of</strong> the BRT communities were using or planning on implementing<br />
alternative fuels/advanced propulsion in their fleets.<br />
disparity between planned orders versus preferred orders. Although<br />
many agencies were ordering special vehicles for BRT, most agencies would<br />
prefer not to order them, as a lack <strong>of</strong> funding and vehicle availability were<br />
holding them back.<br />
High interest in stylized vehicles. Interest is shifting from specialized vehicles<br />
to stylized articulated vehicles, since no North American manufacturers<br />
have committed to producing any specialized vehicles yet. (With an increasing<br />
emphasis on exclusive right-<strong>of</strong>-ways, deployment <strong>of</strong> longer, bi-articulated<br />
vehicles, or, as is being tested in Snohomish County, WA by Community<br />
<strong>Transit</strong>, a double-tall, two-deck bus may be on the horizon.)<br />
limited interest in automated guidance.<br />
The interest in vehicle guidance,<br />
especially precision docking, would be high if the technology were more<br />
available.<br />
In the end, it appears that the vehicle market has progressed significantly in terms<br />
<strong>of</strong> appearance, economy, emissions, and amenities. Due to dialogue among transit<br />
properties, suppliers, and manufacturers, the domestic bus industry can provide<br />
appropriate vehicles for the varying needs <strong>of</strong> BRT communities, now and in the<br />
future.
Exhibit 2-6: Experience with BRT Vehicles<br />
Major Elements <strong>of</strong> BRT<br />
Albuquerque Boston Silver Line Chicago Cleveland Honolulu<br />
Rapid Ride Washington Street Waterfront:<br />
Airport<br />
Waterfront:<br />
BMIP and City<br />
Point<br />
Configuration Articulated Stylized articulated Articulated Articulated<br />
Express HealthLine<br />
Conventional<br />
standard<br />
Stylized articulated<br />
City<br />
Express Rt. A &<br />
County Express<br />
Length 60' 60’ 60’ 60’ 40’ 60’ 60’<br />
Manufacturer and Model<br />
New Flyer, 2005 and<br />
2007<br />
Articulated<br />
NEOPLAN USA Neoplan Neoplan New Flyer New Flyer<br />
Floor Height Low AN 460 LF Low Low High Low Low<br />
Description <strong>of</strong> Livery /<br />
Image<br />
Interior Features<br />
Red & white paint,<br />
Rapid Ride logo<br />
Molded plastic with<br />
fabric inserts<br />
Right-Side Doors 3<br />
Step low Silver Silver<br />
Silver band similar with T<br />
logo, similar to rail vehicle<br />
livery<br />
Standard seats in 2+2 configuration<br />
Luggage racks Aisle seating<br />
Distinctive<br />
silver livery<br />
Wide aisles and<br />
doors<br />
Standard livery<br />
3 3 3 3<br />
Left-Side Doors 3 2 0<br />
Bus Capacity (Seated) 67 57 38 47 46 58<br />
Bus Capacity (Seated and<br />
Standing)<br />
110 79 53 65 120 130<br />
Wheelchair Loading Front door ramp Ramp Ramp Lift Ramp<br />
Wheelchair Securement belts ICE Tie-down Tie-down Strap<br />
Propulsion System Hybrid-electric<br />
Dual-mode<br />
diesel & electric<br />
traction<br />
Dual-mode diesel<br />
& electric traction<br />
ICE Hybrid<br />
Fuel ULSD CNG ULSD ULSD Diesel Diesel<br />
Diesel / hybridelectric<br />
2-55
Major Elements <strong>of</strong> BRT<br />
2-56<br />
Configuration<br />
Exhibit 2-6: Experience with BRT Vehicles (cont’d.)<br />
Eugene Honolulu Kansas City Las Vegas Los Angeles Los Angeles Miami<br />
EmX<br />
Stylized<br />
articulated<br />
City Express!<br />
Rt. B<br />
MAX MAX Orange Line Metro Rapid<br />
Standard Stylized standard Stylized articulated Stylized articulated<br />
Stylized standard<br />
and articulated<br />
Length 60’ 40’ 40’ 60’ 60’ 40’ / 45’ / 60’<br />
Manufacturer and Model New Flyer Gillig Irisbus CIVIS 2003<br />
NABI 60' BRT-01,<br />
2005<br />
NABI and New<br />
Flyer<br />
South Dade<br />
Busway<br />
Conventional<br />
standard and<br />
minis<br />
30' Optares 40<br />
NABI 40 LFW<br />
Floor Height Low High Low Van Hool A330 Low (15") Low (15") Step low<br />
Description <strong>of</strong> Livery /<br />
Image<br />
Interior Features<br />
Distinctive<br />
green livery<br />
Wide aisles<br />
and doors<br />
Standard livery<br />
Max logo, unique livery<br />
and image, large continuous<br />
windows, sleek look<br />
Modern-looking interior,<br />
increased aisle width, increase<br />
hip-to-knee room,<br />
wider doors & windows<br />
Right-Side Doors 3 2<br />
Low<br />
Sleek, modern lines<br />
with large windows,<br />
Modern auto-like<br />
interior, finished window<br />
glazing<br />
Silver metallic twotone<br />
paint scheme<br />
& Metro Orange<br />
Line branding<br />
USSC Aries cloth<br />
seats<br />
Red/silver twotone<br />
paint scheme;<br />
Metro Rapid name<br />
branding<br />
3 2 / 3 28<br />
Left-Side Doors 2 2 0 4 0 0 52<br />
Bus Capacity (Seated) 0 0 57 40 to 57 ICE<br />
Bus Capacity (Seated and<br />
Standing)<br />
Wheelchair Loading 68 120<br />
45 40 69 48 to 69 Diesel<br />
Ramp (at front<br />
door only)<br />
Ramp (at front<br />
door only)<br />
Wheelchair Securement lift ramp Telescoping ARM Telescoping ARM Ramps<br />
Propulsion System Hybrid ICE<br />
Cummins Westport<br />
L-Gas<br />
Fuel Diesel Diesel ULSD Diesel electric hybrid CNG CNG<br />
ICE Strap<br />
1<br />
2
Configuration<br />
Exhibit 2-6: Experience with BRT Vehicles (cont’d.)<br />
Major Elements <strong>of</strong> BRT<br />
Oakland Orlando Phoenix Pittsburgh Sacramento San Jose Halifax Ottawa<br />
Rapid LYMMO RAPID Busways<br />
Stylized<br />
standard<br />
Stylized standard<br />
Conventional<br />
standard and<br />
articulated<br />
EBus -<br />
Stockton<br />
Standard<br />
Rapid 522 Metro<strong>Link</strong> <strong>Transit</strong>way<br />
Stylized standard<br />
and articulated<br />
Stylized<br />
standard<br />
Standard and<br />
articulated<br />
Length 40.5' 35' 40' 40’ / 60’ 40’ 40’ & 60’<br />
Manufacturer and Model<br />
Van Hool<br />
A330<br />
New Flyer NABI 40LFW<br />
Orion VII<br />
2004<br />
Gillig 2001 (40'),<br />
New Flyer 2002<br />
(60')<br />
New Flyer, 2005<br />
Floor Height Low floor Low Step Low Floor High Low-floor Low floor (15") Low floor<br />
Description <strong>of</strong> Livery /<br />
Image<br />
Interior Features<br />
Red, white<br />
and green<br />
livery<br />
LYMMO<br />
logo<br />
Padded<br />
seats,<br />
<strong>Transit</strong> TV<br />
Silver field with green<br />
and violet RAPID logo<br />
High-back seating,<br />
luggage racks, overhead<br />
lighting, reclining seats<br />
Cushioned<br />
seats<br />
Standard<br />
branded<br />
Standard<br />
Full bus wraps<br />
Typical transit<br />
bus - front facing,<br />
upholstered seats<br />
Blue, yellow,<br />
white patterned<br />
livery and<br />
unique<br />
branding<br />
Cloth seats,<br />
reclining with<br />
arm and foot<br />
rests<br />
New Flyer<br />
Invero & D60LF<br />
14.5 - 16"; 11.5"<br />
kneeling<br />
Maple leaf<br />
livery; similar to<br />
rest <strong>of</strong> fleet<br />
Cloth seats<br />
Right-Side Doors<br />
Left-Side Doors<br />
3 2 2 / 3 2 2 / 3<br />
Bus Capacity (Seated) 28 20 41 34 38 / 57 40 44 / 64<br />
Bus Capacity (Seated and<br />
Standing)<br />
77 36 63 55 62 / 98 60 90 / 120<br />
Wheelchair Loading Ramp Ramp Ramp Lift<br />
Kneeling, lowfloor,<br />
ramp<br />
Low-floor 15"<br />
Low-floor<br />
buses, kneeling<br />
buses, ramps<br />
Low floor buses,<br />
kneeling buses,<br />
ramps<br />
Wheelchair Securement<br />
Rear-facing<br />
position<br />
Strap Strap Strap<br />
Farward<br />
facing<br />
Forward-facing<br />
4-point restraint<br />
Belt Belt<br />
Propulsion System ICE ICE ICE ICE ICE ICE ICE<br />
Fuel ULSD CNG LNG Diesel, CNG CNG Low-sulfur diesel Biodiesel Diesel<br />
2-57
Major Elements <strong>of</strong> BRT<br />
2-58<br />
Configuration<br />
Exhibit 2-6: Experience with BRT Vehicles (cont’d.)<br />
York Bogotá Guayaquil Pereira Amsterdam Caen Edinburgh<br />
VIVA<br />
(All Routes)<br />
Standard and<br />
articulated<br />
Transmilenio Metrovia Megabus Zuidtangent Tram on Wheels Fastlink<br />
Stylized articulated<br />
Stylized<br />
standard and<br />
articulated<br />
Stylized<br />
Articulated<br />
Articulated Bi-articulated<br />
Length 40’, 60’ 18 m 18 m 18m 24.5m<br />
Manufacturer and Model<br />
Van Hool A330 &<br />
AG300<br />
Volvo, Mercedes,<br />
Scania, various<br />
models, various years<br />
Van Hool<br />
Bombardier GLT<br />
'tram-on-tires'<br />
Standard single and<br />
double deck<br />
11.4m( double deck),<br />
12m single deck<br />
Volvo B7RLE single<br />
deck, Dennis Trident<br />
Double Deck<br />
Floor Height Low 0.9 m 0.9 m Low Low Low<br />
Description <strong>of</strong> Livery /<br />
Image<br />
Interior Features<br />
Metallic blue with<br />
VIVA logo<br />
Cloth seats<br />
in spacious<br />
arrangement, tables<br />
at some rear seats,<br />
large windows<br />
Red, branded<br />
articulated buses<br />
Molded plastic seats,<br />
front/rear and side<br />
facing<br />
Blue, branded<br />
articulated<br />
buses<br />
Green, branded<br />
articulated buses<br />
Molded plastic<br />
seats, front/rear<br />
and side facing<br />
Zuidtangent<br />
logo, red<br />
braded buses<br />
Blue & white-<br />
twisto<br />
"Bistro" style semicircle<br />
seating at rear<br />
Standard<br />
Right-Side Doors 2 / 3 1 2 3 2<br />
Left-Side Doors 4<br />
Bus Capacity (Seated) 36 / 54 154 69 or 42<br />
Bus Capacity (Seated and<br />
Standing)<br />
50 / 72 160 130 195 88 or 70<br />
Wheelchair Loading<br />
Low floor buses,<br />
kneeling buses,<br />
ramps<br />
Level boarding Level boarding Level boarding Tilting low floor<br />
Kneeling, low floor &<br />
ramp<br />
Wheelchair Securement Belt Rear facing<br />
Propulsion System ICE ICE ICE<br />
Fuel Diesel<br />
Diesel, CNG pilot<br />
project underway<br />
Diesel Diesel<br />
Dual mode-traction<br />
motor on-rail/<br />
Diesel<br />
with 3 buses<br />
diesel engine <strong>of</strong>f-rail
Configuration<br />
Length<br />
Exhibit 2-6: Experience with BRT Vehicles (cont’d.)<br />
Major Elements <strong>of</strong> BRT<br />
Eindhoven Leeds London Rouen Utrecht Adelaide Brisbane<br />
Phileas -Western<br />
Corridor<br />
Articulated,<br />
bi-Articulated<br />
18m<br />
24m (1 only)<br />
Manufacturer and Model Phileas- APTS<br />
Superbus Crawley TEOR Busway<br />
Standard Standard Articulated Bi-articulated<br />
Scania l113 Single<br />
Deck, Volvo B7TL<br />
Double Decker, Scania<br />
L94UB Single Deck<br />
11 m<br />
17.9m<br />
18m<br />
Scania/ Volvo Agora<br />
25m<br />
Van Hool AGG<br />
330<br />
Floor Height Low Low Low Low Low<br />
Description <strong>of</strong> Livery /<br />
Image<br />
Phileas bus logo Standard<br />
Fastway logo,<br />
blue/grey<br />
brand<br />
North East<br />
Busway<br />
Standard<br />
articulated,<br />
standard rigid<br />
Merc Rigid 37.1’<br />
Merc Artic 57.4’<br />
Scania Rigid 38.7’<br />
Mercedes Artic 60,<br />
Mercedes Rigid 40,<br />
Scania Rigid 40<br />
Merc - step high,<br />
Scania - step low<br />
South East and<br />
Inner Northern<br />
Busways<br />
Standard rigid<br />
40.8’<br />
MAN 18.310 -<br />
Volgren/ Scania<br />
L94UB - Volgren<br />
Mainly step low;<br />
some step high<br />
TEOR Logo Standard Standard Standard<br />
Interior Features<br />
Luggage racks over<br />
wheel hubs<br />
Right-Side Doors 3 1 2 4 4 0 0<br />
Left-Side Doors Artic 3; Rigid 2 2<br />
Bus Capacity (Seated)<br />
Bus Capacity (Seated and<br />
Standing)<br />
30 (single-artic),<br />
38 (bi-artic)<br />
121 (single-artic)<br />
159 (bi-artic)<br />
Wheelchair Loading Level boarding Kneeling, low floor<br />
Wheelchair Securement<br />
Propulsion System<br />
Fuel<br />
Hybrid<br />
(LPG/electric)<br />
36 43 or 40 90<br />
67 110 or 115 148<br />
Kneeling, low<br />
floor<br />
1 wheelchair<br />
capacity<br />
Artic 65<br />
Rigid 40/43<br />
Artic 95<br />
Rigid 75<br />
Level boarding Level boarding Front door ramp Front door ramp<br />
Rear facing,<br />
no straps<br />
44<br />
62<br />
Rear facing,<br />
no straps<br />
Diesel Diesel Diesel Diesel Diesel Mix <strong>of</strong> diesel, CNG<br />
2-59
Major Elements <strong>of</strong> BRT<br />
2-60<br />
Liverpool-<br />
Parramatta T-Way<br />
Exhibit 2-6: Experience with BRT Vehicles (cont’d.)<br />
Sydney Beijing Hangzhou Kunming<br />
North-West T-Way -<br />
Blacktown-Parklea<br />
North-West T-Way -<br />
Parramatta-Rouse Hill<br />
Line 1 Line B1 Busway Network<br />
Configuration Standard rigid Standard rigid Standard rigid Articulated Articulated Standard<br />
Length 41’ 41’ 41’ 18 m 18 m 9 - 12 m<br />
Manufacturer and Model Volvo B12BLE Rigid Mercedes/Scania Scania IVECO Neoplan IVECO<br />
Floor Height Step low Step high<br />
Description <strong>of</strong> Livery /<br />
Image<br />
Interior Features<br />
Step mixed low and step<br />
high<br />
Standard White, red stripe Yellow<br />
Low Low High<br />
Specialized BRT<br />
vehicles<br />
Specialized red BRT<br />
vehicles<br />
Right-Side Doors 0 0 0 0 3 2<br />
Left-Side Doors 2 2 2 3 0 0<br />
Bus Capacity (Seated) 44 51 49<br />
Bus Capacity (Seated and<br />
Standing)<br />
62 90 74 160<br />
Wheelchair Loading<br />
Front door, low floor<br />
ramp<br />
Mix, with a few low floor<br />
ramps<br />
Mix, with a few low floor<br />
ramps<br />
Low-floor, level<br />
platforms<br />
Wheelchair Securement<br />
Propulsion System<br />
Rear facing, no straps Rear facing, no straps Rear facing, no straps<br />
Fuel Euro 3 diesel Diesel Diesel Diesel
farE CollECtIon<br />
Description<br />
role <strong>of</strong> fare Collection in Brt<br />
Fare collection directly affects ridership and revenue. It also plays a key role<br />
in customer service, marketing, planning and operations. With BRT, one <strong>of</strong> the<br />
more important fare collection objectives is to expedite efficient boarding, i.e.,<br />
to minimize dwell times, for what are <strong>of</strong>ten extremely busy services. Key fare system<br />
design factors include the type <strong>of</strong> fare structure (e.g., flat fare versus zone- or<br />
distance-based pricing), the type <strong>of</strong> fare collection (e.g., pay on-board vs. <strong>of</strong>fboard,<br />
pro<strong>of</strong>-<strong>of</strong>-payment), and the types <strong>of</strong> payment technologies and fare media<br />
(e.g., paper vs. electronic media). This section focuses on the specific fare collection<br />
processes, structures, and technologies that might be considered for BRT<br />
systems. It describes the various fare collection options for BRT systems and provides<br />
order <strong>of</strong> magnitude cost estimates for the different types <strong>of</strong> options. (More<br />
information on fare collection systems can be found in the following <strong>Transit</strong> Cooperative<br />
Research Program publications: “Fare Policies, Structures, and Technologies<br />
Update,” TCRP Report 94, 2003; “A Toolkit for Self-Service, Barrier-Free<br />
Fare Collection,” TCRP Report 80, 2002; “Multipurpose <strong>Transit</strong> Payment Media,”<br />
TCRP Report 32, 1998; “Bus <strong>Transit</strong> Fare Collection Practices,” TCRP Synthesis <strong>of</strong><br />
<strong>Transit</strong> Practice 26, 1997.)<br />
Characteristics <strong>of</strong> fare Collection<br />
The three primary design characteristics <strong>of</strong> any fare collection system are the<br />
fare collection process, fare media and payment options, and fare structure.<br />
Fare Collection Process—The<br />
fare collection process defines how the<br />
fare is physically paid, processed, and verified. It can influence a number <strong>of</strong><br />
system characteristics, including service times (dwell time and reliability),<br />
fare evasion and enforcement procedures, operating costs (labor and maintenance),<br />
and capital costs (equipment and payment options). The basic<br />
types <strong>of</strong> fare collection are driver validation (i.e., pay on-board), conductor<br />
validation, barrier-enforced payment, and barrier-free payment (or pro<strong>of</strong>-<strong>of</strong>payment).<br />
Fare Media and Payment Options—The<br />
fare media and payment<br />
options are the means by which the fare is actually paid (e.g., cash, tokens,<br />
paper tickets/flash passes, and electronic passes/farecards). The particular<br />
Major Elements <strong>of</strong> BRT<br />
media/options reflect the nature <strong>of</strong> the fare structure and collection process,<br />
as well as the technologies used (i.e., paper, magnetics, and/or smart<br />
cards). The choice and design <strong>of</strong> fare media can influence the service times,<br />
evasion and enforcement procedures, and the potential for multiple applications/partnerships,<br />
as well as the capital and operating costs <strong>of</strong> the fare<br />
collection system.<br />
Fare Structure—The<br />
fare structure includes the basic pricing strategy<br />
(e.g., flat fare vs. fare differentiation), the transfer policy, and the actual<br />
pricing levels. As such, it influences the choice <strong>of</strong> fare collection process as<br />
well as the type <strong>of</strong> fare media/payment options; however, the fare structure<br />
can also be influenced by the payment technologies selected for BRT and<br />
by the existing fare structure <strong>of</strong> the overall transit system (or possibly the<br />
entire region). Fare structures are established based on customer, financial,<br />
operational, and possibly political considerations. The two basic types <strong>of</strong><br />
fare structure are flat fare and differentiated fares (i.e., reflecting distance<br />
traveled, time <strong>of</strong> day <strong>of</strong> travel, or quality <strong>of</strong> service).<br />
fare Collection options<br />
Fare Collection Process<br />
Two basic categories <strong>of</strong> fare collection processes are on-board payment systems<br />
and <strong>of</strong>f-vehicle payment systems. The on-board category includes the drivervalidated<br />
system and the conductor-validated system. The <strong>of</strong>f-vehicle category<br />
includes both barrier systems and barrier-free systems. Deciding on an on-board<br />
or <strong>of</strong>f-vehicle fare collection process is key for the BRT system and it must be<br />
done early in the planning stages, as it will affect other design and operational<br />
elements <strong>of</strong> the system. Issues associated with this decision are discussed in the<br />
Implementation Issues section. The basic types <strong>of</strong> fare collection and verification<br />
options are described below, including their relative motivations and implications.<br />
(Unit cost ranges presented in this section are based on a combination<br />
<strong>of</strong> information from transit agencies that have recently procured fare collection<br />
systems and order-<strong>of</strong>-magnitude estimates provided by various fare equipment<br />
vendors. It must be kept in mind that the actual cost associated with implementation<br />
<strong>of</strong> a particular option depends on the specific functionalities/specifications,<br />
quantity purchased, and specific manufacturer.)<br />
2-61
Major Elements <strong>of</strong> BRT<br />
fare Collecton options<br />
On-Board, Driver-Validated System<br />
This approach represents systems where fare payment and validation<br />
generally occur on-board, and the process is overseen by the driver.<br />
It typically involves a farebox and/or a standalone processing unit for<br />
tickets or cards adjacent to the operator.<br />
Cost: Exhibit 2-7 gives capital and operating costs for various fare collection<br />
options. Exhibit 2-7 table shows upper and lower estimates <strong>of</strong><br />
capital costs (per unit) for key fare collection system elements related<br />
to driver validated systems. Operating costs are presented in Exhibit<br />
2-7 as percentage <strong>of</strong> capital expenditures. These ranges are useful for<br />
developing order-<strong>of</strong>-magnitude estimates <strong>of</strong> the total cost <strong>of</strong> a fare collection<br />
system; the actual costs will depend heavily on the specifications<br />
and functionality, quantity <strong>of</strong> equipment purchased, and specific<br />
manufacturers <strong>of</strong> the products purchased.<br />
2-62<br />
system/subsystem unit<br />
on-Board, Driver-Validated system<br />
Onboard Fare<br />
Collection—<br />
Houston, Texas<br />
Capital Cost range<br />
low High<br />
Electronic registering farebox Farebox $5,000 $6,000<br />
Electronic registering farebox (with smart card reader) Farebox $6,000 $8,000<br />
Validating farebox (includes magnetic card processing unit) Farebox $12,000 $13,000<br />
Validating farebox (with smart card reader) Farebox $13,000 $14,000<br />
Stand-alone smart card processing unit Vehicle $1,500 $2,000<br />
Integrated farebox smart card module Module $500 $1,000<br />
Bus operator control unit Vehicle $1,500 $2,000<br />
Magnetic farecard processing unit (upgrade) Unit $4,000 $6,000<br />
On-board probe equipment Vehicle $500 $1,500<br />
Garage probe equipment Garage $2,500 $3,500<br />
ReAsons to Implement<br />
• Does not require significant fare collection<br />
infrastructure outside the vehicle and is thus<br />
typically much less expensive than other approaches.<br />
• Better control <strong>of</strong> fare evasion (compared to<br />
pro<strong>of</strong>-<strong>of</strong>-payment).<br />
ConsIdeRAtIons/<br />
RequIRements<br />
• Requiring passengers to board<br />
through a single front door and<br />
pay the fare as they enter—<br />
May result in significant dwell<br />
times on busy BRT routes,<br />
particularly those with heavy<br />
passenger turnover.<br />
• Labor requirements—May involve<br />
additional maintenance,<br />
revenue servicing/collection,<br />
and clerical/data support<br />
(depending on incremental<br />
number <strong>of</strong> fareboxes over existing<br />
number).<br />
Exhibit 2-7: Estimated Operating & maintenance Costs for<br />
Fare Collection System Elements (2006 US $)*<br />
Cost Elements (Variable Costs) Low High<br />
Spare parts (% <strong>of</strong> equipment cost) 10% 15%<br />
Support services (% <strong>of</strong> equip. cost, for training, documentation,<br />
revenue testing & warranties)<br />
10% 15%<br />
Installation (% <strong>of</strong> equipment cost) 3% 10%<br />
Nonrecurring engineering & s<strong>of</strong>tware costs (% <strong>of</strong> equipment cost) 15% 30%<br />
Contingency (% <strong>of</strong> equipment/operating cost) 10% 15%<br />
Equipment maintenance costs (% <strong>of</strong> equipment cost) 5% 7%<br />
S<strong>of</strong>tware licenses/system support (% <strong>of</strong> systems/s<strong>of</strong>tware cost) 10% 20%<br />
Revenue handling costs (% <strong>of</strong> annual cash revenue)<br />
Clearinghouse (% <strong>of</strong> annual AFC revenue, for card distribution,<br />
3% 10%<br />
revenue allocation, etc) (depends on nature <strong>of</strong> regional fare<br />
program, if any)<br />
3% 6%<br />
*Cost information from recent system procurements, vendor estimates and general industry<br />
experience.
On-Board, Conductor-Validated System<br />
This approach allows the passenger to either pre-pay or buy a<br />
ticket on-board from a conductor; unlike pro<strong>of</strong>-<strong>of</strong>-payment,<br />
all passengers are typically checked.<br />
Cost: (for Operating & Maintenance costs, see Exhibit 2-7)<br />
system/subsystem unit<br />
Capital Cost range<br />
low High<br />
Station hardware/s<strong>of</strong>tware Station $10,000 $25,000<br />
Garage hardware/s<strong>of</strong>tware Garage $10,000 $50,000<br />
Central hardware/s<strong>of</strong>tware System $75,000 $300,000<br />
Off-Board Barrier System<br />
This approach involves fare payment at a turnstile or faregate,<br />
or possibly payment directly to a ticket agent, in an<br />
enclosed station area or bus platform. It may involve entry<br />
control only or entry and exit control (particularly for distance-based<br />
fares).<br />
Turnstiles—Transmilenio<br />
ReAsons to<br />
Implement<br />
• Shorter dwell time,<br />
compared to a<br />
driver-validated<br />
system.<br />
• Likelihood <strong>of</strong><br />
lower fare evasion,<br />
compared to a<br />
barrier-free/pro<strong>of</strong> <strong>of</strong><br />
payment system.<br />
• Creates clearlydesignated<br />
paid<br />
zones to process<br />
fare payment<br />
<strong>of</strong>f the vehicle,<br />
removing delays<br />
associated with fare<br />
payment from the<br />
boarding process.<br />
• Ability to better<br />
control fare evasion<br />
(compared to<br />
pro<strong>of</strong>-<strong>of</strong>-payment).<br />
• Reduced cost <strong>of</strong><br />
fare inspectors as<br />
needed in a pro<strong>of</strong><strong>of</strong>-payment<br />
or conductor<br />
validation<br />
system.<br />
Major Elements <strong>of</strong> BRT<br />
ConsIdeRAtIons/RequIRements<br />
• In North America, this approach tends to be used only<br />
on commuter rail systems and is rarely applied to urban<br />
modes such as BRT (or light rail) due to the relatively<br />
short distances between stops/stations and the potential<br />
for crowded vehicles.<br />
• Higher labor requirements than other approaches<br />
(TCRP Report 80, Table 2-6):<br />
‒ Inspection personnel 1 FTE/350 daily<br />
passengers<br />
‒ Maintenance personnel 1 FTE/25 TVMs<br />
‒ Revenue servicing/collector 1 FTE/25 TVMs<br />
‒ Data processing/clerical staff 1 FTE/15,000 daily<br />
riders<br />
‒ Security staff 1 FTE/15 stations<br />
‒ Fare media sales staff 1 FTE/3,000 daily<br />
passengers<br />
• Requires an enclosed station or platform and is therefore<br />
difficult to implement in corridors with restricted crosssection<br />
width.<br />
• Barriers need to be designed to accommodate access by<br />
disabled passengers.<br />
• Highest capital cost <strong>of</strong> any <strong>of</strong> these approaches, as TVMs<br />
will be needed in addition to the faregates.<br />
• Moderate labor requirements (TCRP Report 80,<br />
Table 2-6):<br />
‒ Maintenance personnel 1 FTE/25 TVMs or<br />
faregates<br />
‒ Revenue servicing/collector 1 FTE/25 TVMs<br />
‒ Security staff 1 FTE/station<br />
‒ Data processing/clerical staff 1 FTE/15,000 daily<br />
riders<br />
‒ Fare media sales staff 1 FTE/3,000 daily<br />
passengers<br />
2-63
Major Elements <strong>of</strong> BRT<br />
Off-Board, Barrier-Free, or Pro<strong>of</strong>-<strong>of</strong>-<br />
Payment (POP) System<br />
In this approach, the passenger is required to carry a valid<br />
(by day, time, and fare zone, if applicable) ticket or pass when<br />
on the vehicle and is subject to random inspection by roving<br />
personnel. POP typically requires ticket vending and/or<br />
validating machines.<br />
An alternative approach that some agencies are considering<br />
for BRT is a hybrid POP/pay-on-board system. Under this hybrid<br />
approach, passengers with passes are allowed to board<br />
through the rear door <strong>of</strong> the vehicle. It decreases dwell times<br />
although it increases the risk <strong>of</strong> fare evasion compared to a Barrier free fare—Translink<br />
completely on-board system. Some agencies are considering<br />
hybrid pay-on-board/pro<strong>of</strong>-<strong>of</strong>-payment systems, in which there are a limited number <strong>of</strong> ticket<br />
vending machines (only at a few major stops/stations), and rear-door boarding is allowed for<br />
passengers who have prepaid.<br />
Cost: (for Operating & Maintenance costs, see Exhibit 2-7)<br />
system/subsystem unit<br />
Capital Cost range<br />
low High<br />
Ticket vending machine<br />
(TVM)<br />
Unit $25,000 $60,000<br />
TVM upgrade —smart card<br />
processing<br />
Unit $5,000 $7,500<br />
Stand-alone validator Unit $2,000 $5,000<br />
Hand-held validator Unit $1,500 $4,000<br />
Station hardware/s<strong>of</strong>tware Station $10,000 $25,000<br />
Garage hardware/s<strong>of</strong>tware Garage $10,000 $50,000<br />
Central hardware/s<strong>of</strong>tware System $75,000 $300,000<br />
fare Media/Payment options<br />
The selection <strong>of</strong> particular fare media or other payment options reflects the<br />
agency’s fare structure and collection process, as well as the technologies used<br />
(i.e., paper, magnetics and/or smart cards). The type <strong>of</strong> BRT running way, and<br />
passenger demands at stations also influences the decision. The fare equipment/<br />
technology must be capable <strong>of</strong> reading and processing the selected media, and<br />
the payment options <strong>of</strong>fered depends on the fare structure.<br />
The three primary types <strong>of</strong> fare media are cash/paper, magnetic farecards, and<br />
smart cards. The latter two options are categorized as electronic fare collection<br />
2-64<br />
ReAsons to<br />
Implement<br />
• Supports multiple<br />
door boarding and<br />
thus lower dwell<br />
times, compared to<br />
a driver validation<br />
system; for this reason,<br />
it is frequently<br />
used in light rail<br />
systems.<br />
• Needs fewer fare<br />
inspectors, compared<br />
to conductor<br />
validation.<br />
ConsIdeRAtIons/RequIRements<br />
• Increased risk <strong>of</strong> fare evasion.<br />
• When considering implementing POP, a transit agency<br />
should consider how passenger loads and turnover and<br />
interior vehicle layout will affect the ability to do on-board<br />
inspection.<br />
• High labor requirements (TCRP Report 80, Table 2-6)<br />
‒ Roving inspection personnel 1 FTE/3,000 daily<br />
passengers<br />
‒ Maintenance personnel 1 FTE/25 TVMs<br />
‒ Revenue servicing/collector 1 FTE/25 TVMs<br />
‒ Data processing/clerical staff 1 FTE/15,000 daily<br />
riders<br />
‒ Security staff 1 FTE/15 stations<br />
‒ Fare media sales staff 1 FTE/3,000 daily<br />
passengers<br />
(EFC). It should be noted that, while EFC <strong>of</strong>fers a number <strong>of</strong> benefits to both the<br />
agency and passengers through the additional functions that it <strong>of</strong>fers, implementing<br />
EFC may add (rather than reduce) existing fare collection costs.<br />
There are emerging alternatives for fare payment that generally involve media <strong>of</strong><br />
broader use, not exclusively utilized for fare payment. The two primary emerging<br />
options—payment with commercial credit/debit cards and payment with mobile<br />
phones—are still under development and have not yet been widely implemented.
Cash, Tokens, and Paper Media<br />
Traditional fare media include the use <strong>of</strong> cash (coins and bills),<br />
tokens, and/or paper fare (tickets, transfer, and flash passes).<br />
These manual fare collection media are widely applied in transit<br />
systems since they are the simplest fare equipment.<br />
Cost: (for Operating & Maintenance costs, see Exhibit 2-7)<br />
system/subsystem unit<br />
Capital Cost range<br />
low High<br />
Simple mechanical farebox Unit $2,000 $2,000<br />
Complex electronic registering<br />
farebox<br />
Unit $6,000 $6,000<br />
Paper media Ticket/Pass $0.01 $0.04<br />
Magnetic Stripe Farecards<br />
Magnetic stripe cards are made <strong>of</strong> heavy paper or plastic and<br />
have an imprinted magnetic stripe that stores information<br />
about its value or use. This type <strong>of</strong> fare media involves the use<br />
<strong>of</strong> electronic readers, which either determine validity <strong>of</strong> a pass<br />
or deduct the proper fare from stored value (or stored rides)<br />
on a farecard when a card is swiped. Magnetic technology can<br />
be either read-only or read-write (i.e., for stored value/ride);<br />
read-write units can also facilitate the on-board issuance <strong>of</strong><br />
magnetic farecards (e.g., transfers or day passes).<br />
Cost: (for Operating & Maintenance costs, see Exhibit 2-7)<br />
system/subsystem<br />
Magnetic stripe farecards<br />
unit<br />
Capital Cost range<br />
low High<br />
Validating farebox with magnetic<br />
card processing<br />
Farebox $12,000 $13,000<br />
Magnetic stripe card Card $0.01 $0.30<br />
Station hardware/s<strong>of</strong>tware Station $10,000 $25,000<br />
Garage hardware/s<strong>of</strong>tware Garage $10,000 $50,000<br />
Central hardware/s<strong>of</strong>tware System $75,000 $300,000<br />
Metrocard (magnetic strip)—<br />
MTA<br />
ReAsons to<br />
Implement<br />
• No need for electronic<br />
processing <strong>of</strong><br />
fare media.<br />
• Paper tickets or<br />
flash passes <strong>of</strong>fer<br />
faster fare validation<br />
compared to<br />
electronic media.<br />
• Media are typically<br />
low cost (ranging<br />
from $0.02 to $0.30<br />
for base material<br />
and printing<br />
requirements).<br />
• May be compatible<br />
with existing payment<br />
media within<br />
a region.<br />
Major Elements <strong>of</strong> BRT<br />
ConsIdeRAtIons/RequIRements<br />
• Requires fare equipment on vehicles. Involves BRT vehicle<br />
operators in the fare collection and verification process.<br />
• Boarding times (in driver validation systems) can be<br />
slower where exact change is required.<br />
• Flash passes or tickets require visual inspection by drivers,<br />
but are typically processed faster than cash.<br />
• Collection <strong>of</strong> data on ridership requires driver input, possibly<br />
affecting labor contracts.<br />
• Dwell times will be longer with magnetic media than with<br />
smart cards.<br />
• Higher equipment maintenance costs than with smart<br />
card-processing equipment.<br />
• Requires supporting electronic fare collection infrastructure<br />
including sales network.<br />
2-65
Major Elements <strong>of</strong> BRT<br />
Smart Cards<br />
Smart cards carry computer chips that can support the same<br />
payment options as magnetic stripe media. They are read by<br />
contact (placing a card next to a reader) or in a contactless<br />
manner passing a card within a certain distance <strong>of</strong> a reader.<br />
They can be used for multiple applications (e.g., transit payment<br />
and one or more other functions such as parking or toll<br />
payment, or possibly non-transportation applications such as Smart card—WMATA<br />
retail purchases or university campus functions). Smart cards<br />
also facilitate fare integration among multiple transit systems<br />
in a region.<br />
Contactless smart cards (also sometimes called “proximity cards”), in particular, have begun to<br />
receive considerable attention by transit agencies around the world as a viable fare medium.<br />
Cost: (for Operating & Maintenance costs, see Exhibit 2-7)<br />
system/subsystem<br />
smart Cards<br />
unit<br />
Capital Cost range<br />
low High<br />
Validating farebox with smart<br />
card reader<br />
Farebox $13,000 $14,000<br />
Smart card (plastic) Card $1.50 $4.00<br />
Smart card (paper) Card $0.30 $0.75<br />
Station hardware/s<strong>of</strong>tware Station $10,000 $25,000<br />
Garage hardware/s<strong>of</strong>tware Garage $10,000 $50,000<br />
Central hardware/s<strong>of</strong>tware System $75,000 $300,000<br />
While the cost <strong>of</strong> the cards is much higher than the cost <strong>of</strong> magnetic stripe farecards, it is declining.<br />
The actual unit cost will depend on the manufacturer, capabilities and quantity <strong>of</strong> the<br />
cards ordered. Also, a smart card can last 3 to 5 years, making that option economical (over<br />
the long run) compared to its magnetic counterpart, which usually lasts no more than a few<br />
months before requiring replacement. Also, a new, lower-cost type <strong>of</strong> smart card is coming into<br />
the marketplace, produced in paper. These paper cards have a useful life comparable to a paper<br />
magnetic card, and may cost as little as $0.30 apiece, depending on quantities ordered.<br />
2-66<br />
ReAsons to Implement<br />
• Faster processing times (for contactless smart<br />
cards) than magnetic stripe cards; thus, the<br />
potential for faster boarding times in a driver<br />
validation system.<br />
• Lower maintenance and higher reliability<br />
because contactless smart card readers have no<br />
moving parts or slots into which foreign objects<br />
can be jammed.<br />
• The smart card devices tend to be compact,<br />
providing considerable installation flexibility.<br />
• Ease <strong>of</strong> use leads to higher rates <strong>of</strong> use and<br />
adoption by passengers.<br />
• Can be used for multiple applications - transit<br />
payments and other uses.<br />
ConsIdeRAtIons/<br />
RequIRements<br />
• Requires an EFC infrastructure<br />
including sales network.<br />
• In a POP system, requires<br />
inspectors with handheld electronic<br />
card readers to check for<br />
valid payment.<br />
• Higher up-front cost <strong>of</strong> the<br />
cards themselves, compared to<br />
magnetic stripe farecards.
Emerging Options<br />
Contactless fare payment typically involves cards issued by the transit agency. However, at least<br />
two other options for fare payment an agency might consider are emerging: commercial credit/<br />
debit cards and mobile personal communication devices.<br />
Commercial Credit/Debit Cards—Commercial credit/debit cards containing contactless<br />
chips have been introduced by banks for use in retail and other payments. <strong>Transit</strong> agencies<br />
are beginning to test the use <strong>of</strong> these cards for payment <strong>of</strong> fares, and this could emerge as a<br />
viable option, to supplement, or perhaps to eventually replace some or all, agency-issued fare<br />
media.<br />
Mobile Personal Communication Devices—Another emerging option is the use <strong>of</strong><br />
mobile phones or similar devices for fare payment. This can involve downloading a fare instrument<br />
directly to a mobile phone and then using the phone to pay the fare, either by touching<br />
the phone to a contactless card reader (essentially using it as a form <strong>of</strong> smart card) or using the<br />
phone’s screen to display pro<strong>of</strong> <strong>of</strong> payment to a fare inspector or bus operator.<br />
ReAsons to Implement<br />
• Deeper penetration into the<br />
broader consumer market.<br />
• More user-friendly, as one<br />
device can be used for multiple<br />
applications.<br />
• More marketing opportunities.<br />
Major Elements <strong>of</strong> BRT<br />
ConsIdeRAtIons/RequIRements<br />
• Required coordination with other institutions,<br />
including private and non-transportation<br />
related organizations<br />
2-67
Major Elements <strong>of</strong> BRT<br />
fare structure<br />
The fare structure influences the choice <strong>of</strong> fare collection process as well as the<br />
type <strong>of</strong> fare media/payment options. Fare structures are based on an agency’s customer,<br />
financial, operational and political goals. Two basic types <strong>of</strong> fare structures<br />
are flat fares and differentiated fares.<br />
fare structure<br />
Flat Fares<br />
In a flat fare structure, the fare is the same regardless <strong>of</strong> distance traveled, time <strong>of</strong> day, or quality<br />
<strong>of</strong> service.<br />
Differentiated Fares<br />
With a differentiated fare structure, fares vary, depending in one or more <strong>of</strong> the following<br />
ways:<br />
• Distance-based or zonal fares—fare<br />
is charged as a direct or indirect function <strong>of</strong><br />
the distance traveled. Bus operators may collect the fare when passengers board or, more<br />
rarely, as they exit the vehicle.<br />
• Time-<strong>of</strong>-day-based fares—fare<br />
differs depending on the time <strong>of</strong> day or day <strong>of</strong> week<br />
(e.g., lower fares during <strong>of</strong>f-peak hours or on weekends).<br />
• Service-based fares—fare<br />
depends on the type or quality <strong>of</strong> service (e.g., a higher fare<br />
is charged for express bus, rail, or BRT service than for regular bus service).<br />
• Free (or reduced) fare area or service —free or reduced fares are charged in a designated<br />
location (e.g., a downtown free-fare zone) or on a special service (e.g., a downtown<br />
circulator service).<br />
2-68<br />
ReAsons to Implement<br />
• Simplifies fare payment, reducing<br />
potential confusion on the<br />
part <strong>of</strong> passengers and potential<br />
disputes with operators, potentially<br />
speeding up boarding.<br />
• Simplifies enforcement, especially<br />
in a POP system.<br />
ReAsons to Implement<br />
• Greater potential to match<br />
fare paid to service consumed;<br />
higher operating costs associated<br />
with certain types <strong>of</strong> service<br />
(longer trips, peak service, and<br />
“premium” (rail, express bus and<br />
BRT) service are reflected in a<br />
higher fare.<br />
• Differentiated fares have a<br />
higher revenue-generating<br />
potential than do flat fares.<br />
ConsIdeRAtIons/RequIRements<br />
• Fare does not reflect the higher operating costs<br />
associated with serving longer trips, providing<br />
peak service, and operating “premium” (i.e., rail,<br />
express bus and BRT) service.<br />
• Typically, has lower revenue-generating potential<br />
than a differentiated fare structure.<br />
ConsIdeRAtIons/RequIRements<br />
• Adds complexity to the system, making it more<br />
difficult for riders to understand and use it.<br />
• May lead to inequitable fares, such as zonal<br />
systems or riders making very short trips but<br />
crossing a zone boundary.<br />
• Requires enforcement.
Effects <strong>of</strong> Fare Collection Elements on System Performance and Benefits<br />
Exhibit 2-8 summarizes the links between the fare collection process, fare media/<br />
payment options and fare structure and the BRT system performance indicators<br />
and system benefits identified in Chapter 1. These links are explored further in<br />
Chapters 3 and 4.<br />
Exhibit 2-8: Summary <strong>of</strong> Effects <strong>of</strong> Fare Collection Elements on System Performance<br />
Fare Collection Process<br />
On-Board<br />
• Driver-Validated<br />
• Conductor-Validated<br />
Off-Board<br />
• Barrier Pro<strong>of</strong>-<strong>of</strong>-Payment<br />
Fare Media/Payment<br />
Options<br />
• Cash, Tokens & Paper<br />
• Magnetic Stripe Farecards<br />
• Smart Cards<br />
• Emerging Options<br />
(Credit/Debit Cards and<br />
Mobile Communication<br />
Devices)<br />
Fare Structure<br />
• Flat<br />
• Differentiated<br />
Major Elements <strong>of</strong> BRT<br />
Travel Time Savings Reliability Identity and Image Safety and Security Capacity Accessibility<br />
Off-board payment<br />
enables all-door<br />
boarding, reducing<br />
vehicle dwell time<br />
and, thus, overall<br />
travel time. On-board<br />
conductor-validated<br />
fare payment allows<br />
faster boarding than<br />
driver-based onboard<br />
payment.<br />
Contactless smart<br />
cards (or flash<br />
passes) permit faster<br />
processing times than<br />
cash and magnetic<br />
stripe cards and<br />
thus the potential<br />
to reduce boarding<br />
times. Smart cards<br />
and farecards that<br />
can be used for other<br />
modes can reduce<br />
ease the transfer<br />
process.<br />
Differentiated fares<br />
are more complicated<br />
and may slow down<br />
boarding, increasing<br />
dwell time and overall<br />
travel time.<br />
Off-board payment<br />
enables all-door<br />
boarding, reducing delays<br />
due to irregular dwell<br />
time and thus improving<br />
reliability.<br />
Contactless smart cards<br />
(or flash passes) permit<br />
faster processing times<br />
than cash and magnetic<br />
stripe cards and thus<br />
increase potential for<br />
reducing dwell time<br />
delays especially during<br />
peak hours.<br />
Differentiated fares are<br />
more complicated and<br />
may slow down boarding,<br />
increasing dwell time and<br />
reducing reliability.<br />
Off-board payment,<br />
especially barrier-enforced<br />
fare collection, may convey<br />
image <strong>of</strong> a higher quality<br />
service and appear more<br />
rail-like.<br />
Electronic fare collection<br />
(magnetic strip and smart<br />
cards) and emerging<br />
options (credit/debit<br />
cards) and mobile phones)<br />
enhance convenience, can<br />
take advantage <strong>of</strong> multiple<br />
applications, and may<br />
convey image <strong>of</strong> a higher<br />
quality service. Electronic<br />
fare collection that can<br />
also be used for rail modes<br />
reinforces a sense <strong>of</strong> an<br />
integrated rapid transit<br />
network.<br />
Premium fares may convey<br />
image <strong>of</strong> a higher level <strong>of</strong><br />
service.<br />
Bus operators provide<br />
presence on all vehicles.<br />
Fare inspectors provide<br />
additional presence<br />
on vehicles and at<br />
stops/stations. POP<br />
may create additional<br />
security needs.<br />
Travel time<br />
savings and<br />
improved<br />
reliability<br />
from all-door<br />
boarding<br />
improve system<br />
throughput.<br />
Travel time<br />
savings and<br />
improved<br />
reliability<br />
from use <strong>of</strong><br />
contactless<br />
smart cards<br />
improves system<br />
throughput.<br />
Off-vehicle<br />
payment<br />
increases onboard<br />
space to<br />
maneuver with<br />
mobility aids.<br />
2-69
Major Elements <strong>of</strong> BRT<br />
2-70<br />
Fare Collection Process<br />
On-Board<br />
• Driver-Validated<br />
• Conductor-Validated<br />
Off-Board<br />
• Barrier Pro<strong>of</strong>-<strong>of</strong>-Payment<br />
Fare Media/Payment<br />
Options<br />
• Cash, Tokens & Paper<br />
• Magnetic Stripe Farecards<br />
• Smart Cards<br />
• Emerging Options<br />
(Credit/Debit Cards and<br />
Mobile Communication<br />
Devices)<br />
Fare Structure<br />
• Flat<br />
• Differentiated<br />
Exhibit 2-9: Summary <strong>of</strong> Effects <strong>of</strong> Fare Collection Elements on System Benefits<br />
Higher Ridership Capital Cost-Effectiveness Operating Cost Efficiency<br />
Shorter travel times<br />
and improved<br />
reliability from <strong>of</strong>fboard<br />
or conductorvalidated<br />
fare<br />
collection can help<br />
attract and retain<br />
riders.<br />
Increased<br />
convenience and<br />
user-friendliness<br />
<strong>of</strong> electronic fare<br />
collection (magnetic<br />
stripe and smart<br />
cards) can help<br />
attract and retain<br />
riders.<br />
Flat fares tend to<br />
result in higher<br />
ridership. Peak/<strong>of</strong>fpeak<br />
differential can<br />
encourage greater<br />
<strong>of</strong>f-peak usage.<br />
Barrier systems have the<br />
highest capital costs.<br />
Use <strong>of</strong> contactless smart<br />
cards and emerging options<br />
<strong>of</strong>fers potential for lower<br />
fare equipment maintenance<br />
costs than cash processing or<br />
magnetic strip systems.<br />
Differentiated fares tend to<br />
result in higher revenue.<br />
If reduction in dwell time is<br />
large enough, it may allow<br />
shorter headways (i.e., better<br />
service without adding<br />
vehicles)<br />
Use <strong>of</strong> electronic media in<br />
general results in lower cashhandling<br />
costs.<br />
<strong>Transit</strong> Supportive Land<br />
Development<br />
Bus operators provide<br />
presence on all vehicles. Fare<br />
inspectors provide additional<br />
presence on vehicles and at<br />
stops/stations.<br />
Environmental<br />
Quality<br />
Travel time savings<br />
and improved<br />
reliability from<br />
all-door boarding<br />
improve system<br />
throughput.<br />
Affects service quality only. Electronic fare<br />
collection can<br />
reduce dwell time,<br />
which lowers<br />
emissions.
Implementation Issues<br />
Issues During Project Development<br />
Fare collection-related issues that an agency should consider during project development<br />
(e.g., during planning, design and procurement) include the following:<br />
General Planning/Design Considerations<br />
In addition to an evaluation <strong>of</strong> the relative system performance impacts and<br />
benefits associated with the different options, the choice <strong>of</strong> a BRT fare collection<br />
process, fare structure, payment options, and media technology typically incorporate<br />
the following considerations:<br />
Station/Stop Design and Infrastructure Requirements—With<br />
<strong>of</strong>f-board fare collection, stations need to be designed to accommodate<br />
required fare collection equipment—for instance, space for one or more<br />
TVMs, electric supply, and data/communications connections.<br />
System Costs and Available Funds—The<br />
choice <strong>of</strong> a fare collection system<br />
will ultimately depend on its cost and funds available for this element.<br />
As explained earlier, a POP system will typically have a higher cost—for both<br />
capital and operations—than a driver validation system.<br />
Integration with Agency-Wide Fare Policy and Technology—The<br />
choice <strong>of</strong> fare structure, payment options, and media technology should be<br />
tied, to the extent possible, to the operating agency’s existing policies and<br />
legacy systems. The fare collection system for BRT should be designed to<br />
facilitate seamless integration with the agency’s other modes/services, and<br />
with other agencies in the region to the extent possible.<br />
Fare Media Technology Standards<br />
Many current and new transit systems (including BRT implementations) are<br />
migrating to or implementing electronic fare collection systems especially with<br />
smart cards. Promoting standardization and interoperability among different<br />
smart card technologies, therefore, has become a key concern in the transit industry.<br />
Agencies want to facilitate the availability <strong>of</strong> multiple sources <strong>of</strong> cards as<br />
they introduce smart card systems. Moreover, in regional systems, the integration<br />
<strong>of</strong> fare payment among multiple agencies requires each <strong>of</strong> the participants<br />
to be able to accept cards issued by the other participating agencies. Thus, it is<br />
essential that all participating agencies agree either to procure the same system<br />
Major Elements <strong>of</strong> BRT<br />
(i.e., from a single vendor) or on a common technology standard that ensures<br />
interoperability if agencies select systems from different vendors.<br />
Several smart card standardization efforts have been initiated in recent years.<br />
A dual contactless card “standard” (called “Type A” and “Type B”) has been established<br />
by the ISO 14443 standards development group. This standard covers<br />
several aspects <strong>of</strong> the card design and card-reader interface. However, sharing a<br />
common interface does not guarantee interoperability; s<strong>of</strong>tware communications<br />
must also be compatible, and there must be shared security data. At the<br />
s<strong>of</strong>tware communications level, different suppliers are rarely compatible. Thus,<br />
unless they plan to rely on a single vendor, it is important that agencies participating<br />
in an integrated payment program agree on a common set <strong>of</strong> specifications<br />
for all smart card system components.<br />
Several efforts are under way to establish industry-wide, international, or regional<br />
system standards for transit smart card applications, such as:<br />
CALYPSO—Developed<br />
by a group <strong>of</strong> transit providers in Europe, CALYP-<br />
SO is a smart card system standard that can be licensed by any interested<br />
agency. Eleven vendors are currently licensed to produce CALYPSO-compatible<br />
cards and readers. (<strong>Transit</strong> agencies in Paris, Venice, Lisbon, Brussels and<br />
Constance [Germany] developed CALYPSO between 1998 and 2000.)<br />
ITSO and EU-IFM—The<br />
Integrated Transport Smartcard Organization<br />
(ITSO) is a public-private partnership <strong>of</strong> transit operators and government<br />
agencies in the United Kingdom that has developed a specification for the<br />
provision <strong>of</strong> “interoperable contactless smart card transport ticketing and<br />
related services in the UK” (ITSO 2006). Through a partnership with other<br />
European organizations, ITSO is now trying to establish compatible smart<br />
card-based ticketing systems within the EU member nations.<br />
UTFS—APTA and FTA are sponsoring the Universal <strong>Transit</strong> Fare System<br />
(UTFS) Standards Program, aimed at developing an industry standard and<br />
set <strong>of</strong> guidelines that U.S. transit agencies can use in developing electronic<br />
payment systems. As <strong>of</strong> 2007, a Contactless Fare Media System Standard<br />
had been developed (APTA 2007).<br />
New York Regional Smart Card Interface Specification<br />
—The Port<br />
Authority <strong>of</strong> New York and New Jersey, in conjunction with other agencies<br />
in the New York City/Northern New Jersey region, has developed an “Inter-<br />
2-71
Major Elements <strong>of</strong> BRT<br />
2-72<br />
face Specification” designed to facilitate interoperability among payment<br />
systems implemented in the coming years by the region’s transit providers.<br />
Interface Requirements/Opportunities with Other BRT<br />
Technologies and Infrastructure<br />
BRT fare equipment can stand alone or interface with other equipment/technologies.<br />
For instance, on-vehicle equipment (i.e., farebox or stand-alone smart card<br />
readers) can interface with an automated vehicle locator (AVL) system to record<br />
the location (i.e., stop or station) <strong>of</strong> each transaction (in addition to time and bus<br />
run data). An interface is also possible with automatic passenger counting (APC)<br />
systems. The bus operator control unit (OCU) used in conjunction with the farebox<br />
can also serve multiple functions; in addition to providing operator display<br />
and controls for the fare collection device(s), the OCU can be programmed to<br />
allow operator control <strong>of</strong> a stop announcement system. In general, a farebox/<br />
smart card reader can upload and download data via an existing “smart bus”<br />
data communications system, rather than through use <strong>of</strong> an independent fare<br />
collection communications system. To take advantage <strong>of</strong> such interface possibilities,<br />
each component intended for integration must meet a common data<br />
interface standard (e.g., SAE J1708 and J1587, or the newer J1939).<br />
Fare Collection Infrastructure<br />
An important aspect <strong>of</strong> providing electronic fare media is <strong>of</strong>fering convenient<br />
purchase/revalue options to passengers. Key options that should be considered<br />
include the following:<br />
Credit/debit/ATM cards can be used in many TVMs to purchase or revalue<br />
fare media. In addition, the use <strong>of</strong> contactless credit cards is now being<br />
tested as a means <strong>of</strong> direct fare payment.<br />
<strong>Transit</strong> vouchers are provided by many employers (typically as part <strong>of</strong> a<br />
transit benefits program) to allow employees to purchase fare media from<br />
any <strong>of</strong> the transit agencies in a region.<br />
<strong>Transit</strong> agencies have begun to <strong>of</strong>fer account-based or autoload arrangements<br />
for passengers with smart cards. A passenger (or his/her employer)<br />
establishes a transit account with the agency; the account is typically<br />
backed by a credit card. The passenger’s card is automatically loaded (with<br />
a predetermined amount <strong>of</strong> stored value or the next month’s pass) when<br />
presented to a card reader (i.e., at a TVM or farebox).<br />
Re-usable fare media can be initially purchased or requested by telephone,<br />
mail, or internet. The passenger can then load (or reload) value or a pass to the<br />
farecard at a TVM or through an autoload program. An emerging option is to<br />
download a fare instrument directly to a mobile phone and then use the phone<br />
to pay the fare, either by touching the phone to a contactless card reader (i.e.,<br />
essentially using it as a form <strong>of</strong> smart card) or simply using the phone’s screen to<br />
display pro<strong>of</strong> <strong>of</strong> payment to a fare inspector or bus operator.<br />
Issues During Operation<br />
Fare collection-related issues an agency should consider once the BRT project<br />
development has been completed include the following.<br />
labor Requirements<br />
The use <strong>of</strong> POP typically has a greater labor requirement than a driver validation<br />
system due to the need for fare inspectors. Agencies should consider the trade<strong>of</strong>f<br />
between this additional labor requirement and any savings due to improved<br />
operations and fleet utilization.<br />
Revenue processing<br />
The use <strong>of</strong> EFC technologies (magnetic stripe farecards and contactless smart<br />
cards) has led to improvements in revenue processing and control, including improved<br />
data collection and operations monitoring. EFC systems should produce<br />
a reduction in both labor-intensive cash handling costs and the risks <strong>of</strong> internal<br />
theft <strong>of</strong> cash. EFC systems also permit automation <strong>of</strong> financial processes, facilitating<br />
fare integration among multiple operators. Such multi-modal and multiagency<br />
networks result in seamless regional travel for passengers. Thus, these<br />
systems benefit both transit agencies and passengers.<br />
data Collection to support planning<br />
The types <strong>of</strong> data directly or indirectly retrieved from fare collection systems<br />
are <strong>of</strong>ten used to support planning activities. Therefore, the choice <strong>of</strong> fare system<br />
options should consider the types <strong>of</strong> useful data that can be generated. For<br />
example, on-board EFC systems can potentially be linked to automated vehicle<br />
location systems to allow collection <strong>of</strong> information on boardings by location as<br />
well as time <strong>of</strong> day.<br />
equipment Reliability/maintainability<br />
The type <strong>of</strong> fare media technology affects the reliability and maintainability <strong>of</strong><br />
the fare collection equipment. Equipment used to read contactless smart cards<br />
has no openings/slots and no moving parts, making it considerably more reliable<br />
and easier to maintain than magnetic stripe farecard equipment.
Fare evasion and enforcement<br />
The type <strong>of</strong> fare collection process selected will have an impact on the potential<br />
for fare evasion and the nature <strong>of</strong> enforcement necessary. In a pay-on-boarding<br />
system, every rider passes by the operator and either deposits cash or presents/<br />
inserts some type <strong>of</strong> farecard or pass. Thus, the rate <strong>of</strong> evasion is typically quite<br />
low. However, some fare evasion is inevitable in any type <strong>of</strong> fare system even with<br />
driver-validated pay on-board systems, especially in cases with more crowding.<br />
The potential for fare evasion is higher in a POP system, as only a portion <strong>of</strong> riders<br />
are checked for pro<strong>of</strong> <strong>of</strong> payment. Enforcement in a POP system is done through<br />
random inspections by roving inspectors, and the need for inspectors will significantly<br />
increase operating costs. (Note, however, that a benefit <strong>of</strong> this approach is<br />
that fare inspectors also serve to support the security <strong>of</strong> the system.) The extent <strong>of</strong><br />
evasion depends on a variety <strong>of</strong> factors, including the inspection rate and pattern,<br />
the fine structure, the inclination <strong>of</strong> inspectors to issue warnings vs. citations, the<br />
level <strong>of</strong> crowding in the vehicle or on the platform, and, to some extent, the complexity<br />
<strong>of</strong> the fare structure and the ease <strong>of</strong> use <strong>of</strong> the TVMs/validators.<br />
potential partnerships and multiapplication opportunities<br />
Smart cards, in particular, can benefit passengers, and thus agencies, by providing<br />
multiapplication opportunities that allow for the potential combination<br />
<strong>of</strong> transit payments with various other types <strong>of</strong> applications and/or payment<br />
media. Potential partnerships and multiapplication opportunities include the<br />
following (for discussions <strong>of</strong> multiapplication opportunities and examples, see<br />
TCRP Report 80):<br />
Electronic toll collection and parking payments<br />
Financial services/e-purse payments<br />
Payphones and mobile commerce<br />
Other payment and loyalty programs<br />
Vending machines<br />
Identification purposes for security and access into buildings<br />
marketing<br />
Fare-system-related marketing activities include (1) education <strong>of</strong> passengers as<br />
to how to use the fare equipment and media on the BRT system (including how<br />
to purchase and revalue) and (2) promotion <strong>of</strong> use <strong>of</strong> the BRT system through<br />
pricing or payment option initiatives. Pricing incentives/special features possible<br />
Major Elements <strong>of</strong> BRT<br />
with EFC—smart cards, in particular—include “negative” balance protection (allowing<br />
the passenger to board even if the card contains insufficient funds for<br />
that trip), lower fares with use <strong>of</strong> the card than if paying cash, free/reducedprice<br />
transfers only with use <strong>of</strong> the card, a frequency-based discount (e.g., ride<br />
10 times, get a free ride), or even a “lowest fare” guarantee (once a card is used<br />
a certain number <strong>of</strong> times within a given time period, it becomes an unlimitedride<br />
pass). Payment partnerships with entities such as employers and universities<br />
can also provide effective marketing opportunities for an agency.<br />
Experience with Brt fare Collection<br />
Summary <strong>of</strong> Implementation<br />
Most BRT systems in the United States continue to use on-board farebox payment<br />
as the primary fare collection mechanism. Three systems use <strong>of</strong>f-board<br />
collection with pro<strong>of</strong>-<strong>of</strong>-payment enforcement: the Las Vegas MAX, the Los Angeles<br />
Orange Line, the Cleveland HealthLine; a fourth, the Eugene EmX, currently<br />
has no fares but will implement <strong>of</strong>f-board pro<strong>of</strong>-<strong>of</strong>-payment when the second<br />
EmX line is built. For the Pittsburgh busways, passengers on inbound trips pay on<br />
the outbound portion <strong>of</strong> the trip in order to expedite loading and reduce dwell<br />
times in downtown Pittsburgh. Boston’s Silver Line Waterfront line has three underground<br />
stations with barrier systems; the surface stops rely on farebox based<br />
payments.<br />
Implementation <strong>of</strong> electronic fare collection is increasing in the U.S. transit industry.<br />
A majority <strong>of</strong> the U.S. BRT systems in Exhibit 2-10 have electronic fare<br />
collection. Use <strong>of</strong> ticket vending machines is less common, corresponding with<br />
the few systems that have <strong>of</strong>f-board fare collection.<br />
By contrast, <strong>of</strong>f-board fare collection is common in the European, Latin American,<br />
and Chinese BRT systems and some Canadian systems. The Latin American<br />
BRTs use barrier-enforced systems, reflecting their emphasis on substantial<br />
station infrastructure that can support an enclosed boarding area. The three<br />
systems cited also employ smart cards. The European BRTs typically combine onboard<br />
payment with pro<strong>of</strong>-<strong>of</strong>-payment systems; about half have implemented<br />
electronic fare collection. Interestingly, the three Australian BRTs have on-board<br />
payment even though they use <strong>of</strong>f-street running ways and stations that could<br />
support <strong>of</strong>f-board payment schemes.<br />
Overall, use <strong>of</strong> zone-based fares is rare, with most BRTs charging a flat fare.<br />
2-73
Major Elements <strong>of</strong> BRT<br />
2-74<br />
Exhibit 2-10: Experience with BRT Fare Collection<br />
Albuquerque Boston – Silver Line Chicago Cleveland Eugene Honolulu<br />
Rapid Ride Washington St<br />
Fare Collection Process Pay on-board Pay on-board<br />
Fare Media / Payment<br />
Options<br />
Cash, paper<br />
Fare Structure Flat<br />
Equipment at Stations<br />
Equipment for On-Board<br />
Validation<br />
Cash, paper transfers,<br />
magnetic stripe,<br />
smart card<br />
Flat, with free<br />
transfers to rail<br />
Electronic farebox Electronic farebox<br />
Waterfront<br />
(All Routes)<br />
Barrier at 3<br />
underground<br />
stations; pay onboard<br />
elsewhere<br />
Cash, paper ticket,<br />
smart card<br />
Neighborhood<br />
Express<br />
Pay on-board<br />
Cash, paper, magnetic<br />
stripe<br />
Healthline EmX<br />
Pro<strong>of</strong>-<strong>of</strong>payment<br />
Planning pay<br />
<strong>of</strong>f-board<br />
City and<br />
County<br />
Pay on-board<br />
Cash, paper,<br />
magnetic stripe<br />
Flat Flat Currently free Flat<br />
TVMs at 3 underground<br />
stations and<br />
5 airport terminals<br />
Electronic farebox,<br />
GPS<br />
Electronic farebox Electronic farebox
Exhibit 2-10: Experience with BRT Fare Collection (cont’d.)<br />
Major Elements <strong>of</strong> BRT<br />
Kansas City Las Vegas Los Angeles Miami Oakland Orlando<br />
Main Street<br />
MAX<br />
North Las Vegas<br />
MAX<br />
Metro Rapid Orange Line<br />
South Dade Busway<br />
Rapid San Pablo<br />
Corridor<br />
Fare Collection Process Pay on-board Pro<strong>of</strong>-<strong>of</strong>-payment Pay on-board Pro<strong>of</strong>-<strong>of</strong>-oayment Pay on-board Pay on-board<br />
Fare Media / Payment<br />
Options<br />
Magnetic stripe Cash, paper passes<br />
Tickets, standard<br />
paper passes<br />
Cash, paper,<br />
magnetic stripe<br />
card<br />
Cash, paper, smart<br />
card<br />
LYMMO<br />
Fare Structure Flat Flat Flat Flat Flat Flat Free fares<br />
Equipment at Stations<br />
Equipment for On-Board<br />
Validation<br />
Ticket vending<br />
machines (TVMs)<br />
Ticket vending<br />
machines (TVMs<br />
Hand-held validators Electronic farebox Electronic farebox Electronic farebox<br />
2-75
Major Elements <strong>of</strong> BRT<br />
2-76<br />
Exhibit 2-10: Experience with BRT Fare Collection (cont’d.)<br />
Phoenix Pittsburgh Sacramento San Jose Halifax Ottawa York, ON<br />
RAPID All Busways EBus Rapid 522 Metro<strong>Link</strong> <strong>Transit</strong>way VIVA<br />
Fare Collection Process Pay on-board Pay on-board Pay on-board Pay on-board Pay-on board Pro<strong>of</strong>-<strong>of</strong>-payment Pro<strong>of</strong>-<strong>of</strong>-payment<br />
Fare Media / Payment<br />
Options<br />
Fare Structure Differentiated<br />
Cash, paper Cash, paper Cash, passes<br />
Differentiated;<br />
dis-tance-based for<br />
express services<br />
Cash, paper passes,<br />
smart cards in development<br />
Cash, ticket,<br />
passes<br />
Flat Flat Flat<br />
Cash, paper<br />
tickets, passes<br />
Flat (with some<br />
differentiated fares<br />
by service level)<br />
Paper tickets,<br />
passes<br />
Differentiated<br />
(by zones)<br />
Equipment at Stations TVMs TVMs<br />
Equipment for On-Board<br />
Validation<br />
Electronic farebox Electronic farebox Electronic farebox Electronic farebox
Fare Collection Process<br />
Fare Media / Payment<br />
Options<br />
Exhibit 2-10: Experience with BRT Fare Collection (cont’d.)<br />
Major Elements <strong>of</strong> BRT<br />
Bogotá Guayaquil Pereira Amsterdam Caen Edinburgh Eindhoven<br />
Transmilenio Metrovia Megabus Zuidtangent<br />
Barrier (verify at<br />
station entrances<br />
/ exits)<br />
Smart cards<br />
Barrier<br />
Cash, smart<br />
cards<br />
Barrier (verify at<br />
station entrances)<br />
Smart cards<br />
Pay on-board or<br />
pro<strong>of</strong>-<strong>of</strong>-payment<br />
Paper<br />
(Strippenkart)<br />
Tram on<br />
Wheels<br />
Pay on-board or<br />
pro<strong>of</strong>-<strong>of</strong>-payment<br />
Smart cards,<br />
magnetic tickets<br />
Fare Structure Flat Flat Flat Zone system Flat rate<br />
Equipment at Stations<br />
Equipment for On-Board<br />
Validation<br />
Add-value<br />
machines, Nextbus<br />
Add-value<br />
machines,<br />
Nextbus<br />
Add-value<br />
machines,<br />
Nextbus<br />
None None None Validator<br />
TVM<br />
Validator,<br />
smartcard reader<br />
Fastlink<br />
Pay on-board<br />
or pro<strong>of</strong>-<strong>of</strong>payment<br />
Cash coin<br />
(exact change)<br />
or smart card<br />
Flat daytime,<br />
night-bus fare<br />
after 12am<br />
Partial route<br />
TVMs<br />
Farebox<br />
Phileas - Western<br />
Corridor<br />
Pro<strong>of</strong>-<strong>of</strong>-payment, pay<br />
on-board machine, no<br />
driver payment<br />
Paper (Strippenkart)<br />
Zone system<br />
Limited TVM<br />
Electronic farebox,<br />
validator<br />
2-77
Major Elements <strong>of</strong> BRT<br />
2-78<br />
Exhibit 2-10: Experience with BRT Fare Collection (cont’d.)<br />
Leeds London Rouen Utrecht Adelaide Brisbane Sydney<br />
Superbus Crawley TEOR Busway<br />
Fare Collection Process Pay on-board Pay on-board Off-board<br />
Fare Media / Payment<br />
Options<br />
Fare Structure<br />
Equipment at Stations<br />
Equipment for On-Board<br />
Validation<br />
Cash and paper<br />
only<br />
Differentiated by<br />
distance and time<br />
<strong>of</strong> day<br />
Cash Magnetic stripe<br />
Pro<strong>of</strong>-<strong>of</strong> -payment,<br />
pay on-board<br />
Paper<br />
(Strippenkart)<br />
North East Busway<br />
Pay on-board (80%<br />
pre pay multi-rider<br />
ticket)<br />
Cash, paper<br />
Magnetic stripe<br />
Flat rate Flat rate Zone system Flat<br />
TVM (not<br />
currently in use)<br />
Farebox Farebox Validator<br />
Electronic farebox<br />
validators<br />
South East and<br />
Inner Northern<br />
Busways<br />
T-Ways<br />
Pay on-board Pay on-board<br />
Cash, paper,<br />
magnetic stripe<br />
4 fare zones for<br />
South East;<br />
Cash, paper, magnetic<br />
dtripe<br />
Zone system<br />
Electronic farebox Electronic farebox
Exhibit 2-10: Experience with BRT Fare Collection (cont’d.)<br />
Beijing Hangzhou Kunming<br />
Line 1 Line B1 Busway Network<br />
Fare Collection Process Pay attendents at station Pay at station Pay on-board<br />
Fare Media / Payment<br />
Options<br />
Cash, smart cards Cash, smart cards Cash, IC cards<br />
Fare Structure Flat Flat Flat<br />
Equipment at Stations None None<br />
Equipment for On-Board<br />
Validation<br />
None Farebox<br />
Major Elements <strong>of</strong> BRT<br />
2-79
Major Elements <strong>of</strong> BRT<br />
IntEllIgEnt transPortatIon<br />
systEMs (Its)<br />
Description<br />
role <strong>of</strong> Intelligent transportation systems in Brt<br />
Intelligent Transportation Systems (ITS) enhance transportation system performance<br />
through the use <strong>of</strong> advanced communications technologies. They have<br />
helped transit agencies increase safety, operational efficiency, and quality <strong>of</strong> service,<br />
and have improved riders’ convenience, access to reliable and timely information.<br />
ITS includes a variety <strong>of</strong> advanced technologies to collect, process and<br />
disseminate real-time data from vehicle and roadway sensors. The data are transmitted<br />
via a dedicated communications network and computing intelligence is<br />
used to transform these data into useful information for the operating agency,<br />
driver and ultimately the customer. Various technologies combine to form distinct<br />
types <strong>of</strong> ITS systems. For example, automatic vehicle location (AVL) in combination<br />
with automated scheduling and dispatch (ASD) and transit signal priority<br />
(TSP) can improve schedule adherence, resulting in better service reliability as<br />
well as faster revenue speed.<br />
ITS technologies provide many performance enhancements and benefits. The<br />
remote monitoring <strong>of</strong> transit vehicle location and status and passenger activity<br />
improves passenger and facility safety and security. Also, ITS can be used<br />
to assist operators in maintaining vehicle fleets and notifying mechanics about<br />
impending mechanical problems as well as routine maintenance needs. In short,<br />
ITS applications are fundamental to generating many benefits for a BRT system.<br />
Characteristics <strong>of</strong> Its<br />
Many ITS technologies can be utilized for BRT systems. Many have been applied<br />
to conventional bus systems. This section discusses individual ITS technologies<br />
that should be considered for integration into BRT systems. Several <strong>of</strong> these technologies<br />
have already provided significant benefits as part <strong>of</strong> BRT systems. The<br />
various ITS applications that can be integrated into BRT systems are discussed<br />
below and can be categorized into six groups:<br />
2-80<br />
<strong>Transit</strong> Vehicle Prioritization<br />
Intelligent Vehicle Systems<br />
Operations Management Systems<br />
Passenger Information Systems<br />
Safety and Security Systems<br />
Electronic Fare Collection Systems (discussed in Fare Collection)<br />
Note that the technologies discussed in this section do not comprise a comprehensive<br />
list <strong>of</strong> Intelligent Transportation Systems. Only those technologies with<br />
direct relevance to BRT applications are presented.<br />
Its options<br />
transit Vehicle Priorities<br />
<strong>Transit</strong> vehicle prioritization technologies include methods to provide preference<br />
or priority to BRT vehicles to pass through intersections or sections <strong>of</strong> roadway.<br />
The intent is to reduce the overall delay <strong>of</strong> vehicles at traffic signals (providing<br />
higher operating speeds and reduced travel time), and to achieve improved<br />
schedule/headway adherence and consistency (providing enhanced reliability<br />
and shorter waiting times). Traffic signal delay is <strong>of</strong>ten the most significant cause<br />
<strong>of</strong> travel time delays on urban streets. A red signal not only causes a BRT vehicle<br />
to fall behind schedule, but it also can compound schedule adherence problems<br />
if the bus was already running late before approaching a red signal. A number <strong>of</strong><br />
methods are available to minimize the impact <strong>of</strong> traffic signal delays to transit<br />
vehicles. These include the optimization <strong>of</strong> traffic signal timing, utilization <strong>of</strong> station<br />
and lane access control, and transit signal prioritization. Signal timing/phasing<br />
and transit signal priority help minimize the delay caused by vehicles having<br />
to stop for traffic at intersections. Access control provides the BRT vehicles with<br />
unencumbered entrance to and exit from dedicated running ways and/or stations.
transit Vehicle Priorities<br />
Signal Timing/Phasing Optimization<br />
Traffic signal sequences can be rearranged at selected intersections to reduce delay for BRT<br />
vehicles. Reduced cycle length, phasing changes, and <strong>of</strong>fset turning for bus speeds are three<br />
techniques that can be used to reduce the delay <strong>of</strong> buses at traffic signals. Assessment <strong>of</strong> this<br />
approach requires analysis and possible operations modeling using vehicle- and person-flow<br />
data but does not require additional components for the vehicle or infrastructure.<br />
Signal timing/phasing optimization relies on pre-defined timings and does not adapt to the<br />
real-time traffic conditions.<br />
system/subsystem unit<br />
signal timing/Phasing optimization<br />
Capital Cost range annual o&M<br />
low High low High<br />
Signal retiming Intersection $3,000 $4,000 $300 $400<br />
<strong>Transit</strong> Signal Priority<br />
<strong>Transit</strong> signal priority (TSP) can alter signal timing to give priority to BRT vehicles. Signal timing<br />
is changed by either extending the green for the detected vehicle, truncating an opposing<br />
movement to provide an early green, or inserting a bus movement to reduce delay to the BRT.<br />
This allows BRT vehicles to improve schedule adherence, reliability, and speed. The technology<br />
requires installation <strong>of</strong> sensors on buses and at intersections along bus routes. Available strategies<br />
include green extension (extending the green phase to allow BRT vehicles to travel through)<br />
and early green (providing an early green signal to allow BRT vehicles to spend less time at an intersection).<br />
Sometimes transit signal priority treatments may be coupled with dedicated queue<br />
bypass lanes, or a special “buses only” signal, where BRT vehicles stop on the near side shoulder<br />
to provide buses with the right-<strong>of</strong>-way for rejoining the general purpose travel lanes.<br />
Several TSP technologies and signal priority methods are available. A basic TSP system consists<br />
<strong>of</strong> communication from a BRT vehicle to a receiver at signalized intersections. A signal is sent<br />
from the BRT vehicle to the signal at the upcoming intersection. In turn, priority may be given<br />
to that vehicle. Emitters on board buses use short range communications such as infrared and<br />
radio frequency (RF) to communicate with the receivers .<br />
system/subsystem unit<br />
transit signal Priority<br />
Capital Cost range annual o&M<br />
low High low High<br />
Emitters Vehicle $900 $1,100 $40 $50<br />
Receivers Intersection $1,000 $2,000 $40 $80<br />
Phase selector Intersection $1,800 $2,000 $75 $80<br />
S<strong>of</strong>tware (MDT modifications) System $50,000 $100,000 $5,000 $10,000<br />
Control box and controller Intersection $8,000 $10,000 $320 $400<br />
Interface to AVL System $25,000 $25,000 $2,500 $2,500<br />
ReAsons to Implement<br />
• Can be implemented quickly with<br />
standard traffic signal equipment.<br />
• Protect buses from conflicting<br />
vehicle traffic.<br />
•<br />
•<br />
Reduced traffic signal delay.<br />
Improved on-time performance.<br />
Major Elements <strong>of</strong> BRT<br />
ConsIdeRAtIons/<br />
RequIRements<br />
• Does not consider real-time conditions <strong>of</strong><br />
the transit operation for real-time operations<br />
management.<br />
• May require updated signal technology<br />
for coordination.<br />
• Institutional resistance may be encountered;<br />
complaints from public may increase.<br />
• Should not adversely impact other road<br />
users.<br />
• Signal control systems may need to be<br />
upgraded to accommodate different<br />
signal priority algorithms.<br />
• Requires field equipment to be installed.<br />
• Requires approval by and coordinating<br />
with third parties, such as cities (specifically<br />
traffic engineering departments) and<br />
other stakeholders.<br />
• Minimize adverse impacts to CWSS street<br />
traffic.<br />
2-81
Major Elements <strong>of</strong> BRT<br />
Station and Lane Access Control<br />
Station and lane access control systems allow access to dedicated BRT running ways and stations<br />
with dynamic message signs (DMS) and gate control systems. These systems require the<br />
installation <strong>of</strong> barrier control systems that identify a vehicle and/or similar surveillance and<br />
monitoring systems. Typically, these systems utilize an electronic transponder (similar to a transponder<br />
used for electronic toll collection systems).<br />
system/subsystem unit<br />
station/lane access Control<br />
2-82<br />
Capital Cost range annual o&M<br />
low High low High<br />
Controller s<strong>of</strong>tware System $25,000 $50,000 $2,500 $5,000<br />
Gate hardware Entrance $100,000 $150,000 $4,000 $6,000<br />
ReAsons to Implement<br />
• Prevents unauthorized entrance to<br />
facilities.<br />
• Reduces travel time.<br />
• Monitors access <strong>of</strong> vehicles/personnel<br />
to facilities.<br />
ConsIdeRAtIons/<br />
RequIRements<br />
•<br />
Requires transponders for effective access.
Intelligent Vehicle systems<br />
These technologies provide automated controls—lateral (i.e., steering) and longitudinal<br />
(i.e., starting, speed control, stopping)—for BRT vehicles. Intelligent vehicle<br />
systems help to reduce frequency and severity <strong>of</strong> crashes and collisions and<br />
reduced running times and station dwell times.<br />
Precision docking and lane-assist technologies can help reduce the lane width<br />
required to operate BRT vehicles. They can, therefore, enable the deployment <strong>of</strong><br />
BRT systems (possibly with dedicated lanes) in environments with constrained<br />
right-<strong>of</strong>-way. These technologies can also help reduce station dwell time by consistently<br />
achieving small gaps at stations, providing level boarding.<br />
ITS-based precision docking and lane-assist systems are still in the early stages<br />
<strong>of</strong> system development. Limited operational experience both in the U.S. and<br />
abroad has resulted in very limited information regarding system performance,<br />
system reliability, maintenance requirements, failure modes, etc. Other non ITSbased<br />
guidance systems, (i.e., mechanical guidance, such as curb-guided buses)<br />
have been deployed in several cases in Europe and Australia.<br />
Intelligent Vehicle systems<br />
Collision Warning<br />
Collision warning systems alert BRT vehicle drivers about the presence <strong>of</strong> obstacles or the impending<br />
impact with pedestrians or obstacles. This includes forward, rear, or side impact collision<br />
warning systems or integrated 360-degree systems (a system that covers all sides <strong>of</strong> the<br />
BRT vehicle). These technologies employ the use <strong>of</strong> microwave radar to scan the environment<br />
surrounding the vehicle. Upon detecting an obstacle, the system automatically warns the BRT<br />
operator.<br />
A similar but more advanced system being developed is called collision avoidance. This system<br />
works similar to collision warning systems but, upon detecting an obstacle, automatic systems<br />
take control and decelerate the engine or apply the brakes if a driver does not properly respond<br />
to avoid colliding with the detected obstacle. However, as <strong>of</strong> 2008, these systems were still in<br />
research or early implementation stages and are not widely available for installation on BRT<br />
vehicles.<br />
system/subsystem unit<br />
Capital Cost range annual o&M<br />
Low High Low High<br />
Collision Warning<br />
Sensor integration Vehicle $3,000 $4,000 $300 $400<br />
Major Elements <strong>of</strong> BRT<br />
Precision docking and lane-assist systems require coordinated design with running<br />
ways and stations. The running way standpoint <strong>of</strong> these technologies is discussed<br />
under the running way section <strong>of</strong> this document.<br />
ReAsons to Implement<br />
• Reduced maintenance costs.<br />
• Reduced vehicle out-<strong>of</strong>-service time.<br />
• Increased passenger and driver safety.<br />
• Potential reduced insurance costs.<br />
ConsIdeRAtIons/<br />
RequIRements<br />
• Requires installation <strong>of</strong> sensors (infrared,<br />
video or other) and driver notification<br />
devices on-board vehicle.<br />
2-83
Major Elements <strong>of</strong> BRT<br />
Precision Docking<br />
Precision docking assists BRT drivers in accurately placing a vehicle at a stop or station location<br />
in terms <strong>of</strong> both longitudinal control (parallel to the station) and lateral control (side-to-side).<br />
Sensors continually determine the lateral distance to the curb, front and rear, and the longitudinal<br />
distance to the end <strong>of</strong> the bus loading area. ITS-based technologies to implement precision<br />
docking include optical, magnetic, machine vision, or microwave radar. Other non ITS-based<br />
methods include mechanical guidance, such as curb guided vehicles and single rail vehicles.<br />
These non-ITS methods are discussed in the Running Ways section <strong>of</strong> this document.<br />
Optical guidance is the most commonly used ITS-based technology for precision docking. Both<br />
magnetic and optical options require the installation <strong>of</strong> markings on the pavement (paint or<br />
magnets), vehicle-based sensors to read the markings, and linkages with the vehicle steering system.The<br />
availability <strong>of</strong> these systems is currently limited (as <strong>of</strong> 2008) to international suppliers as<br />
an additional option for new vehicle purchases. Commercial availability from U.S. suppliers as<br />
an add-on option is likely in the next two to five years.<br />
Precision docking with guided buses has been operational for about 10 years in Europe, using<br />
mechanical guidance technology. More recently, precision docking and level boarding have<br />
been developed using optical guidance technology and are in revenue service in France. In the<br />
U.S., optical guidance was implemented in the Las Vegas MAX system. However, the technology<br />
deployed in that system is not in use because local conditions require significant maintenance<br />
<strong>of</strong> the optical guidance markers to operate reliably.<br />
system/subsystem unit<br />
2-84<br />
Capital Cost range annual o&M<br />
low High low High<br />
Precision Docking<br />
Magnetic sensors Station $4,000 $4,000 $160 $160<br />
Optical markings Station $4,000 $4,000 $160 $160<br />
Hardware and integration Vehicle $50,000 $50,000 $5,000 $5,000<br />
ReAsons to Implement<br />
• Improves passenger convenience<br />
during boarding and alighting.<br />
• Reduces delay at stops.<br />
• Increases passenger convenience.<br />
• Increases passenger and driver safety.<br />
• Reduces insurance costs.<br />
ConsIdeRAtIons/<br />
RequIRements<br />
• Requires vehicle-based systems as well<br />
as coordinated running way design and<br />
station design.<br />
• Limited deployment to date.<br />
• Infrastructure may require significant<br />
maintenance based on local conditions <strong>of</strong><br />
the area.
Lane-Keeping Assistance Systems<br />
Lane-keeping assistance systems (or vehicle guidance systems) guide BRT vehicles on running<br />
ways while maintaining or allowing for higher speed. This is done by providing feedback to<br />
the driver or by controlling the vehicle automatically. These technologies allow BRT vehicles<br />
to safely operate at higher speeds in dedicated or semi-dedicated lanes that may be narrower<br />
than standard traffic lanes (e.g., 10-ft wide as opposed to a standard lane width <strong>of</strong> 12 ft). Such<br />
systems are necessary to sustain safety because <strong>of</strong> the smaller margin for error associated with<br />
a narrower lane width, especially when it is adjacent to regular traffic. There are three primary<br />
ITS-based lane assist technologies: magnetic, optical, and GPS-based. (Mechanical guidance systems<br />
are described in the Running Way section <strong>of</strong> this chapter). The availability <strong>of</strong> these systems<br />
is currently limited. However, commercial deployment is expected within two to five years.<br />
• optical (or vision-based guidance systems) use machine vision equipment (cameras, image<br />
processing equipment, pattern recognition algorithms, etc.) to provide the lane-assist<br />
system with information as to the exact location <strong>of</strong> the equipped bus within the lane.<br />
• magnetic guidance systems use magnetic material (i.e., magnetic tape, magnetic plugs)<br />
either located on or embedded in the roadway to provide a reference magnetic field. Sensors<br />
installed on the bus, consisting <strong>of</strong> multiple magnetometers, compare the relative field<br />
strength measured by each magnetometer. From those measurements, the lateral distance<br />
to the magnetic reference is determined.<br />
• Gps-based guidance utilizes GPS to provide position information. However, to determine<br />
bus position relative to the lane, the location <strong>of</strong> lane boundaries must also be known. A<br />
digital map containing the location <strong>of</strong> all relevant road elements is used. The database is<br />
queried based on vehicle location, and the query results provide the location <strong>of</strong> the lane<br />
boundaries and other objects. From that information, the position <strong>of</strong> the vehicle with<br />
respect to the lane can then be determined and used by the lane assist system.<br />
system/subsystem unit<br />
lane-Keeping<br />
assistance system<br />
Capital Cost range annual o&M<br />
low High low High<br />
Magnetic sensors Mile $20,000 $20,000 $800 $800<br />
Optical Mile $20,000 $20,000 $800 $800<br />
Hardware (including<br />
GPS) and integration<br />
Vehicle $50,000 $95,000 $5,000 $9,500<br />
ReAsons to Implement<br />
• Reduces vehicle maintenance costs.<br />
• Reduces vehicle out-<strong>of</strong>-service time.<br />
• Increases passenger and driver safety.<br />
Major Elements <strong>of</strong> BRT<br />
ConsIdeRAtIons/<br />
RequIRements<br />
• Requires vehicle-based systems as well<br />
as coordinated running way design and<br />
station design.<br />
• Infrastructure may require significant<br />
maintenance due to local conditions <strong>of</strong><br />
the area.<br />
• GPS-based systems require very accurate<br />
maps that include road network, facilities<br />
and stations, which may not be available<br />
or are available at a high cost.<br />
•<br />
Not widely available.<br />
2-85
Major Elements <strong>of</strong> BRT<br />
operations Management systems<br />
This group <strong>of</strong> technologies includes systems that enhance BRT operations by improving<br />
operating efficiencies, increasing service reliability and reducing travel<br />
times. These technologies include transit operations s<strong>of</strong>tware applications that<br />
assist transit agencies with driver scheduling, vehicle assignment and dispatching.<br />
Increasingly, these s<strong>of</strong>tware products are being integrated with each other for additional<br />
benefits. For example, computer-aided dispatching (CAD) combined with<br />
AVL is the most popular form <strong>of</strong> transit operations technology. CAD/AVL gives<br />
transit agencies the capability to monitor, supervise, and control operations with<br />
real-time data and provide real-time information to customers.<br />
operations Management systems<br />
Computer-Aided Dispatch (CAD)<br />
A CAD system can manage a voice and data communication system by automatically<br />
selecting appropriate channels for specific types <strong>of</strong> communications; allowing<br />
operations/dispatch to select a specific vehicle, group <strong>of</strong> vehicles, or all vehicles to<br />
receive messages; and facilitating emergency response in the case <strong>of</strong> an incident.<br />
Currently, CAD systems are very prevalent in fixed-route bus operations.<br />
Usually, CAD systems also include the installation <strong>of</strong> mobile data terminals (MDT)<br />
in each vehicle near the operator. The MDTs facilitate data transfer between the<br />
vehicle and operations/dispatch. The use <strong>of</strong> MDTs for data communication tends<br />
to reduce the volume <strong>of</strong> voice communication since much <strong>of</strong> the information<br />
transmitted between operators and dispatch can be coded.<br />
system/subsystem unit<br />
CaD system<br />
2-86<br />
Capital Cost range annual o&M<br />
low High low High<br />
S<strong>of</strong>tware System $100,000 $150,000 $10,000 $15,000<br />
Hardware System $10,000 $20,000 $400 $800<br />
MDTs Vehicle $3,800 $6,500 $160 $250<br />
Interface to AVL System $20,000 $50,000 $2,000 $5,000<br />
ReAsons to Implement<br />
• To promote improved efficiency and<br />
productivity <strong>of</strong> the operation by reducing<br />
unnecessary communication<br />
between dispatches and drivers, improving<br />
the collection and archiving<br />
<strong>of</strong> operations events, and providing<br />
new information and analysis tools to<br />
assist operations decision-making.<br />
ConsIdeRAtIons/<br />
RequIRements<br />
• Requires a data communication system<br />
to be installed.
Automatic Vehicle Location (AVL)<br />
An AVL system determines the location <strong>of</strong> each vehicle that is equipped with the required hardware<br />
and s<strong>of</strong>tware. The most popular technology currently used to determine location in an<br />
AVL system is the global positioning system (GPS). With an AVL system, central dispatch can<br />
view the location <strong>of</strong> equipped vehicles on a map, in addition to displaying specific information<br />
about each vehicle (i.e,. vehicle ID, operator, route).<br />
Route and schedule adherence (RSA) is <strong>of</strong>ten determined by using AVL and schedule data in a<br />
subsystem <strong>of</strong> AVL. RSA assists drivers in maintaining their schedules and ensuring that they do<br />
not go <strong>of</strong>f-route. If the system determines that the bus is running behind or ahead <strong>of</strong> schedule,<br />
the driver is notified via the MDT. The driver can then adjust the stop dwell time or layover<br />
time or increase the speed to get back on schedule, depending upon the transit agency’s policy<br />
about drivers taking corrective actions to maintain their schedules.<br />
Typically, a vehicle logic unit (VLU) is also part <strong>of</strong> an MDT. A VLU is an on–board computer that<br />
provides processing horsepower to support full automation, single point log-on, and all <strong>of</strong> the<br />
onboard ITS applications.<br />
system/subsystem unit<br />
automatic Vehicle location system<br />
Capital Cost range annual o&M<br />
Low High Low High<br />
In-vehicle equipment (GPS, Vehicle Logic<br />
Unit)<br />
Vehicle $1,500 $3,000 $60 $120<br />
Dispatch hardware (2 workstations*) System $20,000 $46,000 $2,000 $4,600<br />
RSA s<strong>of</strong>tware System $120,000 $150,000 $12,000 $15,000<br />
Integration with scheduling System $40,000 $80,000 $4,000 $8,000<br />
Automated Scheduling and Dispatch S<strong>of</strong>tware<br />
Automated scheduling and dispatch s<strong>of</strong>tware help to manage BRT vehicles and ensure the<br />
proper level <strong>of</strong> service. <strong>Transit</strong> fixed-route scheduling s<strong>of</strong>tware applications help transit agencies<br />
with route planning and restructuring and “runcutting.” Automated scheduling s<strong>of</strong>tware<br />
allows agencies to produce the most efficient vehicle and operator/crew schedules. Increasingly,<br />
scheduling s<strong>of</strong>tware products are being integrated with each other and with other technologies<br />
(CAD, AVL) for additional benefits. When used in combination, these applications reduce the<br />
need to re-enter data and makes data generated by each application available to all other applications.<br />
(See previous sections on AVL and CAD for more information on these technologies.)<br />
system/subsystem unit<br />
fixed-route scheduling s<strong>of</strong>tware<br />
Capital Cost range annual o&M<br />
low High low High<br />
S<strong>of</strong>tware System $120,000 $300,000 $12,000 $30,000<br />
Hardware System $10,000 $10,000 $400 $400<br />
Interface <strong>of</strong> CAD to scheduling s<strong>of</strong>tware System $20,000 $50,000 $2,000 $5,000<br />
*Minimum <strong>of</strong> two (one serves as a backup).<br />
ReAsons to Implement<br />
• Serves as the backbone <strong>of</strong> many<br />
transit ITS applications, providing<br />
critical data to most other transit ITS<br />
systems such as automatic annunciation,<br />
vehicle component monitoring,<br />
automatic passenger counting (APC),<br />
transit signal priority (TSP), and realtime<br />
passenger information.<br />
• Provides ability to monitor vehicles.<br />
• Reduces response time to incidents.<br />
• Improves on-time performance and<br />
reliability.<br />
• Improves fleet utilization.<br />
•<br />
•<br />
Improves dispatcher efficiency.<br />
Reduces fleet requirements.<br />
• Better utilization <strong>of</strong> routes and<br />
scheduling.<br />
• Reduces operating costs (reduced<br />
non-revenue time).<br />
• Reduces operators over-time (better<br />
runcutting).<br />
Major Elements <strong>of</strong> BRT<br />
ConsIdeRAtIons/<br />
RequIRements<br />
• Requires robust data communications<br />
system.<br />
• Cost may not be justified for small agencies<br />
that have fewer than 7 or 8 routes (or<br />
fewer than 15 vehicles).<br />
2-87
Major Elements <strong>of</strong> BRT<br />
Automated Passenger Counters (APCs)<br />
Automated passenger counters (APCs) automatically count passengers as they board and<br />
alight transit vehicles. With the introduction <strong>of</strong> GPS-based AVL systems, the integration <strong>of</strong> APC<br />
systems with AVL provides bus-stop level ridership data. In cases where a transit agency cannot<br />
invest in APCs for the entire fleet, APCs are deployed on 15-20 percent <strong>of</strong> the vehicles in a fleet.<br />
The vehicles are then rotated on different routes as needed.<br />
An APC system creates an electronic record at each bus stop, typically including stop location,<br />
stop date/time, time <strong>of</strong> doors opening/closing, number <strong>of</strong> passengers boarding, and number <strong>of</strong><br />
passengers alighting. These records can be downloaded at the end <strong>of</strong> the day in the garage or in<br />
real-time using the data communication system. If the latter is done, the data can be used for<br />
operations management purposes. The main technology used for passenger counting is infrared<br />
sensors mounted in the doorway that counts people passing through the infra-red beams.<br />
system/subsystem unit<br />
automated Passenger Counters<br />
2-88<br />
Capital Cost range annual o&M<br />
low High low High<br />
APC on-board Vehicle $2,500 $6,000 $100 $250<br />
APC s<strong>of</strong>tware System $50,000 $80,000 $5,000 $8,000<br />
Interface to AVL System $15,000 $25,000 $1,500 $2,500<br />
Vehicle Component Monitoring System<br />
A vehicle component monitoring (VCM) system uses sensors to monitor various vehicle components<br />
and report on their performance and send warnings <strong>of</strong> impending (out-<strong>of</strong>-tolerance<br />
indicators) and actual failures. Components such as the engine, transmission, anti-lock brakes,<br />
and various fluid levels can be continuously monitored while the bus is in operation. By keeping<br />
track <strong>of</strong> component status with daily reports, maintenance personnel can perform preventive<br />
maintenance before a minor problem becomes major.<br />
system/subsystem unit<br />
Vehicle Component Monitoring system<br />
Capital Cost range annual o&M<br />
low High low High<br />
VCM in-vehicle Vehicle $1,800 $2,500 $80 $100<br />
VCM s<strong>of</strong>tware System $20,000 $40,000 $2,000 $4,000<br />
Interface to MDT Vehicle $200 $250 $20 $25<br />
ReAsons to Implement<br />
• Improved and timely data for the<br />
planning department; combining<br />
APC data with a base map, route<br />
alignments, and fare information<br />
allows planners to more easily assess<br />
ridership, segments <strong>of</strong> routes experiencing<br />
overloads or low ridership,<br />
and non-productive routes/segments.<br />
• Improves revenue control.<br />
• Helps improve schedule efficiency.<br />
• Reduces cost <strong>of</strong> collecting ridership<br />
data.<br />
•<br />
Reduces maintenance costs.<br />
• Reduces time that vehicles are out <strong>of</strong><br />
service.<br />
• Improves passenger convenience<br />
since abrupt service interruptions,<br />
due to mechanical problems, are<br />
significantly reduced.<br />
ConsIdeRAtIons/<br />
RequIRements<br />
• If not all vehicles are equipped with APCs,<br />
then APC-equipped vehicles will need<br />
to be continuously rotated on different<br />
routes and across different time periods<br />
to capture all ridership data.<br />
• Requires data maintenance and correction.<br />
• Requires data communication system<br />
and on-board mechanical monitoring<br />
systems that are capable <strong>of</strong> collecting and<br />
transmitting exception data.<br />
• May be difficult to retr<strong>of</strong>it older vehicles<br />
with no electronic sensors.
Passenger Information systems<br />
Passenger information systems provide customers with information regarding<br />
BRT services. These systems can improve passenger satisfaction and reduce<br />
wait times, thus increasing ridership. For transit agencies, passenger information<br />
systems <strong>of</strong>ten lessen the burden on staff who provide customer information<br />
through traditional channels such as telephone. Passenger information systems<br />
also have spin-<strong>of</strong>f benefits:<br />
<strong>Transit</strong> personnel frequently use the same real-time information systems to<br />
monitor the reliability <strong>of</strong> their services.<br />
The systems can be a source <strong>of</strong> revenue through the sale <strong>of</strong> advertising time<br />
and space on information media.<br />
Passenger information can be static or real-time and can be categorized as to<br />
the location <strong>of</strong> the passenger in the “travel chain”: pre-trip, en-route, station/<br />
terminal, and in-vehicle. These systems disseminate the information via a variety<br />
<strong>of</strong> media including the Internet, wireless devices, kiosks, dynamic message signs<br />
(DMS), on-board electronic signs, public address system, or an interactive voice<br />
response (IVR) system.<br />
Significant advances have been made in the area <strong>of</strong> integrated regional traveler<br />
information systems, in particular, the introduction <strong>of</strong> the 511 telephone number,<br />
designated by the <strong>Federal</strong> Communications Commission for states and local<br />
jurisdictions to provide traveler information in the U.S. Travelers using 511 receive<br />
access to transit, traffic, and other related information. The service is usually<br />
provided free <strong>of</strong> charge.<br />
Major Elements <strong>of</strong> BRT<br />
2-89
Major Elements <strong>of</strong> BRT<br />
Passenger Information systems<br />
Pre-Trip Passenger Information<br />
Pre-trip transit information systems provide travelers with information to assist them in making<br />
decisions about their choice <strong>of</strong> transportation mode, route, and departure time before they<br />
embark on their trip. There are four main types <strong>of</strong> pre-trip information:<br />
1) General service Information includes static information about routes, schedules, maps,<br />
fares, and other service-related items.<br />
2) Itinerary planning allows travelers to obtain a detailed itinerary <strong>of</strong> their intended trip from<br />
Point A to Point B.<br />
3) Real-time Information provides travelers with up-to-the-minute information about the<br />
status <strong>of</strong> the BRT service. The information most frequently provided through these systems<br />
includes predicted arrival or departure times <strong>of</strong> vehicles, graphical representations <strong>of</strong> vehicle<br />
location, and service delays and/or disruptions.<br />
4) multimodal traveler Information provides information on multiple modes <strong>of</strong> travel, including<br />
traffic and transit, in a region.<br />
These systems <strong>of</strong>ten combine real-time and static data from one or more transportation services.<br />
Several types <strong>of</strong> dissemination media deliver information to passengers: Interactive Voice<br />
Response (IVR) telephone system, 511 information number, cell phones, Personal Digital Assistants<br />
(PDAs), and computers.<br />
system/subsystem unit<br />
Web site Enhancements<br />
2-90<br />
Capital Cost range annual o&M<br />
Low High Low High<br />
Development System $30,000 $80,000 $3,000 $8,000<br />
Hardware System $4,000 $8,000 $160 $320<br />
Interactive Voice response system<br />
Hardware System $4,000 $8,000 $160 $320<br />
S<strong>of</strong>tware System $100,000 $200,000 $10,000 $20,000<br />
ReAsons to Implement<br />
• Reduces call volumes to customer<br />
service agents.<br />
• Reduces need for customer service<br />
agents.<br />
• Increases breadth <strong>of</strong> customer<br />
information.<br />
• Increases customer satisfaction.<br />
• Improves quality <strong>of</strong> information since<br />
it is more rigorously maintained and<br />
updated and provided to customers<br />
in a more consistent manner than<br />
when relying solely on customer<br />
service agents providing information.<br />
• Increases travel flexibility/choice.<br />
• Reduces number <strong>of</strong> customer complaints.<br />
ConsIdeRAtIons/<br />
RequIRements<br />
• Information must be maintained.<br />
• Real-time arrival/departure systems<br />
require an AVL system to be in place.
En-Route Passenger Information<br />
En-route information is provided to customers on their way to a BRT station/terminal or while<br />
waiting for their vehicle. Just as travelers benefit from information before embarking on a trip,<br />
information provided en-route is no less critical. Providing real-time arrival or departure time at<br />
stations and/or stops has been shown to reduce traveler anxiety.<br />
En-route information is made available through mobile telephone or web-enabled handheld<br />
devices. Information can be provided in one <strong>of</strong> two modes via wireless devices: push or pull. In<br />
the case <strong>of</strong> information push, real-time information (e.g., service delays) is sent as an email or<br />
text message to devices such as mobile telephones, PDAs, and alphanumeric pagers. The pull<br />
mode allows users to use their web-enabled devices to access the Internet and request specific<br />
information from a transit agency’s website.<br />
Examples <strong>of</strong> en-route information use include:<br />
• Park-and-ride passengers can check parking availability and/or the departure times <strong>of</strong> the<br />
next BRT vehicle.<br />
• Passengers waiting at a BRT stop can check the arrival time <strong>of</strong> the next BRT vehicle.<br />
• Passengers on their way to a BRT station can check if they have missed the last vehicle.<br />
system/subsystem unit<br />
Wireless service<br />
Capital Cost range annual o&M<br />
low High low High<br />
Development System $30,000 $50,000 $3,000 $5,000<br />
Hardware System $5,000 $15,000 $200 $600<br />
Interface with 511 System $10,000 $20,000 $1,000 $2,000<br />
ReAsons to Implement<br />
• Reduces anxiety for customers when<br />
they are informed <strong>of</strong> the status <strong>of</strong><br />
their vehicle.<br />
• Reduces call volumes to customer<br />
service.<br />
• Increases customer satisfaction.<br />
• Improves quality <strong>of</strong> information.<br />
• Increases travel flexibility/choice.<br />
• Reduces number <strong>of</strong> customer complaints.<br />
Major Elements <strong>of</strong> BRT<br />
ConsIdeRAtIons/<br />
RequIRements<br />
• Information (schedules, arrival/departure,<br />
delays, etc.) must be maintained.<br />
•<br />
Requires an AVL system to be in place.<br />
2-91
Major Elements <strong>of</strong> BRT<br />
Station/Terminal Passenger Information<br />
Providing transit information at a BRT stop or station plays a significant role in keeping travelers<br />
informed about the status <strong>of</strong> their vehicle and directing them to the correct stops, platforms, or<br />
bays. Real-time or dynamic information describing current transit operations includes updates<br />
on delays, incidents, and service diversions along transit routes, as well as estimated vehicle arrival<br />
or departure times for stops along the routes.<br />
Station/terminal information can be provided to passengers through Dynamic Message Signs<br />
(DMS). DMSs are electronic displays used at stops/stations to indicate the arrival or departure<br />
times <strong>of</strong> vehicles, as well as delay information. The location <strong>of</strong> the signs and size <strong>of</strong> characters<br />
should be in accordance with the ADA Accessibility Guidelines. DMS can be powered by electricity<br />
or solar power.<br />
State-<strong>of</strong>-the-art kiosks with touch screens allow users to navigate through static and dynamic<br />
information by simply touching selected information on the screen. Kiosks may provide users<br />
with a variety <strong>of</strong> transit and non-transit information such as schedules, route maps, fares,<br />
weather, events in the area, and traffic information. Kiosks are usually placed indoors at locations<br />
that have a high volume <strong>of</strong> foot traffic.<br />
system/subsystem unit<br />
station/terminal Passenger Information<br />
2-92<br />
Capital Cost range annual o&M<br />
low High low High<br />
Electronic display Stop/station $4,000 $10,000 $160 $400<br />
Interface with AVL System $25,000 $50,000 $2,500 $5,000<br />
Prediction s<strong>of</strong>tware System $25,000 $50,000 $2,500 $5,000<br />
Kiosks Kiosk $4,000 $10,000 $160 $400<br />
ReAsons to Implement<br />
• Improves perception <strong>of</strong> service<br />
quality.<br />
• Increases customer satisfaction.<br />
• Improves quality <strong>of</strong> information.<br />
• Increases travel flexibility/choice.<br />
• Reduces number <strong>of</strong> customer complaints.<br />
ConsIdeRAtIons/<br />
RequIRements<br />
• Requires maintenance <strong>of</strong> information.<br />
• Requires an AVL system to be in place.<br />
• Requires connection to the communications<br />
data system from signs and shelters.<br />
• Requires provision <strong>of</strong> power to signs and<br />
shelters (can be <strong>of</strong>fset by using solarpowered<br />
elements).
In-Vehicle Passenger Information<br />
In-vehicle information usually includes information on the next stop, vehicle schedule, transfers,<br />
or delays. This can be accomplished using an automated annunciation system (AAS), consisting<br />
<strong>of</strong> dynamic message signs (DMS) on-board the vehicle and an audio announcement <strong>of</strong> the<br />
same information displayed on the on-board DMS.<br />
An AAS requires techniques to monitor the vehicle’s location along the route so the upcoming<br />
stop name can be announced just prior to the vehicle arriving at the stop. Information beyond<br />
next-stop announcements requires that the system obtain information on the predicted vehicle<br />
arrival time at the next station/stop, receive data on other vehicles along the route, and display<br />
information on board the vehicle regarding arrival at the next stop and transfer information. An<br />
AAS is <strong>of</strong>ten linked to speakers on the outside <strong>of</strong> the bus to announce the route number, name,<br />
and destination <strong>of</strong> the vehicle to passengers at bus stops.<br />
In-vehicle passenger information may provide additional benefits:<br />
• Can be utilized to display and announce advertisements, making it a potential source for<br />
additional revenue.<br />
• Video displays on-board BRT vehicles may provide entertainment to riders and encourage<br />
more people to use the BRT service. Each BRT vehicle may have two or more video displays<br />
connected to the Internet and may broadcast weather, news, local information, or short<br />
movies for entertainment purposes. The system may be a source <strong>of</strong> income if an agency<br />
elects to display advertisements.<br />
system/subsystem unit<br />
automatic annunciation system<br />
Capital Cost range annual o&M<br />
low High low High<br />
Annunciator Vehicle $2,500 $3,500 $100 $140<br />
In-vehicle display Vehicle $1,000 $1,500 $40 $60<br />
Fixed-end equipment System $100,000 $160,000 $4,000 $16,000<br />
Interface to AVL System $25,000 $25,000 $2,500 $2,500<br />
In-vehicle video display<br />
Display units (2 per vehicle) Vehicle $2,000 $4,000 $80 $160<br />
Fixed-end equipment System $5,000 $10,000 $200 $400<br />
ReAsons to Implement<br />
• ADA requires that public transit<br />
providers announce all major stops,<br />
intersections, and landmarks. Generally,<br />
drivers are required to make<br />
these announcements. In many<br />
agencies, AAS are used to perform<br />
this required function, eliminating<br />
the need for drivers to make the announcements.<br />
• Increases customer convenience.<br />
• Increases customer satisfaction.<br />
• Increases passenger safety.<br />
• Reduces driver responsibilities.<br />
• Improves navigation <strong>of</strong> the transit<br />
system by individuals with visual<br />
and hearing impairments and/or<br />
infrequent transit users.<br />
Major Elements <strong>of</strong> BRT<br />
ConsIdeRAtIons/<br />
RequIRements<br />
• Stop locations, stop names, and route<br />
numbers and names will need to be kept<br />
current.<br />
• Buses with in-vehicle display signs that are<br />
not compatible with an AAS will need to<br />
be replaced (thus inflating the deployment<br />
cost).<br />
• Requires an AVL system for automatic<br />
stop annunciation system.<br />
2-93
Major Elements <strong>of</strong> BRT<br />
safety and security systems<br />
On-Board Silent Alarm<br />
On-board silent alarms consists <strong>of</strong> a push button that is located in a discrete location near the<br />
driver’s seat <strong>of</strong> the vehicle. This silent alarm button is used by the driver whenever he/she is<br />
in danger. The alarm alerts the dispatchers without letting passengers or an individual who is<br />
perpetrating a crime know. These systems allow for quicker response to incidents and criminal<br />
activity.<br />
After the silent alarm has been activated, the following steps can take place:<br />
• If it is integrated with an AVL system, the dispatcher’s AVL map display will zoom in on the<br />
vehicle and monitor the vehicle constantly.<br />
• An audible alarm will sound in the dispatching <strong>of</strong>fice until a dispatcher acknowledges the<br />
silent alarm condition.<br />
• A subtle indicator is displayed on the MDT to let the driver know that his/her alarm has<br />
been received.<br />
• A message such as “Call 911” can be displayed on the exterior sign for others to see.<br />
system/subsystem unit<br />
silent alarm system<br />
2-94<br />
Capital Cost range annual o&M<br />
low High low High<br />
Hardware Vehicle $200 $400 $10 $20<br />
S<strong>of</strong>tware System $2000 $10000 $200 $1000<br />
On-Board Voice Monitoring<br />
An on-board voice monitoring system is usually an add-on to the silent-alarm system. When<br />
an emergency alarm is activated, a covert microphone installed on-board allows dispatchers<br />
to listen in to on-board activities to determine the nature <strong>of</strong> the problem and then request<br />
the appropriate assistance. The covert microphone transmission cannot be initiated by the dispatcher;<br />
it is activated only via the driver’s activation <strong>of</strong> the silent alarm.<br />
system/subsystem unit<br />
Covert Microphone system<br />
Capital Cost range annual o&M<br />
low High low High<br />
Hardware Vehicle $200 $400 $10 $20<br />
ReAsons to Implement<br />
• Ability to precisely locate a BRT<br />
vehicle that is involved in an incident<br />
and send assistance quickly to the<br />
scene.<br />
• Improves safety and security <strong>of</strong> drivers<br />
and passengers.<br />
• Reduces response time to incidents.<br />
• Reduces number <strong>of</strong> incidents.<br />
• Allows determination <strong>of</strong> the nature<br />
<strong>of</strong> the problem when a silent alarm is<br />
activated so to request the appropriate<br />
assistance.<br />
• Improves safety and security <strong>of</strong> drivers<br />
and passengers.<br />
• Reduces response time to incidents.<br />
• Reduces number <strong>of</strong> incidents.<br />
ConsIdeRAtIons/<br />
RequIRements<br />
• Requires data communications and AVL<br />
for implementing a silent alarm system.<br />
• Requires on-board data communications<br />
infrastructure.
On-Board Video Monitoring<br />
On-board cameras provide remote monitoring and recording <strong>of</strong> the passenger environment<br />
on transit vehicles. Cameras are usually mounted to provide complete coverage <strong>of</strong> the BRT<br />
vehicle interior and may be mounted to view door wells, as well as the road through the front<br />
windshield.<br />
On-board cameras are gaining popularity with transit agencies as a form <strong>of</strong> crime deterrence<br />
and can be used to review incidents that may have taken place on-board. Also, cameras can<br />
provide information on driver behavior by recording drivers’ actions. When the behavior includes<br />
a traffic violation, such as running a red light or a stop sign, a camera can identify or verify<br />
such actions. Further, camera images can be used to review the seconds just prior to an accident<br />
to determine fault.<br />
Video monitoring can be done in real-time utilizing a high-bandwidth communication system.<br />
However, this method is practiced on a very limited basis as it requires large bandwidth. Thus,<br />
video images <strong>of</strong>ten are recorded on media such as video cassettes using digital video recorders<br />
(DVRs). The images can be retrieved for reviewing and/or making prints.<br />
system/subsystem unit<br />
on-Board Video Monitoring system<br />
Capital Cost range annual o&M<br />
low High low High<br />
Cameras Vehicle $8,000 $10,000 $320 $400<br />
Viewing station System $10,000 $15,000 $400 $600<br />
Effects <strong>of</strong> ITS Elements on System Performance and Benefits<br />
system Performance<br />
Exhibit 2-11 summarizes the links between the ITS technologies options and the<br />
BRT system performance indicators and system benefits described in Chapter 1.<br />
These links are explored further in Chapters 3 and 4.<br />
ReAsons to Implement<br />
• Improves safety and security <strong>of</strong> drivers<br />
and passengers.<br />
• Reduces vandalism costs.<br />
• Reduces insurance costs.<br />
• Increases sense <strong>of</strong> security.<br />
• Reduces number <strong>of</strong> incidents.<br />
Major Elements <strong>of</strong> BRT<br />
ConsIdeRAtIons/<br />
RequIRements<br />
• Having a complete coverage <strong>of</strong> the interior<br />
<strong>of</strong> the bus requires several cameras,<br />
which may be expensive for some smaller<br />
agencies.<br />
2-95
Major Elements <strong>of</strong> BRT<br />
<strong>Transit</strong> Vehicle<br />
Prioritization<br />
• Optimization <strong>of</strong> Signal<br />
Timing/Phasing<br />
• Station and Lane<br />
Access Control<br />
• <strong>Transit</strong> Signal Priority<br />
Intelligent Vehicle<br />
Systems<br />
• Collision Warning<br />
• Precision Docking<br />
• Lane-Keeping<br />
Assistance Systems<br />
Operations<br />
Management Systems<br />
• Computer Aided<br />
Dispatch (CAD)<br />
• Automatic Vehicle<br />
Location (AVL)<br />
• Automated Scheduling<br />
and Dispatch S<strong>of</strong>tware<br />
• Automated Passenger<br />
Counters (APC)<br />
• Vehicle Component<br />
Monitoring System<br />
2-96<br />
Exhibit 2-11: Summary <strong>of</strong> Effects <strong>of</strong> ITS Elements on System Performance<br />
Travel Time Savings Reliability Identity and Image Safety and Security Capacity Accessibility<br />
<strong>Transit</strong> vehicle<br />
prioritization<br />
minimizes congestion<br />
and signal delays,<br />
improving travel<br />
times over local<br />
service and reducing<br />
wait times.<br />
Precision docking<br />
allows for faster<br />
approaches to<br />
stations and reduced<br />
dwell times. Guidance<br />
may increase travel<br />
speed.<br />
Active operations<br />
management<br />
maintains schedules,<br />
minimizing wait time.<br />
<strong>Transit</strong> signal priority,<br />
and to a lesser degree<br />
optimization <strong>of</strong> signal<br />
timing/phasing,<br />
facilitate schedule<br />
adherence and<br />
recovery.<br />
Precision docking<br />
facilitates boarding<br />
and reduces dwell<br />
time variability.<br />
Active operations<br />
management focuses<br />
on maintaining<br />
reliability.<br />
Faster speeds enabled by<br />
signal priority enhance<br />
image.<br />
Precision docking and<br />
guidance promote an<br />
image <strong>of</strong> BRT as advanced<br />
or cutting-edge.<br />
Bus operators<br />
provide presence<br />
on all vehicles. Fare<br />
inspectors provide<br />
additional presence on<br />
vehicles and at stops/<br />
stations.<br />
Affects service quality<br />
only.<br />
Vehicle tracking<br />
systems enable<br />
monitoring <strong>of</strong> vehicles.<br />
Vehicle health<br />
monitoring alerts<br />
operators and central<br />
control <strong>of</strong> vehicle<br />
malfunction.<br />
Vehicle prioritization<br />
increases speed<br />
and throughput <strong>of</strong><br />
running ways.<br />
Precision docking<br />
limits delays at<br />
stations, increasing<br />
throughput<br />
Guidance systems<br />
increase travel speed,<br />
also increasing<br />
throughput<br />
Operations<br />
management and<br />
proper service<br />
planning ensures that<br />
capacity matches<br />
demand. Systems<br />
allow quick response<br />
to resolve incidents<br />
that could cause<br />
bottle-necks.<br />
Guidance systems<br />
reduce lane<br />
crosswidth, providing<br />
more space for<br />
sidewalk access<br />
facilities. Precision<br />
docking may<br />
enhance boarding<br />
and alighting by<br />
eliminating the gap<br />
between vehicle and<br />
station.<br />
Vehicle health<br />
monitoring alerts<br />
agency <strong>of</strong> lift or<br />
ramp malfunction.<br />
Automated<br />
Vehicle Location<br />
systems enable the<br />
implementation <strong>of</strong><br />
Automated Voice<br />
Annunciation (AVA).
Passenger<br />
Information Systems<br />
• Pre-Trip<br />
• En-Route<br />
• Station/Terminal<br />
• In-Vehicle<br />
Safety and Security<br />
• On-Board Silent<br />
Alarms<br />
• On-Board Voice<br />
Monitoring<br />
• On-Board Video<br />
Monitoring<br />
Exhibit 2-11: Summary <strong>of</strong> Effects <strong>of</strong> ITS Elements on System Performance (cont’d.)<br />
Major Elements <strong>of</strong> BRT<br />
Travel Time Savings Reliability Identity and Image Safety and Security Capacity Accessibility<br />
Effective pre-trip<br />
information coupled<br />
with reliable service<br />
minimizes wait time.<br />
Wayside/in-terminal<br />
information<br />
minimizes wait time<br />
perceptions.<br />
Passenger<br />
information allows<br />
for notices <strong>of</strong><br />
service interruption,<br />
increasing service<br />
reliability and<br />
perceptions <strong>of</strong><br />
reliability.<br />
Passenger information<br />
systems enhance brand<br />
identity and provide a<br />
channel to communicate<br />
with customers.<br />
Passenger information<br />
systems allow for<br />
communication <strong>of</strong><br />
security threats.<br />
Safety and security<br />
systems facilitate active<br />
management <strong>of</strong> the<br />
BRT system, deterring<br />
crime and enabling<br />
responses to incidents.<br />
Real-time passenger<br />
information tools<br />
must be designed<br />
to be used and<br />
understood by all<br />
passengers.<br />
2-97
Major Elements <strong>of</strong> BRT<br />
2-98<br />
<strong>Transit</strong> Vehicle Prioritization<br />
• Optimization <strong>of</strong> Signal Timing/Phasing<br />
• Station and Lane Access Control<br />
• <strong>Transit</strong> Signal Priority<br />
Intelligent Vehicle Systems<br />
• Collision Warning<br />
• Precision Docking<br />
• Lane-Keeping Assistance Systems<br />
Operations Management Systems<br />
• Computer Aided Dispatch (CAD)<br />
• Automatic Vehicle Location (AVL)<br />
• Automated Scheduling and Dispatch S<strong>of</strong>tware<br />
• Automated Passenger Counters (APC)<br />
• Vehicle Component Monitoring Sys-tem<br />
Passenger Information Systems<br />
• Pre-trip<br />
• En-route<br />
• Station/Terminal<br />
• In-Vehicle<br />
Exhibit 2-12: Summary <strong>of</strong> Effects <strong>of</strong> ITS Elements on System Benefits<br />
Higher Ridership<br />
Faster speeds,<br />
especially in contrast<br />
to other traffic, and<br />
greater reliability<br />
attract ridership.<br />
Advanced features<br />
that enhance BRT<br />
system image may<br />
attract ridership.<br />
Operations<br />
management<br />
systems can improve<br />
reliability, which may<br />
increase ridership.<br />
Advanced features,<br />
such as real-time<br />
passenger information<br />
displays, enhance<br />
BRT system image<br />
and may attract<br />
ridership. Information<br />
systems also make<br />
the service easier to<br />
use, especially for new<br />
riders.<br />
Capital Cost<br />
Effectiveness<br />
Fewer accidents increase<br />
fleet capital cost<br />
effectiveness, reduce<br />
spare radio required.<br />
Scheduling and dispatch<br />
s<strong>of</strong>tware may reduce<br />
fleet requirements by<br />
enabling more efficient<br />
use <strong>of</strong> resources. Cost<br />
may not be justified<br />
for small agencies that<br />
have fewer than 7 or 8<br />
routes (or fewer than 15<br />
vehicles).<br />
Station systems require<br />
provision <strong>of</strong> power to<br />
stations.<br />
Operating Cost Efficiency<br />
Faster speeds result in operating<br />
cost efficiencies<br />
Precision docking and lane<br />
keeping assistance may reduce<br />
dwell time increasing operating<br />
cost efficiency. May also reduce<br />
insurance costs. Collision<br />
warning and lane-keeping<br />
assistance systems may reduce<br />
maintenance costs and vehicle<br />
out-<strong>of</strong>-service time, as well as<br />
insurance costs.<br />
Scheduling and dispatch<br />
s<strong>of</strong>tware may reduce operators’<br />
over-time. Enabling better<br />
management <strong>of</strong> finite resources<br />
increases operating efficiencies.<br />
APCs provide valuable planning<br />
information for BRT services.<br />
Reduces cost <strong>of</strong> collecting<br />
ridership data.<br />
Quality information systems<br />
require that information must<br />
be maintained. They may reduce<br />
the need for customer service<br />
agents. Station systems require<br />
provision <strong>of</strong> power to stations;<br />
solar-based systems reduce<br />
operating costs.<br />
<strong>Transit</strong><br />
Supportive<br />
Land<br />
Develoment<br />
.<br />
Environmental<br />
Quality<br />
Less idling <strong>of</strong> buses<br />
generates fewer<br />
pollutants.<br />
Vehicle<br />
component monitoring<br />
may reduce<br />
environmental<br />
impacts <strong>of</strong><br />
undetected engine<br />
or transmission<br />
problems.
Safety and Security<br />
• On-Board Silent Alarms<br />
• On-Board Voice Monitoring<br />
• On-Board Video Monitoring<br />
Exhibit 2-12: Summary <strong>of</strong> Effects <strong>of</strong> ITS Elements on System Benefits (cont’d.)<br />
Higher Ridership<br />
Advanced features<br />
that enhance BRT<br />
system image (safe<br />
system) may attract<br />
ridership.<br />
Capital Cost<br />
Effectiveness<br />
Complete coverage <strong>of</strong><br />
a bus interior requires<br />
several cameras which<br />
can be expensive. To<br />
deploy on-board voice<br />
monitoring, a data<br />
communications infrastructure<br />
must be in<br />
place.<br />
Operating Cost Efficiency<br />
May reduce vandalism costs and<br />
insurance costs.<br />
<strong>Transit</strong> Supportive<br />
Land<br />
Develoment<br />
Major Elements <strong>of</strong> BRT<br />
Environmental<br />
Quality<br />
2-99
Major Elements <strong>of</strong> BRT<br />
Implementation Issues<br />
Implementation <strong>of</strong> ITS for BRT <strong>of</strong>ten has implications beyond just the BRT system.<br />
From project development through operation, ITS has the power to transform<br />
the way an agency performs certain tasks and business processes. Furthermore,<br />
through the need to find cooperation among functions that are typically<br />
divided across several different departments or agencies, implementation <strong>of</strong> ITS<br />
for BRT can motivate cooperation and integration <strong>of</strong> the components being<br />
implemented and the business processes behind them.<br />
Implementation Issues During Project Development<br />
This section discusses issues that may arise during project development when<br />
implementing ITS for BRT, including:<br />
2-100<br />
transformation <strong>of</strong> business practices<br />
system integration<br />
requirements for a data communications system<br />
planning and design considerations for TSP, AVL, APC, real-time passenger<br />
information, and cameras<br />
relevant standards, interface requirements, and institutional requirements<br />
such as those imposed by the National ITS Architecture and the <strong>Transit</strong><br />
Communications Interface Pr<strong>of</strong>iles (TCIP) effort<br />
transformation <strong>of</strong> Business Practices<br />
ITS procurements have wider implications for a transit agency than procurements<br />
<strong>of</strong> other transit system components. Unlike many transit procurements,<br />
ITS deployments are not confined to a single department within the transit<br />
agency, such as payroll or maintenance—they cross over several departments.<br />
For example, an automated annunciation system requires involvement by operations,<br />
maintenance, marketing, customer service, and scheduling departments.<br />
Many ITS systems may also require coordination with external parties for information<br />
and data exchange.<br />
Furthermore, ITS deployments differ from other transit-related systems in that<br />
they are not only for the agency’s internal use but also are used and viewed by<br />
the public. For instance, an AVL system provides location and schedule adherence<br />
information for the dispatchers while also providing bus location information<br />
on the Internet for public use. As such, implementation <strong>of</strong> ITS systems cre-<br />
Exhibit 2-13: BRT Communication Schematic<br />
Field<br />
Supervisor<br />
<strong>Transit</strong><br />
Management<br />
Center<br />
BRT Vehicle<br />
BRT<br />
Station<br />
Transportation<br />
Management<br />
Center<br />
BRT Vehicle<br />
Roadway<br />
Infrastructure<br />
Wire-line<br />
Wireless<br />
ates new expectations about what information will be available to consumers<br />
and how the operation will be managed accordingly.<br />
requirements for system Integration<br />
Implementation <strong>of</strong> ITS technologies does not involve just the installation <strong>of</strong><br />
equipment on board the vehicle, at bus stops, and at agency facilities. It also<br />
involves modifications to communications, installation <strong>of</strong> s<strong>of</strong>tware, and integration<br />
with other agency or regional systems. Accomplishing this requires sound<br />
implementation procedures and approaches to ensure a successful deployment<br />
<strong>of</strong> the system.<br />
requirements for a Data Communications system<br />
ITS technologies require a robust and reliable data communication system to<br />
function properly. For decades, transit agencies have relied on voice communications<br />
between drivers and dispatch to provide important operational information.<br />
However, a data communication system is required for most ITS tech-
nologies to be functional. This may pose a challenge to some agencies, as the<br />
availability <strong>of</strong> radio frequencies for data use is currently limited in some areas.<br />
This may require agencies to pursue alternatives such as private cellular carrier<br />
systems. A detailed analysis <strong>of</strong> current and future communications needs is a<br />
helpful step for any transit agency planning to deploy ITS technologies.<br />
An advanced communications system (ACS) is not focused solely on the communications<br />
between the BRT vehicle and the transportation management center<br />
(TMC). While this is a vital data link, it is just one <strong>of</strong> the many communication<br />
links required for BRT system integration. Exhibit 2-13 provides a schematic <strong>of</strong> a<br />
typical communication system and the interactions among the various elements<br />
<strong>of</strong> a BRT system.<br />
As indicated, an ACS is the foundation <strong>of</strong> a successfully deployed ITS-enhanced<br />
BRT system. All ITS technologies require some form <strong>of</strong> communication among<br />
the BRT vehicle, roadside infrastructure, and transit management center. The<br />
ACS essentially provides the means for the synergies <strong>of</strong> the ITS technologies and<br />
BRT concept to come together.<br />
System-Specific Planning/Design Considerations<br />
<strong>Transit</strong> Signal Priority<br />
Intersection Infrastructure Needs—In many cases, traffic signal control<br />
cabinets and controllers (devices at intersections that control the traffic<br />
signals) will need to be upgraded or replaced all together. The modification<br />
<strong>of</strong> these traffic signal devices can add cost and time to the implementation<br />
<strong>of</strong> TSP. Each intersection may require $10,000 to $18,000 ($8,000 to $15,000<br />
for the cabinets, $1,000 to $2,500 for the controllers, and $500 for s<strong>of</strong>tware).<br />
Time required for design, system specification, and system manufacture can<br />
add at least 6 to 12 months.<br />
Cooperation with External Agencies and Municipal Jurisdictions—The successful<br />
implementation <strong>of</strong> transit signal priority depends on cooperation<br />
between the transit agency and the relevant municipal jurisdiction in charge<br />
<strong>of</strong> traffic control.<br />
Automatic Vehicle Location<br />
Cooperation <strong>of</strong> Other <strong>Department</strong>s—In addition to the communications<br />
system, AVL systems can provide information in a manner that transforms<br />
Major Elements <strong>of</strong> BRT<br />
certain business functions. Cooperation among various departments is,<br />
therefore, necessary.<br />
<strong>Department</strong>s affected can include Operations (fixed-route and paratransit),<br />
Maintenance, Scheduling, Payroll, IT, and Planning. Issues for coordination<br />
include the placement <strong>of</strong> devices on the vehicles, requirements for labor,<br />
procedures for maintenance, and the development <strong>of</strong> AVL system reports.<br />
Automatic Passenger Counters<br />
APC systems provide valuable data and feedback to the transit agency, and the<br />
planning department in particular. During the implementation phase, agencies<br />
need to pay particular attention to the following:<br />
Placement <strong>of</strong> Equipment—Placement <strong>of</strong> equipment affects the ability to<br />
accurately count the number <strong>of</strong> passengers based on the fare collection and<br />
boarding processes. Use <strong>of</strong> APCs with non-standard door configurations<br />
(e.g., with additional doors) may require modification <strong>of</strong> standard equipment<br />
and s<strong>of</strong>tware.<br />
Interfacing with AVL—In some cases, an APC system has been implemented<br />
as a stand-alone system with its own GPS on buses already equipped with<br />
an AVL system, either because the APC preceded the AVL or the APC was<br />
deployed after the AVL but by a different, less expensive vendor. These situations<br />
have created duplications, higher maintenance costs, and incomplete<br />
and mismatched data. Because the APC system is not getting its ridership<br />
records “stamped” with the AVL data (including route number, run number,<br />
direction, etc.), additional post-data-collection processing will need to be<br />
done to match the APC with bus data.<br />
Data Downloading Options—APC data downloading options include manual<br />
downloading via a laptop, wireless data via wireless LAN, and real-time<br />
reporting. Wireless data downloading (either at a specific regular interval or<br />
in real-time) <strong>of</strong>fers an efficient and convenient option for transit agencies.<br />
Report-Generating S<strong>of</strong>tware—APC systems can generate reports more<br />
quickly and in more useful formats than traditional manual surveys. An<br />
investigation <strong>of</strong> reporting capabilities and requirements (from multiple departments,<br />
in addition to planning departments) can better define requirements<br />
<strong>of</strong> the APC system at the initiation <strong>of</strong> procurement.<br />
2-101
Major Elements <strong>of</strong> BRT<br />
Real-Time Information<br />
Real-time transit information systems include automated annunciation systems,<br />
Internet bus location and arrival information, bus stop arrival time information,<br />
and telephone-accessible information (e.g., IVR, cell phone, PDA). Real-time information<br />
system is the most, if not only, visible ITS system to the public and<br />
the one with which they can interact. Hence, a great deal <strong>of</strong> care must be taken<br />
when implementing any <strong>of</strong> these systems, as the public’s trust in the information<br />
provided by these systems is at stake. If the information delivered is not accurate<br />
or reliable, riders will quickly lose faith in the system, which may impact the decision<br />
to use the transit service.<br />
To ensure that real-time information systems are implemented properly and are<br />
providing meaningful and complete information, agencies need to consider the<br />
following implementation approaches:<br />
Deployment after AVL—Implementing real-time systems after the AVL<br />
system has been successfully launched allows for system function and interfaces<br />
to be successfully resolved, thereby allowing more reliable reporting <strong>of</strong><br />
data and ensuring that information reported to the public can be trusted.<br />
Phased Deployment - Phased implementation <strong>of</strong> specific systems (such as<br />
on one route only) provides transit agencies with the opportunity to test<br />
the system at a small scale, allowing the agency to work out any arrival time<br />
prediction inaccuracies and hardware problems.<br />
Defining Infrastructure Needs: Defining infrastructure needs (communications<br />
and power) and making sure that they are available on site are critical<br />
elements, especially when deploying the system at bus stops/shelters. A<br />
power source <strong>of</strong>ten is not available at shelters, or permission to draw power<br />
is necessary. Furthermore, in many cases, civil works, such as digging up and<br />
replacing the sidewalk to run power lines to the bus stop/shelter, are necessary,<br />
which can require the involvement <strong>of</strong> multiple city departments (e.g.,<br />
public works, traffic and signals).<br />
Cameras<br />
Deployment <strong>of</strong> on-board surveillance cameras helps in reducing crime and vandalism<br />
and provides a greater sense <strong>of</strong> safety and security for the drivers and<br />
passengers. Two issues are important to consider in the deployment <strong>of</strong> such a<br />
system:<br />
2-102<br />
Number and Location <strong>of</strong> Cameras—The number and location <strong>of</strong> cameras<br />
are based on the agency’s assessment <strong>of</strong> what activities and events are critical<br />
to monitor (e.g., fare payment, entry/exit points, traffic, potential traffic<br />
accidents, areas <strong>of</strong> potential passenger accidents, driver’s area).<br />
Delivery Mechanism: As with APC data, data can be downloaded manually<br />
(by removing the tape/disc and viewing it at a central location) or wirelessly.<br />
Downloading images in real-time requires a large bandwidth, which most<br />
agencies do not have and could result in interruptions to other communications<br />
systems.<br />
standards, Interface and Institutional requirements<br />
In ITS, standards for individual components and interfaces between components<br />
are critical for proper and successful implementation.<br />
National ITS Architecture (applicable to U.S. applications)<br />
The National ITS Architecture provides a common framework for planning, defining,<br />
and integrating intelligent transportation systems. The National ITS Architecture<br />
is not a design tool; it defines the framework around which different<br />
approaches to design and implement systems could be developed, including:<br />
Functions (e.g., gather traffic information, request a route) required for ITS.<br />
Physical entities or subsystems where these functions reside (e.g., roadside<br />
or vehicle).<br />
Information flows that connect these functions and physical subsystems<br />
into an integrated system.<br />
The ITS architecture helps guide transportation pr<strong>of</strong>essionals in applying standards<br />
and making deployment decisions that will result in efficiency, economies<br />
<strong>of</strong> scale, and national interoperability. The National ITS Architecture provides a<br />
common ground for a region’s various agencies to integrate their ITS systems,<br />
allowing coordination at the regional level.<br />
Benefits <strong>of</strong> using the National ITS Architecture in the design, implementation,<br />
and operation <strong>of</strong> ITS include:<br />
Multiple supplies—more vendors will be supplying compatible equipment,<br />
leading to competition and less expensive equipment.
Future growth—by following an “open system” approach, the National ITS<br />
Architecture allows migration paths for future growth and expansion (i.e.,<br />
upgrade subsystems instead <strong>of</strong> starting from scratch).<br />
Support ranges <strong>of</strong> functionality—the National ITS Architecture supports<br />
high-end and low-end features. Basic services can be provided free, while<br />
value-added services can be added on a fee basis.<br />
Synergy—the National ITS Architecture considers the requirements for multiple<br />
functions and allocates systems that optimally support those functions.<br />
Risk reduction—the National ITS Architecture’s common framework<br />
reduces risk for those implementing ITS, equipment manufacturers, and<br />
consumers alike.<br />
<strong>Transit</strong> Communication Interface Pr<strong>of</strong>iles<br />
The <strong>Transit</strong> Communications Interface Pr<strong>of</strong>iles (TCIP) is an APTA standard development<br />
effort designed to allow separate transit system components and organizations<br />
to exchange data in a plug-and-play environment, particularly related<br />
to s<strong>of</strong>tware for various transit applications. TCIP encourages transit agencies and<br />
transit suppliers to create standardized, tailored interfaces. TCIP is applicable to<br />
all transit modes and services including BRT.<br />
TCIP is based on the earlier NTCIP work performed by ITE, AASHTO, and NEMA<br />
and is published as the NTCIP 1400-Series Standards. TCIP extended the NTCIP<br />
Standards to include a Concept <strong>of</strong> Operations, Model Architecture, Dialog Definitions,<br />
and a rigorous, modular approach to conformance. Development <strong>of</strong><br />
both the TCIP and the earlier NTCIP was sponsored by the U.S. DOT’s Intelligent<br />
Transportation Systems Joint Program Office.<br />
In 1996, TCIP was launched, and ITE was selected to develop the standards. In<br />
1999, Phase 1 <strong>of</strong> TCIP (TCIP1) was completed with the help <strong>of</strong> more than 800 volunteers.<br />
TCIP1 established a transit data interface framework and eight business<br />
area object standards. A list <strong>of</strong> TCIP1 standards is contained in Exhibit 2-14.<br />
In March 2000, Phase 2 <strong>of</strong> TCIP (TCIP2) was launched. TCIP2 is sometimes referred<br />
to as the “dialogues” phase <strong>of</strong> TCIP because it focuses on the details <strong>of</strong><br />
information exchange (messages) within and between transit applications <strong>of</strong> ITS.<br />
TCIP2 pays particular attention to the issue <strong>of</strong> messaging requirements for communications<br />
between different computing platforms since it is not realistic to<br />
expect the entire transit industry to adopt a single standard platform. Therefore,<br />
the project includes transit-specific pr<strong>of</strong>iles to existing applications and commu-<br />
Code title<br />
Major Elements <strong>of</strong> BRT<br />
nications standards. The goal <strong>of</strong> TCIP2 is to develop the transaction sets, application<br />
pr<strong>of</strong>iles, and implementation tools. A set <strong>of</strong> guidebooks is being developed<br />
to test and implement TCIP standards.<br />
Implementation Issues During operation<br />
This section discusses issues that may arise during the operation <strong>of</strong> the BRT project,<br />
including:<br />
Labor requirements<br />
Institutional and business process requirements<br />
Initial and ongoing training requirements<br />
Reliability and maintainability<br />
Exhibit 2-14: TCIP Standards<br />
NTCIP 1400 Framework Document<br />
NTCIP 1401 Standard on Common Public Transportation (CPT) Objects<br />
NTCIP 1402 Standard on Incident Management (IM) Objects<br />
NTCIP 1403 Standard on Passenger Information (PI) Objects<br />
NTCIP 1404 Standard on Scheduling/Runcutting (SCH) Objects<br />
NTCIP 1405 Standard on Spatial Representation (SP) Objects<br />
NTCIP 1406 Standard on On-Board (OB) Objects<br />
NTCIP 1407 Standard on Control Center (CC) Objects<br />
NTCIP 1408 Fare Collection Business Area Standard<br />
labor requirements<br />
The primary purpose <strong>of</strong> ITS technologies is to help transit agencies improve efficiencies,<br />
reduce cost, and provide better information. These benefits, however,<br />
<strong>of</strong>ten come at the cost <strong>of</strong> additional labor needs. ITS transit systems have many<br />
components that need to be routinely maintained and/or updated, which adds<br />
additional burden on the maintenance and/or operations staff. For example, updating<br />
schedules and information to be displayed onboard buses and/or wayside<br />
are additional tasks that need to be performed by agency staff. Moreover, ITS<br />
systems tend to generate a wealth <strong>of</strong> data that is useful to many areas within<br />
the transit agency. Producing these reports and performing data analysis are also<br />
2-103
Major Elements <strong>of</strong> BRT<br />
additional efforts to be carried out. Thus, when deploying any <strong>of</strong> the ITS technologies<br />
stated earlier, it is crucial for the transit agency to figure out how these<br />
technologies will impact its staffing. If additional staff will be required to support<br />
these deployments, then the agency will need to include that in their budget. In<br />
addition to the possibility <strong>of</strong> having to augment staff, some <strong>of</strong> the existing staff<br />
will need to be trained on how to use the new technologies.<br />
Institutional/Business Process requirements<br />
Deploying ITS technologies quite <strong>of</strong>ten entails some changes as to how an<br />
agency performs certain tasks. For example, if BRT vehicles provide on-board<br />
automated annunciations, then stop and route information will need to be kept<br />
up-to-date and downloaded to vehicles whenever any change to any route is<br />
made. Similarly, any new BRT stop will need to be geocoded, a practice that may<br />
not have been required prior to ITS deployments. In addition, data generated<br />
from the ITS systems will need to be disseminated within the agency, requiring<br />
a process <strong>of</strong> how to create reports, when to create them, and which staff is to<br />
receive what report.<br />
Initial and ongoing training requirements<br />
Training <strong>of</strong> personnel that will be using the system is vital to any technology deployment.<br />
Dispatchers and drivers should receive comprehensive training before<br />
the AVL system is in place and should receive refresher training a few weeks after<br />
the system is live. In some cases, elementary training may be needed by dispatchers<br />
who may not be computer-literate.<br />
reliability/Maintainability<br />
ITS technologies need to be well maintained to deliver the expected benefits.<br />
Given that some ITS technologies are used by the public to help them navigate<br />
the transit system, keeping these technologies well maintained and properly<br />
functioning is crucial. Disseminating incorrect real-time information due to a<br />
non-functioning GPS unit or outdated schedule will have severe negative consequences<br />
on the reputation <strong>of</strong> the service.<br />
Experience with Brt and Its<br />
summary <strong>of</strong> Implementation<br />
Overall, ITS technologies have the potential to improve BRT system performance<br />
by leveraging investment in physical infrastructure.<br />
2-104<br />
Among the 18 U.S. BRT systems presented in Exhibit 2-15, all are either currently<br />
using or are planning to use ITS technologies. Implementation <strong>of</strong> an Automatic<br />
Vehicle Location system, real-time travel information, transit signal priority, and<br />
security technologies are the most widespread applications <strong>of</strong> ITS.<br />
<strong>Transit</strong> signal priority is the primary <strong>Transit</strong> Vehicle Prioritization technology<br />
used in the U.S., with 11 <strong>of</strong> the 18 systems installing TSP on at least some intersections.<br />
Only one, the Silver Line in Boston, uses access control, while the Cleveland<br />
HealthLine and Eugene EmX use signal timing/phasing optimization.<br />
The implementation <strong>of</strong> intelligent vehicle system technologies is rare among current<br />
U.S. BRT systems. The Las Vegas MAX system incorporated precision docking<br />
through optical guidance. However, the system is no longer used because <strong>of</strong><br />
significant maintenance costs due to local weather conditions; MAX currently<br />
relies on manual docking guided by the curb. Cleveland is installing mechanical<br />
docking guidance on the median guideway stations <strong>of</strong> its HealthLine BRT.<br />
All U.S. BRT systems use Operation Management Systems technologies . Almost<br />
all systems in Exhibit 2-15 have implemented or are implementing some type <strong>of</strong><br />
AVL system. Computer-Aided Dispatch systems are regularly implemented with<br />
AVL systems. Automated Scheduling and Dispatch S<strong>of</strong>tware, Automated Passenger<br />
Counters, and Vehicle Component Monitoring Systems have also been<br />
implemented in some systems, but are less widespread than AVL.<br />
Almost all U.S. BRT systems have installed some passenger information system<br />
technologies. Of particular note, 14 <strong>of</strong> the 18 systems below have or are planning<br />
to implement electronic information displays at stations.<br />
In the U.S., security and safety technologies are becoming more common, with<br />
half <strong>of</strong> the BRTs using some kind <strong>of</strong> on-board alarm or monitoring system.<br />
Outside <strong>of</strong> the U.S., real-time passenger information at stations is the most commonly-used<br />
ITS element, with almost every system in Exhibit 2-15 employing or<br />
planning real-time displays. Europe is the only region where use <strong>of</strong> Intelligent<br />
Vehicle Systems is prevalent. Mechanical guidance is most common, with one<br />
city using optical guidance and another electromagnetic guidance. Security<br />
and safety technologies are used in the three Australian cities, but few other<br />
international BRT systems report using these technologies. Finally, there is some<br />
use <strong>of</strong> TSP around the world, but it is not as commonly used as in the U.S. and<br />
Canada.
<strong>Transit</strong> Vehicle Prioritization<br />
Exhibit 2-15: Experience with BRT and ITS<br />
Major Elements <strong>of</strong> BRT<br />
Albuquerque Boston – Silver Line Chicago Cleveland Eugene Honolulu Kansas City<br />
Rapid Ride Washington St Waterfront Neighborhood<br />
Express<br />
HealthLine EmX Express<br />
Signal Timing/Phasing Optimization X X<br />
Station and Lane access Control X<br />
<strong>Transit</strong> Signal Priority (Number <strong>of</strong> Intersections<br />
Applied / Total Number <strong>of</strong> Intersections)<br />
Intelligent Vehicle Systems<br />
Collision Warning<br />
Main Street<br />
MAX<br />
40 / 50 Yes 31<br />
Precision Docking Yes<br />
Lane Keeping Assistance Systems<br />
Operations Management Systems<br />
Computer Aided Dispatch (CAD) X X X X<br />
Automatic Vehicle Location (AVL) GPS GPS GPS GPS GSP GPS GPS<br />
Automated Scheduling and Dispatch S<strong>of</strong>tware<br />
Automated Passenger Counters (APCs) X X<br />
Vehicle Component Monitoring System<br />
Passenger Information Systems<br />
AVM X<br />
Pre-trip X X X X<br />
En-route<br />
Station/Terminal X X X X (VMS) X X (Next-bus info)<br />
In-Vehicle<br />
Safety and Security Technology<br />
X X X X<br />
On-board Silent Alarms X<br />
On-board Voice Monitoring X<br />
On-board Video Monitoring X X<br />
2-105
Major Elements <strong>of</strong> BRT<br />
<strong>Transit</strong> Vehicle Prioritization<br />
Signal Timing/Phasing Optimization<br />
Station and Lane access Control<br />
<strong>Transit</strong> Signal Priority (Number <strong>of</strong> Intersections<br />
Applied / Total Number <strong>of</strong> Intersections)<br />
Intelligent Vehicle Systems<br />
2-106<br />
Exhibit 2-15: Experience with BRT and ITS (cont’d.)<br />
Las Vegas Los Angeles Los Angeles Miami Oakland Orlando Phoenix<br />
North Las Vegas<br />
MAX<br />
Orange Line<br />
Metro Rapid<br />
(All routes)<br />
South Dade<br />
Busway<br />
Rapid San Pablo<br />
Corridor<br />
LYMMO RAPID<br />
12 / 20 Planned 985 Yes 1/1<br />
Collision Warning X<br />
Precision Docking Manual, with curb<br />
Lane Keeping Assistance Systems<br />
Operations Management Systems<br />
Computer Aided Dispatch (CAD) X X X<br />
Automatic Vehicle Location (AVL) GPS GPS, Loop Detectors GPS, Loop Detectors X GPS AVL / Wi-Fi X<br />
Automated Scheduling and Dispatch S<strong>of</strong>tware X X X X X<br />
Automated Passenger Counters (APCs) X X X X X<br />
Vehicle Component Monitoring System X<br />
Passenger Information Systems<br />
Pre-trip X X X<br />
En-route X X X<br />
Station/Terminal X (Next-bus VMS) X (Next-bus VMS) X X X X<br />
In-Vehicle<br />
Safety and Security Technology<br />
X X X X X X<br />
On-board Silent Alarms X X X X<br />
On-board Voice Monitoring X X X X X<br />
On-board Video Monitoring X X X X X
<strong>Transit</strong> Vehicle Prioritization<br />
Signal Timing/Phasing Optimization<br />
Station and Lane access Control<br />
<strong>Transit</strong> Signal Priority (Number <strong>of</strong> Intersections<br />
Applied / Total Number <strong>of</strong> Intersections)<br />
Intelligent Vehicle Systems<br />
Collision Warning X<br />
Precision Docking<br />
Lane Keeping Assistance Systems<br />
Operations Management Systems<br />
Computer Aided Dispatch (CAD)<br />
Exhibit 2-15: Experience with BRT and ITS (cont’d.)<br />
Pittsburgh Sacramento San Jose Halifax Ottawa<br />
Major Elements <strong>of</strong> BRT<br />
Busways EBus Rapid 522 Metro<strong>Link</strong> <strong>Transit</strong>way<br />
1/1 3 / 43 (green ext) 56 / 128 (green ext, red truncation) 27 12 / 16<br />
Automatic Vehicle Location (AVL) GPS Yes GPS<br />
Automated Scheduling and Dispatch S<strong>of</strong>tware X X<br />
Automated Passenger Counters (APCs) X X (4 veh) X (10% <strong>of</strong> fleet)<br />
Vehicle Component Monitoring System Under development<br />
Passenger Information Systems<br />
Pre-trip X X Trip Planning X<br />
En-route X<br />
Station/Terminal X Real time info in development Real Time Information X<br />
In-Vehicle<br />
Safety and Security Technology<br />
X X (Automated next-stop announcement) X<br />
On-board Silent Alarms X X X X<br />
On-board Voice Monitoring X X Planned<br />
On-board Video Monitoring X X Planned<br />
2-107
Major Elements <strong>of</strong> BRT<br />
2-108<br />
<strong>Transit</strong> Vehicle Prioritization<br />
Signal Timing/Phasing Optimization<br />
Station and Lane access Control<br />
<strong>Transit</strong> Signal Priority (Number <strong>of</strong> Intersections<br />
Applied / Total Number <strong>of</strong> Intersections)<br />
Intelligent Vehicle Systems<br />
Collision Warning<br />
Exhibit 2-15: Experience with BRT and ITS (cont’d.)<br />
York Bogotá Guayaquil Pereira Amsterdam<br />
VIVA Transmilenio Metrovia Megabus Zuidtangent<br />
All intersections along route None None None 45<br />
Precision Docking Mechanical<br />
Lane Keeping Assistance Systems<br />
Operations Management Systems<br />
Computer Aided Dispatch (CAD)<br />
Automatic Vehicle Location (AVL) X<br />
Automated Scheduling and Dispatch S<strong>of</strong>tware X<br />
Automated Passenger Counters (APCs) X<br />
Vehicle Component Monitoring System X<br />
Passenger Information Systems<br />
Pre-trip<br />
En-route<br />
Loop detectors,<br />
station sensors<br />
On-board<br />
transponders<br />
On-board<br />
transponders<br />
Station/Terminal X Nextbus displays Nextbus displays Nextbus displays<br />
In-Vehicle<br />
Safety and Security Technology<br />
X<br />
On-board Silent Alarms X<br />
On-board Voice Monitoring<br />
On-board Video Monitoring Video recording (not monitoring)<br />
Real-time stop information,<br />
timetabled
<strong>Transit</strong> Vehicle Prioritization<br />
Signal Timing/Phasing Optimization<br />
Station and Lane access Control<br />
<strong>Transit</strong> Signal Priority (Number <strong>of</strong> Intersections<br />
Applied / Total Number <strong>of</strong> Intersections)<br />
Intelligent Vehicle Systems<br />
Collision Warning<br />
Exhibit 2-15: Experience with BRT and ITS (cont’d.)<br />
Major Elements <strong>of</strong> BRT<br />
Caen Edinburgh Eindhoven Leeds London<br />
Tram on Wheels Fastlink Phileas - Western Corridor Superbus Crawley<br />
49 Signal Priority Automatic TSP 20<br />
Precision Docking Mechanical- Central Guidance Rail Mechanical<br />
Lane Keeping Assistance Systems<br />
Operations Management Systems<br />
Computer Aided Dispatch (CAD)<br />
Automatic Vehicle Location (AVL) GPS<br />
Automated Scheduling and Dispatch S<strong>of</strong>tware Yes<br />
Automated Passenger Counters (APCs)<br />
Vehicle Component Monitoring System<br />
Passenger Information Systems<br />
Pre-trip Online-journey planner and timetable<br />
En-route<br />
Station/Terminal Real-time information<br />
In-Vehicle<br />
Safety and Security Technology<br />
On-board Silent Alarms<br />
On-board Voice Monitoring<br />
Real-time information,<br />
SMS<br />
On-board Video Monitoring CCTV at station and in bus<br />
Electromagnetic (for docking,<br />
not currently used)<br />
Real-time stop information,<br />
timetabled<br />
TSP in downtown<br />
areas<br />
Mechanical Mechanical<br />
Real-time<br />
information, SMS<br />
Time tabled, at<br />
Station/Stop<br />
2-109
Major Elements <strong>of</strong> BRT<br />
<strong>Transit</strong> Vehicle Prioritization<br />
Signal Timing/Phasing Optimization<br />
Station and Lane access Control<br />
<strong>Transit</strong> Signal Priority (Number <strong>of</strong> Intersections<br />
Applied / Total Number <strong>of</strong> Intersections)<br />
Intelligent Vehicle Systems<br />
2-110<br />
Exhibit 2-15: Experience with BRT and ITS (cont’d.)<br />
Rouen Utrecht Adelaide Brisbane<br />
TEOR Busway North East Busway<br />
All but 3 intersections (pre 2007 extension)<br />
Signal Priority- Automatic and Manual<br />
Yes; Signal Priority -<br />
Automatic<br />
South East and Inner<br />
Northern Busways<br />
Passive Priority X<br />
Collision Warning None<br />
Precision Docking Optical Mechanical Guide Rollers on Front Axle None<br />
Lane Keeping Assistance Systems None<br />
Operations Management Systems<br />
Computer Aided Dispatch (CAD)<br />
Automatic Vehicle Location (AVL) GPS<br />
Automated Scheduling and Dispatch S<strong>of</strong>tware X X<br />
Automated Passenger Counters (APCs)<br />
Vehicle Component Monitoring System<br />
Passenger Information Systems<br />
X X<br />
Pre-trip<br />
En-route<br />
City Web Site has Trip Planning<br />
Station/Terminal Real-time stop information, timetabled<br />
Real-time stop<br />
information, timetabled<br />
No Real Time Info<br />
In-Vehicle<br />
Safety and Security Technology<br />
No<br />
On-board Silent Alarms Yes<br />
On-board Voice Monitoring Yes Yes<br />
On-board Video Monitoring Yes Yes
<strong>Transit</strong> Vehicle Prioritization<br />
Signal Timing/Phasing Optimization<br />
Station and Lane access Control<br />
<strong>Transit</strong> Signal Priority (Number <strong>of</strong> Intersections<br />
Applied / Total Number <strong>of</strong> Intersections)<br />
Intelligent Vehicle Systems<br />
Exhibit 2-15: Experience with BRT and ITS (cont’d.)<br />
Major Elements <strong>of</strong> BRT<br />
Sydney Beijing Hangzhou Kunming<br />
T-Ways Line 1 Line B1 Busway Network<br />
65 on Liverpool line; Signal Pre-emption<br />
including green extension and early green<br />
Yes Yes<br />
Collision Warning None None None None<br />
Precision Docking None None None None<br />
Lane Keeping Assistance Systems<br />
Operations Management Systems<br />
None None None None<br />
Computer Aided Dispatch (CAD)<br />
Automatic Vehicle Location (AVL) Loop Detectors, Liverpool only Yes Yes<br />
Automated Scheduling and Dispatch S<strong>of</strong>tware X<br />
Automated Passenger Counters (APCs)<br />
Vehicle Component Monitoring System X<br />
Passenger Information Systems<br />
Pre-trip<br />
En-route<br />
Station/Terminal<br />
Real Time Info at Liverpool stations; termini<br />
stations only for other 2 line<br />
Real-Time Info Real-Time Info<br />
In-Vehicle<br />
Safety and Security Technology<br />
On-board Silent Alarms<br />
Real time info Real-Time Info<br />
On-board Voice Monitoring Yes X<br />
On-board Video Monitoring Yes X<br />
Currently being<br />
implemented<br />
2-111
Major Elements <strong>of</strong> BRT<br />
Implementation <strong>of</strong> ITS for specific BRT applications is neither widespread or longstanding.<br />
To supplement the understanding <strong>of</strong> the potential for ITS applications,<br />
case studies <strong>of</strong> applications (many in non-BRT contexts) are presented here.<br />
transit Vehicle Prioritization<br />
Signal Timing/Phasing Optimization<br />
Chicago (non-BRT) —Pace is currently working on a signal timing optimization<br />
collaborative effort with the Illinois <strong>Department</strong> <strong>of</strong> Transportation<br />
(IDOT), the Regional Transportation Authority, and local municipal entities,<br />
which started in January 2005 and extends through 2007. The scope<br />
<strong>of</strong> work includes data collection, selection <strong>of</strong> intersections for TSP signal<br />
timing optimization, a signal timing strategies plan, design <strong>of</strong> specifications,<br />
deployment, and demonstration and evaluation. This project includes 31<br />
signalized intersections in the vicinity <strong>of</strong> the Harvey Transportation Center.<br />
The purpose <strong>of</strong> this effort is for IDOT to have optimized traffic signals that<br />
could serve as the base condition for the comparison <strong>of</strong> TSP strategies in<br />
the future.<br />
Station and Lane Access Control<br />
Boston—MBTA<br />
deployed a station and tunnel access control system, an<br />
intrusion detection system that provides access only to MBTA BRT vehicles.<br />
The 20 BRT vehicles are equipped with RF (radio frequency) transponders<br />
that communicate with a receiver at the tunnel entrance, and access is<br />
provided to approved vehicles. The system has been operational since 2005.<br />
The cost <strong>of</strong> this system plus an elaborate security and surveillance system<br />
was $5 million.<br />
<strong>Transit</strong> Signal Priority<br />
Los Angeles—As<br />
<strong>of</strong> 2007 the LADOT implemented a TSP system used by<br />
Metro Rapid that consists <strong>of</strong> 331 loop detectors, 210 intersections equipped<br />
with automatic vehicle identification (AVI) sensors at the controller cabinet,<br />
150 emitters-equipped buses, and central control system s<strong>of</strong>tware at a total<br />
cost <strong>of</strong> $10 million. Loop detection technology is used to detect the presence<br />
<strong>of</strong> a bus approaching the intersection. Bus identification is detected by<br />
the AVI sensor and sent to the transit management computer located at the<br />
LADOT transportation management center. Average cost was $13,500 per<br />
signalized intersection.<br />
2-112<br />
In Los Angeles, the implementation <strong>of</strong> Metro Rapid also became the impetus for<br />
installing a new communication system. The system needed a way to transmit<br />
data between the BRT vehicle, traffic signals, and the transit management center<br />
to implement the TSP system. Fiber optic cables were installed, linking the traffic<br />
signals and the transit management center. Communication needs at BRT sites<br />
<strong>of</strong> planned ITS technologies will need to be analyzed and compared to current<br />
communication capabilities.<br />
Intelligent Vehicle systems<br />
Collision Warning<br />
San Mateo, California (non-BRT) —The San Mateo County <strong>Transit</strong><br />
District (SamTrans) carried out a collision warning system demonstration<br />
project in the summer <strong>of</strong> 2005. A bus was fitted with integrated frontal<br />
and side collision warning devices. This system is being expanded to more<br />
vehicles.<br />
Pittsburgh (non-BRT) —The Port Authority <strong>of</strong> Allegheny County installed<br />
a side object detection system from Collision Warning Systems on<br />
100 vehicles operating out <strong>of</strong> its East Liberty garage. The system includes<br />
six sensors on each side <strong>of</strong> the bus and a sensor on the back corners. The<br />
system detects objects and provides both an audible and visual warning to<br />
the driver.<br />
Precision Docking<br />
Las Vegas—The<br />
Civis bus was guided by an inexpensive, computerized<br />
optical guidance system that follows white stripes painted on the pavement.<br />
However, due to lack <strong>of</strong> rainfall, the roadway needed constant cleaning <strong>of</strong><br />
dirt and oil buildup, which degraded the contrast between the white stripes<br />
and the pavement. Hence, the system was performing irregularly and has<br />
subsequently been abandoned.<br />
Lane-Keeping Assistance Systems<br />
Eindhoven, Netherlands<br />
—Phileas is a 200-passenger-BRT system that is<br />
(semi-) automated. It operates on a dedicated lane, and the electronic guidance<br />
enables it to operate automatically while on its dedicated guideway. In<br />
semi-automated mode, the lateral position is controlled by the technology<br />
and the driver controls the speed.
operations Management systems<br />
Implementation <strong>of</strong> operations management technologies such as CAD/AVL is<br />
<strong>of</strong>ten tied to system-wide implementations and is not just BRT-related. The deployments<br />
discussed below may include BRT routes operated by these agencies<br />
but are generally intended as system-wide applications.<br />
Computer Aided Dispatch (CAD)<br />
Columbus, Ohio—As<br />
part <strong>of</strong> its CAD/AVL procurement, the Central Ohio<br />
<strong>Transit</strong> Authority acquired Trapeze scheduling s<strong>of</strong>tware for its fixed-route<br />
fleet (Trapeze FX and OPS).<br />
Northern Kentucky—The<br />
<strong>Transit</strong> Authority <strong>of</strong> Northern Kentucky<br />
(TANK) deployed fixed-route operations s<strong>of</strong>tware as part <strong>of</strong> its CAD/AVL<br />
deployment in 2003.<br />
Fairfax, Virginia—The<br />
Connector bus service acquired fixed-route scheduling<br />
s<strong>of</strong>tware in 2004.<br />
Woodbridge, Virginia—The<br />
Potomac and Rappahannock Transportation<br />
Commission (PRTC) deployed MDTs on its fleet as part <strong>of</strong> its ITS deployment<br />
in 2003.<br />
Automatic Vehicle Location (AVL)<br />
Madison, Wisconsin—Metro<br />
<strong>Transit</strong> deployed CAD/AVL system on its<br />
243-vehicle fleet. The system also monitors route and schedule adherence.<br />
Woodbridge, Virginia—PRTC<br />
deployed a CAD/AVL system on its fleet <strong>of</strong><br />
13 flexible service and 57 express vehicles in 2003.<br />
Las Vegas—The<br />
Regional Transportation Commission <strong>of</strong> Southern Nevada<br />
recently acquired a GPS-based CAD/AVL system, which included 296 fixedroute,<br />
150 paratransit, and 10 supervisor vehicles.<br />
Lake Tahoe, Nevada—The<br />
Tahoe Regional Planning Agency (TRPA)<br />
deployed a CAD/AVL system on its fleet <strong>of</strong> 47 vehicles.<br />
Automated Scheduling and Dispatch S<strong>of</strong>tware<br />
Columbus, Ohio—In<br />
2002, as part <strong>of</strong> its CAD/AVL procurement, the Central<br />
Ohio <strong>Transit</strong> Authority acquired scheduling s<strong>of</strong>tware for its fixed-route<br />
fleet<br />
Major Elements <strong>of</strong> BRT<br />
Madison, Wisconsin—Metro<br />
<strong>Transit</strong> deployed a CAD/AVL system on<br />
its 243-vehicle fleet. The system provides for two dispatching workstations.<br />
Automated fixed-route scheduling s<strong>of</strong>tware was also deployed.<br />
Kansas City, Missouri—Kansas<br />
City Area <strong>Transit</strong> Authority (KCATA) acquired<br />
both automated scheduling s<strong>of</strong>tware and dispatch s<strong>of</strong>tware as part<br />
<strong>of</strong> its ITS deployment in 2003. Scheduling and dispatching s<strong>of</strong>tware are also<br />
used for KCATA’s BRT service.<br />
Automated Passenger Counters (APCs)<br />
Las Vegas—The<br />
Regional Transportation Commission <strong>of</strong> Southern Nevada<br />
deployed an APC system as part <strong>of</strong> its CAD/AVL deployment effort.<br />
Columbus, Ohio—The<br />
Central Ohio <strong>Transit</strong> Authority has been using<br />
APCs since the mid-1980s, with its most recent upgrade in 2005. Data collected<br />
by the APCs are 95 percent accurate.<br />
Seattle—The<br />
King County <strong>Department</strong> <strong>of</strong> Transportation (Metro) has<br />
been utilizing APCs since 1980. In 2000, King County Metro upgraded its<br />
APC system and increased the percentage <strong>of</strong> APC-equipped buses from 12<br />
to 15 percent.<br />
Portland, Oregon—Data<br />
collected by Tri-Met’s APCs are 98-99 percent<br />
accurate.<br />
Vehicle Component Monitoring System<br />
Falls Church, Virginia—In<br />
2002, Falls Church equipped four <strong>of</strong> its buses<br />
with in-vehicle diagnostics monitoring system. This system is a network <strong>of</strong><br />
sensors connected to critical vehicle systems (e.g., transmission) and provides<br />
data that can be used by a maintenance system.<br />
Washington, D.C.<br />
—WMATA Metrobus equipped 164 new CNG and articulated<br />
buses with in-vehicle diagnostics monitoring system. At the end <strong>of</strong> the<br />
day, as buses return to their garages, data collected on critical components in<br />
the vehicle (e.g., transmission “health”) are downloaded from each bus.<br />
2-113
Major Elements <strong>of</strong> BRT<br />
Passenger Information systems<br />
Pre-Trip Passenger Information<br />
Chicago—The<br />
Regional Transportation Authority is developing a Multimodal<br />
Trip Planning System (MMTPS) that will integrate existing singlemode<br />
trip planners and real-time travel information systems in the Chicago<br />
region. The MMTPS will use ITS standards to provide travelers with realtime<br />
comparative door-to-door travel instructions over the Internet.<br />
Seattle—King<br />
County Metro’s BusView Internet application provides<br />
information on the location <strong>of</strong> buses. The application allows the user to set<br />
an “alarm” at any point along a bus route; when the bus reaches that point,<br />
a message is sent to the user alerting him/her that the bus has reached the<br />
requested point along the route.<br />
Salt Lake City, Utah—The<br />
Utah <strong>Transit</strong> Authority’s (UTA) website<br />
provides travelers with comprehensive pre-trip information, such as detailed<br />
itineraries and a list <strong>of</strong> buses that are affected by detours. Also, users<br />
can download UTA’s “On the Go” PDA application to access bus schedules,<br />
hours <strong>of</strong> service, fares, and other information.<br />
Washington, D.C. —WMATA’s IVR phone system was introduced in November<br />
2002, making it the first transit agency in the country to <strong>of</strong>fer fullyautomated,<br />
voice-enabled trip planning. The IVR application informs riders<br />
about how to travel to their destinations in the Washington metropolitan<br />
region by bus or rail. It provides several alternatives for each trip request,<br />
including walking directions and fare information. The current application<br />
covers most <strong>of</strong> the bus and rail operators in the region.<br />
San Francisco—Bay<br />
Area Rapid <strong>Transit</strong> (BART) provides its QuickPlanner<br />
for an Apple iPod, which includes BART schedules, station information, a<br />
BART system map, and update notifications.<br />
En-Route Passenger Information<br />
Washington, D.C. —Metrorail eAlerts, provided by WMATA, is an e-mail<br />
subscription service to notify customers <strong>of</strong> Metrorail service disruptions.<br />
Additionally, WMATA provides customers with the ability to generate detailed<br />
trip itineraries via its website.<br />
2-114<br />
Woodbridge, Virginia—PRTC<br />
introduced an e-mail alert system in<br />
December 1999. The system provides information on any incident that may<br />
affect transit service. E-mail alerts are sent to all subscribers and can be<br />
received via computer, cell phone, or PDA.<br />
Station/Terminal Passenger Information<br />
Los Angeles—LACMTA<br />
deployed a real-time arrival information system as<br />
part <strong>of</strong> its Metro Rapid BRT system. The deployment includes 44 DMSs at<br />
various stops that display the actual arrival time <strong>of</strong> buses.<br />
San Luis Obispo, California—SLO<br />
<strong>Transit</strong> provides real-time arrival<br />
information at its bus stops. The DMSs used for this system are all solarpowered.<br />
Williamsport, Pennsylvania—River<br />
Valley <strong>Transit</strong> implemented a<br />
unique information system at its downtown <strong>Transit</strong> Center. The system uses<br />
two DMSs to display the bay number for each bus as well as to alert passengers<br />
when a bus is about to depart.<br />
Portland, Oregon—Tri-Met’s<br />
<strong>Transit</strong> Tracker provides real-time bus arrival<br />
information at numerous bus stops and MAX stations throughout its<br />
service area.<br />
Washington, D.C. —WMATA deployed its Passenger Information Display<br />
System (PIDS) in 2001. The system was operational at all Metrorail stations<br />
with more than 400 signs. DMSs at Metrorail stations display arrival times <strong>of</strong><br />
the Metro trains in a countdown fashion, e.g., “Red Line/6 Cars/4 Minutes.”<br />
The DMSs are also used to display time and to provide information during<br />
an emergency.<br />
In-Vehicle Passenger Information<br />
Columbus, Ohio—Central<br />
Ohio <strong>Transit</strong> Authority (COTA) completed its<br />
installation <strong>of</strong> an Automated Vehicle Anunciation (AVA) System in 2005.<br />
In addition to announcing and displaying upcoming stops inside the bus,<br />
the system announces and displays the route number and direction on the<br />
exterior <strong>of</strong> the bus.<br />
Madison, Wisconsin<br />
—Metro <strong>Transit</strong> equipped its buses with automatic<br />
annunciation as part <strong>of</strong> its ITS deployment in 2003.
Los Angeles—As<br />
part <strong>of</strong> its Phase II deployment, LACMTA deployed an<br />
AVA system on its bus fleet in 2005.<br />
San Antonio—VIA<br />
Metropolitan <strong>Transit</strong> equipped its entire fleet with<br />
an integrated in-vehicle information system. Each vehicle is equipped with<br />
audio/visual units to announce the next stop.<br />
safety and security systems<br />
On-Board Silent Alarm<br />
Denver—Assaults<br />
on bus operators and passengers dropped by 20 percent<br />
after the Denver RTD implemented its silent alarms and covert microphones.<br />
Columbus, Ohio—All<br />
COTA fixed-route vehicles were retr<strong>of</strong>itted with<br />
silent alarm in 2002.<br />
Phoenix—Valley<br />
Metro equipped its fleet with on-board silent alarm system<br />
in 2005.<br />
Los Angeles—LACMTA<br />
equipped its buses with silent alarm system as<br />
part <strong>of</strong> its CAD/AVL deployment in 2004.<br />
On-Board Voice Monitoring<br />
Denver—Denver<br />
RTD implemented its AVL/CAD system which included<br />
silent alarms and covert microphones on-board its buses.<br />
Phoenix—Valley<br />
Metro equipped its fleet with on-board silent alarm systems<br />
in 2005.<br />
Los Angeles—LACMTA<br />
equipped its buses with silent alarm systems as<br />
part <strong>of</strong> its CAD/AVL deployment in 2004.<br />
On-Board Video Monitoring<br />
Monterey, California—Monterey-Salinas<br />
<strong>Transit</strong> deployed a comprehensive<br />
on-board and external video surveillance system in 2004 and 2005.<br />
This system has led to the identification and conviction <strong>of</strong> criminals both<br />
on-board and outside vehicles.<br />
Major Elements <strong>of</strong> BRT<br />
Philadelphia<br />
—Anecdotal information from SEPTA and other transit systems<br />
indicate that the total dollar amount <strong>of</strong> claims can be reduced by 10-<br />
20 percent by having video cameras and recorders on-board transit vehicles.<br />
2-115
Major Elements <strong>of</strong> BRT<br />
relationship between the Element and Demonstrated Performance<br />
This section presents figures <strong>of</strong> demonstrated performance for various ITS technologies.<br />
2-116<br />
Exhibit 2-16: Demonstrated Performance for <strong>Transit</strong> Vehicle Prioritization Systems<br />
ITS Option Performance Measure Case <strong>of</strong> Demonstrated Performance<br />
Signal Timing/Phasing Optimization N/A<br />
Station Lane Access Control N/A<br />
<strong>Transit</strong> Signal Priority Travel Time Savings seattle : King County DOT implemented a 2.1-mile TSP system on Rainier Avenue. Average signal delay was reduced from 7.7<br />
seconds to 3.3 seconds (57% reduction). Effects to side street and overall intersection delay were insignificant.<br />
los Angeles: LADOT and LACMTA estimate up to 25% reduction in bus travel times due to the TSP system.<br />
phoenix : Deployed TSP at seven intersections, reducing signal delay for buses by 16%. Impact on cross traffic was minimal.<br />
tacoma, Washington: Combination <strong>of</strong> TSP and signal optimization reduced transit signal delay ~40% in two corridors (221<br />
intersec-tions).<br />
portland, oregon: TriMet experienced 10% improvement in travel time.<br />
Chicago : PACE buses had an average 15% reduction (3 mins) in running time using TSP at 22 intersections. Actual running<br />
time reductions varied from 7% to 20% depending on the time <strong>of</strong> day.<br />
Reliability portland, oregon: TriMet experienced 19% reduction in travel time variability. Due to increased reliability, TriMet has been<br />
able to reduce travel time.<br />
Capacity portland, oregon: TriMet avoided adding 1 bus by using TSP.<br />
Exhibit 2-17: Demonstrated Performance for Service Planning and Bus Operations Management Systems<br />
ITS Option Performance Measure Case <strong>of</strong> Demonstrated Performance<br />
Computer Aided Dispatch (CAD) N/A<br />
Automatic Vehicle Location (AVL) Hamilton, ontario: Hamilton Street Railway Co. increased schedule adherence from 82% to 89% after implementing AVL.<br />
Automated Scheduling Reliability N/A<br />
Automated Passenger Counters<br />
(APC)<br />
Vehicle Component Monitoring<br />
System<br />
N/A<br />
Safety and Security Washington, d.C.: WMATA’s system reduced road calls. Metrobus VCM system identified new CNG buses with faulty oxygen<br />
sensors; bus manufacturer agreed to replace.
Exhibit 2-18: Demonstrated Performance for Passenger Information Systems<br />
ITS Option Performance Measure Case <strong>of</strong> Demonstrated Performance<br />
Major Elements <strong>of</strong> BRT<br />
Pre-trip Passenger Information Identity & Image Washington, d.C.: WMATA RideGuide improved calls answered by call takers from 85% to 95%, busy/no answer complaints<br />
dropped from 40 per month in 2002 to 0 in early 2003.<br />
En-route Passenger Information N/A<br />
Station/Terminal Passenger<br />
Information<br />
In-Vehicle Passenger Information N/A<br />
Identity & Image Washington, d.C.: WMATA deployed Passenger Information Display System (PIDS) in 2001at all Metrorail stations with over<br />
400 signs. Survey indicated 93% <strong>of</strong> respondents aware <strong>of</strong> PIDS; among frequent Metrorail riders, 99% were aware <strong>of</strong> and 98%<br />
had used PIDS. Survey respondents were fairly satisfied with PIDS, only 11% not satisfied.<br />
Exhibit 2-19: Demonstrated Performance for Safety and Security Systems<br />
ITS Option Performance Measure Case <strong>of</strong> Demonstrated Performance<br />
On-Board Silent Alarms Safety and Security denver: Assaults on bus operators and passengers dropped by 20% after implementation <strong>of</strong> silent alarms and covert microphones.<br />
Columbus, ohio: Covert alarm and AVL system credited for saving a Central Ohio <strong>Transit</strong> Authority driver’s life: Driver hit<br />
covert alarm just as he suffered a heart attack; dispatchers notified instantly, location <strong>of</strong> bus identified, emergency personnel<br />
directed to exact location <strong>of</strong> bus.<br />
On-Board Voice Moni-toring Safety and Security denver: Assaults on bus operators and passengers dropped by 20% after implementation <strong>of</strong> silent alarms and covert microphones.<br />
On-Board Video Moni-toring Safety and Security philadelphia: SEPTA and other transit systems indicate that total dollar amount <strong>of</strong> claims can be reduced by 10% - 20% with<br />
video cameras and recorders on-board transit vehicles.<br />
Washington, d.C.: Surveillance cameras deployed onboard Metrobuses proved effective in three incidents-- In one, on-board<br />
camera captured image <strong>of</strong> a suspected murderer, allowing Metro police to produce a photo <strong>of</strong> suspect’s face. In another, onboard<br />
camera helped WMATA prevail in legal case where a rider sued WMATA, claiming driver reckless driving caused head<br />
injuries.<br />
Demonstrated performance data were not available for collision warning, rear-impact warning, precision docking, or lane-keeping assistance systems.<br />
2-117
Major Elements <strong>of</strong> BRT<br />
Relationship between the Element and Demonstrated Benefits<br />
2-118<br />
Exhibit 2-20: Demonstrated Benefits for <strong>Transit</strong> Vehicle Priority Systems<br />
ITS Option Performance Measure Case <strong>of</strong> Demonstrated Performance<br />
Signal Tim-ing/Phasing<br />
Optimization<br />
N/A<br />
Station Lane Access Control N/A<br />
<strong>Transit</strong> Signal Priority Operating Cost Efficiency los Angeles: LADOT and LACMTA estimate savings in operating costs <strong>of</strong> $6.67 per bus per hour due to TSP system, translates<br />
to approximate savings in operating costs <strong>of</strong> $66.70 per bus per day.<br />
Chicago: TSP deployed at 22 intersections and more efficient runcutting, PACE realized savings <strong>of</strong> 1 bus while maintaining the<br />
same frequency <strong>of</strong> service on a weekday.<br />
Exhibit 2-21: Demonstrated Benefits for Service Planning and Bus Operations Management Systems<br />
ITS Option Benefits Measure Case <strong>of</strong> Demonstrated Benefits<br />
Computer Aided Dis-patch (CAD) Operating Cost Efficiency Ann Arbor, michigan: AATA estimates that its computer-assisted transfer management (CATM) s<strong>of</strong>tware (also known as<br />
transfer con-nection protection) accounts for majority <strong>of</strong> estimated 70% reduction in voice traffic on its radio system.<br />
Columbus, ohio – CAD/AVL system reduced dispatchers “busy” time by 10%, allowed more time to devote to critical tasks<br />
and provide better assistance to drivers.<br />
Automatic Vehicle Lo-cation (AVL) Operating Cost Efficiency prince William County, Virginia: PRTC estimated annual savings <strong>of</strong> $869,148 because <strong>of</strong> AVL system.<br />
portland, oregon: Tri-Met’s AVL/CAD system produced estimated annual operating cost savings <strong>of</strong> $1.9 million, based on<br />
analysis <strong>of</strong> 8 routes typical <strong>of</strong> Tri-Met service.<br />
Automated Scheduling Operating Cost Efficiency Columbus, ohio: Study in 2001 showed automated CAD/AVL system resulted in 10%-15% dispatcher time savings.<br />
Automated Passenger Counters<br />
(APC)<br />
Vehicle Component Monitoring<br />
System<br />
Operating Cost Efficiency london, ontario: London <strong>Transit</strong> saves $50,000 over manual methods per system-wide count.<br />
Atlanta: MARTA reduced the number <strong>of</strong> traffic checker positions from 19 to 9.<br />
Capital Cost Effectiveness Washington, d.C.: WMATA’s system reduced road calls. Metrobus VCM system identified new CNG buses with faulty oxygen<br />
sensors; bus manufacturer agreed to replace.
Exhibit 2-22: Demonstrated Benefits for Passenger Information Systems<br />
ITS Option Benefit Measure Case <strong>of</strong> Demonstrated Benefits<br />
Major Elements <strong>of</strong> BRT<br />
Pre-Trip Passenger Information Washington, d.C.: WMATA’s RideGuide helped Metro avoid hiring 5-10 new customer service staff every year to keep up with<br />
increased calls.<br />
En-route passenger information N/A<br />
Station/Terminal Passenger<br />
Information<br />
In-Vehicle Passenger Information Higher Ridership N/A<br />
Washington, d.C.: WMATA deployed Passenger Information Display System (PIDS) in 2001at all Metrorail stations with over<br />
400 signs. Survey indicated 93% <strong>of</strong> respondents aware <strong>of</strong> PIDS; among frequent Metrorail riders, 99% were aware <strong>of</strong> and 98%<br />
had used PIDS. Survey respondents were fairly satisfied with PIDS, only 11% not satisfied.<br />
Exhibit 2-23: Demonstrated Benefits for Safety and Security Systems<br />
ITS Option Benefit Measure Case <strong>of</strong> Demonstrated Benefits<br />
On-Board Silent Alarms N/A<br />
On-Board Voice Monitoring N/A<br />
On-Board Video Monitoring Operating Cost Efficiency philadelphia: SEPTA and other transit systems indicate that total dollar amount <strong>of</strong> claims can be reduced by 10% - 20% with<br />
video cameras and recorders on-board transit vehicles.<br />
Washington, d.C. - Surveillance cameras deployed onboard Metrobuses proved effective in three incidents-- In one, on-board<br />
camera captured image <strong>of</strong> a suspected murderer, allowing Metro police to produce a photo <strong>of</strong> suspect’s face. In another, onboard<br />
camera helped WMATA prevail in legal case where a rider sued WMATA, claiming driver reckless driving caused head<br />
injuries.<br />
Demonstrated benefits figures were not found for intelligent vehicle systems: collision warning, rear-impact warning, precision docking, or lane keeping assistance<br />
systems.<br />
2-119
Major Elements <strong>of</strong> BRT<br />
sErVICE anD oPEratIng Plans<br />
Description<br />
role <strong>of</strong> the service and operating Plan in Brt<br />
The design <strong>of</strong> the service and operations plan for BRT service affects how a passenger<br />
finds value in and perceives the service. BRT service should be frequent,<br />
direct, easy-to-understand, comfortable, reliable, operationally efficient, and,<br />
above all, rapid. The flexibility <strong>of</strong> BRT elements and systems leads to significant<br />
flexibility in designing a service plan to respond to the customer base it will serve<br />
and the physical and environmental surroundings in which it will operate.<br />
This section details basic service and operational planning considerations related<br />
to the provision <strong>of</strong> BRT service. Each <strong>of</strong> the operational items discussed<br />
varies when applied in different corridors, different cities, and different regions,<br />
depending on a host <strong>of</strong> factors such as available capital and operating budget,<br />
customer demand, available rights-<strong>of</strong>-way, potential route configuration, and<br />
political environment.<br />
Characteristics <strong>of</strong> the service and operating Plan<br />
Route Length—Route<br />
length affects what locations a customer can<br />
directly reach without transferring and determines the resources required<br />
for serving the route. Longer routes, while minimizing the need for transfers,<br />
require more capital and labor resources and encounter much more<br />
variability in operations. Short routes may require passengers to transfer to<br />
reach locations not served by the route but can generally provide higher<br />
travel time reliability. BRT service need not operate on dedicated facilities<br />
for 100 percent <strong>of</strong> their length.<br />
Route Structure—An<br />
important advantage <strong>of</strong> BRT running ways and<br />
stations is that they can accommodate different vehicles serving different<br />
routes. This flexibility allows for the incorporation <strong>of</strong> different types <strong>of</strong><br />
routes and route structures with the same physical investment. Service designers<br />
<strong>of</strong> BRT systems are thus able to create tailored services and provide<br />
point-to-point service or “one-seat rides” to customers thereby reducing<br />
overall travel time by limiting the number <strong>of</strong> transfers. Offering point-topoint<br />
service with limited transferring will assist with attracting riders to the<br />
BRT system. Increasing the number <strong>of</strong> choices has trade-<strong>of</strong>fs with simplicity<br />
and clarity <strong>of</strong> the route structure.<br />
2-120<br />
Service Span—The<br />
service span represents the period <strong>of</strong> time that a<br />
service is available for use. Generally, rapid transit service is provided most<br />
<strong>of</strong> the day with high frequencies through the peak hours that allow passengers<br />
to arrive randomly without significant waits. Service frequencies<br />
are reduced in <strong>of</strong>f-peak hours such as mid-day and evening. Service spans<br />
affect the segment <strong>of</strong> the market that a transit service can attract. Long<br />
service spans allow patrons with varied schedules and many different types<br />
<strong>of</strong> travel patterns to rely on a particular service. Short service spans limit the<br />
market <strong>of</strong> potential passengers. For example, peak-only service spans limit<br />
the potential passengers served to commuters with daytime work schedules.<br />
Where local and BRT services serve the same corridor, the service span<br />
<strong>of</strong> both local and BRT service may be considered together since passengers<br />
may have an option between the two services. Exhibit 2-24 describes different<br />
BRT service types and typical spans by running way type.<br />
Exhibit 2-24: BRT Service Types and Typical Spans<br />
Principal running Way service Pattern<br />
service<br />
Weekdays saturday sunday<br />
arterial streets all stop all Day all Day all Day<br />
Mixed Traffic<br />
Bus lanes<br />
Median Busways<br />
(no Passing)<br />
freeways<br />
Mixed Traffic<br />
Bus/HoV lanes<br />
Connecting<br />
Bus Routes<br />
Non Stop with<br />
Local Distributor<br />
Commuter<br />
Express<br />
All Day All Day All Day<br />
All Day All Day<br />
Peak Period<br />
Busways all stop all Day all Day all Day<br />
Express Day Time or<br />
Peak Period<br />
Feeder Service<br />
Connecting<br />
Bus Routes<br />
Day Time<br />
All Day or<br />
Non-Peak<br />
Period<br />
Day time or<br />
All Day<br />
Day Time<br />
All Day All Day All Day<br />
*All Day - typically 18 to 24 hours; Daytime - typically 7 a.m. to 7 p.m.; Rush Hours - typically from 6:30<br />
to 9 a.m. and 4 to 6 p.m.; 1 feeder bus service in Off Peak and express service in Peak; see “Bus Rapid<br />
<strong>Transit</strong> - Implementation Guidelines,” TCRP Report 90.
Service Frequency—Service<br />
frequency determines how long passengers<br />
must wait for service. Tailoring service frequency to the market served<br />
is one <strong>of</strong> the most important elements in planning and operating a BRT<br />
system.<br />
Station Spacing—BRT<br />
system operating speeds are greatly influenced by<br />
a number <strong>of</strong> operational planning issues, including the distance or spacing<br />
between stops. The spacing <strong>of</strong> stops has a measurable impact on the BRT<br />
system’s operating speed and customer total travel time. Long station spacing<br />
increases operating speeds.<br />
Methods <strong>of</strong> Schedule Control—BRT<br />
schedules can be maintained and<br />
monitored either to meet specified schedules or to regulate headways.<br />
service and operations Planning options<br />
route length options<br />
Route lengths vary according to the specific service requirements and development<br />
characteristics <strong>of</strong> a corridor. Route lengths <strong>of</strong> less than 2 hours <strong>of</strong> total<br />
round trip travel time tend to improve schedule adherence and overall system<br />
reliability. This generally translates into route lengths a maximum <strong>of</strong> 20 miles.<br />
Keeping total round trip travel time to a minimum is desirable to avoid passengers<br />
relying on a printed schedule to use BRT services.<br />
route structure options<br />
There are three types <strong>of</strong> BRT route structure options for consideration. With<br />
each type, higher levels <strong>of</strong> overlap with the existing transit network may bring<br />
increasing opportunity to reallocate service and achieve resource savings.<br />
Simple route structures with just one or two route patterns are easy for new<br />
passengers to understand and, therefore, straightforward to navigate. To attract<br />
customers, they must be able to easily understand the service being <strong>of</strong>fered. Service<br />
directness and linearity in routing are keys to providing customers with a<br />
clear understanding <strong>of</strong> BRT service. However, providing additional options, such<br />
as through a comprehensive route network with branching routes, gives passengers<br />
more choices, especially those passengers who might otherwise transfer.<br />
Clarity and choice are two principles that should be balanced when determining<br />
the route structure.<br />
Major Elements <strong>of</strong> BRT<br />
Different route structures also pose different opportunities for restructuring<br />
other transit services. Simple route structures may allow for connecting transit<br />
services to be focused on a few stations. Development <strong>of</strong> branching networks<br />
may allow for existing services to be restructured and resources to be reallocated<br />
from routes now served by BRT services to other routes.<br />
2-121
Major Elements <strong>of</strong> BRT<br />
route structure options<br />
Single Route<br />
This is the simplest BRT service pattern and <strong>of</strong>fers the advantage<br />
<strong>of</strong> being easiest to understand since only one type <strong>of</strong><br />
service is available at any given BRT station. This route structure<br />
works best in corridors with many activity centers that<br />
would attract and generate passengers at stations all along the<br />
route.<br />
Overlapping Route with Skip Stop or<br />
Express Variations<br />
This is a hybrid approach that combines simple routes with<br />
some variation in service pattern. The overlapping route with<br />
skip stop or express variations provides various transit services<br />
including the base BRT service.<br />
Integrated or Network System (with Locals,<br />
Expresses, and Combined Line-Haul /<br />
Feeders)<br />
The network system route structure provides the most comprehensive<br />
array <strong>of</strong> transit services in addition to base all-stops,<br />
local and BRT service. This type <strong>of</strong> route structure provides the<br />
most options to passengers for a one-seat ride but can result<br />
in passenger confusion and vehicle congestion when pulling<br />
into and out <strong>of</strong> stations.<br />
2-122<br />
AC <strong>Transit</strong>—San Pablo, CA<br />
TEOR—Rouen, France<br />
MBTA—Boston, Mass.<br />
ReAsons to Implement<br />
• Simple route structure helps customers<br />
understand service and best<br />
serves patterns <strong>of</strong> demand.<br />
• To facilitate equal loadings on successive<br />
buses during peak (and <strong>of</strong>f-peak)<br />
hours.<br />
• Retains some key advantages <strong>of</strong> simple<br />
routes while introducing alternate<br />
service patterns that can better serve<br />
certain origin-destination pairs.<br />
• Helpful to serve several markets<br />
• Provides maximum choice <strong>of</strong> different<br />
types <strong>of</strong> service with a fixed<br />
infrastructure investment.<br />
ConsIdeRAtIons/<br />
RequIRements<br />
• Requires dedication <strong>of</strong> a fleet to serve the<br />
entire route, even when demand is low on<br />
certain segments.<br />
• Works best with passing capability at<br />
stations.<br />
• May introduce some confusion for infrequent<br />
riders and may cause congestion at<br />
stations.<br />
• Creates variability <strong>of</strong> loads on successive<br />
vehicles.<br />
• Requires infrastructure treatments (e.g.,<br />
passing capability at stations and dedicated<br />
lanes to prevent congestion.<br />
• Requires strong marketing and passenger<br />
information campaigns to direct passengers<br />
to the appropriate service.
span <strong>of</strong> service options<br />
There are two service span options for BRT service.<br />
span <strong>of</strong> service options<br />
All Day<br />
All-day BRT service is usually provided from the start <strong>of</strong> service in the morning to the end <strong>of</strong><br />
service in the evening. This type <strong>of</strong> service usually maintains a minimum level <strong>of</strong> service (frequency)<br />
headways throughout the entire span <strong>of</strong> service, even in the <strong>of</strong>f-peak periods. Expanding<br />
service to weekend periods can reinforce the idea that BRT service is an integral part <strong>of</strong> the<br />
transit network.<br />
For network BRT systems, service during <strong>of</strong>f-peak periods can revert to only the trunk link service<br />
to better match demand.<br />
Peak-Period-Only<br />
This type <strong>of</strong> BRT span <strong>of</strong> service option provides peak-period service, <strong>of</strong>fering high-quality and<br />
high-capacity-BRT-service-only when it is needed during peak hours. At other times, the base<br />
level <strong>of</strong> service may be provided by local bus routes.<br />
frequency <strong>of</strong> service options<br />
The frequency <strong>of</strong> service affects the service regularity and the ability <strong>of</strong> passengers<br />
to rely upon the BRT service. High frequencies (e.g., headways <strong>of</strong> 10 minutes<br />
or less) create the impression <strong>of</strong> dependable service with minimal waits, encouraging<br />
passengers to arrive randomly without having to refer to a schedule.<br />
station spacing options<br />
BRT stations are typically spaced farther apart than stops for local service. Spacing<br />
stations farther apart concentrates passengers at stations, limiting delays to<br />
fewer locations along a route. Longer stretches between stations allow vehicles<br />
to sustain higher speeds between stations. These factors lead to overall higher<br />
travel speeds. These higher speeds help to compensate for the increased amount<br />
<strong>of</strong> time required to walk, take transit, or drive to stations.<br />
ReAsons to Implement<br />
• Conveys to passengers that service is<br />
available and reliable.<br />
• Often implemented in arterial corridors<br />
where there is established local<br />
service and where BRT service provides<br />
a faster, more reliable choice.<br />
• Implemented in corridors with heavy<br />
commute-travel orientation.<br />
Major Elements <strong>of</strong> BRT<br />
ConsIdeRAtIons/<br />
RequIRements<br />
• Requires provision <strong>of</strong> service at times<br />
when demand is especially low.<br />
• Often requires some background service<br />
(e.g., local bus service) to ensure some<br />
level <strong>of</strong> service throughout the day.<br />
• Requires strong campaign to disseminate<br />
schedule information.<br />
Methods <strong>of</strong> schedule Control<br />
On-time performance is monitored either to meet specified schedules or to regulate<br />
headways. The two methods are described below.<br />
2-123
Major Elements <strong>of</strong> BRT<br />
Methods <strong>of</strong> schedule Control<br />
Schedule-Based Control<br />
Schedule-based control regulates the operation <strong>of</strong> vehicles to meet specified schedules. Operating<br />
policies dictate that operators must arrive within a certain scheduled time at specific<br />
locations along the route. Dispatchers monitor vehicle locations for schedule adherence.<br />
Schedule-based control facilitates connections with other services when schedules are coordinated<br />
to match. Schedule-based control is also used to communicate to passengers that<br />
schedules fall at certain regular intervals.<br />
Headway-Based Control<br />
Often used on very high frequency systems, headway-based control focuses on maintaining<br />
headways rather than meeting specific schedules. Operators may be encouraged to travel<br />
routes with maximum speed and may have no specified time <strong>of</strong> arrival at the end <strong>of</strong> the route.<br />
Dispatchers monitor vehicle locations and issue directions to speed up or slow down to regulate<br />
headways and capacity, minimizing wait times and vehicle bunching.<br />
Effects <strong>of</strong> service and operations Plan Elements on<br />
System Performance and System Benefits<br />
Exhibit 2-25 summarizes the links between the Service and Operations Plans, policies,<br />
practices, and technologies and the BRT system performance indicators and<br />
system benefits identified in Chapter 1. These links are explored in-depth in Chapters<br />
3 and 4.<br />
2-124<br />
ReAsons to Implement<br />
• For services with longer headways,<br />
schedules may be appropriate so<br />
passengers can time their arrival at<br />
stations.<br />
• Well-suited to corridors with exclusive<br />
transitways that can maintain<br />
reliable times such as those with<br />
exclusive transitways or minimal<br />
congestion.<br />
• Appropriate for high frequency services<br />
to promote faster speeds and<br />
reduce waiting times.<br />
ConsIdeRAtIons/<br />
RequIRements<br />
• Requires active operations management<br />
to ensure “on-time” performance.<br />
• Requires a combination <strong>of</strong> active supervision,<br />
automated vehicle location (AVL)<br />
technology, and/or transit signal priority<br />
(TSP) to maintain regular headways.
Exhibit 2-25: Summary <strong>of</strong> Effects <strong>of</strong> Service and Operations Plan Elements on System Performance<br />
Route Length Longer routes may decrease<br />
the need for transfers.<br />
Route Structure and Type Integrated route struc-<br />
• Single Route<br />
• Overlapping Route with<br />
Skip Stop or Express<br />
Variations<br />
• Integrated or Network<br />
System<br />
System Performance<br />
Major Elements <strong>of</strong> BRT<br />
Travel Time Savings Reliability Identity and Image Safety and Security Capacity Accessibility<br />
tures reduce the need for<br />
transfers.<br />
Express and Skip-Stop<br />
routes have shorter travel<br />
times than local service<br />
and can reduce systemwide<br />
travel times by spreading<br />
passenger loads and<br />
reducing station dwell<br />
times on local routes.<br />
Shorter route lengths may<br />
promote greater control <strong>of</strong><br />
reliability.<br />
Express and Skip-Stop routes<br />
can prevent bus bunching and<br />
reduce variability between peak<br />
and non-peak hour operations.<br />
They can cause congestion<br />
at stations if stations are not<br />
designed to accommodate<br />
multiple vehicles.<br />
Span <strong>of</strong> Service Wide spans <strong>of</strong> service suggest<br />
• Peak Hour Only<br />
• All Day<br />
the service is dependable.<br />
Frequency <strong>of</strong> Service More frequent services<br />
reduce waiting time.<br />
Station Spacing<br />
Narrow<br />
Wide<br />
Method <strong>of</strong> Schedule Control<br />
Schedule-Based<br />
Headway-Based<br />
Less frequent station<br />
spacing has a major impact<br />
on travel time by increasing<br />
overall system speeds.<br />
Headway-based control for<br />
high frequency operations<br />
maximize speeds.<br />
High frequencies limit the<br />
impact <strong>of</strong> service interruptions.<br />
Frequent service may<br />
experience bus bunching<br />
problems.<br />
Less frequent station spacing<br />
limits variation in dwell time.<br />
Headway-based control may<br />
result in variability between<br />
peak and non-peak hours, while<br />
schedule-based control can<br />
make service seem unreliable<br />
if schedules cannot be<br />
maintained during peak hours.<br />
Distinctions between<br />
BRT and other service<br />
may better define brand<br />
identity.<br />
Creating a strong image<br />
is important to avoid<br />
confusion for riders in<br />
differentiating these<br />
services. Integrated route<br />
structures may widen<br />
exposure to the brand.<br />
Peak-hour only service may<br />
require strong education<br />
efforts to make riders<br />
aware <strong>of</strong> service availability<br />
and schedule.<br />
Frequent service can make<br />
BRT appear more like<br />
some rail systems. It also<br />
makes BRT easier to use,<br />
which enhances its image<br />
as a premium service.<br />
Less frequent stops-andstarts<br />
make for a smoother<br />
ride, which enhances the<br />
passenger experience.<br />
Peak-only service may<br />
require less security<br />
at stations since<br />
passengers at stations<br />
will not be isolated.<br />
High frequencies<br />
increase potential<br />
conflicts with<br />
other vehicles and<br />
pedestrians. High<br />
frequencies reduce<br />
security vulnerability<br />
at stations.<br />
Multiple services can<br />
increase operational<br />
capacity.<br />
Increased frequency<br />
is a key determinant<br />
<strong>of</strong> operating capacity.<br />
Service frequency<br />
is limited by system<br />
capacity (vehicle,<br />
station and running<br />
way capacities).<br />
Integrated<br />
or network<br />
systems may<br />
reduce the<br />
number <strong>of</strong><br />
required<br />
transfers.<br />
2-125
Major Elements <strong>of</strong> BRT<br />
2-126<br />
Exhibit 2-26: Summary <strong>of</strong> Effects <strong>of</strong> Service and Operations Plan Elements on System Benefits<br />
Route Length Service plans that are customerresponsive<br />
attract ridership and<br />
maximize system benefit<br />
Route Structure and Type Overlapping routes may cause<br />
• Single Route<br />
• Overlapping Route with Skip<br />
Stop or Express Variations<br />
• Integrated or Network<br />
System<br />
Span <strong>of</strong> Service<br />
• Peak-Hour-Only<br />
• All-Day<br />
Higher Ridership Capital Cost Effectiveness<br />
confusion for infrequent riders,<br />
which could inhibit ridership.<br />
An integrated or network system<br />
can <strong>of</strong>fer more one-seat rides<br />
which may attract more riders.<br />
Frequency <strong>of</strong> Service High frequencies create the<br />
impression <strong>of</strong> dependable service<br />
with minimal waits, which may<br />
attract riders.<br />
System Performance<br />
Operating Cost<br />
Efficiency<br />
Principles appropriate<br />
to the design and<br />
scheduling <strong>of</strong> costefficient<br />
BRT service<br />
primarily the same as<br />
for conventional bus<br />
services. Planners need<br />
to design service that<br />
is appropriate to the<br />
level <strong>of</strong> travel demand<br />
and minimizes nonproductive<br />
vehicle<br />
hours.<br />
<strong>Transit</strong>-Supportive<br />
Land Development<br />
The flexible nature <strong>of</strong> BRT<br />
service plans allows BRT<br />
to expand or contract<br />
with changes in land use<br />
quickly and easily. If the<br />
BRT is designed to provide<br />
fast and convenient<br />
connections among key<br />
activity hubs in an urban<br />
or suburban area, this may<br />
help attract developer<br />
interest.<br />
Environmental Quality<br />
An overlapping route<br />
may reduce emissions by<br />
increasing the overall service<br />
efficiencies.<br />
Higher frequencies can<br />
increase vehicle noise<br />
pollution created by the<br />
system operations. High<br />
frequency service that is<br />
not commensurate with<br />
ridership levels may result<br />
in higher per-passenger<br />
emissions.<br />
Station Spacing Few stops mean traveling at<br />
• Narrow<br />
• Wide<br />
higher speeds and reduced<br />
stoppage time, which lowers<br />
emissions.<br />
Method <strong>of</strong> Schedule Control Headway based schedules<br />
• Schedule-Based<br />
• Headway-Based<br />
can reduce idling and lower<br />
overall emissions.
Experience with Brt service Plans<br />
Exhibit 2-27 shows BRT service plans in 45 cities around the world. Most U.S.<br />
BRT systems feature a single BRT corridor replacing an existing local route or<br />
overlaid onto the same route, with fewer stops. One notable exception is the Los<br />
Angeles Metro Rapid, which consists <strong>of</strong> an extensive network <strong>of</strong> rapid bus lines<br />
overlaid onto local routes. The Latin American BRTs lie at the opposite end <strong>of</strong> the<br />
spectrum from the U.S., with extensive trunk and feeder networks replacing the<br />
local bus routes. Other regions demonstrate a variety <strong>of</strong> approaches.<br />
Station spacing varies widely, although most are between 0.4 and 1 mile. There<br />
are some U.S. BRTs with station spacing under 0.4 miles, which is essentially<br />
comparable to local bus service spacing. A few systems that operate on HOV or<br />
highway lanes or as commuter services have very high station spacing <strong>of</strong> 3 to 4<br />
miles.<br />
Frequencies correlate with the running way investments, as it is possible to<br />
achieve much higher frequencies with grade-separated transitways. Typically,<br />
the BRT systems on arterials operate with headways between 9 and 15 minutes,<br />
with a few such as Boston and Los Angeles operating shorter headways in some<br />
corridors. By contrast, the dedicated running way frequencies are more likely to<br />
be 1 to 8 minutes.<br />
Most <strong>of</strong> the BRT systems provide all-day service, with just a few operating as<br />
peak-only services. The majority are all-stop services. The cities that have built<br />
segregated busway networks, such as Ottawa, Adelaide, Brisbane, Bogotá, Guyaguil<br />
and Pereira, are able to <strong>of</strong>fer multiple service options including limited stop<br />
and express service.<br />
Major Elements <strong>of</strong> BRT<br />
2-127
Major Elements <strong>of</strong> BRT<br />
2-128<br />
Exhibit 2-27: Experience with BRT Service Plans<br />
Albuquerque Boston Silver Line Chicago Cleveland Eugene Honolulu<br />
Rapid Ride Washington St Waterfront Airport Express HealthLine EmX City Express<br />
Route Structure Overlapping route Replaced Local Route New service<br />
Overlay onto Local<br />
Route<br />
Replaced Local<br />
Route<br />
Replaced Local<br />
Route<br />
Overlay onto<br />
Local Route<br />
Route Type Limited-Stop All Stop All-stop Limited All-stop All-stop Limited Stop<br />
Span <strong>of</strong> Service All Day All Day All Day All Day all day all day All Day<br />
Frequency <strong>of</strong> Service in Peak Hours<br />
(Headway in Minutes)<br />
Frequency <strong>of</strong> Service Off-Peak<br />
(Head-way in Minutes)<br />
11 4 10 5 10 15<br />
11 15 9 to 12 15 30 20 - 30<br />
Avg. Station Spacing Distance 0.87 0.22 4.45 0.47 to 0.56 0.42 0.44 0.26 - .55
Route Structure Overlaps local route<br />
Exhibit 2-27: Experience with BRT Service Plans (cont’d.)<br />
Major Elements <strong>of</strong> BRT<br />
Honolulu Kansas City Las Vegas Los Angeles Miami Oakland Orlando<br />
County Express Main Street MAX<br />
Replaced existing<br />
route?<br />
North Las Vegas<br />
MAX<br />
Overlay onto Local<br />
Route<br />
Metro Rapid<br />
(All routes)<br />
Overlaid on local<br />
routes<br />
Route Type Express Limited Stop Limited Stop Limited<br />
South Dade<br />
Busway<br />
Integrated Network<br />
<strong>of</strong> Routes<br />
Limited and<br />
All-Stop<br />
Rapid San Pablo<br />
Corridor<br />
Overlay onto<br />
Local Route<br />
LYMMO<br />
Replaced Local<br />
Downtown<br />
Circulator<br />
All Stop All Stop<br />
Span <strong>of</strong> Service All Day All day All Day All Day All Day All Day All Day<br />
Frequency <strong>of</strong> Service in Peak Hours<br />
(Headway in Minutes)<br />
Frequency <strong>of</strong> Service Off-Peak<br />
(Head-way in Minutes)<br />
30 9 12 2-10 10 12 5<br />
30 30 15-20<br />
Avg. Station Spacing Distance 0.96 0.29 0.84 0.75 0.57 0.56 About 900 feet<br />
2-129
Major Elements <strong>of</strong> BRT<br />
Route Structure Express Routes<br />
2-130<br />
Exhibit 2-27: Experience with BRT Service Plans (cont’d.)<br />
Phoenix Pittsburgh Sacramento San Jose Santa Monica Halifax<br />
RAPID East Busway South Busway<br />
West<br />
Busway<br />
EBus Rapid 522 Lincoln Rapid Metro<strong>Link</strong><br />
Replaced limited<br />
service route<br />
Overlaps local<br />
route. Headway<br />
based.<br />
Overlaps Local<br />
Route<br />
Route Type Express All-Stop All-Stop All-Stop Limited Limited<br />
Span <strong>of</strong> Service<br />
Frequency <strong>of</strong> Service in Peak Hours<br />
(Headway in Minutes)<br />
Frequency <strong>of</strong> Service Off-Peak<br />
(Head-way in Minutes)<br />
Weekday Peak Hour<br />
only<br />
All Day All Day All Day All-day All Day Mon-Sat Peak-Hour Only<br />
Overlaps route<br />
Express - Stop only<br />
at major transit<br />
centers<br />
2 routes all-day<br />
weekdays, 1 route<br />
peak-hour only<br />
10 0.58 1.33 15 min 15 10<br />
20 min 15 30<br />
Avg. Station Spacing Distance 0.25? 1.14 0.54 0.83 0.5 mile 0.85 0.82 3.11
Route Structure<br />
Route Type<br />
Exhibit 2-27: Experience with BRT Service Plans (cont’d.)<br />
Major Elements <strong>of</strong> BRT<br />
Ottawa York Bogotá Guayaquil Pereira Amsterdam Caen<br />
<strong>Transit</strong>way VIVA Transmilenio Metrovia Megabus Zuidtangent Tram on Wheels<br />
Carries 6 BRT routes and<br />
many local routes<br />
BRT routes are all-stop.<br />
Local routes operate as<br />
all-stop, express, and<br />
trunk-feeder<br />
Span <strong>of</strong> Service Some routes all day<br />
Frequency <strong>of</strong> Service in Peak Hours<br />
(Headway in Minutes)<br />
Frequency <strong>of</strong> Service Off-Peak<br />
(Head-way in Minutes)<br />
Avg. Station Spacing Distance 0.60 - 1.30<br />
BRT network<br />
overlaid on<br />
existing local<br />
routes<br />
Limited-stop<br />
18 hours per<br />
day<br />
Replaced<br />
existing privatelyoperated<br />
routes<br />
Trunk-Feeder<br />
(all-stop, express<br />
along trunk)<br />
Replaced<br />
existing<br />
privatelyoperated<br />
routes<br />
Trunk-Feeder<br />
(all-stop along<br />
trunk)<br />
Replaced existing<br />
privately-operated<br />
routes<br />
Trunk-Feeder (allstop,<br />
limited, and<br />
express along trunk)<br />
New city orbital<br />
BRT link with<br />
intermodal links<br />
Two routes overlapping in<br />
core area providing high<br />
frequency in downtown and<br />
Y pattern coverage north/<br />
south <strong>of</strong> downtown<br />
Limited Express All-Stop<br />
All day All day All Day All Day<br />
2-20 3-15 1 - 3 4 - 6 3 - 5 7.5 - 8 3-6 (where routes overlap)<br />
4-30 15 10 10 10 10-15<br />
0.7-1.0 (varies<br />
by route)<br />
0.80 0.56 0.9-1.2 0.2-0.25<br />
2-131
Major Elements <strong>of</strong> BRT<br />
Route Structure<br />
2-132<br />
Exhibit 2-27: Experience with BRT Service Plans (cont’d.)<br />
Edinburgh Eindhoven Leeds London Rouen Utrecht Adelaide<br />
Fastlink<br />
Single radial route<br />
linking periphery to<br />
downtown<br />
Phileas - Western<br />
Corridor<br />
Two radial routes<br />
overlapping in central<br />
area, linking downtown<br />
with periphery and<br />
airport<br />
Superbus Crawley TEOR Busway<br />
Two radial routes<br />
linking periphery<br />
to downtown<br />
2 north-south<br />
overlapping routes.<br />
<strong>Link</strong>s downtown to<br />
employment areas to<br />
north (Gatwick) and<br />
south<br />
Three radial routes<br />
overlapping in<br />
central area, linking<br />
downtown with<br />
hospital, universities and<br />
peripheral areas<br />
Three radial<br />
routes linking<br />
downtown to<br />
periphery<br />
Route Type All-Stop All-Stop Trunk-Feeder All-Stop All-Stop All-Stop<br />
Span <strong>of</strong> Service All Day All Day All Day All Day All Day All Day<br />
Frequency <strong>of</strong> Service in Peak Hours<br />
(Headway in Minutes)<br />
Frequency <strong>of</strong> Service Off-Peak<br />
(Head-way in Minutes)<br />
North East<br />
Busway<br />
Replaced Local<br />
Routes<br />
All stop Express/<br />
Semi Express<br />
Mix Peak Only and<br />
All Day<br />
3 8 2-8 10 3 2-4 1.1<br />
10 10 2-8 10-20 4 3-7.5 4<br />
Avg. Station Spacing Distance 0.2-0.25 0.34 0.25 0.33 0.9-1.2 3.10
Route Structure<br />
Route Type<br />
South East<br />
Busway<br />
Overlaid on<br />
existing local<br />
routes<br />
All Stop and<br />
Express, with<br />
some express<br />
service to CBD<br />
with no stops.<br />
Span <strong>of</strong> Service Mainly All Day<br />
Frequency <strong>of</strong> Service in Peak Hours<br />
(Headway in Minutes)<br />
Frequency <strong>of</strong> Service Off-Peak<br />
(Head-way in Minutes)<br />
16 sec headway at<br />
Buranda Station<br />
Exhibit 2-27: Experience with BRT Service Plans (cont’d.)<br />
Major Elements <strong>of</strong> BRT<br />
Brisbane Sydney T-Ways Beijing Hangzhou Kunmimg<br />
Inner Northern<br />
Busway<br />
Replaced Local<br />
Routes<br />
Liverpool-<br />
Parramatta<br />
Overlaid on<br />
existing local<br />
routes<br />
North-West<br />
Blacktown-Parklea<br />
Overlaid on existing<br />
local routes<br />
North-West<br />
Parramatta-Rouse Hill<br />
Overlaid on existing<br />
local routes<br />
Line 1 Line B1<br />
Replacing<br />
existing<br />
routes in<br />
busiest<br />
corridors<br />
Replacing<br />
existing routes<br />
in busiest<br />
corridors<br />
Busway<br />
Network<br />
Center-lane<br />
BRT network<br />
for existing<br />
routes in<br />
busiest<br />
corridors<br />
All Stop All Stop All Stop All Stop All-Stop All-Stop All-Stop<br />
Mix Peak Only<br />
and All Day<br />
All Day All Day Most All Day All Day All Day All Day<br />
4.6 10.0 8.6 4.0 3 - 4 minutes<br />
2 5 15 11.6 5<br />
Avg. Station Spacing Distance 1.00 0.41 0.54 0.42 0.50 0.41<br />
2-133
Major Elements <strong>of</strong> BRT<br />
BranDIng ElEMEnts<br />
Description<br />
role <strong>of</strong> Branding Elements in Brt<br />
Branding involves a wide range <strong>of</strong> strategies and tactics to package a set <strong>of</strong> product<br />
characteristics and service attributes and to build and reinforce a brand that<br />
communicates the distinct characteristics <strong>of</strong> a product—in this case, a BRT system.<br />
A successful BRT brand can communicate the value <strong>of</strong> a BRT system in both<br />
quantifiable service attributes and performance. Successful brands also can reinforce<br />
impressions <strong>of</strong> BRT as a “premium” service, thereby attracting ridership.<br />
<strong>Transit</strong> agencies typically develop their branding for BRT systems within the context<br />
<strong>of</strong> a larger branding initiative and communications plan. This section details<br />
just some <strong>of</strong> the basic choices available for transit agencies when considering<br />
their larger branding strategies. A discussion <strong>of</strong> the impact <strong>of</strong> packaging these<br />
branding elements with service characteristics is located in the section on Image<br />
and Identity—Brand Identity in Chapter 3.<br />
Characteristics <strong>of</strong> Branding Elements<br />
For BRT system branding, there are at least two major characteristics or elements<br />
<strong>of</strong> branding which transit agencies can consider when developing a BRT<br />
system—the market classification <strong>of</strong> BRT and branding devices:<br />
Marketing Classification <strong>of</strong> BRT Service—The<br />
marketing classification<br />
<strong>of</strong> BRT describes how BRT fits within the rest <strong>of</strong> a transit system. This<br />
classification reflects both functional differences in service attributes and<br />
differences in how the services or systems are marketed.<br />
Branding Devices—Branding<br />
devices or brand identifiers are attributes,<br />
usually visual, that customers can associate with a product. In the case <strong>of</strong><br />
BRT, the most common branding devices are use <strong>of</strong> separate brand names,<br />
logos, and colors or color palettes.<br />
Marketing Classification <strong>of</strong> BRT<br />
There are at least three marketing classifications for BRT (or ways to characterize<br />
BRT services with respect to the rest <strong>of</strong> an area’s transportation network). The<br />
first two that are discussed—BRT Marketed as a Separate Tier <strong>of</strong> Service and<br />
BRT Marketed as a Rapid <strong>Transit</strong> Route represent active branding strategies. The<br />
2-134<br />
third—BRT Marketed with No Differentiation from Other Routes—represents the<br />
default case <strong>of</strong> doing no special branding.
Marketing Classifications <strong>of</strong> BRT<br />
BRT as a Separate Tier <strong>of</strong> Service<br />
With enough features, BRT can be marketed as a separate tier<br />
<strong>of</strong> service, operated independently <strong>of</strong> local and express bus<br />
routes and rapid transit routes. This <strong>of</strong>ten involves the use <strong>of</strong><br />
a special name for the type <strong>of</strong> service (e.g., “Rapid”), separate<br />
colors or logos, and a separate fleet <strong>of</strong> vehicles.<br />
BRT as a Rapid <strong>Transit</strong> Route<br />
BRT systems with advanced features, especially dedicated<br />
running ways, can be classified and marketed as elements <strong>of</strong><br />
a larger regional rapid transit system. Often, this can take the<br />
form <strong>of</strong> equating BRT systems and lines as equivalent to other<br />
forms <strong>of</strong> rapid transit (light rail, heavy rail, and commuter rail.)<br />
This classification <strong>of</strong> BRT involves the inclusion <strong>of</strong> BRT routes<br />
into regional rapid transit maps and notation and naming <strong>of</strong><br />
BRT lines in a manner similar to other rapid transit service and<br />
distinct from local bus service.<br />
Signage for EmX<br />
Map <strong>of</strong> Rapid <strong>Transit</strong> Routes in<br />
Los Angeles<br />
BRT Marketed with Minimal<br />
Differentiation from Other Routes<br />
In some cases, routes that incorporate BRT elements have minimal or no differentiated branding<br />
or marketing from regular local or express routes. Services in this category are <strong>of</strong>ten noted<br />
as limited or express versions <strong>of</strong> other routes in the system. Often, these routes follow the<br />
same route numbering system and look and are served by similar vehicles as regular routes.<br />
ReAsons to Implement<br />
• To differentiate the service from local<br />
bus service.<br />
• To highlight the integration <strong>of</strong><br />
BRT into the regional rapid transit<br />
network.<br />
• To raise expectations <strong>of</strong> performance<br />
and service delivery for both transit<br />
agency staff and customers, thereby<br />
promoting a higher level <strong>of</strong> customer<br />
service and ridership.<br />
• When BRT features are not significant<br />
enough to warrant a differentiated<br />
branding strategy.<br />
Major Elements <strong>of</strong> BRT<br />
ConsIdeRAtIons/<br />
RequIRements<br />
• Requires integration among transit<br />
agencies to achieve the designed brand<br />
characteristics <strong>of</strong> BRT service<br />
• Requires stations and vehicles that emphasize<br />
the function and attributes <strong>of</strong> the<br />
service and highlight its distinct nature.<br />
At a minimum, a separate shelter type<br />
and vehicle livery are employed.<br />
• Requires fuller integration <strong>of</strong> marketing<br />
materials and branding strategy to emphasize<br />
similarities to rail and other rapid<br />
transit modes.<br />
• Requires no change to marketing and<br />
branding strategies.<br />
2-135
Major Elements <strong>of</strong> BRT<br />
Branding Devices<br />
Branding devices are tools that transit agencies can use to define and reinforce a special brand for BRT. They are primarily visual in<br />
nature, but each plays a role in communicating the characteristics <strong>of</strong> a BRT system and emphasizing the distinct nature <strong>of</strong> BRT.<br />
Branding Devices<br />
Brand Name<br />
A brand name, in the form <strong>of</strong> a word or phrase, can distinguish<br />
BRT systems from other transit services available in a given region.<br />
Brand names <strong>of</strong>ten include the name <strong>of</strong> the agency operating<br />
a particular BRT system. Brand names can be applied<br />
to either the services or routes alone, the infrastructure within<br />
which BRT services operate, or both.<br />
Logos<br />
Distinct colors in logos communicate the distinct<br />
nature <strong>of</strong> a specific transit service, in this case, BRT<br />
service. A logo is a visual image taking the form <strong>of</strong> the<br />
combination <strong>of</strong> an ideogram (icon, sign, or emblem)<br />
or logotype (written form <strong>of</strong> the brand name).<br />
Designated Colors<br />
Designated colors distinct<br />
for BRT service highlight<br />
the distinct nature <strong>of</strong> BRT<br />
service from other services<br />
and provide an important<br />
reference for passengers.<br />
2-136<br />
Color Scheme for LTD’s Emerald Express (EmX)<br />
Other Branding Devices<br />
Other branding devices commonly used for other types <strong>of</strong><br />
products can theoretically be used for BRT, such as slogans or<br />
mottos, mascots, graphic design programs and typefaces, and<br />
sound logos. These, however, are used less systematically and<br />
tend to be less central to BRT system branding efforts.<br />
Rapid (AC <strong>Transit</strong>)<br />
ReAsons to Implement<br />
• Packages all the characteristics <strong>of</strong> a<br />
BRT system into an easily identifiable<br />
name.<br />
Communicates particular character-<br />
• istics <strong>of</strong> a BRT system (e.g., “Rapid”),<br />
the area it serves, or its relationship<br />
to other rapid transit services in a<br />
region.<br />
• To associate the distinctiveness <strong>of</strong><br />
a BRT system visually, making the<br />
system easy to identify and associate<br />
with positive service attributes.<br />
• To add another layer <strong>of</strong> visual distinction<br />
to a BRT system.<br />
• To enable communication <strong>of</strong> service<br />
attributes in a way that transcends<br />
language barriers.<br />
To add another layer <strong>of</strong> visual or<br />
• other cues to distinguish a BRT<br />
system.<br />
ConsIdeRAtIons/<br />
RequIRements<br />
• The selection <strong>of</strong> a brand name must show<br />
some relationship to names <strong>of</strong> other services<br />
within a broader transportation system.<br />
• Brand names <strong>of</strong>ten require cooperation<br />
among several departments and business<br />
functions within an agency to ensure that<br />
the brand conveys a consistent and appropriate<br />
meaning to the general public.<br />
• Logos <strong>of</strong>ten need to have some relationship<br />
to an agency’s overall visual identity.<br />
• Other visual elements <strong>of</strong> a BRT system<br />
(station shelters, overall station design, and<br />
vehicle design and vehicle livery) also need<br />
to relate to and incorporate a BRT system’s<br />
logo and visual communications plan.<br />
• Like logos, the consistent use <strong>of</strong> color to<br />
designate a BRT brand needs to have some<br />
relationship to an agency’s overall visual<br />
identity.<br />
• Other visual elements <strong>of</strong> a BRT system<br />
(station shelters, overall station design, and<br />
vehicle design and vehicle livery) also need<br />
to relate to and incorporate a BRT system’s<br />
logo and visual communications plan.<br />
Like logos and colors, use <strong>of</strong> other branding<br />
• devices needs to have some relationship<br />
to an agency’s overall communications<br />
program.
Effects <strong>of</strong> Branding Elements on system Performance<br />
and System Benefits<br />
Exhibits 2-28 and 2-29 summarize the links between station elements and the<br />
BRT performance indicators and system benefits identified in Chapter 1. These<br />
links are explored further in Chapters 3 and 4.<br />
Exhibit 2-28: Summary <strong>of</strong> Effects <strong>of</strong> Station Elements on System Performance<br />
System Performance<br />
Major Elements <strong>of</strong> BRT<br />
Travel Time Savings Reliability Identity and Image Safety and Security Capacity Accessibility<br />
Marketing Classification Minimal impact Minimal impact Classifying BRT as a<br />
• BRT Marketed with No<br />
Differentiation from Other<br />
Routes<br />
• BRT Marketed as a<br />
Separate Tier <strong>of</strong> Service<br />
• BRT Marketed as a Rapid<br />
<strong>Transit</strong> Route<br />
separate Tier <strong>of</strong> Service or<br />
as a Rapid <strong>Transit</strong> Route<br />
builds and reinforces Brand<br />
Identity<br />
Branding Devices Minimal impact Minimal impact Use <strong>of</strong> branding devices<br />
• Brand Name<br />
• Logo<br />
• Designated Color<br />
• Other Branding Devices<br />
such as brand names,<br />
logos, color schemes<br />
accentuates brand identity<br />
and contributes to<br />
comprehensive contextual<br />
design <strong>of</strong> BRT systems<br />
Minimal impact Minimal impact Minimal impact<br />
Minimal impact Minimal impact Minimal impact<br />
2-137
Major Elements <strong>of</strong> BRT<br />
Marketing Classification By enhancing brand identity,<br />
• BRT Marketed with No<br />
Differentiation from Other<br />
Routes<br />
• BRT Marketed as a Separate<br />
Tier <strong>of</strong> Service<br />
• BRT Marketed as a Rapid<br />
<strong>Transit</strong> Route<br />
2-138<br />
Exhibit 2-29: Summary <strong>of</strong> Effects <strong>of</strong> Station Elements on System Benefits<br />
System Performance<br />
Higher Ridership Capital Cost Effectiveness Operating Cost Efficiency<br />
marketing BRT as either a separate<br />
tier <strong>of</strong> service or as integrated with<br />
a region’s rapid transit system can<br />
highlight higher performance <strong>of</strong><br />
BRT and attract higher ridership.<br />
Branding Devices By enhancing brand identity,<br />
• Brand Name<br />
• Logo<br />
• Designated Color<br />
• Other Branding Devices<br />
different branding devices can<br />
highlight higher performance <strong>of</strong><br />
BRT and attract higher ridership.<br />
<strong>Transit</strong>-Supportive<br />
Land Development<br />
Environmental<br />
Quality<br />
Minimal impact Minimal impact Minimal impact Minimal impact<br />
Minimal impact Minimal impact Minimal impact Minimal impact
Implementation Issues<br />
The flexible and diverse nature <strong>of</strong> BRT presents unique issues and challenges related<br />
to implementation <strong>of</strong> branding elements.<br />
Implementation Issues During Project Development<br />
Brand Strategy<br />
During planning and project development, it is important to implement branding<br />
elements in the context <strong>of</strong> developing a comprehensive brand strategy. As<br />
one initial activity in developing a brand strategy, it is important to discern the<br />
value <strong>of</strong> the brand <strong>of</strong> the existing services that a transit agency already operates.<br />
Developing a BRT system provides an opportunity to articulate a brand for a<br />
unique and distinct system. Because markets are particular to specific regions<br />
and evolve over time, the approach to BRT must be tailored to each specific<br />
situation.<br />
Building a brand strategy follows three key steps:<br />
Market Research and Business Process Review—Research is important<br />
to understand the target audience. This usually involves activities such as surveys,<br />
focus groups, and interviews with both users and non-users <strong>of</strong> transit service.<br />
Consumer research reveals demographic information <strong>of</strong> the market area<br />
and what potential consumers perceive about existing transit service and what<br />
they would value in a new transit service. Research can also involve an exploration<br />
internal to the implementing agency to gauge internal attitudes about provision<br />
<strong>of</strong> service and how business processes affect the end product.<br />
Identification <strong>of</strong> Points <strong>of</strong> Differentiation for BRT—The second step in<br />
developing the brand involves identifying what the point <strong>of</strong> differentiation is<br />
for BRT. This step involves an exploration <strong>of</strong> what features are relevant to the<br />
target audience. These features can be both related to what the product does<br />
(its performance—travel time savings, reliability, safety, security, and effective<br />
design) and the impression it conveys. These points <strong>of</strong> differentiation will help<br />
in the planning for the system and selection <strong>of</strong> elements and ultimately with the<br />
marketing <strong>of</strong> the service.<br />
Implementation <strong>of</strong> the Brand—Implementation <strong>of</strong> the brand involves more<br />
than just implementing brand elements alone. More broadly, it involves at least<br />
three activities:<br />
Major Elements <strong>of</strong> BRT<br />
Implementation <strong>of</strong> a package <strong>of</strong> BRT System Elements—The elements that<br />
most support the brand and its message are key to presenting an attractive<br />
product that potential customers respond to.<br />
Changing internal business processes—Critical to a successful product is an<br />
organization that believes in the product it is presenting to the customer<br />
and delivers the product efficiently and effectively. This <strong>of</strong>ten involves<br />
reorganization <strong>of</strong> internal business structures, processes, relationships, and<br />
delivery approaches.<br />
Implementing branding and communication plan—As the internal business<br />
processes are settled, a branding and communication plan should be<br />
developed and executed.<br />
Implementation Issues During operation<br />
Continued Brand Management<br />
Sustaining the brand <strong>of</strong> a BRT system and its perception as a “premium” transit<br />
product requires constant attention. The steps necessary for successful launch<br />
—market research, review <strong>of</strong> the BRT product and its value, and marketing—are<br />
required to be repeated and refreshed regularly and periodically.<br />
IntEgratIon <strong>of</strong> Brt ElEMEnts Into<br />
Brt systEMs<br />
Introduction<br />
BRT system elements must be packaged in an integrated fashion to best achieve<br />
the goal <strong>of</strong> a fast, reliable, and attractive system. The previous sections have described<br />
the numerous individual BRT system elements and characteristics. The<br />
integration <strong>of</strong> some packages or groups <strong>of</strong> disparate elements can yield more<br />
total benefits than the sum <strong>of</strong> the benefits <strong>of</strong> the individual parts. Special attention<br />
is required to optimally integrate these packages <strong>of</strong> elements.<br />
This section explores five different interfaces that represent packages <strong>of</strong> BRT elements:<br />
Boarding Level Interface<br />
Boarding Capacity Interface<br />
2-139
Major Elements <strong>of</strong> BRT<br />
2-140<br />
Route Network Operations Interface<br />
Intersection Operation Interface<br />
Integrated Communication System Interface<br />
Interfaces for Brt Element Integration<br />
Successful implementation <strong>of</strong> BRT elements requires that elements function<br />
seamlessly with other elements. This section presents various combinations <strong>of</strong><br />
elements and the planning and design issues associated with successful integration<br />
<strong>of</strong> each set <strong>of</strong> elements to support BRT system performance and maximize<br />
BRT benefits.<br />
Boarding Level Interface<br />
The boarding level interface involves primarily vehicles and stations. Properly<br />
designed together, vehicles and station platforms can contribute to level boarding<br />
or near-level boarding.<br />
Level boarding eliminates both vertical and horizontal gaps between vehicle<br />
floor and station platforms, thereby eliminating the need to take time to deploy<br />
ramps for wheelchairs or mobility devices and allowing instant boarding<br />
for all passengers. Level boarding, therefore, significantly expedites the speed <strong>of</strong><br />
boarding and alighting processes thereby reducing travel time and improving<br />
customer response. Level boarding can be achieved through effective integration<br />
<strong>of</strong> low-floor vehicles, level station platforms (generally at least 14 inches),<br />
and precision docking (either through mechanically guided running ways or ITS<br />
guidance [Vehicle Infrastructure Integration]). In many international cases, level<br />
boarding is achieved with high-floor vehicles, high platforms, and drop ramps at<br />
stations.<br />
Near-level boarding can be achieved through a combination <strong>of</strong> low-floor vehicles<br />
and raised station platform heights. While not as significant as true level boarding,<br />
near-level boarding can still reduce (if not eliminate) the rate <strong>of</strong> ramp deployment<br />
and facilitate boarding for all passengers.<br />
Boarding Capacity Interface<br />
The boarding capacity interface involves a set <strong>of</strong> elements that facilitates the<br />
broader boarding and alighting process. Boarding through multiple doors allows<br />
BRT systems to process passengers at a rate similar to rapid transit systems,<br />
reducing the impact <strong>of</strong> high passenger volumes on dwell times. This interface<br />
involves integration <strong>of</strong> vehicles with multiple door channels (multiple doors<br />
and multiple door streams), <strong>of</strong>f-board fare collection (either barrier-separated<br />
or pro<strong>of</strong>-<strong>of</strong>-payment fare collection) or on-board fare collection enhanced with<br />
electronic fare media. Multiple-door boarding is also facilitated by a combination<br />
<strong>of</strong> running ways and stations designed to allow quick processing <strong>of</strong> vehicles<br />
in and out <strong>of</strong> stations (e.g., stations that allow passing <strong>of</strong> vehicles, stations with<br />
multiple berths, and dedicated running ways).<br />
Route Network Operations Interface<br />
The combination <strong>of</strong> running way and station elements helps determine the<br />
types <strong>of</strong> service designs that can be operated. Integrated network operations<br />
generally require a combination <strong>of</strong> more exclusive running ways (on-street dedicated<br />
running ways or <strong>of</strong>f-street types), stations with passing lanes and extended<br />
platforms, and a common vehicle fleet. Generally, there are also transit centers<br />
located at major terminals to facilitate transfers among feeders to the trunk-line<br />
BRT routes. The higher the level <strong>of</strong> exclusivity and grade separation <strong>of</strong> the running<br />
way, the higher the number <strong>of</strong> routes that can be operated in an integrated<br />
fashion with the BRT system. Features that introduce delay, such as at intersections,<br />
limited-capacity stations, and other bottlenecks along the running way,<br />
limit the capacity <strong>of</strong> the system and, therefore, number <strong>of</strong> routes that can be<br />
integrated into the BRT network.<br />
Intersection Operations Interface<br />
Efficient operation <strong>of</strong> BRT routes through intersections requires integration <strong>of</strong><br />
running way design and ITS with some contributions from station design and<br />
vehicles. The basic integration <strong>of</strong> BRT at intersections begins with <strong>Transit</strong> Signal<br />
Priority systems (and other traffic priority systems) and running way designs<br />
(lane configurations) that allow for physical or electronic queue jumpers. This<br />
requires some integration with the communication systems on the vehicle and<br />
the implementation <strong>of</strong> other ITS elements (an Automatic Vehicle Location system<br />
and an advanced communication system). Placing stations on the far-side <strong>of</strong><br />
intersections also facilitates the passage <strong>of</strong> BRT vehicles through intersections.<br />
Integrated Communication Systems Interface<br />
As mentioned in the ITS section, the effectiveness <strong>of</strong> ITS and other electronic<br />
components requires effective integration <strong>of</strong> the communications systems. This<br />
involves almost all ITS components: all communications equipment on vehicles<br />
(transit signal priority transponders, collision warning devices and other assist
and automation technologies, advanced communication systems, Automatic<br />
Vehicle Location, on-vehicle variable message signs, and passenger counters),<br />
electronic fare collection equipment (either on vehicles or at stations), and any<br />
communications systems associated with the running way (guidance) and stations<br />
(passenger information systems). The extent to which all these elements<br />
are integrated affects whether the functional abilities <strong>of</strong> each individual system<br />
are realized. For example, an Electronic Fare Collection system may be linked to<br />
an AVL/GPS system to provide data on the boarding pr<strong>of</strong>ile along a BRT route. A<br />
system to archive and process the data would support operations and planning.<br />
Most important, the integration <strong>of</strong> the elements with an advanced communication<br />
system enhances the ability to respond and transmit information in real<br />
time, making the system more responsive to customers.<br />
Major Elements <strong>of</strong> BRT<br />
2-141
BRT ElEmEnTs and sysTEm pERfoRmancE<br />
BRT ElEmEnTs and sysTEm<br />
pERfoRmancE<br />
This chapter identifies six key BRT system performance attributes—<br />
travel time, reliability, image and identity, passenger safety and security,<br />
system capacity, and accessibility. These six ways that BRT systems<br />
perform better also represent ways that transit passengers benefit from<br />
the implementation <strong>of</strong> BRT. The section on each performance attribute<br />
includes a description <strong>of</strong> the attribute, an overview <strong>of</strong> how individual<br />
BRT elements may contribute to performance, and a review <strong>of</strong> the performance<br />
<strong>of</strong> existing systems. This review includes a research summary<br />
(in cases where applications in transit demonstrate effects on performance)<br />
and system performance pr<strong>of</strong>iles (short case studies <strong>of</strong> BRT and<br />
non-BRT applications). Finally, the discussion <strong>of</strong> each performance attribute<br />
describes the indicators used to measure the performance attribute<br />
and a summary <strong>of</strong> the performance associated with BRT systems in<br />
cities around the world that have provided relevant data. The summary<br />
allows for a comparison <strong>of</strong> different approaches undertaken by transit<br />
agencies and different performance results across systems.<br />
The following six BRT system performance attributes are discussed in<br />
this chapter:<br />
Travel Time represents a primary performance attribute <strong>of</strong> BRT<br />
systems—the ability to transport passengers on their respective<br />
trips quickly. The impact <strong>of</strong> BRT systems on travel time savings<br />
depends on how each BRT element is implemented in a specific application<br />
and how they relate to each other and the other elements<br />
<strong>of</strong> the BRT system. There are several different travel time components<br />
that BRT systems impact, including:<br />
Running time—the time BRT vehicles and passengers actually<br />
spend moving. Running times are dependent on traffic<br />
Ch a r aC t e r i s t iC s o f Bu s ra p i d tr a n s i t f o r deCision-Ma k i n g 3-1
BRT Elements and System Performance<br />
3-2<br />
congestion, delays at intersections, and the need to decelerate into<br />
and accelerate from stations.<br />
Station dwell time - the time vehicles and passengers spend at stations<br />
while the vehicle is stopped to board and alight passengers.<br />
Waiting and transfer time - the amount <strong>of</strong> time passengers spend<br />
waiting for the first transit vehicle and the amount <strong>of</strong> time they spend<br />
waiting for subsequent services required to complete their trip.<br />
Reliability represents the variability <strong>of</strong> travel times. Reliability is affected by<br />
many BRT features. The three main aspects <strong>of</strong> reliability include:<br />
Running time reliability - the ability to maintain consistent travel<br />
times.<br />
Station dwell time reliability - the ability for patrons to board and<br />
alight within a set timeframe, with varying loads <strong>of</strong> passengers at<br />
stations, especially as measured across varying levels <strong>of</strong> congestion at<br />
different periods <strong>of</strong> a service day and on vehicles, thereby minimizing<br />
delay at stations.<br />
Service reliability - the availability <strong>of</strong> consistent service (availability<br />
<strong>of</strong> service to patrons, ability to recover from disruptions, availability <strong>of</strong><br />
resources to consistently provide the scheduled level <strong>of</strong> service).<br />
Identity and image capture how a BRT system is perceived by both passengers<br />
and non-passengers. These attributes reflect the effectiveness <strong>of</strong> a<br />
BRT system’s design in positioning it in the transportation marketplace and<br />
in fitting within the context <strong>of</strong> the urban environment. It is important both<br />
as a promotional and marketing tool for transit patrons and for providing<br />
information to non-frequent users as to the location <strong>of</strong> BRT system access<br />
points (i.e., stops and stations) and routing. Two major elements <strong>of</strong> BRT<br />
system identity and image capture its identity as a product (brand identity)<br />
and as an element <strong>of</strong> the urban form (contextual design):<br />
Brand identity - reflects how the BRT system is positioned relative to<br />
the rest <strong>of</strong> the transit system and other travel options. Effective design<br />
and integration <strong>of</strong> BRT elements reinforce a positive and attractive<br />
brand identity that motivates potential customers and makes it easier<br />
for them to use the system.<br />
Contextual design - measures how effectively the design <strong>of</strong> the BRT<br />
system is integrated with the surrounding urban environment.<br />
Safety and security for transit customers and the general public can be improved<br />
with the implementation <strong>of</strong> BRT systems, where safety and security<br />
are defined as:<br />
Safety - freedom from hazards, as demonstrated by reduced accident<br />
rates, injuries, and improved public perception <strong>of</strong> safety.<br />
Security - the actual and perceived freedom from criminal activities<br />
and potential threats against customers and property.<br />
Capacity is defined as the maximum number <strong>of</strong> passengers that can be carried<br />
past a point in a given direction during a given period along the critical<br />
section <strong>of</strong> a given BRT under specific operating conditions. Virtually all BRT<br />
elements affect capacity.<br />
Accessibility describes the general availability <strong>of</strong> service to all transit users<br />
or proximity to points <strong>of</strong> access (stations and stops) <strong>of</strong> the transit system.<br />
This document describes accessibility in a more specific sense—the ability<br />
and ease with which individuals with disabilities can use the transit system.<br />
TRavEl TimE<br />
Travel time represents the amount <strong>of</strong> time spent by passengers (and vehicles)<br />
from the beginning to the end <strong>of</strong> their trips. Travel time may be the single attribute<br />
<strong>of</strong> a transit system that customers care about the most and isparticularly<br />
important for non-discretionary, recurring trips such as those made for work<br />
purposes. Relatively high BRT running speeds and reduced station dwell times<br />
make BRT services more attractive for all types <strong>of</strong> customers, especially riders<br />
with other transportation choices. Waiting and transfer times have a particularly<br />
important effect, and BRT service plans generally feature frequent, all–day, direct<br />
service to minimize them. Travel times vary across different operating conditions.<br />
“Operational Analysis <strong>of</strong> Bus Lanes on Arterials” indicates that, for suburban bus<br />
operations, the majority <strong>of</strong> overall bus travel time (about 70 percent) takes place<br />
while the bus is in motion. For city bus operations, particularly within Central<br />
Business Districts (CBDs), a lower percentage <strong>of</strong> overall bus travel time (about<br />
40-60%) takes place while the bus is in motion. This is due to heavier passen-
ger boarding and alighting volumes per stop, higher stop density, more frequent<br />
signalized intersections, more pedestrian interference and worse traffic conditions.<br />
This report, considers four travel time components:<br />
Running time—time<br />
spent in the vehicle traveling from station to station<br />
Dwell time—time<br />
spent in the vehicle stopped at a station<br />
Wait time—time<br />
spent by passengers initially waiting to board a transit<br />
service<br />
Transfer time—time<br />
spent by passengers transferring between BRT service<br />
and other types <strong>of</strong> transit service<br />
Each component <strong>of</strong> travel time is described in further detail with a discussion <strong>of</strong><br />
how BRT elements contribute to their reduction. (One aspect <strong>of</strong> travel time <strong>of</strong>ten<br />
mentioned in transportation planning is called access time—the time spent<br />
by passengers walking or taking another non-transit mode to reach a particular<br />
transit service. It is not discussed here since it is affected by the intensity and<br />
location <strong>of</strong> land uses.)<br />
It is important to note that savings to travel time are experienced by both vehicles<br />
and passengers. While this discussion focuses on travel time savings across<br />
an entire route, for consistency <strong>of</strong> reporting across systems, it is important to<br />
note that passengers will experience travel time savings on BRT systems depending<br />
on their individual trip lengths.<br />
Running Time<br />
description <strong>of</strong> Running Time<br />
Running time is the element <strong>of</strong> travel time that represents the time spent by BRT<br />
passengers and vehicles moving between stations. In most cases, the maximum<br />
speed <strong>of</strong> the vehicle itself is not usually a determining factor for running travel<br />
times. Vehicles in service in dense corridors rarely accelerate to the maximum<br />
speed <strong>of</strong> the vehicle since their speeds are limited by general traffic speeds and<br />
close stop spacing. The major determining factors <strong>of</strong> running time are the delays<br />
that the vehicle encounters along the way, including congestion due to other<br />
vehicle traffic, delays at traffic signals to accommodate cross-traffic and pedestrians,<br />
delays to make turns, the number <strong>of</strong> stations a vehicle is required to serve,<br />
and the design <strong>of</strong> the BRT route structure.<br />
BRT Elements and System Performance<br />
Effects <strong>of</strong> BRT Elements on Running Time<br />
The primary BRT elements that improve travel times relative to conventional<br />
bus service are described below.<br />
Right-<strong>of</strong>-Way Locations, Level <strong>of</strong> Running Way Priority<br />
Right-<strong>of</strong>-way locations and level <strong>of</strong> running way priority are two <strong>of</strong> the key BRT elements that affect<br />
travel times. In general, BRT systems in <strong>of</strong>f-street rights-<strong>of</strong>-way have faster speeds or shorter<br />
travel times for equivalent distances. The impacts <strong>of</strong> each <strong>of</strong> the on-street and <strong>of</strong>f-street running<br />
way types are described for each level <strong>of</strong> running way priority.<br />
On-Street Running Way Types<br />
Mixed-flow lanes—BRT vehicles operating in mixed-flow lanes are typically constrained by the<br />
speed <strong>of</strong> general traffic. This represents the basic condition <strong>of</strong> bus operation upon which other<br />
levels <strong>of</strong> running way priority can provide improvements.<br />
Mixed-flow lanes with queue jumpers—Queue jumpers allow vehicles to bypass traffic queues<br />
(i.e., traffic backups) at signalized locations or bottlenecks. Queue jumpers <strong>of</strong>ten are used in<br />
combination with transit signal priority.<br />
On-street bus lanes reduce delays associated with congestion in city streets. Dedicated lanes<br />
<strong>of</strong>ten are used in conjunction with transit signal priority to minimize unpredictable delays at<br />
intersections.<br />
Bus-only streets provide similar reductions in delay as on-street bus lanes with the added benefit<br />
<strong>of</strong> removing delays resulting from conflicts with automobiles changing lanes across the BRT running<br />
way. When implemented along a street with significant pedestrian activity (e.g. a shopping<br />
district), bus speeds are <strong>of</strong>ten limited.<br />
Off-Street Running Way Types<br />
Expressway bus lanes, similar to grade-separated exclusive transitways, eliminate most potential<br />
delay within an expressway/freeway environment. Typically, they have joint operation with<br />
other vehicles as high-occupancy vehicle (HOV) lanes and therefore may experience some delay<br />
due to congestion.<br />
At-grade exclusive transitways eliminate the hazards due to merging or turning traffic or pedestrians<br />
and bicyclists crossing into the middle <strong>of</strong> the running way, allowing BRT vehicles to travel<br />
safely at higher speeds.<br />
Grade-separated exclusive transitways eliminate all potential delay, including delays at intersections.<br />
BRT vehicles are free to travel safely at relatively high speeds from station to station.<br />
Stations—Station Location<br />
Off-street, <strong>of</strong>f-line stations divert BRT vehicles from the main BRT running way and thus create<br />
delay associated with turns and access to and from the transit running way and within a transit<br />
center. On-line station types (either on-street or <strong>of</strong>f-street) create no such delay.<br />
3-3
BRT Elements and System Performance<br />
Stations—Passing Capability<br />
Stations that allow for passing minimize delays at stations, especially if the service plan includes<br />
high-frequency operation or multiple routes. Passing capability also allows for the service plan<br />
to incorporate route options such as skip-stop or express routes, which <strong>of</strong>fer even lower travel<br />
times than routes that serve all stations.<br />
ITS—<strong>Transit</strong> Vehicle Prioritization<br />
<strong>Transit</strong> signal priority (TSP), enables the BRT vehicle to travel faster along the roadway through<br />
increased green time. TSP is especially useful for travel time savings if implemented at key intersections<br />
that cause the highest delay.<br />
Signal timing/phasing optimization can provide similar benefits, but perhaps to a lesser extent.<br />
Retiming or coordinating signals along a corridor is generally directed at improving all traffic<br />
flow.<br />
Station and lane access control can reduce the amount <strong>of</strong> time a BRT vehicle sits in a queue<br />
waiting to enter a dedicated BRT or HOV lane or station.<br />
ITS—Intelligent Vehicle Systems<br />
For those BRT systems operating on narrow roadway ROW (e.g., shoulders), lane-keeping assistance<br />
systems (or vehicle guidance systems) allow the BRT vehicle operator to travel at higher<br />
speeds than otherwise would be possible due to the physical constraints <strong>of</strong> the ROW.<br />
Precision docking enables a BRT vehicle to quickly dock at a BRT station and reduce both running<br />
travel time and station dwell time. Docking technology removes the burden on the BRT<br />
vehicle operator <strong>of</strong> steering the vehicle to within a certain lateral distance from the station platform,<br />
allowing for faster approaches to stations.<br />
Service and Operations Plan—Route Type<br />
Reducing the number <strong>of</strong> station stops by <strong>of</strong>fering limited-stop or express service can reduce delays<br />
associated with decelerating and accelerating out <strong>of</strong> the station and with station loading.<br />
Service and Operations Plan—Station Spacing<br />
Increasing station spacing by reducing the number <strong>of</strong> stations reduces delay associated with decelerating<br />
into and accelerating out <strong>of</strong> the station and with loading at the station. Cumulatively,<br />
the travel time savings associated with widening the station spacing can be significant.<br />
Service and Operations Plan—Schedule Control Method<br />
When frequencies are high enough, encouraging vehicle operators to travel the route as fast as<br />
they can and managing on-time performance through headway-based schedule control can<br />
encourage vehicles to travel at the maximum speeds that are possible between stations.<br />
performance <strong>of</strong> Existing systems<br />
<strong>Transit</strong> agencies have significant experience in achieving travel time savings<br />
and increasing the speed <strong>of</strong> service through deployment <strong>of</strong> BRT elements. This<br />
3-4<br />
section characterizes this experience in three sections: a summary <strong>of</strong> relevant<br />
research on travel time savings strategies, pr<strong>of</strong>iles <strong>of</strong> noteworthy experience<br />
(including both BRT and non-BRT cases), and a summary <strong>of</strong> BRT system characteristics<br />
that affect running time and available performance data.<br />
Research Summary<br />
Research in transit operations suggests how running times can be reduced<br />
through many elements that are incorporated into BRT. The <strong>Transit</strong> Capacity<br />
and Quality <strong>of</strong> Service Manual, 2nd Edition provides estimated average speeds <strong>of</strong><br />
buses, as a function <strong>of</strong> three variables:<br />
type <strong>of</strong> running way (e.g., busway or freeway HOV lane, arterial street bus<br />
lane, or mixed traffic)<br />
average stop spacing<br />
average dwell time per stop<br />
Exhibit 3-1 makes clear that the use <strong>of</strong> <strong>of</strong>f-street ROW locations with wide station<br />
spacing (such as expressway bus lanes or grade-separated transitways) is the most<br />
effective way to increase bus travel speeds. All things (e.g., station spacing, fare collection<br />
approach, etc.) being equal, BRT revenue speeds on exclusive running ways will<br />
compare favorably with most heavy rail and exclusive right-<strong>of</strong>-way light rail systems.<br />
Exhibit 3-1: Estimated Average Bus Speeds on Busways or<br />
Exclusive Freeway HOV Lanes<br />
Average Stop<br />
Spacing (mi)<br />
Average Dwell Time per Stop (secs)<br />
0 15 30 45 60<br />
0.5 36 mph 26 mph 21 mph 18 mph 16 mph<br />
1.0 42 mph 34 mph 30 mph 27 mph 24 mph<br />
1.5 44 mph 38 mph 35 mph 32 mph 29 mph<br />
2.0 46 mph 41 mph 37 mph 35 mph 32 mph<br />
2.5 46 mph 42 mph 39 mph 37 mph 35 mph<br />
Note: Assumes 50 mph top running speed <strong>of</strong> bus in lane<br />
Source: <strong>Transit</strong> Capacity and Quality <strong>of</strong> Service Manual, 2 nd Edition, p. 4-46.
As shown in Exhibit 3-2, having dedicated bus lanes on arterial streets (also<br />
known as on-street bus lanes) provides for speeds that are similar to that <strong>of</strong><br />
street-running light rail systems.<br />
Exhibit 3-2: Estimated Average Bus Speeds on<br />
Dedicated Arterial Street Bus Lanes<br />
Average Stop<br />
Spacing (mi)<br />
Average Dwell Time per Stop (secs)<br />
10 20 30 40 50 60<br />
0.10 9 mph 7 mph 6 mph 5 mph 4 mph 4 mph<br />
0.20 16 mph 13 mph 11 mph 10 mph 9 mph 8 mph<br />
0.25 18 mph 15 mph 13 mph 11 mph 10 mph 9 mph<br />
0.50 25 mph 22 mph 20 mph 18 mph 16 mph 15 mph<br />
Source: <strong>Transit</strong> Capacity and Quality <strong>of</strong> Service Manual, 2 nd Edition, p. 4-53.<br />
Exhibit 3-3 indicates that in typical mixed traffic conditions, bus speeds are<br />
significantly lower than those for BRT, light and heavy rail systems operating<br />
on exclusive running ways. This is due to the traffic itself, as well as the time<br />
required for the bus to exit / re-enter the traffic stream at each stop.<br />
Exhibit 3-3: Estimated Average Bus Speeds in<br />
General Purpose Traffic Lanes<br />
Average Stop<br />
Spacing (mi)<br />
Average Dwell Time per Stop (secs)<br />
10 20 30 40 50 60<br />
0.10 6 mph 5 mph 5 mph 4 mph 4 mph 3 mph<br />
0.20 9 mph 8 mph 7 mph 6 mph 6 mph 5 mph<br />
0.25 10 mph 9 mph 8 mph 7 mph 7 mph 6 mph<br />
0.50 11 mph 10 mph 10 mph 9 mph 9 mph 8 mph<br />
Source: <strong>Transit</strong> Capacity and Quality <strong>of</strong> Service Manual, 2 nd Edition, p. 4-53.<br />
BRT Elements and System Performance<br />
Exhibits 3-1 to 3-3 also indicate that stop spacing and dwell times are also significant<br />
in influencing average bus travel speeds.<br />
BRT systems improve travel times over conventional bus services through a combination<br />
<strong>of</strong> dedicated running ways, longer station spacing, reduced dwell times<br />
at stops (e.g., due to multiple door boarding) and/or ITS applications (e.g., traffic<br />
signal priority). BRT experience in the United States suggests that travel time<br />
savings is on the order <strong>of</strong> 25 to 50 percent for recently-implemented BRT systems<br />
(Bus Rapid <strong>Transit</strong>: Case Studies in Bus Rapid <strong>Transit</strong>, p. 51). Findings from<br />
11 international systems in Canada, Brazil, Ecuador, England, and Japan found<br />
that speed improvements associated with BRT implementation ranged from 22<br />
to 120 percent (Bus Rapid <strong>Transit</strong>—An Overview). Exhibit 3-4 shows BRT speeds<br />
related to the spacing <strong>of</strong> stations.<br />
Exhibit 3-4: Busway and Freeway Bus Lane Speeds as a<br />
Function <strong>of</strong> Station Spacing<br />
Station Spacing<br />
(mi)<br />
Stops Per Mile<br />
Speeds (mph)<br />
20-Second Dwell 30-Second Dwell<br />
0.25 4.0 18 16<br />
0.50 2.0 25 22<br />
1.00 1.0 34 31<br />
1.50 0.7 42 38<br />
2.00 0.5 44 40<br />
Source: “Bus Rapid <strong>Transit</strong>—Implementation Guidelines”<br />
When determining station spacing, there is a trade<strong>of</strong>f between patron accessibility<br />
and service speed.<br />
System Performance Pr<strong>of</strong>iles<br />
Many systems combine BRT elements to achieve travel time savings. The following<br />
examples demonstrate that these savings can be achieved with relatively<br />
simple improvements such as increased station spacing and with more significant<br />
infrastructure investments such as grade-separated running ways.<br />
3-5
BRT Elements and System Performance<br />
Metro Rapid, Los Angeles<br />
The Metro Rapid system demonstrates how a combination <strong>of</strong> increased station<br />
spacing, TSP, and queue jumpers can clearly impact travel time. Metro Rapid is a<br />
229-mile network <strong>of</strong> rapid bus lines that serve greater Los Angeles. The network<br />
is overlaid on local bus routes and operates in mixed traffic with TSP, queue<br />
jumpers, and fewer stops implemented to improve speeds over the local service.<br />
Overall, the Metro Rapid lines provide an average 25 percent time savings over<br />
local service. An evaluation <strong>of</strong> the Wilshire/Whittier Boulevard BRT line found<br />
that average travel time savings during peak periods was 28 percent compared<br />
to previous bus service. The TSP system contributed to 27 percent <strong>of</strong> the overall<br />
travel time savings; the remaining 73 percent was due to BRT elements such as<br />
station spacing and location. The Ventura Boulevard BRT line saw similar results,<br />
with a 23 percent overall travel time reduction and TSP contributing to 33 percent<br />
<strong>of</strong> the travel time savings. Metro continues to add Metro Rapid lines, and<br />
now has implemented a 450-mile network <strong>of</strong> around 30 lines.<br />
East, South, and West Busways, Pittsburgh<br />
The East Busway and South Busway in Pittsburgh each provide a fully gradeseparated<br />
transitway for vehicles traveling between downtown Pittsburgh and<br />
suburbs to the east and south. With the introduction <strong>of</strong> the East Busway, several<br />
routes that had served the corridor were diverted to the busway to take<br />
advantage <strong>of</strong> the faster speeds and reliability on the busway. Along with the<br />
diversion <strong>of</strong> these routes to the busway, the downtown circulation segments<br />
<strong>of</strong> the routes also were realigned. The time required for walk access to service,<br />
downtown circulation, and line-haul travel was calculated for six key downtown<br />
destinations for both the AM and PM peaks. In all cases in the AM peak, the<br />
line-haul travel time decreased by an average <strong>of</strong> 5 or 6 minutes, while downtown<br />
circulation time decreased for four out <strong>of</strong> six locations. Overall, total travel time<br />
has decreased by 52 percent. The South Busway has demonstrated even higher<br />
reductions <strong>of</strong> 55 percent. The West Busway operates on an at-grade busway and<br />
has demonstrated somewhat lower travel time savings <strong>of</strong> 25 percent (Pultz and<br />
K<strong>of</strong>fman 1987).<br />
HealthLine BRT, Cleveland<br />
The Greater Cleveland Regional <strong>Transit</strong> Authority (RTA) has implemented a<br />
7.1-mile BRT corridor along the city’s main east-west thoroughfare, Euclid Avenue.<br />
The service, named the HealthLine, features multiple BRT elements designed<br />
to improve travel times, including an exclusive two-lane median busway<br />
3-6<br />
in the corridor’s Midtown section, exclusive curbside lanes for 2.3 miles, transit<br />
signal priority, level boarding, <strong>of</strong>f-board fare collection, and articulated buses<br />
with multiple-door entry on both the right and left sides. As <strong>of</strong> mid-2008, RTA<br />
had completed the median busway portion <strong>of</strong> the route and began operating its<br />
conventional 40-ft buses in the busway. Even though the entire service was not<br />
yet operational, RTA was already reporting a 26 percent improvement in travel<br />
times along this corridor.<br />
Chicago <strong>Transit</strong> Authority’s Express Bus Service<br />
In 1998, the Chicago <strong>Transit</strong> Authority (CTA) began implementing express bus<br />
service overlaid onto its local routes in high ridership corridors. The program<br />
seeks to improve travel times by reducing the number <strong>of</strong> stops by about 75<br />
percent. Express buses stop only at major intersections and for connections to<br />
other transit service. The buses stop at basic bus stops with special red “express<br />
service” markings. Three initial lines—Western Express, Irving Park Express, and<br />
Garfield Express—reported travel time improvements <strong>of</strong> 15 percent, 25 percent,<br />
and 20 percent, respectively. Following the success <strong>of</strong> these lines, CTA began<br />
implementing more express service and, as <strong>of</strong> 2008, there were 10 express bus<br />
routes. CTA may begin implementing signal priority at a later date. The agency<br />
has launched web-based real-time bus tracking for many <strong>of</strong> its bus lines (express<br />
and local) and is implementing an effort to reduce bus bunching across its bus<br />
service.<br />
BRT Elements by System and Running Time<br />
Multiple performance indicators measure travel time performance, as described<br />
below. It should be noted that it is difficult to measure running time separately<br />
from dwell times, so these travel time statistics typically include both attributes,<br />
aggregated as “end-to-end travel time.” Exhibit 3-5 summarizes the travel time<br />
savings performance benefits associated with the introduction <strong>of</strong> BRT systems in<br />
35 cities around the world, based on the following indicators:<br />
Maximum Peak Hour End-to-End Travel Time—the maximum travel time<br />
required to complete a one-way trip from the beginning to the end <strong>of</strong> the<br />
line during weekday peak hours.<br />
Uncongested End-to-End Travel Time—the average travel time required to<br />
complete a one-way trip from the beginning to the end <strong>of</strong> the line during<br />
weekday non-peak hours <strong>of</strong> service.
Average Speed in Peak Hour (mph)—determined by dividing the total<br />
one-way route length by the maximum peak-hour end-to-end travel time,<br />
multiplied by 60.<br />
Average Uncongested Speed (mph) - determined by dividing the total oneway<br />
route length by the uncongested end-to-end travel time, multiplied by<br />
60.<br />
Percent Travel Time Change in Corridor Before vs. After BRT—derived by<br />
calculating the percentage difference in travel time at peak hours between<br />
the BRT service and the transit travel in this corridor prior to implementation<br />
<strong>of</strong> BRT. This is one way <strong>of</strong> measuring the travel time benefits <strong>of</strong> BRT;<br />
however, not all agencies have calculations for pre-BRT corridor travel times<br />
available. The alternative measure is below.<br />
Percent Travel Time Change in Corridor BRT vs. Local Bus in Same Corridor—derived<br />
by calculating the percentage difference in travel time at peak<br />
hours between a BRT line and a local line that operate along the same alignment<br />
and have the same end points. This is not applicable for agencies that<br />
have replaced local bus service in the corridor.<br />
Survey <strong>of</strong> Customer Travel Times—indicates the actual travel time savings<br />
reported by customers through rider surveys. Only a few agencies have<br />
provided results <strong>of</strong> such surveys.<br />
The data shown in Exhibit 3-5 provide empirical context for assessing the impact<br />
<strong>of</strong> BRT elements on transit running times across a broad array <strong>of</strong> BRT strategies<br />
that encompass a range <strong>of</strong> BRT treatments. Some cities operate multiple BRT<br />
corridors or routes; if the treatments or performance results are substantially<br />
different, they are listed separately. In all, there are 54 different BRT systems or<br />
lines analyzed in the table.<br />
Most <strong>of</strong> the systems described in the table operate in an on-street environment,<br />
either in mixed-flow lanes or exclusive curbside or median lanes. Roughly onethird<br />
feature <strong>of</strong>f-street running way operation. Approximately half feature prioritization<br />
elements such as queue jumping and transit signal priority.<br />
Overall, the BRT systems showed improvements in travel time over previous corridor<br />
travel times or existing local bus service. Reported travel time improvements<br />
range from 5 to 70 percent, with half <strong>of</strong> the systems demonstrating improvements<br />
between 20 and 40 percent. The median percentage improvement<br />
was 25 percent.<br />
BRT Elements and System Performance<br />
According to the data, the strongest indicator <strong>of</strong> improved travel time is the<br />
level <strong>of</strong> running way segregation. Almost all <strong>of</strong> the systems with less than 25<br />
percent improvement operate on-street in mixed traffic lanes. The systems with<br />
the highest reported travel time savings <strong>of</strong> 40 percent or higher were those with<br />
grade-separated busways—Adelaide, Brisbane, Pittsburgh, and Edinburgh (Edinburgh<br />
reports the time savings only for the exclusive guideway portion <strong>of</strong> its<br />
BRT corridor). However, this correlation is not absolute. For example, the Orange<br />
Line BRT in Los Angeles reports a 16 percent improvement in travel time despite<br />
operating in a segregated right-<strong>of</strong>-way. This is the result <strong>of</strong> safety concerns at<br />
the running way’s at-grade intersection crossings, which require drivers to slow<br />
down significantly when passing through an intersection. Indeed, the issue <strong>of</strong> atgrade<br />
crossings would appear to be a trend in the data, as both Miami and the<br />
Pittsburgh West Busway, which also include some at-grade intersections, have<br />
lower time savings than the busways with total grade separation (Pittsburgh’s<br />
East and South busways, Brisbane, and Adelaide). Segregation <strong>of</strong>fers a comparative<br />
benefit over non-segregated BRT, but all <strong>of</strong> the BRT systems reported improvements<br />
over previous or current local service.<br />
<strong>Transit</strong> signal priority is a feature on many <strong>of</strong> the lines that showed improvement,<br />
suggesting that it likely contributes to the improvement over local service.<br />
The data did not, however, reveal an obvious correlation between higher travel<br />
time savings and use <strong>of</strong> transit signal priority.<br />
The data also reveal the importance <strong>of</strong> certain service design features such as<br />
longer station spacing and limited-stop or express service in reducing running<br />
travel times. In addition to prevailing traffic conditions, maximum transit vehicle<br />
speeds are limited by the distance between stations. The desire to maximize<br />
overall service speeds is part <strong>of</strong> the rationale behind limited service, which designates<br />
fewer stops along a given distance than traditional local service. Local bus<br />
service typically features stop spacing <strong>of</strong> 0.2 or 0.25 miles. By contrast, almost all<br />
<strong>of</strong> the BRT systems shown here have an average station spacing <strong>of</strong> 0.5 miles or<br />
more, with the on-street systems typically between 0.5 and 1 mile and the segregated<br />
busway systems at 1 mile or longer.<br />
For BRT systems sharing lane space with local buses on mixed-flow lanes, designing<br />
a limited-stop service can reduce end-to-end travel time, especially when<br />
complemented with TSP capabilities. Perhaps the best example <strong>of</strong> this is the<br />
Metro Rapid service in Los Angeles, which, as described earlier, reduces travel<br />
time an average <strong>of</strong> 25 percent over local lines operating on the same alignment.<br />
3-7
BRT Elements and System Performance<br />
Another example is the Metrolink system in Halifax, which <strong>of</strong>fers express service<br />
with extremely long station spacing, an average <strong>of</strong> 3.3 miles. This allows the<br />
system to achieve travel time savings <strong>of</strong> 33 percent, comparable to some <strong>of</strong> the<br />
segregated ROW BRTs.<br />
Finally, the data seem to indicate a strong correlation between passing ability at<br />
stations or bus pullouts and improved travel time. However, since most <strong>of</strong> the<br />
systems with this feature operate on segregated busways, it seems likely that the<br />
immediate cause <strong>of</strong> the performance improvement is the running way itself.<br />
3-8
Running Way (mi)<br />
Exhibit 3-5: BRT Elements by System and Travel Time<br />
Albuquerque Boston Silver Line<br />
BRT Elements and System Performance<br />
Rapid Ride Washington Street Waterfront SL1 - Airport Waterfront SL2 - BMIP<br />
On-Street Mixed Lanes 13.1 0.2 3.5 1.2<br />
On-Street Exclusive Bus Lanes 0.7 2.2<br />
Off-Street Mixed Lanes<br />
Off-Street Reserved Lanes<br />
At-Grade <strong>Transit</strong>ways<br />
Grade-Separated <strong>Transit</strong>ways<br />
Queue Jumpers<br />
station<br />
1.0 1.0<br />
Location On-street On-street On- and <strong>of</strong>f-street On- and <strong>of</strong>f-street<br />
Passing Capability<br />
iTs<br />
No No No No<br />
<strong>Transit</strong> Vehicle Prioritization<br />
Intelligent Vehicle Systems<br />
service plan<br />
TSP TSP<br />
Route Type Limited-stop All-stop All-stop All-stop<br />
Average Station Spacing (mi) 0.87 0.22 0.56 0.22<br />
Method <strong>of</strong> Schedule Control<br />
performance<br />
Schedule Schedule Schedule<br />
Maximum (Peak Hour) End-to-End Travel Time (min) 37 18 40 24<br />
Uncongested End-to-End Travel Time (min) 37 12 n/a n/a<br />
Average Speed in Peak Hour (mph) 17.4 8.0 12.4<br />
Average Uncongested Speed (mph) 17.4 12.0<br />
% Travel Time Reduction in Corridor Before vs. After BRT 15% 9%<br />
% Travel Time Reduction in Corridor Compared to Local Bus 9%<br />
Survey <strong>of</strong> Customer Travel Times 77% positive Yes 78% good or excellent 78% good or excellent<br />
3-9
BRT Elements and System Performance<br />
3-10<br />
Running Way (mi)<br />
Exhibit 3-5: BRT Elements by System and Travel Time (cont’d)<br />
Chicago Cleveland<br />
Western Avenue Express Irving Park Express Garfield Express HealthLine<br />
On-Street Mixed Lanes 18.3 9.0 9.4 2.7<br />
On-Street Exclusive Bus Lanes 4.4<br />
Off-Street Mixed Lanes<br />
Off-Street Reserved Lanes<br />
At-Grade <strong>Transit</strong>ways<br />
Grade-Separated <strong>Transit</strong>ways<br />
Queue Jumpers<br />
station<br />
Location On-street On-street On-street On-street<br />
Passing Capability<br />
iTs<br />
No No No No<br />
<strong>Transit</strong> Vehicle Prioritization TSP<br />
Intelligent Vehicle Systems<br />
service plan<br />
Precision docking<br />
Route Type Limited Limited Limited All-stop<br />
Average Station Spacing (mi) 0.47 0.50 0.56 0.42<br />
Method <strong>of</strong> Schedule Control Schedule Schedule Schedule Schedule<br />
performance 2004 data 2004 data 2004 data<br />
Maximum (Peak Hour) End-to-End Travel Time (min) 92 55 59 34<br />
Uncongested End-to-End Travel Time (min) 60 37 31<br />
Average Speed in Peak Hour (mph) 11.9 10.3 9.1<br />
Average Uncongested Speed (mph) 18.3 15.3 17.4<br />
% Travel Time Reduction in Corridor Before vs. After BRT 26%<br />
% Travel Time Reduction in Corridor Compared to Local Bus<br />
Survey <strong>of</strong> Customer Travel Times<br />
15% 20% 25%
Running Way (mi)<br />
Exhibit 3-5: BRT Elements by System and Travel Time (cont’d)<br />
BRT Elements and System Performance<br />
Eugene Honolulu Honolulu Honolulu Kansas City<br />
EmX<br />
City<br />
Express A<br />
City<br />
Express B<br />
County<br />
Express C<br />
On-Street Mixed Lanes 1.4 19.0 8.0 18 6<br />
On-Street Exclusive Bus Lanes 2.6<br />
Off-Street Mixed Lanes 3.5<br />
Off-Street Reserved Lanes 17.5<br />
MAX<br />
Some segments at<br />
certain times <strong>of</strong> day<br />
At-Grade <strong>Transit</strong>ways<br />
Grade-Separated <strong>Transit</strong>ways<br />
Queue Jumpers<br />
station<br />
Yes No<br />
Location<br />
Passing Capability<br />
iTs<br />
On-street On-street On-street On-street On-street<br />
<strong>Transit</strong> Vehicle Prioritization<br />
Intelligent Vehicle Systems<br />
service plan<br />
TSP TSP<br />
Route Type All-Stop Limited Limited-stop Express<br />
Average Station Spacing (mi) 0.44 0.56 0.29 0.98 0.30<br />
Method <strong>of</strong> Schedule Control<br />
performance<br />
Schedule Schedule Schedule Schedule Schedule<br />
Maximum (Peak Hour) End-to-End Travel Time (min) 30.0 85 53 105<br />
Uncongested End-to-End Travel Time (min) 18 37 31<br />
Average Speed in Peak Hour (mph) 10.3 9.1<br />
Average Uncongested Speed (mph) 13.5 75 40 85<br />
% Travel Time Reduction in Corridor Before vs. After BRT 8.0 13.4 9.1 22.3 20.0<br />
% Travel Time Reduction in Corridor Compared to Local Bus 20% 25%<br />
Survey <strong>of</strong> Customer Travel Times 17.8 15.2 12.0 27.5<br />
3-11
BRT Elements and System Performance<br />
3-12<br />
Running Way (mi)<br />
Exhibit 3-5: BRT Elements by System and Travel Time (cont’d)<br />
Las Vegas Los Angeles Los Angeles<br />
North Las Vegas MAX Orange Line Metro Rapid (All Routes)<br />
On-Street Mixed Lanes 2.9 1.0 229<br />
On-Street Exclusive Bus Lanes 4.7<br />
Off-Street Mixed Lanes<br />
Off-Street Reserved Lanes<br />
At-Grade <strong>Transit</strong>ways<br />
Grade-Separated <strong>Transit</strong>ways<br />
Queue Jumpers<br />
station<br />
13.5<br />
Location On-street Off-street On-street<br />
Passing Capability<br />
iTs<br />
Passing lane at each in-line station No<br />
<strong>Transit</strong> Vehicle Prioritization TSP TSP<br />
Intelligent Vehicle Systems<br />
service plan<br />
Precision docking<br />
Route Type Limited-stop All-stop Limited<br />
Average Station Spacing (mi) 0.75 1.12 0.71<br />
Method <strong>of</strong> Schedule Control<br />
performance<br />
Headway Some headway Headway<br />
Maximum (Peak Hour) End-to-End Travel Time (min) 20 42 Varies by corridor<br />
Uncongested End-to-End Travel Time (min) 17 37 Varies by corridor<br />
Average Speed in Peak Hour (mph) 22.5 20 mph 14 to 16 mph (avg for all routes)<br />
Average Uncongested Speed (mph) 26.5 23 mph 16 - 22 mph (avg for all routes)<br />
% Travel Time Reduction in Corridor Before vs. After BRT 16%<br />
% Travel Time Reduction in Corridor Compared to Local Bus 25% Overall avg <strong>of</strong> 25% faster than local bus routes<br />
Survey <strong>of</strong> Customer Travel Times Yes Very favorable Very favorable
Running Way (mi)<br />
Exhibit 3-5: BRT Elements by System and Travel Time (cont’d)<br />
On-Street Mixed Lanes 14.0<br />
BRT Elements and System Performance<br />
Miami Oakland Orlando<br />
Busway Rapid San Pablo Corridor LYMMO<br />
On-Street Exclusive Bus Lanes<br />
Off-Street Mixed Lanes<br />
Off-Street Reserved Lanes<br />
At-Grade <strong>Transit</strong>ways<br />
Grade-Separated <strong>Transit</strong>ways<br />
8.0 3.0<br />
Queue Jumpers<br />
station<br />
Yes<br />
Location Off-street On-street Off-street<br />
Passing Capability<br />
iTs<br />
Bus pullouts<br />
<strong>Transit</strong> Vehicle Prioritization<br />
Intelligent Vehicle Systems<br />
service plan<br />
TSP<br />
Route Type Limited All Stop All Stop<br />
Average Station Spacing (mi) 0.71 0.56 0.30<br />
Method <strong>of</strong> Schedule Control Schedule Schedule Headway<br />
performance 2004 data 2004 data 2004 data<br />
Maximum (Peak Hour) End-to-End Travel Time (min) 25 63<br />
Uncongested End-to-End Travel Time (min) 25 52 20<br />
Average Speed in Peak Hour (mph) 19.2 13.4<br />
Average Uncongested Speed (mph) 19.2 16.2 9.0<br />
% Travel Time Reduction in Corridor Before vs. After BRT 35%<br />
% Travel Time Reduction in Corridor Compared to Local Bus 21% Overall avg <strong>of</strong> 25% faster than local bus routes<br />
Survey <strong>of</strong> Customer Travel Times (17% from limited service route) 0% Very favorable<br />
3-13
BRT Elements and System Performance<br />
3-14<br />
Running Way (mi)<br />
Exhibit 3-5: BRT Elements by System and Travel Time (cont’d)<br />
Phoenix Phoenix Phoenix Phoenix<br />
RAPID I-10 East RAPID I-10 West RAPID SR-51 RAPID I-17<br />
On-Street Mixed Lanes 6.5 4.8 12.3 8.0<br />
On-Street Exclusive Bus Lanes<br />
Off-Street Mixed Lanes<br />
Off-Street Reserved Lanes<br />
At-Grade <strong>Transit</strong>ways<br />
Grade-Separated <strong>Transit</strong>ways<br />
Queue Jumpers<br />
station<br />
14.0 8.0 10.3 11.5<br />
Location On-street On-street On-street On-street<br />
Passing Capability<br />
iTs<br />
Bus pullouts Bus pullouts Bus pullouts Bus pullouts<br />
<strong>Transit</strong> Vehicle Prioritization TSP TSP TSP<br />
Intelligent Vehicle Systems (1 signal) TSP (1 signal)<br />
service plan (1 signal) TSP Collision warning<br />
Route Type (1 signal) All Stop All Stop<br />
Average Station Spacing (mi) Collision warning Collision warning Collision warning Express<br />
Method <strong>of</strong> Schedule Control 1.63<br />
performance Express Express Express Schedule<br />
Maximum (Peak Hour) End-to-End Travel Time (min) 1.86 1.59 2.05 2004 data<br />
Uncongested End-to-End Travel Time (min) Schedule Schedule Schedule 52<br />
Average Speed in Peak Hour (mph) 2004 data 2004 data 2004 data<br />
Average Uncongested Speed (mph)<br />
% Travel Time Reduction in Corridor Before vs. After BRT<br />
37 34 48 22.5<br />
% Travel Time Reduction in Corridor Compared to Local Bus<br />
Survey <strong>of</strong> Customer Travel Times<br />
33.2 22.5 28.1
Running Way (mi)<br />
Exhibit 3-5: BRT Elements by System and Travel Time (cont’d)<br />
Pittsburgh Pittsburgh Pittsburgh<br />
East Busway South Busway West Busway<br />
On-Street Mixed Lanes 0.4 0.4<br />
BRT Elements and System Performance<br />
On-Street Exclusive Bus Lanes<br />
Off-Street Mixed Lanes<br />
Off-Street Reserved Lanes<br />
At-Grade <strong>Transit</strong>ways<br />
Grade-Separated <strong>Transit</strong>ways<br />
Queue Jumpers<br />
station<br />
8.7 4.3 4.6<br />
Location Off-street Off-street Off-Street<br />
Passing Capability<br />
iTs<br />
Passing lanes Passing lanes Passing lanes<br />
<strong>Transit</strong> Vehicle Prioritization TSP<br />
Intelligent Vehicle Systems<br />
service plan<br />
Collision warning Collision warning Collision warning<br />
Route Type All-stop All-stop All-stop<br />
Average Station Spacing (mi) 1.14 0.54 0.83<br />
Method <strong>of</strong> Schedule Control Schedule Schedule Schedule<br />
performance 2004 data 2004 data 2004 data<br />
Maximum (Peak Hour) End-to-End Travel Time (min) 20 9 17<br />
Uncongested End-to-End Travel Time (min) 18 9 14<br />
Average Speed in Peak Hour (mph) 27.3 28.7 17.6<br />
Average Uncongested Speed (mph) 30.3 28.7 21.4<br />
% Travel Time Reduction in Corridor Before vs. After BRT<br />
% Travel Time Reduction in Corridor Compared to Local Bus<br />
52% 55% 26%<br />
Survey <strong>of</strong> Customer Travel Times<br />
85% <strong>of</strong> passengers report shorter travel times with an average<br />
reduction <strong>of</strong> 14 min<br />
3-15
BRT Elements and System Performance<br />
3-16<br />
Running Way (mi)<br />
Exhibit 3-5: BRT Elements by System and Travel Time (cont’d)<br />
Sacramento San Jose Halifax<br />
E-Bus Rapid 522 Metro<strong>Link</strong><br />
On-Street Mixed Lanes 8.0 25.0 12.1<br />
On-Street Exclusive Bus Lanes 0.5<br />
Off-Street Mixed Lanes 10.6<br />
Off-Street Reserved Lanes 4.0<br />
At-Grade <strong>Transit</strong>ways<br />
Grade-Separated <strong>Transit</strong>ways<br />
Queue Jumpers<br />
station<br />
Location<br />
Passing Capability<br />
iTs<br />
On- and <strong>of</strong>f-street On- and <strong>of</strong>f-street On- and <strong>of</strong>f-street<br />
<strong>Transit</strong> Vehicle Prioritization<br />
Intelligent Vehicle Systems<br />
service plan<br />
TSP TSP TSP<br />
Route Type Limited Express<br />
Average Station Spacing (mi) 0.47 0.86 3.3<br />
Method <strong>of</strong> Schedule Control<br />
performance<br />
Headway<br />
Maximum (Peak Hour) End-to-End Travel Time (min) 43 min 88 EB, 100 WB 44 min<br />
Uncongested End-to-End Travel Time (min) 34 min<br />
Average Speed in Peak Hour (mph) 11.2 mph 17.4 mph EB, 15.3 mph WB<br />
Average Uncongested Speed (mph) 14.1 mph<br />
% Travel Time Reduction in Corridor Before vs. After BRT 10% 33%<br />
% Travel Time Reduction in Corridor Compared to Local Bus 5% 20% 33%<br />
Survey <strong>of</strong> Customer Travel Times No Yes Yes, rated excellent
Running Way (mi)<br />
Exhibit 3-5: BRT Elements by System and Travel Time (cont’d)<br />
Ottawa <strong>Transit</strong>way York<br />
BRT Elements and System Performance<br />
95 96 97 VIVA Blue VIVA Purple<br />
On-Street Mixed Lanes 2.1 2.1 2.1 20.3 17.1<br />
On-Street Exclusive Bus Lanes<br />
Off-Street Mixed Lanes 3.2 13.1 5.2<br />
Off-Street Reserved Lanes 8.7 3.8 1.2<br />
At-Grade <strong>Transit</strong>ways 12.0 8.2 9.8<br />
Some bus-only<br />
intersection lanes<br />
Some bus-only<br />
intersection lanes<br />
Grade-Separated <strong>Transit</strong>ways<br />
Queue Jumpers<br />
station<br />
Location On- and <strong>of</strong>f-street On- and <strong>of</strong>f-street On- and <strong>of</strong>f-street On- and <strong>of</strong>f-street On- and <strong>of</strong>f-street<br />
Passing Capability<br />
iTs<br />
Bus pullouts Bus pullouts Bus pullouts Bus pullouts Bus pullouts<br />
<strong>Transit</strong> Vehicle Prioritization<br />
Intelligent Vehicle Systems<br />
service plan<br />
TSP TSP TSP TSP TSP<br />
Route Type All-Stop Limited Stop Limited Stop<br />
Average Station Spacing (mi) 0.95 1.20 0.60 1.10 1.00<br />
Method <strong>of</strong> Schedule Control<br />
performance<br />
Schedule Schedule Schedule Schedule Schedule<br />
Maximum (Peak Hour) End-to-End Travel Time (min) 65 75 59 74 67<br />
Uncongested End-to-End Travel Time (min) 65 72 54 52 48<br />
Average Speed in Peak Hour (mph) 22.0 19.0 16.0 17.0 16.0<br />
Average Uncongested Speed (mph)<br />
% Travel Time Reduction in Corridor Before vs. After BRT<br />
% Travel Time Reduction in Corridor Compared to Local Bus<br />
25.0 23.0 20.0 22.0 21.0<br />
Survey <strong>of</strong> Customer Travel Times Rated improved Rated improved<br />
3-17
BRT Elements and System Performance<br />
3-18<br />
Exhibit 3-5: BRT Elements by System and Travel Time (cont’d)<br />
Bogotá Guayaquil Pereira<br />
Transmilenio Metrovia Megabus<br />
Running Way (mi)<br />
On-Street Mixed Lanes<br />
On-Street Exclusive Bus Lanes<br />
Off-Street Mixed Lanes<br />
Off-Street Reserved Lanes<br />
At-Grade <strong>Transit</strong>ways<br />
Grade-Separated <strong>Transit</strong>ways<br />
Queue Jumpers<br />
station<br />
52.0 10.0 17.0<br />
Location Off-street Off-street Off-street<br />
Passing Capability<br />
iTs<br />
<strong>Transit</strong> Vehicle Prioritization<br />
Intelligent Vehicle Systems<br />
service plan<br />
Bus pullouts<br />
Route Type<br />
Trunk-feeder<br />
(all-stop, express along trunk)<br />
Trunk-feeder<br />
(all-stop along trunk)<br />
Trunk-feeder<br />
(all-stop, limited, and express along trunk)<br />
Average Station Spacing (mi)<br />
Method <strong>of</strong> Schedule Control<br />
performance<br />
Maximum (Peak Hour) End-to-End Travel Time (min)<br />
Uncongested End-to-End Travel Time (min)<br />
0.40 0.28 0.46<br />
Average Speed in Peak Hour (mph) 14 - 16 14.0 13.0<br />
Average Uncongested Speed (mph)<br />
% Travel Time Reduction in Corridor Before vs. After BRT<br />
% Travel Time Reduction in Corridor Compared to Local Bus<br />
Survey <strong>of</strong> Customer Travel Times<br />
14 - 16 14.0 13.0
Running Way (mi)<br />
Exhibit 3-5: BRT Elements by System and Travel Time (cont’d)<br />
BRT Elements and System Performance<br />
Amsterdam Caen Edinburgh Eindhoven<br />
Zuidtangent Tram on Wheels Fastlink Phileas - Western Corridor<br />
On-Street Mixed Lanes 1.9 1.9 2.2<br />
On-Street Exclusive Bus Lanes 6.2 9.2 2.2<br />
Off-Street Mixed Lanes 2.5<br />
Off-Street Reserved Lanes<br />
At-Grade <strong>Transit</strong>ways<br />
Grade-Separated <strong>Transit</strong>ways<br />
Queue Jumpers<br />
station<br />
14.9 0.1 0.9 7.2<br />
Location<br />
Passing Capability<br />
iTs<br />
On- and <strong>of</strong>f-street On- and <strong>of</strong>f-street On- and <strong>of</strong>f-street<br />
<strong>Transit</strong> Vehicle Prioritization TSP<br />
Intelligent Vehicle Systems<br />
service plan<br />
Precision docking Precision docking Precision docking Not being used<br />
Route Type Limited express All-stop All-stop All-stop<br />
Average Station Spacing (mi)<br />
Method <strong>of</strong> Schedule Control<br />
performance<br />
0.9-1.2 0.2-0.25 0.2-0.25 0.34<br />
Maximum (Peak Hour) End-to-End Travel Time (min)<br />
Uncongested End-to-End Travel Time (min)<br />
Average Speed in Peak Hour (mph)<br />
30 3.2 (guideway segment)<br />
Average Uncongested Speed (mph) 23.5 12.5 13.0<br />
% Travel Time Reduction in Corridor Before vs. After BRT<br />
% Travel Time Reduction in Corridor Compared to Local Bus<br />
Survey <strong>of</strong> Customer Travel Times<br />
70% average in PM for guideway segment<br />
3-19
BRT Elements and System Performance<br />
3-20<br />
Exhibit 3-5: BRT Elements by System and Travel Time (cont’d)<br />
Leeds London Rouen Utrecht<br />
Superbus Crawley TEOR Busway<br />
Running Way (mi)<br />
On-Street Mixed Lanes 11.2 8.7 3.5<br />
On-Street Exclusive Bus Lanes<br />
Off-Street Mixed Lanes<br />
Off-Street Reserved Lanes<br />
3.8 3.7 2.0<br />
At-Grade <strong>Transit</strong>ways<br />
Grade-Separated <strong>Transit</strong>ways<br />
Queue Jumpers<br />
station<br />
2.2 0.9 14.9 4.8<br />
Location<br />
Passing Capability<br />
iTs<br />
On- and <strong>of</strong>f-street On- and <strong>of</strong>f-street On- and <strong>of</strong>f-street On- and <strong>of</strong>f-street<br />
<strong>Transit</strong> Vehicle Prioritization TSP TSP TSP<br />
Intelligent Vehicle Systems<br />
service plan<br />
Precision docking Precision docking Precision docking<br />
Route Type Trunk-feeder All-stop All-stop All-stop<br />
Average Station Spacing (mi)<br />
Method <strong>of</strong> Schedule Control<br />
performance<br />
0.25 0.33<br />
Maximum (Peak Hour) End-to-End Travel Time (min)<br />
Uncongested End-to-End Travel Time (min)<br />
Average Speed in Peak Hour (mph)<br />
Up to 30% reduction in journey times<br />
Average Uncongested Speed (mph) 12.5 10.3<br />
% Travel Time Reduction in Corridor Before vs. After BRT<br />
% Travel Time Reduction in Corridor Compared to Local Bus<br />
Survey <strong>of</strong> Customer Travel Times<br />
3 min outbound, up to 11<br />
min inbound<br />
70% average in PM for<br />
guideway segment
Exhibit 3-5: BRT Elements by System and Travel Time (cont’d)<br />
BRT Elements and System Performance<br />
Adelaide Brisbane Sydney<br />
North East Busway South East Busway Inner Northern Busway<br />
Liverpool-Parramatta<br />
T-Way<br />
Running Way (mi)<br />
On-Street Mixed Lanes<br />
On-Street Exclusive Bus Lanes<br />
Off-Street Mixed Lanes<br />
Off-Street Reserved Lanes<br />
At-Grade <strong>Transit</strong>ways<br />
Grade-Separated <strong>Transit</strong>ways<br />
Queue Jumpers<br />
station<br />
7.46 10.3 1.7 13.0<br />
Location Off-street Off-street Off-street On- and <strong>of</strong>f-street<br />
Passing Capability<br />
iTs<br />
Passing at interchanges Bus pullouts Bus pullouts Bus pullouts<br />
<strong>Transit</strong> Vehicle Prioritization Passive priority TSP<br />
Intelligent Vehicle Systems<br />
service plan<br />
Precision docking<br />
Route Type<br />
All-stop express/semi<br />
express<br />
All-stop & express, including<br />
express to CBD with no stops<br />
All-stop All-stop<br />
Average Station Spacing (mi)<br />
Method <strong>of</strong> Schedule Control<br />
performance<br />
3.10 1.00 0.41 0.54<br />
Maximum (Peak Hour) End-to-End Travel Time (min) 29 (TTP to city) 21 21 64<br />
Uncongested End-to-End Travel Time (min) 23 (TTP to city) 20 20 60<br />
Average Speed in Peak Hour (mph) 15.5 / 25 (TTP to city) 29.3/47.1 5.5 18<br />
Average Uncongested Speed (mph) 17.3 / 28 (TTP to city) 30.8/49.5 5.8 19<br />
% Travel Time Reduction in Corridor Before vs. After BRT 40% (approx) 65% in peak 0<br />
% Travel Time Reduction in Corridor Compared to Local Bus 66%<br />
Survey <strong>of</strong> Customer Travel Times No Yes Yes No<br />
3-21
BRT Elements and System Performance<br />
3-22<br />
Running Way (mi)<br />
Exhibit 3-5: BRT Elements by System and Travel Time (cont’d)<br />
North-West T-Way -<br />
Blacktown-Parklea<br />
Sydney Beijing Kunming<br />
North-West T-Way - Parramatta-Rouse<br />
Hill<br />
Line 1 BRT Busway Network<br />
On-Street Mixed Lanes<br />
On-Street Exclusive Bus Lanes<br />
Off-Street Mixed Lanes<br />
Off-Street Reserved Lanes<br />
At-Grade <strong>Transit</strong>ways<br />
24.9<br />
Grade-Separated <strong>Transit</strong>ways<br />
Queue Jumpers<br />
station<br />
4.4 8.7<br />
8.1<br />
Location Off-street On- and <strong>of</strong>f-street Off-street<br />
Passing Capability<br />
iTs<br />
Bus pullouts Bus pullouts Multiple lanes<br />
<strong>Transit</strong> Vehicle Prioritization<br />
Intelligent Vehicle Systems<br />
service plan<br />
TSP<br />
Route Type All-stop All-stop All-stop All-stop<br />
Average Station Spacing (mi)<br />
Method <strong>of</strong> Schedule Control<br />
performance<br />
0.42 0.50 .57<br />
Maximum (Peak Hour) End-to-End Travel Time (min) 20 38 37<br />
Uncongested End-to-End Travel Time (min) 17 38<br />
Average Speed in Peak Hour (mph) 14.0 16.8 14.9 9.4<br />
Average Uncongested Speed (mph) 16.4 16.8<br />
% Travel Time Reduction in Corridor Before vs. After BRT<br />
% Travel Time Reduction in Corridor Compared to Local Bus<br />
Survey <strong>of</strong> Customer Travel Times<br />
38% Speeds up 68%
station dwell Time<br />
description <strong>of</strong> station dwell Time<br />
Station dwell time represents the second major component <strong>of</strong> end-to-end travel<br />
time (in addition to running time). Station dwell time is the amount <strong>of</strong> time<br />
spent by passengers while a vehicle is stopped at a station. The dwell time represents<br />
the time required for the vehicle to load and unload passengers at the<br />
transit station. The report on “Operational Analysis <strong>of</strong> Bus Lanes on Arterials”<br />
states that station dwell time can comprise as much as 30 percent (a significant<br />
share) <strong>of</strong> total travel times for transit. It also states that dwell time can also make<br />
up to as much as 40 percent <strong>of</strong> total delay time depending on the level <strong>of</strong> congestion.<br />
Dwell time depends on:<br />
number <strong>of</strong> passengers boarding or alighting per door channel - higher passenger<br />
loads at stations increase dwell time while multiple places to board<br />
and alight disperses these loads, thereby reducing dwell time<br />
fare collection system—processing fares upon boarding directly increases<br />
loading times; pre-processing fares and/or reducing transaction times on<br />
vehicles can reduce loading times<br />
vehicle occupancy—congestion inside the vehicle requires extra time to<br />
load and unload passengers<br />
Effects <strong>of</strong> BRT Elements on station dwell Time<br />
The BRT elements that impact station dwell time most strongly are discussed<br />
below.<br />
Stations - Curb Design<br />
Level platforms minimize the “gap” between the BRT vehicle floor and the station platform<br />
edge, greatly speeding the boarding and alighting process. No-gap, level vehicle, floor-to-platform<br />
boarding and alighting has the added benefit <strong>of</strong> permitting wheelchair users to board and<br />
alight BRT vehicles without a lift, ramp, or assistance from a vehicle operator, thereby eliminating<br />
the time spent deploying ramps or lifts.<br />
Raised curbs achieve some <strong>of</strong> the benefits <strong>of</strong> level platforms without the need for precision<br />
docking but require extra time for ramp deployment for the mobility impaired.<br />
Stations—Platform Layout<br />
Platform layouts that do not constrain the number <strong>of</strong> vehicles, specifically extended platforms<br />
(with or without assigned berths) that can load and unload passengers, decrease the amount<br />
<strong>of</strong> time vehicles spend at stations waiting in vehicle queues.<br />
Vehicles—Vehicle Configuration<br />
BRT Elements and System Performance<br />
Vehicle configurations with low floors (whether conventional standard, stylized standard,<br />
conventional articulated, or stylized articulated) facilitate boarding and alighting, especially<br />
<strong>of</strong> mobility impaired groups—persons with disabilities, the elderly, children, and persons with<br />
packages. For low-floor vehicles, passenger service times could be reduced 20 percent for boarding<br />
times, 15 percent for front alighting times, and 15 percent for rear alighting times.<br />
Specialized BRT vehicles with 100 percent low-floor vehicles have the great advantage <strong>of</strong> shorter<br />
boarding and alighting times and the ability to place an additional door behind the rear axle.<br />
Vehicles—Passenger Circulation Enhancement<br />
All types <strong>of</strong> passenger circulation facilitate lower dwell times.<br />
Additional door channels (with wider and more numerous doors) can dramatically reduce the<br />
time for passengers to board and alight. BRT systems that incorporate some form <strong>of</strong> secure, nondriver<br />
involved fare collection (on-board conductor-validated system, <strong>of</strong>f-board barrier system,<br />
or <strong>of</strong>f-board barrier-free system) can take advantage <strong>of</strong> multiple-door boarding.<br />
Vehicles that include an alternative seat layout with wider aisles in the interior also reduce<br />
dwell times, especially when there are significant standing loads, by reducing passenger congestion<br />
within the vehicle and reducing time for boarding and alighting.<br />
Although a small percentage <strong>of</strong> passengers board in wheelchairs, the dwell times for these customers<br />
can be significant. The typical wheelchair-lift cycle times range from 60 to 200 seconds<br />
per boarding for high-floor buses (including time to secure the wheelchair). With a low-floor<br />
bus, the typical wheelchair ramp cycle time ranges from 30 to 60 seconds per boarding, which<br />
includes time to secure the wheelchair. Enhanced wheelchair securement devices are being<br />
developed and can reduce dwell times further; the extent <strong>of</strong> the impact is still being measured.<br />
Fare Collection—Fare Collection Process<br />
Fare collection processes that allow multiple door boarding and do not require the involvement<br />
<strong>of</strong> the driver (on-board conductor-validated, <strong>of</strong>f-board barrier-enforced, or <strong>of</strong>f-board barrier-free/pro<strong>of</strong>-<strong>of</strong>-payment)<br />
can provide significant reductions in boarding times.<br />
Fare Collection—Fare Media and Payment Options<br />
For options where fare transactions take place on the vehicle, the fare transaction media has<br />
additional impacts on station dwell time. Compared to fare collection by a driver using exact<br />
change, flash pass systems or electronic systems using tickets or passes can reduce passenger<br />
boarding time by 13 percent from an average <strong>of</strong> 3.5 to 4 seconds per passenger. Smart card<br />
technologies are most effective in this respect; magnetic stripe card technologies are less effective.<br />
ITS—Intelligent Vehicle Systems<br />
Precision docking has the potential to reduce station dwell times for two reasons: it allows<br />
all passengers, especially the mobility impaired, to board and alight without climbing up and/<br />
or down stairs, and some BRT systems (e.g., Bogotá Transmilenio) use systems that ensure that<br />
vehicles stop in the same location, thus ensuring orderly queuing for boarding.<br />
3-23
BRT Elements and System Performance<br />
Service and Operations Plan—Service Frequency<br />
Increasing service frequency reduces the number <strong>of</strong> passengers that can accumulate at the<br />
station, reducing the time associated with loading them.<br />
Service and Operations Plan—Method <strong>of</strong> Schedule Control<br />
Headway-based schedule control makes headways more regular, ensuring even loads and<br />
loading times.<br />
performance <strong>of</strong> Existing systems<br />
Several BRT systems have demonstrated low dwell times compared to conventional<br />
bus transit. This section characterizes this experience in three sections: a<br />
summary <strong>of</strong> relevant research, pr<strong>of</strong>iles <strong>of</strong> noteworthy experience, and a summary<br />
<strong>of</strong> BRT systems and the characteristics that affect dwell time, as well as any<br />
available performance data.<br />
Research Summary<br />
Several studies performed for conventional transit service suggest how implementation<br />
<strong>of</strong> certain BRT elements can achieve dwell time savings.<br />
Exhibit 3-6 highlights typical passenger service times for a standard floor bus.<br />
Exhibit 3-7 shows loading times as a function <strong>of</strong> available door channels. Increasing<br />
the number <strong>of</strong> door channels available for loading reduces loading time. This<br />
is critical where the number <strong>of</strong> passengers at stations is high.<br />
3-24<br />
Exhibit 3-6: Passenger Service Times by Floor Type<br />
<strong>Transit</strong> Agency<br />
Boarding Times (sec) Alighting Times (sec)<br />
Low-Floor High-Floor Low-Floor High-Floor<br />
Ann Arbor<br />
Transportation Authority<br />
Revenue: Cash 3.09 3.57 1.32 2.55<br />
No Cash 1.92 2.76 2.17 2.67<br />
Shuttle: No Fare 1.91 2.26 Not reported Not reported<br />
Victoria Regional <strong>Transit</strong> 3.02 3.78 1.87 3.61<br />
System<br />
2.13 1.84<br />
Vancouver Regional<br />
<strong>Transit</strong> System<br />
St. Albert <strong>Transit</strong><br />
N/A<br />
3.78<br />
N/A<br />
2.62<br />
1.43<br />
Single Boarding 3.61 4.27<br />
Two Boarding 6.15 7.27 Not reported Not reported<br />
Senior Boarding 3.88 6.10<br />
Kitchner <strong>Transit</strong> 2.23 2.42 1.16 1.49<br />
Source: Bus Rapid <strong>Transit</strong>: Case Studies in Bus Rapid <strong>Transit</strong>, Chapter 6.<br />
Exhibit 3-7: Multiple Channel Passenger Service Times per Total<br />
Passenger with a High-Floor Bus (sec/passenger)<br />
Available Door Channels Boarding Front Alighting Rear Alighting<br />
1 2.5 3.3 2.1<br />
2 1.5 1.8 1.2<br />
3 1.1 1.5 0.9<br />
4 0.9 1.1 0.7<br />
6 0.6 0.7 0.5<br />
Source: <strong>Transit</strong> Capacity and Quality <strong>of</strong> Service Manual, 2nd Edition<br />
The <strong>Transit</strong> Capacity and Quality <strong>of</strong> Service Manual, 2 nd Edition estimates the<br />
average boarding times per passenger for a conventional single-door boarding
us fare collection system where the operator(s) enforces fare payment. These<br />
are shown in Exhibit 3-8.<br />
Exhibit 3-8: Bus Passenger Service Times (sec/passenger)<br />
Fare Payment Method Observed Range<br />
Pre-payment (e.g., passes, no fare,<br />
free transfer, pay on exit)<br />
BOARDING<br />
Default (Single-Door<br />
Boarding)<br />
2.25–2.75 2.5<br />
Smart card 3.0–3.7 3.5<br />
Single ticket or token 3.4–3.6 3.5<br />
Exact change 3.6–4.3 4.0<br />
Swipe or dip card 4.2 4.2<br />
ALIGHTING<br />
Rear door 1.4–2.7 2.1<br />
Front door 2.6–3.7 3.3<br />
Note: Add 0.5 sec to boarding times if standees are present on the bus. Subtract 0.5 sec/ passenger from<br />
boarding times and 1.0 seconds/passenger from front-door alighting times on low-floor buses.<br />
Sources: <strong>Transit</strong> Capacity and Quality <strong>of</strong> Service Manual, 2nd Edition, p. 4-5; “BRT Implementation<br />
Guidelines,” Table 8-7.<br />
The <strong>Transit</strong> Quality <strong>of</strong> Service Manual indicates that pro<strong>of</strong>-<strong>of</strong>-payment systems<br />
can provide up to a 38 percent reduction in boarding times, with commensurate<br />
reductions in dwell times as well. Multiple-door channels for boarding and<br />
alighting can reduce passenger service times even further, to a fraction <strong>of</strong> other<br />
fare collection approaches. For example, two-, three-, four-, and six-door channels<br />
can reduce the 2.5 seconds per total passenger required to board under<br />
complete pre-paid fare system to 1.5, 1.1, 0.9, and 0.6 seconds per total passenger<br />
boarding at a particular stop, respectively (<strong>Transit</strong> Capacity and Quality <strong>of</strong> Service<br />
Manual, 2nd Edition, Exhibit 4-2).<br />
System Performance Pr<strong>of</strong>iles<br />
Transmilenio, Bogotá<br />
The Transmilenio in Bogotá uses multiple BRT elements to achieve an extremely<br />
short station dwell time <strong>of</strong> 0.33 seconds per passenger. Station platforms are the<br />
same height as the floor <strong>of</strong> the buses, stations feature one to five platforms and<br />
BRT Elements and System Performance<br />
one or two access points, buses have four large left-side doors that are coordinated<br />
with the station doors, and fare collection occurs at the station entrance<br />
using pre-paid contactless smart card technology.<br />
The prepaid farecards can be purchased only inside the stations, which can cause<br />
queuing problems and create congestion in the station area. Placing fare machines<br />
outside the stations would reduce wait times to purchase or reload cards<br />
(“Report on South American Bus Rapid <strong>Transit</strong> Field Visits: Tracking the Evolution<br />
<strong>of</strong> the TransMilenio Model: Final Report: December 2007” and “Applicability<br />
<strong>of</strong> Bogotá’s TransMilenio BRT System to the United States, Final Report”).<br />
MAX, Las Vegas and TEOR, Rouen<br />
Both the MAX system in Las Vegas and the TEOR system in Rouen, France utilize<br />
an optical guidance precision docking system. This system, in combination<br />
with vehicle floor-height station platforms, provides level, no-gap boarding and<br />
alighting, thus greatly reducing station dwell times. The MAX reports average<br />
dwell times <strong>of</strong> just 15 to 20 seconds, while the TEOR reports an average dwell<br />
time <strong>of</strong> 6.3 seconds. (Note that the Las Vegas MAX optical guidance system is<br />
no longer operational.)<br />
<strong>Transit</strong>way, Ottawa<br />
In a demonstration project between 1982 and 1984, Ottawa’s transit agency,<br />
OC Transpo, replaced standard 40-ft buses with 60-ft articulated buses on one<br />
route and introduced a pro<strong>of</strong>-<strong>of</strong>-payment (POP) fare collection scheme. Under<br />
this POP fare collection scheme, passengers with valid passes or transfers (about<br />
68 percent <strong>of</strong> riders on the route) could board at any <strong>of</strong> the three doors <strong>of</strong> the<br />
articulated bus. Prior to POP implementation, the bus operator enforced fare<br />
payment on this route, and all passenger boardings took place only at the front<br />
door.<br />
The demonstration project showed that POP implementation yielded better<br />
performance through improvements in schedule adherence and on-time performance.<br />
Average dwell times for the articulated buses were reduced by an estimated<br />
13 to 21 percent, based on dwell time survey data. Average bus running<br />
times were reduced by about 2 percent. There was no evidence that POP implementation<br />
increased the fare evasion rate. Due to the increased capacity <strong>of</strong> the<br />
articulated buses, OC Transpo was able to substitute two articulated buses for<br />
three standard buses on the route, realizing benefits from fewer driver hours and<br />
reduced operating costs.<br />
3-25
BRT Elements and System Performance<br />
BRT Elements by System and Station Dwell Time<br />
Exhibit 3-9 presents a summary <strong>of</strong> BRT elements that affect station dwell time<br />
from 35 cities with BRT systems. It also presents performance results, calculated<br />
as mean station dwell times.<br />
A focus on reducing dwell times is not yet standard among BRT systems in North<br />
America. This partly reflects the dominance <strong>of</strong> on-street curbside lane operations,<br />
which may limit the ability to implement features that reduce dwell time<br />
such as level boarding, <strong>of</strong>f-board fare collection, and extended berthing platforms.<br />
As a result, many BRT systems in the U.S., especially those that operate on<br />
arterial streets, still load and unload passengers in the same fashion as conventional<br />
bus service, yielding minimal dwell time reductions. The increasing introduction<br />
<strong>of</strong> smart card and magnetic swipe fare media for on-board fare collection<br />
throughout U.S. transit systems should help to reduce dwell times for these<br />
arterial BRT systems; agencies in Boston, Chicago, Honolulu, Miami, and Oakland<br />
have incorporated smart cards or magnetic swipe cards as part <strong>of</strong> systemwide<br />
implementations. Moreover, some agencies are implementing <strong>of</strong>f-board fare collection<br />
for arterial BRT; for example, the VIVA, which operates in Ontario’s York<br />
Region, uses pro<strong>of</strong>-<strong>of</strong>-payment <strong>of</strong>f-board fare collection even though it currently<br />
runs in on-street curbside lanes.<br />
In addition, the greater use <strong>of</strong> low-floor buses will help to reduce boarding time<br />
by reducing the height differential between the curb and bus. Almost all U.S.<br />
BRT systems are currently served by low-floor buses.<br />
Variations in the fare payment process can yield dwell time reductions. For example,<br />
Pittsburgh’s busways follow a policy <strong>of</strong> collecting fares on trips away from<br />
downtown at the destination station. Passengers thus board through all doors in<br />
downtown, speeding up the service as it travels through downtown. Orlando’s<br />
LYMMO operates with no fares, allowing passengers to enter and exit through<br />
all doors. The Las Vegas MAX, the Los Angeles Metro Orange Line, the Eugene<br />
EmX, and the Cleveland HealthLine are the only BRT systems in the U.S. that use<br />
<strong>of</strong>f-board fare payment, multiple-door boarding, and level or raised platforms as<br />
part <strong>of</strong> a comprehensive design to reduce dwell times. The Las Vegas MAX and<br />
Cleveland HealthLine also incorporate guidance equipment to help achieve level<br />
boarding (although the Las Vegas optical guidance system is not in use).<br />
By contrast, use <strong>of</strong> alternative fare collection processes, especially <strong>of</strong>f-board systems,<br />
is more common outside the U.S. Many conventional bus operations that<br />
have relatively less expensive labor costs, such as in Latin America, use on-board<br />
conductor-validated systems, thereby eliminating the involvement <strong>of</strong> the driv-<br />
3-26<br />
er. Off-board fare collection processes are common among systems with high<br />
volumes <strong>of</strong> passenger loads at stations. Off-board barrier-enforced systems are<br />
common in Latin America (Curitiba, Bogotá and Pereira, Quito and Guayaquil)<br />
and are being introduced in Beijing. The Transmilenio in Bogotá boasts an impressively-low<br />
0.33 seconds per passenger for dwell time. Off-board barrier-free<br />
systems are common in Canada (OC Transpo’s <strong>Transit</strong>way in Ottawa and York<br />
Region’s VIVA) and Europe (several systems in the Netherlands and France). Several<br />
systems demonstrate consistently low average station dwell times as a result,<br />
including the Zuidtangent in Amsterdam (10-15 seconds total dwell time), the<br />
Western Corridor in Eindhoven (10 seconds total dwell time), and TEOR routes<br />
in Rouen (6.3 seconds total dwell time).<br />
Only 10 cities provided data on their BRT systems’ mean station dwell time, and<br />
the data reflect with various factors, including total station dwell time, dwell<br />
time per passenger, and as a percentage <strong>of</strong> total trip time. As a result, it is not<br />
possible to draw broad conclusions about the effect <strong>of</strong> individual BRT elements<br />
on dwell times. Systems that provided data incorporate either level to near-level<br />
boarding or standard platforms with multiple vehicle platform lengths. Rouen,<br />
Las Vegas, Pittsburgh, Bogotá, Eindhoven, and Amsterdam each have level or<br />
raised-platform boarding, while Adelaide, Brisbane, Miami, and Ottawa use standard<br />
boarding but feature platforms that can accommodate three, four, or five<br />
buses at a time.<br />
Most <strong>of</strong> these 10 cities use <strong>of</strong>f-board fare collection or pro<strong>of</strong>-<strong>of</strong>-payment-enforced<br />
on-board collection. The exceptions are the two U.S. systems in Miami<br />
and Pittsburgh, and Brisbane, which also reports the longest dwell time <strong>of</strong> these<br />
systems—180 seconds. Most, but not all, employ high service frequency—headways<br />
<strong>of</strong> five minutes or less—but there was no obvious correlation between frequency<br />
level and reduced dwell time. Finally, <strong>of</strong> the six systems with the lowest<br />
reported dwell times, Rouen, Las Vegas, Eindhoven, Amsterdam, and Adelaide all<br />
use some form <strong>of</strong> precision docking; the exception is Bogotá.
Exhibit 3-9: BRT Elements by System and Station Dwell Time<br />
BRT Elements and System Performance<br />
Albuquerque Boston Silver Line Chicago Cleavland<br />
Rapid Ride<br />
Washington<br />
Street<br />
Waterfront<br />
Western Avenue<br />
Express<br />
Irving Park<br />
Express<br />
Garfield<br />
Express<br />
HealthLine<br />
Stations<br />
Curb Design Standard curb Standard curb Standard curb Standard curb Standard curb Standard curb Level platform<br />
Platform Layout<br />
(# vehicles accommodated)<br />
Vehicles<br />
1 1<br />
1 above ground,<br />
3 underground<br />
1 1 1 1<br />
Configuration Articulated Stylized articulated Articulated<br />
Conventional<br />
standard<br />
Stylized articulated Articulated Articulated<br />
Floor Height<br />
Fare Collection<br />
Low Step low Low High Low Low Low<br />
Fare Collection Process Pay on-board Pay on-board<br />
Fare Media and Payment Options Cash, paper<br />
Cash, paper<br />
transfers, magnetic<br />
stripe, smart card<br />
Barrier at 3<br />
underground<br />
stations; others<br />
are Pay On-<br />
Board<br />
Cash, paper<br />
ticket, smart<br />
card<br />
Pay on-board Pay on-board Pay on-board Off-board<br />
Cash, paper,<br />
magnetic stripe<br />
Cash, paper,<br />
magnetic stripe<br />
Cash, paper,<br />
magnetic stripe<br />
ITS<br />
Intelligent Vehicle Systems<br />
Service Plan<br />
Peak Service Frequency (min) 11 4 10 9 11 12 15<br />
Method <strong>of</strong> Schedule Control<br />
Performance<br />
Mean Dwell Time (sec)<br />
Schedule Schedule Schedule Schedule Schedule Schedule<br />
3-27
BRT Elements and System Performance<br />
3-28<br />
Exhibit 3-9: BRT Elements by System and Station Dwell Time (cont’d.)<br />
Eugene Honolulu Kansas City Las Vegas Los Angeles Los Angeles<br />
EmX<br />
City<br />
Express A<br />
City<br />
Express B<br />
County<br />
Express C<br />
MAX<br />
North Las<br />
Vegas MAX<br />
Orange Line Metro Rapid<br />
(All Routes)<br />
Stations<br />
Curb Design Raised curb Standard curb Standard curb Standard curb Raised curb 8" curb Standard curb<br />
Platform Layout<br />
(# vehicles accommodated)<br />
Vehicles<br />
1 1 1 1 1 1 3 1<br />
Configuration Articulated Articulated Standard Articulated<br />
Stylized<br />
conventional<br />
Stylized<br />
articulated<br />
Stylized<br />
articulated<br />
Stylized standard<br />
and articulated<br />
Floor Height<br />
Fare Collection<br />
Low Low High Low Low Low Low Low floor<br />
Fare Collection Process None Pay on-board Pay on-board Pay on-board Pay on-board<br />
Pro<strong>of</strong>-<strong>of</strong>paymentPro<strong>of</strong>-<strong>of</strong>payment<br />
Tickets from<br />
Pay on-board<br />
Fare Media and Payment Options<br />
ITS<br />
None<br />
Cash, paper,<br />
magnetic stripe<br />
Cash, paper,<br />
magnetic stripe<br />
Cash, paper,<br />
magnetic stripe<br />
Magnetic stripe<br />
TVM and<br />
standard<br />
paper passes<br />
Cash and paper<br />
passes<br />
Intelligent Vehicle Systems<br />
Service Plan<br />
Precision<br />
Docking<br />
-<br />
Peak Service Frequency (min) 10 15 15 30 9 12 4 2-10<br />
Method <strong>of</strong> Schedule Control<br />
Performance<br />
Schedule Schedule Schedule Schedule Schedule Headway Headway<br />
Mean Dwell Time (sec) 15 to 20
Stations<br />
Curb Design<br />
Platform Layout<br />
(# vehicles accommodated)<br />
Vehicles<br />
Configuration<br />
Exhibit 3-9: BRT Elements by System and Station Dwell Time (cont’d.)<br />
BRT Elements and System Performance<br />
Miami Oakland Orlando Phoenix Phoenix Phoenix Phoenix<br />
Busway<br />
Standard<br />
curb<br />
Rapid San Pablo<br />
Corridor<br />
LYMMO<br />
RAPID I-10<br />
East<br />
RAPID I-10<br />
West<br />
RAPID SR-51 RAPID I-17<br />
Standard curb Standard curb Standard curb Standard curb Standard curb Standard curb<br />
3 1 2 1 1 1 1<br />
Conventional<br />
standard and<br />
minis<br />
Stylized standard<br />
Conventional<br />
standard<br />
Stylized standard Stylized standard Stylized standard<br />
Stylized<br />
standard<br />
Floor Height<br />
Fare Collection<br />
Step low Step low Low Step low Step low Step low Step low<br />
Fare Collection Process Pay on-board Pay on-board Free Pay on-board Pay on-board Pay on-board Pay on-board<br />
Fare Media and Payment Options<br />
ITS<br />
Cash, paper,<br />
magnetic<br />
stripe<br />
Cash, paper, smart<br />
card<br />
Cash, paper Cash, paper Cash, paper Cash, paper<br />
Intelligent Vehicle Systems<br />
Service Plan<br />
Collision warning Collision warning Collision warning<br />
Collision<br />
warning<br />
Peak Service Frequency (min) 6 12 5 10 10 10 10<br />
Method <strong>of</strong> Schedule Control Schedule Schedule Headway Schedule Schedule Schedule Schedule<br />
Performance 2004 data 2004 data 2004 data 2004 data 2004 data<br />
Mean Dwell Time (sec) 45-60 45-60 45-60 45-60 45-60<br />
3-29
BRT Elements and System Performance<br />
3-30<br />
Exhibit 3-9: BRT Elements by System and Station Dwell Time (cont’d.)<br />
Pittsburgh Pittsburgh Pittsburgh Sacramento San Jose Halifax<br />
East Busway South Busway West Busway E-Bus Rapid 522 Metro<strong>Link</strong><br />
Stations<br />
Curb Design Raised curb Raised curb Raised curb Standard curb Standard curb<br />
Platform Layout<br />
(# vehicles accommodated)<br />
Vehicles<br />
2 2<br />
Configuration<br />
Conventional standard<br />
and articulated<br />
Conventional standard<br />
and articulated<br />
Conventional standard<br />
and articulated<br />
Standard<br />
Stylized standard and<br />
articulated<br />
Stylized standard<br />
Floor Height<br />
Fare Collection<br />
High High High Low Low Low<br />
Fare Collection Process Pay on-board Pay on-board Pay on-board Pay on-board Pay on-board Pay on-board<br />
Fare Media and Payment Options<br />
ITS<br />
Cash, paper Cash, paper Cash, paper Cash, passes<br />
Cash, paper passes,<br />
(smart cards in<br />
development)<br />
Cash, ticket,<br />
passes<br />
Intelligent Vehicle Systems<br />
Service Plan<br />
Collision warning Collision warning Collision warning<br />
Peak Service Frequency (min) 0.58 1.33 15 min 15 10<br />
Method <strong>of</strong> Schedule Control Schedule Schedule Schedule Headway<br />
Performance 2004 data<br />
Mean Dwell Time (sec)<br />
35 at inner stations, 47-60<br />
at outer stations
Exhibit 3-9: BRT Elements by System and Station Dwell Time (cont’d.)<br />
BRT Elements and System Performance<br />
Ottawa <strong>Transit</strong>way York Bogotá Guayaquil Pereira<br />
95 96 97 VIVA Blue VIVA Purple Transmilenio Metrovia Megabus<br />
Stations<br />
Curb Design Standard curb Standard curb Standard curb Standard curb Standard curb Level platform Level Platform Level Platform<br />
Platform Layout<br />
(# vehicles accommodated)<br />
Vehicles<br />
3 3 3 1 1 2 - 5 1- 2<br />
Configuration Articulated Standard Articulated Articulated Standard Stylized articulated<br />
Stylized standard<br />
and articulated<br />
Stylized<br />
articulated<br />
Floor Height<br />
Fare Collection<br />
14.5 - 16”<br />
11.5” kneeling<br />
14.5 - 16”<br />
11.5” kneeling<br />
14.5 - 16”<br />
11.5” kneeling<br />
Low Low 0.9 m 0.9 m<br />
Fare Collection Process<br />
Pro<strong>of</strong>-<strong>of</strong>paymentPro<strong>of</strong>-<strong>of</strong>paymentPro<strong>of</strong>-<strong>of</strong>paymentPro<strong>of</strong>-<strong>of</strong>paymentPro<strong>of</strong>-<strong>of</strong>payment<br />
Barrier (verify at<br />
station entrances /<br />
exits)<br />
Barrier<br />
Barrier (verify<br />
at station<br />
entrances)<br />
Fare Media and Payment Options<br />
ITS<br />
Intelligent Vehicle Systems<br />
Service Plan<br />
Cash, paper<br />
tickets, passes<br />
Cash, paper<br />
tickets, passes<br />
Cash, paper<br />
tickets, passes<br />
Paper tickets,<br />
passes<br />
Paper tickets,<br />
passes<br />
Smart cards<br />
Cash, smart<br />
cards<br />
Smart cards<br />
Peak Service Frequency (min) 3-4 3-6 12 5 10 1-3 4-6 –3-5<br />
Method <strong>of</strong> Schedule Control<br />
Performance<br />
Schedule Schedule Schedule Schedule Schedule<br />
Mean Dwell Time (sec)<br />
4-11% <strong>of</strong> total<br />
trip time for<br />
4-11% <strong>of</strong> total<br />
trip time for<br />
4-11% <strong>of</strong> total<br />
trip time for<br />
0.33 per passenger<br />
system<br />
system<br />
system<br />
3-31
BRT Elements and System Performance<br />
3-32<br />
Stations<br />
Exhibit 3-9: BRT Elements by System and Station Dwell Time (cont’d.)<br />
Amsterdam Caen Edinburgh Eindhoven Leeds London Rouen Utrecht<br />
Zuidtangent<br />
Tram on<br />
Wheels<br />
Fastlink<br />
Phileas -<br />
Western<br />
Corridor<br />
Curb Design Level platform Level platform Level platform Level platform<br />
Platform Layout<br />
(# vehicles accommodated)<br />
Vehicles<br />
Configuration Articulated Bi-articulated<br />
Standard single<br />
and double<br />
deck<br />
Superbus Crawley TEOR Busway<br />
Level platform,<br />
raised curb<br />
Articulated, Standard Stylized articulated<br />
Standard curb Level platform Level platform<br />
Stylized standard<br />
and articulated<br />
Floor Height<br />
Fare Collection<br />
Low Low Low Low Low Low Low Low<br />
Fare Collection Process<br />
Fare Media and Payment Options<br />
ITS<br />
Intelligent Vehicle Systems<br />
Pay on-board<br />
or pro<strong>of</strong>-<strong>of</strong>payment<br />
Paper<br />
(Strippenkart)<br />
Precision<br />
docking<br />
Pay on-board<br />
or pro<strong>of</strong>-<strong>of</strong>payment<br />
Smart cards,<br />
magnetic tickets<br />
Precision<br />
docking<br />
Pay on-board<br />
or pro<strong>of</strong>-<strong>of</strong>payment<br />
Cash coin<br />
(exact change)<br />
or smart card<br />
Precision<br />
docking<br />
Pro<strong>of</strong>-<strong>of</strong>payment,<br />
pay on-board<br />
machine,<br />
no driver<br />
payment<br />
Paper<br />
(Strippenkart)<br />
Not being<br />
used<br />
Pay on-board Pay on-board Off-board<br />
Cash and paper<br />
only<br />
Precision<br />
docking<br />
Cash Magnetic stripe<br />
Precision docking<br />
Precision<br />
docking<br />
Stylized<br />
articulated<br />
Pay on-board<br />
or pro<strong>of</strong>-<strong>of</strong>payment<br />
Paper<br />
(Strippenkart)<br />
Service Plan<br />
Peak Service Frequency (min)<br />
Method <strong>of</strong> Schedule Control<br />
Performance<br />
7.5 - 8<br />
3-6 (where<br />
routes overlap)<br />
3 8 2-8 10 3 2-4<br />
Mean Dwell Time (sec) 10-15l 10 6.3
Exhibit 3-9: BRT Elements by System and Station Dwell Time (cont’d.)<br />
BRT Elements and System Performance<br />
Adelaide Brisbane Sydney Beijing Kunming<br />
North East<br />
Busway<br />
South East<br />
Busway<br />
Inner<br />
Northern<br />
Busway<br />
Liverpool-<br />
Parramatta<br />
T-Way<br />
North-West<br />
T-Way -<br />
Blacktown-<br />
Parklea<br />
North-West<br />
T-Way -<br />
Parramatta-Rouse<br />
Hill<br />
Line 1 BRT<br />
Busway<br />
network<br />
Stations<br />
Curb Design Standard curb Standard curb Standard curb Standard curb Standard curb Standard curb Level platform Standard curb<br />
Platform Layout<br />
(# vehicles accommodated)<br />
Vehicles<br />
3- and 4-bus<br />
length<br />
Standard 4<br />
max 5<br />
Standard 4<br />
max 5<br />
Standard 2<br />
max 6<br />
Standard 2<br />
4 at termini<br />
60 m platform<br />
length<br />
Configuration<br />
Standard<br />
articulated,<br />
standard rigid<br />
Standard rigid Standard rigid Standard rigid Standard rigid Standard rigid Articulated Standard<br />
Floor Height<br />
Fare Collection<br />
Step high, step<br />
low<br />
Pay on-board<br />
Mainly step low,<br />
some step high<br />
Mainly step<br />
low, some step<br />
high<br />
Step low Step high Step high, step low Low High<br />
Fare Collection Process<br />
(80% pre-pay<br />
multi-rider<br />
ticket)<br />
Pay on-board Pay on-board Pay on-board Pay on-board Pay on-board<br />
Pay attendants at<br />
station<br />
Pay on-board<br />
Fare Media and Payment Options<br />
ITS<br />
Cash, paper<br />
magnetic stripe<br />
Cash, paper<br />
magnetic stripe<br />
Cash, paper<br />
magnetic<br />
stripe<br />
Cash, paper<br />
magnetic<br />
stripe<br />
Cash, paper<br />
magnetic stripe<br />
Cash, paper magnetic<br />
stripe<br />
Cash, smart<br />
cards<br />
Cash, IC cards<br />
Intelligent Vehicle Systems<br />
Service Plan<br />
Precision<br />
docking<br />
Peak Service Frequency (min)<br />
Method <strong>of</strong> Schedule Control<br />
Performance<br />
1.1<br />
16-sec headway<br />
at Buranda<br />
Station<br />
4.6 10.0 8.6 4.0<br />
Mean Dwell Time (sec) 30 180 180<br />
3-33
BRT Elements and System Performance<br />
Wait Time and Transfer Time<br />
description <strong>of</strong> Wait Time and Transfer Time<br />
Wait time is the amount <strong>of</strong> time a passenger spends at a station before boarding<br />
a particular transit service. Because passengers perceive wait time as more <strong>of</strong> a<br />
burden than time spent in a moving vehicle (as much as three times a burden),<br />
reducing wait time is an important aspect <strong>of</strong> designing a BRT service. BRT systems<br />
<strong>of</strong>ten are planned such that the service (especially the trunk line, all-stops<br />
service) is frequent enough during peak periods so customers without a schedule<br />
can arrive randomly and still experience brief waits.<br />
Transfer time represents the amount <strong>of</strong> time passengers spend transferring from<br />
one BRT service to another or to other transit services (e.g., local bus routes and<br />
rail). Reducing the time required to travel within the station from one vehicle to<br />
the next and the time spent waiting for the second service reduce this element<br />
<strong>of</strong> travel time.<br />
Effects <strong>of</strong> BRT Elements on Wait Time and Transfer Time<br />
Service frequency and reliability are the primary determinants <strong>of</strong> wait time,<br />
although other elements such as passenger information systems affect the perception<br />
<strong>of</strong> wait time. In addition to those factors that affect wait time, primary<br />
factors affecting transfer time are station physical design and transit route<br />
network design.<br />
Stations—Station Location<br />
The design <strong>of</strong> stations can facilitate lower transfer times, walking distances, and fewer level<br />
changes. Off-street, on-line stations with highway rights-<strong>of</strong>-way increase transfer time to connecting<br />
transit service.<br />
ITS—Operations Management<br />
An automated scheduling and dispatch system along with transit vehicle tracking ensures<br />
even headways (for lower wait times) and connection protection for those passengers transferring<br />
among systems or vehicles. <strong>Transit</strong> vehicle tracking also enables the passenger information<br />
to be collected and disseminated.<br />
3-34<br />
ITS—Passenger Information<br />
Real-time passenger information systems do not directly impact wait time. However, by providing<br />
current information on the status <strong>of</strong> the approaching vehicles, real-time passenger information<br />
systems allow passengers to adjust their wait time expectations or spend their wait<br />
time in other activities, reducing the burden that passengers associate with waiting. Trip itinerary<br />
planning and traveler information on person (through PDAs or mobile phones) give<br />
passengers advance information on closest stations, next vehicle arrival, and required transfers.<br />
Traveler information on vehicles and traveler information at stations can inform passengers<br />
on next vehicle arrival and can direct passengers to the correct location for transfers (berth or<br />
platform position.)<br />
Service and Operations Plan—Service Frequency<br />
Service frequency is the key determinant <strong>of</strong> wait time and transfer time. Since BRT systems can<br />
cost-effectively use (smaller) standard-size vehicles, the operation <strong>of</strong> a trunk line can support<br />
higher frequencies <strong>of</strong> service.<br />
Service and Operations Plan—Route Structure<br />
BRT route structures that incorporate multiple route types converging onto a common trunk<br />
can increase the number and types <strong>of</strong> services available to transit passengers at high-volume stations.<br />
Multiple routes traveling the same corridor increase the frequency along the corridor and<br />
reduce the amount <strong>of</strong> time waiting for BRT service. BRT route networks also can be constructed<br />
to eliminate transfer time altogether. Routes can combine local feeder and BRT trunk service,<br />
eliminating the need to disembark at the station and transfer for passengers who access the<br />
transit network at locations away from the primary BRT route.<br />
Service and Operations Plan—Method <strong>of</strong> Schedule Control<br />
For high frequency services, headway-based scheduling can regulate headways and reduce<br />
spikes in waiting time due to vehicle bunching.<br />
performance <strong>of</strong> Existing systems<br />
System Performance Pr<strong>of</strong>iles<br />
Several systems suggest how BRT elements can reduce wait times and transfer<br />
times.<br />
Orange Line, Los Angeles<br />
In October 2005, the Los Angeles Metropolitan Transportation Authority (Metro)<br />
opened the Orange Line, one <strong>of</strong> the first systems in the U.S. to incorporate a<br />
comprehen
sive set <strong>of</strong> BRT features. The Orange Line primarily operates on a dedicated busway<br />
with high-capacity articulated buses, substantial stations, near-level boarding,<br />
<strong>of</strong>f-board fare payment, and headway-based schedules. Metro incorporated<br />
several features that reduce wait and transfer times, as well as customer perceptions<br />
<strong>of</strong> wait time. On weekdays, buses run at four- to six-minute headways<br />
during peak hours, and every 10 minutes <strong>of</strong>f-peak. This frequency means that<br />
passengers do not need to consult a schedule before heading to a station to<br />
catch a bus, reducing both actual passenger wait time and the frustration that<br />
can result from waiting. To further reduce passenger perception <strong>of</strong> wait time, the<br />
stations feature real-time bus information signs. The stations also can accommodate<br />
multiple bus arrivals, which helps avoid the problem <strong>of</strong> bus bunching<br />
that can result from very short headways. Metro also timed the Orange Line<br />
schedule to coordinate with the schedule <strong>of</strong> the Red Line subway in an effort to<br />
ease transfers to the subway at the Orange Line’s Hollywood Station eastern terminus.<br />
The connection to the subway occurs at street level, however, requiring<br />
passengers to walk a short distance and cross some vehicle traffic.<br />
South Busway, Miami<br />
The Miami Busway is a two-lane, at-grade, bus-only roadway adjacent to US 1.<br />
The 13-mile busway was implemented in two phases; the first 8.5 miles <strong>of</strong> the<br />
busway opened in 1997, and the final 4.5 mile segment opened in late 2007. The<br />
at-grade busway passes through many signalized intersections and terminates at<br />
a Metrorail station. Nine bus routes operate on all or part <strong>of</strong> the busway. There<br />
are three busway-only routes: Busway Local, which serves all stops; Busway Flyer,<br />
a limited-stop super-express service; and Busway MAX, a semi-express or skipstop<br />
service. The other regular lines use the busway for a portion <strong>of</strong> their route.<br />
Since all nine routes converge onto the same busway trunk, they provide a very<br />
high combined frequency during AM and PM peak times <strong>of</strong> 29-30 vehicles per<br />
hour, making wait time low. The Dadeland South Intermodal Metrorail Station<br />
<strong>of</strong>fers a seamless connection between rail and busway passengers, although passengers<br />
must exit the Metrorail fare area to access the busway bays for boarding<br />
and alighting.<br />
London Bus (Non-BRT)<br />
In London, England, an evaluation <strong>of</strong> the London Transport Countdown System<br />
(a real-time bus arrival information system) revealed that 83 percent <strong>of</strong> those<br />
surveyed believed that time passed more quickly by having the real-time information<br />
system at the stop. Also, 65 percent <strong>of</strong> those surveyed felt they waited a<br />
BRT Elements and System Performance<br />
shorter time, with the average perceived wait time dropping from 12 minutes to<br />
8.5 minutes, a 28 percent reduction.<br />
BRT Elements by System and Wait Time and Transfer Time<br />
Exhibit 3-10 presents those characteristics that affect the time associated with<br />
waiting for transit service and transferring between services for BRT systems in<br />
35 cities worldwide. Performance measures include the following:<br />
average wait and transfer time<br />
percent <strong>of</strong> passengers requiring a transfer<br />
customer perception <strong>of</strong> wait time and transfer time<br />
Few systems report such data, so it is difficult to make broad conclusions about<br />
the impact <strong>of</strong> specific BRT elements on wait and transfer times, but some trends<br />
can be noted. As expected, systems where the frequency was improved and<br />
spacing between vehicles was regulated yielded positive passenger ratings <strong>of</strong><br />
wait time. In addition, integrated networks such as Pittsburgh’s busways resulted<br />
in reduced wait time along trunk segments and reduced time associated with<br />
transferring. Many passengers do not have to transfer at all, while passengers<br />
who do still transfer report improvements in the ease <strong>of</strong> transferring.<br />
Overall, the most frequent tools to reduce wait and transfer time, as well as passenger<br />
perceptions <strong>of</strong> wait time, are passenger information systems and frequency<br />
<strong>of</strong> service. Most <strong>of</strong> the U.S. systems either have bus arrival information at the<br />
stations and on the vehicles or are planning to implement these features. They<br />
also have much shorter headways than typical local bus service. Almost all <strong>of</strong><br />
the U.S. systems feature peak headways <strong>of</strong> under 12 minutes, with three others<br />
<strong>of</strong>fering 15-minute headways. In systems in other parts <strong>of</strong> the world, passenger<br />
information and high frequency are also the primary elements for reducing wait<br />
and transfer times. The headways are typically much shorter than the U.S. systems.<br />
About two-thirds feature headways under 6 minutes, while most <strong>of</strong> the<br />
remaining systems have 6- to 10-minute headways.<br />
3-35
BRT Elements and System Performance<br />
3-36<br />
Stations<br />
Exhibit 3-10: BRT Elements by System and Wait Time and Transfer Time<br />
Albuquerque Boston Silver Line Chicago Chicago Chicago Cleveland Eugene<br />
Rapid Ride<br />
Washington<br />
Street<br />
Waterfront<br />
Western<br />
Avenue<br />
Express<br />
Irving Park<br />
Express<br />
Garfield<br />
Express<br />
Location On-street On-street On- and <strong>of</strong>f-street On-street On-street On-street On-street<br />
ITS<br />
HealthLine EmX<br />
On-street,<br />
transit center<br />
Automatic Vehicle Location (AVL) GPS GPS<br />
GPS, dead reckoning<br />
in tunnel<br />
GPS GPS<br />
Automatic Scheduling and Dispatch None CAD Yes CAD<br />
Passenger Information<br />
Service Plan<br />
Route Structure<br />
At station, on<br />
vehicle<br />
LED Nextbus<br />
signs<br />
Overlapping<br />
route<br />
VMS at stations<br />
and in-vehicle<br />
LED signs with<br />
schedule info at<br />
stations; vehicles<br />
have public address<br />
and VMS with stop<br />
announcements<br />
New service &<br />
replacing local service<br />
At stations Vehicle, web<br />
Replaced<br />
existing route<br />
Peak Service Frequency (min) 11 4 10 9 11 12 15 10<br />
Replaced<br />
existing route<br />
Method <strong>of</strong> Schedule Control<br />
Performance<br />
Average Wait and Transfer Time<br />
(min)<br />
Schedule Schedule Schedule Schedule Schedule Schedule Schedule<br />
Percent <strong>of</strong> Passengers Requiring a<br />
Transfer<br />
45%<br />
Customer Perception <strong>of</strong> Wait Time<br />
and Transfer Time<br />
60.2% <strong>of</strong><br />
surveyed<br />
passengers rated<br />
Frequency <strong>of</strong><br />
Service above<br />
average or<br />
excellent<br />
59% rated Frequency<br />
<strong>of</strong> Service as above<br />
average or excellent
Exhibit 3-10: BRT Elements by System and Wait Time and Transfer Time (cont’d.)<br />
BRT Elements and System Performance<br />
Honolulu Honolulu Honolulu Kansas City Las Vegas Los Angeles Los Angeles<br />
City<br />
Express A<br />
City<br />
Express B<br />
County<br />
Express C<br />
MAX<br />
North Las<br />
Vegas MAX<br />
Orange Line<br />
Metro Rapid<br />
(All Routes)<br />
Stations<br />
Location On-street On-street On-street On-street On-street Off-street On-street<br />
ITS<br />
Automatic Vehicle Location (AVL) GPS GPS GPS GPS Orbital<br />
Automatic Scheduling and Dispatch CAD/AVL<br />
Passenger Information<br />
Service Plan<br />
Route Structure<br />
Traveler<br />
Information<br />
planned on<br />
vehicles, at<br />
several stations<br />
Overlaps local<br />
route<br />
Traveler<br />
Information<br />
planned on<br />
vehicles, at<br />
several stations<br />
Overlaps local<br />
route<br />
Traveler Information<br />
planned on vehicles, at<br />
several stations<br />
Overlaps local route<br />
Real-time at<br />
all stations,<br />
trip planning<br />
Peak Service Frequency (min) 12<br />
Station,<br />
telephone,<br />
internet,<br />
on-vehicle<br />
electronic<br />
displays<br />
GPS, loop<br />
detectors<br />
Nextbus VMS<br />
GPS, loop<br />
detectors<br />
Nextbus VMS<br />
at stations,<br />
Telephone,<br />
Internet<br />
Replaced<br />
existing route<br />
Method <strong>of</strong> Schedule Control<br />
Performance<br />
Schedule Schedule Schedule Schedule Headway Headway?<br />
Average Wait and Transfer Time<br />
(min)<br />
8 7 7.5 7.8<br />
Percent <strong>of</strong> Passengers Requiring a<br />
Transfer<br />
11% 38% 23%<br />
Passengers<br />
rate Metro<br />
Rapid<br />
Customer Perception <strong>of</strong> Wait Time<br />
and Transfer Time<br />
Frequency at<br />
3.76 out <strong>of</strong><br />
5, compared<br />
to 3.15 for<br />
the former<br />
Limited Bus<br />
3-37
BRT Elements and System Performance<br />
3-38<br />
Exhibit 3-10: BRT Elements by System and Wait Time and Transfer Time (cont’d.)<br />
Miami Oakland Orlando Phoenix Phoenix Phoenix Phoenix<br />
Busway<br />
Rapid San Pablo<br />
Corridor<br />
LYMMO<br />
RAPID I-10<br />
East<br />
RAPID I-10<br />
West<br />
RAPID SR5-1 RAPID I-17<br />
Stations<br />
Location Off-street On-Street Off-street On-street On-street On-street On-street<br />
ITS<br />
Automatic Vehicle Location (AVL) GPS AVL/Wi-Fi Orbital Orbital Orbital Orbital<br />
Automatic Scheduling and Dispatch Yes Yes Yes Yes Yes<br />
Passenger Information<br />
Service Plan<br />
Traveler<br />
Information at<br />
stations and on<br />
vehicle<br />
Real-time arrival at<br />
stations; traveler<br />
info on vehicle and<br />
via PDA<br />
Traveler Information<br />
at stations and on<br />
vehicle; web-based<br />
Real-time arrival<br />
at stations;<br />
on-vehicle<br />
announcements;<br />
PDA and webbased<br />
info.<br />
Real-time arrival<br />
at stations;<br />
on-vehicle<br />
announcements;<br />
PDA and webbased<br />
info.<br />
Real-time arrival<br />
at stations;<br />
on-vehicle<br />
announcements;<br />
PDA and webbased<br />
info.<br />
Real-time arrival at<br />
stations; on-vehicle<br />
announcements;<br />
PDA and webbased<br />
info.<br />
Route Structure<br />
Integrated<br />
network <strong>of</strong><br />
routes<br />
Overlay onto local<br />
route<br />
Replaced local<br />
downtown circulator<br />
Express routes Express routes Express routes Express routes<br />
Peak Service Frequency (min) 10 12 5 10 10 10 10<br />
Method <strong>of</strong> Schedule Control Schedule Schedule Headway Schedule Schedule Schedule Schedule<br />
Performance<br />
Average Wait and Transfer Time<br />
(min)<br />
Percent <strong>of</strong> Passengers Requiring a<br />
Transfer<br />
2004 data<br />
Customer Perception <strong>of</strong> Wait Time<br />
and Transfer Time<br />
44% <strong>of</strong><br />
passengers rate<br />
frequency <strong>of</strong><br />
service as good<br />
or very good<br />
(avg rating =<br />
3.25 out <strong>of</strong> 5)
Exhibit 3-10: BRT Elements by System and Wait Time and Transfer Time (cont’d.)<br />
BRT Elements and System Performance<br />
Pittsburgh Pittsburgh Pittsburgh Sacramento San Jose Halifax<br />
East Busway South Busway West Busway E-Bus Rapid 522 Metro<strong>Link</strong><br />
Stations<br />
Location Off-street Off-street Off-street On- and <strong>of</strong>f-street On- and <strong>of</strong>f-street On- and <strong>of</strong>f-street<br />
ITS<br />
Automatic Vehicle Location (AVL) None GPS AVL<br />
Automatic Scheduling and Dispatch None Trapeze<br />
Automated next stop<br />
None<br />
Passenger Information<br />
Service Plan<br />
On vehicle<br />
announcements,<br />
automated trip<br />
planning through<br />
website<br />
Real-time display<br />
trip planning<br />
Route Structure<br />
Replaced limited<br />
service route<br />
Overlaps local route,<br />
headway based<br />
Overlaps route<br />
Peak Service Frequency (min) 0.58 1.33 15 15 10<br />
Method <strong>of</strong> Schedule Control Schedule Schedule Schedule Headway<br />
Performance 2004 data<br />
Average Wait and Transfer Time<br />
(min)<br />
7 for bus to rail/rail to<br />
bus<br />
Percent <strong>of</strong> Passengers Requiring a<br />
Transfer<br />
22-29% 7%<br />
Customer Perception <strong>of</strong> Wait Time<br />
and Transfer Time<br />
78% <strong>of</strong> passengers<br />
perceived reduced<br />
wait time; 52% <strong>of</strong><br />
passengers reported<br />
that transferring had<br />
gotten easier due to<br />
high frequency <strong>of</strong> EBA<br />
route<br />
3-39
BRT Elements and System Performance<br />
3-40<br />
Stations<br />
Location<br />
ITS<br />
Exhibit 3-10: BRT Elements by System and Wait Time and Transfer Time (cont’d.)<br />
Ottawa <strong>Transit</strong>way York Bogotá Guayaquil Pereira<br />
95 96 97 VIVA Blue VIVA Purple Transmilenio Metrovia Megabus<br />
On- and <strong>of</strong>fstreet<br />
On- and <strong>of</strong>fstreet<br />
On- and <strong>of</strong>fstreet<br />
On- and <strong>of</strong>fstreet<br />
On- and <strong>of</strong>fstreet<br />
Automatic Vehicle Location (AVL) GPS GPS GPS<br />
AVLequipped<br />
AVL-equipped<br />
Automatic Scheduling and Dispatch Yes Yes Yes Yes Yes<br />
Passenger Information Yes Yes Yes<br />
Service Plan<br />
Route Structure<br />
VMS at stops<br />
and on-board<br />
Overlays<br />
locals<br />
VMS at stops<br />
and on-board<br />
Overlays<br />
locals<br />
Off-street Off-street Off-street<br />
Loop detectors,<br />
station sensors<br />
Nextbus displays<br />
at stations<br />
Replaced existing<br />
privatelyoperated<br />
routes<br />
On-board<br />
transponders<br />
Nextbus displays<br />
at stations<br />
Replaced existing<br />
privatelyoperated<br />
routes<br />
On-board<br />
transponders<br />
Nextbus displays<br />
at stations<br />
Replaced existing<br />
privatelyoperated<br />
routes<br />
Peak Service Frequency (min) 3-4 3-6 12 5 10 1-3 4-6 3-5<br />
Method <strong>of</strong> Schedule Control<br />
Performance<br />
Schedule Schedule Schedule Schedule Schedule<br />
Average Wait and Transfer Time<br />
(min)<br />
6:30 6:30<br />
Percent <strong>of</strong> Passengers Requiring a<br />
Transfer<br />
40% for system 40% for system 40% for system 25% 25%<br />
Customer Perception <strong>of</strong> Wait Time<br />
and Transfer Time
Stations<br />
Location<br />
ITS<br />
Exhibit 3-10: BRT Elements by System and Wait Time and Transfer Time (cont’d.)<br />
BRT Elements and System Performance<br />
Amsterdam Caen Edinburgh Eindhoven Leeds London Rouen Utrecht<br />
Zuidtangent<br />
Tram on<br />
Wheels<br />
On- and <strong>of</strong>fstreet<br />
Fastlink<br />
On- and <strong>of</strong>fstreet<br />
Automatic Vehicle Location (AVL) GPS<br />
Automatic Scheduling and Dispatch Yes<br />
Passenger Information<br />
Real-time stop<br />
information,<br />
Real-time at<br />
station/stop,<br />
online journey<br />
Real-time, at<br />
station/stop,<br />
Service Plan<br />
timetabled planner and<br />
timetable<br />
SMS<br />
Route Structure<br />
New city orbital<br />
BRT link with<br />
intermodal links<br />
Peak Service Frequency (min) 7.5-8<br />
Method <strong>of</strong> Schedule Control<br />
Performance<br />
Average Wait and Transfer Time<br />
(min)<br />
Percent <strong>of</strong> Passengers Requiring a<br />
Transfer<br />
Customer Perception <strong>of</strong> Wait Time<br />
and Transfer Time<br />
Two routes<br />
overlapping<br />
in core area<br />
providing high<br />
frequency in<br />
downtown and Y<br />
pattern coverage<br />
north/south <strong>of</strong><br />
downtown<br />
3-6 (where routes<br />
overlap)<br />
Single radial<br />
route linking<br />
periphery to<br />
downtown<br />
Phileas -<br />
Western<br />
Corridor<br />
On- and <strong>of</strong>fstreet<br />
Realtime<br />
stop<br />
information,<br />
timetabled<br />
Two radial<br />
routes<br />
overlapping<br />
in central<br />
area, linking<br />
downtown<br />
with<br />
periphery and<br />
airport<br />
Superbus Crawley TEOR Busway<br />
On- and <strong>of</strong>fstreet<br />
Real-time, at<br />
station/stop,<br />
SMS<br />
Two radial<br />
routes linking<br />
periphery to<br />
downtown<br />
On- and <strong>of</strong>f-street On- and <strong>of</strong>f-street On- and <strong>of</strong>f-street<br />
Timetable at<br />
station/stop<br />
2 north-south<br />
overlapping<br />
routes, Llnks<br />
downtown to<br />
employment<br />
areas to north<br />
(Gatwick) and<br />
south<br />
Real-time stop<br />
information,<br />
timetable<br />
Three radial<br />
routes<br />
overlapping<br />
in central<br />
area, linking<br />
downtown<br />
with hospital,<br />
universities and<br />
peripheral areas<br />
Real-time stop<br />
information,<br />
timetable<br />
Three radial<br />
routes linking<br />
downtown to<br />
periphery<br />
3 8 2-8 10 3 2-4<br />
3-41
BRT Elements and System Performance<br />
3-42<br />
Stations<br />
Exhibit 3-10: BRT Elements by System and Wait Time and Transfer Time (cont’d.)<br />
Adelaide Brisbane Sydney Beijing Kunming<br />
North East<br />
Busway<br />
South East<br />
Busway<br />
Inner<br />
Northern<br />
Busway<br />
Location Off-street Off-street Off-street<br />
ITS<br />
Automatic Vehicle Location (AVL) GPS GPS<br />
Automatic Scheduling and Dispatch<br />
Passenger Information<br />
Service Plan<br />
Route Structure<br />
No real-time at<br />
station/stop or<br />
on vehicle; city<br />
web site has trip<br />
itinerary planning<br />
BRT network<br />
replaced local<br />
routes<br />
Peak Service Frequency (min) 1.1<br />
Method <strong>of</strong> Schedule Control<br />
Performance<br />
Average Wait and Transfer Time<br />
(min)<br />
Percent <strong>of</strong> Passengers Requiring a<br />
Transfer<br />
Customer Perception <strong>of</strong> Wait Time<br />
and Transfer Time<br />
Real-time Info at<br />
stations<br />
BRT network,<br />
overlaid on<br />
existing local<br />
routes<br />
16-sec headway<br />
at Buranda<br />
Station<br />
Real-time Info at<br />
stations<br />
BRT network<br />
replaced local<br />
routes<br />
Low Low Low<br />
Liverpool-<br />
Parramatta<br />
T-Way<br />
On- and <strong>of</strong>fstreet<br />
Loop<br />
detectors<br />
Real-time Info<br />
at stations<br />
BRT network,<br />
overlaid on<br />
existing local<br />
routes<br />
North-<br />
West<br />
T-Way -<br />
Blacktown-<br />
Parklea<br />
North-West<br />
T-Way -<br />
Parramatta-<br />
Rouse Hill<br />
Line 1 BRT<br />
Off-street On- and <strong>of</strong>f-street Off-street<br />
Real-time Info<br />
at terminus<br />
stations only<br />
BRT network,<br />
overlaid on<br />
existing local<br />
routes<br />
Real-time at<br />
stations and on<br />
vehicles<br />
BRT network,<br />
overlaid on<br />
existing local<br />
routes<br />
4.6 10.0 8.6 4.0<br />
Yes<br />
Currently being<br />
implemented<br />
BRT network<br />
replacing existing<br />
routes in busiest<br />
corridors<br />
Busway<br />
Network<br />
BRT network<br />
replacing existing<br />
routes in busiest<br />
corridors<br />
Down 59%
REliaBiliTy<br />
Passengers are attracted to trips with short travel times, but they are more likely<br />
to continue using the service if they can depend on consistent levels <strong>of</strong> service.<br />
Reliability is affected by a number <strong>of</strong> sources <strong>of</strong> uncertainty, including traffic<br />
conditions, route length, recovery times built into the route schedules, number<br />
<strong>of</strong> stops, evenness <strong>of</strong> passenger demand, and the unpredictable use <strong>of</strong> wheelchair<br />
lifts/ramps and vehicle breakdowns due to unforeseen mechanical or nonmechanical<br />
problems.<br />
Some <strong>of</strong> these factors are not within the direct control <strong>of</strong> the transit operator.<br />
Nevertheless, there are many features <strong>of</strong> BRT that improve reliability. In this discussion,<br />
the focus is on three main aspects <strong>of</strong> reliability—running time reliability,<br />
station dwell time reliability, and service reliability. Running time reliability and<br />
station dwell time reliability relate to a system’s ability to meet a schedule or a<br />
specified travel time consistently, while service reliability captures the characteristics<br />
<strong>of</strong> the system that contribute to passengers perception <strong>of</strong> service availability<br />
and dependability.<br />
Running Time Reliability<br />
description <strong>of</strong> Running Time Reliability<br />
Running time reliability is the ability <strong>of</strong> a BRT service to maintain a consistently<br />
high speed to provide customers with consistent travel times.<br />
Effects <strong>of</strong> BRT Elements on Running Time Reliability<br />
Running way characteristics that contribute to reductions in running way travel<br />
time can also improve reliability.<br />
Running Way—Running Way Type (Right-<strong>of</strong>-Way Location, Level <strong>of</strong> Running<br />
Way Priority)<br />
Running way segregation reduces the number <strong>of</strong> unpredictable delays at intersections and along<br />
the running way, reducing the variability <strong>of</strong> the trip times. Reliability is greatest for fully gradeseparated<br />
exclusive running ways since complete segregation effectively eliminates conditions<br />
that cause delay (traffic congestion, intersection signals, turning movements, and exposure to<br />
accidents).<br />
Stations—Passing Capability<br />
BRT Elements and System Performance<br />
Designing stations so vehicles can pass each other allows vehicles that have already completed<br />
loading at the station or that serve routes that bypass the station to continue on their journeys<br />
and maintain their schedule without delay.<br />
ITS—<strong>Transit</strong> Vehicle Prioritization<br />
<strong>Transit</strong> signal priority systems allow a BRT vehicle to maintain its schedule by giving those BRT<br />
vehicles that are behind schedule extra green time.<br />
Signal timing/phasing can give more overall green time to BRT vehicles operating at peak times<br />
in the peak direction.<br />
Station and lane-access control reduce the number <strong>of</strong> illegal vehicles operating on the facility<br />
by restricting access to facilities and stations to authorized BRT vehicles.<br />
ITS—Intelligent Vehicle Systems<br />
Collision warning, lane assist, and precision docking give the BRT vehicle operator added insurance<br />
to operate at consistent speeds regardless <strong>of</strong> traffic condition, thereby ensuring overall<br />
system reliability by maintaining a schedule.<br />
ITS—Operations Management<br />
Automatic vehicle location, automated scheduling and dispatch, and vehicle component<br />
monitoring systems enable a central dispatcher to know exactly what is happening to address<br />
the situation as needed. If there is an incident, such as a mechanical failure, an accident, or congestion,<br />
a central dispatcher can address problems quickly and efficiently, helping ensure the<br />
reliability <strong>of</strong> the service.<br />
Service and Operations Plan—Station Spacing<br />
Spacing stations further apart improves reliability for the same reasons that it improves running<br />
travel time:<br />
Significant distances between stations allow vehicles to travel at a predictable, high speed for<br />
longer periods <strong>of</strong> time.<br />
Serving fewer stations concentrates demand at each station, reducing the opportunities for<br />
variation due to starting and stopping and loading and unloading.<br />
Service and Operations Plan—Route Length<br />
Running time reliability is more possible with shorter route lengths, especially for BRT systems<br />
that have minimal running way segregation.<br />
performance <strong>of</strong> Existing systems<br />
The experience with documenting direct impacts on reliability is limited. Traditionally,<br />
transit planners have focused on other measures <strong>of</strong> performance. Increasingly,<br />
researchers are now focusing on reliability as a significant factor in<br />
attracting customers. This section presents pr<strong>of</strong>iles <strong>of</strong> systems that are good il-<br />
3-43
BRT Elements and System Performance<br />
lustrations <strong>of</strong> achieving reliability and a summary <strong>of</strong> BRT systems’ characteristics<br />
that affect reliability with available performance data.<br />
System Performance Pr<strong>of</strong>iles<br />
Orange Line, Los Angeles<br />
A 2007 study that compared the end-to-end travel time performance <strong>of</strong> the Orange<br />
Line to Metro Rapid’s Ventura Line found that the dedicated guideway provided<br />
greater travel time reliability. The Orange Line runs along a 14-mile dedicated<br />
guideway, while the Ventura Line operates for 16.4 miles in mixed traffic.<br />
The Orange Line also features near-level boarding and <strong>of</strong>f-board fare collection<br />
with multiple-door bus entry; the Metro Rapid Venture Line serves conventional<br />
level curbside bus stops and employs on-board fare collection. Both lines have<br />
traffic signals at cross streets. This study found that, as <strong>of</strong> 2006, average travel<br />
times for the Orange Line were 41 minutes eastbound and 50 minutes westbound,<br />
which was roughly comparable to the Metro Rapid Ventura Line’s travel<br />
times. However, the Orange Line showed the same travel times for each direction<br />
in AM and PM peak periods. The Ventura Line travel times revealed large<br />
variability: AM westbound travel was 44 minutes, compared to 50 minutes in<br />
the afternoon; AM eastbound travel was 45 minutes, compared to 59 minutes in<br />
the afternoon. It appears that, because the Orange Line has its own right-<strong>of</strong>-way,<br />
travel times are more consistent than with Metro Rapid, as Metro Rapid travel<br />
times can be significantly affected by traffic conditions on arterial streets (Vincent<br />
and Callaghan 2004).<br />
Wilshire Boulevard Dedicated Lane Demonstration Project, Los Angeles<br />
The Wilshire Boulevard Dedicated Lane Demonstration Project was implemented<br />
in Spring 2004 during peak-periods (weekdays from 7:00 - 9:00 AM and 4:00<br />
- 7:00 PM). Curb bus-only lanes are in effect in each direction <strong>of</strong> traffic on a<br />
0.9-mile section <strong>of</strong> Wilshire Boulevard between <strong>Federal</strong> and Centinela avenues<br />
in West Los Angeles. Prior to bus lane implementation, curbside parking was allowed,<br />
and Los Angeles Metro buses operated in mixed-flow traffic during the<br />
peak periods.<br />
Four days <strong>of</strong> on-board survey data (two days before project implementation, two<br />
days after implementation) and two months <strong>of</strong> loop detector data (one month<br />
before, one month after) were analyzed to assess the demonstration project’s<br />
impact on bus running times in the segment. Running times were reduced during<br />
each hour <strong>of</strong> the peak period in both directions <strong>of</strong> traffic by an average <strong>of</strong><br />
3-44<br />
about seven percent. Running time reliability (i.e., the range between the 5 th and<br />
95 th percentiles <strong>of</strong> travel time observations) also improved in nearly all times <strong>of</strong><br />
the day, by an average <strong>of</strong> about 17 percent.<br />
Various Operations Management Applications (Non-BRT)<br />
Two technologies that have the largest impact on system reliability include automatic<br />
vehicle location systems and transit signal priority. A vehicle location<br />
system can reduce bus bunching, improve bus spacing, and improve schedule<br />
adherence, resulting in increased system reliability. In Portland, Oregon, bus<br />
spacing improved 36 percent after Tri-Met used vehicle location data to adjust<br />
headway and run times. Also, on-time performance improved from 70 to 83 percent<br />
for one route once vehicle location data were available. Baltimore demonstrated<br />
a 23 percent increase in on-time performance for those buses equipped<br />
with vehicle location technology. In Kansas City, Missouri, on-time performance<br />
improved from 80 to 90 percent, with a 21 percent reduction in late buses and<br />
a 12 percent reduction in early buses after implementing a vehicle location system.<br />
Just as transit signal priority reduces overall travel time, it also can improve system<br />
reliability by reducing vehicle delay and stops. In Phoenix, TSP reduced redlight<br />
delay by 16 percent. However, overall trip times were not reduced since bus<br />
operators operated more slowly to maintain operating schedules and to avoid<br />
arriving at time points early. This is a case where policy decisions impact the effectiveness<br />
<strong>of</strong> a technology and must be taken into account in the operation <strong>of</strong><br />
a BRT system. An evaluation <strong>of</strong> the Toronto TSP system demonstrated a 32 to 50<br />
percent reduction in signal delay for various bus routes.<br />
BRT Elements by System and Running Time Reliability<br />
Exhibit 3-11 provides a summary <strong>of</strong> running time reliability performance <strong>of</strong> BRT<br />
systems in 35 cities. The performance indicators developed to measure running<br />
time reliability include:<br />
Ratio <strong>of</strong> Minimum to Maximum Travel Time - the travel time differential<br />
between peak and non-peak travel times derived by dividing peak hour<br />
travel time by non-peak travel time; the higher the ratio, the greater the<br />
impact <strong>of</strong> peak hour traffic conditions on end-to-end travel times.<br />
Running Time Reliability (Coefficient <strong>of</strong> Variation) - the standard deviation<br />
<strong>of</strong> running time divided by the mean (average) running time.
Survey <strong>of</strong> Customer Perception <strong>of</strong> Reliability - provided if cities have conducted<br />
customer satisfaction surveys.<br />
Running time reliability describes the ability <strong>of</strong> a BRT system to maintain a consistently<br />
high speed. The system characteristics that impact running time—including<br />
running way segregation, ITS, and station spacing - also affect running<br />
time reliability.<br />
Exhibit 3-11 includes running time reliability performance indicators for 40 BRT<br />
routes or lines in 22 cities (several cities operate multiple systems or lines). The<br />
key performance indicator in this table is Ratio <strong>of</strong> Maximum Time to Minimum<br />
Time. As noted above, this figure is determined by dividing the peak-hour endto-end<br />
travel time by the non-peak end-to-end travel time. (As with the running<br />
time analysis, it is important to keep in mind that end-to-end travel time data<br />
will reflect station dwell times as well as running way travel time.) Systems with a<br />
ratio <strong>of</strong> 1.00 indicate that travel times are not impacted by prevailing traffic conditions<br />
and can maintain high and consistent level <strong>of</strong> performance throughout<br />
the service day. A ratio higher than 1:00 indicates that peak travel times are longer<br />
than non-peak, and the higher the ratio, the more variable the travel time.<br />
Not surprisingly, the ratio is typically lower for BRT systems that operate along<br />
dedicated or exclusive lanes than for those systems that operate within a mixedflow<br />
environment. Exhibit 3-11 shows that segregating BRT service from mixedflow<br />
traffic, which is subject to deteriorating levels-<strong>of</strong>-service during peak hours,<br />
allows the service to sustain a higher and more consistent level <strong>of</strong> performance<br />
over the entire service span. Almost all <strong>of</strong> the systems that operate on a segregated<br />
running way have a ratio <strong>of</strong> 1.0 to 1.2. For systems that operate along<br />
mixed-flow lanes, this ratio was typically higher, particularly in regions suffering<br />
from heavy local traffic conditions. For example, three <strong>of</strong> the highest ratios are<br />
the Garfield Express (1.42) in Chicago, the VIVA Blue Line (1.4) in York, Canada,<br />
and the Boston Silver Line Washington Street service (1.5). All three are systems<br />
that operate on major arterial roads that are subject to recurring peak-hour traffic<br />
congestion.<br />
The correlation between running way segregation and reliability is not nearly<br />
as strong as it is for travel time performance. For example, two <strong>of</strong> the best performing<br />
lines are the VIVA Purple Line (1.0) and the Kansas City MAX (1.1). Both<br />
operate in mixed traffic but incorporate transit signal priority and wider station<br />
spacing than typical local service. In addition, there is variability within systems<br />
that is not clearly explained by this data set. For example, the Ottawa 97 line has<br />
BRT Elements and System Performance<br />
a much lower level <strong>of</strong> reliability than the 95 and 96 lines, although they share the<br />
same BRT elements.<br />
Another important difference between running time performance and reliability<br />
performance is that segregated running ways with at-grade intersection crossings<br />
do not appear to suffer a reliability penalty. Two <strong>of</strong> the systems with at-grade<br />
crossings –Miami’s South Dade Busway, and the Los Angeles Orange Line—<strong>of</strong>fer<br />
some <strong>of</strong> the best reliability ratios.<br />
Beyond the running way segregation and priority, there is no clear correlation<br />
between any particular element and reliability. Elements such as station spacing,<br />
route length, and ITS features are associated with varying levels <strong>of</strong> reliability.<br />
There may be two general conclusions to draw from this. First, it seems likely<br />
that it is the combination <strong>of</strong> BRT elements that impact reliability and not any<br />
one in isolation. Second, the impacts may be the result <strong>of</strong> some other factor not<br />
being reflected in this particular data set. For example, a likely factor is the level<br />
<strong>of</strong> traffic congestion experienced in a mixed running way environment. Boston’s<br />
Washington Street line operates for a short time in an extremely congested area<br />
<strong>of</strong> the Central Business District with very narrow streets; by contrast, the VIVA<br />
Purple Line operates in wide streets in a suburban environment. These factors<br />
may play a larger role in the travel time variability than the simple fact <strong>of</strong> mixed<br />
lane operation.<br />
In addition to running time variability, a few cities reported the results <strong>of</strong> surveys<br />
measuring passenger perceptions <strong>of</strong> reliability. Overall, the results <strong>of</strong> these surveys<br />
were positive. Riders <strong>of</strong> BRT lines in Los Angeles, Sacramento, Ottawa, the<br />
York Region, Bogotá, Adelaide, and Brisbane gave their city’s BRT service high<br />
marks for reliability. The results for the Boston Silver Line were mixed. The Waterfront<br />
service was rated highly, with 67 percent <strong>of</strong> passengers rating it above<br />
average or excellent in terms <strong>of</strong> reliability. However, in a 2005 survey, the Washington<br />
Street service only received high marks from 35 percent <strong>of</strong> riders. This<br />
was a major drop from a 2003 survey which found 65 percent <strong>of</strong> riders rating<br />
reliability as above average or better. An FTA evaluation <strong>of</strong> the Silver Line reports<br />
that this drop in passenger satisfaction was due to pilot tests <strong>of</strong> new on-board<br />
electronic fare boxes, which resulted in a significant increase in boarding delays<br />
and travel times.<br />
3-45
BRT Elements and System Performance<br />
3-46<br />
Exhibit 3-11: BRT Elements by System and Running Time Reliability<br />
Albuquerque Boston Silver Line Chicago Cleveland<br />
Rapid Ride<br />
Washington<br />
Street<br />
Waterfront SL1<br />
– Airport<br />
Waterfront SL2 -<br />
BMIP<br />
Western<br />
Avenue<br />
Express<br />
Irving Park<br />
Express<br />
Garfield<br />
Express<br />
HealthLine<br />
Running Way (mi)<br />
On-Street Mixed Lanes 13.1 0.2 3.5 1.2 18.3 9.0 9.4 2.7<br />
On-Street Exclusive Bus Lanes<br />
Off-Street Mixed Lanes<br />
Off-Street Reserved Lanes<br />
At-Grade <strong>Transit</strong>ways<br />
0.7 2.2 4.4<br />
Grade-Separated <strong>Transit</strong>ways 1.0 1.0<br />
Queue Jumpers<br />
Station<br />
No No No No No No No No<br />
Passing Capability<br />
ITS<br />
No No No No No No No No<br />
<strong>Transit</strong> Vehicle Prioritization TSP TSP<br />
Intelligent Vehicle Systems None none<br />
Precision<br />
docking<br />
Automatic Vehicle Location (AVL)<br />
GPS, dead<br />
reckoning in tunnel<br />
GPS, dead reckoning<br />
in tunnel<br />
Automatic Scheduling and Dispatch<br />
Vehicle Component Monitoring System<br />
Service Plan<br />
CAD CAD<br />
Route Length 13.8 2.4 4.5 2.2 18.3 9.0 9.4 7.1<br />
Average Station Spacing (mi) 0.87 0.22 0.56 0.22 0.47 0.50 0.56 0.42<br />
Performance 2004 data 2004 data 2004 data<br />
Ratio <strong>of</strong> Maximum to Minimum<br />
Running Time<br />
1.2 1.5 1.3 1.19 1.42<br />
Running Time Reliability (Coefficient <strong>of</strong><br />
Variation)<br />
0.075 10-20% 10-35%<br />
Survey <strong>of</strong> Customer Perception <strong>of</strong><br />
Reliability<br />
35% rated good<br />
or excellent<br />
67% rated good or<br />
excellent<br />
67% rated good or<br />
excellent
Exhibit 3-11: BRT Elements by System and Running Time Reliability (cont’d.)<br />
Eugene Honolulu Honolulu Honolulu<br />
EmX<br />
City<br />
Express A<br />
City<br />
Express B<br />
County<br />
Express C<br />
Kansas<br />
City<br />
MAX<br />
BRT Elements and System Performance<br />
Las Vegas Los Angeles Los Angeles<br />
North<br />
Las Vegas<br />
MAX<br />
Orange Line<br />
Metro Rapid<br />
(All Routes)<br />
Running Way (mi)<br />
On-Street Mixed Lanes 1.4 19.0 8.0 18 6.0 2.9 1.0 229<br />
On-Street Exclusive Bus Lanes 2.6 4.7<br />
Off-Street Mixed Lanes 3.5<br />
Off-Street Reserved Lanes 17.5<br />
At-Grade <strong>Transit</strong>ways<br />
Grade-Separated <strong>Transit</strong>ways<br />
13.5<br />
Queue Jumpers<br />
Station<br />
Yes No No<br />
Passing Capability<br />
ITS<br />
No No<br />
Passing lane at each<br />
in-line station<br />
<strong>Transit</strong> Vehicle Prioritization Yes Yes TSP TSP<br />
Intelligent Vehicle Systems No<br />
Precision<br />
docking<br />
Automatic Vehicle Location (AVL) GSP GPS GPS GPS GPS Orbital GPS, loop detectors<br />
GPS, loop<br />
detectors<br />
Automatic Scheduling and Dispatch CAD CAD/AVL<br />
Vehicle Component Monitoring System<br />
Service Plan<br />
Yes None None<br />
Route Length 4.0 19.0 8.0 39.0 6.0 7.5 14.5 229.5<br />
Average Station Spacing (mi)<br />
Performance<br />
0.44 0.56 0.29 0.98 0.30 0.75 1.12 0.71<br />
Ratio <strong>of</strong> Maximum to Minimum Running Time<br />
Running Time Reliability (Coefficient <strong>of</strong> Variation)<br />
2.2 1.3 1.2 1.1 1.1 1.1<br />
Survey <strong>of</strong> Customer Perception <strong>of</strong> Reliability Yes, very good Yes, very good<br />
3-47
BRT Elements and System Performance<br />
3-48<br />
Exhibit 3-11: BRT Elements by System and Running Time Reliability (cont’d.)<br />
Miami Oakland Orlando Phoenix Phoenix Phoenix Phoenix<br />
Busway<br />
Rapid San Pablo<br />
Corridor<br />
LYMMO<br />
RAPID I-10<br />
East<br />
RAPID I-10<br />
West<br />
RAPID SR-51 RAPID I-17<br />
Running Way (mi)<br />
On-Street Mixed Lanes<br />
On-Street Exclusive Bus Lanes<br />
Off-Street Mixed Lanes<br />
14.0 6.5 4.8 12.3 8.0<br />
Off-Street Reserved Lanes 14.0 8.0 10.3 11.5<br />
At-Grade <strong>Transit</strong>ways<br />
Grade-Separated <strong>Transit</strong>ways<br />
Queue Jumpers<br />
Station<br />
20.0 3.0<br />
Passing Capability<br />
ITS<br />
Off-street On-street Off-street On-street On-street On-street On-street<br />
<strong>Transit</strong> Vehicle Prioritization TSP<br />
TSP<br />
(1 signal)<br />
TSP<br />
(1 signal)<br />
TSP<br />
(1 signal)<br />
TSP<br />
(1 signal)<br />
Intelligent Vehicle Systems Collision warning Collision warning Collision warning Collision warning<br />
Automatic Vehicle Location (AVL) AVL GPS AVL / wi-fi Orbital Orbital Orbital Orbital<br />
Automatic Scheduling and Dispatch CAD Yes Yes Yes Yes Yes<br />
Vehicle Component Monitoring System<br />
Service Plan<br />
Yes<br />
Route Length 8.0 14.0 3.0 20.5 12.8 22.5 19.5<br />
Average Station Spacing (mi) 0.71 0.56 0.30 1.86 1.59 2.05 1.63<br />
Performance 2004 data 2004 data<br />
Ratio <strong>of</strong> Maximum to Minimum Running Time<br />
1.0 (original 8.5<br />
segment)<br />
1.2<br />
Running Time Reliability (Coefficient <strong>of</strong> Variation)<br />
Survey <strong>of</strong> Customer Perception <strong>of</strong> Reliability<br />
0.9 (90%) 1 (100%) 1 (100%) 1 (100%)
Exhibit 3-11: BRT Elements by System and Running Time Reliability (cont’d.)<br />
BRT Elements and System Performance<br />
Pittsburgh Pittsburgh Pittsburgh Sacramento San Jose Halifax<br />
East Busway South Busway West Busway E-Bus Rapid 522 Metro<strong>Link</strong><br />
Running Way (mi)<br />
On-Street Mixed Lanes 0.4 0.4 8 25 12.1<br />
On-Street Exclusive Bus Lanes 0.5<br />
Off-Street Mixed Lanes 10.6<br />
Off-Street Reserved Lanes<br />
At-Grade <strong>Transit</strong>ways<br />
4<br />
Grade-Separated <strong>Transit</strong>ways<br />
Queue Jumpers<br />
Station<br />
8.7 4.3 4.6<br />
Passing Capability<br />
ITS<br />
Passing lanes Passing lanes Passing lanes<br />
<strong>Transit</strong> Vehicle Prioritization TSP TSP TSP TSP<br />
Intelligent Vehicle Systems Collision warning Collision warning Collision warning<br />
Automatic Vehicle Location (AVL) GPS Yes<br />
Automatic Scheduling and Dispatch<br />
Vehicle Component Monitoring System<br />
Service Plan<br />
Trapeze<br />
Route Length 9.1 4.3 5.0 12.0 25.0 23.2<br />
Average Station Spacing (mi) 1.14 0.54 0.83 0.47 0.86 3.3<br />
Performance 2004 data 2004 data 2004 data<br />
Ratio <strong>of</strong> Maximum to Minimum Running Time 1.1 1.0 1.2 1.3<br />
Running Time Reliability (Coefficient <strong>of</strong> Variation) 0.85<br />
Survey <strong>of</strong> Customer Perception <strong>of</strong> Reliability Yes Yes<br />
3-49
BRT Elements and System Performance<br />
3-50<br />
Exhibit 3-11: BRT Elements by System and Running Time Reliability (cont’d.)<br />
Pittsburgh York Bogotá Guayaquil<br />
95 96 97 VIVA Blue VIVA Purple Transmilenio Metrovia<br />
Running Way (mi)<br />
On-Street Mixed Lanes 2.1 2.1 2.1 20.3 17.1<br />
On-Street Exclusive Bus Lanes<br />
Some bus-only<br />
intersection lanes<br />
Some bus-only<br />
intersection lanes<br />
Off-Street Mixed Lanes 3.2 13.1 5.2<br />
Off-Street Reserved Lanes 8.7 3.8 1.2<br />
At-Grade <strong>Transit</strong>ways<br />
Grade-Separated <strong>Transit</strong>ways<br />
Queue Jumpers<br />
Station<br />
12.0 8.2 9.8 52.0 10.0<br />
Passing Capability<br />
ITS<br />
Bus pullouts Bus pullouts Bus pullouts Bus pullouts Bus pullouts Bus pullouts<br />
<strong>Transit</strong> Vehicle Prioritization<br />
Intelligent Vehicle Systems<br />
TSP TSP TSP TSP TSP<br />
Automatic Vehicle Location (AVL) GPS GPS GPS AVL-equipped AVL-equipped<br />
Loop<br />
detectors,<br />
station sensors<br />
On-board<br />
transponders<br />
Automatic Scheduling and Dispatch Yes Yes Yes Yes Yes<br />
Vehicle Component Monitoring System<br />
Service Plan<br />
Under<br />
development<br />
Under<br />
development<br />
Under<br />
development<br />
Oil temp, oil pressure,<br />
engine temp reported<br />
to control centre<br />
Oil temp, oil pressure,<br />
engine temp reported<br />
to control centre<br />
Route Length 25.9 27.2 18.4 20.3 17.1 52.0 10.0<br />
Average Station Spacing (mi)<br />
Performance<br />
0.95 1.20 0.60 1.10 1.00<br />
Ratio <strong>of</strong> Maximum to Minimum Running Time 1.0 1.1 1.4 1.4 1.0<br />
Running Time Reliability (Coefficient <strong>of</strong> Variation) 4.12 - 4.21 4.46 - 4.47 3.63 - 4.24<br />
Survey <strong>of</strong> Customer Perception <strong>of</strong> Reliability<br />
Yes, 67% <strong>of</strong><br />
riders call<br />
Yes, 67% <strong>of</strong><br />
riders call<br />
Yes, 67% <strong>of</strong><br />
riders call service Yes, rated excellent Yes, rated excellent Yes<br />
service reliable service reliable reliable
Exhibit 3-11: BRT Elements by System and Running Time Reliability (cont’d.)<br />
BRT Elements and System Performance<br />
Pereira Amsterdam Caen Edinburgh Eindhoven Leeds London<br />
Megabus Zuidtangent<br />
Tram on<br />
Wheels<br />
Fastlink<br />
Phileas - Western<br />
Corridor<br />
Superbus Crawley<br />
Running Way (mi)<br />
On-Street Mixed Lanes 1.9 1.9 2.2 11.2<br />
On-Street Exclusive Bus Lanes 6.2 9.2 2.2 3.8 3.7<br />
Off-Street Mixed Lanes<br />
Off-Street Reserved Lanes<br />
2.5<br />
At-Grade <strong>Transit</strong>ways<br />
Grade-Separated <strong>Transit</strong>ways<br />
Queue Jumpers<br />
Station<br />
Passing Capability<br />
ITS<br />
17.0 14.9 0.1 0.9 7.2 2.2 0.9<br />
<strong>Transit</strong> Vehicle Prioritization TSP TSP<br />
Intelligent Vehicle Systems<br />
Precision<br />
docking<br />
Precision<br />
docking<br />
Precision docking Not being used<br />
Precision<br />
docking<br />
Precision<br />
docking<br />
Automatic Vehicle Location (AVL)<br />
On-board<br />
transponders<br />
GPS<br />
Automatic Scheduling and Dispatch<br />
Vehicle Component Monitoring System<br />
Service Plan<br />
Yes<br />
Route Length 17.0 25.5 9.3 5.0 9.4 6.0 15.8<br />
Average Station Spacing (mi)<br />
Performance<br />
0.9-1.2 0.2-0.25 0.2-0.25 0.34 0.25<br />
Ratio <strong>of</strong> Maximum to Minimum Running Time<br />
Running Time Reliability (Coefficient <strong>of</strong> Variation)<br />
Survey <strong>of</strong> Customer Perception <strong>of</strong> Reliability<br />
11.0<br />
3-51
BRT Elements and System Performance<br />
3-52<br />
Exhibit 3-11: BRT Elements by System and Running Time Reliability (cont’d.)<br />
Rouen Utrecht Adelaide Brisbane Sydney<br />
TEOR Busway<br />
North East<br />
Busway<br />
South East<br />
Busway<br />
Inner Northern<br />
Busway<br />
Liverpool-<br />
Parramatta<br />
T-Way<br />
North-West<br />
T-Way -<br />
Blacktown-Parklea<br />
Running Way (mi)<br />
On-Street Mixed Lanes 8.7 3.5<br />
On-Street Exclusive Bus Lanes<br />
Off-Street Mixed Lanes<br />
Off-Street Reserved Lanes<br />
2.0<br />
At-Grade <strong>Transit</strong>ways<br />
Grade-Separated <strong>Transit</strong>ways<br />
Queue Jumpers<br />
Station<br />
14.9<br />
4.8<br />
7.46 10.3 1.7 13.0<br />
4.4<br />
Passing Capability<br />
ITS<br />
Passing at<br />
interchanges<br />
Bus pullouts Bus pullouts Bus pullouts Bus pullouts<br />
<strong>Transit</strong> Vehicle Prioritization TSP TSP Passive priority TSP<br />
Intelligent Vehicle Systems<br />
Precision<br />
docking<br />
Precision<br />
docking<br />
Automatic Vehicle Location (AVL)<br />
Automatic Scheduling and Dispatch<br />
Vehicle Component Monitoring System<br />
Service Plan<br />
GPS GPS Loop detectors<br />
Route Length 23.6 10.3 7.5 10.3 1.7 19.0 4.7<br />
Average Station Spacing (mi)<br />
Performance<br />
0.33 3.10 1.00 0.41 0.54 0.42<br />
Ratio <strong>of</strong> Maximum to Minimum Running Time<br />
Running Time Reliability (Coefficient <strong>of</strong> Variation)<br />
1.3 1.1 1.1 1.1 1.2<br />
Survey <strong>of</strong> Customer Perception <strong>of</strong> Reliability Yes Yes Yes Yes
Exhibit 3-11: BRT Elements by System and Running Time Reliability (cont’d.)<br />
Sydney Beijing Kunming<br />
North-West T-Way -<br />
Parramatta-Rouse Hill<br />
Line 1 BRT Busway Network<br />
Running Way (mi)<br />
On-Street Mixed Lanes<br />
On-Street Exclusive Bus Lanes<br />
Off-Street Mixed Lanes<br />
Off-Street Reserved Lanes 24.9<br />
At-Grade <strong>Transit</strong>ways 8.7<br />
Grade-Separated <strong>Transit</strong>ways<br />
Queue Jumpers<br />
Station<br />
8.1<br />
Passing Capability<br />
ITS<br />
Bus pullouts Multiple lanes<br />
<strong>Transit</strong> Vehicle Prioritization<br />
Intelligent Vehicle Systems<br />
TSP<br />
Automatic Vehicle Location (AVL)<br />
Automatic Scheduling and Dispatch<br />
Vehicle Component Monitoring System<br />
Service Plan<br />
Yes<br />
Route Length 10.6 10.3 24.9<br />
Average Station Spacing (mi)<br />
Performance<br />
0.50<br />
Ratio <strong>of</strong> Maximum to Minimum Running Time<br />
Running Time Reliability (Coefficient <strong>of</strong> Variation)<br />
Survey <strong>of</strong> Customer Perception <strong>of</strong> Reliability<br />
1.0 38% Speeds up 68%<br />
BRT Elements and System Performance<br />
3-53
BRT Elements and System Performance<br />
station dwell Time Reliability<br />
description <strong>of</strong> station dwell Time Reliability<br />
Station dwell time reliability represents the ability for BRT vehicles to consistently<br />
load passengers within a certain dwell time and to minimize the amount <strong>of</strong> time<br />
spent at the station. Passenger loads can vary significantly throughout the day<br />
and even within each peak period. Incorporating BRT elements to accommodate<br />
this significant variation without impacting travel times can improve reliability.<br />
This is especially important, since BRT systems serve corridors and locations with<br />
high transit demand. Lengthy dwell times can affect the overall perception <strong>of</strong> reliability<br />
beyond the actual time spent (The Role <strong>of</strong> <strong>Transit</strong> Amenities and Vehicle<br />
Characteristics in Building <strong>Transit</strong> Ridership, p. 27).<br />
Effects <strong>of</strong> BRT Elements on station dwell Time Reliability<br />
Each <strong>of</strong> the BRT element options that help make station dwell times more reliable<br />
is described below.<br />
Stations—Curb Design<br />
Level platforms or raised curbs facilitate consistent station dwell times by reducing the need<br />
to step up to the vehicle.<br />
Stations—Platform Layout<br />
Extended platforms allow for more than one vehicle to board at a time and reduce the amount<br />
<strong>of</strong> time that vehicles must wait in queues to load passengers.<br />
Vehicles—Vehicle Configuration<br />
To comply with the Americans with Disabilities Act (ADA), a majority <strong>of</strong> vehicles now being<br />
produced in the U.S. have low floors at the doors to facilitate boarding and alighting. Low-floor<br />
vehicles not only speed boarding for general (ambulatory) passengers, they contribute to the<br />
reliability <strong>of</strong> station dwell times when integrated well with station or stop design.<br />
Vehicles—Passenger Circulation Enhancement<br />
In the same way that passenger circulation enhancements reduce dwell time, they also reduce<br />
dwell time variability and enhance reliability. The most dramatic <strong>of</strong> the passenger circulation<br />
enhancements that promote reliability is enhanced wheelchair securement.<br />
Fare Collection—Fare Collection Process<br />
Off-board fare collection processes (barrier-enforced pre-payment systems or pro<strong>of</strong>-<strong>of</strong>payment<br />
systems) eliminate the need for passengers to pay or show passes as they board the<br />
vehicle, allowing for multiple-door boarding and reducing the variability in the time it takes<br />
customers to either produce the required money or the required pass. On-board conductor<br />
validation has a similar effect but with lower magnitude.<br />
3-54<br />
Fare Collection—Fare Media and Payment Options<br />
Electronic fare collection systems and pre-paid instruments can make dwell times more reliable,<br />
primarily by reducing the need for boarding passengers to search for exact change and by<br />
reducing transaction times.<br />
ITS—Intelligent Vehicle Systems<br />
Precision docking systems enable a BRT vehicle operator to precisely place the BRT vehicle a<br />
certain distance from the station platform to eliminate the need for wheelchair ramps.<br />
ITS—Operations Management<br />
<strong>Transit</strong> vehicle tracking enables a central dispatcher to know exactly where a BRT vehicle is and<br />
address problems that may arise while the BRT vehicle is at a station.<br />
Service and Operations Plan—Service Frequency<br />
Increasing service frequency reduces the number <strong>of</strong> passengers that can accumulate at the<br />
station, reducing the time associated with loading them.<br />
Service and Operations Plan—Method <strong>of</strong> Schedule Control<br />
Headway-based schedule control makes headways more regular, ensuring even loads and<br />
loading times.<br />
performance <strong>of</strong> Existing systems<br />
Research Summary<br />
A study <strong>of</strong> boarding times for ambulatory passengers reported the times to be<br />
faster with low-floor buses, from 0.2 to 0.7 seconds. The average boarding time <strong>of</strong><br />
wheelchair passengers was faster with the ramp than with a lift, 27.4 seconds versus<br />
46.4 seconds. While these shorter boarding/alighting times had not resulted<br />
in increases in schedule speed at any <strong>of</strong> the transit agencies interviewed, some<br />
felt that the faster ramp operations made it easier to maintain schedule (dwell<br />
time reliability), particularly when multiple, unpredictable wheelchair boardings<br />
occurred during a run (King 1998).<br />
Typical wheelchair lift cycle times, including the time required to secure the<br />
wheelchair inside the vehicle, are 60 to 200 seconds, while the ramps used in<br />
low-floor buses reduce the cycle times to 30 to 60 seconds (<strong>Transit</strong> Capacity and<br />
Quality <strong>of</strong> Service Manual, 2nd Edition).<br />
Research shows that an emerging application to reduce station dwell times is the<br />
use <strong>of</strong> rear-facing positions for wheelchair securement on transit buses. Securement<br />
<strong>of</strong> wheelchairs on transit buses can take more than three minutes using<br />
conventional securement devices and with the assistance <strong>of</strong> an operator (Hardin
and Foreman 2002). A rear-facing position for wheelchairs is being incorporated<br />
into vehicles at various transit agencies in Europe and Canada and at AC <strong>Transit</strong><br />
in California. Sometimes, they are used in combination with more conventional<br />
forward-facing positions. A survey <strong>of</strong> six transit agencies in Canada suggests that<br />
dwell times can be less than one minute in cases <strong>of</strong> wheelchair loading with the<br />
use <strong>of</strong> rear-facing positions for wheelchairs (Rutenberg and Hemily 2003).<br />
System Performance Pr<strong>of</strong>iles<br />
EmX, Eugene<br />
In January 2007, Lane <strong>Transit</strong> District (LTD) in Eugene, Oregon launched its first<br />
BRT service, the EmX Green Line. The four-mile Green Line uses dedicated busways<br />
and exclusive bus lanes, transit signal priority, enhanced stations, and highcapacity<br />
vehicles. The EmX replaced LTD’s most popular local bus service. In the<br />
first few weeks following the EmX’s launch, average weekday boardings rose by<br />
70 percent, from 2,667 to 4,506. As <strong>of</strong> October 2007, average weekday boardings<br />
were up to 6,200. The EmX employs several features that help ensure short<br />
and consistent station dwell times. The service uses high-capacity vehicles with<br />
multiple-door boarding. Currently, the service is free, so there is no on-board fare<br />
collection to delay boarding. (LTD will implement <strong>of</strong>f-board fare collection with<br />
its next EmX line.) LTD achieves “near-level” boarding through the use <strong>of</strong> raised<br />
platforms and, to mimimize horizontal gaps, the platforms have plastic striping<br />
along the platform edge that allow the drivers to pull in as close as possible<br />
without damaging the vehicle. Drivers also visually line up the vehicle front with<br />
EmX logos painted on the platforms to ensure consistent berthing spots. Finally,<br />
drivers must adhere to a strict schedule for passenger boarding at each station,<br />
closing doors promptly at the scheduled departure time. According to LTD, this<br />
has required a culture change for the drivers who are accustomed to a more<br />
“laid-back” approach to passenger boarding.<br />
BRT Elements by System and Station Dwell Time Reliability<br />
Exhibit 3-12 presents a summary <strong>of</strong> BRT elements that support dwell time reliability<br />
by system and the relevant performance indicator dwell time variability<br />
(Coefficient <strong>of</strong> Variation <strong>of</strong> Station Dwell Times).<br />
The BRT elements that can improve reliability are the same as those that reduce<br />
dwell times. As noted in the section discussing dwell times, in the U.S., the most<br />
commonly-employed element affecting reliability is low-floor vehicles. Most U.S.<br />
systems are now using low-floor buses, which help ease boarding and ensure<br />
consistent dwell times. In addition, most U.S. BRT systems operate at headways<br />
BRT Elements and System Performance<br />
no greater than 12 minutes at peak times. Shorter headways help reliability by<br />
reducing the number <strong>of</strong> passengers attempting to board at any particular schedule<br />
stop. Fewer U.S. systems use the other key factors—<strong>of</strong>f-board fare collection,<br />
multiple-door boarding, and level or near-level boarding.<br />
Only the Cleveland HealthLine, Eugene EmX, Las Vegas MAX, and Los Angeles<br />
Orange Line have incorporated level or near-level boarding, which further reduces<br />
boarding time, especially by allowing direct access for the mobility impaired.<br />
This is a key factor for dwell time reliability because, while the percentage <strong>of</strong> mobility-impaired<br />
passengers may be small, deploying a ramp or other accessibility<br />
device can take several minutes and require the attention <strong>of</strong> the driver. This will<br />
impact dwell time consistency more than it will impact overall dwell times.<br />
These four U.S. systems also have implemented <strong>of</strong>f-board fare collection, multiple-door<br />
boarding, and specialized BRT vehicles with wider aisles for improved<br />
passenger circulation. These features all contribute to dwell time reliability. Outside<br />
the U.S., it is much more common for cities to implement a “suite” <strong>of</strong> BRT<br />
elements designed to improve station dwell times.<br />
3-55
BRT Elements and System Performance<br />
3-56<br />
Exhibit 3-12: BRT Elements by System and Station Dwell Time Reliability<br />
Albuquerque Boston Silver Line Chicago Cleavland<br />
Rapid Ride<br />
Washington<br />
Street<br />
Waterfront<br />
Western Avenue<br />
Express<br />
Irving Park<br />
Express<br />
Garfield<br />
Express<br />
HealthLine<br />
Stations<br />
Curb Design Standard curb Standard curb Standard curb Standard curb Standard curb Standard curb Level platform<br />
Platform Layout<br />
(# vehicles accommodated)<br />
Vehicles<br />
1 1<br />
1 above ground,<br />
3 underground<br />
1 1 1 1<br />
Configuration Articulated Stylized articulated Articulated<br />
Conventional<br />
standard<br />
Stylized articulated Articulated Articulated<br />
Floor Height<br />
Fare Collection<br />
Low Step low Low High Low Low Low<br />
Fare Collection Process Pay on-board Pay on-board<br />
Fare Media and Payment Options Cash, paper<br />
Cash, paper<br />
transfers, magnetic<br />
stripe, smart card<br />
Barrier at 3<br />
underground<br />
stations; others<br />
are Pay On-<br />
Board<br />
Cash, paper<br />
ticket, smart<br />
card<br />
Pay on-board Pay on-board Pay on-board Off-board<br />
Cash, paper,<br />
magnetic stripe<br />
Cash, paper,<br />
magnetic stripe<br />
Cash, paper,<br />
magnetic stripe<br />
ITS<br />
Intelligent Vehicle Systems<br />
Service Plan<br />
Peak Service Frequency (min) 11 4 10 9 11 12 15<br />
Method <strong>of</strong> Schedule Control<br />
Performance<br />
Dwell Time Variability (Coefficient <strong>of</strong><br />
Variation <strong>of</strong> Station Dwell Times)<br />
Schedule Schedule Schedule Schedule Schedule Schedule
Exhibit 3-12: BRT Elements by System and Station Dwell Time Reliability (cont’d.)<br />
BRT Elements and System Performance<br />
Eugene Honolulu Kansas City Las Vegas Los Angeles Los Angeles<br />
EmX<br />
City<br />
Express A<br />
City<br />
Express B<br />
County<br />
Express C<br />
MAX<br />
North Las<br />
Vegas MAX<br />
Orange Line Metro Rapid<br />
(All Routes)<br />
Stations<br />
Curb Design Raised curb Standard curb Standard curb Standard curb Raised curb 8" curb Standard curb<br />
Platform Layout<br />
(# vehicles accommodated)<br />
Vehicles<br />
1 1 1 1 1 1 3 1<br />
Configuration Articulated Articulated Standard Articulated<br />
Stylized<br />
conventional<br />
Stylized<br />
articulated<br />
Stylized<br />
articulated<br />
Stylized standard<br />
and articulated<br />
Floor Height<br />
Fare Collection<br />
Low Low High Low Low Low Low Low floor<br />
Fare Collection Process None Pay on-board Pay on-board Pay on-board Pay on-board<br />
Pro<strong>of</strong>-<strong>of</strong>paymentPro<strong>of</strong>-<strong>of</strong>payment<br />
Tickets from<br />
Pay on-board<br />
Fare Media and Payment Options<br />
ITS<br />
None<br />
Cash, paper,<br />
magnetic stripe<br />
Cash, paper,<br />
magnetic stripe<br />
Cash, paper,<br />
magnetic stripe<br />
Magnetic stripe<br />
TVM and<br />
standard<br />
paper passes<br />
Cash and paper<br />
passes<br />
Intelligent Vehicle Systems<br />
Service Plan<br />
Precision<br />
Docking<br />
-<br />
Peak Service Frequency (min) 10 15 15 30 9 12 4 2-10<br />
Method <strong>of</strong> Schedule Control<br />
Performance<br />
Dwell Time Variability (Coefficient<br />
<strong>of</strong> Variation <strong>of</strong> Station Dwell Times)<br />
Schedule Schedule Schedule Schedule Schedule Headway Headway<br />
3-57
BRT Elements and System Performance<br />
3-58<br />
Stations<br />
Curb Design<br />
Platform Layout<br />
(# vehicles accommodated)<br />
Vehicles<br />
Configuration<br />
Exhibit 3-12: BRT Elements by System and Station Dwell Time Reliability (cont’d.)<br />
Miami Oakland Orlando Phoenix Phoenix Phoenix Phoenix<br />
Busway<br />
Standard<br />
curb<br />
Rapid San Pablo<br />
Corridor<br />
LYMMO<br />
RAPID I-10<br />
East<br />
RAPID I-10<br />
West<br />
RAPID SR-51 RAPID I-17<br />
Standard curb Standard curb Standard curb Standard curb Standard curb Standard curb<br />
3 1 2 1 1 1 1<br />
Conventional<br />
standard and<br />
minis<br />
Stylized standard<br />
Conventional<br />
standard<br />
Stylized standard Stylized standard Stylized standard<br />
Stylized<br />
standard<br />
Floor Height<br />
Fare Collection<br />
Step low Step low Low Step low Step low Step low Step low<br />
Fare Collection Process Pay on-board Pay on-board Free Pay on-board Pay on-board Pay on-board Pay on-board<br />
Fare Media and Payment Options<br />
ITS<br />
Cash, paper,<br />
magnetic<br />
stripe<br />
Cash, paper, smart<br />
card<br />
Cash, paper Cash, paper Cash, paper Cash, paper<br />
Intelligent Vehicle Systems<br />
Service Plan<br />
Collision warning Collision warning Collision warning<br />
Collision<br />
warning<br />
Peak Service Frequency (min) 10 12 5 10 10 10 10<br />
Method <strong>of</strong> Schedule Control<br />
Performance<br />
Dwell Time Variability (Coefficient<br />
<strong>of</strong> Variation <strong>of</strong> Station Dwell Times)<br />
Schedule Schedule Headway Schedule Schedule Schedule Schedule
Exhibit 3-12: BRT Elements by System and Station Dwell Time Reliability (cont’d.)<br />
BRT Elements and System Performance<br />
Pittsburgh Pittsburgh Pittsburgh Sacramento San Jose Halifax<br />
East Busway South Busway West Busway E-Bus Rapid 522 Metro<strong>Link</strong><br />
Stations<br />
Curb Design Raised curb Raised curb Raised curb Standard curb Standard curb<br />
Platform Layout<br />
(# vehicles accommodated)<br />
Vehicles<br />
2 2<br />
Configuration<br />
Conventional standard<br />
and articulated<br />
Conventional standard<br />
and articulated<br />
Conventional standard<br />
and articulated<br />
Standard<br />
Stylized standard and<br />
articulated<br />
Stylized standard<br />
Floor Height<br />
Fare Collection<br />
High High High Low Low Low<br />
Fare Collection Process Pay on-board Pay on-board Pay on-board Pay on-board Pay on-board Pay on-board<br />
Fare Media and Payment Options<br />
ITS<br />
Cash, paper Cash, paper Cash, paper Cash, passes<br />
Cash, paper passes,<br />
(smart cards in<br />
development)<br />
Cash, ticket,<br />
passes<br />
Intelligent Vehicle Systems<br />
Service Plan<br />
Collision warning Collision warning Collision warning<br />
Peak Service Frequency (min) 0.58 1.33 15 min 15 10<br />
Method <strong>of</strong> Schedule Control<br />
Performance<br />
Dwell Time Variability (Coefficient<br />
<strong>of</strong> Variation <strong>of</strong> Station Dwell Times)<br />
Schedule Schedule Schedule Headway<br />
3-59
BRT Elements and System Performance<br />
3-60<br />
Exhibit 3-12: BRT Elements by System and Station Dwell Time Reliability (cont’d.)<br />
Ottawa <strong>Transit</strong>way York Bogotá Guayaquil Pereira<br />
95 96 97 VIVA Blue VIVA Purple Transmilenio Metrovia Megabus<br />
Stations<br />
Curb Design Standard curb Standard curb Standard curb Standard curb Standard curb Level platform Level Platform Level Platform<br />
Platform Layout<br />
(# vehicles accommodated)<br />
Vehicles<br />
3 3 3 1 1 2 - 5 1- 2<br />
Configuration Articulated Standard Articulated Articulated Standard Stylized articulated<br />
Stylized standard<br />
and articulated<br />
Stylized<br />
articulated<br />
Floor Height<br />
Fare Collection<br />
14.5 - 16”<br />
11.5” kneeling<br />
14.5 - 16”<br />
11.5” kneeling<br />
14.5 - 16”<br />
11.5” kneeling<br />
Low Low 0.9 m 0.9 m<br />
Fare Collection Process<br />
Pro<strong>of</strong>-<strong>of</strong>paymentPro<strong>of</strong>-<strong>of</strong>paymentPro<strong>of</strong>-<strong>of</strong>paymentPro<strong>of</strong>-<strong>of</strong>paymentPro<strong>of</strong>-<strong>of</strong>payment<br />
Barrier (verify at<br />
station entrances /<br />
exits)<br />
Barrier<br />
Barrier (verify<br />
at station<br />
entrances)<br />
Fare Media and Payment Options<br />
ITS<br />
Intelligent Vehicle Systems<br />
Service Plan<br />
Cash, paper<br />
tickets, passes<br />
Cash, paper<br />
tickets, passes<br />
Cash, paper<br />
tickets, passes<br />
Paper tickets,<br />
passes<br />
Paper tickets,<br />
passes<br />
Smart cards<br />
Cash, smart<br />
cards<br />
Smart cards<br />
Peak Service Frequency (min) 3-4 3-6 12 5 10 1-3 4-6 3-5<br />
Method <strong>of</strong> Schedule Control<br />
Performance<br />
Dwell Time Variability (Coefficient<br />
<strong>of</strong> Variation <strong>of</strong> Station Dwell Times)<br />
Schedule Schedule Schedule Schedule Schedule
Stations<br />
Exhibit 3-12: BRT Elements by System and Station Dwell Time Reliability (cont’d.)<br />
BRT Elements and System Performance<br />
Amsterdam Caen Edinburgh Eindhoven Leeds London Rouen Utrecht<br />
Zuidtangent<br />
Tram on<br />
Wheels<br />
Fastlink<br />
Phileas -<br />
Western<br />
Corridor<br />
Curb Design Level platform Level platform Level platform Level platform<br />
Platform Layout<br />
(# vehicles accommodated)<br />
Vehicles<br />
Configuration Articulated Bi-articulated<br />
Standard single<br />
and double<br />
deck<br />
Superbus Crawley TEOR Busway<br />
Level platform,<br />
raised curb<br />
Articulated, Standard Stylized articulated<br />
Standard curb Level platform Level platform<br />
Stylized standard<br />
and articulated<br />
Floor Height<br />
Fare Collection<br />
Low Low Low Low Low Low Low Low<br />
Fare Collection Process<br />
Fare Media and Payment Options<br />
ITS<br />
Intelligent Vehicle Systems<br />
Service Plan<br />
Pay on-board<br />
or pro<strong>of</strong>-<strong>of</strong>payment<br />
Paper<br />
(Strippenkart)<br />
Precision<br />
docking<br />
Peak Service Frequency (min) 7.5 - 8<br />
Method <strong>of</strong> Schedule Control<br />
Performance<br />
Dwell Time Variability (Coefficient<br />
<strong>of</strong> Variation <strong>of</strong> Station Dwell Times)<br />
Pay on-board<br />
or pro<strong>of</strong>-<strong>of</strong>payment<br />
Smart cards,<br />
magnetic tickets<br />
Precision<br />
docking<br />
3-6 (where<br />
routes overlap)<br />
Pay on-board<br />
or pro<strong>of</strong>-<strong>of</strong>payment<br />
Cash coin<br />
(exact change)<br />
or smart card<br />
Precision<br />
docking<br />
Pro<strong>of</strong>-<strong>of</strong>payment,<br />
pay on-board<br />
machine,<br />
no driver<br />
payment<br />
Paper<br />
(Strippenkart)<br />
Not being<br />
used<br />
Pay on-board Pay on-board Off-board<br />
Cash and paper<br />
only<br />
Precision<br />
docking<br />
Cash Magnetic stripe<br />
Precision docking<br />
Precision<br />
docking<br />
Stylized<br />
articulated<br />
Pay on-board<br />
or pro<strong>of</strong>-<strong>of</strong>payment<br />
Paper<br />
(Strippenkart)<br />
3 8 2-8 10 3 2-4<br />
3-61
BRT Elements and System Performance<br />
3-62<br />
Exhibit 3-12: BRT Elements by System and Station Dwell Time Reliability (cont’d.)<br />
Adelaide Brisbane Sydney Beijing Kunming<br />
North East<br />
Busway<br />
South East<br />
Busway<br />
Inner<br />
Northern<br />
Busway<br />
Liverpool-<br />
Parramatta<br />
T-Way<br />
North-West<br />
T-Way -<br />
Blacktown-<br />
Parklea<br />
North-West<br />
T-Way -<br />
Parramatta-Rouse<br />
Hill<br />
Line 1 BRT<br />
Busway<br />
network<br />
Stations<br />
Curb Design Standard curb Standard curb Standard curb Standard curb Standard curb Standard curb Level platform Standard curb<br />
Platform Layout<br />
(# vehicles accommodated)<br />
Vehicles<br />
3- and 4-bus<br />
length<br />
Standard 4<br />
max 5<br />
Standard 4<br />
max 5<br />
Standard 2<br />
max 6<br />
Standard 2<br />
4 at termini<br />
60 m platform<br />
length<br />
Configuration<br />
Standard<br />
articulated,<br />
standard rigid<br />
Standard rigid Standard rigid Standard rigid Standard rigid Standard rigid Articulated Standard<br />
Floor Height<br />
Fare Collection<br />
Step high, step<br />
low<br />
Pay on-board<br />
Mainly step low,<br />
some step high<br />
Mainly step<br />
low, some step<br />
high<br />
Step low Step high Step high, step low Low High<br />
Fare Collection Process<br />
(80% pre-pay<br />
multi-rider<br />
ticket)<br />
Pay on-board Pay on-board Pay on-board Pay on-board Pay on-board<br />
Pay attendants at<br />
station<br />
Pay on-board<br />
Fare Media and Payment Options<br />
ITS<br />
Cash, paper<br />
magnetic stripe<br />
Cash, paper<br />
magnetic stripe<br />
Cash, paper<br />
magnetic<br />
stripe<br />
Cash, paper<br />
magnetic<br />
stripe<br />
Cash, paper<br />
magnetic stripe<br />
Cash, paper magnetic<br />
stripe<br />
Cash, smart<br />
cards<br />
Cash, IC cards<br />
Intelligent Vehicle Systems<br />
Service Plan<br />
Precision<br />
docking<br />
Peak Service Frequency (min)<br />
Method <strong>of</strong> Schedule Control<br />
Performance<br />
Dwell Time Variability (Coefficient<br />
<strong>of</strong> Variation <strong>of</strong> Station Dwell Times)<br />
1.1<br />
16-sec headway<br />
at Buranda<br />
Station<br />
4.6 10.0 8.6 4.0
service Reliability<br />
description <strong>of</strong> service Reliability<br />
Service reliability is a qualitative characteristic related to the ability <strong>of</strong> a transit<br />
operation to provide service consistent with its plans and policies and the expectations<br />
<strong>of</strong> its customers. Three aspects <strong>of</strong> a transit operation promote service<br />
reliability:<br />
Availability <strong>of</strong> service options—service<br />
can be so dense and frequent that<br />
a missed or delayed trip results in little degradation <strong>of</strong> service. Passengers<br />
have multiple choices that allow them to respond to unpredictability <strong>of</strong><br />
their own schedules and behavior (e.g., the need to work late or go home<br />
during the middle <strong>of</strong> the day).<br />
Ability to recover from service disruptions—strategies<br />
to quickly respond<br />
to unpredictable delays and disruptions.<br />
Availability <strong>of</strong> “contingency” resources—having<br />
sufficient “back-up” permits<br />
operator to meet its service plan in the face <strong>of</strong> all the uncertainties that<br />
could affect it, e.g., driver illness, traffic, and other unforeseen events.<br />
Effects <strong>of</strong> BRT Elements on service Reliability<br />
The characteristics <strong>of</strong> many BRT elements affect service reliability are discussed<br />
below.<br />
Stations—Passing Capability<br />
Stations with passing lanes, either through bus pullouts or passing lanes at stations, minimize<br />
the risk that delays or incidents affecting one BRT vehicle will result in delays to other vehicles<br />
along the line. Disabled vehicles can pull over to the side <strong>of</strong> the running way or a portion <strong>of</strong> the<br />
station platform while other vehicles are able to pass and still meet their service.<br />
Stations—Platform Layout<br />
Extended platforms allow for flexibility <strong>of</strong> operations in case a vehicle breaks down or experiences<br />
excessively long delays while loading at stations, provided that the running way through<br />
the station allows vehicles to pass.<br />
ITS—<strong>Transit</strong> Vehicle Prioritization<br />
Vehicle prioritization systems can help facilitate bringing a vehicle back to its scheduled position<br />
after a brief interruption or delay to service.<br />
ITS—Operations Management<br />
BRT Elements and System Performance<br />
Operations management systems allow system managers to quickly address any incidents that<br />
may arise and disseminates that information to riders.<br />
ITS—Passenger Information Systems<br />
While passenger information systems do not enable greater service reliability, they allow for<br />
transit agencies and operations managers to communicate to passengers waiting for and currently<br />
using the service <strong>of</strong> any service changes or disruptions, thereby reducing the impacts <strong>of</strong><br />
disruptions.<br />
Service and Operations Plan—Service Frequency<br />
High-frequency BRT systems (less than five minutes) can give passengers an impression that<br />
the service is available at any station without delay, even when headways and schedule adherence<br />
vary, as long as inordinate bunching (irregular spacing between vehicles) is avoided.<br />
Service and Operations Plan—Service Span<br />
Service that extends to the <strong>of</strong>f-peak periods (mid-day, evening, and late night) and on weekends<br />
provides potential users with expanded options for making round trips. Expanded service spans<br />
make BRT systems dependable.<br />
In addition to these BRT elements, an agency can improve service reliability through programs<br />
and business processes, such as:<br />
• enhanced maintenance programs for vehicles and other elements<br />
• fleet management to maintain higher spare ratios<br />
performance <strong>of</strong> Existing systems<br />
System Performance Pr<strong>of</strong>iles<br />
VIVA, York Region, Ontario<br />
The VIVA BRT service operates in the York Region <strong>of</strong> Ontario, just north <strong>of</strong> Toronto.<br />
It is a five-line network that operates in four suburban corridors designated<br />
for concentrated, high-density development. The VIVA is being built in<br />
phases, with Phase I launched in 2005, just three years after planning began.<br />
Phase I incorporates BRT elements that can be deployed relatively quickly, such<br />
as enhanced shelters, signal priority, stylized high-capacity buses, <strong>of</strong>f-board fare<br />
collection, queue jumper lanes, and a distinct branding scheme. The buses run<br />
on mixed-traffic curbside lanes until dedicated lanes can be built in Phase II.<br />
To improve travel times and ensure service reliability, York Region <strong>Transit</strong> implemented<br />
transit signal priority and a vehicle tracking system. The buses are<br />
3-63
BRT Elements and System Performance<br />
equipped with GPS units that allow the control center to monitor the buses,<br />
alert drivers to potential delays or problems, and activate the transit signal priority<br />
when buses are behind schedule. Signal priority can extend the green light or<br />
shorten the red cycle and is limited to one bus per intersection per 2.5 minutes<br />
in any direction.<br />
O-Bahn Busway, Adelaide<br />
The O-Bahn Busway in Adelaide, Australia is a 12km guided busway system to<br />
the northeastern suburbs (opened in 1986) that uses a mechanical track guidance<br />
system developed in Germany. Buses are steered automatically using horizontal<br />
guide wheels that engage raised concrete edges on the track. Vehicles<br />
travel at speeds <strong>of</strong> up to 100 km/hour serving three stations in the alignment.<br />
Travel times along the corridor decreased from 40 minutes to 25 minutes.<br />
Several aspects <strong>of</strong> the system support maximum service reliability. The stations<br />
are designed such that the vehicles pull <strong>of</strong>f the guided track and serve stations<br />
that can accommodate more than one vehicle. Vehicles are, therefore, never<br />
stationary on the track. This configuration ensures that the 18 bus routes that<br />
serve the route can operate without interference due to delays on each individual<br />
route. During the peak hour, an average headway <strong>of</strong> less than one minute<br />
is maintained (67 vehicles per hour). Braking ability on rubber-tired vehicles also<br />
allows safe operating distances <strong>of</strong> as little as 20 seconds between vehicles along<br />
the guided track (Passenger Transport Board 1999). In rare cases <strong>of</strong> vehicle breakdowns<br />
on the guideway, vehicle operators inform the Traffic Control Centre and<br />
alert oncoming vehicles with a hazard light. A special maintenance and recovery<br />
vehicle equipped with guide-wheels and able to travel in both directions is<br />
used to recover stranded vehicles and to maintain the track. While the guideway<br />
section is blocked, vehicles are diverted from the blocked section along parallel<br />
arterial streets to the next station, minimizing delays.<br />
San Pablo Rapid, Oakland and Orange Line, Los Angeles<br />
These two systems demonstrate that it is possible to achieve good reliability with<br />
very different BRT strategies. The 14-mile San Pablo Rapid operates in mixed<br />
traffic along the San Pablo Avenue Corridor, serving seven cities in Alameda and<br />
Contra Costa counties. AC <strong>Transit</strong> developed the Rapid to improve service quality<br />
for existing customers and attract new riders. This was achieved by adding<br />
relatively low-cost BRT elements: a headway-based schedule at 12-minute intervals,<br />
stops that are at least one-half mile apart, transit signal priority and queue<br />
jumpers, and real-time bus arrival information. It features conventional on-board<br />
3-64<br />
fare collection and standard curb height boarding. The system cost $3.2 million<br />
to implement. Even though the buses operate in a mixed traffic arterial, the reported<br />
ratio <strong>of</strong> maximum to minimum travel time is 1.21. During peak hours,<br />
service reliability is maintained by use <strong>of</strong> additional vehicles (National Bus Rapid<br />
<strong>Transit</strong> Institute 2006).<br />
The Orange Line reports a reliability ratio <strong>of</strong> 1.1, which is achieved through a<br />
very different BRT strategy. The Orange Line also runs for 14 miles but operates<br />
almost entirely in a dedicated busway. Because traffic signals at intersections<br />
are managed to minimize delay to cross-traffic through intersections, the service<br />
does not feature full transit signal priority, although it does benefit from<br />
signal synchronization. To help speed boarding, the system uses <strong>of</strong>f-board fare<br />
collection and raised platforms at the stations. It is served by articulated vehicles<br />
that run at five- to six-minute headways at peak hours. The initial cost to build<br />
the Orange Line was $318 million. Ridership on the Orange Line is significantly<br />
higher than on the San Pablo Rapid, with the Orange Line averaging over 26,000<br />
weekday boardings compared to the Rapid, which has around 6,000. These two<br />
systems demonstrate the variety <strong>of</strong> strategies that can be used to implement<br />
high-performing BRT service (Stanger 2007).<br />
Tri-Met Automated Bus Dispatching, Portland (Non-BRT)<br />
Portland, Oregon’s Tri-Met is a pioneer in the development, implementation,<br />
and deployment <strong>of</strong> transit ITS systems. Its bus dispatch system (BDS) began implementation<br />
in 1997 and became fully operational in 1998. The main features<br />
<strong>of</strong> the BDS include GPS-based Automatic Vehicle Location (AVL), voice and data<br />
communications, an on-board computer and mobile data terminal, automatic<br />
passenger counters (partial), and a Computer-Aided Dispatch (CAD) operations<br />
control center.<br />
After implementation <strong>of</strong> the BDS, there was noticeable improvement in both<br />
on-time performance and instances <strong>of</strong> severe bus-bunching. Overall, on-time<br />
performance increased from 61.4 to 67.2 percent <strong>of</strong> all trips, a 9.4 percent gain.<br />
The greatest improvement occurred in the AM peak period, with a 129 percent<br />
gain. There was also a noticeable reduction in headway variation and bus bunching.<br />
Bus bunching, which is represented by headways below 70 percent <strong>of</strong> their<br />
scheduled values, declined by 15 percent. For PM peak outbound trips, where<br />
any irregularities in service are exacerbated by the high rate <strong>of</strong> passenger arrivals<br />
causing boarding backups and delays, extreme instances <strong>of</strong> bus bunching (headway<br />
ratios < 10 percent <strong>of</strong> scheduled values) declined by 37 percent (Weatherford<br />
2000).
Regional <strong>Transit</strong> District AVL and CAD System, Denver (Non-BRT)<br />
The Denver, Colorado Regional <strong>Transit</strong> District (RTD) was one <strong>of</strong> the first systems<br />
in the nation to install a GPS-based AVL system and a CAD system throughout<br />
its operations. The RTD transit system covers 2,400 square miles and consists <strong>of</strong><br />
about 1,335 vehicles, including 936 buses in fixed-route service, 27 buses in the<br />
16th Street Mall, 175 paratransit vehicles, 17 light-rail vehicles, and 180 supervisor<br />
and maintenance vehicles. In 1993, the RTD began installation <strong>of</strong> an AVL system<br />
across its fleet developed by Westinghouse Wireless Solutions.<br />
Since the AVL system was implemented, the transit system has provided the<br />
customers with higher quality <strong>of</strong> service (most noticeable after final system acceptance).<br />
As reported in a U.S. DOT evaluation, “RTD decreased the number <strong>of</strong><br />
vehicles that arrived at stops early by 125 between 1992 and 1997. The number<br />
<strong>of</strong> vehicles that arrived late at stops decreased by 21 percent. These improvements<br />
are to a system that was already performing well, and outstanding considering<br />
the impact that inclement weather can have on on-time performance<br />
during winter.” From 1992 to 1997, customer complaints per 100,000 boardings<br />
decreased by 26 percent, due in large part to the improved schedule adherence.<br />
London Transport Countdown System (Non-BRT)<br />
London was one <strong>of</strong> the first cities in the world to deploy a next-bus-arrival system<br />
at bus stops. The system, called Countdown, was piloted in 1992 on Route<br />
18 <strong>of</strong> the London system and proved highly popular with passengers. Deployment<br />
continued by stages. As <strong>of</strong> March 2002, 1,473 Countdown signs had been<br />
installed and were operational. The installation <strong>of</strong> 2,400 signs was expected by<br />
March 2003 and 4,000 signs by 2005. The 4,000 signs will cover 25 percent <strong>of</strong><br />
all stops and will benefit 60 percent <strong>of</strong> all passenger journeys (Schweiger 2003).<br />
While the Countdown system does not directly affect service reliability, it had<br />
a noticeable impact on passenger’s perceptions. It was found that 64 percent <strong>of</strong><br />
those surveyed regarding the system believed service reliability had improved<br />
after Countdown was implemented.<br />
BRT Elements by System and Service Reliability<br />
Since the frequency <strong>of</strong> incidents and the responses to them are seldom recorded<br />
and not available in an easily comparable format, it is difficult to present a consistent<br />
measure to compare service reliability across systems. For this reason, this<br />
section characterizes performance simply by listing the BRT elements that have<br />
an effect on service reliability.<br />
BRT Elements and System Performance<br />
Exhibit 3-13 presents those BRT elements that are most relevant to assessing<br />
service reliability for BRT systems in 35 cities worldwide. ITS features, especially<br />
transit signal priority and automated scheduling and dispatch, are probably the<br />
most important elements for achieving service reliability. A majority <strong>of</strong> U.S. BRT<br />
systems use vehicle tracking devices at a minimum, with slightly less than half using<br />
transit signal priority or automated scheduling. Outside the U.S., a majority<br />
<strong>of</strong> BRT systems use vehicle tracking and TSP. Vehicle component monitoring is<br />
also becoming increasingly common, both in the U.S. and around the world.<br />
3-65
BRT Elements and System Performance<br />
3-66<br />
Exhibit 3-13: BRT Elements by System and Service Reliability<br />
Albuquerque Boston Silver Line Chicago Cleveland<br />
Rapid Ride<br />
Washington<br />
Street<br />
Waterfront SL1<br />
– Airport<br />
Waterfront SL2 -<br />
BMIP<br />
Western<br />
Avenue<br />
Express<br />
Irving Park<br />
Express<br />
Garfield<br />
Express<br />
HealthLine<br />
Stations<br />
Platform Length (# vehicles<br />
accommodated)<br />
1 1<br />
1 above ground, 3<br />
underground<br />
1 above ground, 3<br />
underground<br />
1 1 1 1 40' + 1 60'<br />
Passing Capability<br />
ITS<br />
No<br />
<strong>Transit</strong> Vehicle Prioritization TSP<br />
TSP - Green<br />
Extension, Red<br />
Truncation<br />
TSP<br />
Automatic Vehicle Location (AVL) GPS GPS<br />
GPS, dead<br />
reckoning in tunnel<br />
GPS, dead reckoning<br />
in tunnel<br />
Yes<br />
Automatic Scheduling and Dispatch None CAD CAD<br />
Vehicle Component Monitoring<br />
System<br />
AVM<br />
LED signs with LED signs with<br />
Passenger Information<br />
At Station / On<br />
Vehicle LED<br />
Nextbus signs<br />
VMS at Stations<br />
and in-vehicle<br />
schedule info at<br />
stations; vehicles<br />
have public address<br />
and VMS with stop<br />
schedule info at<br />
stations; vehicles<br />
have public address<br />
and VMS with stop<br />
Real time<br />
passenger<br />
info<br />
Service Plan<br />
announcements announcements<br />
Span <strong>of</strong> Service All day All day All day All day All day All day All day All day<br />
Peak Service Frequency (min) 11 4 10 10 9 12 11 5<br />
Off-Peak Service Frequency (min) 11 12 10 - 30 15 15
Exhibit 3-13: BRT Elements by System and Service Reliability (cont’d.)<br />
Eugene Honolulu Honolulu Honolulu<br />
EmX<br />
City<br />
Express A<br />
City<br />
Express B<br />
County<br />
Express C<br />
Kansas<br />
City<br />
MAX<br />
BRT Elements and System Performance<br />
Las Vegas<br />
North<br />
Las Vegas<br />
MAX<br />
Los<br />
Angeles<br />
Orange<br />
Line<br />
Los Angeles<br />
Metro<br />
Rapid (All<br />
Routes)<br />
Stations<br />
Platform Length (# vehicles<br />
accommodated)<br />
1 1 1 1 1 1 3 (200')<br />
Passing Lane<br />
1<br />
Passing Capability<br />
ITS<br />
No<br />
provided at<br />
each in-line<br />
station<br />
<strong>Transit</strong> Vehicle Prioritization TSP TSP TSP No None<br />
Automatic Vehicle Location (AVL) GPS GPS GPS GPS GPS Orbital<br />
GPS, Loop<br />
Detectors<br />
GPS, Loop<br />
Detectors<br />
Automatic Scheduling and Dispatch CAD CAD/AVL<br />
Vehicle Component Monitoring<br />
System<br />
None None<br />
Passenger Information<br />
Service Plan<br />
Vehicle, Web<br />
Traveler<br />
Information<br />
planned on<br />
vehicles, at<br />
several stations<br />
Traveler<br />
Information<br />
planned on vehicles,<br />
at several stations<br />
Traveler Information<br />
planned on vehicles,<br />
at several stations<br />
Real-time<br />
at all<br />
stations, trip<br />
planning<br />
Station,<br />
telephone,<br />
internet,<br />
on-vehicle<br />
electronic<br />
displays<br />
Nextbus<br />
VMS<br />
Nextbus VMS<br />
at stations,<br />
telephone,<br />
internet<br />
Span <strong>of</strong> Service All day All day All day All day All day All day All day<br />
Peak Service Frequency (min) 10 15 15 30 9 12 4 2-10<br />
Off-Peak Service Frequency (min) 20-30 30 20 30 30 15 10 15-20<br />
3-67
BRT Elements and System Performance<br />
3-68<br />
Exhibit 3-13: BRT Elements by System and Service Reliability (cont’d.)<br />
Miami Oakland Orlando Phoenix Phoenix Phoenix Phoenix Los Angeles<br />
Busway<br />
Rapid<br />
San Pablo<br />
Corridor<br />
LYMMO<br />
RAPID I-10<br />
East<br />
RAPID I-10<br />
West<br />
RAPID SR-51 RAPID I-17<br />
Metro<br />
Rapid (All<br />
Routes)<br />
Stations<br />
Platform Length (# vehicles<br />
accommodated)<br />
3 1 2 1 1 1 1 1<br />
Passing Capability<br />
ITS<br />
Bus pullouts Bus pullouts Bus pullouts Bus pullouts Bus pullouts<br />
<strong>Transit</strong> Vehicle Prioritization No TSP TSP<br />
TSP at 1<br />
intersection<br />
TSP at 1<br />
intersection<br />
TSP at 1<br />
intersection<br />
TSP at 1<br />
intersection<br />
None<br />
Automatic Vehicle Location (AVL) AVL GPS AVL/Wi-Fi Orbital Orbital Orbital Orbital<br />
GPS, Loop<br />
Detectors<br />
Automatic Scheduling and Dispatch CAD Yes Yes Yes Yes Yes<br />
Vehicle Component Monitoring<br />
System<br />
Yes None<br />
Passenger Information<br />
Traveler<br />
information at<br />
stations and<br />
on vehicle<br />
Real-time arrival<br />
at stations;<br />
traveler info on<br />
vehicle and via<br />
PDA<br />
Traveler<br />
Information<br />
at stations<br />
and on<br />
vehicle; webbased<br />
Real-time arrival<br />
at stations;<br />
on-vehicle<br />
announcements;<br />
PDA and webbased<br />
info<br />
Real-time arrival<br />
at stations;<br />
on-vehicle<br />
announcements;<br />
PDA and webbased<br />
info<br />
Real-time arrival<br />
at stations;<br />
on-vehicle<br />
announcements;<br />
PDA and webbased<br />
info<br />
Real-time arrival<br />
at stations;<br />
on-vehicle<br />
announcements;<br />
PDA and webbased<br />
info<br />
Nextbus VMS<br />
at stations,<br />
telephone,<br />
internet<br />
Service Plan<br />
Span <strong>of</strong> Service All day All day All day<br />
Weekday peakhour<br />
only<br />
Weekday peakhour<br />
only<br />
Weekday peakhour<br />
only<br />
Weekday peakhour<br />
only<br />
Peak Service Frequency (min) 6 12 5 10 10 10 10 2-10<br />
Off-Peak Service Frequency (min) 15 10-15 15-20<br />
All day
Exhibit 3-13: BRT Elements by System and Service Reliability (cont’d.)<br />
BRT Elements and System Performance<br />
Pittsburgh Pittsburgh Pittsburgh Sacramento San Jose Halifax<br />
East Busway South Busway West Busway E-Bus Rapid 522 Metro<strong>Link</strong><br />
Stations<br />
Platform Length (# vehicles<br />
accommodated)<br />
2 (typically) 2<br />
Passing Capability Passing allowed Passing allowed Passing allowed None None<br />
ITS<br />
<strong>Transit</strong> Vehicle Prioritization<br />
Signal Priority<br />
(magnetic loop<br />
sensors)<br />
TSP - Gn Ext<br />
TSP - Green Extension, Red<br />
Truncation<br />
Automatic Vehicle Location (AVL) None GPS AVL<br />
Automatic Scheduling and Dispatch None Trapeze None<br />
Vehicle Component Monitoring<br />
System<br />
None None None<br />
Passenger Information On Vehicle<br />
Automated next stop<br />
announcements, realtime<br />
info in development,<br />
automated trip planning<br />
through website<br />
TSP<br />
Real-time display, trip<br />
planning<br />
Service Plan<br />
Span <strong>of</strong> Service All day All day All day All day All day, Mon-Sat<br />
2 routes all-day weekdays,<br />
1 route peak-hour only<br />
Peak Service Frequency (min) 0.58 1.33 15 min 15 10<br />
Off-Peak Service Frequency (min) 20 min 15 30<br />
3-69
BRT Elements and System Performance<br />
3-70<br />
Stations<br />
Platform Length (# vehicles<br />
accommodated)<br />
Exhibit 3-13: BRT Elements by System and Service Reliability (cont’d.)<br />
Ottawa <strong>Transit</strong>way York Bogotá Guayaquil Pereira<br />
95 96 97 VIVA Blue VIVA Purple Transmilenio Metrovia Megabus<br />
Passing Capability Bus pullouts Bus pullouts Bus pullouts Bus pullouts Bus pullouts<br />
ITS<br />
<strong>Transit</strong> Vehicle Prioritization TSP TSP TSP<br />
1 1 2 to 5 1 to 2<br />
Limited to buses<br />
that are behind<br />
schedule with a<br />
max <strong>of</strong> one bus<br />
per intersection<br />
per 2.5 minutes in<br />
any direction<br />
Limited to buses<br />
that are behind<br />
schedule with a<br />
max <strong>of</strong> one bus per<br />
intersection per<br />
2.5 minutes in any<br />
direction<br />
Automatic Vehicle Location (AVL) GPS GPS GPS AVL-equipped AVL-equipped<br />
Automatic Scheduling and Dispatch Yes Yes Yes Yes Yes<br />
Vehicle Component Monitoring<br />
System<br />
Under<br />
development<br />
Under|<br />
development<br />
Under<br />
development<br />
Passenger Information Yes Yes Yes<br />
Oil temp, oil<br />
pressure, engine<br />
temp reported to<br />
control centre<br />
VMS at stops and<br />
on-board<br />
Oil temp, oil<br />
pressure, engine<br />
temp reported to<br />
control centre<br />
VMS at stops and<br />
on-board<br />
Bus pullouts at<br />
many stations;<br />
some lines more<br />
than 2 lanes<br />
Loop detectors,<br />
station sensors<br />
Nextbus displays at<br />
stations<br />
No passing No passing<br />
On-board<br />
transponders<br />
Nextbus<br />
displays at<br />
stations<br />
On-board<br />
transponders<br />
Nextbus<br />
displays at<br />
stations<br />
Service Plan<br />
Span <strong>of</strong> Service All day All day All day 18 hours per day 18 hours per day All day All day<br />
Peak Service Frequency (min) 3-4 3-6 12 5 10 1 - 3 4 - 6 3 - 5<br />
Off-Peak Service Frequency (min) 30-34 30-35 30 15 15 10 10
Stations<br />
Platform Length (# vehicles<br />
accommodated)<br />
Passing Capability<br />
ITS<br />
Exhibit 3-13: BRT Elements by System and Service Reliability (cont’d.)<br />
BRT Elements and System Performance<br />
Amsterdam Caen Edinburgh Eindhoven Leeds London Rouen Utrecht<br />
Zuidtangent<br />
<strong>Transit</strong> Vehicle Prioritization RTSP<br />
Tram on<br />
Wheels<br />
Signal priority -<br />
automatic<br />
Fastlink<br />
Automatic Vehicle Location (AVL) GPS<br />
Automatic Scheduling and Dispatch Yes<br />
Vehicle Component Monitoring<br />
System<br />
Passenger Information<br />
Real-time stop<br />
information,<br />
timetable<br />
Real-time at<br />
station/stop,<br />
online-journey<br />
planner and<br />
timetable<br />
Phileas - Western<br />
Corridor<br />
TSP TSP<br />
Real-time,<br />
at station/<br />
stop, SMS<br />
Real-time stop<br />
information,<br />
timetable<br />
Superbus Crawley TEOR Busway<br />
No passing<br />
in guideway<br />
segments<br />
TSP in<br />
downtown<br />
areas<br />
Real-time, at<br />
station/stop,<br />
SMS<br />
Timetable at<br />
station/stop<br />
Signal<br />
priority-<br />
automatic<br />
and manual<br />
Realtime<br />
stop<br />
information,<br />
timetable<br />
Signal priority -<br />
automatic<br />
Real-time stop<br />
information,<br />
timetable<br />
Service Plan<br />
Span <strong>of</strong> Service All day All day All day All day All day All day All day All day<br />
Peak Service Frequency (min) 7.5 - 8<br />
3-6 (where routes<br />
overlap)<br />
3 8 2-8 10 3 2-4<br />
Off-Peak Service Frequency (min) 10 10-15 10 10 2-8 10-20 4 3-7.5<br />
3-71
BRT Elements and System Performance<br />
3-72<br />
Stations<br />
Platform Length (# vehicles<br />
accommodated)<br />
Passing Capability<br />
ITS<br />
<strong>Transit</strong> Vehicle Prioritization<br />
Exhibit 3-13: BRT Elements by System and Service Reliability (cont’d.)<br />
Adelaide Brisbane Sydney Beijing Hangzhou Kunming<br />
North East<br />
Busway<br />
Two stations<br />
have 3 bus<br />
length, one has<br />
4-bus length<br />
Passing at<br />
interchanges.<br />
busway is single<br />
‘track’<br />
Passive priority<br />
(No active)<br />
South East<br />
Busway<br />
Standard 4<br />
Max 5<br />
Bus pullouts<br />
at stations<br />
Inner<br />
Northern<br />
Busway<br />
Standard 4<br />
Max 5<br />
Bus<br />
pullouts at<br />
stations<br />
Liverpool-<br />
Parramatta<br />
T-Way<br />
Standard 2<br />
Max 6<br />
Bus pullouts at<br />
stations<br />
Signal preemption<br />
including green<br />
extension and<br />
early green<br />
North-West<br />
T-Way -<br />
Blacktown-<br />
Parklea<br />
Standard 2,<br />
4 at termini<br />
Bus pullouts at<br />
stations<br />
North-West<br />
T-Way -<br />
Parramatta-<br />
Rouse Hill<br />
Bus pullouts at<br />
stations<br />
Line 1 BRT Line B!<br />
Multiple<br />
lanes<br />
60 m<br />
Multiple<br />
lanes<br />
TSP TSP<br />
Automatic Vehicle Location (AVL) 4 at termini GPS GPS Loop detectors Yes Yes<br />
Automatic Scheduling and Dispatch<br />
Vehicle Component Monitoring<br />
System<br />
Passenger Information<br />
Service Plan<br />
Span <strong>of</strong> Service<br />
City web<br />
site has trip<br />
planning<br />
Mix peak only<br />
and all day<br />
Real time info<br />
at stations<br />
Mainly all day<br />
Real time<br />
info at<br />
stations<br />
Mix peak<br />
only and all<br />
day<br />
Real time info<br />
at stations<br />
Real time info<br />
at terminus<br />
stations only<br />
Real time info<br />
at terminus<br />
stations only<br />
Rea time at<br />
stations and<br />
on vehicles<br />
Rea time at<br />
stations and<br />
on vehicles<br />
Busway<br />
network<br />
None<br />
Currently<br />
being<br />
implemented<br />
All day All day Most all day All day All day All day<br />
Peak Service Frequency (min) 1.1<br />
16-sec<br />
headway<br />
at Buranda<br />
Station<br />
4.6 10.0 8.6 4.0 3 - 4<br />
Off-Peak Service Frequency (min) 4 2 5 15 11.6 5
imagE and idEnTiTy<br />
The creation <strong>of</strong> an image and identity separate from local on-street bus operations<br />
is an important objective <strong>of</strong> BRT. Research has shown that if transit is to<br />
attract choice riders it must not only <strong>of</strong>fer competitive travel times and highquality<br />
service but also be complemented by an attractive image. Unfortunately,<br />
conventional bus service suffers from a severe image problem. Many people<br />
perceive the bus as an inferior way to travel when compared with the mobility,<br />
convenience, and personal freedom afforded by the automobile. Some <strong>of</strong> the<br />
most common negative views regarding bus service are that it is unreliable, time<br />
consuming, inaccessible, inconvenient, crowded, dirty, and unsafe (TCRP Report<br />
63). These perceptions and their impact on the tangible response <strong>of</strong> patrons to<br />
BRT systems and BRT services highlight the need to focus on the image and<br />
identity <strong>of</strong> BRT.<br />
This discussion focuses on two key aspects <strong>of</strong> image and identity: brand identity<br />
and contextual design. Brand identity is a concept that encompasses the broad<br />
range <strong>of</strong> attributes and the holistic “packaging” <strong>of</strong> a BRT system into an attractive<br />
product for transit patrons and potential transit patrons. The concept <strong>of</strong><br />
contextual design represents the integration <strong>of</strong> physical design elements <strong>of</strong> the<br />
BRT system to convey a singular and attractive design aesthetic that communicates<br />
both the existence <strong>of</strong> the system and complements the physical urban<br />
environment.<br />
Brand identity<br />
description <strong>of</strong> Brand identity<br />
To increase its appeal to choice riders, an important objective for BRT is to establish<br />
an image and identity separate from local bus operations. The concept <strong>of</strong><br />
brand identity captures both the qualities that affect identity - the consumer’s<br />
overall perception <strong>of</strong> the style, aesthetics, and compatibility <strong>of</strong> the system elements<br />
and explicit branding- and marketing devices such as logos and color<br />
schemes. As such, brand identity includes not only things that passengers can<br />
see, but all things encompassing the senses, such as the chime <strong>of</strong> the bus arriving<br />
at the station, the slogan representing the system, or the comfort <strong>of</strong> the vehicle<br />
seats. Thus, brand identity is an important part <strong>of</strong> the image formation process<br />
within the public mind (Meenaghan 1995; Heffner et al. 2006).<br />
BRT Elements and System Performance<br />
The image <strong>of</strong> a BRT system determines how it is viewed among the set <strong>of</strong> other<br />
public transportation options. A well-crafted identity and the image <strong>of</strong> clean,<br />
modern, and efficient transportation can help achieve market differentiation<br />
and promote BRT as a premium, new “mode,” which may help increase ridership,<br />
particularly by choice riders. A unified brand identity also can convey important<br />
customer information such as routing and stations served and help infrequent<br />
customers understand how to use the system (Levinson 2004).<br />
Regarding identity and image, there are some noteworthy differences between<br />
products and services. BRT, like all forms <strong>of</strong> public transit, provides a service.<br />
Services, by their very nature, are largely intangible and experiential. They cannot<br />
be seen, felt, tasted, or touched before purchase and are therefore perceived as<br />
higher in risk than products (Onkvisit and Shaw 1989). Thus, an attractive image<br />
is actually more crucial for services than for physical products. Identity and image<br />
can impart tangibility and help customers get a “mental fix” on an otherwise<br />
undifferentiated service, transforming it into a virtual product (Onkvisit and<br />
Shaw 1989). An image that successfully draws upon the needs and values <strong>of</strong> consumers<br />
can provide confidence, security, and a higher guarantee <strong>of</strong> consistent<br />
quality. Also, since services consist largely <strong>of</strong> the interface between the provider<br />
and the customer, a pleasant service atmosphere is <strong>of</strong> paramount importance.<br />
When thinking about how BRT elements contribute to brand identity, it is helpful<br />
to recognize that there are ways that the style or perceived design are improved<br />
and ways that the fundamental service qualities can be improved. To<br />
lend a tangible quality to BRT service, the most noticeable physical elements<br />
should be leveraged as much as possible. Distinctive logos, color combinations,<br />
and graphics should be consistently applied to vehicles, stations, running ways,<br />
and printed materials. Sleek, rail-inspired vehicles with spacious interior designs<br />
project a modern, upscale image, distinguishing BRT from older “shoebox”style<br />
buses (Peak et al. 2005; Zimmerman and Levinson 2004). Attractive running<br />
ways and modern, comfortable vehicles and stations convey the idea that<br />
BRT service provides the style, amenities, and capacity <strong>of</strong> rail. Image also can be<br />
enhanced with design features that are distinct and highly visible. Design that<br />
complements the brand identity <strong>of</strong> a BRT system can strengthen the image <strong>of</strong><br />
the service and reinforce the core marketing message aimed at passengers. Most<br />
BRT systems have stations with design cues to distinguish BRT routes from regular<br />
local bus service. Unique, eye-catching architecture and design elements also<br />
can be used to indicate where to gain access to the system.<br />
3-73
BRT Elements and System Performance<br />
In addition to physical design and aesthetics, identity and image also relate to<br />
aspects <strong>of</strong> service quality such as reliability and comfort. Exclusive right-<strong>of</strong>-way<br />
and signal priority, which are defining characteristics <strong>of</strong> BRT service, help ensure<br />
that service is more reliable. Advanced fare collection systems, multiple doors,<br />
automated guidance systems, and precision docking may reduce dwell times and<br />
enable levels <strong>of</strong> convenience in passenger boarding and alighting that approach<br />
rail (Zimmerman and Levinson 2004). These advanced technologies may also act<br />
as “authority symbols,” communicating the pr<strong>of</strong>essional legitimacy <strong>of</strong> the service<br />
provider and reducing the perception <strong>of</strong> risk (Cobb-Walgren and Mohr 1998).<br />
Furthermore, because consumer perceptions depend heavily upon interactions<br />
with service providers, customer contact personnel should be carefully chosen<br />
and trained to interact well with customers.<br />
Effects <strong>of</strong> BRT Elements on Brand identity<br />
Several BRT elements affect brand identity.<br />
Level <strong>of</strong> Running Way Priority<br />
Just as the physical rail tracks <strong>of</strong> a rail transit line reinforce the idea that high quality rail service is<br />
present, running ways that have distinct identities support the idea that high quality BRT service<br />
is present. This strengthens the identity <strong>of</strong> the BRT system. The ability to impart and reinforce<br />
system identity becomes stronger with increasing levels <strong>of</strong> priority. Exclusive right-<strong>of</strong>-way also<br />
may reinforce the perception <strong>of</strong> rapid, reliable service.<br />
Running Way—Marking<br />
Similar to running way segregation, running way markings can also supplement brand identity.<br />
Examples <strong>of</strong> differentiation techniques include pavement markings and signs (e.g., frequent<br />
“bus only” markings on the pavement), particularly active signage (e.g., “BRT Only”), and<br />
uniquely-colored running way pavement (e.g., maroon in Europe, green in New Zealand, yellow<br />
in Nagoya and Sao Paulo). Running way markings advertise the BRT system by providing it<br />
with a distinct image and also make enforcement easier when there is no barrier separating the<br />
BRT-only running ways from general traffic.<br />
3-74<br />
Stations—Station Type<br />
Perhaps no better opportunity exists to send tangible cues and create a unique identity and<br />
theme throughout a BRT system than station design. The unique identity <strong>of</strong> BRT stations should<br />
create a systemwide, unified theme that is easily recognizable to customers and emphasizes<br />
BRT’s unique attributes <strong>of</strong> speed and reliability. This can be accomplished with distinct design<br />
cues that differentiate BRT from local bus service and unique, eye-catching architecture and<br />
design elements that advertise the service and indicate where to gain access to the system. Consumer<br />
perceptions <strong>of</strong> services also depend heavily on the service atmosphere. Enhanced stops,<br />
larger designated stations, and intermodal terminals advertise the BRT service and can enhance<br />
its image by providing an environment that is safe, attractive, comfortable, convenient,<br />
and accessible to disabled customers.<br />
Vehicles—Vehicle Configuration<br />
Vehicles may be the single most important element <strong>of</strong> user and non-user perceptions <strong>of</strong> a BRT<br />
system’s quality. The styling and aesthetics <strong>of</strong> BRT vehicles and interior designs help distinguish<br />
BRT from local bus service, presenting BRT as a new concept or “mode.” For this reason, BRT<br />
system identity is enhanced when BRT services are served by dedicated BRT vehicles. Vehicle<br />
configurations that provide enhanced body designs—stylized standard and articulated vehicles<br />
and specialized BRT vehicles—support positive impressions <strong>of</strong> BRT. Uniquely-styled<br />
vehicles advertise that the BRT system provides a distinct service and sends a tangible cue that<br />
indicates stopping locations and routes. Examples <strong>of</strong> advanced vehicle configurations include<br />
larger sizes for greater carrying capacity, aerodynamic designs, multiple sets <strong>of</strong> doors, covered<br />
rear wheel wells, comfortable seats, and roomy, open standing areas, all <strong>of</strong> which add to the<br />
vehicle’s rail-like feel.<br />
Vehicles—Aesthetic Enhancements<br />
Vehicles with unique branding and livery (e.g., paint schemes, colors, and icons) can help achieve<br />
a distinct image, conveying important customer information such as routing and stations served,<br />
as well as alerting infrequent riders where they can board. A common and successful enhancement<br />
is the use <strong>of</strong> specialized logos and livery, especially when the visual scheme complements<br />
BRT stops, stations, terminals, signs, maps, and other sources <strong>of</strong> information, further solidifying<br />
the identity <strong>of</strong> the system as a whole.<br />
Use <strong>of</strong> large panoramic windows and enhanced lighting can reinforce brand messages <strong>of</strong> being<br />
“open” and “safe.” Low-floor buses generally have larger windows. The large windows and<br />
high ceilings provide the customer with a feeling <strong>of</strong> spaciousness, which contributes to the comfort<br />
<strong>of</strong> passengers.<br />
Vehicles—Propulsion System<br />
Clean propulsion systems and fuels have positive effects on image and branding <strong>of</strong> the service.<br />
BRT vehicles that are designed to run smoothly and reduce noise levels and air emissions may<br />
help do away with stereotypes <strong>of</strong> the noisy, polluting buses. There is a trend toward innovations<br />
in environmentally-clean vehicles such as hybrid-electric vehicles and vehicles fueled with compressed<br />
natural gas (CNG) and ultra low sulfur diesel.
Fare Collection—Fare Collection Process<br />
Fare pre-payment contributes to BRT’s resemblance to rail service. Complete pre-payment with<br />
<strong>of</strong>f-vehicle fare payment, either through barrier-enforced or barrier-free pro<strong>of</strong>-<strong>of</strong>-payment,<br />
allows for the optimization <strong>of</strong> bus operations, thus improving the system’s image and brand<br />
identity. Fare inspectors associated with barrier free pro<strong>of</strong>-<strong>of</strong>-payment systems also provide another<br />
customer service interface. Because inspectors represent the system, there is an important<br />
balance between enforcement vigilance and an understanding customer service approach.<br />
Fare Collection—Fare Media and Payment Options<br />
Alternative fare media relate BRT systems to high technology and user-friendliness. Smart cards<br />
provide quick transactions that enhance the image <strong>of</strong> BRT service as a high technology and high<br />
efficiency system. Although involving significant investments, they provide substantial benefits,<br />
including the possibility <strong>of</strong> auxiliary services (e.g., vending machines, parking, tolls, etc.) and the<br />
creation <strong>of</strong> seamless regional transit services with integrated fare collection. Magnetic stripe<br />
cards have many <strong>of</strong> the same benefits as smart cards, although with slightly longer transaction<br />
times.<br />
ITS - <strong>Transit</strong> Vehicle Prioritization, Intelligent Vehicle Systems, Passenger Information<br />
Systems<br />
Advanced technologies communicate the pr<strong>of</strong>essional legitimacy <strong>of</strong> the BRT service provider<br />
and increase customer perceptions <strong>of</strong> overall safety and security. The inclusion <strong>of</strong> ITS elements<br />
also can strengthen the association <strong>of</strong> the BRT brand with innovation and cutting-edge technology.<br />
<strong>Transit</strong> signal priority can be marketed as just one improvement that distinguishes BRT<br />
service from regular bus service. Precision docking can help brand BRT as a “smart” service with<br />
the ability to precisely stop at the same location each and every time. Real-time traveler information<br />
options suggest that the system is technologically advanced enough to provide useful<br />
and timely information to customers. More advanced systems, such as collision warning and<br />
automated lane guidance, enhance safety and provide a smoother ride.<br />
Worldwide, the interest in modern-looking, specialized BRT vehicles has led to<br />
development <strong>of</strong> several models, including Irisbus’ Civis in France, the Bombardier<br />
“GLT” in Belgium and France, the Berkh<strong>of</strong>f-Jonkhere Phileas in the Netherlands<br />
and the Wright Bus in Northern Ireland. Manufacturers in North America (including<br />
Gillig, NABI, New Flyer and Orion) also are developing new models that<br />
incorporate aesthetics into their designs.<br />
Of course, BRT elements alone do not define the total contribution to BRT brand<br />
identity. The successful deployment <strong>of</strong> personnel and employment <strong>of</strong> business<br />
practices also contribute to a BRT system’s brand identity. Because consumers<br />
are likely to assess the quality <strong>of</strong> a service based on interactions with the service<br />
provider, customer service personnel should be carefully chosen and trained.<br />
Firms may also use employee appearance to achieve specific imaging or branding<br />
BRT Elements and System Performance<br />
goals. For instance, uniformed operators trained in the use <strong>of</strong> high-tech equipment<br />
convey the provider’s pr<strong>of</strong>essional legitimacy (Cobb-Walgren and Mohr<br />
1998), while security <strong>of</strong>ficials provide a greater sense <strong>of</strong> safety and security and<br />
reduce the perception <strong>of</strong> risk.<br />
performance <strong>of</strong> Existing systems<br />
The following descriptions <strong>of</strong> branding approaches to BRT projects show the<br />
range <strong>of</strong> possibilities when composing a brand and assembling BRT elements to<br />
reflect that brand identity.<br />
Research Summary<br />
The need to address the image <strong>of</strong> BRT is documented by differences in consumer<br />
response between rail and conventional bus service. Rail service tends to attract<br />
more riders than bus service even if all functional service attributes are equal<br />
(speed, frequency, span, etc). To reflect this stronger consumer response to certain<br />
modes, travel demand forecasts incorporate the use <strong>of</strong> mode constants to<br />
capture the effects <strong>of</strong> qualitative service attributes in mode choice modeling.<br />
These constants are a measure <strong>of</strong> the degree to which, all else being equal, one<br />
mode is more or less attractive than another. Mode choice models assume that<br />
mode constants will capture qualitative service attributes that are not explained<br />
by the easily quantifiable variables (such as travel cost and time) used in most<br />
models. These intangible service attributes (<strong>of</strong>ten called mode specific factors,<br />
or MSFs) present a challenge for empirical research because they are difficult<br />
to quantify and measure consistently across transit systems. Intangible service<br />
attributes <strong>of</strong>ten include qualities such as comfort, safety, security, and ride quality.<br />
The disparity in consumer response between rail and on-street bus service appears<br />
to be due, in part, to qualitative attributes relating to image and perception.<br />
Design elements <strong>of</strong> rail provide distinct image benefits that might explain<br />
the apparent popularity <strong>of</strong> light rail over bus (Brown et al. 2003). For instance,<br />
riders like clear, understandable routes and vehicles and stations that are designed<br />
to be attractive and comfortable. Rail travel <strong>of</strong>ten is perceived as faster,<br />
more comfortable, quieter, safer, more reliable, and less polluting than on-street<br />
bus (Ben-Akiva and Morikawa 2002; U.S. General Accounting Office 2001). Although<br />
rail has a clear advantage over conventional bus service in terms <strong>of</strong> ridership<br />
potential, there is limited information on how rail compares to BRT in this<br />
regard. However, the few studies that do exist suggest that if functional service<br />
characteristics and infrastructure are comparable, BRT should attract riders at<br />
3-75
BRT Elements and System Performance<br />
a level similar to light rail. Ben-Akiva and Morikawa (2002) argue that “a highquality<br />
express bus service with exclusive right-<strong>of</strong>-way may be equally attractive<br />
to Metro service.” Clearly, this has pr<strong>of</strong>ound implications for high-quality BRT,<br />
which is capable <strong>of</strong> operating much like a light rail system.<br />
If there are differences in ridership attraction between rail and BRT, they appear<br />
to lie in the intangible attributes that relate to image and perception. Henke<br />
(2007) draws on the findings <strong>of</strong> several different studies to conclude that up to<br />
one-third <strong>of</strong> median ridership gain observed across six new BRT systems could<br />
not be explained by quantifiable service improvements and that most <strong>of</strong> this unexplained<br />
aspect was due to branding and image. Indeed, in addition to emulating<br />
the functional aspects <strong>of</strong> rail, BRT shows great promise for replicating many<br />
<strong>of</strong> the image attributes that attract choice riders to rail.<br />
However, there is limited research knowledge regarding the impact and costeffectiveness<br />
<strong>of</strong> BRT in terms <strong>of</strong> image improvement. Current research at the<br />
National Bus Rapid <strong>Transit</strong> Institute (NBRTI) aims to quantify the impact <strong>of</strong> different<br />
BRT system design elements on overall image and assess the extent <strong>of</strong><br />
the relationship between positive image and ridership gain. It is hoped that this<br />
will allow agencies considering BRT to determine how best to convey a quality<br />
image in the most cost-effective manner. To discern the role <strong>of</strong> image in modechoice<br />
decisions, the research will assess differences in perceptions between BRT<br />
and other modes, particularly rail transit and the private automobile. Because<br />
the success <strong>of</strong> BRT in reducing traffic congestion depends heavily on attracting<br />
choice riders, the NBRTI study intends to examine the image perceptions <strong>of</strong> this<br />
group to determine the extent to which image plays a role in their mode-choice<br />
decisions. One study found that when dedicated bus lanes were provided, they<br />
were perceived as <strong>of</strong>fering travel time savings over the automobile (Cain and<br />
Sibley-Perone 2005).<br />
System Performance Pr<strong>of</strong>iles<br />
San Pablo Rapid, Alameda, and Contra Costa Counties (California)<br />
The branding <strong>of</strong> the San Pablo Rapid features special designs for the vehicles<br />
and stations. The sleek, state-<strong>of</strong>-the art, 100 percent low-floor Van Hool vehicles<br />
dedicated to the San Pablo Rapid feature the eye-catching red and white “Rapid”<br />
logo and prominent graphics on all sides <strong>of</strong> the vehicle. The distinctive “Rapid”<br />
logo and graphics also are featured prominently at San Pablo Rapid stations.<br />
3-76<br />
Silver Line, Boston<br />
The Silver Line bus service is branded as a new line <strong>of</strong> the MBTA’s rapid transit<br />
system. The other color-coded lines on the system are heavy rail and light rail.<br />
The Silver Line is the first MBTA bus line that has been branded as rapid transit.<br />
As such, it is included in the rapid transit map and route schedule. Like the rapid<br />
transit lines, but unlike all other MBTA bus lines, the Silver Line has named stops<br />
and strip maps at stops and onboard vehicles. Also unlike most bus routes, a subway<br />
pass is valid on the Silver Line, and a free transfer to other rapid transit lines<br />
is available for those paying cash. The silver color is used on the vehicles (which<br />
have a special Silver Line livery), stations, signs, logo, and marketing materials.
MAX, Kansas City<br />
To distinguish MAX service from local buses, vehicles have a unique shape and<br />
paint scheme that prominently displays the MAX logo. Similar to light rail, MAX<br />
has stations with clearly identifiable names (e.g., Midtown or Crown Center) and<br />
real-time transit information. All MAX stations are well-lit and feature a specially-designed<br />
passenger shelter and a distinctive 17-foot high information marker<br />
with the MAX logo at the top. The design <strong>of</strong> the MAX map adds further to the<br />
resemblance <strong>of</strong> light rail by using simple route geometry and stop labels.<br />
MAX, Las Vegas<br />
For the Las Vegas MAX BRT system, planners at the Regional Transportation<br />
Commission (RTC) <strong>of</strong> Southern Nevada developed a branding specification that<br />
highlighted all aspects <strong>of</strong> an alternative transit experience. The MAX system<br />
combined a sleek, state-<strong>of</strong>-the art vehicle, uniquely designed passenger stations,<br />
and an exclusive marketing campaign to introduce the service and educate citizens<br />
and visitors alike regarding BRT in the Las Vegas metropolitan area. The<br />
MAX vehicle features a striking, high-gloss blue, white, and gold exterior that<br />
prominently displays the MAX logo. To further brand the MAX system, the<br />
same prominent color scheme and logo are integrated into the identification <strong>of</strong><br />
stations, signage, ticket vending machines<br />
(TVMs), and the overall paint scheme <strong>of</strong><br />
the facilities. The marketing campaign employed<br />
free “Try MAX on Us” passes, MAX<br />
promotional labels on give-away bottled<br />
water, and colorful information packets.<br />
Additionally, outreach events were held<br />
throughout the community to teach riders<br />
how to use the TVMs.<br />
BRT Elements and System Performance<br />
Metro Rapid, Los Angeles<br />
In Los Angeles, the introduction <strong>of</strong> a unique branding specification for Metro<br />
Rapid service has been critical in getting the riding public to associate Metro<br />
Rapid with high-frequency, limited-stop service. In the case <strong>of</strong> Metro Rapid, the<br />
success <strong>of</strong> the program was very much predicated on Metro’s service formula,<br />
which operates 4-5 minute peak hour headways on its Wilshire and Ventura lines.<br />
The riding public immediately associated Metro Rapid’s distinct red buses and<br />
distinct stations with high-frequency, headway-based service, and this branding<br />
strategy eased the challenge <strong>of</strong> expanding the market niche for high-frequency<br />
regional express service. Eventually, the success <strong>of</strong> this branding approach<br />
prompted the Los Angeles County Metropolitan Transportation Authority to<br />
change how it branded its local service, imitating a similar design scheme for<br />
vehicles but using a different distinct color to suggest tiers <strong>of</strong> service.<br />
3-77
BRT Elements and System Performance<br />
South Miami-Dade Busway<br />
The South Miami-Dade Busway is Miami-Dade <strong>Transit</strong>’s state-<strong>of</strong>-the-art bus<br />
rapid transit system. Branding <strong>of</strong> the service is centered around the system’s<br />
20-mile exclusive running way, which extends from the southern terminus <strong>of</strong><br />
Miami MetroRail - Dadeland South Station. The at-grade, dedicated busway runs<br />
adjacent to Rt. 1, a high-growth corridor. The physical segregation <strong>of</strong> the busway<br />
enables the riding public to immediately identify the exclusive busway as a faster<br />
way to travel using transit. A total <strong>of</strong> 56 uniquely-designed and painted shelters<br />
serve the 28 stops along the busway. Extensive landscaping between the stations<br />
complements the beauty <strong>of</strong> neighboring communities and adds to the system’s<br />
identity. Both full-size buses and minibuses operate on the busway and in adjacent<br />
neighborhoods, entering the exclusive lanes at major intersections. This<br />
fleet is not designated in any special way (e.g., through a different livery or logo).<br />
3-78<br />
LYMMO, Orlando<br />
The LYMMO is a BRT route that operates on a continuous loop through downtown<br />
Orlando using gray running way pavers to indicate that the lanes are for<br />
LYMMO vehicles only. The LYMMO uses smaller, low-floor vehicles with colorful<br />
public-art exteriors to enhance the customer’s experience and to give the system<br />
a unique identity. The LYMMO has 11 enhanced stations and 8 stops. The stations<br />
feature shelters that are unique to the LYMMO system. In addition to these<br />
branded aspects, the LYMMO also has a unique logo on vehicles, stations, and<br />
stops. LYMMO’s unique branding and fare-free service have been important to<br />
its success as a high-frequency, fast, reliable, and premium transit service.
Orange Line, Los Angeles<br />
The Orange Line, one <strong>of</strong> the first BRT lines with the comprehensive set <strong>of</strong> features<br />
associated with BRT systems in the U.S., began operating in October 2005.<br />
It features a 14-mile dedicated busway, high-capacity articulated buses, railinspired<br />
stations, level boarding, <strong>of</strong>f-board fare payment, and headway-based<br />
schedules. To give the Orange Line a premium service image, the Los Angeles<br />
County Metropolitan Transportation Authority (Metro) has branded the route<br />
similar to how it brands its rail lines. It is the only bus line that has been given a<br />
color-coded name designation, the route is included on the rail system map, and<br />
the vehicles are painted in the same silver and gray color pattern as Metro rail<br />
vehicles. The 60-ft articulated “Metro Liners” are powered by compressed natural<br />
gas and feature aerodynamic styling, panoramic windows, low floors, wide<br />
aisles and doors, and on-board video monitors. All Orange Line stations have the<br />
same basic design and construction, ensuring a consistent, recognizable brand<br />
identity with integrated art elements, developed in a similar fashion as the art in<br />
the rail stations. Each station <strong>of</strong>fers various amenities such as bicycle racks and<br />
lockers, covered seating, telephones, lighting, and security cameras. The Orange<br />
Line has an interactive website that highlights its similarity to rail and explains<br />
how to use the service.<br />
BRT Elements and System Performance<br />
EmX Green Line, Eugene<br />
In January 2007, Eugene, Oregon joined Los Angeles as one <strong>of</strong> the first U.S. cities<br />
to launch a full-service BRT system. The four-mile EmX Green Line uses dedicated<br />
busways, exclusive bus lanes, transit signal priority, high-capacity vehicles<br />
with near-level boarding, widely-spaced stations, <strong>of</strong>f-board fare collection, and<br />
short headways. A “green” image is a central theme <strong>of</strong> the branding strategy <strong>of</strong><br />
the EmX (short for “Emerald Express”). The Green Line is the first operational<br />
route in what is planned to be a comprehensive system <strong>of</strong> BRT corridors. The<br />
routes will all be given color names instead <strong>of</strong> conventional bus route numbers.<br />
Approximately two-thirds <strong>of</strong> the service operates in exclusive lanes, which are<br />
constructed in concrete to distinguish them from general purpose lanes. Stations<br />
have raised platforms, display a consistent shelter design, provide real-time passenger<br />
information, and are located predominately in the median <strong>of</strong> the street to<br />
emphasize the rail-like nature <strong>of</strong> the service. EmX service is provided by modern,<br />
60-ft articulated vehicles that have a sleek silhouette and multiple doors on both<br />
sides. In keeping with the “green” theme, the buses are hybrid-electric and are<br />
painted green and silver with the EmX logo.<br />
3-79
BRT Elements and System Performance<br />
BRT Elements by System and Brand Identity<br />
Exhibit 3-14 presents a summary <strong>of</strong> BRT elements that support a differentiated<br />
brand identity for BRT systems in 36 cities around the world. The most common<br />
technique to give separate brand identity is the use <strong>of</strong> a different look for<br />
vehicles. In the U.S., this is the most popular branding technique, with roughly<br />
two-thirds <strong>of</strong> the U.S. BRT cities operating stylized vehicles and about 75 percent<br />
using a distinct livery for the BRT vehicles. Systems are also more likely to use<br />
articulated vehicles; while this may be done primarily to achieve capacity and<br />
headway targets, it does also support branding efforts, since most conventional<br />
fleets are served by 40-ft buses. Articulated vehicles also present a more “raillike”<br />
appearance. It should be noted that there is a general trend in U.S. transit<br />
toward more “stylized” buses and, in some <strong>of</strong> the cities in Exhibit 3-14, the vehicle<br />
styling used for the BRT buses also is being adopted throughout the fleet. However,<br />
a distinct livery continues to be used to allow customers to distinguish the<br />
BRT vehicles from the regular fleet.<br />
The three Canadian cities listed use varying strategies. Ottawa operates its standard<br />
fleet vehicles on the <strong>Transit</strong>way. By contrast, special vehicles are central to<br />
the York Region <strong>Transit</strong>’s branding scheme for the VIVA. The agency purchased<br />
a separate fleet <strong>of</strong> stylized articulated vehicles for the VIVA, with a spacious interior<br />
configuration and distinct blue-and-white livery. Vehicles are also a strong<br />
branding component for the three Latin American systems.<br />
Like the U.S., most, but not all, European systems use distinctly stylized and<br />
marked vehicles for their BRT systems. European cities are also the most likely to<br />
use some type <strong>of</strong> vehicle guidance mechanism, which can support a high-quality<br />
service image for BRT by allowing level boarding. The Australian systems <strong>of</strong>ten<br />
use conventional buses with a standard livery or a very minor distinguishing livery<br />
element. It should be noted that, in both Europe and Australia, conventional<br />
fleet buses already have many <strong>of</strong> the features associated with “modern styling” in<br />
the U.S., such as large, single-pane windshields, large side windows, and curving<br />
lines instead <strong>of</strong> boxy corners.<br />
A few systems rely on a dedicated running way rather than vehicle attributes to<br />
brand the service. The Ottawa <strong>Transit</strong>way, the Pittsburgh busways, Brisbane’s<br />
busways, and Adelaide’s North East Busway all use regular fleet vehicles for busway<br />
operations. Overall, however running way location and running way priority<br />
are used less frequently, however, as a key branding element. Decisions about<br />
running way priority appear to be based primarily on considerations such as<br />
availability <strong>of</strong> right-<strong>of</strong>-way and capacity goals.<br />
3-80<br />
Stations also play an important role in branding for most <strong>of</strong> the systems summarized<br />
in Exhibit 3-14. Most systems <strong>of</strong>fer enhanced shelters, at a minimum, with<br />
many using full station designs more <strong>of</strong>ten associated with rail systems. Decisions<br />
about station types are dependent on the running way location, which impacts<br />
the available space for the BRT stations and may limit the ability to implement<br />
stations with a substantial physical presence. Nevertheless, most systems strive<br />
to differentiate their BRT stops from conventional bus stops with greater levels <strong>of</strong><br />
sheltering; seating, lighting and other passenger amenities; and a distinct design<br />
scheme <strong>of</strong>ten tied into the look <strong>of</strong> the buses. A few systems have invested in very<br />
substantial station structures—<strong>of</strong>ten at transfer points or service termini - that<br />
play an important role in the branding by raising the pr<strong>of</strong>ile <strong>of</strong> the entire service.<br />
For example, the dramatic architecture <strong>of</strong> the underground Courthouse Station<br />
on Boston’s Silver Line Waterfront BRT service led the Boston Globe to call it<br />
“one <strong>of</strong> the remarkable new spaces” in the city. Brisbane, Bogotá, Guayaquil, and<br />
Pereira also each feature some architecturally-noteworthy stations. (The section<br />
on “Contextual Design” has more discussion on the importance <strong>of</strong> stations to<br />
image <strong>of</strong> a BRT system.)<br />
Latin America is the only region that consistently uses barrier-enforced fare collection<br />
as a strong branding element. The U.S., Australian, and Chinese systems<br />
still rely more on vehicle-based payment systems, while European systems frequently<br />
employ on-board payment in combination with pro<strong>of</strong>-<strong>of</strong>-payment fare<br />
collection.<br />
The primary ITS element used to support branding is passenger information.<br />
Most BRT systems have implemented passenger information systems at stations<br />
and on vehicles, or pre-trip planning via the web. Almost all the cities in Latin<br />
America, Europe, and Australia provide real-time passenger information at stations,<br />
while about half <strong>of</strong> the U.S. and Canadian systems do.
Exhibit 3-14: BRT Elements by System and Brand Identity<br />
City, State / Province / Country Albuquerque Boston Silver Line<br />
BRT Elements and System Performance<br />
BRT Line / System Rapid Ride Washington Street Waterfront SL1 – Airport<br />
Running Way (miles)<br />
On Street Mixed Lanes 13.1 0.2 3.5<br />
On Street Exclusive Bus Lanes 0.7 2.2<br />
Off Street Mixed Lanes 0.0<br />
Off Street Reserved Lanes 0.0<br />
At-Grade <strong>Transit</strong>way 0.0<br />
Grade-Separated <strong>Transit</strong>way<br />
Queue Jumpers<br />
- 1.0<br />
Marking<br />
Station<br />
Signage Signage and Striping<br />
Type<br />
Vehicles<br />
Enhanced Shelter<br />
No Shelter, Basic Shelter, Enhanced Shelter &<br />
<strong>Transit</strong> Center<br />
No Shelter, Underground Station & <strong>Transit</strong> Center<br />
Configuration Articulated Stylized Articulated Articulated<br />
Description <strong>of</strong> Livery / Image Red & White Paint, Rapid Ride Logo Special livery Special livery<br />
Interior Features Molded plastic with fabric inserts Standard seats in 2+2 configuration luggage racks for airport line<br />
Propulsion System and Fuel<br />
Fare Collection<br />
Hybrid-Electric, ULSD ICE CNG Dual-Mode diesel & electric, ULSD<br />
Fare Collection Process Pay on-board Pay On-Board Barrier at 3 underground stops; pay on board elsewhere<br />
Fare Media and Payment Options<br />
ITS<br />
Cash & Paper only Cash / Paper Transfers / Magnetic Stripe / Smart Cards cash, paper ticket, smart card<br />
<strong>Transit</strong> Vehicle Prioritization TSP TSP - Green Extension, Red Truncation No<br />
Intelligent Vehicle Systems None None None<br />
Passenger Information<br />
At Station / On Vehicle<br />
LED Nextbus signs<br />
VMS at Stations and in-vehicle<br />
LED signs with schedule info at stations; vehicles have<br />
public address and VMS with stop announcements<br />
Identity and Image Performance All 3 routes<br />
Survey <strong>of</strong> Customer Perceptions Yes<br />
Survey <strong>of</strong> General Customer<br />
Satisfaction exists? (yes/no)<br />
Yes, High<br />
A 2003 survey <strong>of</strong> passengers found that 90% <strong>of</strong> Silver Line<br />
Washington Street riders rate the service as<br />
"good to excellent."<br />
In a 2006 passenger survey, 60% rated station features as<br />
good or excellent; 53% rated shelter amenities good or<br />
excellent; 70% rated driver courtesy good or excellent;<br />
87% rated vehicle cleanliness good or excellent<br />
3-81
BRT Elements and System Performance<br />
3-82<br />
Exhibit 3-14: BRT Elements by System and Brand Identity (cont’d.)<br />
City, State / Province / Country Boston Silver Line Chicago<br />
BRT Line / System Waterfront SL2 - BMIP Western Avenue Express Irving Park Express<br />
Running Way (miles)<br />
On Street Mixed Lanes<br />
On Street Exclusive Bus Lanes<br />
Off Street Mixed Lanes<br />
Off Street Reserved Lanes<br />
At-Grade <strong>Transit</strong>way<br />
1.2 18.3 9.0<br />
Grade-Separated <strong>Transit</strong>way<br />
Queue Jumpers<br />
Marking<br />
Station<br />
1.0<br />
Type<br />
Vehicles<br />
No Shelter, Underground Station & <strong>Transit</strong> Center No Shelter No Shelter<br />
Configuration Articulated<br />
Description <strong>of</strong> Livery / Image<br />
Interior Features<br />
Special livery Distinct electronic destination signs Distinct electronic destination signs<br />
Propulsion System and Fuel<br />
Fare Collection<br />
Dual-Mode diesel & electric, ULSD<br />
Fare Collection Process Barrier at 3 underground stops; pay on board elsewhere On Board On Board<br />
Fare Media and Payment Options<br />
ITS<br />
cash, paper ticket, smart card Cash & Paper Cash & Paper<br />
<strong>Transit</strong> Vehicle Prioritization No<br />
Intelligent Vehicle Systems none<br />
Passenger Information<br />
LED signs with schedule info at stations; vehicles have public<br />
address and VMS with stop announcements<br />
Identity and Image Performance<br />
Survey <strong>of</strong> Customer Perceptions<br />
All 3 routes<br />
Survey <strong>of</strong> General Customer<br />
Satisfaction exists? (yes/no)<br />
In a 2006 passenger survey, 60% rated station features as<br />
good or excellent; 53% rated shelter amenities good or<br />
excellent; 70% rated driver courtesy good or excellent; 87%<br />
rated vehicle cleanliness good or excellent
Exhibit 3-14: BRT Elements by System and Brand Identity (cont’d.)<br />
City, State / Province / Country Chicago Cleveland Eugene Honolulu<br />
BRT Elements and System Performance<br />
BRT Line / System Garfield Express HealthLine EmX City Express: A City Express: B<br />
Running Way (miles)<br />
On Street Mixed Lanes 9.4 2.7 1.4 19.0 8.0<br />
On Street Exclusive Bus Lanes<br />
Off Street Mixed Lanes<br />
Off Street Reserved Lanes<br />
At-Grade <strong>Transit</strong>way<br />
Grade-Separated <strong>Transit</strong>way<br />
4.4 2.6<br />
Queue Jumpers Queue jump<br />
Marking<br />
Station<br />
Signage<br />
Raised delineators; concrete<br />
pavement, markings<br />
Type<br />
Vehicles<br />
No Shelter Enhanced Shelter Enhanced Shelter, Station Building Basic Shelter Basic Shelter<br />
Configuration Stylized articulated Stylized articulated Articulated Standard<br />
Description <strong>of</strong> Livery / Image<br />
Distinct electronic<br />
destination signs<br />
Specialized Livery, Large<br />
Windows<br />
Specialized Livery, Large Windows Standard livery Standard livery<br />
Interior Features Wide Aisles and Doors Wide Aisles and Doors<br />
Propulsion System and Fuel<br />
Fare Collection<br />
Hybrid diesel Hybrid diesel Diesel / Hybrid-Electric Diesel<br />
Fare Collection Process On Board Off Board, Pro<strong>of</strong> <strong>of</strong> Payment None—to be <strong>of</strong>f board Pay On-Board Pay On-Board<br />
Fare Media and Payment Options<br />
ITS<br />
Cash & Paper N/A Cash & Paper Cash & Paper<br />
<strong>Transit</strong> Vehicle Prioritization TSP TSP<br />
Intelligent Vehicle Systems mechanical guidance Visual guidance<br />
Passenger Information Real time passenger info Vehicle, Web<br />
Identity and Image Performance<br />
Survey <strong>of</strong> Customer Perceptions<br />
Survey <strong>of</strong> General Customer<br />
Satisfaction exists? (yes/no)<br />
A 2007 rider satisfaction survey<br />
yielded an average rating <strong>of</strong> 7.4 on a<br />
10-point scale.<br />
Traveler Information planned<br />
on vehicles, at several stations<br />
Traveler Information planned<br />
on vehicles, at several stations<br />
Yes Yes<br />
3-83
BRT Elements and System Performance<br />
3-84<br />
Exhibit 3-14: BRT Elements by System and Brand Identity (cont’d.)<br />
City, State / Province / Country Honolulu Kansas City Las Vegas Los Angeles<br />
BRT Line / System Country Express: C MAX - Main St MAX Orange Line<br />
Running Way (miles)<br />
On Street Mixed Lanes 18.0 6.0 3.0 1.0<br />
On Street Exclusive Bus Lanes<br />
along certain segments,<br />
for certain times <strong>of</strong> day<br />
4.5 -<br />
Off Street Mixed Lanes 3.5 - 0.0<br />
Off Street Reserved Lanes 17.5 - 0.0<br />
At-Grade <strong>Transit</strong>way - 13.5<br />
Grade-Separated <strong>Transit</strong>way -<br />
Queue Jumpers 1 queue jumper<br />
Marking<br />
Station<br />
Zipper Lane Concrete Barrier Bus Only Markings Signage, Striping At-Grade Busway, Signage at Intersections<br />
Type<br />
Vehicles<br />
Basic Shelter Enhanced Shelter Basic and Enhanced Shelter Enhanced Shelter<br />
Configuration Articulated Stylized Standard Stylized Articulated Stylized Articulated<br />
Description <strong>of</strong> Livery / Image Standard livery<br />
MAX logo, unique livery and image, large<br />
continuous windows, sleek look<br />
Sleek, modern lines with<br />
large windows,<br />
Silver metallic two-tone paint scheme &<br />
Metro Orange Line name branding, large<br />
windows<br />
Interior Features<br />
Modern looking interior, increased aisle width,<br />
increase hip-to-knee room, wider doors,<br />
wider windows<br />
modern auto like interior,<br />
finished window glazing<br />
USSC Aries cloth seats<br />
Propulsion System and Fuel<br />
Fare Collection<br />
Diesel / Hybrid-Electric ULSD Diesel Electric Hybrid ICE CNG<br />
Fare Collection Process Pay On-Board Pay On-board Pro<strong>of</strong>-<strong>of</strong>-Payment Pro<strong>of</strong>-<strong>of</strong>-Payment<br />
Fare Media and Payment Options<br />
ITS<br />
Cash & Paper Cash & Magnetic Stripe Magnetic Stripe Tickets from TVM and standard paper passes<br />
<strong>Transit</strong> Vehicle Prioritization TSP TSP<br />
Intelligent Vehicle Systems Optical Docking (not used) None<br />
Passenger Information<br />
Identity and Image Performance<br />
Traveler Information planned<br />
on vehicles, at several stations<br />
Real-time at all stations, Trip Planning<br />
Station, Telephone, Internet,<br />
On-Vehicle Electronic<br />
Displays<br />
Nextbus VMS<br />
Survey <strong>of</strong> Customer Perceptions yes Yes Y, very good<br />
Survey <strong>of</strong> General Customer<br />
Satisfaction exists? (yes/no)<br />
Yes<br />
A 2005 on-board survey found that Max rated<br />
excellent on all 20 factors, that service quality<br />
was "High" and that riders would definitely<br />
recommend MAX.<br />
A survey in February 2005<br />
showed that 97% <strong>of</strong> riders<br />
rated their experience riding<br />
MAX as “good” or “excellent.”<br />
A 2006 rider survey found that 95% <strong>of</strong> riders<br />
like the Orange Line Metroliner vehicle and<br />
91% like the pre-paid boarding system.
Exhibit 3-14: BRT Elements by System and Brand Identity (cont’d.)<br />
BRT Elements and System Performance<br />
City, State / Province / Country Los Angeles Miami Oakland Orlando<br />
BRT Line / System Metro Rapid (All Routes) Busway San Pablo Ave Rapid LYMMO<br />
Running Way (miles)<br />
On Street Mixed Lanes 229.5 14.0<br />
On Street Exclusive Bus Lanes - -<br />
Off Street Mixed Lanes 0.0<br />
Off Street Reserved Lanes 0.0 -<br />
At-Grade <strong>Transit</strong>way 0.0 20.0 3.0<br />
Grade-Separated <strong>Transit</strong>way -<br />
Queue Jumpers Queue Jumpers Queue jumpers<br />
Marking<br />
Station<br />
At-Grade Busway Busway Barrier, Gray Pavers<br />
Type<br />
Vehicles<br />
No Shelter, Enhanced Shelter,<br />
<strong>Transit</strong> Center<br />
Enhanced Shelter Basic Shelter Enhanced Shelter<br />
Configuration<br />
Stylized Standard and<br />
Articulated<br />
Standard, Articulated, Minis Stylized standard Stylized standard<br />
Description <strong>of</strong> Livery / Image<br />
Red/Silver two-tone paint<br />
scheme & Metro Rapid name<br />
branding<br />
Standard <strong>Transit</strong><br />
Specialized Livery, Logos,<br />
Branding<br />
Specialized Livery, Wide Doors<br />
Interior Features<br />
Propulsion System and Fuel<br />
Fare Collection<br />
ICE CNG Hybrid, CNG, Diesel Ultra-low-sulfur diesel ICE CNG<br />
Fare Collection Process Pay On-board Pay on Board Pay On-Board Free<br />
Fare Media and Payment Options<br />
ITS<br />
Cash and Paper Passes Cash, paper swipe card Free<br />
<strong>Transit</strong> Vehicle Prioritization TSP No TSP TSP<br />
Intelligent Vehicle Systems None<br />
Collision warning, lane assist, precision<br />
docking<br />
Passenger Information<br />
Nextbus VMS at stations,<br />
Telephone, Internet<br />
Traveler information at stations and on vehicle<br />
Real-time arrival at stations;<br />
traveler info on vehicle &<br />
via PDA<br />
Traveler Information at stations and on<br />
vehicle; web-based<br />
Identity and Image Performance All 2004<br />
Survey <strong>of</strong> Customer Perceptions Y, very good 65% see busway as attractive 93% view favorably<br />
Survey <strong>of</strong> General Customer<br />
Satisfaction exists? (yes/no)<br />
Customers give Metro Rapid<br />
a rating <strong>of</strong> 3.76 out <strong>of</strong> 5.00,<br />
compared to 3.15 for the<br />
former limited bus service<br />
Average Satisfaction with Busway is 3.75 out <strong>of</strong><br />
5 compared to 3.61 for all MDT services.<br />
83% <strong>of</strong> riders rate Rapid<br />
Bus as Good or Excellent<br />
compared to 72% who rated<br />
the system similarly in a<br />
survey 2 years prior.<br />
Mean satisfaction: 4.41 out <strong>of</strong> 5.0; 52.5% <strong>of</strong><br />
passengers have improved their opinions <strong>of</strong><br />
public transit.<br />
3-85
BRT Elements and System Performance<br />
3-86<br />
Exhibit 3-14: BRT Elements by System and Brand Identity (cont’d.)<br />
City, State / Province / Country Phoenix<br />
BRT Line / System RAPID - I-10 East RAPID - I-10 West RAPID - SR-51 RAPID - I-17<br />
Running Way (miles)<br />
On Street Mixed Lanes<br />
On Street Exclusive Bus Lanes<br />
Off Street Mixed Lanes<br />
6.5 4.8 12.3 8.0<br />
Off Street Reserved Lanes 14.0 8.0 10.3 11.5<br />
At-Grade <strong>Transit</strong>way<br />
Grade-Separated <strong>Transit</strong>way<br />
Queue Jumpers<br />
- - - -<br />
Marking<br />
Station<br />
Signage Signage Signage Signage<br />
Type<br />
Vehicles<br />
Enhanced Shelter Enhanced Shelter Enhanced Shelter Enhanced Shelter<br />
Configuration Specialized composite bus Specialized composite bus Specialized composite bus Specialized composite bus<br />
Description <strong>of</strong> Livery / Image Distinct styling & livery Distinct styling & livery Distinct styling & livery Distinct styling & livery<br />
Interior Features<br />
high-back seating, forward<br />
facing, luggage racks,<br />
overhead lighting,<br />
reclining seats<br />
high-back seating, forward facing, luggage<br />
racks, overhead lighting, reclining seats<br />
high-back seating, forward<br />
facing, luggage racks,<br />
overhead lighting,<br />
reclining seats<br />
high-back seating, forward facing, luggage<br />
racks, overhead lighting, reclining seats<br />
Propulsion System and Fuel<br />
Fare Collection<br />
LNG LNG LNG LNG<br />
Fare Collection Process Pay On-Board Pay On-Board Pay On-Board Pay On-Board<br />
Fare Media and Payment Options<br />
ITS<br />
Cash, Magnetic Cash, Magnetic Cash, Magnetic Cash, Magnetic<br />
<strong>Transit</strong> Vehicle Prioritization TSP at 1 intersection TSP at 1 intersection TSP at 1 intersection TSP at 1 intersection<br />
Intelligent Vehicle Systems Collision Warning Collision Warning Collision Warning Collision Warning<br />
Passenger Information<br />
Identity and Image Performance<br />
Survey <strong>of</strong> Customer Perceptions<br />
Survey <strong>of</strong> General Customer<br />
Satisfaction exists? (yes/no)<br />
Real-time arrival at stations;<br />
on-vehicle announcements;,<br />
PDA and web-based info.<br />
Real-time arrival at stations; on-vehicle<br />
announcements;, PDA and web-based info.<br />
Real-time arrival at stations;<br />
on-vehicle announcements;,<br />
PDA and web-based info.<br />
Real-time arrival at stations; on-vehicle<br />
announcements;, PDA and web-based info.
Exhibit 3-14: BRT Elements by System and Brand Identity (cont’d.)<br />
BRT Elements and System Performance<br />
City, State / Province / Country Pittsburgh Sacramento<br />
BRT Line / System East Busway South Busway West Busway EBus - Stockton<br />
Running Way (miles)<br />
On Street Mixed Lanes 8.0<br />
On Street Exclusive Bus Lanes 0.0<br />
Off Street Mixed Lanes 0.4 - 0.4 0.0<br />
Off Street Reserved Lanes - - - 0.0<br />
At-Grade <strong>Transit</strong>way 4.6 0.0<br />
Grade-Separated <strong>Transit</strong>way 8.7 4.3 None<br />
Queue Jumpers 1 queue jumper<br />
Marking<br />
Station<br />
Grade Separated Grade Separated Busway None<br />
Type<br />
Vehicles<br />
Enhanced Shelter Enhanced Shelter Enhanced Shelter No Shelter, Basic Shelter, <strong>Transit</strong> Center<br />
Configuration Standard & Articulated Standard & Articulated Standard & Articulated Standard<br />
Description <strong>of</strong> Livery / Image Standard & Articulated Standard & Articulated Standard & Articulated Standard Branded<br />
Interior Features Cushioned Seats Cushioned Seats Cushioned Seats Standard<br />
Propulsion System and Fuel<br />
Fare Collection<br />
Standard Diesel with 5 CNG Standard Diesel with 5 CNG Standard Diesel with 5 CNG ICE CNG<br />
Fare Collection Process Pay On-Board Pay On-Board Pay On-Board Pay on-board<br />
Fare Media and Payment Options<br />
ITS<br />
Cash and Paper Only Cash and Paper Only Cash and Paper Only cash and passes<br />
<strong>Transit</strong> Vehicle Prioritization<br />
Signal Priority (magnetic<br />
loop sensors)<br />
TSP - Green Ext<br />
Intelligent Vehicle Systems Collision Warning Collision Warning Collision Warning None<br />
Passenger Information<br />
Identity and Image Performance<br />
On Vehicle<br />
Survey <strong>of</strong> Customer Perceptions Yes<br />
Survey <strong>of</strong> General Customer<br />
Satisfaction exists? (yes/no)<br />
91% <strong>of</strong> riders surveyed<br />
indicated the West Busway<br />
was Very Important or Fairly<br />
Important in their decision<br />
to start using the bus.<br />
Yes<br />
3-87
BRT Elements and System Performance<br />
3-88<br />
Exhibit 3-14: BRT Elements by System and Brand Identity (cont’d.)<br />
City, State / Province / Country San Jose Halifax Ottawa<br />
BRT Line / System Rapid 522 Metro<strong>Link</strong> 95 96 97<br />
Running Way (miles)<br />
On Street Mixed Lanes 25.0 12.1 2.1 2.1 2.1<br />
On Street Exclusive Bus Lanes 0.0 0.5<br />
Off Street Mixed Lanes 0.0 10.6 3.2 13.1 5.2<br />
Off Street Reserved Lanes 0.0 - 8.7 3.8 1.2<br />
At-Grade <strong>Transit</strong>way 0.0 - 12.0 8.2 9.8<br />
Grade-Separated <strong>Transit</strong>way - -<br />
Queue Jumpers Queue Jumpers<br />
Marking<br />
Station<br />
None Signage Signage, Pavement Color<br />
Signage, Pavement<br />
Color<br />
Signage, Pavement Color<br />
Type<br />
Vehicles<br />
No Shelter, Basic Shelter and<br />
Enhanced Shelter; <strong>Transit</strong><br />
Center<br />
Basic Shelter, Station Enclosures<br />
Station Enclosures and<br />
Buildings<br />
Station Enclosures and<br />
Buildings<br />
Station Enclosures and<br />
Buildings<br />
Configuration<br />
Stylized Standard and<br />
Articulated<br />
Stylized Standard Articulated Standard Articulated<br />
Description <strong>of</strong> Livery / Image BRT-only full bus wraps<br />
Blue, yellow, white patterned livery<br />
and unique branding<br />
Maple leaf livery; similar to<br />
rest <strong>of</strong> fleet<br />
Maple leaf livery; similar<br />
to rest <strong>of</strong> fleet<br />
Maple leaf livery; similar<br />
to rest <strong>of</strong> fleet<br />
Interior Features<br />
Typical transit bus - front<br />
facing, upholstered seats<br />
Cloth seats, reclining with arm / foot<br />
rests<br />
Cloth seats Cloth seats Cloth seats<br />
Propulsion System and Fuel<br />
Fare Collection<br />
ICE LSD ICE Biodiesel ICE Low-sulfur diesel ICE Low-sulfur diesel ICE Low-sulfur diesel<br />
Fare Collection Process Pay On-board Pay on-board Pro<strong>of</strong>-<strong>of</strong>-Payment Pro<strong>of</strong>-<strong>of</strong>-Payment Pro<strong>of</strong>-<strong>of</strong>-Payment<br />
Fare Media and Payment Options<br />
ITS<br />
Cash and Paper Passes.<br />
Smart cards in development<br />
cash / tickets / passes<br />
Cash, Paper tickets, or<br />
passes<br />
Cash, Paper tickets, or<br />
passes<br />
Cash, Paper tickets, or<br />
passes<br />
<strong>Transit</strong> Vehicle Prioritization<br />
TSP - Green Extension, Red<br />
Truncation<br />
TSP TSP TSP TSP<br />
Intelligent Vehicle Systems None<br />
Automated next stop<br />
announcements. Real-<br />
None None None None<br />
Passenger Information<br />
Identity and Image Performance<br />
Time info in development.<br />
Automated trip planning<br />
through website<br />
Real-time display, trip planning Yes Yes Yes<br />
Survey <strong>of</strong> Customer Perceptions No Y, excellent<br />
Survey <strong>of</strong> General Customer<br />
Satisfaction exists? (yes/no)<br />
Yes Y, excellent
Exhibit 3-14: BRT Elements by System and Brand Identity (cont’d.)<br />
BRT Elements and System Performance<br />
City, State / Province / Country York Bogota Guayaquil<br />
BRT Line / System VIVA Blue VIVA Purple Transmilenio Metrovia<br />
Running Way (miles)<br />
On Street Mixed Lanes 20.3 17.1 - -<br />
On Street Exclusive Bus Lanes - -<br />
Off Street Mixed Lanes - -<br />
Off Street Reserved Lanes - -<br />
At-Grade <strong>Transit</strong>way<br />
Grade-Separated <strong>Transit</strong>way<br />
52.0 10.0<br />
Queue Jumpers Bus-Only Lanes at some intersections Bus-Only Lanes at some intersections - -<br />
Marking<br />
Station<br />
None None Busway, Signage Busway, Signage<br />
Type<br />
Vehicles<br />
Basic and Enhanced Shelter Basic and Enhanced Shelter Station Station<br />
Configuration Articulated Standard Stylized Articulated Stylized Standard & Articulated<br />
Description <strong>of</strong> Livery / Image Metallic blue with Viva logo Metallic blue with Viva logo Red, branded articulated buses<br />
Blue, branded articulated<br />
buses<br />
Interior Features<br />
Cloth seats in spacious arrangement and<br />
tables for workspace at some rear seats.<br />
WiFi being deployed. Large windows.<br />
Bright, large in-vehicle display screens<br />
Cloth seats in spacious arrangement and<br />
tables for workspace at some rear seats.<br />
WiFi being deployed. Large windows.<br />
Bright, large in-vehicle display screens<br />
molded plastic seats, front/rear<br />
and side facing<br />
Propulsion System and Fuel<br />
Fare Collection<br />
ICE Clean diesel ICE Clean diesel<br />
Diesel; CNG pilot project<br />
underway with 3 buses<br />
x<br />
Fare Collection Process Pro<strong>of</strong>-<strong>of</strong>-Payment Pro<strong>of</strong>-<strong>of</strong>-Payment<br />
Barrier (Verify at station<br />
entrances / exits)<br />
Barrier<br />
Fare Media and Payment Options<br />
ITS<br />
Paper tickets or passes Paper tickets or passes Smart Cards Cash, Smart Cards<br />
<strong>Transit</strong> Vehicle Prioritization<br />
Limited to buses that are behind<br />
schedule with a max <strong>of</strong> one bus per<br />
intersection per 2.5 minutes in<br />
any direction<br />
Limited to buses that are behind schedule<br />
with a max <strong>of</strong> one bus per intersection<br />
per 2.5 minutes in any direction<br />
x x<br />
Intelligent Vehicle Systems None None none None<br />
Passenger Information<br />
Identity and Image Performance<br />
VMS at stops and on-board VMS at stops and on-board Nextbus displays at stations Nextbus displays at stations<br />
Survey <strong>of</strong> Customer Perceptions Excellent Excellent yes<br />
Survey <strong>of</strong> General Customer<br />
Satisfaction exists? (yes/no)<br />
Excellent Excellent yes<br />
x<br />
3-89
BRT Elements and System Performance<br />
3-90<br />
Exhibit 3-14: BRT Elements by System and Brand Identity (cont’d.)<br />
City, State / Province / Country Pereira Amsterdam Caen Edinburgh<br />
BRT Line / System Megabus Zuidtangent Tram on Wheels Fastlink<br />
Running Way (miles)<br />
On Street Mixed Lanes - 1.9 1.9<br />
On Street Exclusive Bus Lanes - 6.2 9.2 2.2<br />
Off Street Mixed Lanes - 2.5 -<br />
Off Street Reserved Lanes - - -<br />
At-Grade <strong>Transit</strong>way<br />
Grade-Separated <strong>Transit</strong>way<br />
17.0 14.9 0.1 0.9<br />
Queue Jumpers - Queue Jumper<br />
Marking<br />
Station<br />
Busway, Signage Busway, Signage<br />
Signage, concrete track with<br />
rail, landscaping<br />
signage, color, segregation<br />
Type<br />
Vehicles<br />
Station<br />
Enhanced Shelters, Stations,<br />
<strong>Transit</strong> Centers<br />
Configuration Stylized Articulated Articulated Bi-Articulated<br />
Standard single and<br />
double deck<br />
Description <strong>of</strong> Livery / Image Green, branded articulated buses Zuidtangent logo, red braded buses Blue & White- Twisto Standard<br />
Interior Features<br />
molded plastic seats, front/rear and<br />
side facing<br />
"bistro" style semi-circle<br />
seating at rear<br />
Propulsion System and Fuel<br />
Fare Collection<br />
ICE diesel Diesel<br />
Dual Mode- Traction motor<br />
on-rail/ diesel engine <strong>of</strong>f-rail<br />
Diesel<br />
Fare Collection Process Barrier (Verify at station entrances) Pay On-Board or Pro<strong>of</strong> <strong>of</strong> Payment<br />
Pay On-Board or Pro<strong>of</strong> <strong>of</strong><br />
Payment<br />
Pay On-Board or Pro<strong>of</strong> <strong>of</strong><br />
Payment<br />
Fare Media and Payment Options<br />
ITS<br />
Smart Cards Paper (Strippenkart) Smart Cards, Magnetic tickets<br />
Cash Coin (Exact Change) or<br />
Smart Card<br />
<strong>Transit</strong> Vehicle Prioritization x RTSP Signal Priority- Automatic TSP<br />
Intelligent Vehicle Systems none Only for Docking, Mechanical<br />
Mechanical- Central Guidance<br />
Rail<br />
Real-time at Station/Stop,<br />
Mechanical<br />
Passenger Information<br />
Identity and Image Performance<br />
Nextbus displays at stations Real-time stop information, timetabled Online-journey planner and<br />
timetable<br />
Real-time, at Station/Stop, SMS<br />
Survey <strong>of</strong> Customer Perceptions yes<br />
Survey <strong>of</strong> General Customer<br />
Satisfaction exists? (yes/no)<br />
yes
Exhibit 3-14: BRT Elements by System and Brand Identity (cont’d.)<br />
BRT Elements and System Performance<br />
City, State / Province / Country Eindhoven Leeds London Rouen Utrecht<br />
BRT Line / System Phileas - Western Corridor Superbus Crawley TEOR Busway<br />
Running Way (miles)<br />
On Street Mixed Lanes 2.2 - 11.2 8.7 3.5<br />
On Street Exclusive Bus Lanes 3.8 3.7 - 2.0<br />
Off Street Mixed Lanes - - - - -<br />
Off Street Reserved Lanes - - - - -<br />
At-Grade <strong>Transit</strong>way<br />
Grade-Separated <strong>Transit</strong>way<br />
7.2<br />
2.2 0.9 14.9 4.8<br />
Queue Jumpers -<br />
Marking<br />
Signage, concrete track,<br />
landscaping<br />
Curb guidance, pavement<br />
markings, some pavement color<br />
Signage, curb guidance<br />
Color running way<br />
and slightly raised in<br />
downtown<br />
Signage, pavement<br />
markings, pavement<br />
color<br />
Station<br />
Type<br />
Vehicles<br />
Configuration Articulated, Bi-Articulated Standard Standard Articulated Bi-Articulated<br />
Description <strong>of</strong> Livery / Image<br />
Interior Features<br />
Phileas bus logo Standard<br />
Fastway logo, blue/grey<br />
branded buses, unique<br />
enhanced shelters<br />
TEOR Logo (Transport<br />
Est-Ouest Rouennais)<br />
Standard<br />
Propulsion System and Fuel<br />
Fare Collection<br />
Hybrid (LPG/Electric) Diesel Diesel Diesel Diesel<br />
Fare Collection Process<br />
Pro<strong>of</strong>-<strong>of</strong>-Payment, Pay On-Board<br />
machine, no driver payment<br />
Pay On-Board Pay On-Board Off-board Fare Collection<br />
Pro<strong>of</strong>-<strong>of</strong>-Payment, Pay<br />
On-Board<br />
Fare Media and Payment Options<br />
ITS<br />
Paper (Strippenkart) Cash and Paper Only Cash Magnetic Strip Paper (Strippenkart)<br />
<strong>Transit</strong> Vehicle Prioritization TSP Signal Priority in downtown areas<br />
Signal Priority- Automatic<br />
and Manual<br />
Signal Priority-<br />
Automatic<br />
Intelligent Vehicle Systems<br />
Electromagnetic docking<br />
(not in use)<br />
Mechanical Mechanical Optical -<br />
Passenger Information<br />
Identity and Image Performance<br />
Survey <strong>of</strong> Customer Perceptions<br />
Survey <strong>of</strong> General Customer<br />
Satisfaction exists? (yes/no)<br />
Real-time stop information,<br />
timetabled<br />
Real-time, at Station/Stop, SMS<br />
Time tabled, at Station/<br />
Stop<br />
Real-time stop<br />
information, timetabled<br />
Real-time stop<br />
information, timetabled<br />
3-91
BRT Elements and System Performance<br />
3-92<br />
Exhibit 3-14: BRT Elements by System and Brand Identity (cont’d.)<br />
City, State / Province / Country Adelaide Brisbane Sydney<br />
BRT Line / System North East Busway South East Busway Inner Northern Busway Liverpool-Parramatta T-Way<br />
North-West T-Way -<br />
Blacktown-Parklea<br />
Running Way (miles)<br />
On Street Mixed Lanes<br />
On Street Exclusive Bus Lanes<br />
Off Street Mixed Lanes<br />
Off Street Reserved Lanes<br />
6.0 0.3<br />
At-Grade <strong>Transit</strong>way 13.0 4.4<br />
Grade-Separated <strong>Transit</strong>way<br />
Queue Jumpers<br />
7.46 10.3 1.7<br />
Marking<br />
Station<br />
Off-Street Busway, Signage<br />
Off-Street Busway,<br />
Signage<br />
Off-Street Busway,<br />
Signage<br />
Signage, At-Grade Busway<br />
Signage/Red Pavement<br />
Color; Busway<br />
Type<br />
Vehicles<br />
<strong>Transit</strong> Centers Stations, <strong>Transit</strong> Centers Stations, <strong>Transit</strong> Centers<br />
Basic and Enhanced Shelter;<br />
Stations<br />
Stations, <strong>Transit</strong> Centers<br />
Configuration<br />
Standard Articulated = 60<br />
Standard Rigid = 80<br />
Standard Rigid Standard Rigid Standard Rigid Standard Rigid<br />
Description <strong>of</strong> Livery / Image<br />
Standard white and yellow -<br />
same as non busway corridors<br />
Standard Brisbane White, Standard Brisbane White,<br />
Blue and Yellow Blue and Yellow<br />
Standard Sydney Bus Livery -<br />
Blue White and Yellow -<br />
with T-Way Logo<br />
White Red Stripe<br />
Interior Features Luggage racks over wheel hubs<br />
Propulsion System and Fuel<br />
Fare Collection<br />
Diesel<br />
Mix <strong>of</strong> Diesel and CNG<br />
Gas Buses<br />
Mix <strong>of</strong> Diesel and CNG<br />
Gas Buses<br />
Euro 3 diesel Diesel<br />
Fare Collection Process<br />
Pay on Board (80% pre pay<br />
multi-rider ticket)<br />
Pay on Board Pay on Board Pay on Board Pay on Board<br />
Fare Media and Payment Options<br />
ITS<br />
Cash & Paper Magnetic Stripe<br />
Cash & Paper Magnetic<br />
Stripe<br />
Cash & Paper Magnetic<br />
Stripe<br />
Cash & Paper Magnetic Stripe<br />
Cash & Paper Magnetic<br />
Stripe<br />
<strong>Transit</strong> Vehicle Prioritization Passive Priority (No active) - -<br />
Signal Pre-emption including<br />
green extension and early green<br />
-<br />
Intelligent Vehicle Systems<br />
Mechanical Guide Rollers on<br />
Front Axle<br />
None None None None<br />
Passenger Information<br />
Identity and Image Performance<br />
City Web Site has Trip Planning Real Time Info at Stations<br />
Real Time Info at<br />
Stations<br />
Real Time Info at Stations<br />
Real Time Info at Terminus<br />
Stations Only<br />
Survey <strong>of</strong> Customer Perceptions yes yes yes yes<br />
Survey <strong>of</strong> General Customer<br />
Satisfaction exists? (yes/no)<br />
yes yes yes yes
Exhibit 3-14: BRT Elements by System and Brand Identity (cont’d.)<br />
City, State / Province / Country Sydney Beijing Hangzhou Kunming<br />
BRT Line / System<br />
North-West T-Way -<br />
Parramatta-Rouse Hill<br />
Line 1 BRT Line B1 Busway network<br />
Running Way (miles)<br />
On Street Mixed Lanes<br />
On Street Exclusive Bus Lanes 1.9 6.2<br />
Off Street Mixed Lanes 2.2<br />
Off Street Reserved Lanes 24.9<br />
At-Grade <strong>Transit</strong>way<br />
Grade-Separated <strong>Transit</strong>way<br />
Queue Jumpers<br />
8.7<br />
8.1<br />
Marking<br />
Station<br />
Signage/Red Pavement Color;<br />
Busway<br />
Busway Striping Striping<br />
Type<br />
Vehicles<br />
Basic and Enhanced Shelters,<br />
<strong>Transit</strong> Centers<br />
Stations<br />
Configuration Standard Rigid Articulated Articulated Standard<br />
Description <strong>of</strong> Livery / Image<br />
Interior Features<br />
Yellow Specialized BRT vehicles<br />
Specialized red BRT<br />
vehicles<br />
Propulsion System and Fuel<br />
Fare Collection<br />
Diesel Diesel<br />
Fare Collection Process Pay on Board Pay attendants at station Pay at station Pay On-Board<br />
Fare Media and Payment Options<br />
ITS<br />
Cash & Paper Magnetic Stripe Cash / Smart Cards Cash / Smart Cards Cash / IC Cards<br />
<strong>Transit</strong> Vehicle Prioritization - TSP TSP<br />
Intelligent Vehicle Systems None None None None<br />
Passenger Information<br />
Real Time Info at Terminus<br />
Stations Only<br />
Real-Time at stations and<br />
on vehicles<br />
Real-Time at stations and<br />
on vehicles<br />
BRT Elements and System Performance<br />
Currently being implemented<br />
Identity and Image Performance<br />
Survey <strong>of</strong> Customer Perceptions Yes<br />
Survey <strong>of</strong> General Customer<br />
Satisfaction exists? (yes/no)<br />
Yes<br />
3-93
BRT Elements and System Performance<br />
contextual design<br />
description <strong>of</strong> contextual design<br />
A well-designed BRT project complements the scale and character <strong>of</strong> the surrounding<br />
area and can shape a community in ways that go beyond transportation<br />
benefits alone. Quality <strong>of</strong> life is enhanced when systems are designed to<br />
harmonize with their context and create a sense <strong>of</strong> place for the communities<br />
they serve. Designing BRT as an integrated part <strong>of</strong> the community can channel a<br />
wide spectrum <strong>of</strong> benefits relating to the environment, the economy, aesthetics,<br />
public health and safety, and civic participation.<br />
For instance, a well-designed BRT project can serve as a focal point that draws<br />
the community together. Unfortunately, public space <strong>of</strong>ten is neglected in the<br />
design <strong>of</strong> transportation projects, where the focus is on moving people around<br />
(Forsyth et al. 2007). Good public spaces provide a hospitable setting for people<br />
to stop and read, eat lunch, or meet with friends. To that end, introducing a BRT<br />
system into a community can be viewed as an exercise in urban design. BRT facilities<br />
can create a more welcoming, vibrant streetscape by incorporating amenities<br />
such as landscaping, sidewalks, lighting, street furniture, and recreational<br />
trails.<br />
Accessibility and connectivity to the broader urban fabric should be emphasized<br />
as crucial elements <strong>of</strong> contextual design (Neckar 2007). BRT can make a significant<br />
contribution to community integration only when the system is accessible<br />
for all who wish to use it. Because transit facilities serve as a transition between<br />
different modes, they must be carefully tailored to balance the needs <strong>of</strong> pedestrians,<br />
bicyclists, transit riders, and motorists. Moreover, in addition to providing<br />
access for all, facilities must be designed to accommodate and protect the<br />
most vulnerable users (Forsyth et al. 2007). ADA requires adequate circulation<br />
space within a bus shelter, provision <strong>of</strong> sidewalks, bus stops that are connected<br />
to streets and sidewalks by an accessible path, and readable bus route and schedule<br />
information. Open accommodation to all users is, therefore, an important<br />
consideration when address the contextual design <strong>of</strong> the system.<br />
3-94<br />
Effects <strong>of</strong> BRT Elements on contextual design<br />
The BRT elements that impact contextual design most strongly are discussed<br />
below.<br />
Running Ways—Running Way Location, Level <strong>of</strong> Running Way Priority<br />
On-street running ways, by their very nature, are integrated with commercial and residential<br />
uses along major arterial streets. They also have more direct pedestrian access between activity<br />
centers and the systems.<br />
Off-street running ways are less integrated with the urban environment. One potential advantage<br />
<strong>of</strong> the separation from the street network is that potential effects <strong>of</strong> noise and vibration<br />
may be shielded from adjacent communities through a spatial distance buffer or physical<br />
barriers, thereby harmonizing with sensitive land uses. Landscaping associated with <strong>of</strong>f-street<br />
running ways also enhances the design and image <strong>of</strong> the BRT system.<br />
Designated running ways that are attractively designed can convey a sense <strong>of</strong> quality and permanence<br />
that potentially attracts developers and residents who desire high quality transit service.<br />
Running ways also affect the physical environment <strong>of</strong> the surrounding neighborhood. Running Way<br />
Types that shield potential effects <strong>of</strong> noise and vibration can harmonize best with sensitive land uses.<br />
Landscaping with native trees and plants can reinforce a sense <strong>of</strong> place and integrate the running<br />
way with the overall design concept <strong>of</strong> the surrounding neighborhood.<br />
Running Way—Marking<br />
Attractive running way differentiation techniques can advertise the BRT system and reinforce<br />
the image <strong>of</strong> high quality transit service. Specially-colored pavement or “Bus Only” signs and<br />
markings should attract attention to the service without being garish or intrusive. When designed<br />
properly, running way differentiation can strengthen the distinct identity <strong>of</strong> the system<br />
while blending with the scale and style <strong>of</strong> the streetscape and surrounding neighborhood.<br />
Stations—Station Type<br />
The level <strong>of</strong> attention devoted to the design and architecture <strong>of</strong> BRT stations and the degree to<br />
which stations integrate with the surrounding community impacts how potential customers<br />
will perceive the BRT system. This has a direct impact on BRT system ridership, as well as an<br />
indirect impact on nearby development and neighborhood revitalization. Station design also<br />
presents the opportunity to impart the system with unique local character and community<br />
ownership by incorporating elements such as native landscaping, historic preservation, and local<br />
artwork. Stations also should provide a full range <strong>of</strong> amenities such as passenger information,<br />
telephones, vending machines, lighting, and security provisions.<br />
Stations—Station Access<br />
It is important for the system to be accessible to the entire community. To that end, the design<br />
<strong>of</strong> stations and shelters should specify adequate internal circulation, connection to streets and<br />
sidewalks by an accessible path, provision <strong>of</strong> sidewalks, readable route and schedule information,<br />
and generous accommodations for bicyclists and people with disabilities.
Vehicles—Vehicle Configuration<br />
Community integration can be significantly enhanced when vehicles are designed to be accessible<br />
to all members <strong>of</strong> the community. Accommodations such as storage space for bicycles and<br />
wheelchairs, level boarding, ramps, and next-stop voice and text announcements help send the<br />
message that the system belongs to everyone.<br />
Vehicles—Aesthetic Enhancements<br />
Vehicle styling can have a significant impact on the ability <strong>of</strong> the BRT system to fit within the<br />
context <strong>of</strong> the community. Styling that emphasizes various features such as large vehicles to<br />
simulate rail (Los Angeles Orange Line, Eugene EmX), sleek lines and attractive interiors (Las Vegas<br />
MAX), and colors to suggest a high-technology theme (Boston Silver Line) can enhance the<br />
ability <strong>of</strong> a BRT system to integrate with the community. In addition, uniquely-styled vehicles<br />
can act as a tourist attraction in their own right and become a distinct trademark <strong>of</strong> the community.<br />
Branding and paint schemes incorporating themes that are relevant to the area can add<br />
local flair and bring a sense <strong>of</strong> community pride to the system.<br />
Vehicles—Propulsion System<br />
As well as contributing to the image and brand identity <strong>of</strong> BRT service, propulsion systems and<br />
fuels can have clear positive effects on community integration. Furthermore, public health and<br />
quality <strong>of</strong> life in the community can be enhanced with innovative propulsion technologies that<br />
mitigate noise and air pollution.<br />
performance <strong>of</strong> Existing systems<br />
The benefits <strong>of</strong> contextual design are difficult to measure and quantify and even<br />
more difficult to cast in terms <strong>of</strong> monetary value. Therefore, it is inappropriate to<br />
use quantitative terms to evaluate the relative effectiveness <strong>of</strong> BRT investments<br />
in achieving contextual design.<br />
Research Summary<br />
There are numerous detailed case studies where transit facilities with significant<br />
levels <strong>of</strong> amenities, irrespective <strong>of</strong> mode, have had a strong positive impact on<br />
surrounding communities. In addition, BRT improvements that interface with<br />
adjacent land uses and provide capacity for future growth can catalyze new development<br />
and revitalization <strong>of</strong> existing neighborhoods and downtowns. Case<br />
studies documenting integral and contextual design approaches are presented<br />
in TCRP Report 22, “The Role <strong>of</strong> <strong>Transit</strong> in Creating Livable Metropolitan Communities.”<br />
In places including Boston, Houston, Seattle, Miami, and Pittsburgh,<br />
BRT and other quality bus facilities have demonstrated the ability to generate<br />
positive development and redevelopment when other factors such as the development<br />
market and local land use policies are supportive.<br />
BRT Elements and System Performance<br />
System Performance Pr<strong>of</strong>iles<br />
The following section presents system pr<strong>of</strong>iles <strong>of</strong> successful designs as well as<br />
a summary <strong>of</strong> system characteristics that have an effect on contextual design.<br />
System pr<strong>of</strong>iles are useful to illustrate good examples <strong>of</strong> attractive systems and<br />
successful integration <strong>of</strong> BRT systems with their surrounding communities.<br />
LYMMO, Orlando<br />
In Orlando, the LYM-<br />
MO system provides<br />
superior service on<br />
a downtown circulator<br />
route. LYMMO<br />
uses a variety <strong>of</strong> BRT<br />
elements—dedicated<br />
lanes with specialized<br />
paving, advanced<br />
computer monitoring<br />
systems, real-time<br />
bus information at<br />
stations, specially-designed<br />
station shelters, and vehicles that are decorated in themes relevant to Orlando’s<br />
tourism industry. Design <strong>of</strong> the stations and running way were developed<br />
in conjunction with the streetscape for downtown Orlando, providing an integrated<br />
look to the system. This combination <strong>of</strong> elements has highlighted the service<br />
and resulted in significant ridership gains by establishing a high-quality, free<br />
bus service in the downtown area. LYMMO was developed as a distinct brand<br />
with its own logo and vehicles. Free fares also are part <strong>of</strong> its appeal to the riders.<br />
South East Busway, Brisbane<br />
The South East Busway in Brisbane, Australia represents<br />
an achievement in system design. The design <strong>of</strong><br />
the system, especially at stations, emphasizes transparency<br />
and openness through the use <strong>of</strong> generic<br />
design using clear glass and simple linear steel forms.<br />
This canopy and station architecture theme is carried<br />
into all stations. The openness and transparency<br />
<strong>of</strong> the design assure visibility, thereby reinforcing<br />
impressions <strong>of</strong> public safety. While the basic station<br />
3-95
BRT Elements and System Performance<br />
form is repeated at all stations,<br />
the configuration <strong>of</strong> station architecture<br />
is tailored to specific<br />
site contexts. For example, the<br />
design and landscaping <strong>of</strong> Griffith<br />
University Station includes<br />
plantings from the nearby<br />
Toohey Forest. The landscaping<br />
at the Buranda Station<br />
features palm trees and other<br />
subtropical plants native to<br />
the province. The consistency<br />
<strong>of</strong> station design enables first-time users and the public to gain familiarity with<br />
the stations. The simplicity <strong>of</strong> station design facilitates the movement <strong>of</strong> passengers<br />
and vehicles through the system. The design has won multiple accolades,<br />
including a nomination for the Australian Engineering Excellence Awards 2001<br />
and an Award <strong>of</strong> Commendation in the 2001 Illuminating Engineering Society<br />
State Lighting Awards.<br />
Metro Orange Line, Los Angeles<br />
The Metro Orange Line began<br />
operating in October 2005 as one<br />
<strong>of</strong> the first “full-service” BRT systems<br />
in the U.S. The Orange Line<br />
features a 14-mile dedicated busway<br />
that runs along an inactive<br />
rail corridor, high-capacity articulated<br />
buses, rail-like stations, level<br />
boarding, <strong>of</strong>f-board fare payment,<br />
and headway-based schedules.<br />
The Orange Line is a fleet <strong>of</strong> 60-ft<br />
articulated “Metro Liners”, powered<br />
by compressed natural gas.<br />
The buses have space for two bikes<br />
and two wheelchairs, and three<br />
extra-wide doors. On-board video<br />
monitors recently were installed<br />
for an added level <strong>of</strong> security. Each<br />
3-96<br />
station <strong>of</strong>fers bicycle racks and lockers, covered seating, ticket vending machines,<br />
telephones, lighting, spacious sidewalks, and security cameras. Six stations have<br />
lighted park-and-ride lots, supplying a total <strong>of</strong> 3,800 free parking spaces.<br />
To create a unique sense <strong>of</strong> place, each station has been given the attention <strong>of</strong><br />
a select California artist. The artwork maintains continuity <strong>of</strong> design while also<br />
giving each station a unique theme relevant to the history <strong>of</strong> the San Fernando<br />
Valley. Artworks include terrazzo paving at platforms, colorful porcelain steel art<br />
panels at each station entry, sculpted seating, and various landscaping designs.<br />
Sound walls and irrigated landscaping along the busway help the Orange Line to<br />
blend into the surrounding environment. As an added benefit to the community,<br />
the design <strong>of</strong> the Orange Line includes 14 miles <strong>of</strong> bikeway and 8 miles <strong>of</strong><br />
pedestrian paths, complete with fencing and crosswalks to ensure safety.<br />
Land use was a key consideration in selecting the Orange Line BRT running way<br />
and stations over simpler expressions <strong>of</strong> BRT. The long-term development plan<br />
for Los Angeles includes high-capacity transit at certain major activity centers<br />
to encourage transit oriented development. Large multi-unit developers already<br />
have expressed interest, and Metro is reviewing joint development contracts to<br />
construct over two million square feet <strong>of</strong> mixed-use development at several stations.<br />
These developments would combine park-and-ride, residential, and commercial<br />
facilities with ground floor retail and <strong>of</strong>fice space. Metro also has committed<br />
to a $3.6 million renovation project in a historic district near the North<br />
Hollywood station (Callaghan and Vincent 2007).<br />
EmX, Eugene<br />
The Emerald Express (EmX) BRT system, operated by Lane <strong>Transit</strong> District (LTD)<br />
in Eugene, Oregon, commenced service in January 2007 as one <strong>of</strong> the first fullfeatured<br />
BRT systems in the U.S. The EmX uses a variety <strong>of</strong> BRT elements, including<br />
dedicated lanes with specialized paving, signal priority, modern vehicles,<br />
level boarding, advanced computer monitoring systems, specially-designed stations<br />
with real-time information, and a unique brand identity. Since opening,<br />
the EmX Green Line has surpassed all ridership estimates, carrying more than 1.4<br />
million boardings in its first year. BRT was chosen as the preferred transit strategy<br />
in Eugene, not only for its significant enhancements to transit service but<br />
also because it is appropriate in scale and cost for the surrounding community.<br />
The system was designed to have a consistent look that would complement the<br />
character <strong>of</strong> the community. Arborists, urban foresters, concrete specialists, traffic<br />
engineers, architects, and landscapers were consulted during every phase <strong>of</strong>
the project. Community integration and accessibility were primary design goals<br />
from the outset <strong>of</strong> the project.<br />
Station design, inspired by the concept <strong>of</strong> “masted sails,” provides shelter and<br />
comfort to customers while also complementing the landscape. The open design<br />
allows maximum visibility to improve customer safety and reduce vandalism.<br />
LTD staff also worked closely with cycling groups and people with disabilities to<br />
design a system that would be accessible to everyone. A bicycle lane runs along<br />
the corridor <strong>of</strong> the Green Line, and vehicles have storage space for three bicycles.<br />
Median stations,<br />
audible crossing signals<br />
at intersections,<br />
ramps and railings,<br />
warning pavers, and<br />
level boarding create<br />
an easy-to-use system<br />
for people with<br />
disabilities. The 60-ft<br />
articulated vehicles<br />
feature doors on<br />
both sides, near-level<br />
boarding, space for<br />
two wheelchairs, and<br />
next-stop voice and<br />
text announcements.<br />
Concern for the environment and appreciation <strong>of</strong> local culture and ecology are<br />
central to the hallmark “green” image <strong>of</strong> the EmX. A unique trait <strong>of</strong> the EmX is<br />
that each station showcases the metalwork <strong>of</strong> local artist Linn Cook, who uses<br />
aluminum forms <strong>of</strong> native plants to feature a different species at each station.<br />
The image <strong>of</strong> innovative, environmentally-friendly public transit is further embodied<br />
in EmX’s clean, quiet hybrid electric vehicles. Grass in the center lane<br />
<strong>of</strong> the running way adds greenery while also helping to absorb noise. Native<br />
landscaping at stations and along the corridor benefit the natural ecosystem.<br />
LTD’s commitment to the environment was recognized with a 2008 Sustainable<br />
Transport Honorable Mention from the Institute for Transportation and Development<br />
Policy. After less than one year in operation, the EmX is the only U.S.<br />
BRT project selected as an award winner for 2008.<br />
BRT Elements and System Performance<br />
BRT Elements by System and Contextual Design<br />
Exhibit 3-15 presents a summary <strong>of</strong> BRT elements that support contextual design<br />
for BRT systems in 36 cities around the world. As with system branding, decisions<br />
about running way location and priority are likely to be made for reasons<br />
other than contextual design considerations, primarily to serve travel time, reliability,<br />
and capacity goals and as a function <strong>of</strong> available right-<strong>of</strong>-way. As a result,<br />
not surprisingly, there is a wide range <strong>of</strong> running way locations and priority levels<br />
to be found throughout the 36 cities summarized in Exhibit 3-15. As discussed<br />
above, there are two ways that running way location can have a direct impact on<br />
contextual design.<br />
First, on-street running ways <strong>of</strong>fer greater opportunities to create attractive public<br />
spaces, especially if the BRT operates through city streets. Some cities have<br />
taken advantage <strong>of</strong> their urban location by not only building a BRT running way<br />
but renovating or rebuilding the surrounding streetscape. For example, for its<br />
HealthLine BRT project, Cleveland RTA not only constructed the busway along<br />
Euclid Avenue but also funded a complete streetscape renovation including reconstruction<br />
<strong>of</strong> concrete sidewalks with brick inlay, new curbs, complete sewer<br />
and water system upgrades, and amenities such as new light fixtures, landscaping,<br />
and sidewalk benches. The Massachusetts Bay Transportation Authority undertook<br />
a similar renovation effort along Boston’s Washington Street corridor<br />
when implementing the Silver Line (Callaghan and Vincent 2008). This level <strong>of</strong> investment<br />
in the surrounding area is not typical <strong>of</strong> most BRT systems, however.<br />
The second type <strong>of</strong> impact that running way location has come from <strong>of</strong>f-street<br />
running ways. This type <strong>of</strong> running way design allows any potential negative<br />
noise and vibration impacts to be isolated from surrounding neighborhoods.<br />
This is the case with the Los Angeles Orange Line, where the transit agency also<br />
implemented sound walls to protect nearby houses from vehicle noise. In Ottawa,<br />
about nine kilometers <strong>of</strong> the <strong>Transit</strong>way lie in an open cut and are fully<br />
grade-separated, with underpasses for crossing below the surrounding roadways.<br />
Other <strong>Transit</strong>way sections that are at-grade typically are not adjacent to<br />
residential areas and therefore do not require noise mitigation.<br />
Off-street running way locations also permit agencies to implement attractive<br />
landscaping along the busway. Los Angeles and Miami are two cities that used<br />
landscaping around their dedicated <strong>of</strong>f-street busways to create a more attractive<br />
surrounding environment.<br />
Another running way feature that can impact contextual design is the choice <strong>of</strong><br />
markings. Only a few systems have used colored pavement instead <strong>of</strong> the stan-<br />
3-97
BRT Elements and System Performance<br />
dard bus lane markings, which not only serves the purpose <strong>of</strong> differentiating the<br />
BRT right-<strong>of</strong>-way but also makes the busway more attractive. Most <strong>of</strong> the European<br />
cities in Exhibit 3-15 use colored pavement; in the U.S., the Eugene EmX and<br />
Los Angeles Orange Line have used concrete pavement, which is different from<br />
adjacent asphalt pavement. Eugene also employs a grass strip down the middle<br />
<strong>of</strong> its median running ways, which helps create a “green” look that complements<br />
the city’s natural surroundings.<br />
The most common means to articulate a unified design in BRT systems is the<br />
use <strong>of</strong> enhanced shelters or full stations. The majority <strong>of</strong> BRT systems around the<br />
world use enhanced stations at a minimum, creating a permanent visual representation<br />
<strong>of</strong> the BRT system in the community. Often these designs are articulated<br />
to a greater degree with more exclusive running way facilities, as they are<br />
with the Pittsburgh busways, Ottawa <strong>Transit</strong>way, Brisbane busways, Los Angeles<br />
Orange Line, and all three Latin American cities in Exhibit 3-15. Some cities have<br />
designed their stations to reflect or complement the surrounding aesthetic. For<br />
example, Brisbane chose an open architecture with clear glass to create a feeling<br />
<strong>of</strong> openness and connectivity to the surrounding environment.<br />
While they may be smaller due to space concerns, on-street stations or shelters<br />
can enhance the surrounding streetscape, especially because they are located<br />
directly in the common public space. While the data summary show that most<br />
BRT systems use an enhanced shelter or station architecture, is difficult to determine<br />
how well these stations are integrated into the community. Many cities<br />
have worked closely with communities adjacent to the BRT running way to ensure<br />
that the station design is compatible with their surroundings. For example,<br />
the York Region’s VIVA and the Cleveland HealthLine have multiple station designs<br />
based on the needs and input <strong>of</strong> the immediate neighborhood. For stations<br />
in Cleveland’s Central Business District, the transit agency designed smaller<br />
stations with a more “historic” look to complement the historic downtown architecture<br />
and narrow cross streets; for the Midtown region, which has a wider<br />
streetscape and more recent, non-historic structures, the stations are larger and<br />
more modern looking. In Boston, the MBTA Silver Line Washington Street stations<br />
were modified based on community input to be more consistent with that<br />
corridor’s historic brick architecture (Callaghan and Vincent 2008).<br />
Exhibit 3-15 also shows that many U.S. systems have adopted clean propulsion<br />
technologies for their BRT vehicles. A majority <strong>of</strong> U.S. BRT systems have at least<br />
some vehicles powered with hybrid or CNG systems. While these propulsion<br />
systems can help reduce noise and vibration associated with frequent, high-ca-<br />
3-98<br />
pacity bus service, it should be noted that this is not always the case. Both Los<br />
Angeles and Boston experienced issues with their CNG buses creating vibration<br />
in the surrounding neighborhoods. The agencies addressed these problems with<br />
sound walls and vehicle modifications. It is far less common outside the U.S.<br />
to use alternative propulsion systems, although the European buses do employ<br />
very low emission diesel technologies.
Exhibit 3-15: BRT Elements by System and Contextual Design<br />
City, State / Province / Country Albuquerque Boston Silver Line<br />
BRT Elements and System Performance<br />
BRT Line / System Rapid Ride Washington St Waterfront SL1 - Airport Waterfront SL2 - BMIP<br />
Running Way (miles)<br />
On Street Mixed Lanes 13.1 0.2 3.5 1.2<br />
On Street Exclusive Bus Lanes 0.7 2.2<br />
Off Street Mixed Lanes 0.0<br />
Off Street Reserved Lanes 0.0<br />
At-Grade <strong>Transit</strong>way 0.0<br />
Grade-Separated <strong>Transit</strong>way<br />
Queue Jumpers<br />
- 1.0 1.0<br />
Marking<br />
Station<br />
Signage Signage and Striping<br />
Type Enhanced Shelter<br />
No Shelter, Basic Shelter, Enhanced<br />
Shelter & <strong>Transit</strong> Center<br />
No Shelter, Underground<br />
Station & <strong>Transit</strong> Center<br />
No Shelter, Underground<br />
Station & <strong>Transit</strong> Center<br />
Access/Park & Ride Lots<br />
Vehicles<br />
2 lots Pedestrian focus<br />
90% arrive by public transit; 8%<br />
by walking<br />
Configuration Articulated Stylized Articulated Articulated Articulated<br />
Floor Height Low-floor Low Floor Low floor Low-floor<br />
Description <strong>of</strong> Livery / Image<br />
Red & White Paint, Rapid Ride<br />
Logo<br />
Special livery Special livery Special livery<br />
Propulsion System and Fuel Hybrid-Electric, ULSD ICE CNG<br />
Dual-Mode diesel & electric,<br />
ULSD<br />
Dual-Mode diesel & electric,<br />
ULSD<br />
3-99
BRT Elements and System Performance<br />
3-100<br />
Exhibit 3-15: BRT Elements by System and Contextual Design (cont’d.)<br />
City, State / Province / Country Chicago* Cleveland<br />
BRT Line / System Western Avenue Express Irving Park Express Garfield Express HealthLine<br />
Running Way (miles)<br />
On Street Mixed Lanes 18.3 9.0 9.4 2.7<br />
On Street Exclusive Bus Lanes<br />
Off Street Mixed Lanes<br />
Off Street Reserved Lanes<br />
At-Grade <strong>Transit</strong>way<br />
Grade-Separated <strong>Transit</strong>way<br />
Queue Jumpers<br />
4.4<br />
Marking<br />
Station<br />
Signage<br />
Type No Shelter No Shelter No Shelter Enhanced Shelter<br />
Access/Park & Ride Lots<br />
Vehicles<br />
0 lots 0 lots 0 lots New bike path<br />
Configuration Stylized articulated<br />
Floor Height Low Low Low low<br />
Description <strong>of</strong> Livery / Image<br />
Distinct electronic destination<br />
signs<br />
Distinct electronic destination signs<br />
Distinct electronic destination<br />
signs<br />
Specialized Livery, Large<br />
Windows<br />
Propulsion System and Fuel Hybrid diesel
Exhibit 3-15: BRT Elements by System and Contextual Design (cont’d.)<br />
City, State / Province / Country Eugene Honolulu<br />
BRT Elements and System Performance<br />
BRT Line / System EmX City Express: A City Express: B Country Express: C<br />
Running Way (miles)<br />
On Street Mixed Lanes 1.4 19.0 8.0 18.0<br />
On Street Exclusive Bus Lanes 2.6<br />
Off Street Mixed Lanes 3.5<br />
Off Street Reserved Lanes<br />
At-Grade <strong>Transit</strong>way<br />
Grade-Separated <strong>Transit</strong>way<br />
17.5<br />
Queue Jumpers Queue jump<br />
Marking<br />
Station<br />
Raised delineators; concrete<br />
pavement, markings<br />
Zipper Lane Concrete Barrier<br />
Type<br />
Enhanced Shelter, Station<br />
Building<br />
Basic Shelter Basic Shelter Basic Shelter<br />
Access/Park & Ride Lots<br />
Vehicles<br />
Pedestrian focus; bike lockers<br />
and racks<br />
0 lots 0 lots 0 lots<br />
Configuration Stylized articulated Articulated Standard Articulated<br />
Floor Height low Low High Low<br />
Description <strong>of</strong> Livery / Image<br />
Specialized Livery, Large<br />
Windows<br />
Standard livery Standard livery Standard livery<br />
Propulsion System and Fuel Hybrid diesel Diesel / Hybrid-Electric Diesel Diesel / Hybrid-Electric<br />
3-101
BRT Elements and System Performance<br />
3-102<br />
Exhibit 3-15: BRT Elements by System and Contextual Design (cont’d.)<br />
City, State / Province / Country Kansas City Las Vegas Los Angeles<br />
BRT Line / System MAX - Main St MAX Orange Line Metro Rapid (All Routes)<br />
Running Way (miles)<br />
On Street Mixed Lanes 6.0 3.0 1.0 229.5<br />
On Street Exclusive Bus Lanes<br />
along certain segments, for<br />
certain times <strong>of</strong> day<br />
4.5 - -<br />
Off Street Mixed Lanes - 0.0 0.0<br />
Off Street Reserved Lanes - 0.0 0.0<br />
At-Grade <strong>Transit</strong>way - 13.5 0.0<br />
Grade-Separated <strong>Transit</strong>way - -<br />
Queue Jumpers 1 queue jumper Queue Jumpers<br />
Marking<br />
Station<br />
Bus Only Markings Signage, Striping<br />
At-Grade Busway, Signage at<br />
Intersections<br />
Type Enhanced Shelter Basic and Enhanced Shelter Enhanced Shelter<br />
Majority arrive by transit,<br />
No Shelter, Enhanced Shelter,<br />
<strong>Transit</strong> Center<br />
Access/Park & Ride Lots<br />
Vehicles<br />
Pedestrian focus Pedestrian focus<br />
walking or bike. Bike path &<br />
pedestrian walkway. 7 park-andride<br />
lots.<br />
Pedestrian focus<br />
Configuration Stylized Standard Stylized Articulated Stylized Articulated<br />
Stylized Standard and<br />
Articulated<br />
Floor Height Low floor Low-floor Low floor (15") Low floor (15")<br />
Description <strong>of</strong> Livery / Image<br />
Max logo, unique livery and<br />
image, large continuous<br />
windows, sleek look<br />
Sleek, modern lines with large<br />
windows<br />
Silver metallic two-tone paint<br />
scheme & Metro Orange Line<br />
name branding, large windows<br />
Red/Silver two-tone paint<br />
scheme & Metro Rapid name<br />
branding<br />
Propulsion System and Fuel ULSD Diesel Electric Hybrid ICE CNG ICE CNG
Exhibit 3-15: BRT Elements by System and Contextual Design (cont’d.)<br />
BRT Elements and System Performance<br />
City, State / Province / Country Miami Oakland Orlando* Phoenix<br />
BRT Line / System Busway San Pablo Ave Rapid LYMMO RAPID - I-10 East<br />
Running Way (miles)<br />
On Street Mixed Lanes 14.0 6.5<br />
On Street Exclusive Bus Lanes<br />
Off Street Mixed Lanes<br />
-<br />
Off Street Reserved Lanes - 14.0<br />
At-Grade <strong>Transit</strong>way<br />
Grade-Separated <strong>Transit</strong>way<br />
20.0 3.0 -<br />
Queue Jumpers Queue jumpers<br />
Marking<br />
Station<br />
At-Grade Busway Busway Barrier, Gray Pavers Signage<br />
Type Enhanced Shelter Basic Shelter Enhanced Shelter Enhanced Shelter<br />
Access/Park & Ride Lots<br />
Vehicles<br />
6 lots; bike path Pedestrian focus Pedestrian focus, 1 lot<br />
Commuter service; 250-500 car<br />
lots<br />
Configuration Standard, Articulated, Minis Stylized standard Stylized standard Specialized composite bus<br />
Floor Height Low Low Low<br />
Description <strong>of</strong> Livery / Image Standard <strong>Transit</strong> Specialized Livery, Logos, Branding Specialized Livery, Wide Doors Distinct styling & livery<br />
Propulsion System and Fuel Hybrid, CNG, Diesel Ultra-low-sulfur diesel ICE CNG LNG<br />
3-103
BRT Elements and System Performance<br />
3-104<br />
Exhibit 3-15: BRT Elements by System and Contextual Design (cont’d.)<br />
City, State / Province / Country Phoenix Pittsburgh*<br />
BRT Line / System RAPID - I-10 West RAPID - SR-51 RAPID - I-17 East Busway<br />
Running Way (miles)<br />
On Street Mixed Lanes<br />
On Street Exclusive Bus Lanes<br />
4.8 12.3 8.0<br />
Off Street Mixed Lanes 0.4<br />
Off Street Reserved Lanes 8.0 10.3 11.5 -<br />
At-Grade <strong>Transit</strong>way - - -<br />
Grade-Separated <strong>Transit</strong>way<br />
Queue Jumpers<br />
8.7<br />
Marking<br />
Station<br />
Signage Signage Signage Grade Separated<br />
Type Enhanced Shelter Enhanced Shelter Enhanced Shelter Enhanced Shelter<br />
Access/Park & Ride Lots<br />
Commuter service; 250-500 car<br />
lots<br />
Commuter service; 250-500 car lots<br />
Commuter service; 250-500<br />
car lots<br />
Vehicles<br />
Configuration Specialized composite bus Specialized composite bus Specialized composite bus Standard & Articulated<br />
Floor Height Low Low Low<br />
Description <strong>of</strong> Livery / Image Distinct styling & livery Distinct styling & livery Distinct styling & livery Standard and Articulated<br />
Propulsion System and Fuel LNG LNG LNG Standard Diesel with 5 CNG<br />
16 lots
Exhibit 3-15: BRT Elements by System and Contextual Design (cont’d.)<br />
BRT Elements and System Performance<br />
City, State / Province / Country Pittsburgh* Sacramento San Jose<br />
BRT Line / System South Busway West Busway EBus - Stockton Rapid 522<br />
Running Way (miles)<br />
On Street Mixed Lanes 8.0 25.0<br />
On Street Exclusive Bus Lanes 0.0 0.0<br />
Off Street Mixed Lanes - 0.4 0.0 0.0<br />
Off Street Reserved Lanes - - 0.0 0.0<br />
At-Grade <strong>Transit</strong>way 4.6 0.0 0.0<br />
Grade-Separated <strong>Transit</strong>way 4.3 None -<br />
Queue Jumpers 1 queue jumper Queue Jumpers<br />
Marking<br />
Station<br />
Grade Separated Busway None None<br />
Type Enhanced Shelter Enhanced Shelter<br />
No Shelter, Basic Shelter, <strong>Transit</strong><br />
Center<br />
No Shelter, Basic Shelter and<br />
Enhanced Shelter; <strong>Transit</strong><br />
Center<br />
3 with 281 spaces. 3 existing lots<br />
Access/Park & Ride Lots<br />
Vehicles<br />
12 lots 10 lots<br />
with 1300 spaces at commuter<br />
rail stations<br />
Configuration Standard & Articulated Standard & Articulated<br />
Stylized Standard and<br />
Articulated<br />
Floor Height Low-floor Low floor (15")<br />
Description <strong>of</strong> Livery / Image Standard and articulated Standard and articulated Standard Branded BRT-only full bus wraps<br />
Propulsion System and Fuel Standard Diesel with 5 CNG Standard Diesel with 5 CNG ICE CNG ICE LSD<br />
3-105
BRT Elements and System Performance<br />
3-106<br />
Exhibit 3-15: BRT Elements by System and Contextual Design (cont’d.)<br />
City, State / Province / Country Halifax Ottawa<br />
BRT Line / System Metro<strong>Link</strong> 95 96 97<br />
Running Way (miles)<br />
On Street Mixed Lanes 12.1 2.1 2.1 2.1<br />
On Street Exclusive Bus Lanes 0.5<br />
Off Street Mixed Lanes 10.6 3.2 13.1 5.2<br />
Off Street Reserved Lanes - 8.7 3.8 1.2<br />
At-Grade <strong>Transit</strong>way - 12.0 8.2 9.8<br />
Grade-Separated <strong>Transit</strong>way<br />
Queue Jumpers<br />
-<br />
Marking<br />
Station<br />
Signage Signage, Pavement Color Signage, Pavement Color Signage, Pavement Color<br />
Type Basic Shelter, Station Enclosures Station Enclosures and Buildings<br />
Station Enclosures and<br />
Buildings<br />
Station Enclosures and Buildings<br />
Access/Park & Ride Lots<br />
Vehicles<br />
6 lots<br />
Configuration Stylized Standard Articulated Standard Articulated<br />
Floor Height Low floor 14.5 - 16"; 11.5" kneeling 14.5 - 16"; 11.5" kneeling 14.5 - 16"; 11.5" kneeling<br />
Description <strong>of</strong> Livery / Image<br />
Blue, yellow, white patterned<br />
livery and unique branding<br />
Maple leaf livery; similar to rest <strong>of</strong><br />
fleet<br />
Maple leaf livery; similar to rest<br />
<strong>of</strong> fleet<br />
Maple leaf livery; similar to rest<br />
<strong>of</strong> fleet<br />
Propulsion System and Fuel ICE Biodiesel ICE Low-sulfur diesel ICE Low-sulfur diesel ICE Low-sulfur diesel
Exhibit 3-15: BRT Elements by System and Contextual Design (cont’d.)<br />
BRT Elements and System Performance<br />
City, State / Province / Country York Bogota Guayaquil<br />
BRT Line / System VIVA Blue VIVA Purple Transmilenio Metrovia<br />
Running Way (miles)<br />
On Street Mixed Lanes 20.3 17.1 - -<br />
On Street Exclusive Bus Lanes - -<br />
Off Street Mixed Lanes - -<br />
Off Street Reserved Lanes - -<br />
At-Grade <strong>Transit</strong>way<br />
Grade-Separated <strong>Transit</strong>way<br />
52.0 10.0<br />
Queue Jumpers<br />
Bus-Only Lanes at some<br />
intersections<br />
Bus-Only Lanes at some<br />
intersections<br />
- -<br />
Marking<br />
Station<br />
None None Busway, Signage Busway, Signage<br />
Type Basic and Enhanced Shelter Basic and Enhanced Shelter Station Station<br />
Access/Park & Ride Lots<br />
Vehicles<br />
No lots No lots<br />
Configuration Articulated Standard Stylized Articulated Stylized Standard & Articulated<br />
Floor Height Low floor Low floor 0.9 m x<br />
Description <strong>of</strong> Livery / Image Metallic blue with Viva logo Metallic blue with Viva logo Red, branded articulated buses Blue, branded articulated buses<br />
Propulsion System and Fuel ICE Clean diesel ICE Clean diesel<br />
Diesel; CNG pilot project<br />
underway with 3 buses<br />
x<br />
3-107
BRT Elements and System Performance<br />
3-108<br />
Exhibit 3-15: BRT Elements by System and Contextual Design (cont’d.)<br />
City, State / Province / Country Pereira Amsterdam Caen Edinburgh<br />
BRT Line / System Megabus Zuidtangent Tram on Wheels Fastlink<br />
Running Way (miles)<br />
On Street Mixed Lanes - 1.9 1.9<br />
On Street Exclusive Bus Lanes - 6.2 9.2 2.2<br />
Off Street Mixed Lanes - 2.5 -<br />
Off Street Reserved Lanes - - -<br />
At-Grade <strong>Transit</strong>way<br />
Grade-Separated <strong>Transit</strong>way<br />
17.0 14.9 0.1 0.9<br />
Queue Jumpers - Queue Jumper<br />
Marking<br />
Station<br />
Busway, Signage Busway, Signage<br />
Signage, concrete track with<br />
rail, landscaping<br />
signage, color, segregation<br />
Type Station<br />
Enhanced Shelters, Stations,<br />
<strong>Transit</strong> Centers<br />
Access/Park & Ride Lots<br />
Vehicles<br />
No lots -<br />
Configuration Stylized Articulated Articulated Bi-Articulated<br />
Standard single and double<br />
deck<br />
Floor Height 0.9 m Low Floor Low Floor Low Floor<br />
Description <strong>of</strong> Livery / Image Green, branded articulated buses Zuidtangent logo, red braded buses Blue & White- Twisto Standard<br />
Propulsion System and Fuel ICE diesel Diesel<br />
Dual Mode- Traction motor onrail/<br />
diesel engine <strong>of</strong>f-rail<br />
Diesel
Exhibit 3-15: BRT Elements by System and Contextual Design (cont’d.)<br />
BRT Elements and System Performance<br />
City, State / Province / Country Eindhoven Leeds London Rouen<br />
BRT Line / System Phileas - Western Corridor Superbus Crawley TEOR<br />
Running Way (miles)<br />
On Street Mixed Lanes 2.2 - 11.2 8.7<br />
On Street Exclusive Bus Lanes 3.8 3.7 -<br />
Off Street Mixed Lanes - - - -<br />
Off Street Reserved Lanes - - - -<br />
At-Grade <strong>Transit</strong>way<br />
Grade-Separated <strong>Transit</strong>way<br />
7.2 2.2 0.9 14.9<br />
Queue Jumpers -<br />
Marking<br />
Signage, concrete track,<br />
landscaping<br />
Curb guidance, pavement markings,<br />
some pavement color<br />
Signage, curb guidance<br />
Color running way and slightly<br />
raised in downtown<br />
Station<br />
Type<br />
Access/Park & Ride Lots<br />
Vehicles<br />
1 park-and-ride 1000 parking spaces<br />
Configuration Articulated, Bi-Articulated Standard Standard Articulated<br />
Floor Height Low Floor Low Floor Low Floor Low Floor<br />
Description <strong>of</strong> Livery / Image Phileas bus logo Standard<br />
Fastway logo, blue/grey<br />
branded buses, unique<br />
enhanced shelters<br />
TEOR Logo (Transport Est-<br />
Ouest Rouennais)<br />
Propulsion System and Fuel Hybrid (LPG/Electric) Diesel Diesel Diesel<br />
3-109
BRT Elements and System Performance<br />
3-110<br />
Exhibit 3-15: BRT Elements by System and Contextual Design (cont’d.)<br />
City, State / Province / Country Utrecht Adelaide Brisbane<br />
BRT Line / System Busway North East Busway South East Busway Inner Northern Busway<br />
Running Way (miles)<br />
On Street Mixed Lanes 3.5<br />
On Street Exclusive Bus Lanes 2.0<br />
Off Street Mixed Lanes -<br />
Off Street Reserved Lanes -<br />
At-Grade <strong>Transit</strong>way 4.8<br />
Grade-Separated <strong>Transit</strong>way<br />
Queue Jumpers<br />
7.46 10.3 1.7<br />
Marking<br />
Station<br />
Signage, pavement markings,<br />
pavement color<br />
Off-Street Busway, Signage Off-Street Busway, Signage Off-Street Busway, Signage<br />
Type <strong>Transit</strong> Centers Stations, <strong>Transit</strong> Centers Stations, <strong>Transit</strong> Centers<br />
Access/Park & Ride Lots<br />
Vehicles<br />
3 lots; 1,190 spaces 3 lots, 759 spaces None Designated<br />
Configuration Bi-Articulated<br />
Standard Articulated = 60 Standard<br />
Rigid = 80<br />
Standard Rigid Standard Rigid<br />
Floor Height Low Floor<br />
Merc - step high, Scania - step low<br />
floor<br />
Mainly Step Low Floor Some<br />
Step High Floor<br />
Mainly Step Low Floor Some<br />
Step High Floor<br />
Description <strong>of</strong> Livery / Image Standard<br />
Standard white and yellow - same as<br />
non busway corridors<br />
Standard Brisbane White, Blue and Yellow<br />
Propulsion System and Fuel Diesel Diesel<br />
Mix <strong>of</strong> Diesel and CNG Gas<br />
Buses<br />
Mix <strong>of</strong> Diesel and CNG Gas<br />
Buses
Exhibit 3-15: BRT Elements by System and Contextual Design (cont’d.)<br />
BRT Elements and System Performance<br />
City, State / Province / Country Sydney Beijing<br />
BRT Line / System Liverpool-Parramatta T-Way<br />
North-West T-Way - Blacktown-<br />
Parklea<br />
North-West T-Way -<br />
Parramatta-Rouse Hill<br />
Line 1 BRT<br />
Running Way (miles)<br />
On Street Mixed Lanes<br />
On Street Exclusive Bus Lanes 6.0 0.3 1.9<br />
Off Street Mixed Lanes<br />
Off Street Reserved Lanes<br />
2.2<br />
At-Grade <strong>Transit</strong>way<br />
Grade-Separated <strong>Transit</strong>way<br />
Queue Jumpers<br />
13.0 4.4 8.7 8.1<br />
Marking<br />
Station<br />
Signage, At-Grade Busway<br />
Signage/Red Pavement Color;<br />
Busway<br />
Signage/Red Pavement Color;<br />
Busway<br />
Busway<br />
Type<br />
Basic and Enhanced Shelter;<br />
Stations<br />
Stations, <strong>Transit</strong> Centers<br />
Basic and Enhanced Shelters,<br />
<strong>Transit</strong> Centers<br />
Stations<br />
Access/Park & Ride Lots<br />
Vehicles<br />
1 Designated lot None Designated 2 Designated Park and Ride lots<br />
Configuration Standard Rigid Standard Rigid Standard Rigid Articulated<br />
Floor Height Step Low Floor Step High Step Mix Low Floor Step High Low-Floor<br />
Standard Sydney Bus Livery - Blue<br />
Description <strong>of</strong> Livery / Image<br />
White and Yellow - with T-Way<br />
Logo<br />
White Red Stripe Yellow Specialized BRT vehicles<br />
Propulsion System and Fuel Euro 3 diesel Diesel Diesel<br />
3-111
BRT Elements and System Performance<br />
3-112<br />
Exhibit 3-15: BRT Elements by System and Contextual Design (cont’d.)<br />
City, State / Province / Country Hangzhou Kunming<br />
BRT Line / System Line B1 Busway network<br />
Running Way (miles)<br />
On Street Mixed Lanes<br />
On Street Exclusive Bus Lanes 6.2<br />
Off Street Mixed Lanes<br />
Off Street Reserved Lanes 24.9<br />
At-Grade <strong>Transit</strong>way<br />
Grade-Separated <strong>Transit</strong>way<br />
Queue Jumpers<br />
Marking Striping Striping<br />
Station<br />
Type<br />
Access/Park & Ride Lots<br />
Vehicles<br />
Configuration Articulated Standard<br />
Floor Height Low-Floor High-Floor<br />
Description <strong>of</strong> Livery / Image Specialized red BRT vehicles<br />
Propulsion System and Fuel Diesel
passEngER safETy and sEcuRiTy<br />
Safety and security are distinct, measurable attributes <strong>of</strong> a transit system that<br />
impact service attractiveness to customers, operating costs, and overall performance.<br />
They reflect different attributes that contribute to transit patron’s comfort<br />
with riding a BRT system. Safety is the level <strong>of</strong> freedom from hazards experienced<br />
by passengers, employees, pedestrians, other vehicle occupants, and<br />
others who interact with the transit system. Security, meanwhile, is the level <strong>of</strong><br />
the freedom from crime or other intentional danger experienced by transit employees,<br />
system users, and property. Implementation <strong>of</strong> BRT has the potential to<br />
yield improvements over conventional bus operations, such as:<br />
improved rider perception <strong>of</strong> safety and security - resulting from changes to<br />
physical design attributes and service characteristics - potentially inducing<br />
additional ridership<br />
reduced transit vehicle collisions with autos, objects, and pedestrians by<br />
minimizing interactions and potential conflicts within the travel right-<strong>of</strong>way<br />
<strong>of</strong> other motor vehicles<br />
more predictable and manageable risks, which can reduce insurance claims,<br />
legal fees, and accident investigations<br />
reduced harm to passengers either from hazards or crime<br />
The provision <strong>of</strong> a safe and secure environment for BRT customers requires careful<br />
consideration <strong>of</strong> the primary safety and security risks, and the best means to<br />
address those risks, within three key system environments: inside the vehicle, on<br />
the right-<strong>of</strong>-way, and at stations and stops. BRT stations and stops are <strong>of</strong> particular<br />
concern, as they are likely to be unattended and open during extended hours<br />
<strong>of</strong> operation. The sections below consider how investment in BRT can be expected<br />
to impact these risks, with safety and security issues discussed separately.<br />
safety<br />
description <strong>of</strong> safety<br />
Safety is the level <strong>of</strong> freedom from danger experienced by passengers, employees,<br />
pedestrians, occupants <strong>of</strong> other roadway vehicles, and others who interact<br />
with the transit system. In general, two performance measures reflect the quality<br />
<strong>of</strong> a transit agency’s safety management: accident rates and public perception <strong>of</strong><br />
BRT Elements and System Performance<br />
safety. Accident rates can be measured by analyzing local agencies’ historical collision<br />
records and nationally-reported transit accident data. The public perception<br />
<strong>of</strong> safety is <strong>of</strong>ten measured using passenger surveys or information gathered<br />
from other forms <strong>of</strong> customer feedback.<br />
Effects <strong>of</strong> BRT Elements on safety<br />
Investment in many elements <strong>of</strong> BRT <strong>of</strong>fers the potential to positively influence<br />
system safety performance relative to conventional bus operations. For example,<br />
as running way exclusivity increases, the frequency <strong>of</strong> sideswipe collisions<br />
between transit and non-transit vehicles decreases. At the same time, however,<br />
there is evidence to suggest that some systems with BRT characteristics may<br />
actually create conditions where specific types <strong>of</strong> safety hazards become more<br />
prominent. For example, different operating environments may experience<br />
higher rates <strong>of</strong> specific types <strong>of</strong> collisions, such as collisions at intersections and<br />
at-grade crossings. The following describes how specific BRT elements can impact<br />
safety performance and highlight safety issues that need to be addressed.<br />
Running Way—Right-<strong>of</strong>-Way Location<br />
Off-street running ways that involve the segregation <strong>of</strong> BRT vehicles from other traffic and<br />
from pedestrians may increase the level <strong>of</strong> safety and decrease the probability and severity <strong>of</strong><br />
collisions by BRT vehicles, provided they address potential conflict points such as cross-street<br />
intersections and other at-grade vehicle and pedestrian crossings.<br />
Running Way—Level <strong>of</strong> Running Way Priority<br />
Creating running way priority through dedicated or exclusive facilities decreases potential conflict<br />
with traffic traveling in the same direction, thereby reducing potential for collisions caused<br />
by weaving and stopping.<br />
Running Way—Markings<br />
Running way markings can help decrease the likelihood <strong>of</strong> non-BRT vehicles entering an exclusive<br />
running way by visually differentiating the BRT running way from mixed-traffic streets.<br />
Stations—Curb Design<br />
Raised curbs or level platforms reduce the possibility <strong>of</strong> tripping and facilitate wheelchair and<br />
disabled person access.<br />
3-113
BRT Elements and System Performance<br />
Vehicles—Vehicle Configuration<br />
The use <strong>of</strong> vehicle configurations with partial or complete low floors may potentially reduce<br />
tripping hazards for boarding BRT vehicles. Studies performed so far, however, cannot yet point<br />
to statistically-valid comparisons <strong>of</strong> passenger safety for low-floor buses versus high-floor buses.<br />
In implementing low-floor buses, hand-holds may be necessary between the entrance and the<br />
first row <strong>of</strong> seats since, in many cases, the wheel well takes up the space immediately beyond the<br />
entrance (King 1998).<br />
ITS - <strong>Transit</strong> Vehicle Prioritization<br />
Station and lane access control can improve security <strong>of</strong> transit facilities by providing access<br />
only to approved vehicles. Jurisdictions that implement signal priority should ensure that any<br />
bus-only signals are clearly marked and understood by other drivers.<br />
ITS - Intelligent Vehicle Systems<br />
Lane-keeping assistance systems, collision warning systems, object detection systems, and<br />
precision docking can contribute to the safety <strong>of</strong> a BRT system through smoother operation<br />
as it is operating at high speeds, in mixed traffic, or entering/exiting traffic flows. In addition,<br />
guidance technologies allow vehicles to follow a specified path along the running way and in<br />
approaches to stations, thereby helping operators to avoid collisions while maintaining close<br />
tolerances.<br />
performance <strong>of</strong> Existing systems<br />
Research Summary<br />
On average, buses in conventional transit operations are subject to between one<br />
and two collisions per year, including collisions with other vehicles, pedestrians,<br />
and fixed objects, with an expected cost <strong>of</strong> roughly $5,000 per year per vehicle<br />
on collision-related expenses (including claims, damage repair, and insurance<br />
costs). To the extent that investment in BRT elements, most notably partial or<br />
exclusive running ways, can reduce either the incidence or severity <strong>of</strong> vehicle collisions,<br />
BRT investments can reduce collision costs, and riders may perceive this<br />
increased safety, potentially inducing additional ridership.<br />
Given the small number <strong>of</strong> U.S. BRT systems and the short time period most<br />
systems have been in operation, the availability <strong>of</strong> domestic BRT system accident<br />
data remains limited, and the actual safety and security characteristics <strong>of</strong> BRT are<br />
not fully determined. However, a great deal <strong>of</strong> vehicle accident data are available<br />
on conventional bus, LRT, and other U.S. transit modes operating in mixed, partially-separated,<br />
and fully-exclusive rights-<strong>of</strong>-way. These data effectively demonstrate<br />
a key expected safety implication from investment in partially-separated<br />
or exclusive vehicle rights-<strong>of</strong>-way: vehicle collision rates, both on the right-<strong>of</strong>-way<br />
3-114<br />
and at stations/stops, tend to decrease as the degree <strong>of</strong> running way “exclusivity”<br />
increases. This impact is clearly displayed in Exhibit 3-16.<br />
Exhibit 3-16: Vehicle Accident Rates versus<br />
Share <strong>of</strong> Exclusive ROW<br />
Source: National <strong>Transit</strong> Database (NTD), non-major bus and rail collisions, 2002 - 2005<br />
The relationship presented in Exhibit 3-16 is representative <strong>of</strong> minor collisions<br />
(i.e., incidents resulting in minor injuries and/or vehicle damage). In contrast, the<br />
frequency and average severity <strong>of</strong> major collisions can actually increase when<br />
moving toward more exclusive running ways. Specifically, BRT and LRT systems<br />
have both experienced heightened collision rates and severities at points where<br />
exclusive running ways have at-grade roadway crossings (roughly 80 percent <strong>of</strong><br />
LRT accidents occur at intersection crossings). These incidents are commonly<br />
the result <strong>of</strong> cross traffic, either running red lights or being unaware <strong>of</strong> the presence<br />
<strong>of</strong> the transit vehicle. System designers can address this important issue<br />
through improved crossing markings and warning systems.<br />
System Performance Pr<strong>of</strong>iles<br />
System pr<strong>of</strong>iles illustrate approaches to system safety in planning for BRT. The<br />
following pr<strong>of</strong>iles detail the experiences <strong>of</strong> new express busways in Miami and
Los Angeles, each <strong>of</strong> which illustrates the particular importance <strong>of</strong> grade crossings<br />
to BRT safety.<br />
South Miami-Dade Busway<br />
The design <strong>of</strong> traffic control, at crossings in particular, is an important determinant<br />
<strong>of</strong> system safety for BRT. After the initial 8.5-mile segment opened in February<br />
1997, many serious collisions between BRT vehicles, motorists, and pedestrians<br />
occurred at the South Miami-Dade Busway’s at-grade intersections. The<br />
proximity to the heavily travelled US-1 highway that parallels the busway contributed<br />
to safety conflicts. The frequency and seriousness <strong>of</strong> crashes at busway<br />
intersections between busway vehicles and vehicular traffic heightened attention<br />
to busway safety, particularly at several key intersections. Miami-Dade <strong>Transit</strong><br />
(MDT) and Miami-Dade County installed extensive signage and signalization<br />
to deter such conflicts. MDT also revised operating procedures, requiring that<br />
busway vehicles proceed very slowly through busway intersections to minimize<br />
the risk <strong>of</strong> collision. MDT also has pursued changes to the Manual on Uniform<br />
Traffic Control Devices (MUTCD) to incorporate warrants that accommodate the<br />
installation <strong>of</strong> railroad-style crossing gates at intersections <strong>of</strong> BRT running ways<br />
and arterial streets.<br />
Orange Line, Los Angeles<br />
The Los Angeles Metro opened a dedicated busway with at-grade crossings, the<br />
Orange Line, in October 2005. During the first two months <strong>of</strong> operation, Orange<br />
Line vehicles were involved in 14 collisions, including 8 at crossings. In the following<br />
10 months, there were another 13 collisions, 10 <strong>of</strong> which involved vehicle<br />
collisions at intersections. Metro instituted a number <strong>of</strong> measures to improve<br />
safety including:<br />
reducing Orange Line vehicles speeds through intersections from 25 to 10 mph<br />
installing 36-inch bus crossing signs at intersections<br />
changing traffic signal timing to give buses more time to clear intersections<br />
changing conventional round green signal indicators to an “up” arrow signal<br />
on the cross streets to emphasize the prohibition <strong>of</strong> “turning right on red”<br />
lowering the flashing “Bus Coming” sign to be immediately adjacent to “No<br />
Right Turn on Red” signs<br />
installing 24-in “Look Both Ways” pedestrian warning signs<br />
BRT Elements and System Performance<br />
installing photo enforcement cameras to deter red-light runners<br />
adding “Keep Clear” pavement markings at intersections<br />
undertaking a major community education effort<br />
By June 2006, following the implementation <strong>of</strong> these measures, the accident rate<br />
for the Orange Line was lower than that <strong>of</strong> other Metro services (Vincent and<br />
Callaghan 2007). This experience reinforces the notion that at-grade crossings<br />
are key focus areas for planners interested in ensuring safe operation <strong>of</strong> BRT systems.<br />
In addition, Metro’s experience highlights the fact that at-grade systems<br />
are likely to experience safety issues soon after deployment, as motorists adjust<br />
to bus traffic in new corridors but they can be addressed through education<br />
efforts and clear intersection markings and signage. Nevertheless, the safety issues<br />
continue to require low speeds through intersections, reducing the Orange<br />
Line’s average vehicle speed.<br />
In summary, the safety performance <strong>of</strong> BRT systems is likely to depend on <strong>of</strong><br />
the degree to which operating right-<strong>of</strong>-way is segregated from other traffic.<br />
At-grade crossings, in particular, represent a key area to be addressed during<br />
the development <strong>of</strong> a BRT system especially on segregated or <strong>of</strong>f-street rights<strong>of</strong>-way.<br />
BRT Elements by System and Safety<br />
Exhibit 3-17 presents a summary <strong>of</strong> BRT elements that are most relevant to passenger<br />
and system safety for BRT systems in 36 cities around the world, as well as<br />
any available performance data. Very few systems have reported any safety data,<br />
on either vehicle or passenger safety, so it is not possible to draw any statisticallysignificant<br />
relationships between elements and performance.<br />
Following implementation <strong>of</strong> the Pittsburgh East Busway, bus accidents on this<br />
corridor were lowered—not surprising since the East Busway is fully grade-separated.<br />
However, passenger safety incidents increased; there was no clear explanation<br />
why this occurred. As already noted above, accidents on the Los Angeles Orange<br />
Line initially were a problem. However, recent performance data provided<br />
by Metro shows that the Orange Line has a much lower accident rate per mile<br />
than the Metro Rapid service, which operates in mixed traffic. Finally, the Boston<br />
Silver Line Waterfront Service has a lower vehicle accident and passenger injury<br />
rate than the MBTA system as whole. Again, it is not possible to draw any definitive<br />
conclusions about why this is, although it is worth noting that the portions<br />
<strong>of</strong> the Waterfront Service operate in an exclusive underground tunnel.<br />
3-115
BRT Elements and System Performance<br />
Many systems with <strong>of</strong>f-street busways operate with at-grade intersection crossings,<br />
a feature that has been identified with increased accidents between buses<br />
and other vehicle traffic or pedestrians. Of the 27 BRT lines that have some <strong>of</strong>fstreet<br />
operation, 21 operate exclusively or partially with at-grade intersections.<br />
At-grade busways (such as the Miami South Dade Busway and Los Angeles Orange<br />
Line) are the predominant model in the U.S. (with the notable exception <strong>of</strong><br />
Pittsburgh) and in Latin America. Europe typically features a mix <strong>of</strong> at-grade and<br />
fully-segregated <strong>of</strong>f-street busway operations. However, the difference between<br />
Metro Rapid and Orange Line accident rates suggests that greater opportunities<br />
for accidents occur with buses operating in mixed traffic than in at-grade<br />
busways.<br />
At this time, only Orlando, Phoenix, and Pittsburgh report having implemented<br />
collision warning systems. Vehicle docking guidance mechanisms, which may reduce<br />
passenger safety incidents, are very common in Europe, with most systems<br />
featured in Exhibit 3-17 indicating some type <strong>of</strong> guidance to minimize vehicle<br />
distance from loading platforms. Few other cities report using such guidance,<br />
although it should be noted that the three Latin American cities achieve virtually<br />
rail-like level boarding using non-mechanical guidance strategies.<br />
3-116
Exhibit 3-17: BRT Elements by System and Safety<br />
City, State / Province / Country Albuquerque Boston Silver Line<br />
BRT Elements and System Performance<br />
BRT Line / System Rapid Ride Washington St Waterfront SL1 - Airport Waterfront SL2 - BMIP<br />
Running Way (miles)<br />
On Street Mixed Lanes 13.1 0.2 3.5 1.2<br />
On Street Exclusive Bus Lanes 0.7 2.2<br />
Off Street Mixed Lanes 0.0<br />
Off Street Reserved Lanes 0.0<br />
At-Grade <strong>Transit</strong>way 0.0<br />
Grade-Separated <strong>Transit</strong>way<br />
Queue Jumpers<br />
- 1.0 1.0<br />
Marking<br />
Station<br />
Signage Signage and Striping<br />
Curb Design<br />
Vehicles<br />
Standard Curb Standard Curb Standard Curb Standard Curb<br />
Configuration Articulated Stylized Articulated Articulated Articulated<br />
Floor Height<br />
ITS<br />
Low-floor Low Floor Low floor Low-floor<br />
<strong>Transit</strong> Vehicle Prioritization TSP<br />
TSP - Green Extension, Red<br />
Truncation<br />
No No<br />
Intelligent Vehicle Systems None None None none<br />
Safety and Security All 3 routes All 3 routes<br />
Measured Indicator <strong>of</strong> Safety (e.g. number <strong>of</strong><br />
accidents)<br />
Survey <strong>of</strong> Customer Perception <strong>of</strong> Safety or Security<br />
exists? (yes/no)<br />
Yes<br />
5.86 accidents and .76 injuries<br />
per 100,000 vehicle miles; lower<br />
than systemwide<br />
78% rated safety above average<br />
or excellent<br />
5.86 accidents and .76 injuries<br />
per 100,000 vehicle miles;<br />
lower than systemwide<br />
78% rated safety above<br />
average or excellent<br />
3-117
BRT Elements and System Performance<br />
3-118<br />
Exhibit 3-17: BRT Elements by System and Safety (cont’d.)<br />
City, State / Province / Country Chicago* Cleveland<br />
BRT Line / System Western Avenue Express Irving Park Express Garfield Express HealthLine<br />
Running Way (miles)<br />
On Street Mixed Lanes 18.3 9.0 9.4 2.7<br />
On Street Exclusive Bus Lanes 4.4<br />
Off Street Mixed Lanes<br />
Off Street Reserved Lanes<br />
At-Grade <strong>Transit</strong>way<br />
Grade-Separated <strong>Transit</strong>way<br />
Queue Jumpers<br />
Marking Signage<br />
Station<br />
Curb Design Standard Curb Standard Curb Standard Curb Near Level<br />
Vehicles<br />
Configuration Stylized articulated<br />
Floor Height Low Low Low low<br />
ITS<br />
<strong>Transit</strong> Vehicle Prioritization TSP<br />
Intelligent Vehicle Systems mechanical guidance<br />
Safety and Security<br />
Measured Indicator <strong>of</strong> Safety (e.g. number <strong>of</strong><br />
accidents)<br />
Survey <strong>of</strong> Customer Perception <strong>of</strong> Safety or Security<br />
exists? (yes/no)
Exhibit 3-17: BRT Elements by System and Safety (cont’d.)<br />
City, State / Province / Country Eugene Honolulu<br />
BRT Elements and System Performance<br />
BRT Line / System EmX City Express: A City Express: B Country Express: C<br />
Running Way (miles)<br />
On Street Mixed Lanes 1.4 19.0 8.0 18.0<br />
On Street Exclusive Bus Lanes 2.6<br />
Off Street Mixed Lanes 3.5<br />
Off Street Reserved Lanes<br />
At-Grade <strong>Transit</strong>way<br />
Grade-Separated <strong>Transit</strong>way<br />
17.5<br />
Queue Jumpers Queue jump<br />
Marking<br />
Station<br />
Raised delineators; concrete<br />
pavement, markings<br />
Zipper Lane Concrete Barrier<br />
Curb Design<br />
Vehicles<br />
Raised platform Standard Curb Standard Curb Standard Curb<br />
Configuration Stylized articulated Articulated Standard Articulated<br />
Floor Height<br />
ITS<br />
low Low High Low<br />
<strong>Transit</strong> Vehicle Prioritization TSP<br />
Intelligent Vehicle Systems<br />
Safety and Security<br />
Measured Indicator <strong>of</strong> Safety (e.g. number <strong>of</strong><br />
accidents)<br />
Survey <strong>of</strong> Customer Perception <strong>of</strong> Safety or Security<br />
exists? (yes/no)<br />
Visual guidance<br />
3-119
BRT Elements and System Performance<br />
3-120<br />
Exhibit 3-17: BRT Elements by System and Safety (cont’d.)<br />
City, State / Province / Country Kansas City Las Vegas Los Angeles<br />
BRT Line / System MAX - Main St MAX Orange Line Metro Rapid (All Routes)<br />
Running Way (miles)<br />
On Street Mixed Lanes 6.0 3.0 1.0 229.5<br />
On Street Exclusive Bus Lanes<br />
along certain segments, for<br />
certain times <strong>of</strong> day<br />
4.5 - -<br />
Off Street Mixed Lanes - 0.0 0.0<br />
Off Street Reserved Lanes - 0.0 0.0<br />
At-Grade <strong>Transit</strong>way - 13.5 0.0<br />
Grade-Separated <strong>Transit</strong>way - -<br />
Queue Jumpers 1 queue jumper Queue Jumpers<br />
Marking<br />
Station<br />
Bus Only Markings Signage, Striping<br />
At-Grade Busway, Signage at<br />
Intersections<br />
Curb Design<br />
Vehicles<br />
Raised Curb Raised Curb 8" Curb Standard Curb<br />
Configuration Stylized Standard Stylized Articulated Stylized Articulated<br />
Stylized Standard and<br />
Articulated<br />
Floor Height<br />
ITS<br />
Low floor Low-floor Low floor (15") Low floor (15")<br />
<strong>Transit</strong> Vehicle Prioritization TSP TSP TSP<br />
Intelligent Vehicle Systems<br />
Safety and Security<br />
Optical Docking (not used) None None<br />
Measured Indicator <strong>of</strong> Safety (e.g. number <strong>of</strong><br />
accidents)<br />
Accidents down 40% for MAX<br />
avg = 1.45 accidents per 100,000<br />
miles<br />
avg = 4.83 accidents per<br />
100,000 miles<br />
Passengers rate Metro Rapid<br />
Survey <strong>of</strong> Customer Perception <strong>of</strong> Safety or Security<br />
exists? (yes/no)<br />
Personal Safety on Buses 3.88<br />
out <strong>of</strong> 5, compared to 3.40 for<br />
the former Limited Bus
Exhibit 3-17: BRT Elements by System and Safety (cont’d.)<br />
BRT Elements and System Performance<br />
City, State / Province / Country Miami Oakland Orlando* Phoenix<br />
BRT Line / System Busway San Pablo Ave Rapid LYMMO RAPID - I-10 East<br />
Running Way (miles)<br />
On Street Mixed Lanes 14.0 6.5<br />
On Street Exclusive Bus Lanes<br />
Off Street Mixed Lanes<br />
-<br />
Off Street Reserved Lanes - 14.0<br />
At-Grade <strong>Transit</strong>way<br />
Grade-Separated <strong>Transit</strong>way<br />
20.0 3.0 -<br />
Queue Jumpers Queue jumpers<br />
Marking<br />
Station<br />
At-Grade Busway Busway Barrier, Gray Pavers Signage<br />
Curb Design<br />
Vehicles<br />
Standard Curb Standard Curb Standard Curb standard curb<br />
Configuration Standard, Articulated, Minis Stylized standard Stylized standard Specialized composite bus<br />
Floor Height<br />
ITS<br />
Low Low Low<br />
<strong>Transit</strong> Vehicle Prioritization No TSP TSP TSP at 1 intersection<br />
Intelligent Vehicle Systems<br />
Collision warning, lane assist,<br />
precision docking<br />
Collision Warning<br />
Safety and Security<br />
Measured Indicator <strong>of</strong> Safety (e.g. number <strong>of</strong><br />
accidents)<br />
All 2004<br />
Survey <strong>of</strong> Customer Perception <strong>of</strong> Safety or Security<br />
exists? (yes/no)<br />
67.5% <strong>of</strong> passengers rate safety<br />
riding vehicles as Good or Very<br />
Good; 59.5% <strong>of</strong> passengers rate<br />
safety at Busway stations as<br />
Good or Very Good (2004)<br />
75% <strong>of</strong> customers rated personal<br />
safety on vehicles as good or very<br />
good; 72% rated safety at stations as<br />
good or very good.<br />
3-121
BRT Elements and System Performance<br />
3-122<br />
Exhibit 3-17: BRT Elements by System and Safety (cont’d.)<br />
City, State / Province / Country Phoenix Pittsburgh*<br />
BRT Line / System RAPID - I-10 West RAPID - SR-51 RAPID - I-17 East Busway<br />
Running Way (miles)<br />
On Street Mixed Lanes<br />
On Street Exclusive Bus Lanes<br />
4.8 12.3 8.0<br />
Off Street Mixed Lanes 0.4<br />
Off Street Reserved Lanes 8.0 10.3 11.5 -<br />
At-Grade <strong>Transit</strong>way - - -<br />
Grade-Separated <strong>Transit</strong>way<br />
Queue Jumpers<br />
8.7<br />
Marking<br />
Station<br />
Signage Signage Signage Grade Separated<br />
Curb Design<br />
Vehicles<br />
standard curb standard curb standard curb Raised Curb<br />
Configuration Specialized composite bus Specialized composite bus Specialized composite bus Standard & Articulated<br />
Floor Height<br />
ITS<br />
Low Low Low<br />
<strong>Transit</strong> Vehicle Prioritization TSP at 1 intersection TSP at 1 intersection TSP at 1 intersection<br />
Intelligent Vehicle Systems<br />
Safety and Security<br />
Collision Warning Collision Warning Collision Warning Collision Warning<br />
Measured Indicator <strong>of</strong> Safety (e.g. number <strong>of</strong><br />
accidents)<br />
Survey <strong>of</strong> Customer Perception <strong>of</strong> Safety or Security<br />
exists? (yes/no)<br />
Bus service in East Corridor<br />
experienced a 30%<br />
reduction in all accidents<br />
but a 6% increase in<br />
passenger accidents after<br />
implementation <strong>of</strong> the East<br />
Busway
Exhibit 3-17: BRT Elements by System and Safety (cont’d.)<br />
BRT Elements and System Performance<br />
City, State / Province / Country Pittsburgh* Sacramento San Jose<br />
BRT Line / System South Busway West Busway EBus - Stockton Rapid 522<br />
Running Way (miles)<br />
On Street Mixed Lanes 8.0 25.0<br />
On Street Exclusive Bus Lanes 0.0 0.0<br />
Off Street Mixed Lanes - 0.4 0.0 0.0<br />
Off Street Reserved Lanes - - 0.0 0.0<br />
At-Grade <strong>Transit</strong>way 4.6 0.0 0.0<br />
Grade-Separated <strong>Transit</strong>way 4.3 None -<br />
Queue Jumpers 1 queue jumper Queue Jumpers<br />
Marking<br />
Station<br />
Grade Separated Busway None None<br />
Curb Design<br />
Vehicles<br />
Raised Curb Raised Curb Standard Curb<br />
Configuration Standard & Articulated Standard & Articulated<br />
Stylized Standard and<br />
Articulated<br />
Floor Height<br />
ITS<br />
Low-floor Low floor (15")<br />
<strong>Transit</strong> Vehicle Prioritization<br />
Signal Priority (magnetic loop<br />
sensors)<br />
TSP - Green Ext<br />
TSP - Green Extension, Red<br />
Truncation<br />
Intelligent Vehicle Systems<br />
Safety and Security<br />
Measured Indicator <strong>of</strong> Safety (e.g. number <strong>of</strong><br />
accidents)<br />
Collision Warning Collision Warning None None<br />
Survey <strong>of</strong> Customer Perception <strong>of</strong> Safety or Security<br />
exists? (yes/no)<br />
No<br />
3-123
BRT Elements and System Performance<br />
3-124<br />
Exhibit 3-17: BRT Elements by System and Safety (cont’d.)<br />
City, State / Province / Country Halifax Ottawa<br />
BRT Line / System Metro<strong>Link</strong> 95 96 97<br />
Running Way (miles)<br />
On Street Mixed Lanes 12.1 2.1 2.1 2.1<br />
On Street Exclusive Bus Lanes 0.5<br />
Off Street Mixed Lanes 10.6 3.2 13.1 5.2<br />
Off Street Reserved Lanes - 8.7 3.8 1.2<br />
At-Grade <strong>Transit</strong>way - 12.0 8.2 9.8<br />
Grade-Separated <strong>Transit</strong>way<br />
Queue Jumpers<br />
-<br />
Marking<br />
Station<br />
Signage Signage, Pavement Color Signage, Pavement Color Signage, Pavement Color<br />
Curb Design<br />
Vehicles<br />
Standard Curb Standard Curb Standard Curb Standard Curb<br />
Configuration Stylized Standard Articulated Standard Articulated<br />
Floor Height<br />
ITS<br />
Low floor 14.5 - 16"; 11.5" kneeling 14.5 - 16"; 11.5" kneeling 14.5 - 16"; 11.5" kneeling<br />
<strong>Transit</strong> Vehicle Prioritization TSP TSP TSP TSP<br />
Intelligent Vehicle Systems<br />
Safety and Security<br />
Measured Indicator <strong>of</strong> Safety (e.g. number <strong>of</strong><br />
accidents)<br />
None None None None<br />
Survey <strong>of</strong> Customer Perception <strong>of</strong> Safety or Security<br />
exists? (yes/no)<br />
Yes Yes Yes
Exhibit 3-17: BRT Elements by System and Safety (cont’d.)<br />
BRT Elements and System Performance<br />
City, State / Province / Country York Bogota Guayaquil<br />
BRT Line / System VIVA Blue VIVA Purple Transmilenio Metrovia<br />
Running Way (miles)<br />
On Street Mixed Lanes 20.3 17.1 - -<br />
On Street Exclusive Bus Lanes - -<br />
Off Street Mixed Lanes - -<br />
Off Street Reserved Lanes - -<br />
At-Grade <strong>Transit</strong>way<br />
Grade-Separated <strong>Transit</strong>way<br />
52.0 10.0<br />
Queue Jumpers<br />
Bus-Only Lanes at some<br />
intersections<br />
Bus-Only Lanes at some<br />
intersections<br />
- -<br />
Marking<br />
Station<br />
None None Busway, Signage Busway, Signage<br />
Curb Design<br />
Vehicles<br />
Standard Curb Standard Curb Level Platform Level Platform<br />
Configuration Articulated Standard Stylized Articulated<br />
Stylized Standard &<br />
Articulated<br />
Floor Height<br />
ITS<br />
Low floor Low floor 0.9 m x<br />
<strong>Transit</strong> Vehicle Prioritization<br />
Limited to buses that are behind<br />
schedule with a max <strong>of</strong> one bus<br />
per intersection per 2.5 minutes<br />
in any direction<br />
Limited to buses that are behind<br />
schedule with a max <strong>of</strong> one bus per<br />
intersection per 2.5 minutes in any<br />
direction<br />
x x<br />
Intelligent Vehicle Systems<br />
Safety and Security<br />
Measured Indicator <strong>of</strong> Safety (e.g. number <strong>of</strong><br />
accidents)<br />
None None none None<br />
Survey <strong>of</strong> Customer Perception <strong>of</strong> Safety or Security<br />
exists? (yes/no)<br />
yes<br />
3-125
BRT Elements and System Performance<br />
3-126<br />
Exhibit 3-17: BRT Elements by System and Safety (cont’d.)<br />
City, State / Province / Country Pereira Amsterdam Caen Edinburgh<br />
BRT Line / System Megabus Zuidtangent Tram on Wheels Fastlink<br />
Running Way (miles)<br />
On Street Mixed Lanes - 1.9 1.9<br />
On Street Exclusive Bus Lanes - 6.2 9.2 2.2<br />
Off Street Mixed Lanes - 2.5 -<br />
Off Street Reserved Lanes - - -<br />
At-Grade <strong>Transit</strong>way<br />
Grade-Separated <strong>Transit</strong>way<br />
17.0 14.9 0.1 0.9<br />
Queue Jumpers - Queue Jumper<br />
Marking<br />
Station<br />
Busway, Signage Busway, Signage<br />
Signage, concrete track with<br />
rail, landscaping<br />
signage, color, segregation<br />
Curb Design<br />
Vehicles<br />
Level Platform Level platform Level platform Level platform<br />
Configuration Stylized Articulated Articulated Bi-Articulated<br />
Standard single and double<br />
deck<br />
Floor Height<br />
ITS<br />
0.9 m Low Floor Low Floor Low Floor<br />
<strong>Transit</strong> Vehicle Prioritization x RTSP Signal Priority- Automatic TSP<br />
Intelligent Vehicle Systems<br />
Safety and Security<br />
Measured Indicator <strong>of</strong> Safety (e.g. number <strong>of</strong><br />
accidents)<br />
Survey <strong>of</strong> Customer Perception <strong>of</strong> Safety or Security<br />
exists? (yes/no)<br />
none Only for Docking, Mechanical<br />
Mechanical- Central Guidance<br />
Rail<br />
Mechanical
Exhibit 3-17: BRT Elements by System and Safety (cont’d.)<br />
BRT Elements and System Performance<br />
City, State / Province / Country Eindhoven Leeds London Rouen<br />
BRT Line / System Phileas - Western Corridor Superbus Crawley TEOR<br />
Running Way (miles)<br />
On Street Mixed Lanes 2.2 - 11.2 8.7<br />
On Street Exclusive Bus Lanes 3.8 3.7 -<br />
Off Street Mixed Lanes - - - -<br />
Off Street Reserved Lanes - - - -<br />
At-Grade <strong>Transit</strong>way<br />
Grade-Separated <strong>Transit</strong>way<br />
7.2 2.2 0.9 14.9<br />
Queue Jumpers -<br />
Marking<br />
Station<br />
Signage, concrete track,<br />
landscaping<br />
Curb guidance, pavement markings,<br />
some pavement color<br />
Signage, curb guidance<br />
Color running way and slightly<br />
raised in downtown<br />
Curb Design<br />
Vehicles<br />
Level platform Level platform, Raised Curb Standard Curb Level Platform<br />
Configuration Articulated, Bi-Articulated Standard Standard Articulated<br />
Floor Height<br />
ITS<br />
Low Floor Low Floor Low Floor Low Floor<br />
<strong>Transit</strong> Vehicle Prioritization TSP Signal Priority in downtown areas<br />
Signal Priority- Automatic<br />
and Manual<br />
Intelligent Vehicle Systems<br />
Safety and Security<br />
Measured Indicator <strong>of</strong> Safety (e.g. number <strong>of</strong><br />
accidents)<br />
Survey <strong>of</strong> Customer Perception <strong>of</strong> Safety or Security<br />
exists? (yes/no)<br />
Electromagnetic docking (not<br />
in use)<br />
Mechanical Mechanical Optical<br />
3-127
BRT Elements and System Performance<br />
3-128<br />
Exhibit 3-17: BRT Elements by System and Safety (cont’d.)<br />
City, State / Province / Country Utrecht Adelaide Brisbane<br />
BRT Line / System Busway North East Busway South East Busway Inner Northern Busway<br />
Running Way (miles)<br />
On Street Mixed Lanes 3.5<br />
On Street Exclusive Bus Lanes 2.0<br />
Off Street Mixed Lanes -<br />
Off Street Reserved Lanes -<br />
At-Grade <strong>Transit</strong>way 4.8<br />
Grade-Separated <strong>Transit</strong>way<br />
Queue Jumpers<br />
7.46 10.3 1.7<br />
Marking<br />
Station<br />
Signage, pavement markings,<br />
pavement color<br />
Off-Street Busway, Signage Off-Street Busway, Signage Off-Street Busway, Signage<br />
Curb Design<br />
Vehicles<br />
Level platform Standard Curb Standard Curb Standard Curb<br />
Configuration Bi-Articulated<br />
Standard Articulated = 60 Standard<br />
Rigid = 80<br />
Standard Rigid Standard Rigid<br />
Floor Height<br />
ITS<br />
Low Floor<br />
Merc - step high, Scania - step low<br />
floor<br />
Mainly Step Low Floor Some<br />
Step High Floor<br />
Mainly Step Low Floor Some<br />
Step High Floor<br />
<strong>Transit</strong> Vehicle Prioritization Signal Priority- Automatic Passive Priority (No active) - -<br />
Intelligent Vehicle Systems<br />
Safety and Security<br />
Measured Indicator <strong>of</strong> Safety (e.g. number <strong>of</strong><br />
accidents)<br />
-<br />
Mechanical Guide Rollers on Front<br />
Axle<br />
None None<br />
Survey <strong>of</strong> Customer Perception <strong>of</strong> Safety or Security<br />
exists? (yes/no)<br />
yes yes yes
Exhibit 3-17: BRT Elements by System and Safety (cont’d.)<br />
BRT Elements and System Performance<br />
City, State / Province / Country Sydney Beijing<br />
BRT Line / System Liverpool-Parramatta T-Way<br />
North-West T-Way -<br />
Blacktown-Parklea<br />
North-West T-Way -<br />
Parramatta-Rouse Hill<br />
Running Way (miles)<br />
On Street Mixed Lanes<br />
On Street Exclusive Bus Lanes 6.0 0.3 1.9<br />
Off Street Mixed Lanes<br />
Off Street Reserved Lanes<br />
2.2<br />
At-Grade <strong>Transit</strong>way<br />
Grade-Separated <strong>Transit</strong>way<br />
Queue Jumpers<br />
13.0 4.4 8.7 8.1<br />
Marking Signage, At-Grade Busway<br />
Signage/Red Pavement Color;<br />
Busway<br />
Signage/Red Pavement Color;<br />
Busway<br />
Line 1 BRT<br />
Station<br />
Curb Design<br />
Vehicles<br />
Standard Curb Standard Curb Standard Curb Level Platform<br />
Configuration Standard Rigid Standard Rigid Standard Rigid Articulated<br />
Floor Height<br />
ITS<br />
Step Low Floor Step High Step Mix Low Floor Step High Low-Floor<br />
<strong>Transit</strong> Vehicle Prioritization<br />
Signal Pre-emption including<br />
green extension and early green<br />
- - TSP<br />
Intelligent Vehicle Systems<br />
Safety and Security<br />
Measured Indicator <strong>of</strong> Safety (e.g. number <strong>of</strong><br />
accidents)<br />
None None None None<br />
Survey <strong>of</strong> Customer Perception <strong>of</strong> Safety or Security<br />
exists? (yes/no)<br />
yes<br />
Busway<br />
3-129
BRT Elements and System Performance<br />
3-130<br />
Exhibit 3-17: BRT Elements by System and Safety (cont’d.)<br />
City, State / Province / Country Hangzhou Kunming<br />
BRT Line / System Line B1 Busway network<br />
Running Way (miles)<br />
On Street Mixed Lanes<br />
On Street Exclusive Bus Lanes 6.2<br />
Off Street Mixed Lanes<br />
Off Street Reserved Lanes 24.9<br />
At-Grade <strong>Transit</strong>way<br />
Grade-Separated <strong>Transit</strong>way<br />
Queue Jumpers<br />
Marking Striping Striping<br />
Station<br />
Curb Design Standard Curb Standard Curb<br />
Vehicles<br />
Configuration Articulated Standard<br />
Floor Height Low-Floor High-Floor<br />
ITS<br />
<strong>Transit</strong> Vehicle Prioritization TSP<br />
Intelligent Vehicle Systems None None<br />
Safety and Security<br />
Measured Indicator <strong>of</strong> Safety (e.g. number <strong>of</strong><br />
accidents)<br />
Survey <strong>of</strong> Customer Perception <strong>of</strong> Safety or Security<br />
exists? (yes/no)
security<br />
description <strong>of</strong> security<br />
The objective <strong>of</strong> passenger security is to minimize both the frequency and severity<br />
<strong>of</strong> criminal activities impacting BRT systems and their patrons. Reducing<br />
potential or perceived threats to employees, passengers, and property improves<br />
the image <strong>of</strong> BRT systems. Security performance measures generally are measured<br />
as crime rates experienced on the transit system per unit <strong>of</strong> output (e.g.,<br />
per service hour or per trip). These statistics can then be compared to crime<br />
rates experienced in the system’s surrounding areas or across the entire transit<br />
system.<br />
Effects <strong>of</strong> BRT Elements on security<br />
Security principles should be studied and applied at all locations where passengers<br />
come into contact with BRT systems, specifically including stations and vehicles.<br />
Physical design elements, service characteristics, fare collection systems,<br />
and other advanced technologies all contribute to the level <strong>of</strong> passenger security.<br />
Stations—Station Location<br />
All <strong>of</strong>f-street station locations and the on-street island platform station location separate passengers<br />
from pedestrians potentially protecting them from criminal elements on sidewalks. Onstreet<br />
curb-adjacent station locations do not. Design for on-street station types (curb-adjacent<br />
or island platform) need to protect passengers from exposure to motorists.<br />
Stations—Station Type<br />
Since passengers potentially can spend time at stations in an exposed environment, designing<br />
stations to minimize exposure to crime or security threats is important. Such considerations<br />
include the provision <strong>of</strong> clear or transparent materials to preserve sight lines through the facility,<br />
incorporation <strong>of</strong> security monitoring or emergency telephones, and barriers or fare-enforcement<br />
areas to deter non-patrons from entering the station area.<br />
Vehicles—Aesthetic Enhancement<br />
Aesthetic enhancements that support a secure environment emphasize visibility, brightness,<br />
transparency, and openness. Some vehicle characteristics that support these principles include<br />
larger windows and enhanced lighting to promote sight lines through the vehicle. Large windows<br />
in the front and rear <strong>of</strong> the vehicle reduce the presence <strong>of</strong> dim zones within the vehicle<br />
(Lusk 2007).<br />
Fare Collection—Fare Collection Process<br />
BRT Elements and System Performance<br />
Off-board fare collection systems enhance security by promoting a vigilant security environment.<br />
Pro<strong>of</strong>-<strong>of</strong>-payment uses the same equipment, personnel, and procedures that are applied to<br />
collecting and enforcing fares and can help ensure passenger security on a system. Monitoring<br />
and surveillance measures could be applied to achieve both fare enforcement and security objectives.<br />
The presence <strong>of</strong> fare inspectors can both transmit a message <strong>of</strong> order and security and<br />
ensure a source <strong>of</strong> trained staff to assist customers in cases <strong>of</strong> emergency.<br />
Barrier-enforced fare payment may discourage criminals from entering the system and targeting<br />
passengers with cash and may also provide a more secure or controlled environment for<br />
waiting passengers.<br />
Fare Collection—Fare Media and Payment Options<br />
Pre-paid instruments and passes may not enhance passenger security, but may be easier to control<br />
if lost or stolen and may discourage crime on the system because <strong>of</strong> the reduced number<br />
<strong>of</strong> transactions using cash. Fare media options such as contactless smart cards that allow for<br />
stored value and that do not require passengers to reveal the instrument while paying the fare<br />
may also enhance security. In addition, smart card data can be analyzed for fraudulent usage<br />
patterns to detect fare evaders and other criminals.<br />
ITS—Operations Management<br />
BRT security can be addressed with operations management technology such as automated<br />
scheduling and dispatch and vehicle tracking. In addition, silent alarms and voice and video<br />
monitoring are important to the security <strong>of</strong> the BRT vehicle and passengers. When criminal<br />
activity does occur, an integrated system that includes a silent alarm, video cameras, and vehicle<br />
tracking can alert dispatchers instantly to the status <strong>of</strong> the BRT vehicle, where it is located, and<br />
what is occurring on the BRT vehicle.<br />
Service and Operating Plans<br />
Service and operating plans that feature more frequent service on trunk lines minimize exposure<br />
<strong>of</strong> patrons to potential crime at stations by reducing time required to wait at stations.<br />
performance <strong>of</strong> Existing systems<br />
Research summary<br />
As with system safety, the actual impact <strong>of</strong> domestic BRT investments on transit<br />
system security remains undetermined (due to the lack <strong>of</strong> available data). However,<br />
comparisons <strong>of</strong> security pr<strong>of</strong>iles among other existing transit modes allow<br />
for some estimation <strong>of</strong> the expected security performance <strong>of</strong> BRT.<br />
Among existing transit modes, conventional bus service consistently reports the<br />
lowest overall crime rates, whether measured on a per passenger trip or vehicle<br />
3-131
BRT Elements and System Performance<br />
revenue-mile basis. The higher crime reported for U.S. rail transit systems rates<br />
as compared to conventional bus, is primarily at stations and stops. (The majority<br />
<strong>of</strong> the reported crimes at stations and stops is burglary and theft related).<br />
These relationships are presented in Exhibit 3-18, which presents the number <strong>of</strong><br />
security incidents per million passenger trips (including theft/burglary, property<br />
crimes, assaults, and suicides).<br />
3-132<br />
Exhibit 3-18: Security Incidents per Million Passenger Trips<br />
Source: National <strong>Transit</strong> Database (NTD), major and non-major security incidents, 2002 - 2005<br />
The reason for the higher reported crime rates among rail transit modes is unknown.<br />
However, several hypotheses may explain the differences. First, rail transit<br />
stations/stops and vehicles, especially those operating under pro<strong>of</strong>-<strong>of</strong>-paymentbased<br />
fare systems, are more commonly frequented by transit police as compared<br />
to conventional bus. Hence, incidents occurring on systems frequented by<br />
transit police are more likely to be reported, as compared to those modes transit<br />
police inspect with lower frequency. Moreover, crimes occurring at conventional<br />
bus stations are more likely to be reported to municipal police and not recorded<br />
by transit agencies, whereas crimes in LRT stations are more likely to be reported<br />
to transit police. These factors suggest that actual crime rates for conventional<br />
buses may be higher than reported crime rates. Nonetheless, the data suggest<br />
that reported crime is higher at rail stations and, by extension, BRT planners<br />
should adopt strategies to address this issue.<br />
Enforcement <strong>of</strong> pro<strong>of</strong>-<strong>of</strong>-payment systems is also important for maintaining low<br />
crime rates. Light rail transit systems have high rates <strong>of</strong> fare evasion relative to<br />
other transit modes due to the common use <strong>of</strong> pro<strong>of</strong>-<strong>of</strong>-payment systems. There<br />
are nearly 200 recorded incidents <strong>of</strong> fare evasion per 1 million light rail passenger<br />
trips, compared to just 18 for commuter rail, 7 for heavy rail, and 2 for conventional<br />
buses. Prevention <strong>of</strong> fare evasion through information and enforcement<br />
is a critical component <strong>of</strong> pro<strong>of</strong>-<strong>of</strong>-payment systems, such as those commonly<br />
promoted for BRT.<br />
System Performance Pr<strong>of</strong>iles<br />
Southeast Busway, Brisbane<br />
The Southeast Busway is a two-way facility comprising elevated roadways and<br />
underground tunnels between the Brisbane CBD and communities to the southeast,<br />
terminating at Eight Mile Plains. Service continues through the Pacific Motorway<br />
to service Underwood and Springwood on the Gold Coast. It delivers fast<br />
and reliable bus services but also provides a safer public transport experience. A<br />
state-<strong>of</strong>-the-art Busway Operations Centre (BOC) at Woolloongabba plays a vital<br />
role in the management <strong>of</strong> the busway. Among other duties, staff at the BOC<br />
monitor security at stations and detect illegal use <strong>of</strong> the busway by unauthorized<br />
vehicles.<br />
The 16.5 km busway route is monitored by 140 security cameras and patrolled<br />
24 hours a day by Busway Safety Officers (BSO). All platforms are equipped with<br />
emergency telephones that link directly to the BOC. Real-time next bus information<br />
also is provided at stations to improve trip planning by passengers.<br />
The stations use toughened glass screens to provide open and highly transparent<br />
spaces. Stations are well lit using high lux white lighting to improve visibility and<br />
station security. Pedestrian under- and over-passes improve the safety <strong>of</strong> crossing<br />
between platforms. Cautionary tactile paving is used throughout station entry<br />
plazas and platforms to assist the sight impaired. All stations are clearly signed,<br />
with entry plazas outlining safety tips and conditions <strong>of</strong> entry.<br />
While there is a high frequency <strong>of</strong> bus service, there is a relatively low volume <strong>of</strong><br />
vehicles on the busway since only buses and emergency vehicles are permitted<br />
on the facility. Lower travel volumes reduce the opportunities for collisions. Bus-
es travel at 80 km/hr (50 mph) on the busway and 50 km/hr (31 mph) through<br />
busway stations when not stopping.<br />
BRT Elements by System and Security<br />
Exhibit 3-19 presents a summary <strong>of</strong> BRT elements that affect the security <strong>of</strong> the<br />
BRT systems in 36 cities around the world, as well as available performance data.<br />
In discussing security issues, it is important to distinguish between fare evasion<br />
and other security threats. Fare evasion is a non-violent <strong>of</strong>fense, while most other<br />
security threats are violent or cause damage. Both types <strong>of</strong> threats can be generally<br />
addressed through physical design features (e.g., station and vehicle design<br />
and lighting), technological enhancements, surveillance, and enforcement. However,<br />
the specific techniques for reducing fare evasion are more straightforward<br />
to identify and implement.<br />
Few systems provided data relating to system security, making it impossible to<br />
draw any conclusions about the impact <strong>of</strong> particular BRT elements on security.<br />
Several did report the results <strong>of</strong> passenger surveys that asked questions about<br />
safety and security perceptions. Many <strong>of</strong> these surveys asked passengers about<br />
their “personal safety,” which could be interpreted as either security from crime<br />
or the likelihood <strong>of</strong> accidents. The following BRT systems reported the results <strong>of</strong><br />
passenger surveys on safety:<br />
Boston Silver Line Waterfront Service: 78 percent <strong>of</strong> passengers rated safety<br />
above average or excellent.<br />
Los Angeles Metro Rapid: Passengers rated personal safety on buses 3.88<br />
out <strong>of</strong> 5, compared to 3.40 for the former Limited Bus.<br />
Miami-Dade Busway: 67.5 percent <strong>of</strong> passengers rate safety riding vehicles as<br />
good or very good; 59.5 percent <strong>of</strong> passengers rate safety at busway stations<br />
as good or very good.<br />
AC <strong>Transit</strong> San Pablo Rapid: 75 percent <strong>of</strong> customers rated personal safety<br />
on vehicles as good or very good; 72 percent rated safety at stations as good<br />
or very good.<br />
While it is not possible to draw broad conclusions from these few cases, it is<br />
interesting to note that each system has very different BRT elements, perhaps<br />
indicating that no single element is necessary to provide a feeling <strong>of</strong> security. For<br />
example, Boston’s Silver Line Waterfront service features underground stations<br />
BRT Elements and System Performance<br />
and the Miami busway has <strong>of</strong>f-street enhanced shelters, while Metro Rapid and<br />
AC <strong>Transit</strong> Rapid have basic on-street stops.<br />
Overall, many but not all <strong>of</strong> the BRT systems in Exhibit 3-19 report having either<br />
silent alarms, voice monitoring, or video monitoring to promote security. In addition,<br />
as noted earlier, most BRT systems are using modern stylized vehicles for<br />
their BRT services; these vehicles typically feature large windows and enhanced<br />
lighting, which may enhance a feeling <strong>of</strong> safety for passengers on the vehicle.<br />
With regard to fare collection, only 10 cities report using pro<strong>of</strong>-<strong>of</strong>-payment fare<br />
collection, which can reinforce a feeling <strong>of</strong> security because <strong>of</strong> the presence <strong>of</strong><br />
agency personnel on the buses to check fares. This method is slightly more common<br />
in Europe, where five <strong>of</strong> the eight systems in Exhibit 3-19 use on-board payments<br />
in combination with pro<strong>of</strong>-<strong>of</strong>-payment. Only Cleveland, Las Vegas, and<br />
the Los Angeles Orange Line use <strong>of</strong>f-board pro<strong>of</strong>-<strong>of</strong>-payment fare collection in<br />
the U.S.; all others use driver-based on-board fare collection or charge no fares<br />
at all. Of the 36 cities, only the three Latin American cities use barrier-controlled<br />
<strong>of</strong>f-board payment systems, which can provide the highest level <strong>of</strong> security by<br />
controlling access to the system and requiring a heavy agency personnel presence<br />
at stations to check fares.<br />
3-133
BRT Elements and System Performance<br />
3-134<br />
Exhibit 3-19: BRT Elements by System and Security<br />
City, State / Province / Country Albuquerque Boston Silver Line<br />
BRT Line / System Rapid Ride Washington St Waterfront SL1 - Airport Waterfront SL2 - BMIP<br />
Station<br />
Location On-Street On-Street On and Off On and Off<br />
Type<br />
Vehicles<br />
Enhanced Shelter<br />
No Shelter, Basic Shelter, Enhanced<br />
Shelter & <strong>Transit</strong> Center<br />
No Shelter, Underground<br />
Station & <strong>Transit</strong> Center<br />
No Shelter, Underground<br />
Station & <strong>Transit</strong> Center<br />
Configuration Articulated Stylized Articulated Articulated Articulated<br />
Description <strong>of</strong> Livery / Image<br />
Red & White Paint, Rapid Ride<br />
Logo<br />
Special livery Special livery Special livery<br />
Interior Features<br />
Fare Collection<br />
Molded plastic with fabric inserts Standard seats in 2+2 configuration luggage racks for airport line<br />
Fare Collection Process Pay on-board Pay On-Board<br />
Barrier at 3 underground stops;<br />
pay on board elsewhere<br />
Barrier at 3 underground<br />
stops; pay on board elsewhere<br />
Fare Media and Payment Options<br />
ITS<br />
Cash & Paper only<br />
Cash / Paper Transfers / Magnetic<br />
Stripe / Smart Cards<br />
cash, paper ticket, smart card cash, paper ticket, smart card<br />
Automatic Vehicle Location (AVL) GPS GPS GPS, dead reckoning in tunnel GPS, dead reckoning in tunnel<br />
Automated Scheduling and Dispatch None CAD CAD<br />
Vehicle Component Monitoring System AVM<br />
Silent Alarms x<br />
Voice and Video Monitoring Video Monitoring x<br />
Safety and Security<br />
Measured Indicator <strong>of</strong> Security (e.g. number <strong>of</strong><br />
incidents)<br />
All 3 routes All 3 routes<br />
Survey <strong>of</strong> Customer Perception <strong>of</strong> Safety or Security<br />
exists? (yes/no)<br />
78% rated safety above average<br />
or excellent<br />
78% rated safety above<br />
average or excellent
Exhibit 3-19: BRT Elements by System and Security (cont’d.)<br />
BRT Elements and System Performance<br />
City, State / Province / Country Chicago* Cleveland<br />
BRT Line / System Western Avenue Express Irving Park Express Garfield Express HealthLine<br />
Station<br />
Location On On On On<br />
Type<br />
Vehicles<br />
No Shelter No Shelter No Shelter Enhanced Shelter<br />
Configuration Stylized articulated<br />
Description <strong>of</strong> Livery / Image<br />
Distinct electronic destination<br />
signs<br />
Distinct electronic destination signs<br />
Distinct electronic destination<br />
signs<br />
Specialized Livery, Large<br />
Windows<br />
Interior Features<br />
Fare Collection<br />
Wide Aisles and Doors<br />
Fare Collection Process On Board On Board On Board Off Board, Pro<strong>of</strong> <strong>of</strong> Payment<br />
Fare Media and Payment Options<br />
ITS<br />
Cash & Paper Cash & Paper Cash & Paper<br />
Automatic Vehicle Location (AVL)<br />
Automated Scheduling and Dispatch<br />
Vehicle Component Monitoring System<br />
Yes<br />
Silent Alarms<br />
Voice and Video Monitoring<br />
Safety and Security<br />
Measured Indicator <strong>of</strong> Security (e.g. number <strong>of</strong><br />
incidents)<br />
Survey <strong>of</strong> Customer Perception <strong>of</strong> Safety or Security<br />
exists? (yes/no)<br />
Yes<br />
3-135
BRT Elements and System Performance<br />
3-136<br />
Exhibit 3-19: BRT Elements by System and Security (cont’d.)<br />
City, State / Province / Country Eugene Honolulu<br />
BRT Line / System EmX City Express: A City Express: B Country Express: C<br />
Station<br />
Location On On On On<br />
Type<br />
Vehicles<br />
Enhanced Shelter, Station<br />
Building<br />
Basic Shelter Basic Shelter Basic Shelter<br />
Configuration Stylized articulated Articulated Standard Articulated<br />
Description <strong>of</strong> Livery / Image<br />
Specialized Livery, Large<br />
Windows<br />
Standard livery Standard livery Standard livery<br />
Interior Features<br />
Fare Collection<br />
Wide Aisles and Doors<br />
Fare Collection Process None -- to be <strong>of</strong>f board Pay On-Board Pay On-Board Pay On-Board<br />
Fare Media and Payment Options<br />
ITS<br />
N/A Cash & Paper Cash & Paper Cash & Paper<br />
Automatic Vehicle Location (AVL) GPS GPS GPS GPS<br />
Automated Scheduling and Dispatch<br />
Vehicle Component Monitoring System<br />
Silent Alarms<br />
Voice and Video Monitoring<br />
Safety and Security<br />
Measured Indicator <strong>of</strong> Security (e.g. number <strong>of</strong><br />
incidents)<br />
Survey <strong>of</strong> Customer Perception <strong>of</strong> Safety or Security<br />
exists? (yes/no)<br />
CAD
Exhibit 3-19: BRT Elements by System and Security (cont’d.)<br />
City, State / Province / Country Kansas City Las Vegas Los Angeles<br />
BRT Elements and System Performance<br />
BRT Line / System MAX - Main St MAX Orange Line Metro Rapid (All Routes)<br />
Station<br />
Location On On and Off Off On and Off<br />
Type<br />
Vehicles<br />
Enhanced Shelter Basic and Enhanced Shelter Enhanced Shelter<br />
No Shelter, Enhanced Shelter,<br />
<strong>Transit</strong> Center<br />
Configuration Stylized Standard Stylized Articulated Stylized Articulated<br />
Stylized Standard and<br />
Articulated<br />
Description <strong>of</strong> Livery / Image<br />
Max logo, unique livery and<br />
image, large continuous<br />
windows, sleek look<br />
Modern looking interior,<br />
Sleek, modern lines with large<br />
windows,<br />
Silver metallic two-tone paint<br />
scheme & Metro Orange Line<br />
name branding, large windows<br />
Red/Silver two-tone paint<br />
scheme & Metro Rapid name<br />
branding<br />
Interior Features<br />
Fare Collection<br />
increased aisle width, increase<br />
hip-to-knee room, wider doors,<br />
wider windows<br />
modern auto like interior, finished<br />
window glazing<br />
USSC Aries cloth seats x<br />
Fare Collection Process Pay On-board Pro<strong>of</strong>-<strong>of</strong>-Payment Pro<strong>of</strong>-<strong>of</strong>-Payment Pay On-board<br />
Fare Media and Payment Options<br />
ITS<br />
Magnetic Stripe<br />
Tickets from TVM and standard<br />
paper passes<br />
Cash and Paper Passes<br />
Automatic Vehicle Location (AVL) GPS Orbital GPS, Loop Detectors GPS, Loop Detectors<br />
Automated Scheduling and Dispatch CAD/AVL x x<br />
Vehicle Component Monitoring System X None None<br />
Silent Alarms Yes Yes<br />
Voice and Video Monitoring<br />
Safety and Security<br />
Yes<br />
Automatic Transportation<br />
Monitoring System<br />
Automatic Transportation<br />
Monitoring System<br />
Measured Indicator <strong>of</strong> Security (e.g. number <strong>of</strong><br />
incidents)<br />
x x<br />
Passengers rate Metro Rapid<br />
Survey <strong>of</strong> Customer Perception <strong>of</strong> Safety or Security<br />
exists? (yes/no)<br />
Personal Safety on Buses 3.88<br />
out <strong>of</strong> 5, compared to 3.40 for<br />
the former Limited Bus<br />
3-137
BRT Elements and System Performance<br />
3-138<br />
Exhibit 3-19: BRT Elements by System and Security (cont’d.)<br />
City, State / Province / Country Miami Oakland Orlando* Phoenix<br />
BRT Line / System Busway San Pablo Ave Rapid LYMMO RAPID - I-10 East<br />
Station<br />
Location Off On Off On<br />
Type<br />
Vehicles<br />
Enhanced Shelter Basic Shelter Enhanced Shelter Enhanced Shelter<br />
Configuration Standard, Articulated, Minis Stylized standard Stylized standard Specialized composite bus<br />
Description <strong>of</strong> Livery / Image Standard <strong>Transit</strong> Specialized Livery, Logos, Branding Specialized Livery, Wide Doors Distinct styling & livery<br />
high-back seating, forward<br />
Interior Features<br />
Fare Collection<br />
facing, luggage racks,<br />
overhead lighting, reclining<br />
seats<br />
Fare Collection Process Pay on Board Pay On-Board Free Pay On-Board<br />
Fare Media and Payment Options<br />
ITS<br />
Cash, paper swipe card Free Cash, Magnetic Swiping<br />
Automatic Vehicle Location (AVL) AVL GPS AVL/Wi-Fi Orbital<br />
Automated Scheduling and Dispatch CAD Yes - Yes<br />
Vehicle Component Monitoring System Yes - -<br />
Silent Alarms - Yes Yes<br />
Voice and Video Monitoring - Yes Yes Yes<br />
Safety and Security<br />
Measured Indicator <strong>of</strong> Security (e.g. number <strong>of</strong><br />
incidents)<br />
All 2004<br />
Survey <strong>of</strong> Customer Perception <strong>of</strong> Safety or Security<br />
exists? (yes/no)<br />
67.5% <strong>of</strong> passengers rate safety<br />
riding vehicles as Good or Very<br />
Good; 59.5% <strong>of</strong> passengers rate<br />
safety at Busway stations as<br />
Good or Very Good (2004)<br />
75% <strong>of</strong> customers rated personal<br />
safety on vehicles as good or very<br />
good; 72% rated safety at stations as<br />
good or very good.
Exhibit 3-19: BRT Elements by System and Security (cont’d.)<br />
BRT Elements and System Performance<br />
City, State / Province / Country Phoenix Pittsburgh*<br />
BRT Line / System RAPID - I-10 West RAPID - SR-51 RAPID - I-17 East Busway<br />
Station<br />
Location On On On Off<br />
Type<br />
Vehicles<br />
Enhanced Shelter Enhanced Shelter Enhanced Shelter Enhanced Shelter<br />
Configuration Specialized composite bus Specialized composite bus Specialized composite bus Standard & Articulated<br />
Description <strong>of</strong> Livery / Image Distinct styling & livery Distinct styling & livery Distinct styling & livery Standard and Articulated<br />
Interior Features<br />
high-back seating, forward facing,<br />
luggage racks, overhead lighting,<br />
reclining seats<br />
high-back seating, forward facing,<br />
luggage racks, overhead lighting,<br />
reclining seats<br />
high-back seating, forward<br />
facing, luggage racks, overhead<br />
lighting, reclining seats<br />
Cushioned Seats<br />
Fare Collection<br />
Fare Collection Process Pay On-Board Pay On-Board Pay On-Board Pay On-Board<br />
Fare Media and Payment Options Cash, Magnetic Swiping Cash, Magnetic Swiping Cash, Magnetic Swiping Cash and Paper Only<br />
ITS<br />
Automatic Vehicle Location (AVL) Orbital Orbital Orbital -<br />
Automated Scheduling and Dispatch Yes Yes Yes -<br />
Vehicle Component Monitoring System - - - -<br />
Silent Alarms Yes Yes Yes -<br />
Voice and Video Monitoring Yes Yes Yes -<br />
Safety and Security<br />
Measured Indicator <strong>of</strong> Security (e.g. number <strong>of</strong><br />
incidents)<br />
Survey <strong>of</strong> Customer Perception <strong>of</strong> Safety or Security<br />
exists? (yes/no)<br />
3-139
BRT Elements and System Performance<br />
3-140<br />
Exhibit 3-19: BRT Elements by System and Security (cont’d.)<br />
City, State / Province / Country Pittsburgh* Sacramento San Jose<br />
BRT Line / System South Busway West Busway EBus - Stockton Rapid 522<br />
Station<br />
Location Off Off On and Off On and Off<br />
Type<br />
Vehicles<br />
Enhanced Shelter Enhanced Shelter<br />
No Shelter, Basic Shelter, <strong>Transit</strong><br />
Center<br />
No Shelter, Basic Shelter and<br />
Enhanced Shelter; <strong>Transit</strong><br />
Center<br />
Configuration Standard & Articulated Standard & Articulated<br />
Stylized Standard and<br />
Articulated<br />
Description <strong>of</strong> Livery / Image Standard and articulated Standard and articulated Standard Branded BRT-only full bus wraps<br />
Interior Features<br />
Fare Collection<br />
Cushioned Seats Cushioned Seats Standard<br />
Typical transit bus - front<br />
facing, upholstered seats<br />
Fare Collection Process Pay On-Board Pay On-Board Pay on-board Pay On-board<br />
Fare Media and Payment Options<br />
ITS<br />
Cash and Paper Only Cash and Paper Only cash and passes<br />
Cash and Paper Passes. Smart<br />
cards in development<br />
Automatic Vehicle Location (AVL) - - None GPS<br />
Automated Scheduling and Dispatch - - None Trapeze<br />
Vehicle Component Monitoring System - - None None<br />
Silent Alarms - - Yes Yes<br />
Voice and Video Monitoring<br />
Safety and Security<br />
- - Yes Yes, CCTV<br />
Measured Indicator <strong>of</strong> Security (e.g. number <strong>of</strong><br />
incidents)<br />
x<br />
Survey <strong>of</strong> Customer Perception <strong>of</strong> Safety or Security<br />
exists? (yes/no)<br />
No
Exhibit 3-19: BRT Elements by System and Security (cont’d.)<br />
City, State / Province / Country Halifax Ottawa<br />
BRT Elements and System Performance<br />
BRT Line / System Metro<strong>Link</strong> 95 96 97<br />
Station<br />
Location On and Off On and Off On and Off On and Off<br />
Type<br />
Vehicles<br />
Basic Shelter, Station Enclosures Station Enclosures and Buildings<br />
Station Enclosures and<br />
Buildings<br />
Station Enclosures and<br />
Buildings<br />
Configuration Stylized Standard Articulated Standard Articulated<br />
Description <strong>of</strong> Livery / Image<br />
Blue, yellow, white patterned<br />
livery and unique branding<br />
Maple leaf livery; similar to rest <strong>of</strong><br />
fleet<br />
Maple leaf livery; similar to rest<br />
<strong>of</strong> fleet<br />
Maple leaf livery; similar to<br />
rest <strong>of</strong> fleet<br />
Interior Features<br />
Fare Collection<br />
Cloth seats, reclining with arm /<br />
foot rests<br />
Cloth seats Cloth seats Cloth seats<br />
Fare Collection Process Pay on-board Pro<strong>of</strong>-<strong>of</strong>-Payment Pro<strong>of</strong>-<strong>of</strong>-Payment Pro<strong>of</strong>-<strong>of</strong>-Payment<br />
Fare Media and Payment Options<br />
ITS<br />
cash / tickets / passes Cash, Paper tickets, or passes Cash, Paper tickets, or passes Cash, Paper tickets, or passes<br />
Automatic Vehicle Location (AVL) AVL GPS GPS GPS<br />
Automated Scheduling and Dispatch None Yes Yes Yes<br />
Vehicle Component Monitoring System None Under development Under development Under development<br />
Silent Alarms<br />
Yes, emergency button with<br />
operator<br />
Yes Yes Yes<br />
Voice and Video Monitoring<br />
Safety and Security<br />
No At stations, planned for in-vehicle<br />
At stations, planned for invehicle<br />
At stations, planned for invehicle<br />
Measured Indicator <strong>of</strong> Security (e.g. number <strong>of</strong><br />
incidents)<br />
x x x x<br />
Survey <strong>of</strong> Customer Perception <strong>of</strong> Safety or Security<br />
exists? (yes/no)<br />
x Yes Yes Yes<br />
3-141
BRT Elements and System Performance<br />
3-142<br />
Exhibit 3-19: BRT Elements by System and Security (cont’d.)<br />
City, State / Province / Country York Bogota Guayaquil<br />
BRT Line / System VIVA Blue VIVA Purple Transmilenio Metrovia<br />
Station<br />
Location On and Off On and Off Off Off<br />
Type<br />
Vehicles<br />
Basic and Enhanced Shelter Basic and Enhanced Shelter Station Station<br />
Configuration Articulated Standard Stylized Articulated<br />
Stylized Standard &<br />
Articulated<br />
Description <strong>of</strong> Livery / Image Metallic blue with Viva logo Metallic blue with Viva logo Red, branded articulated buses<br />
Blue, branded articulated<br />
buses<br />
Interior Features<br />
Cloth seats in spacious<br />
arrangement and tables for<br />
workspace at some rear seats.<br />
WiFi being deployed. Large<br />
windows. Bright, large in-vehicle<br />
display screens<br />
Cloth seats in spacious arrangement<br />
and tables for workspace at some<br />
rear seats. WiFi being deployed.<br />
Large windows. Bright, large invehicle<br />
display screens<br />
molded plastic seats, front/rear<br />
and side facing<br />
Fare Collection<br />
Fare Collection Process Pro<strong>of</strong>-<strong>of</strong>-Payment Pro<strong>of</strong>-<strong>of</strong>-Payment<br />
Barrier (Verify at station<br />
entrances / exits)<br />
Barrier<br />
Fare Media and Payment Options<br />
ITS<br />
Paper tickets or passes Paper tickets or passes Smart Cards Cash, Smart Cards<br />
Automatic Vehicle Location (AVL) AVL-equipped AVL-equipped Loop detectors, station sensors On-board transponders<br />
Automated Scheduling and Dispatch Yes Yes x x<br />
Vehicle Component Monitoring System<br />
Oil temp, Oil pressure, Engine<br />
temp reported to control centre<br />
Oil temp, Oil pressure, Engine temp<br />
reported to control centre<br />
x x<br />
Silent Alarms<br />
Yes, emergency button with<br />
covert alarm<br />
Yes, emergency button with covert<br />
alarm<br />
x x<br />
Voice and Video Monitoring<br />
"No voice monitoring<br />
On-board video recording being<br />
“No voice monitoring<br />
On-board video recording being<br />
x x<br />
installed, no monitoring”<br />
installed, no monitoring”<br />
Safety and Security<br />
Measured Indicator <strong>of</strong> Security (e.g. number <strong>of</strong><br />
incidents)<br />
Survey <strong>of</strong> Customer Perception <strong>of</strong> Safety or Security<br />
exists? (yes/no)<br />
x x x<br />
yes x<br />
x
Exhibit 3-19: BRT Elements by System and Security (cont’d.)<br />
BRT Elements and System Performance<br />
City, State / Province / Country Pereira Amsterdam Caen Edinburgh<br />
BRT Line / System Megabus Zuidtangent Tram on Wheels Fastlink<br />
Station<br />
Location Off On On and Off<br />
Type<br />
Vehicles<br />
Station<br />
Enhanced Shelters, Stations,<br />
<strong>Transit</strong> Centers<br />
Configuration Stylized Articulated Articulated Bi-Articulated<br />
Standard single and double<br />
deck<br />
Description <strong>of</strong> Livery / Image Green, branded articulated buses Zuidtangent logo, red braded buses Blue & White- Twisto Standard<br />
Interior Features<br />
Fare Collection<br />
molded plastic seats, front/rear<br />
and side facing<br />
"bistro" style semi-circle seating<br />
at rear<br />
Fare Collection Process<br />
Barrier (Verify at station<br />
entrances)<br />
Pay On-Board or Pro<strong>of</strong> <strong>of</strong> Payment<br />
Pay On-Board or Pro<strong>of</strong> <strong>of</strong><br />
Payment<br />
Pay On-Board or Pro<strong>of</strong> <strong>of</strong><br />
Payment<br />
Fare Media and Payment Options<br />
ITS<br />
Smart Cards Paper (Strippenkart) Smart Cards, Magnetic tickets<br />
Cash Coin (Exact Change) or<br />
Smart Card<br />
Automatic Vehicle Location (AVL) On-board transponders GPS<br />
Automated Scheduling and Dispatch x Yes<br />
Vehicle Component Monitoring System x<br />
Silent Alarms x<br />
Voice and Video Monitoring x CCTV at station and in bus<br />
Safety and Security<br />
Measured Indicator <strong>of</strong> Security (e.g. number <strong>of</strong><br />
incidents)<br />
Survey <strong>of</strong> Customer Perception <strong>of</strong> Safety or Security<br />
exists? (yes/no)<br />
x<br />
x<br />
3-143
BRT Elements and System Performance<br />
3-144<br />
Exhibit 3-19: BRT Elements by System and Security (cont’d.)<br />
City, State / Province / Country Eindhoven Leeds London Rouen<br />
BRT Line / System Phileas - Western Corridor Superbus Crawley TEOR<br />
Station<br />
Location<br />
Type<br />
Vehicles<br />
Configuration Articulated, Bi-Articulated Standard Standard Articulated<br />
Description <strong>of</strong> Livery / Image Phileas bus logo Standard<br />
Fastway logo, blue/grey<br />
branded buses, unique<br />
enhanced shelters<br />
TEOR Logo (Transport Est-<br />
Ouest Rouennais)<br />
Interior Features<br />
Fare Collection<br />
Fare Collection Process<br />
Pro<strong>of</strong>-<strong>of</strong>-Payment, Pay On-Board<br />
machine, no driver payment<br />
Pay On-Board Pay On-Board Off-board Fare Collection<br />
Fare Media and Payment Options<br />
ITS<br />
Automatic Vehicle Location (AVL)<br />
Automated Scheduling and Dispatch<br />
Vehicle Component Monitoring System<br />
Silent Alarms<br />
Voice and Video Monitoring<br />
Paper (Strippenkart) Cash and Paper Only Cash Magnetic Strip<br />
Safety and Security<br />
Measured Indicator <strong>of</strong> Security (e.g. number <strong>of</strong><br />
incidents)<br />
Survey <strong>of</strong> Customer Perception <strong>of</strong> Safety or Security<br />
exists? (yes/no)
Exhibit 3-19: BRT Elements by System and Security (cont’d.)<br />
City, State / Province / Country Utrecht Adelaide Brisbane<br />
BRT Elements and System Performance<br />
BRT Line / System Busway North East Busway South East Busway Inner Northern Busway<br />
Station<br />
Location Off Off Off<br />
Type<br />
Vehicles<br />
<strong>Transit</strong> Centers Stations, <strong>Transit</strong> Centers Stations, <strong>Transit</strong> Centers<br />
Configuration Bi-Articulated<br />
Standard Articulated = 60 Standard<br />
Rigid = 80<br />
Standard Rigid Standard Rigid<br />
Description <strong>of</strong> Livery / Image Standard<br />
Standard white and yellow - same as<br />
non busway corridors<br />
Standard Brisbane White, Blue<br />
and Yellow<br />
Interior Features<br />
Fare Collection<br />
Luggage racks over wheel hubs<br />
Fare Collection Process Pro<strong>of</strong>-<strong>of</strong>-Payment, Pay On-Board<br />
Pay on Board (80% pre pay multirider<br />
ticket)<br />
Pay on Board Pay on Board<br />
Fare Media and Payment Options<br />
ITS<br />
Paper (Strippenkart) Cash & Paper Magnetic Stripe Cash & Paper Magnetic Stripe<br />
Automatic Vehicle Location (AVL) - GPS GPS<br />
Automated Scheduling and Dispatch X X X<br />
Vehicle Component Monitoring System X X X<br />
Silent Alarms Yes - -<br />
Voice and Video Monitoring Yes Yes Yes<br />
Safety and Security<br />
Measured Indicator <strong>of</strong> Security (e.g. number <strong>of</strong><br />
incidents)<br />
Survey <strong>of</strong> Customer Perception <strong>of</strong> Safety or Security<br />
exists? (yes/no)<br />
- - -<br />
yes yes yes<br />
3-145
BRT Elements and System Performance<br />
3-146<br />
Exhibit 3-19: BRT Elements by System and Security (cont’d.)<br />
City, State / Province / Country Sydney Beijing<br />
BRT Line / System Liverpool-Parramatta T-Way<br />
North-West T-Way - Blacktown-<br />
Parklea<br />
North-West T-Way -<br />
Parramatta-Rouse Hill<br />
Line 1 BRT<br />
Station<br />
Location On and Off Off On and Off Off<br />
Type<br />
Vehicles<br />
Basic and Enhanced Shelter;<br />
Stations<br />
Stations, <strong>Transit</strong> Centers<br />
Basic and Enhanced Shelters,<br />
<strong>Transit</strong> Centers<br />
Stations<br />
Configuration Standard Rigid Standard Rigid Standard Rigid Articulated<br />
Standard Sydney Bus Livery - Blue<br />
Description <strong>of</strong> Livery / Image<br />
Interior Features<br />
Fare Collection<br />
White and Yellow - with T-Way<br />
Logo<br />
White Red Stripe Yellow Specialized BRT vehicles<br />
Fare Collection Process Pay on Board Pay on Board Pay on Board Pay attendants at station<br />
Fare Media and Payment Options<br />
ITS<br />
Cash & Paper Magnetic Stripe Cash & Paper Magnetic Stripe Cash & Paper Magnetic Stripe Cash / Smart Cards<br />
Automatic Vehicle Location (AVL) Loop Detectors Yes<br />
Automated Scheduling and Dispatch X X X<br />
Vehicle Component Monitoring System X X X<br />
Silent Alarms - - -<br />
Voice and Video Monitoring Yes Yes Yes X<br />
Safety and Security<br />
Measured Indicator <strong>of</strong> Security (e.g. number <strong>of</strong><br />
incidents)<br />
Survey <strong>of</strong> Customer Perception <strong>of</strong> Safety or Security<br />
exists? (yes/no)<br />
- - -<br />
yes
Exhibit 3-19: BRT Elements by System and Security (cont’d.)<br />
City, State / Province / Country Hangzhou Kunming<br />
BRT Line / System Line B1 Busway network<br />
Station<br />
Location<br />
Type<br />
Vehicles<br />
On<br />
Configuration Articulated Standard<br />
Description <strong>of</strong> Livery / Image<br />
Interior Features<br />
Fare Collection<br />
Specialized red BRT vehicles<br />
Fare Collection Process Pay at station Pay On-Board<br />
Fare Media and Payment Options<br />
ITS<br />
Cash / Smart Cards Cash / IC Cards<br />
Automatic Vehicle Location (AVL)<br />
Automated Scheduling and Dispatch<br />
Vehicle Component Monitoring System<br />
Silent Alarms<br />
Voice and Video Monitoring<br />
Safety and Security<br />
Yes<br />
Measured Indicator <strong>of</strong> Security (e.g. number <strong>of</strong><br />
incidents)<br />
Survey <strong>of</strong> Customer Perception <strong>of</strong> Safety or Security<br />
exists? (yes/no)<br />
BRT Elements and System Performance<br />
3-147
BRT Elements and System Performance<br />
sysTEm capaciTy<br />
System capacity refers to the maximum number <strong>of</strong> people or transit vehicles<br />
that can be moved past a point by a BRT line or system. In practice, there are few<br />
corridors outside the nation’s largest metropolitan areas where capacity constraints<br />
are an issue. As passenger demand for a particular BRT line begins to<br />
meet or exceed capacity at its critical points, it is likely to impact the quality<br />
<strong>of</strong> service: reliability suffers, operating speeds decrease, and passenger loads increase.<br />
Therefore, providing adequate capacity for BRT systems is essential.<br />
There are three key issues for BRT system capacity assessment:<br />
BRT system capacity is limited by the critical link or lowest-capacity<br />
element (e.g., the bottleneck) within the BRT system. Three key elements<br />
determine BRT system capacity: BRT vehicle (passenger) capacity, BRT station<br />
(vehicle and passenger) capacity, and BRT running way (vehicle) capacity.<br />
Whichever <strong>of</strong> these is the most constraining on throughput becomes<br />
the controlling factor for the entire BRT corridor.<br />
There is a difference between capacity <strong>of</strong> a BRT system and the demand<br />
placed upon a BRT system. Capacity is a measure <strong>of</strong> the estimated maximum<br />
number <strong>of</strong> passengers that could be served by a particular BRT line.<br />
Demand is the actual number <strong>of</strong> passengers utilizing the line. The volume<br />
(demand) to capacity ratio is a standard measure to determine capacity<br />
utilization.<br />
Capacity and BRT level-<strong>of</strong>-service (LOS) are interdependent.<br />
LOS parameters<br />
effecting capacity include the availability <strong>of</strong> service (measured as frequency,<br />
span and coverage), the level <strong>of</strong> comfort (e.g., measured as standee<br />
density), travel time, and reliability.<br />
In presenting capacities <strong>of</strong> various BRT systems, person capacity will be expressed<br />
in terms <strong>of</strong> the theoretical maximum number <strong>of</strong> passengers that can be carried<br />
past the maximum load point along a BRT route per hour. It is important to note<br />
that the actual capacity (operated capacity) may actually be less than the maximum<br />
person capacity because BRT systems <strong>of</strong>ten operate at frequencies lower<br />
than the theoretical maximum capacity.<br />
The remainder <strong>of</strong> this section provides a detailed account <strong>of</strong> how BRT system capacity<br />
is calculated (much <strong>of</strong> the information has been distilled from the <strong>Transit</strong><br />
3-148<br />
Capacity and Quality <strong>of</strong> Service Manual, 2 nd Edition), summarizes how each BRT<br />
element affects BRT system capacity, and provides examples <strong>of</strong> the capacity <strong>of</strong><br />
existing BRT systems.<br />
description <strong>of</strong> person capacity<br />
For BRT systems, the most appropriate measure <strong>of</strong> capacity is a concept called<br />
person capacity. Person capacity is defined by the <strong>Transit</strong> Capacity and Quality<br />
<strong>of</strong> Service Manual, 2nd Edition as:<br />
the maximum number <strong>of</strong> passengers that can be carried along the critical<br />
section <strong>of</strong> the BRT route during a given period <strong>of</strong> time, under specified operating<br />
conditions, without unreasonable delay, hazard, or restriction and<br />
with reasonable certainty<br />
When discussing capacity, there are two key points to emphasize that capacity<br />
has multiple dimensions. How much capacity a system is designed to accommodate<br />
or how much capacity is operated are not necessarily equal to the<br />
maximum capacity or to each other. Three dimensions are useful to consider:<br />
maximum capacity, design capacity, and operated capacity. The differences are<br />
explained in Exhibit 3-20.<br />
Dimension <strong>of</strong><br />
Capacity<br />
Maximum<br />
Capacity<br />
Design<br />
Capacity<br />
Operated<br />
Capacity<br />
Exhibit 3-20: Different Aspects <strong>of</strong> Capacity<br />
Definition Determined by<br />
The unconstrained theoretical maximum<br />
capacity as determined by the physical<br />
characteristics <strong>of</strong> the system.<br />
Maximum capacity scaled down due<br />
to standards and policies (constraints)<br />
related to passenger comfort, safety, and<br />
manageability.<br />
The capacity based on the vehicle size and<br />
frequency actually operated. The operated<br />
capacity is usually less than the maximum<br />
capacity since the operation is scaled to<br />
actual demand.<br />
Vehicle size (maximum)<br />
BRT facility<br />
Operating policies<br />
Service plan (frequency)<br />
Vehicle size (actual; size<br />
may be smaller than the<br />
system can handle)
Effects <strong>of</strong> BRT Elements on person capacity<br />
Different BRT elements determine the three different aspects <strong>of</strong> capacity described<br />
above.<br />
Maximum Person Capacity<br />
Three primary factors determine the maximum person capacity—passenger capacity<br />
<strong>of</strong> BRT vehicles (how many passengers a vehicle can carry), the vehicle<br />
capacity <strong>of</strong> BRT facilities, and passenger demand characteristics. The influence<br />
<strong>of</strong> each factor on the system’s overall person capacity <strong>of</strong> a system is explained in<br />
more detail below.<br />
Passenger capacity <strong>of</strong> BRT vehicles denotes the maximum number <strong>of</strong> seated<br />
and standing passengers that a vehicle can safely and comfortably accommodate.<br />
Other vehicle characteristics such as overall length and the number and<br />
width <strong>of</strong> doors also influence dwell times and the BRT facility capacity.<br />
Vehicle capacity <strong>of</strong> BRT facilities defines the number <strong>of</strong> vehicles per hour<br />
that can use a specific BRT facility. This is largely driven by characteristics and<br />
resultant capacities <strong>of</strong> the BRT system running ways, stations, and the vehicles<br />
themselves. For both running ways and stations, capacity is enhanced by strategies<br />
and design elements that both increase the size <strong>of</strong> the system (e.g., multiple<br />
running way lanes, bus pullouts, larger stations) and reduce delays and improve<br />
the service rate <strong>of</strong> the system (e.g., transit prioritization systems, access control,<br />
strategies to reduce running time and dwell time). Average operating speeds<br />
and dwell times also influence the vehicle capacity <strong>of</strong> BRT facilities, and these<br />
characteristics are largely functions <strong>of</strong> the type and performance <strong>of</strong> the vehicles<br />
themselves.<br />
Unlike other performance attributes, where the performance is determined by<br />
the sum <strong>of</strong> individual elements, capacity is determined by the most constrained<br />
element. While individual elements <strong>of</strong> a BRT system (vehicles, station loading<br />
areas, entrances to vehicles, running way lanes) have individual capacities, BRT<br />
system capacity is determined by the bottlenecks in the system or by the components<br />
that have the lowest person capacity. For example, there may be plenty<br />
<strong>of</strong> capacity on the running way, but if BRT vehicles back up because prior vehicles<br />
are still loading or unloading at the station, the BRT vehicle loading area<br />
capacity at the station defines the maximum number <strong>of</strong> persons that the system<br />
can carry.<br />
BRT Elements and System Performance<br />
Passenger demand characteristics affect capacity by defining where the maximum<br />
load points (potential bottlenecks) in the system are and by affecting loading/unloading<br />
times. Key passenger demand characteristics include:<br />
Distribution <strong>of</strong> passengers over time—the<br />
more even the distribution <strong>of</strong><br />
passengers, the higher the system capacity. Concentrated, uneven loads create<br />
bottlenecks that reduce capacity.<br />
Passenger trip length—long<br />
trip lengths decrease the number <strong>of</strong> passenger<br />
trips that can be accommodated with a given schedule.<br />
Distribution <strong>of</strong> boarding passengers (and alighting) among stations—<br />
high concentrations <strong>of</strong> passengers at stations drive the maximum dwell<br />
time which reduces the number <strong>of</strong> vehicles a system can carry.<br />
Design Capacity<br />
Operators <strong>of</strong>ten define loading and service frequency standards for various types<br />
<strong>of</strong> service and/or vehicles that are below the theoretical maximum. Examples <strong>of</strong><br />
such standards relate to:<br />
Comfort (loading standards, standee policies)—some services (especially<br />
premium park-and-ride or express service) may have passenger loading<br />
standards or policies allowing no standees. Such policies are designed to<br />
promote passenger comfort.<br />
Safety (minimum spacing, limits on overtaking, speed limits)—the frequency<br />
<strong>of</strong> service may be set at one vehicle every 5 or 10 minutes, even though<br />
the facility can accommodate much more frequent service based upon safe<br />
sight and stopping distances, and other traffic engineering concerns.<br />
Manageability (minimum headway, schedule recovery policies)—operator<br />
policies may indicate stable headways can be maintained with a specific<br />
minimum headway or with provision for longer recovery time in the schedule<br />
When these policy constraints are factored in, a lower “design” person capacity<br />
for the system results.<br />
Operated Capacity<br />
The realistic determinant <strong>of</strong> actual capacity is the frequency <strong>of</strong> service and the<br />
size <strong>of</strong> the actual vehicles operated. Because passenger demand <strong>of</strong>ten does not<br />
reach the maximum capacity <strong>of</strong> the system, BRT systems operate at lower fre-<br />
3-149
BRT Elements and System Performance<br />
quencies or with smaller vehicles than the system can accommodate to match<br />
demand. As demand grows, frequency and vehicle size can be increased to meet<br />
demand and take advantage <strong>of</strong> any unused capacity.<br />
Exhibit 3-21 illustrates temporal demand for transit services. The first image is<br />
based on actual passenger volume data taken from a rail transit operator. The<br />
second image illustrates the general relationship between demand and operated<br />
capacity. They illustrate the need to assess capacities for the peak <strong>of</strong> demand as<br />
well as immediately before and after each peak (the “shoulders” <strong>of</strong> the peak).<br />
3-150<br />
Exhibit 3-21: Temporal Demand for Rail <strong>Transit</strong> Service<br />
Person Capacity (Passengers/Hour)<br />
OPERATED<br />
CAPACITY<br />
DEMAND<br />
Early Morning AM Peak Midday PM Peak<br />
Night<br />
24-hour Service Pr<strong>of</strong>ile<br />
MAXIMUM CAPACITY<br />
DESIGN CAPACITY<br />
The contribution <strong>of</strong> each BRT element to each aspect <strong>of</strong> capacity is summarized<br />
in Exhibit 3-22 and discussed in the remainder <strong>of</strong> this section.<br />
Exhibit 3-22: Relationship <strong>of</strong> BRT Elements to Aspects <strong>of</strong><br />
Person Capacity<br />
Capacity<br />
Factor<br />
BRT Element<br />
Elements<br />
Affecting How<br />
Many Passengers<br />
Can Be Carried<br />
in a Vehicle<br />
(Passenger<br />
Capacity <strong>of</strong><br />
Vehicles)<br />
Maximum Capacity<br />
Elements Affecting How Many<br />
Vehicles the BRT System Can<br />
Process (Vehicle Capacity <strong>of</strong><br />
BRT Facilities)<br />
Affect the Size<br />
<strong>of</strong> Vehicles<br />
That Can Be<br />
Accommodated<br />
Affect How<br />
Quickly<br />
Vehicles Pass<br />
Through the<br />
System<br />
Running Ways x x<br />
Stations x x<br />
Operated<br />
Capacity—<br />
Elements<br />
Affecting<br />
What Capacity<br />
is Actually<br />
Operated<br />
Vehicles x x x<br />
Fare Collection x<br />
ITS x<br />
Service and<br />
Operations<br />
Plan<br />
x
Running Ways—Running Way Type<br />
Increasing the level <strong>of</strong> segregation <strong>of</strong> the running way through use <strong>of</strong> designated lanes, atgrade<br />
exclusive lanes, and grade-separated exclusive lanes reduces the number <strong>of</strong> non-BRT<br />
or non-transit vehicles that can use the facility and also reduces the conflicts with parallel and<br />
crossing traffic. This increases the number and frequency <strong>of</strong> transit vehicles that each lane can<br />
accommodate. In many cases, BRT systems combine multiple types <strong>of</strong> running ways. In these<br />
cases, the running way capacity is limited by the running way section that can accommodate<br />
the lowest volume <strong>of</strong> vehicles. Effectively, the person capacity <strong>of</strong> a running way is limited by its<br />
least exclusive section.<br />
Stations—Station Type<br />
Factors that can influence the service time <strong>of</strong> a station (time between when a BRT vehicle enters<br />
and exits the station) include:<br />
• adequate capacity for bus bays/berths/loading areas<br />
• real-time passenger information to reduce passenger/operator interaction time (ITS)<br />
• <strong>of</strong>f-board fare collection<br />
• station capacity and layout/design to allow multi-door boarding<br />
Stations—Curb Design<br />
Raised curbs and level platforms increase capacity by facilitating the boarding and alighting<br />
process for all passengers, and are especially beneficial to the elderly, youth, and passengers with<br />
disabilities.<br />
Stations—Platform Layout<br />
Extended platforms accommodate more vehicles, thereby increasing the number <strong>of</strong> passengers<br />
that can load simultaneously<br />
Stations—Passing Capability<br />
Stations with extra-wide running way to allow for vehicles to pass stopped, delayed, or disabled<br />
vehicles can eliminate bottlenecks in the BRT system.<br />
Vehicles—Vehicle Configuration<br />
Longer buses, such as articulated vehicles, have higher person capacity by as much as 50 percent<br />
over standard 40-ft buses through a combination <strong>of</strong> seated and standing passengers. The<br />
doors, floors and capacity <strong>of</strong> typical length buses are illustrated in Exhibit 3-23.<br />
ITS—<strong>Transit</strong> Vehicle Prioritization<br />
Vehicle prioritization technologies—including signal timing/phasing, transit signal priority,<br />
station and lane access control—reduce conflicts with other traffic and potential delays to<br />
BRT vehicles along the running way and at station entrances and exits. Intermittent access control<br />
<strong>of</strong> bus lanes, such as those demonstrated in Portugal, <strong>of</strong>fer the opportunity to share ROW<br />
with other vehicles, while preserving the capacity necessary for BRT operations.<br />
BRT Elements and System Performance<br />
ITS—Intelligent Vehicle Systems<br />
Driver assist and automation strategies increase the potential frequency <strong>of</strong> transit service and<br />
reduce the overall time per stop. Collision avoidance and lane assist allow vehicles to safely<br />
operate closer together and also allow BRT vehicles to re-enter the flow <strong>of</strong> traffic more quickly<br />
and safely. Precision docking will allow a BRT vehicle to precisely and consistently stop in the<br />
same location each time, speeding up the approach and departure <strong>of</strong> a vehicle from a station<br />
and reducing overall dwell time since passengers will know exactly where to line up to board.<br />
ITS—Operations Management Systems<br />
Automated scheduling and dispatch systems allow a higher frequency <strong>of</strong> BRT vehicles and<br />
facilitate response to incidents that create bottlenecks. Vehicle tracking reduces the failure rate<br />
<strong>of</strong> BRT vehicles arriving at the BRT Station.<br />
Service and Operations Plan—Service Frequency<br />
Service frequency is one <strong>of</strong> the key determinants <strong>of</strong> operated capacity. Increasing frequency<br />
provides more passenger spaces in the same amount <strong>of</strong> time. Note, however, that it does not<br />
change the maximum passenger capacity <strong>of</strong> the system.<br />
Service and Operations Plan—Operating Procedures<br />
Other elements <strong>of</strong> service and operations plans can affect the way that capacity is deployed to<br />
match passenger demand. Some elements that affect capacity are:<br />
• mandated minimum and maximum operating speeds—e.g., slowing at intersections on<br />
busways, station approach speeds<br />
• policies on standees (passenger loading standards)<br />
• yield to buses when leaving stations<br />
• policies related to loading disabled passengers and bicycles<br />
• enforcement <strong>of</strong> policies prohibiting non-BRT vehicles from the running way<br />
•<br />
other transit service and capacity in the same corridor (especially during the peak period)<br />
3-151
BRT Elements and System Performance<br />
Exhibit 3-23: Typical U.S. and Canadian BRT Vehicle Dimensions<br />
and Capacities<br />
Length (ft) Width (ft)<br />
40 (12.2 m)<br />
45 (13.8 m)<br />
60 (18 m)<br />
80 (24 m)<br />
3-152<br />
96-102<br />
(2.45-2.6m)<br />
96-102<br />
(2.45-2.6m)<br />
98-102<br />
(2.5-2.6m)<br />
98-102<br />
(2.5-2.6m)<br />
# Door<br />
Channels<br />
# Seats<br />
(incl. seats in<br />
wheel chair tiedown<br />
areas)<br />
Maximum Capacity*<br />
(seated plus standing)<br />
2-5 35-44 50-60<br />
2-5 35-52 60-70<br />
4-7 31-65 80-90<br />
7-9 40-70 110-130<br />
Capacity includes seated riders plus standees computed at a density <strong>of</strong> 3 standing<br />
persons per square meter.<br />
performance <strong>of</strong> Existing systems<br />
Research Summary<br />
The capacity <strong>of</strong> BRT running ways on arterials can vary greatly based on the<br />
design and operation <strong>of</strong> running ways. A survey <strong>of</strong> running ways presented in Exhibit<br />
3-24 <strong>of</strong> transitways around the world shows that the frequency <strong>of</strong> vehicles<br />
can reach 200 to 300 vehicles per hour. This demonstrates that capacities for BRT<br />
systems can reach levels beyond the capacity needs <strong>of</strong> most developed urban<br />
corridors. Most systems in North America do not reach these levels <strong>of</strong> demand,<br />
and, therefore, do not demonstrate operation near maximum capacity.<br />
Exhibit 3-24: Maximum Observed Peak Hour Bus Flows,<br />
Capacities, and Passenger Flows at Peak Load Points<br />
on <strong>Transit</strong>ways<br />
Type <strong>of</strong><br />
Running Way<br />
Designated Lane<br />
Designated Lanes<br />
with Feeders<br />
Designated Lanes<br />
with Bus Ordering<br />
(Traveling in Clusters)<br />
Designated Lanes<br />
with Overlapping<br />
Routes, Passing at<br />
Stations and<br />
Express Routes<br />
Cities<br />
Applied<br />
Ankara,<br />
Istanbul,<br />
Abidjan<br />
Measured<br />
Peak Hour<br />
Vehicle<br />
Flows<br />
(veh/hr)<br />
Measured<br />
Peak Hour<br />
Passenger Flow<br />
(passengers/hr)<br />
Estimated<br />
Practical Capacity<br />
(passengers/hr)<br />
91 - 197 7,300 - 19,500 5,800 – 18,100<br />
Curitiba 94 9,900 13,900 – 24,100<br />
Porto<br />
Alegre (2<br />
separate<br />
facilities)<br />
Belo<br />
Horizonte,<br />
Sao Paolo<br />
System Performance Pr<strong>of</strong>iles<br />
Martin Luther King Jr. East Busway, Pittsburgh<br />
260 - 304 17,500 - 18,300 8,200-14,700<br />
216 - 221 15,800 -20,300 14,900 – 27,900<br />
Planners at the Port Authority estimate that the Martin Luther King Jr. East Busway<br />
can accommodate 1 vehicle every 24 seconds or a total <strong>of</strong> 150 vehicles per<br />
hour. Assuming the maximum-size vehicle that can be accommodated, an articulated<br />
vehicle with 63 places, the maximum person capacity <strong>of</strong> the facility is<br />
9,450 passengers per hour.<br />
RAPID, Phoenix Public <strong>Transit</strong> <strong>Department</strong><br />
The experience <strong>of</strong> the Phoenix RAPID system demonstrates how the service frequency<br />
defines the operated capacity <strong>of</strong> a BRT system. When the RAPID system<br />
first began operation, it operated a limited number <strong>of</strong> trips oriented toward the<br />
commute market. Furthermore, the Phoenix Public <strong>Transit</strong> <strong>Department</strong> used<br />
buses specially built for the commuter-type service it was operating that indicated<br />
passengers would have a comfortable high-back, reclining seat. Hence, the<br />
Phoenix Public <strong>Transit</strong> <strong>Department</strong>, through its policy <strong>of</strong> limiting standees, reduced<br />
the overall capacity <strong>of</strong> each bus to a specified design capacity.
As the RAPID service continued and external events impacted potential riders<br />
(e.g., rising gas prices, pollution, and urban congestions), demand began to exceed<br />
the pre-determined operated capacity, which resulted in many riders having<br />
to stand for trips during the peak periods. While the RAPID system could<br />
have continued operating with standees, the comfort <strong>of</strong> the passengers (e.g., seat<br />
availability) was a critical element in the design <strong>of</strong> the system. Four additional<br />
trips were added during the peak periods to add seat availability, thus increasing<br />
operated capacity <strong>of</strong> the system.<br />
Curitiba<br />
Curitiba’s BRT system has served as the model for many BRT systems and continues<br />
to be one <strong>of</strong> the world’s highest-performing BRT systems. One exceptional<br />
performance measure is capacity: the 54-km system carries 15,000 riders per<br />
hour at peak times. City planners began designing the BRT system in the late<br />
1960s as part <strong>of</strong> a Master Plan to channel growth around high-capacity transit<br />
corridors. Today, 70 percent <strong>of</strong> commuters use the transit system daily in a city<br />
with a metro area population <strong>of</strong> over 2.7 million. To accommodate this demand,<br />
the BRT system operates on dedicated bus lanes along five corridors radiating<br />
out from the city center. Intersections are equipped with signal priority, and express<br />
service is provided on one-way streets located one block on either side <strong>of</strong><br />
BRT artery routes. Stations have multiple-vehicle platforms with level boarding<br />
and automated doors at the interface between vehicles and stations. Almost<br />
2,000 articulated buses serve the BRT network at headways <strong>of</strong> as little as 90 seconds<br />
(a capacity <strong>of</strong> 40 buses per direction per hour).<br />
Line 1 BRT, Beijing<br />
Beijing’s first BRT line <strong>of</strong>fers an example <strong>of</strong> how to address overcapacity. The<br />
BRT service was designed to alleviate congestion and reduce travel times in the<br />
10-mile corridor. The 10.3-mile route features an 8.1-mile dedicated median busway,<br />
with grade separations at some intersections, and 2.2 miles <strong>of</strong> <strong>of</strong>f-street<br />
mixed lanes. To improve travel times further and <strong>of</strong>fer high capacity, the government<br />
implemented transit signal priority, <strong>of</strong>f-board fare collection, and articulated<br />
vehicles with three double left-side doors. There is also a marketing program<br />
with brochures and signs at stations to help passengers understand the system.<br />
In order to direct passengers to the BRT and rationalize transit operations, three<br />
regular bus routes were eliminated and two were shortened to act as BRT feeders.<br />
In all, the BRT project eliminated 300 standard buses per direction per hour<br />
in the corridor. While this saved the operator money, it also contributed to sig-<br />
BRT Elements and System Performance<br />
nificant overcrowding, with ridership reaching 100,000 per day. To reduce overcrowding,<br />
the operator restored a parallel bus route and added 25 regular buses<br />
during peak hours. Ridership on the BRT dropped to 85,000 per day, with a peak<br />
hour ridership <strong>of</strong> around 7,500 per direction. Twenty new BRT buses were added<br />
in April 2006 to accommodate demand.<br />
BRT Elements by System and Person Capacity<br />
Exhibit 3-25 presents a summary <strong>of</strong> BRT elements that affect capacity for BRT<br />
systems in 36 cities around the world, and available performance measures. The<br />
primary performance measure provided is:<br />
Maximum Critical <strong>Link</strong> Throughput (persons per direction per hour)—this measurement<br />
is based on the maximum number <strong>of</strong> vehicles operated per hour multiplied<br />
by a vehicle’s maximum capacity. (Note: In the case <strong>of</strong> this data table,<br />
the Maximum Critical Throughput figure was provided directly by the transit<br />
agency.)<br />
A comparison <strong>of</strong> the Maximum Critical <strong>Link</strong> Throughput data provided supports<br />
the theory that vehicle capacity, station capacity and running way capacity are<br />
the primary elements impacting total person capacity for a BRT system. The other<br />
element that strongly correlates with maximum throughput is frequency <strong>of</strong><br />
service. Maximum capacity results from a combination <strong>of</strong> these elements, rather<br />
than any one element being the dominant determinant. In general, as systems<br />
add one more element <strong>of</strong> a “higher order,” this is reflected in increased capacity.<br />
The BRT systems with the lowest capacity levels are typically those with on-street<br />
operations, less substantial stations and standard size vehicles, such as Honolulu’s<br />
BRT lines and the AC <strong>Transit</strong> San Pablo Rapid; these systems have maximum<br />
capacities from 200 to 400 passengers per direction per hour (ppdph). Systems<br />
that can accommodate 600 to 850 passengers per direction per hour typically<br />
feature one element <strong>of</strong> a higher order. For example, the Sydney Liverpool-Parramatta<br />
T-Way and North-West T-Way - Blacktown-Parklea (850 ppdph) lines have<br />
<strong>of</strong>f-street busways but still use standard vehicles. By contrast, the Albuquerque<br />
Rapid operates on-street with enhanced shelters but uses articulated vehicles.<br />
The Las Vegas MAX uses articulated vehicles but operates in mixed traffic lanes<br />
for a portion <strong>of</strong> its route and uses relatively low-capacity shelters. Most systems<br />
in this range also <strong>of</strong>fer station passing or multiple-vehicle platform length.<br />
Four systems reported person capacities between 1,000 and 1,260: Eindhoven,<br />
Sydney North-West T-Way Parramatta-Rouse Hill line, and Boston’s Silver Line<br />
Washington Street corridor. Of these, five operate primarily in exclusive bus-<br />
3-153
BRT Elements and System Performance<br />
ways, most located <strong>of</strong>f-street. They also typically have higher capacity stations,<br />
and about half use articulated vehicles. The Ottawa and Sydney systems also allow<br />
passing at stations.<br />
The four systems that reported person capacities between 2,400 and 5,000 are<br />
the BRT systems in Adelaide, Beijing, Guayaquil, and Pereira. All <strong>of</strong> these systems<br />
operate on <strong>of</strong>f-street busways with articulated vehicles. Beijing, Guayaquil, and<br />
Pereira all use level boarding.<br />
The top systems are Kunming’s BRT network, Ottowa Busway (when counting<br />
the 95, 96, and 97 lanes and other routes), Brisbane’s South East Busway, and Bogotá’s<br />
Transmilenio. It should be noted that these are all BRT networks or services<br />
that accommodate multiple lines, so their capacity is much higher than a single<br />
BRT line. All operate <strong>of</strong>f-street with very substantial stations and extremely high<br />
frequencies. Although the South East Busway uses standard vehicles, its stations<br />
can accommodate up to five vehicles, and some services run as frequently as every<br />
16 seconds. This system has a total capacity <strong>of</strong> 15,000. Bogotá’s Transmilenio<br />
is an order <strong>of</strong> magnitude higher than the other systems in this report, with a<br />
maximum capacity <strong>of</strong> 45,000 passengers per hour. As noted earlier, this easily<br />
matches rail system capacities. To achieve this, Bogotá uses <strong>of</strong>f-street busways,<br />
articulated vehicles, spacious stations with passing capability and level boarding,<br />
and very high frequency.<br />
The ITS elements noted in Exhibit 3-25—signal priority, intelligent vehicle systems,<br />
and operating management systems—likely contribute to overall capacity<br />
but do not obviously correlate with the higher capacity systems.<br />
In general, the highest capacity systems can be found in Latin America, Australia,<br />
and China, which typically deploy integrated networks <strong>of</strong> BRT lines designed to<br />
meet either very high existing transit demand or, in the case <strong>of</strong> Brisbane, meet<br />
regional goals for increasing transit mode share. The mid-capacity systems are<br />
typically the European and Canadian systems, while most, but not all, <strong>of</strong> the<br />
lower-capacity systems are in the U.S. In many cases the operated capacity is low<br />
because corridor transit demand is low.<br />
Systems should be designed to meet current and projected capacity needs, so a<br />
low capacity BRT can be a high-performing service, depending on the city’s transit<br />
needs. It would be valuable to assess whether the BRT systems in Exhibit 3-25<br />
are operating at or near maximum capacities to determine whether the person<br />
capacity is appropriate for the city’s current needs and can accommodate future<br />
growth. Unfortunately, the performance data does not reveal this information.<br />
3-154<br />
There are a few examples <strong>of</strong> capacity issues described in the System Performance<br />
Pr<strong>of</strong>iles section.
Exhibit 3-25: BRT Elements by System and Person Capacity<br />
City, State / Province / Country Albuquerque Boston Silver Line<br />
BRT Elements and System Performance<br />
BRT Line / System Rapid Ride Washington St Waterfront SL1 - Airport Waterfront SL2 - BMIP<br />
Running Way (miles)<br />
On Street Mixed Lanes 13.1 0.2 3.5 1.2<br />
On Street Exclusive Bus Lanes 0.7 2.2<br />
Off Street Mixed Lanes 0.0<br />
Off Street Reserved Lanes 0.0<br />
At-Grade <strong>Transit</strong>way 0.0<br />
Grade-Separated <strong>Transit</strong>way - 1.0 1.0<br />
Queue Jumpers<br />
Type Enhanced Shelter<br />
No Shelter, Basic Shelter, Enhanced Shelter &<br />
<strong>Transit</strong> Center<br />
No Shelter, Underground Station &<br />
<strong>Transit</strong> Center<br />
No Shelter, Underground Station<br />
& <strong>Transit</strong> Center<br />
Curb Design Standard Curb Standard Curb Standard Curb Standard Curb<br />
Platform Layout (No. <strong>of</strong> Vehicles<br />
Accommodated)<br />
1 1<br />
1 above ground; multiple w/<br />
underground stations<br />
1 above ground; multiple w/<br />
underground stations<br />
Passing Capability<br />
Vehicles<br />
- -<br />
Configuration Articulated Stylized Articulated Articulated Articulated<br />
Length<br />
ITS<br />
60 ft<br />
60 ft 60 ft 60 ft<br />
<strong>Transit</strong> Vehicle Prioritization TSP TSP - Green Extension, Red Truncation No No<br />
Intelligent Vehicle Systems None None None none<br />
Automated Scheduling and Dispatch None CAD CAD<br />
Vehicle Component Monitoring<br />
System<br />
Service Plan<br />
AVM<br />
Frequency <strong>of</strong> Service in Peak Hours<br />
(Headway in Minutes)<br />
11 4 10 10<br />
Capacity<br />
Maximum Critical <strong>Link</strong> Throughput<br />
(persons per hour per direction)<br />
600 1,264 318<br />
Operated Maximum Vehicles Per Peak<br />
Hour (BRT Service)<br />
10 9 6<br />
Operated Vehicles Per Peak Hour<br />
(Non-BRT Service)<br />
103 0<br />
Total Ridership by Route SL2 and SL3<br />
Average Weekday Boardings in<br />
Corridor after BRT<br />
12,430 14,102 9,338 7,434<br />
3-155
BRT Elements and System Performance<br />
3-156<br />
Exhibit 3-25: BRT Elements by System and Person Capacity (cont’d.)<br />
City, State / Province / Country Chicago* Cleveland Eugene<br />
BRT Line / System Western Avenue Express Irving Park Express Garfield Express HealthLine EmX<br />
Running Way (miles)<br />
On Street Mixed Lanes 18.3 9.0 9.4 2.7 1.4<br />
On Street Exclusive Bus Lanes<br />
Off Street Mixed Lanes<br />
Off Street Reserved Lanes<br />
At-Grade <strong>Transit</strong>way<br />
Grade-Separated <strong>Transit</strong>way<br />
4.4 2.6<br />
Queue Jumpers<br />
Station<br />
Queue jump<br />
Type No Shelter No Shelter No Shelter Enhanced Shelter Enhanced Shelter, Station Building<br />
Curb Design Standard Curb Standard Curb Standard Curb Near Level Raised platform<br />
Platform Layout (No. <strong>of</strong> Vehicles<br />
Accommodated)<br />
1 1 1 1 40' + 1 60' 1<br />
Passing Capability<br />
Vehicles<br />
No No<br />
Configuration Stylized articulated Stylized articulated<br />
Length<br />
ITS<br />
45-ft 45-ft 45-ft 60 ft 60 ft<br />
<strong>Transit</strong> Vehicle Prioritization TSP TSP<br />
Intelligent Vehicle Systems mechanical guidance Visual guidance<br />
Automated Scheduling and Dispatch<br />
Vehicle Component Monitoring<br />
System<br />
Service Plan<br />
CAD<br />
Frequency <strong>of</strong> Service in Peak Hours<br />
(Headway in Minutes)<br />
9 12 11 5 10<br />
Capacity<br />
Maximum Critical <strong>Link</strong> Throughput<br />
(persons per hour per direction)<br />
Operated Maximum Vehicles Per Peak<br />
Hour (BRT Service)<br />
Operated Vehicles Per Peak Hour<br />
(Non-BRT Service)<br />
Total Ridership by Route<br />
Average Weekday Boardings in<br />
Corridor after BRT<br />
6.5 5 5.5
Exhibit 3-25: BRT Elements by System and Person Capacity (cont’d.)<br />
BRT Elements and System Performance<br />
City, State / Province / Country Honolulu Kansas City Las Vegas<br />
BRT Line / System City Express: A City Express: B Country Express: C MAX - Main St MAX<br />
Running Way (miles)<br />
On Street Mixed Lanes 19.0 8.0 18.0 6.0 3.0<br />
On Street Exclusive Bus Lanes along certain segments, for certain times <strong>of</strong> day 4.5<br />
Off Street Mixed Lanes 3.5 -<br />
Off Street Reserved Lanes 17.5 -<br />
At-Grade <strong>Transit</strong>way -<br />
Grade-Separated <strong>Transit</strong>way -<br />
Queue Jumpers<br />
Station<br />
1 queue jumper<br />
Type Basic Shelter Basic Shelter Basic Shelter Enhanced Shelter Basic and Enhanced Shelter<br />
Curb Design Standard Curb Standard Curb Standard Curb Raised Curb Raised Curb<br />
Platform Layout (No. <strong>of</strong> Vehicles<br />
Accommodated)<br />
1 1 1 1 1<br />
Passing Capability<br />
Vehicles<br />
-<br />
Configuration Articulated Standard Articulated Stylized Standard Stylized Articulated<br />
Length<br />
ITS<br />
60 ft 40 ft 60 ft 40 ft 60 ft<br />
<strong>Transit</strong> Vehicle Prioritization TSP TSP<br />
Intelligent Vehicle Systems Optical Docking (not used)<br />
Automated Scheduling and Dispatch CAD/AVL<br />
Vehicle Component Monitoring<br />
System<br />
Service Plan<br />
X<br />
Frequency <strong>of</strong> Service in Peak Hours<br />
(Headway in Minutes)<br />
15 15 30 9 12<br />
Capacity<br />
Maximum Critical <strong>Link</strong> Throughput<br />
(persons per hour per direction)<br />
Operated Maximum Vehicles Per Peak<br />
Hour (BRT Service)<br />
Operated Vehicles Per Peak Hour<br />
(Non-BRT Service)<br />
Total Ridership by Route<br />
Average Weekday Boardings in<br />
Corridor after BRT<br />
400 260 200 600<br />
8 8 4 6<br />
40,000 33,000 12,000 4,450 10,000 (+38%)<br />
4<br />
3-157
BRT Elements and System Performance<br />
3-158<br />
Exhibit 3-25: BRT Elements by System and Person Capacity (cont’d.)<br />
City, State / Province / Country Los Angeles Miami Oakland<br />
BRT Line / System Orange Line Metro Rapid (All Routes) Busway San Pablo Ave Rapid<br />
Partially updated<br />
Running Way (miles)<br />
On Street Mixed Lanes 1.0 229.5 14.0<br />
On Street Exclusive Bus Lanes - -<br />
Off Street Mixed Lanes 0.0 0.0<br />
Off Street Reserved Lanes 0.0 0.0<br />
At-Grade <strong>Transit</strong>way 13.5 0.0 20.0<br />
Grade-Separated <strong>Transit</strong>way -<br />
Queue Jumpers<br />
Station<br />
Queue Jumpers Queue jumpers<br />
Type Enhanced Shelter No Shelter, Enhanced Shelter, <strong>Transit</strong> Center Enhanced Shelter Basic Shelter<br />
Curb Design 8" Curb Standard Curb Standard Curb Standard Curb<br />
Platform Layout (No. <strong>of</strong> Vehicles<br />
Accommodated)<br />
3 artics 1 2 to 3 1<br />
Passing Capability<br />
Vehicles<br />
Passing Lane provided at each in-line station - Bus Pullouts<br />
Configuration Stylized Articulated Stylized Standard and Articulated Standard, Articulated, Minis Stylized standard<br />
Length<br />
ITS<br />
60 ft 40 / 45 / 60 ft 35 / 40 / 60 ft 40 ft<br />
<strong>Transit</strong> Vehicle Prioritization TSP No TSP<br />
Intelligent Vehicle Systems None None<br />
Automated Scheduling and Dispatch x x CAD Yes<br />
Vehicle Component Monitoring<br />
System<br />
Service Plan<br />
None None Yes<br />
Frequency <strong>of</strong> Service in Peak Hours<br />
(Headway in Minutes)<br />
4 2-10 6 12<br />
Capacity 2004 data<br />
Maximum Critical <strong>Link</strong> Throughput<br />
(persons per hour per direction)<br />
x x 385<br />
Operated Maximum Vehicles Per Peak<br />
Hour (BRT Service)<br />
28 324 4 5<br />
Operated Vehicles Per Peak Hour<br />
(Non-BRT Service)<br />
Total Ridership by Route<br />
1800 1800<br />
Average Weekday Boardings in<br />
Corridor after BRT<br />
62,597 464,600 for all corridors<br />
23000 (179% increase since<br />
pre-busway)<br />
6,000
Exhibit 3-25: BRT Elements by System and Person Capacity (cont’d.)<br />
City, State / Province / Country Orlando* Phoenix<br />
BRT Elements and System Performance<br />
BRT Line / System LYMMO RAPID - I-10 East RAPID - I-10 West RAPID - SR-51 RAPID - I-17<br />
Running Way (miles)<br />
On Street Mixed Lanes 6.5 4.8 12.3 8.0<br />
On Street Exclusive Bus Lanes<br />
Off Street Mixed Lanes<br />
-<br />
Off Street Reserved Lanes - 14.0 8.0 10.3 11.5<br />
At-Grade <strong>Transit</strong>way<br />
Grade-Separated <strong>Transit</strong>way<br />
Queue Jumpers<br />
Station<br />
3.0 - - - -<br />
Type Enhanced Shelter Enhanced Shelter Enhanced Shelter Enhanced Shelter Enhanced Shelter<br />
Curb Design Standard Curb standard curb standard curb standard curb standard curb<br />
Platform Layout (No. <strong>of</strong> Vehicles<br />
Accommodated)<br />
2 1 1 1 1<br />
Passing Capability<br />
Vehicles<br />
- bus pullouts bus pullouts bus pullouts bus pullouts<br />
Configuration Stylized standard<br />
Specialized<br />
composite bus<br />
Specialized composite<br />
bus<br />
Specialized composite<br />
bus<br />
Specialized composite<br />
bus<br />
Length<br />
ITS<br />
40-ft 45-ft 45-ft 45-ft 45-ft<br />
<strong>Transit</strong> Vehicle Prioritization TSP TSP at 1 intersection TSP at 1 intersection TSP at 1 intersection TSP at 1 intersection<br />
Intelligent Vehicle Systems Collision warning, lane assist, precision docking Collision Warning Collision Warning Collision Warning Collision Warning<br />
Automated Scheduling and Dispatch - Yes Yes Yes Yes<br />
Vehicle Component Monitoring System<br />
Service Plan<br />
- - - - -<br />
Frequency <strong>of</strong> Service in Peak Hours<br />
(Headway in Minutes)<br />
5 10 10 10 10<br />
Capacity<br />
Maximum Critical <strong>Link</strong> Throughput<br />
(persons per hour per direction)<br />
Operated Maximum Vehicles Per Peak<br />
Hour (BRT Service)<br />
Operated Vehicles Per Peak Hour (Non-<br />
BRT Service)<br />
Total Ridership by Route<br />
Average Weekday Boardings in Corridor<br />
after BRT<br />
12<br />
Average boardings per trip increased by 33% one year<br />
after opening<br />
63/bus 63/bus 63/bus 63/bus<br />
607; 30% increase 435; 30% increase 533; 30% increase 797; 30% increase<br />
3-159
BRT Elements and System Performance<br />
3-160<br />
Exhibit 3-25: BRT Elements by System and Person Capacity (cont’d.)<br />
City, State / Province / Country Pittsburgh* Sacramento<br />
BRT Line / System East Busway South Busway West Busway EBus - Stockton<br />
Running Way (miles)<br />
On Street Mixed Lanes 8.0<br />
On Street Exclusive Bus Lanes 0.0<br />
Off Street Mixed Lanes 0.4 - 0.4 0.0<br />
Off Street Reserved Lanes - - - 0.0<br />
At-Grade <strong>Transit</strong>way 4.6 0.0<br />
Grade-Separated <strong>Transit</strong>way 8.7 4.3 None<br />
Queue Jumpers<br />
Station<br />
1 queue jumper<br />
Type Enhanced Shelter Enhanced Shelter Enhanced Shelter No Shelter, Basic Shelter, <strong>Transit</strong> Center<br />
Curb Design<br />
Platform Layout (No. <strong>of</strong> Vehicles<br />
Accommodated)<br />
Raised Curb Raised Curb Raised Curb<br />
Passing Capability<br />
Vehicles<br />
passing allowed passing allowed passing allowed None<br />
Configuration Standard & Articulated Standard & Articulated Standard & Articulated<br />
Length<br />
ITS<br />
40 ft and 60 ft 40 ft and 60 ft 40 ft and 60 ft 40 ft<br />
<strong>Transit</strong> Vehicle Prioritization Signal Priority (magnetic loop sensors) TSP - Green Ext<br />
Intelligent Vehicle Systems Collision Warning Collision Warning Collision Warning None<br />
Automated Scheduling and Dispatch - - - None<br />
Vehicle Component Monitoring System<br />
Service Plan<br />
- - - None<br />
Frequency <strong>of</strong> Service in Peak Hours<br />
(Headway in Minutes)<br />
0.58 1.33 15 min<br />
Capacity<br />
Maximum Critical <strong>Link</strong> Throughput<br />
(persons per hour per direction)<br />
Operated Maximum Vehicles Per Peak<br />
Hour (BRT Service)<br />
Operated Vehicles Per Peak Hour (Non-<br />
BRT Service)<br />
Total Ridership by Route<br />
Average Weekday Boardings in Corridor<br />
after BRT<br />
104 45 6<br />
190 buses<br />
30,000 daily riders 13,000 daily riders 8,700 daily riders 1,750
Exhibit 3-25: BRT Elements by System and Person Capacity (cont’d.)<br />
City, State / Province / Country San Jose Halifax Ottawa<br />
BRT Elements and System Performance<br />
BRT Line / System Rapid 522 Metro<strong>Link</strong> 95 96<br />
Running Way (miles)<br />
On Street Mixed Lanes 25.0 12.1 2.1 2.1<br />
On Street Exclusive Bus Lanes 0.0 0.5<br />
Off Street Mixed Lanes 0.0 10.6 3.2 13.1<br />
Off Street Reserved Lanes 0.0 - 8.7 3.8<br />
At-Grade <strong>Transit</strong>way 0.0 - 12.0 8.2<br />
Grade-Separated <strong>Transit</strong>way - -<br />
Queue Jumpers<br />
Station<br />
Queue Jumpers<br />
Type<br />
No Shelter, Basic Shelter and Enhanced<br />
Shelter; <strong>Transit</strong> Center<br />
Basic Shelter, Station<br />
Enclosures<br />
Station Enclosures and Buildings<br />
Station Enclosures and<br />
Buildings<br />
Curb Design Standard Curb Standard Curb Standard Curb Standard Curb<br />
Platform Layout (No. <strong>of</strong> Vehicles Accommodated) 2 2<br />
Passing Capability<br />
Vehicles<br />
- None Bus Pullouts Bus Pullouts<br />
Configuration Stylized Standard and Articulated Stylized Standard Articulated Standard<br />
Length<br />
ITS<br />
40 / 60 ft 40 ft 60 ft 40 ft<br />
<strong>Transit</strong> Vehicle Prioritization TSP - Green Extension, Red Truncation TSP TSP TSP<br />
Intelligent Vehicle Systems None None None None<br />
Automated Scheduling and Dispatch Trapeze None Yes Yes<br />
Vehicle Component Monitoring System<br />
Service Plan<br />
None None Under development Under development<br />
Frequency <strong>of</strong> Service in Peak Hours (Headway in<br />
Minutes)<br />
15 10 3-4 3-6<br />
Capacity<br />
Maximum Critical <strong>Link</strong> Throughput (persons per<br />
hour per direction)<br />
774 (including local route) 67 passengers / hour 2,400 1,020<br />
Operated Maximum Vehicles Per Peak Hour (BRT<br />
Service)<br />
4 x 46 16<br />
Operated Vehicles Per Peak Hour (Non-BRT<br />
Service)<br />
Total Ridership by Route<br />
5 x 832 for system 832 for system<br />
Average Weekday Boardings in Corridor after BRT 21,300 (+ 18%) 7,266 60,358 10,893<br />
3-161
BRT Elements and System Performance<br />
3-162<br />
Exhibit 3-25: BRT Elements by System and Person Capacity (cont’d.)<br />
City, State / Province / Country Ottawa York<br />
BRT Line / System 97 VIVA Blue VIVA Purple<br />
Running Way (miles)<br />
On Street Mixed Lanes<br />
On Street Exclusive Bus Lanes<br />
2.1 20.3 17.1<br />
Off Street Mixed Lanes 5.2<br />
Off Street Reserved Lanes 1.2<br />
At-Grade <strong>Transit</strong>way<br />
Grade-Separated <strong>Transit</strong>way<br />
9.8<br />
Queue Jumpers<br />
Station<br />
Bus-Only Lanes at some intersections Bus-Only Lanes at some intersections<br />
Type Station Enclosures and Buildings Basic and Enhanced Shelter Basic and Enhanced Shelter<br />
Curb Design Standard Curb Standard Curb Standard Curb<br />
Platform Layout (No. <strong>of</strong> Vehicles Accommodated) 1 1<br />
Passing Capability<br />
Vehicles<br />
Bus Pullouts Bus Pullouts Bus Pullouts<br />
Configuration Articulated Articulated Standard<br />
Length<br />
ITS<br />
60 ft 60 40 ft<br />
<strong>Transit</strong> Vehicle Prioritization TSP<br />
Limited to buses that are behind schedule<br />
with a max <strong>of</strong> one bus per intersection per 2.5<br />
minutes in any direction<br />
Limited to buses that are behind schedule with a max<br />
<strong>of</strong> one bus per intersection per 2.5 minutes in any<br />
direction<br />
Intelligent Vehicle Systems None None None<br />
Automated Scheduling and Dispatch Yes Yes Yes<br />
Vehicle Component Monitoring System<br />
Service Plan<br />
Under development<br />
Oil temp, Oil pressure, Engine temp reported to<br />
control centre<br />
Oil temp, Oil pressure, Engine temp reported to<br />
control centre<br />
Frequency <strong>of</strong> Service in Peak Hours (Headway in<br />
Minutes)<br />
12 5 10<br />
Capacity Systemwide Systemwide<br />
Maximum Critical <strong>Link</strong> Throughput (persons per<br />
hour per direction)<br />
1,000<br />
Operated Maximum Vehicles Per Peak Hour (BRT<br />
Service)<br />
19 70 70<br />
Operated Vehicles Per Peak Hour (Non-BRT<br />
Service)<br />
Total Ridership by Route<br />
832 for system 217 (excludes TTC contract lines) 217 (excludes TTC contract lines)<br />
Average Weekday Boardings in Corridor after BRT 26,488 28,000 7,300
Exhibit 3-25: BRT Elements by System and Person Capacity (cont’d.)<br />
BRT Elements and System Performance<br />
City, State / Province / Country Bogota Guayaquil Pereira Amsterdam<br />
BRT Line / System Transmilenio Metrovia Megabus Zuidtangent<br />
Running Way (miles)<br />
On Street Mixed Lanes - - - 1.9<br />
On Street Exclusive Bus Lanes - - - 6.2<br />
Off Street Mixed Lanes - - - 2.5<br />
Off Street Reserved Lanes - - - -<br />
At-Grade <strong>Transit</strong>way<br />
Grade-Separated <strong>Transit</strong>way<br />
52.0 10.0 17.0 14.9<br />
Queue Jumpers<br />
Station<br />
- - - Queue Jumper<br />
Type Station Station Station<br />
Curb Design Level Platform Level Platform Level Platform Level platform<br />
Platform Layout (No. <strong>of</strong> Vehicles Accommodated) 2 to 5 x 1 to 2 -<br />
Passing Capability<br />
Vehicles<br />
Bus Pullouts at many stations.<br />
Some lines more than 2 lanes<br />
No Passing No Passing<br />
Configuration Stylized Articulated<br />
Stylized Standard &<br />
Articulated<br />
Stylized Articulated Articulated<br />
Length<br />
ITS<br />
18 m x 18 m 18m<br />
<strong>Transit</strong> Vehicle Prioritization x x x RTSP<br />
Intelligent Vehicle Systems none None none Only for Docking, Mechanical<br />
Automated Scheduling and Dispatch x x x<br />
Vehicle Component Monitoring System<br />
Service Plan<br />
x x x<br />
Frequency <strong>of</strong> Service in Peak Hours (Headway in<br />
Minutes)<br />
1 - 3 4 - 6 3 - 5 7.5 - 8<br />
Capacity<br />
Maximum Critical <strong>Link</strong> Throughput (persons per<br />
hour per direction)<br />
45,000 5,000 5,000<br />
Operated Maximum Vehicles Per Peak Hour (BRT<br />
Service)<br />
x x x<br />
Operated Vehicles Per Peak Hour (Non-BRT<br />
Service)<br />
Total Ridership by Route<br />
x x x<br />
Average Weekday Boardings in Corridor after BRT 1.26 million >100,000 >100,000 27, 000-28,500<br />
3-163
BRT Elements and System Performance<br />
3-164<br />
Exhibit 3-25: BRT Elements by System and Person Capacity (cont’d.)<br />
City, State / Province / Country Caen Edinburgh Eindhoven Leeds<br />
BRT Line / System Tram on Wheels Fastlink<br />
Phileas - Western<br />
Corridor<br />
Running Way (miles)<br />
On Street Mixed Lanes 1.9 2.2 -<br />
On Street Exclusive Bus Lanes 9.2 2.2 3.8<br />
Off Street Mixed Lanes - - -<br />
Off Street Reserved Lanes - - -<br />
At-Grade <strong>Transit</strong>way<br />
Grade-Separated <strong>Transit</strong>way<br />
Queue Jumpers<br />
Station<br />
0.1 0.9 7.2 2.2<br />
Type<br />
Enhanced Shelters, Stations,<br />
<strong>Transit</strong> Centers<br />
Curb Design<br />
Platform Layout (No. <strong>of</strong> Vehicles Accommodated)<br />
Level platform Level platform Level platform Level platform, Raised Curb<br />
Passing Capability<br />
Vehicles<br />
No Passing in guideway segments<br />
Configuration Bi-Articulated Standard single and double deck Articulated, Bi-Articulated Standard<br />
Length<br />
ITS<br />
24.5m 11.4m( double deck), 12m single deck 18m(11), 24m (1)<br />
<strong>Transit</strong> Vehicle Prioritization Signal Priority- Automatic TSP TSP Signal Priority in downtown areas<br />
Intelligent Vehicle Systems<br />
Mechanical- Central<br />
Guidance Rail<br />
Mechanical<br />
Electromagnetic docking<br />
(not in use)<br />
Mechanical<br />
Automated Scheduling and Dispatch<br />
Vehicle Component Monitoring System<br />
Service Plan<br />
Yes<br />
Frequency <strong>of</strong> Service in Peak Hours (Headway in<br />
Minutes)<br />
3-6 (where routes overlap) 3 8 2-8<br />
Capacity<br />
Maximum Critical <strong>Link</strong> Throughput (persons per<br />
hour per direction)<br />
Operated Maximum Vehicles Per Peak Hour (BRT<br />
Service)<br />
Operated Vehicles Per Peak Hour (Non-BRT<br />
Service)<br />
Total Ridership by Route<br />
Average Weekday Boardings in Corridor after BRT 45,000<br />
Route has second highest passenger<br />
volumes in Lothian Bus network<br />
1,000<br />
28,500<br />
Superbus<br />
50% ridership growth in first 2.5<br />
years
Exhibit 3-25: BRT Elements by System and Person Capacity (cont’d.)<br />
BRT Elements and System Performance<br />
City, State / Province / Country London Rouen Utrecht Adelaide<br />
BRT Line / System Crawley TEOR Busway North East Busway<br />
Running Way (miles)<br />
On Street Mixed Lanes 11.2 8.7 3.5<br />
On Street Exclusive Bus Lanes 3.7 - 2.0<br />
Off Street Mixed Lanes - - -<br />
Off Street Reserved Lanes - - -<br />
At-Grade <strong>Transit</strong>way 0.9 14.9 4.8<br />
Grade-Separated <strong>Transit</strong>way 7.46<br />
Queue Jumpers<br />
Station<br />
-<br />
Type <strong>Transit</strong> Centers<br />
Curb Design Standard Curb Level Platform Level platform Standard Curb<br />
Platform Layout (No. <strong>of</strong> Vehicles Accommodated) Two stations allow 3 buses. One allows 4 buses.<br />
Passing Capability<br />
Vehicles<br />
Passing at Interchanges. Busway is single 'track'<br />
Configuration Standard Articulated Bi-Articulated Standard Articulated = 60 Standard Rigid = 80<br />
Length<br />
ITS<br />
11 17.9m(38), 18m(28) 25m<br />
Merc Rigid 37.1ft/11.3m Merc Artic 57.4ft/17.5m<br />
Scania Rigid 38.7ft/11.8m<br />
<strong>Transit</strong> Vehicle Prioritization<br />
Signal Priority- Automatic and<br />
Manual<br />
Signal Priority- Automatic Passive Priority (No active)<br />
Intelligent Vehicle Systems Mechanical Optical - Mechanical Guide Rollers on Front Axle<br />
Automated Scheduling and Dispatch X<br />
Vehicle Component Monitoring System<br />
Service Plan<br />
X<br />
Frequency <strong>of</strong> Service in Peak Hours (Headway in<br />
Minutes)<br />
10 3 2-4 1.1<br />
Capacity<br />
Maximum Critical <strong>Link</strong> Throughput (persons per<br />
hour per direction)<br />
Operated Maximum Vehicles Per Peak Hour (BRT<br />
Service)<br />
Operated Vehicles Per Peak Hour (Non-BRT<br />
Service)<br />
Total Ridership by Route<br />
Average Weekday Boardings in Corridor after BRT 10,000 32,000<br />
33,500 with partial<br />
operation <strong>of</strong> new line<br />
4,500<br />
130<br />
-<br />
28,000<br />
3-165
BRT Elements and System Performance<br />
3-166<br />
Exhibit 3-25: BRT Elements by System and Person Capacity (cont’d.)<br />
City, State / Province / Country Brisbane Sydney<br />
BRT Line / System South East Busway Inner Northern Busway Liverpool-Parramatta T-Way North-West T-Way - Blacktown-Parklea<br />
Running Way (miles)<br />
On Street Mixed Lanes<br />
On Street Exclusive Bus Lanes<br />
Off Street Mixed Lanes<br />
Off Street Reserved Lanes<br />
6.0 0.3<br />
At-Grade <strong>Transit</strong>way 13.0 4.4<br />
Grade-Separated <strong>Transit</strong>way<br />
Queue Jumpers<br />
Station<br />
10.3 1.7<br />
Type<br />
Stations, <strong>Transit</strong><br />
Centers<br />
Stations, <strong>Transit</strong> Centers<br />
Basic and Enhanced Shelter;<br />
Stations<br />
Stations, <strong>Transit</strong> Centers<br />
Curb Design Standard Curb Standard Curb Standard Curb Standard Curb<br />
Platform Layout (No. <strong>of</strong> Vehicles Accommodated) Standard 4; Max is 5 Standard 4; Max is 5 Standard is 2; Max is 6. Standard is 2; 4 at termini<br />
Passing Capability<br />
Vehicles<br />
Bus Pullouts at<br />
Stations<br />
Bus Pullouts at Stations Bus Pullouts at Stations Bus Pullouts at Stations<br />
Configuration Standard Rigid Standard Rigid Standard Rigid Standard Rigid<br />
Length<br />
ITS<br />
40.8ft/12.45 m 41ft/12.5m 41ft/12.5m<br />
<strong>Transit</strong> Vehicle Prioritization - -<br />
Signal Pre-emption including<br />
green extension and early green<br />
-<br />
Intelligent Vehicle Systems None None None None<br />
Automated Scheduling and Dispatch X X X X<br />
Vehicle Component Monitoring System X X X X<br />
Service Plan<br />
Frequency <strong>of</strong> Service in Peak Hours (Headway in<br />
Minutes)<br />
16 sec headway at<br />
Buranda Station<br />
4.6 10.0 8.6<br />
Capacity<br />
Maximum Critical <strong>Link</strong> Throughput (persons per<br />
hour per direction)<br />
15,000 750 850 650<br />
Operated Maximum Vehicles Per Peak Hour (BRT<br />
Service)<br />
294 13 13/14 7<br />
Operated Vehicles Per Peak Hour (Non-BRT<br />
Service)<br />
Total Ridership by Route<br />
- - 0 -<br />
Average Weekday Boardings in Corridor after BRT 93,000 7,200
Exhibit 3-25: BRT Elements by System and Person Capacity (cont’d.)<br />
BRT Elements and System Performance<br />
City, State / Province / Country Sydney Beijing Hangzhou Kunming<br />
BRT Line / System<br />
North-West T-Way -<br />
Parramatta-Rouse Hill<br />
Line 1 BRT Line B1 Busway network<br />
Running Way (miles)<br />
On Street Mixed Lanes<br />
On Street Exclusive Bus Lanes 1.9 6.2<br />
Off Street Mixed Lanes 2.2<br />
Off Street Reserved Lanes 24.9<br />
At-Grade <strong>Transit</strong>way<br />
Grade-Separated <strong>Transit</strong>way<br />
Queue Jumpers<br />
Station<br />
8.7 8.1<br />
Type<br />
Basic and Enhanced Shelters,<br />
<strong>Transit</strong> Centers<br />
Stations<br />
Curb Design Standard Curb Level Platform Standard Curb Standard Curb<br />
Platform Layout (No. <strong>of</strong> Vehicles Accommodated) Standard is 2; 4 at termini 60 m<br />
Passing Capability<br />
Vehicles<br />
Bus Pullouts at Stations Multiple Lanes Multiple Lanes None<br />
Configuration Standard Rigid Articulated Articulated Standard<br />
Length<br />
ITS<br />
41ft/12.5m 18 m 18 m 9 - 12 m<br />
<strong>Transit</strong> Vehicle Prioritization - TSP TSP<br />
Intelligent Vehicle Systems None None None None<br />
Automated Scheduling and Dispatch X<br />
Vehicle Component Monitoring System<br />
Service Plan<br />
X<br />
Frequency <strong>of</strong> Service in Peak Hours (Headway in<br />
Minutes)<br />
4.0 3 - 4 minutes<br />
Capacity<br />
Maximum Critical <strong>Link</strong> Throughput (persons per<br />
hour per direction)<br />
1,100 4,500 8,000<br />
Operated Maximum Vehicles Per Peak Hour (BRT<br />
Service)<br />
15<br />
Operated Vehicles Per Peak Hour (Non-BRT<br />
Service)<br />
Total Ridership by Route<br />
-<br />
Average Weekday Boardings in Corridor after BRT 2,800 85,000 10,000<br />
3-167
BRT Elements and System Performance<br />
accEssiBiliTy<br />
For transit, the term “accessibility” is <strong>of</strong>ten used to describe general availability<br />
<strong>of</strong> service to all transit users or proximity to points <strong>of</strong> access (stations and stops)<br />
<strong>of</strong> the transit system. This document describes accessibility in a more specific<br />
sense—the ability and ease with which individuals with disabilities can use the<br />
transit system. In addition to other enhancements to the performance <strong>of</strong> BRT<br />
systems, the implementation <strong>of</strong> many BRT elements can significantly improve<br />
the accessibility <strong>of</strong> transit for both the disabled and the general public. This section<br />
provides accessibility factors to consider when planning, implementing, and<br />
operating a BRT system. (Additional resource materials will be available in late<br />
2008 from Easter Seals Project ACTION [ESPA], which is overseeing development<br />
<strong>of</strong> an Accessibility Design Guide for BRT Systems. The design guide will<br />
describe factors to consider and lessons learned by transit agencies that have already<br />
implemented accessible BRT systems. The resource materials will be available<br />
on-line at www.projectaction.org.<br />
description <strong>of</strong> accessibility<br />
In the context <strong>of</strong> transit, the term “accessibility” is used to describe how easily<br />
people with disabilities can use the transit system. Accessibility is measured<br />
both in terms <strong>of</strong> whether programs, facilities, and vehicles meet the regulatory<br />
requirements and guidelines, as well as the extent to which transit systems have<br />
been designed to meet the overall mobility needs <strong>of</strong> all customers, including<br />
people with disabilities and older adults.<br />
There are at least three major ways that transit system elements (including BRT<br />
system elements) can affect accessibility:<br />
Physical accessibility—removing<br />
physical barriers and facilitating physical<br />
entry into stations and vehicles<br />
Accessibility <strong>of</strong> information— making information available to all passengers,<br />
especially those with vision and hearing impairments<br />
Safety—providing<br />
enhanced safety treatments and preventing susceptibility<br />
to hazards through warnings and other design treatments<br />
It is important to remember that to the improved accessibility for individuals<br />
with disabilities also improves accessibility improvements for all passengers.<br />
3-168<br />
With these three types <strong>of</strong> accessibility in mind, there are several ways that accessibility<br />
can be measured. Primarily, it can be measured in terms <strong>of</strong> compliance<br />
with applicable regulations, standards, and design guidance. Other ways <strong>of</strong> measuring<br />
accessibility involve both qualitative ratings and quantitative measures<br />
that suggest the impact <strong>of</strong> improved accessibility.<br />
In the United States, transportation programs, facilities, and vehicles must meet<br />
the regulatory requirements <strong>of</strong> the Americans With Disabilities Act (ADA),<br />
including applicable standards set forth in the ADA Accessibility Guidelines<br />
(ADAAG) as adopted by the U.S. DOT. The ADA regulations and the ADAAG describe<br />
minimum accessibility requirements for meeting programmatic, architectural,<br />
structural, and/or operational conditions intended to allow most people<br />
with disabilities to use facilities and services. Compliance with these regulations<br />
and guidelines, however, does not fully describe the level <strong>of</strong> accessibility provided.<br />
Higher levels <strong>of</strong> accessibility can be achieved with the implementation <strong>of</strong><br />
certain design treatments and BRT elements. In some cases, transit systems are<br />
now adopting the notion <strong>of</strong> “universal design,” which embraces the concept <strong>of</strong> a<br />
“barrier-free” environment to provide a more accessible and usable system for all<br />
passengers including people with disabilities, older adults, children, and people<br />
with luggage or baby strollers, as well as the general public.<br />
Other measures <strong>of</strong> accessibility capture its complex nature, as compared to<br />
other more tangible BRT system performance measures such as travel time and<br />
capacity. Measuring accessibility may include qualitative ratings <strong>of</strong> the level <strong>of</strong><br />
accessibility. The level <strong>of</strong> accessibility may also be eventually measured quantitatively<br />
by the level <strong>of</strong> response and use by people with disabilities, as well as the<br />
availability <strong>of</strong> accessible elements such as level boarding and streamlined securement<br />
systems. Other complex quantitative measures may indicate the level <strong>of</strong><br />
opportunities and destinations able to be reached through a particular transit<br />
system. This measure, however, is most useful for local comparisons. As it is difficult<br />
to measure across an entire system, it would be difficult to develop a rating<br />
that can be compared among systems.<br />
In summary, the following can be used as indicators for accessibility in a BRT<br />
system:<br />
Compliance with regulations and requirements (ADA and ADAAG accessibility<br />
requirements in the United States)<br />
Qualitative ratings <strong>of</strong> ease <strong>of</strong> system use by people with disabilities, older<br />
adults, children, adults with strollers, and adults with luggage
BRT ridership trends (e.g., rates <strong>of</strong> use) for people with disabilities and older<br />
adults<br />
Opportunity to reach jobs, services, housing, recreation, shopping, and<br />
entertainment within a reasonable time frame and without being impeded<br />
by physical barriers when using the BRT system<br />
The Effects <strong>of</strong> BRT Elements on<br />
access to and use <strong>of</strong> the BRT system<br />
The following BRT elements are directly related to accessibility and use <strong>of</strong> the<br />
system and should be considered when developing and implementing service.<br />
Running Way—Running Way Type<br />
On-street running way types, whether exclusive or non-exclusive, are generally closer to land<br />
uses and require less walking and access time, and have fewer physical barriers.<br />
Running Way—Running Way Guidance<br />
All guidance systems can reduce the horizontal gap between vehicles and stations, facilitating<br />
boarding for all passengers, but especially for passengers who use wheelchairs or other mobility<br />
aids.<br />
Stations—Station Location<br />
On-street station locations, especially those where station platforms are adjacent to street curbs,<br />
tend to have easier access.<br />
Stations—Basic Station Type<br />
More complex station types—station enclosures, station buildings, and intermodal terminals<br />
or transit centers—tend to require additional design attention to ensure barrier-free access and<br />
ease <strong>of</strong> entry and transfers.<br />
Stations—Passenger Amenities<br />
Passenger information amenities such as maps and real-time information can incorporate accommodations<br />
for people with vision impairments (public address systems and audio information<br />
kiosks and vending machines) and people with hearing impairments (real-time variable<br />
message signs).<br />
Stations Curb Design<br />
BRT Elements and System Performance<br />
Curb designs that minimize the vertical gap between station platform and vehicle floors—raised<br />
curb, level curb, and sloped curb—facilitate boarding for all groups. Level boarding treatments<br />
allow for people using wheelchairs to board without the need to deploy ramps, which could<br />
delay service.<br />
Use <strong>of</strong> detectable warning strips at boarding and alighting demarcations is an effective limit setting<br />
measure and provides delineators <strong>of</strong> the station areas.<br />
Stations—Platform Layout<br />
Platform layouts with assigned and well signed berths create a system that it is easier to understand<br />
and navigate.<br />
Stations—Station Access<br />
Integration to the surrounding infrastructure with attention to accessible pedestrian linkages<br />
allow for barrier-free access to/from the station and between transit elements and modes.<br />
Vehicles—Vehicle Configuration<br />
While partial low-floor vehicle configurations comply with minimum access standards for passengers<br />
with disabilities, specialized BRT vehicles with low floors throughout the interior allow<br />
easier access for all passengers.<br />
Vehicles—Passenger Circulation Enhancement<br />
Improved passenger circulation, through alternative seat layout, additional door channels, and<br />
the ability to maneuver, facilitate boarding for people with disabilities.<br />
Enhanced wheelchair securement systems provide a safer, more accessible environment while<br />
minimizing boarding delays.<br />
Vehicles—Propulsion System<br />
Propulsion systems that provide a gentler ride, such as those involving hybrid-electric or electric<br />
propulsion systems, increase customer’s on-board safety and comfort.<br />
Fare Collection—Fare Collection Process<br />
Off-board fare collection systems tend to facilitate boarding for all passengers.<br />
Fare Collection—Fare Media/Payment Options<br />
Contactless fare payment media and options (e.g., smart cards, commercial debit/credit cards,<br />
and mobile phones) are easier to use and access for all groups.<br />
ITS—Intelligent Vehicle Systems<br />
Precision docking, one <strong>of</strong> the Intelligent Vehicle Systems, improves the interface between vehicle<br />
and station, by eliminating the horizontal gap and ensuring boarding and alighting without<br />
physical barriers.<br />
3-169
BRT Elements and System Performance<br />
ITS—Service Planning and Operations Management<br />
Automated Vehicle Location systems enable the implementation <strong>of</strong> Automated Voice Annunciation<br />
(AVA) systems.<br />
ITS—Passenger Information<br />
Real-time passenger information tools, wherever implemented (pre-trip, en-route, in stations<br />
and terminals, and in-vehicle) must all be designed to be used and understood by all passengers.<br />
These are critical tools to convey the details for users <strong>of</strong> the BRT.<br />
Service and Operations Plan—Route Structure<br />
A simple route structure is easier to understand for everyone, removing a barrier to use due to<br />
lack <strong>of</strong> understanding <strong>of</strong> its operation.<br />
Integrated or network structures may reduce the number <strong>of</strong> required transfers.<br />
performance <strong>of</strong> Existing systems<br />
Analysis <strong>of</strong> experience with BRT elements and accessibility is limited. There are<br />
research studies <strong>of</strong> specific elements and <strong>of</strong> specific cases.<br />
Research summary<br />
Accessible vehicles and transit facility design are both required by the ADA<br />
and are important elements for ensuring that all passengers have access to the<br />
BRT system by minimizing physical and information barriers. According to the<br />
American Public Transportation Association (APTA) 2008 Public Transportation<br />
Fact Book, as <strong>of</strong> 2006, approximately 95 percent <strong>of</strong> fixed route bus and trolley<br />
bus vehicles were accessible (typically either via ramp or lift), and 80 percent <strong>of</strong><br />
Light Rail <strong>Transit</strong> (LRT) vehicles were accessible (typically via infrastructure elements<br />
such as level boarding or wayside lifts). Additionally, more than 85 percent<br />
<strong>of</strong> commuter rail and 99 percent <strong>of</strong> heavy rail vehicles were accessible in 2006.<br />
What is not quantified is the level <strong>of</strong> infrastructure accessibility that has been<br />
achieved with respect to facilities and environmental infrastructure.<br />
To date, there have been few studies documenting whether and how BRT system<br />
elements have improved accessibility specifically for people with disabilities.<br />
Currently, studies and regulatory requirements are the best sources <strong>of</strong> information<br />
for this topic.<br />
An Accessibility Design Guide for BRT Systems is under development through<br />
Easter Seals Project ACTION and is planned for publication in late 2008. It will<br />
3-170<br />
be available on-line through ESPA at www.projectaction.org. This guide will identify<br />
accessibility issues common to BRT systems, effective and ineffective ways<br />
<strong>of</strong> addressing those issues, and examples <strong>of</strong> how the issue was addressed in BRT<br />
systems. (“Bus Rapid <strong>Transit</strong> and Accessibility in the U.S.” [September 2005]<br />
presents a bibliography <strong>of</strong> resources related to BRT and accessibility and is available<br />
online at http:\\projectaction.easterseals.com/site/DocServer/BRT_QandA.<br />
pdf?docID=15943.<br />
Research exploring accessibility issues has so far addressed three major issues:<br />
low-floor vehicles and level boarding<br />
wheelchair securement<br />
information for persons with vision impairments<br />
Low Floor Vehicles and Level Boarding<br />
Research about low floor vehicles (initially focused on light rail) suggests their<br />
value for accessibility. Low floor vehicles <strong>of</strong>fer:<br />
accessible and comfortable transportation for all passengers, especially<br />
persons using wheelchairs or other mobility devices<br />
easier access for elderly who previously had difficulty boarding conventional<br />
transit<br />
reduced station dwell times (Booz Allen & Hamilton 1995)<br />
Since 1991, low-floor buses have gained increased usage among transit agencies.<br />
The enactment <strong>of</strong> the ADA has been a major force in the growing interest <strong>of</strong><br />
low-floor buses, though transit agencies say that the primary reason for choosing<br />
low-floor buses is to provide accessibility for all customers, regardless <strong>of</strong> ability.<br />
Several transit agencies surveyed reported that their customers liked the ease <strong>of</strong><br />
boarding and alighting on a low-floor bus. Customer satisfaction and acceptance<br />
surveys conducted by numerous transit agencies reported that, in general, the<br />
acceptance <strong>of</strong> low-floor buses was positive. Chicago <strong>Transit</strong> Authority customers<br />
reported that low-floor buses were preferred over high-floor buses in all issues<br />
<strong>of</strong> service quality. A total <strong>of</strong> 91 percent <strong>of</strong> Metropolitan Atlanta Rapid <strong>Transit</strong><br />
Authority (MARTA) customers gave low-floor buses a good or excellent overall<br />
rating (King 1998).<br />
With BRT, the concept <strong>of</strong> level boarding through a better interface between the<br />
vehicle and the station platform has gained greater focus. Level boarding en-
ables a faster passenger flow, both on and <strong>of</strong>f vehicles, leading to minimization<br />
<strong>of</strong> dwell times and a decrease in total journey time. With increased throughput,<br />
productivity increases, allowing fewer vehicles to serve the same or improved<br />
routes. (Various technologies and strategies to achieve level boarding, as well<br />
as the operational issues, legal implications, and technology advancements surrounding<br />
level boarding are presented in Kantor et al.)<br />
Wheelchair Securement<br />
Alternative wheelchair securement, especially rear-facing wheelchair securement,<br />
has been shown to <strong>of</strong>fer faster boarding and alighting and reduced dwell<br />
times at stops. Furthermore, experience suggests acceptance by persons using<br />
wheelchairs <strong>of</strong> rear-facing securement. In Europe, rear-facing systems have existed<br />
for more than a decade, and those consumers who have used them say they<br />
appreciate being able to use public transit buses independently, without much<br />
assistance. On BC <strong>Transit</strong> buses in Vancouver, Canada, where both forward- and<br />
rear-facing options are available, operators report that the rear-facing positions<br />
are <strong>of</strong>ten occupied first, suggesting a user preference (Rutenberg et al. 2003).<br />
Recent testing <strong>of</strong> specific rear-facing securement devices suggests the promise<br />
for both operations and better accessibility. A study sponsored by the Transportation<br />
Development Centre <strong>of</strong> Montreal tested a configuration <strong>of</strong> an open area<br />
along the side <strong>of</strong> the bus wall, with a load bearing headrest and backrest and an<br />
aisle facing support. Because there are no belts or hooks used, the rear-facing design<br />
concept provides a significant level <strong>of</strong> independence to all riders. Additionally,<br />
the design can accommodate mobility devices <strong>of</strong> almost any size or weight.<br />
Advantages <strong>of</strong> this application <strong>of</strong> rear-facing position include:<br />
For the wheelchair passenger:<br />
the independent use <strong>of</strong> public transit low-floor buses in a dignified way<br />
no damage to wheelchairs and scooters by attaching belts and hooks<br />
no physical, undignified contact with drivers<br />
no dirty or soiled belts in contact with clothes<br />
For the transit operator:<br />
reduction <strong>of</strong> dwell time from three minutes to about one minute per passenger<br />
BRT Elements and System Performance<br />
no driver involvement, which speed up operation and eliminates injuries<br />
and driver’s downtime<br />
no maintenance and replacement costs for belts<br />
no hazards for other passengers from loose belts<br />
Results <strong>of</strong> the extensive testing indicated that the rear-facing design was safe for<br />
passengers using wheelchairs and scooters, even under severe driving conditions,<br />
provided that the breaks <strong>of</strong> the wheelchairs or scooters were applied and that an<br />
anti-tipping system was in place (Rutenberg and Hemily 2007).<br />
Information for Persons with Vision Impairments<br />
Some information technologies (not specific to BRT) can assist with accessibility<br />
for persons with vision impairments. In the United States, between 6.6 and<br />
9.7 million persons cannot read printed signs at a normal viewing distance. A<br />
demonstration project in San Francisco tested effectiveness <strong>of</strong> Talking Signs as a<br />
wayfinding technique for persons with vision impairments. With the technology,<br />
remote infrared signage directly orients vision-impaired persons to their goal location<br />
and provides constant updates as to their progress to that location by<br />
repeating a directionally-selective voice message that originates at the sign and<br />
is transmitted by infrared light to a hand-held device. The intensity and clarity <strong>of</strong><br />
the message increases as the location is approached.<br />
After four months <strong>of</strong> unsupervised use <strong>of</strong> the Talking Signs system in San Francisco,<br />
subjects participated in focus groups to provide feedback and evaluate the<br />
program. Participants reported increased independence and confidence and decreased<br />
stress when Talking Sign technology was available. Researchers reported<br />
that one participant remarked that “in Powell station he was ‘truly equal’ to<br />
sighted passengers” (Crandall et al. 2003).<br />
System Performance Pr<strong>of</strong>iles<br />
Metropolitan Area Express (MAX), Las Vegas<br />
In Las Vegas, the Regional Transportation Commission <strong>of</strong> Southern Nevada<br />
(RTC) has seen its MAX BRT line reduce travel times by nearly half when compared<br />
to conventional fixed-route bus service operating in the same corridor.<br />
MAX has several features that enhance accessibility. MAX operates mostly in its<br />
own dedicated bus lane adjacent to regular traffic without a grade separation.<br />
Stations are designed for level boarding augmented by flip-out ramps, if needed<br />
to bridge the gap. Fare payment is made via ticket vending machines located on<br />
3-171
BRT Elements and System Performance<br />
each platform, allowing the passengers to use all four doors to board and alight.<br />
Dedicated bicycle racks that do not share space with the wheelchair securement<br />
area permits easy on/<strong>of</strong>f maneuvering for bicyclists as well as people using<br />
wheelchairs. Additional straps located in the securement areas also facilitate<br />
wheelchair securement for wheelchairs and scooters. RTC also is working closely<br />
with vehicle manufacturers to enhance passenger flow and to develop safe and<br />
comfortable rear facing wheelchair securements that are designed to minimize<br />
securement time. In addition, RTC has undertaken additional driver training to<br />
ensure that all drivers are current on wheelchair securement and has noted that<br />
some drivers are able to secure a wheelchair in about 90 seconds.<br />
BRT Elements by system and accessibility<br />
Several BRT systems explicitly planned for accessibility from the beginning. One<br />
example is the RTC in Las Vegas; another is Lane <strong>Transit</strong> District in Eugene, Oregon.<br />
Planners <strong>of</strong> both systems worked extensively with the community to plan<br />
and implement systems that would be accessible for everyone.<br />
All BRT systems are required to be accessible for people with disabilities. For most<br />
systems, this effort includes low-flow buses and flip out or retractable ramps to<br />
facilitate wheelchair boarding. This section outlines the implementation <strong>of</strong> BRT<br />
elements that affect accessibility by system.<br />
Exhibit 3-26 summarizes the use <strong>of</strong> features directly related to accessibility and<br />
use <strong>of</strong> the system in 36 cities around the world. These BRT systems reflect the<br />
growing use <strong>of</strong> low-floor buses throughout transit operations, not just in BRT<br />
service. Almost all <strong>of</strong> the systems listed report using low-floor buses. The few in<br />
the U.S. that do not exclusively use low-floor BRT vehicles are those that operate<br />
standard fleet buses on their BRT routes instead <strong>of</strong> a dedicated BRT fleet. Since<br />
it is common for a transit agency fleet to include some older, high-floor buses<br />
that have not reached the end <strong>of</strong> their useful life, it is possible for the BRT to be<br />
served by some <strong>of</strong> these vehicles.<br />
All <strong>of</strong> the European systems use low-floor buses, with several using guidance<br />
strategies to achieve fully level boarding. The three Latin American systems also<br />
<strong>of</strong>fer level boarding. In the United States, Canada, and Australia, level boarding<br />
is still not common, and it is even less common for agencies to implement docking<br />
guidance systems. As a result, most BRT systems in the United States rely on<br />
ramps or lifts to facilitate boarding for passengers who use wheelchairs or other<br />
mobility aids. As already noted, the Las Vegas RTC incorporated several strategies<br />
to enhance accessibility for its MAX BRT line, including level boarding, the<br />
3-172<br />
first in the United States to do so. Two recently-implemented U.S. BRT systems<br />
have incorporated level or near-level boarding: the Eugene EmX and the Cleveland<br />
HealthLine. The Los Angeles Orange Line and the Pittsburgh Busway built<br />
raised platforms designed to minimize the step up into the vehicles; the Orange<br />
Line combines this with a low-floor bus fleet.<br />
It is also common for BRT systems in the United States to implement passenger<br />
information systems at stations and on vehicles. This feature is intended to improve<br />
accessibility for all passengers. It is not clear yet whether it is common for<br />
these systems to be used to implement information systems that are designed to<br />
enhance accessibility for persons with vision impairments. Only Boston, Phoenix<br />
and San Jose reported using stop announcements on their BRT vehicles.<br />
There is little real-world data on the extent <strong>of</strong> rear-facing wheelchair securement<br />
in BRT systems. Some preliminary research does suggest that it is preferred by<br />
passengers. However, many <strong>of</strong> the BRT systems in Exhibit 3-26 do report using<br />
belts or tie-down devices, which research has indicated is considered less desirable<br />
by the passengers who use them. Of note, all <strong>of</strong> the Australian BRT systems<br />
indicate that they use rear-facing systems, and Oakland, which uses Europeanstyled<br />
buses, also has a rear-facing system.
Exhibit 3-26: BRT Elements by System and Accessibility<br />
City, State / Province / Country Albuquerque Boston Silver Line<br />
BRT Elements and System Performance<br />
BRT Line / System Rapid Ride Washington St Waterfront SL1 - Airport Waterfront SL2 - BMIP<br />
Running Way (mi)<br />
On-Street Running Ways 13.8 2.4 3.5 1.2<br />
Off-Street Running Ways<br />
Station<br />
0.0 0.0 1.0 1.0<br />
Location On-street On-street On- and <strong>of</strong>f-street On- and <strong>of</strong>f-street<br />
Type Enhanced shelter<br />
No shelter, basic shelter, enhanced<br />
shelter & transit center<br />
No shelter, underground station<br />
& transit center<br />
No shelter, underground<br />
station & transit center<br />
Curb Design Standard curb Standard curb Standard curb Standard curb<br />
Platform Layout (# vehicles accommodated) 1 1<br />
1 above ground; multiple w/<br />
underground stations<br />
1 above ground; multiple w/<br />
underground stations<br />
Access/Park-and-Ride Lots<br />
Vehicles<br />
2 lots Pedestrian focus<br />
90% arrive by public transit;<br />
8% by walking<br />
Configuration Articulated Stylized articulated Articulated Articulated<br />
Floor Height Low Low Low Low<br />
Interior Features Molded plastic with fabric inserts Standard seats in 2+2 configuration Luggage racks for airport line<br />
Wheelchair Loading Low Ramp Ramp<br />
Wheelchair Securement Belts Tie-down Tie-down<br />
Dual-mode diesel & electric,<br />
ULSD<br />
Dual-mode diesel & electric,<br />
ULSD<br />
Propulsion System and Fuel<br />
Fare Collection<br />
Hybrid-electric, ULSD ICE CNG<br />
Fare Collection Process Pay on-board Pay on-board<br />
Barrier at 3 underground stops;<br />
pay on board elsewhere<br />
Barrier at 3 underground<br />
stops; pay on board elsewhere<br />
Fare Media and Payment Options<br />
ITS<br />
Cash & Paper only<br />
Cash / Paper Transfers / Magnetic<br />
Stripe / Smart Cards<br />
cash, paper ticket, smart card cash, paper ticket, smart card<br />
Intelligent Vehicle Systems None None None none<br />
Automatic Vehicle Location (AVL) GPS GPS GPS, dead reckoning in tunnel GPS, dead reckoning in tunnel<br />
LED signs with schedule info at LED signs with schedule info<br />
Passenger Information<br />
At station / on vehicle, LED<br />
Nextbus signs<br />
VMS at stations and in-vehicle<br />
stations; vehicles have public<br />
address and VMS with stop<br />
at stations; vehicles have<br />
public address and VMS with<br />
Service Plan<br />
announcements<br />
stop announcements<br />
Route Structure Overlapping route Replaced existing route<br />
New service & replacing local<br />
service<br />
New service & replacing local<br />
service<br />
3-173
BRT Elements and System Performance<br />
3-174<br />
Exhibit 3-26: BRT Elements by System and Accessibility (cont’d.)<br />
City, State / Province / Country Chicago* Cleveland<br />
BRT Line / System Western Avenue Express Irving Park Express Garfield Express HealthLine<br />
Running Way (mi)<br />
On-Street Running Ways 18.3 9.0 9.4 7.1<br />
Off-Street Running Ways 0.0 0.0 0.0 0.0<br />
Station<br />
Location On-street On-street On On-street<br />
Type No shelter No shelter No shelter Enhanced shelter<br />
Curb Design Standard curb Standard curb Standard curb Near level<br />
Platform Layout (# vehicles accommodated) 1 1 1 1 40' + 1 60'<br />
Access/Park-and-Ride Lots 0 lots 0 lots 0 lots<br />
Vehicles<br />
Configuration Stylized articulated<br />
Floor Height Low Low Low Low<br />
Interior Features Wide aisles and doors<br />
Wheelchair Loading<br />
Wheelchair Securement<br />
Propulsion System and Fuel Hybrid diesel<br />
Fare Collection<br />
Fare Collection Process Pay on-board Pay on-board Pay on-board Off-board, pro<strong>of</strong>-<strong>of</strong>-payment<br />
Fare Media and Payment Options Cash & Paper Cash & Paper Cash & Paper<br />
ITS<br />
Intelligent Vehicle Systems None None None mechanical guidance<br />
Automatic Vehicle Location (AVL) Yes<br />
Passenger Information Real time passenger info<br />
Service Plan<br />
Route Structure Replaced
Exhibit 3-26: BRT Elements by System and Accessibility (cont’d.)<br />
City, State / Province / Country Eugene Honolulu<br />
BRT Elements and System Performance<br />
BRT Line / System EmX City Express: A City Express: B Country Express: C<br />
Running Way (mi)<br />
On-Street Running Ways 4.0 19.0 8.0 18.0<br />
Off-Street Running Ways<br />
Station<br />
0.0 0.0 0.0 21.0<br />
Location On-street On-street On-street On-street<br />
Type<br />
Enhanced shelter, station<br />
building<br />
Basic shelter Basic shelter Basic shelter<br />
Curb Design Raised platform Standard curb Standard curb Standard curb<br />
Platform Layout (# vehicles accommodated) 1 1 1 1<br />
Access/Park-and-Ride Lots<br />
Vehicles<br />
Pedestrian focus; bike lockers<br />
and racks<br />
0 lots 0 lots 0 lots<br />
Configuration Stylized articulated Articulated Standard Articulated<br />
Floor Height Low Low High Low<br />
Interior Features Wide aisles and doors<br />
Wheelchair Loading Low floor, ramp Ramp Lift Ramp<br />
Wheelchair Securement - -<br />
Propulsion System and Fuel<br />
Fare Collection<br />
Hybrid diesel Diesel / Hybrid-Electric Diesel Diesel / Hybrid-Electric<br />
Fare Collection Process None -- to be <strong>of</strong>f board Pay on-board Pay on-board Pay on-board<br />
Fare Media and Payment Options<br />
ITS<br />
N/A Cash & Paper Cash & Paper Cash & Paper<br />
Intelligent Vehicle Systems Visual guidance<br />
Automatic Vehicle Location (AVL) GPS GPS GPS GPS<br />
Passenger Information Vehicle, Web<br />
Traveler Information planned on<br />
vehicles, at several stations<br />
Traveler Information planned<br />
on vehicles, at several stations<br />
Traveler Information planned<br />
on vehicles, at several stations<br />
Service Plan<br />
Route Structure Replaced Overlaps local route Overlaps local route Overlaps local route<br />
3-175
BRT Elements and System Performance<br />
3-176<br />
Exhibit 3-26: BRT Elements by System and Accessibility (cont’d.)<br />
City, State / Province / Country Kansas City Las Vegas Los Angeles<br />
BRT Line / System MAX - Main St MAX Orange Line Metro Rapid (All Routes)<br />
Running Way (mi)<br />
On-Street Running Ways 6.0 7.5 1.0 229.5<br />
Off-Street Running Ways<br />
Station<br />
0.0 0.0 13.5 0.0<br />
Location On-street On- and <strong>of</strong>f-street Off-street On and Off<br />
Type Enhanced shelter Basic and enhanced shelter Enhanced shelter<br />
No shelter, enhanced shelter,<br />
transit center<br />
Curb Design Raised curb Raised curb 8" curb Standard curb<br />
Platform Layout (# vehicles accommodated) 1 1 3 artics<br />
Majority arrive by transit,<br />
1<br />
Access/Park-and-Ride Lots<br />
Vehicles<br />
Pedestrian focus Pedestrian focus<br />
walking or bike. Bike path &<br />
pedestrian walkway. 7 park-andride<br />
lots.<br />
Pedestrian focus<br />
Configuration Stylized standard Stylized articulated Stylized articulated<br />
Stylized standard and<br />
articulated<br />
Floor Height Low Low Low floor (15") Low floor (15")<br />
Interior Features<br />
Modern-looking interior,<br />
increased aisle width, increase<br />
hip-to-knee room, wider doors,<br />
wider windows<br />
Modern auto-like interior, finished<br />
window glazing<br />
USSC Aries cloth seats<br />
Wheelchair Loading Low floor, ramp ramp Ramp (at front door only) Ramp (at front door only)<br />
Wheelchair Securement Telescoping ARM Telescoping ARM<br />
Propulsion System and Fuel<br />
Fare Collection<br />
ULSD Diesel electric hybrid ICE CNG ICE CNG<br />
Fare Collection Process Pay on-board Pro<strong>of</strong>-<strong>of</strong>-payment Pro<strong>of</strong>-<strong>of</strong>-payment Pay on-board<br />
Fare Media and Payment Options<br />
ITS<br />
Cash & Magnetic Stripe Magnetic Stripe<br />
Tickets from TVM and standard<br />
paper passes<br />
Cash and Paper Passes<br />
Intelligent Vehicle Systems Optical docking (not used) None None<br />
Automatic Vehicle Location (AVL) GPS Orbital GPS, loop detectors GPS, loop detectors<br />
Passenger Information<br />
Service Plan<br />
Real-time at all stations, trip<br />
planning<br />
Station, telephone, internet, onvehicle<br />
electronic displays<br />
Route Structure Replaced local service Overlaps local route<br />
Nextbus VMS<br />
New line (parallel to several<br />
local routes, but <strong>of</strong>f-street on<br />
new ROW)<br />
Nextbus VMS at stations,<br />
telephone, internet<br />
Overlaid on local routes
Exhibit 3-26: BRT Elements by System and Accessibility (cont’d.)<br />
BRT Elements and System Performance<br />
City, State / Province / Country Miami Oakland Orlando* Phoenix<br />
BRT Line / System Busway San Pablo Ave Rapid LYMMO RAPID - I-10 East<br />
Running Way (mi)<br />
On-Street Running Ways 0.0 14.0 0.0 6.5<br />
Off-Street Running Ways<br />
Station<br />
20.0 0.0 3.0 14.0<br />
Location Off-street On-street Off-street On-street<br />
Type Enhanced shelter Basic shelter Enhanced shelter Enhanced shelter<br />
Curb Design Standard curb Standard curb Standard curb Standard curb<br />
Platform Layout (# vehicles accommodated) 3-Jan 1 2 1<br />
Access/Park-and-Ride Lots<br />
Vehicles<br />
6 lots; bike path Pedestrian focus Pedestrian focus, 1 lot<br />
Commuter service; 250-500<br />
car lots<br />
Configuration Standard, articulated, minis Stylized standard Stylized standard Specialized composite bus<br />
Floor Height Low Low Low<br />
High-back seating, forward<br />
Interior Features<br />
facing, luggage racks,<br />
overhead lighting, reclining<br />
seats<br />
Wheelchair Loading Lifts Ramps<br />
Wheelchair Securement Rear-Facing Position<br />
Propulsion System and Fuel<br />
Fare Collection<br />
Hybrid, CNG, diesel Ultra-low-sulfur diesel ICE CNG LNG<br />
Fare Collection Process Pay on-board Pay on-board Free Pay on-board<br />
Fare Media and Payment Options<br />
ITS<br />
Cash, paper swipe card Free Cash, magnetic swiping<br />
Intelligent Vehicle Systems<br />
Collision warning, lane assist,<br />
precision docking<br />
Collision warning<br />
Automatic Vehicle Location (AVL) AVL GPS AVL/Wi-Fi Orbital<br />
Passenger Information<br />
Service Plan<br />
Route Structure<br />
Traveler information at stations<br />
and on vehicle<br />
Real-time arrival at stations; traveler<br />
info on vehicle & via PDA<br />
Traveler Information at stations<br />
and on vehicle; web-based<br />
Real-time arrival at stations;<br />
on-vehicle announcements;<br />
PDA and web-based info<br />
3-177
BRT Elements and System Performance<br />
3-178<br />
Exhibit 3-26: BRT Elements by System and Accessibility (cont’d.)<br />
City, State / Province / Country Phoenix Pittsburgh*<br />
BRT Line / System RAPID - I-10 West RAPID - SR-51 RAPID - I-17 East Busway<br />
Running Way (mi)<br />
On-Street Running Ways 4.8 12.3 8.0 0.0<br />
Off-Street Running Ways<br />
Station<br />
8.0 10.3 11.5 9.1<br />
Location On-street On-street On-street Off-street<br />
Type Enhanced shelter Enhanced shelter Enhanced shelter Enhanced shelter<br />
Curb Design Standard curb Standard curb Standard curb Raised curb<br />
Platform Layout (# vehicles accommodated) 1 1 1<br />
Access/Park-and-Ride Lots<br />
Commuter service; 250-500 car<br />
lots<br />
Commuter service; 250-500 car lots<br />
Commuter service; 250-500<br />
car lots<br />
Vehicles<br />
Configuration Specialized composite bus Specialized composite bus Specialized composite bus Standard & articulated<br />
Floor Height Low Low Low<br />
Interior Features<br />
High-back seating, forward<br />
facing, luggage racks, overhead<br />
lighting, reclining seats<br />
High-back seating, forward facing,<br />
luggage racks, overhead lighting,<br />
reclining seats<br />
High-back seating, forward<br />
facing, luggage racks, overhead<br />
lighting, reclining seats<br />
16 lots<br />
Cushioned seats<br />
Wheelchair Loading<br />
Wheelchair Securement<br />
Propulsion System and Fuel<br />
Fare Collection<br />
LNG LNG LNG Standard diesel with 5 CNG<br />
Fare Collection Process Pay on-board Pay on-board Pay on-board Pay on-board<br />
Fare Media and Payment Options<br />
ITS<br />
Cash, magnetic swiping Cash, magnetic swiping Cash, magnetic swiping Cash and paper only<br />
Intelligent Vehicle Systems Collision warning Collision warning Collision warning Collision warning<br />
Automatic Vehicle Location (AVL) Orbital Orbital Orbital<br />
Passenger Information<br />
Real-time arrival at stations;<br />
on-vehicle announcements; PDA<br />
and web-based info.<br />
Real-time arrival at stations; onvehicle<br />
announcements; PDA and<br />
web-based info.<br />
Real-time arrival at stations; onvehicle<br />
announcements; PDA<br />
and web-based info.<br />
Service Plan<br />
Route Structure B
Exhibit 3-26: BRT Elements by System and Accessibility (cont’d.)<br />
BRT Elements and System Performance<br />
City, State / Province / Country Pittsburgh* Sacramento San Jose<br />
BRT Line / System South Busway West Busway EBus - Stockton Rapid 522<br />
Running Way (mi)<br />
On-Street Running Ways 0.0 0.0 8.0 25.0<br />
Off-Street Running Ways<br />
Station<br />
4.3 5.0 0.0 0.0<br />
Location Off-street Off-street On- and <strong>of</strong>f-street On- and <strong>of</strong>f-street<br />
Type Enhanced shelter Enhanced shelter<br />
No shelter, basic shelter, transit<br />
center<br />
No shelter, basic shelter and<br />
enhanced shelter; transit<br />
center<br />
Curb Design Raised curb Raised curb Standard curb<br />
Platform Layout (# vehicles accommodated) 2<br />
3 with 281 spaces. 3 existing<br />
Access/Park-and-Ride Lots<br />
Vehicles<br />
12 lots 10 lots<br />
lots with 1300 spaces at<br />
commuter rail stations<br />
Configuration Standard & articulated Standard & articulated<br />
Stylized standard and<br />
articulated<br />
Floor Height Low Low (15")<br />
Interior Features Cushioned seats Cushioned seats Standard<br />
Typical transit bus - front<br />
facing, upholstered seats<br />
Wheelchair Loading Kneeling, low-floor, ramp Low-floor 15"<br />
Wheelchair Securement Forward facing<br />
Forward-facing 4-point<br />
restraint<br />
Propulsion System and Fuel<br />
Fare Collection<br />
Standard diesel with 5 CNG Standard diesel with 5 CNG ICE CNG ICE LSD<br />
Fare Collection Process Pay on-board Pay on-board Pay on-board Pay on-board<br />
Fare Media and Payment Options<br />
ITS<br />
Cash and paper only Cash and paper only Cash and passes<br />
Cash and paper passes, smart<br />
cards in development<br />
Intelligent Vehicle Systems Collision warning Collision warning None None<br />
Automatic Vehicle Location (AVL) None GPS<br />
Automated next stop<br />
announcements. Real-<br />
Passenger Information<br />
Service Plan<br />
On vehicle<br />
Time info in development.<br />
Automated trip planning<br />
through website<br />
Route Structure Replaced limited service route<br />
Overlaps existing local route,<br />
headway (not schedule) based<br />
3-179
BRT Elements and System Performance<br />
3-180<br />
Exhibit 3-26: BRT Elements by System and Accessibility (cont’d.)<br />
City, State / Province / Country Halifax Ottawa<br />
BRT Line / System Metro<strong>Link</strong> 95 96 97<br />
Running Way (mi)<br />
On-Street Running Ways 12.6 2.1 2.1 2.1<br />
Off-Street Running Ways<br />
Station<br />
10.6 23.8 25.1 16.3<br />
Location On- and <strong>of</strong>f-street On- and <strong>of</strong>f-street On- and <strong>of</strong>f-street On- and <strong>of</strong>f-street<br />
Type Basic shelter, station enclosures Station enclosures and buildings<br />
Station Enclosures and<br />
Buildings<br />
Station Enclosures and<br />
Buildings<br />
Curb Design Standard curb Standard curb Standard curb Standard curb<br />
Platform Layout (# vehicles accommodated) 2<br />
Access/Park-and-Ride Lots<br />
Vehicles<br />
6 lots<br />
Configuration Stylized standard Articulated Standard Articulated<br />
Floor Height Low 14.5 - 16"; 11.5" kneeling 14.5 - 16"; 11.5" kneeling 14.5 - 16"; 11.5" kneeling<br />
Interior Features<br />
Cloth seats, reclining with arm /<br />
foot rests<br />
Cloth seats Cloth seats Cloth seats<br />
Wheelchair Loading<br />
Low-floor buses, kneeling buses,<br />
ramps<br />
Low floor buses, kneeling buses,<br />
ramps<br />
Low floor buses, kneeling buses,<br />
ramps<br />
Low floor buses, kneeling<br />
buses, ramps<br />
Wheelchair Securement Belt Belt Belt Belt<br />
Propulsion System and Fuel<br />
Fare Collection<br />
ICE Biodiesel ICE Low-sulfur diesel ICE Low-sulfur diesel ICE Low-sulfur diesel<br />
Fare Collection Process Pay on-board Pro<strong>of</strong>-<strong>of</strong>-Payment Pro<strong>of</strong>-<strong>of</strong>-Payment Pro<strong>of</strong>-<strong>of</strong>-Payment<br />
Fare Media and Payment Options<br />
ITS<br />
Cash / tickets / passes Cash / tickets / passes Cash / tickets / passes Cash / tickets / passes<br />
Intelligent Vehicle Systems None None None None<br />
Automatic Vehicle Location (AVL) AVL GPS GPS GPS<br />
Passenger Information<br />
Service Plan<br />
Real-time display, trip planning Yes Yes Yes<br />
Route Structure Overlapping route
Exhibit 3-26: BRT Elements by System and Accessibility (cont’d.)<br />
BRT Elements and System Performance<br />
City, State / Province / Country York Bogotá Guayaquil<br />
BRT Line / System VIVA Blue VIVA Purple Transmilenio Metrovia<br />
Running Way (mi)<br />
On-Street Running Ways 20.3 17.1 0.0 0.0<br />
Off-Street Running Ways<br />
Station<br />
0.0 0.0 52.0 10.0<br />
Location On- and <strong>of</strong>f-street On- and <strong>of</strong>f-street Off-street Off-street<br />
Type Basic and enhanced shelter Basic and enhanced shelter Station Station<br />
Curb Design Standard curb Standard curb Level platform Level platform<br />
Platform Layout (# vehicles accommodated) 1 1 2 to 5<br />
Access/Park-and-Ride Lots<br />
Vehicles<br />
No lots No lots<br />
Configuration Articulated Standard Stylized articulated<br />
Stylized standard &<br />
articulated<br />
Floor Height Low Low 0.9 m<br />
Interior Features<br />
Cloth seats in spacious<br />
arrangement and tables for<br />
workspace at some rear seats.<br />
WiFi being deployed. Large<br />
windows. Bright, large in-vehicle<br />
display screens<br />
Low floor buses, kneeling buses,<br />
ramps<br />
Cloth seats in spacious arrangement<br />
and tables for workspace at some<br />
rear seats. WiFi being deployed.<br />
Large windows. Bright, large invehicle<br />
display screens<br />
Low floor buses, kneeling buses,<br />
ramps<br />
Molded plastic seats, front/rear<br />
and side facing<br />
Wheelchair Loading<br />
Level boarding Level boarding<br />
Wheelchair Securement Belt Belt<br />
Propulsion System and Fuel<br />
Fare Collection<br />
ICE Clean diesel ICE Clean diesel<br />
Diesel; CNG pilot project<br />
underway with 3 buses<br />
Fare Collection Process Pro<strong>of</strong>-<strong>of</strong>-Payment Pro<strong>of</strong>-<strong>of</strong>-Payment<br />
Barrier (verify at station<br />
entrances / exits)<br />
Barrier<br />
Fare Media and Payment Options<br />
ITS<br />
Paper tickets or passes Paper tickets or passes Smart cards Cash, smart cards<br />
Intelligent Vehicle Systems None None None None<br />
Automatic Vehicle Location (AVL) AVL-equipped AVL-equipped Loop detectors, station sensors On-board transponders<br />
Passenger Information<br />
Service Plan<br />
VMS at stops and on-board VMS at stops and on-board Nextbus displays at stations Nextbus displays at stations<br />
Route Structure Overlays locals Overlays locals<br />
Replaced existing privatelyoperated<br />
routes<br />
Replaced existing privatelyoperated<br />
routes<br />
3-181
BRT Elements and System Performance<br />
3-182<br />
Exhibit 3-26: BRT Elements by System and Accessibility (cont’d.)<br />
City, State / Province / Country Pereira Amsterdam Caen Edinburgh<br />
BRT Line / System Megabus Zuidtangent Tram on Wheels Fastlink<br />
Running Way (mi)<br />
On-Street Running Ways 0.0 8.1 9.2 4.1<br />
Off-Street Running Ways<br />
Station<br />
17.0 17.4 0.1 0.9<br />
Location Off-street On-street On- and <strong>of</strong>f-street<br />
Type Station<br />
Enhanced shelters, stations,<br />
transit centers<br />
Curb Design Level platform Level platform Level platform Level platform<br />
Platform Layout (# vehicles accommodated) 1 to 2<br />
Access/Park-and-Ride Lots<br />
Vehicles<br />
No lots<br />
Configuration Stylized articulated Articulated Bi-articulated<br />
Standard single and double<br />
deck<br />
Floor Height 0.9 m Low Low Low<br />
Interior Features<br />
Molded plastic seats, front/rear<br />
and side facing<br />
"Bistro" style semi-circle seating<br />
at rear<br />
Wheelchair Loading Level boarding Tilting low floor Kneeling, low floor & ramp<br />
Wheelchair Securement rear facing<br />
Propulsion System and Fuel<br />
Fare Collection<br />
ICE diesel Diesel<br />
Dual Mode- Traction motor onrail/<br />
diesel engine <strong>of</strong>f-rail<br />
Diesel<br />
Fare Collection Process<br />
Barrier (verify at station<br />
entrances)<br />
Pay on-board or pro<strong>of</strong>-<strong>of</strong>-payment<br />
Pay on-board or pro<strong>of</strong>-<strong>of</strong>payment<br />
Pay on-board or pro<strong>of</strong>-<strong>of</strong>payment<br />
Fare Media and Payment Options<br />
ITS<br />
Smart cards Paper (Strippenkart) Smart cards, magnetic tickets<br />
Cash coin (exact change) or<br />
smart card<br />
Intelligent Vehicle Systems None Only for docking, mechanical<br />
Mechanical - central guidance<br />
rail<br />
Mechanical<br />
Automatic Vehicle Location (AVL) On-board transponders GPS<br />
Passenger Information<br />
Service Plan<br />
Nextbus displays at stations<br />
Real-time stop information,<br />
timetabled<br />
Real-time at station/stop,<br />
online-journey planner and<br />
timetable<br />
Two routes overlapping in core<br />
Real-time, at station/stop,<br />
SMS<br />
Route Structure<br />
Replaced existing privatelyoperated<br />
routes<br />
New city orbital BRT link with<br />
intermodal links<br />
area providing high frequency<br />
in downtown and Y pattern<br />
coverage north/south <strong>of</strong><br />
downtown<br />
Single radial route linking<br />
periphery to downtown
Exhibit 3-26: BRT Elements by System and Accessibility (cont’d.)<br />
BRT Elements and System Performance<br />
City, State / Province / Country Eindhoven Leeds London Rouen<br />
BRT Line / System Phileas - Western Corridor Superbus Crawley TEOR<br />
Running Way (mi)<br />
On-Street Running Ways 2.2 3.8 14.9 8.7<br />
Off-Street Running Ways<br />
Station<br />
7.2 2.2 0.9 14.9<br />
Location<br />
Type<br />
On-street On-street<br />
Curb Design<br />
Platform Layout (# vehicles accommodated)<br />
Level platform Level platform, raised curb Standard curb Level platform<br />
Access/Park-and-Ride Lots<br />
Vehicles<br />
1 park-and-ride 1000 parking spaces<br />
Configuration Articulated, bi-articulated Standard Standard Articulated<br />
Floor Height<br />
Interior Features<br />
Low Low Low Low Floor<br />
Wheelchair Loading Level boarding Kneeling, low floor Kneeling, low floor Level boarding<br />
Wheelchair Securement 1 wheelchair capacity<br />
Propulsion System and Fuel<br />
Fare Collection<br />
Hybrid (LPG/Electric) Diesel Diesel Diesel<br />
Fare Collection Process<br />
Pro<strong>of</strong>-<strong>of</strong>-payment, pay on-board<br />
machine, no driver payment<br />
Pay on-board Pay on-board Off-board<br />
Fare Media and Payment Options<br />
ITS<br />
Paper (Strippenkart) Cash and paper only Cash Magnetic stripe<br />
Intelligent Vehicle Systems<br />
Automatic Vehicle Location (AVL)<br />
Electromagnetic docking (not<br />
in use)<br />
Mechanical Mechanical Optical<br />
Passenger Information<br />
Service Plan<br />
Route Structure<br />
Real-time stop information,<br />
timetabled<br />
Two radial routes overlapping in<br />
central area, linking downtown<br />
with periphery and airport<br />
Real-time, at station/stop, SMS Time tabled, at station/stop<br />
Two radial routes linking periphery<br />
to downtown<br />
2 north-south overlapping<br />
routes. <strong>Link</strong>s downtown to<br />
employment areas to north<br />
(Gatwick) and south<br />
Real-time stop information,<br />
timetabled<br />
Three radial routes<br />
overlapping in central area,<br />
linking downtown with<br />
hospital, universities and<br />
peripheral areas<br />
3-183
BRT Elements and System Performance<br />
3-184<br />
Exhibit 3-26: BRT Elements by System and Accessibility (cont’d.)<br />
City, State / Province / Country Utrecht Adelaide Brisbane<br />
BRT Line / System Busway North East Busway South East Busway Inner Northern Busway<br />
Running Way (mi)<br />
On-Street Running Ways 5.5 0.0 0.0 0.0<br />
Off-Street Running Ways<br />
Station<br />
4.8 7.5 10.3 1.7<br />
Location On-street Off-street Off-street Off-street<br />
Type <strong>Transit</strong> centers Stations, transit centers Stations, transit centers<br />
Curb Design Level platform Standard curb Standard curb Standard curb<br />
Platform Layout (# vehicles accommodated)<br />
Two stations allow 3 buses, one<br />
allows 4 buses<br />
Standard 4; max 5 Standard 4; max 5<br />
Access/Park-and-Ride Lots<br />
Vehicles<br />
3 lots; 1,190 spaces 3 lots, 759 spaces None designated<br />
Configuration Bi-articulated<br />
Standard articulated = 60 Standard<br />
rigid = 80<br />
Standard rigid Standard rigid<br />
Floor Height Low Floor Merc - step high, Scania - step low Mainly step low, some step high<br />
Mainly step low, some step<br />
high<br />
Interior Features Luggage racks over wheel hubs<br />
Wheelchair Loading Level boarding Front door ramp Front door ramp<br />
Wheelchair Securement Rear facing no straps Rear facing no straps<br />
Propulsion System and Fuel<br />
Fare Collection<br />
Diesel Diesel<br />
Mix <strong>of</strong> diesel and CNG gas<br />
buses<br />
Mix <strong>of</strong> diesel and CNG gas<br />
buses<br />
Fare Collection Process Pro<strong>of</strong>-<strong>of</strong>-payment, pay on-board<br />
Pay on-board (80% pre pay multirider<br />
ticket)<br />
Pay on-board Pay on-board<br />
Fare Media and Payment Options<br />
ITS<br />
Paper (Strippenkart) Cash & paper magnetic stripe Cash & paper magnetic stripe<br />
Intelligent Vehicle Systems<br />
Mechanical Guide Rollers on Front<br />
Axle<br />
None None<br />
Automatic Vehicle Location (AVL) GPS GPS<br />
Passenger Information<br />
Service Plan<br />
Real-time stop information,<br />
timetabled<br />
City Web Site has Trip Planning Real time info at stations Real time info at stations<br />
Route Structure<br />
Three radial routes linking<br />
downtown to periphery<br />
BRT route network replaced local<br />
routes<br />
BRT network, with BRT lines<br />
overlaid on existing local routes<br />
BRT route network replaced<br />
local routes
Exhibit 3-26: BRT Elements by System and Accessibility (cont’d.)<br />
BRT Elements and System Performance<br />
City, State / Province / Country Sydney Beijing<br />
BRT Line / System Liverpool-Parramatta T-Way<br />
North-West T-Way - Blacktown-<br />
Parklea<br />
North-West T-Way -<br />
Parramatta-Rouse Hill<br />
Line 1 BRT<br />
Running Way (mi)<br />
On-Street Running Ways 6.0 0.3 1.9 0.0<br />
Off-Street Running Ways<br />
Station<br />
13.0 4.4 8.7 10.3<br />
Location On- and <strong>of</strong>f-street On- and <strong>of</strong>f-street On- and <strong>of</strong>f-street Off-street<br />
Type<br />
Basic and enhanced shelters,<br />
stations<br />
Stations, transit centers<br />
Basic and enhanced shelters,<br />
transit centers<br />
Stations<br />
Curb Design Standard curb Standard curb Standard curb Level platform<br />
Platform Layout (# vehicles accommodated) Standard 2; Max 6 Standard 2; 4 at termini Standard 2; 4 at termini<br />
Access/Park-and-Ride Lots<br />
Vehicles<br />
1 designated lot None designated 2 designated lots<br />
Configuration Standard rigid Standard rigid Standard rigid Articulated<br />
Floor Height<br />
Interior Features<br />
Step low Step high Step mix low, step high Low<br />
Wheelchair Loading Front door low floor ramp Mix - a few low floor ramp Low-floor /lLevel platforms<br />
Wheelchair Securement Rear facing no straps Rear facing no straps Rear facing no straps<br />
Propulsion System and Fuel<br />
Fare Collection<br />
Euro 3 diesel Diesel Diesel<br />
Fare Collection Process Pay on-board Pay on-board Pay on-board Pay attendants at station<br />
Fare Media and Payment Options<br />
ITS<br />
Cash & paper magnetic stripe Cash & paper magnetic stripe Cash & paper magnetic stripe Cash, smart cards<br />
Intelligent Vehicle Systems None None None None<br />
Automatic Vehicle Location (AVL) Loop Detectors Yes<br />
Passenger Information Real time info at stations<br />
Service Plan<br />
Route Structure<br />
BRT network, with BRT lines<br />
overlaid on existing local routes<br />
Real Time info at terminus stations<br />
only<br />
BRT network, with BRT lines<br />
overlaid on existing local routes<br />
Real Time info at terminus<br />
stations only<br />
BRT network, with BRT lines<br />
overlaid on existing local routes<br />
Real-time at stations and on<br />
vehicles<br />
BRT network replacing<br />
existing routes in busiest<br />
corridors<br />
3-185
BRT Elements and System Performance<br />
3-186<br />
Exhibit 3-26: BRT Elements by System and Accessibility (cont’d.)<br />
City, State / Province / Country Hangzhou Kunming<br />
BRT Line / System Line B1 Busway network<br />
Running Way (mi)<br />
On-Street Running Ways 6.2 0.0<br />
Off-Street Running Ways 0.0 24.9<br />
Station<br />
Location On-street<br />
Type<br />
Curb Design Standard curb Standard curb<br />
Platform Layout (# vehicles accommodated) 60 m<br />
Access/Park-and-Ride Lots<br />
Vehicles<br />
Configuration Articulated Standard<br />
Floor Height Low High<br />
Interior Features<br />
Wheelchair Loading<br />
Wheelchair Securement<br />
Propulsion System and Fuel Diesel<br />
Fare Collection<br />
Fare Collection Process Pay at station Pay on-board<br />
Fare Media and Payment Options<br />
ITS<br />
Cash, smart cards Cash, IC cards<br />
Intelligent Vehicle Systems None None<br />
Automatic Vehicle Location (AVL) Yes<br />
Passenger Information<br />
Service Plan<br />
Real-time at stations and on<br />
vehicles<br />
Currently being implemented<br />
Route Structure<br />
BRT network replacing existing<br />
routes in busiest corridors<br />
Center-lane BRT network for<br />
existing routes in busiest corridors
BRT sysTem BenefiTs<br />
Chapter 3 related BRT system elements to various attributes <strong>of</strong><br />
performance <strong>of</strong> BRT systems. In addition to affecting how the<br />
BRT system itself performs, BRT system elements also have positive<br />
benefits to the transit rider, on the transit system as a whole, and<br />
the communities in which BRT systems operate. This chapter elaborates<br />
on five key benefits <strong>of</strong> implementing BRT —three system benefits<br />
and two community benefits.<br />
System Benefits<br />
Higher ridership—the<br />
primary mission <strong>of</strong> transit service is to<br />
provide a useful service to passengers; an increase in the number<br />
<strong>of</strong> passengers is a good indicator that the service is attractive and<br />
appropriately designed.<br />
Cost effectiveness—the<br />
effectiveness <strong>of</strong> a given project in<br />
achieving stated goals and objectives per unit investment.<br />
Operating efficiency—suggests<br />
how well BRT system elements<br />
support effective deployment <strong>of</strong> resources in serving transit passengers.<br />
Community Benefits<br />
<strong>Transit</strong>-supportive land development—transit-oriented<br />
development promotes livability and accessibility <strong>of</strong> communities<br />
and the increased value <strong>of</strong> properties and communities surrounding<br />
transit investments.<br />
Environmental quality—an<br />
indicator <strong>of</strong> regional quality <strong>of</strong> life,<br />
supporting the health and well-being <strong>of</strong> the public and the attractiveness<br />
and sustainability <strong>of</strong> the urban and natural environment.<br />
The discussion for each benefit includes five major subsections:<br />
Ch a r aC t e r i s t iC s o f Bu s ra p i d tr a n s i t f o r deCision-Ma k i n g 4-1
BRT System Benefits<br />
4-2<br />
a description <strong>of</strong> the benefit and how it is generated<br />
a description <strong>of</strong> how the benefit is measured<br />
an exploration on how BRT system elements and performance characteristics<br />
support the benefit<br />
a discussion <strong>of</strong> other factors that affect how benefits are realized<br />
a summary <strong>of</strong> experience in demonstrating the benefit for implemented<br />
BRT systems<br />
Other Benefits<br />
Like all successful transit modes, bus rapid transit may also result in other system<br />
benefits. These benefits can be significant and wide-ranging. Such benefits<br />
include:<br />
Increased revenue—Revenue<br />
can be generated from new riders, new<br />
ways <strong>of</strong> collecting fares, or new auxiliary revenue sources (e.g., advertising<br />
opportunities on passenger information).<br />
Reduced congestion—The<br />
ability to attract riders from private automobiles<br />
can help reduce or limit the growth in congestion.<br />
Economic productivity—Improvements<br />
to BRT system design can save<br />
time for existing BRT passengers, improve mobility for new BRT passengers,<br />
and reduce congestion on the road network, saving time for automobile<br />
users and freight carriers.<br />
Quality <strong>of</strong> life—Providing<br />
mobility alternatives and improving transitsupportive<br />
development can improve the quality <strong>of</strong> life <strong>of</strong> a region; transit<br />
also supports community preservation.<br />
Improved economic opportunities—Providing<br />
additional mobility<br />
choices can enhance the pool <strong>of</strong> employment opportunities a regional<br />
population can pursue and reduce costs associated with more expensive<br />
modes; retail establishments and other businesses benefit from increased<br />
sales and labor force availability.<br />
Job creation—<strong>Transit</strong><br />
investment has direct positive impacts on employment<br />
for the construction, planning, and design <strong>of</strong> the facilities.<br />
BRT systems may promote and generate these benefits to the transportation<br />
system and the community similar to other successful transit and transportation<br />
systems. When characterizing and measuring these benefits, communities need<br />
to recognize that the extent <strong>of</strong> these benefits is very specific to the context <strong>of</strong><br />
the corridor and the region in which BRT systems operate. Furthermore, many<br />
other factors contribute to the benefits as well, making the task <strong>of</strong> separating the<br />
extent <strong>of</strong> the impact <strong>of</strong> BRT complex.<br />
HiGHeR RiDeRsHiP<br />
Benefit <strong>of</strong> Higher Ridership<br />
Attracting higher ridership is one <strong>of</strong> the primary goals <strong>of</strong> any rapid transit investment.<br />
The ability to attract riders reaffirms the attractiveness <strong>of</strong> the transit<br />
service and confers many benefits to a region, including reduced congestion, increased<br />
accessibility, and reduced pollution.<br />
Definition <strong>of</strong> Higher Ridership<br />
When considering impacts on ridership, it is important to note that BRT systems<br />
attract three types <strong>of</strong> trips:<br />
existing transit trips that are diverted to the new BRT system from other<br />
transit systems/services<br />
new or “induced” trips that were not made previously by transit or any<br />
other mode<br />
trips that were previously made by another, non-transit mode (drive alone,<br />
carpool, walk or bicycle)<br />
BRT systems have been successful in attracting the three types <strong>of</strong> trips.<br />
Measures <strong>of</strong> Higher Ridership<br />
Several statistics are useful to report when assessing the increase in ridership<br />
from implementing BRT. The various measures reflect several factors. BRT<br />
routes operate in different environments (overlapping existing routes or providing<br />
new ones). Sometimes ridership on BRT routes can be separated; sometimes<br />
it should be considered in the context <strong>of</strong> a corridor that includes several routes<br />
(local and BRT routes). In cases where several BRT routes overlap on a unified<br />
exclusive guideway, it is <strong>of</strong>ten useful to report the ridership <strong>of</strong> all routes associ-
ated with the BRT system. Finally, survey assessments <strong>of</strong> how many riders are<br />
attracted to transit are useful in assessing the extent <strong>of</strong> mode shift.<br />
Measures <strong>of</strong> ridership include the following:<br />
Ridership on new BRT routes—usefully<br />
reported when BRT operates in<br />
a similar corridor, but with such distinct characteristics that BRT ridership is<br />
easily reported separately. Ridership on new BRT routes is <strong>of</strong>ten compared<br />
to ridership on existing routes (before implementation), when previous<br />
measurements are available and/or when previous routes have been<br />
replaced by BRT routes, and ridership on existing routes (after implementation),<br />
when other parallel (<strong>of</strong>ten local-serving) routes continue to operate<br />
after implementation <strong>of</strong> BRT.<br />
Total ridership after BRT implementation—reports<br />
the total ridership<br />
in a corridor (including local and BRT routes) after implementation <strong>of</strong><br />
BRT service. This is also compared to ridership on existing routes to provide<br />
information on market share <strong>of</strong> the BRT service and the extent <strong>of</strong> growth in<br />
ridership due to implementation <strong>of</strong> BRT.<br />
Change in ridership in the corridor —calls out the percentage growth<br />
in ridership in the corridor due to implementation <strong>of</strong> BRT.<br />
Attractiveness to ridership with access to other modes—reports<br />
the results <strong>of</strong> attitudinal surveys. Survey statistics <strong>of</strong>ten report the percentage<br />
<strong>of</strong> passengers after implementation who previously used other modes<br />
<strong>of</strong> transportation (driving, walking, or other modes such as taxis or shuttles)<br />
or who previously did not make the trip.<br />
Effects <strong>of</strong> BRT Elements on Ridership<br />
The ability <strong>of</strong> BRT service to attract higher ridership depends on how much<br />
comparative advantage BRT provides over other transit alternatives with respect<br />
to the key service attributes explored in Chapter 3. The impacts are discussed<br />
below.<br />
Travel Time Savings<br />
Improvement in travel time (through speed improvement, delay reduction, and<br />
increases in service frequency) is the most important determinant <strong>of</strong> attracting<br />
riders to transit. To the extent that BRT reduces travel time along an existing<br />
travel corridor, net ridership may increase as a result <strong>of</strong> four effects:<br />
BRT System Benefits<br />
Improved in-vehicle travel time will attract riders who opt for BRT instead<br />
<strong>of</strong> another mode <strong>of</strong> transportation (drive, bicycle or walk).<br />
Riders <strong>of</strong> other existing transit services may be attracted to the BRT service.<br />
Improved travel time may also induce some new passengers to take a trip.<br />
Improved travel time will save existing passengers time and possibly induce<br />
them to make more trips.<br />
Reliability<br />
Service reliability impacts the occurrence <strong>of</strong> unanticipated wait time or delays in<br />
travel time. Recent experience suggests that ridership response to BRT improvements<br />
is higher than would normally be expected due to travel time savings alone.<br />
Reliability may play as significant a role in attracting riders as travel time savings.<br />
Statistics on the impact <strong>of</strong> reliability on ridership are scarce due to measurement<br />
difficulties, although more data collected through the new generation <strong>of</strong> operations<br />
management tools may help to quantify the magnitude <strong>of</strong> this effect.<br />
Identity and Image<br />
To the extent that the unique attributes <strong>of</strong> BRT services can be packaged in a<br />
well-designed image and identity, BRT deployment can be perceived as an enhanced<br />
transit service that caters to a niche travel market. Differentiating BRT<br />
service from other transit service is also critical to providing information as to<br />
where to access transit (e.g., stations and stops) and routing.<br />
Safety and Security<br />
For specific groups <strong>of</strong> potential transit riders, safety and security considerations<br />
can override travel time savings as a factor in making the decision to take transit.<br />
BRT systems that can assure passengers <strong>of</strong> an experience free <strong>of</strong> hazards,<br />
crimes, and security threats make them feel less vulnerable and more confident<br />
in choosing to start and continue using transit.<br />
Capacity<br />
Capacity has an obvious direct effect on ridership because it determines the<br />
maximum number <strong>of</strong> riders that can be accommodated on a BRT service. Ideally,<br />
a transit agency will scale the BRT service appropriately for projected ridership,<br />
allowing for desired ridership increases. Certain BRT elements—particularly the<br />
running way and the vehicle—may limit the total system capacity. For example,<br />
4-3
BRT System Benefits<br />
a dedicated running way that operates at-grade will have a lower capacity than<br />
a grade-separated running way that can maximize the number and frequency <strong>of</strong><br />
buses in service without being constrained by the need to accommodate other<br />
traffic crossing the busway.<br />
Other Factors Affecting Ridership<br />
Additional BRT system attributes that affect ridership include:<br />
4-4<br />
Population size and characteristics—<strong>Transit</strong><br />
systems that serve a<br />
broader service area and higher densities <strong>of</strong> passengers (i.e., large central<br />
business districts and other major activity centers) are more prone to attract<br />
transit riders (e.g., households without automobiles, children, lowincome<br />
groups); corridors that experience growth due to new development<br />
should experience corresponding growth in ridership.<br />
Attractiveness <strong>of</strong> other modes—When<br />
other modes <strong>of</strong> travel are inexpensive<br />
or convenient (e.g., parking is relative easy and inexpensive, highspeed<br />
or uncongested highways are available), transit’s advantage may not<br />
be significant; this comparison is especially relevant when the price or level<br />
<strong>of</strong> service <strong>of</strong> other modes is changing significantly (e.g., when fuel prices<br />
increase or decrease dramatically or when the frequency <strong>of</strong> other transit<br />
routes is adjusted due to BRT implementation).<br />
<strong>Link</strong>ages to other modes—The<br />
ability to link with other modes <strong>of</strong><br />
transportation (e.g., commuter rail, inter-city rail, or pedestrian and bicycle<br />
modes) may increase the attractiveness <strong>of</strong> transit.<br />
BRT Elements by System and Ridership<br />
Exhibit 4-1 summarizes the BRT elements and performance impacts that may<br />
affect ridership numbers for 36 cities around the world. It also includes ridership<br />
performance information where made available. Ridership measurements<br />
provided are:<br />
average weekday boardings in corridor before BRT<br />
average weekday boardings in corridor after BRT<br />
percentage increase in ridership<br />
percentage <strong>of</strong> ridership coming from private motorized modes<br />
The data confirm the connection between ridership totals and the type <strong>of</strong> running<br />
way, vehicle, station elements deployed, and service frequency. The ridership<br />
figures also confirm that all types <strong>of</strong> BRT systems can attract ridership and<br />
that BRT can accommodate extremely high transit demand. Particularly noteworthy<br />
are the ridership figures for systems based on high-capacity dedicated<br />
ROW networks. Many Latin American BRT systems are designed this way, with<br />
networks <strong>of</strong> multi-lane dedicated busways, high-capacity stations, and very high<br />
frequencies. As a result, these systems have extremely high ridership: the Guayaquil<br />
and Pereira BRT systems have more than 100,000 weekday boardings, while<br />
Bogotá’s Transmilenio reports 1.26 million daily boardings. These systems demonstrate<br />
that BRT can be designed to meet rail-like ridership levels, as does the<br />
Brisbane South East Busway, which reports 93,000 average weekday boardings.<br />
The data also show that while BRTs operating in mixed traffic lanes typically<br />
have lower ridership, some do match or exceed ridership on BRTs in dedicated<br />
ROWs. For example, the 20-mile Blue Line on York’s VIVA BRT, which operates<br />
in mixed traffic, has an average weekday boarding <strong>of</strong> 28,000, the same ridership<br />
as Adelaide’s North East Busway.<br />
The two Chinese BRT systems that reported data revealed widely different ridership:<br />
the Beijing Line 1 BRT has 85,000 weekday boardings, while the BRT line in<br />
Kunming has 10,000. The European BRTs tend to be high ridership systems, with<br />
most reporting average weekday boardings between 27,000 and 45,000. In the<br />
U.S., there is a broader range <strong>of</strong> ridership levels, from 1,750 for the Sacramento<br />
E-Bus to 28,000 on the Los Angeles Orange Line. Most U.S. BRT lines report between<br />
5,000 and 15,000 average weekday boardings, and these systems feature<br />
varying combinations <strong>of</strong> high-capacity elements.<br />
The data reveal a wide range <strong>of</strong> ridership increases among the 17 cities that provided<br />
this data point. About half <strong>of</strong> the BRT routes experienced increases between<br />
5 and 35 percent; four reported increases between 36 and 75 percent;<br />
and six reported increases <strong>of</strong> more than 100 percent. It is difficult to compare<br />
these results, since some systems are reporting ridership numbers after years <strong>of</strong><br />
operation, others only months. Overall, this data set shows no clear correlation<br />
between travel time or reliability and the level <strong>of</strong> ridership increase. For example,<br />
the Boston Silver Line Washington Street corridor experienced a 75 percent increase<br />
while decreasing corridor travel times by only 9 percent and having a reliability<br />
ratio <strong>of</strong> 1.5. By contrast, the Halifax Metrolink system reports a 33 percent<br />
improvement in travel time but increased ridership by only 19 percent.
In addition, it is difficult to conclude that any particular BRT element attracts<br />
more riders. Only running way priority demonstrated any level <strong>of</strong> correlation<br />
to ridership increases. Approximately half <strong>of</strong> the systems with increases <strong>of</strong> 43<br />
percent or higher run on dedicated busways for at least a significant portion <strong>of</strong><br />
their service, while most <strong>of</strong> the systems with the smallest ridership increases are<br />
those operating in mixed traffic, but one <strong>of</strong> the best-performing systems, the<br />
Silver Line Washington Street, does as well. No other element clearly aligns with<br />
a particular ridership improvement outcome. Overall, it is likely that riders are<br />
attracted to a number <strong>of</strong> factors that include travel time and reliability but also a<br />
positive brand identity and frequent service. Furthermore, outside factors, such<br />
as the availability and quality <strong>of</strong> transportation alternatives, play an important<br />
role in determining ridership.<br />
The data also reveal that some BRT systems can divert trips from private car to<br />
transit. Fourteen systems reported the percentage <strong>of</strong> ridership coming from<br />
private motorized modes. The results were mixed, but generally good, with half<br />
reporting between 19 and 33 percent <strong>of</strong> their ridership coming from private vehicles.<br />
The highest performing systems were the Albuquerque Rapid Ride and<br />
the Adelaide North East Busway. As with ridership increases, the dataset does<br />
not reveal a clear link between any BRT element or performance indicator and<br />
mode shift.<br />
System Performance Pr<strong>of</strong>iles<br />
VIVA, York Region, Ontario<br />
The VIVA BRT in Ontario’s York Region, north <strong>of</strong> Toronto, presents an effective<br />
strategy to building BRT ridership. York Region <strong>Transit</strong> is implementing the<br />
VIVA BRT network in stages. In the first phase, called Quick Start, the agency implemented<br />
high-capacity vehicles, <strong>of</strong>f-board fare collection, enhanced stations,<br />
transit signal priority, and an extensive branding and marketing campaign. The<br />
Ridership on Corridors (York Region <strong>Transit</strong>)<br />
Year Conventional VIVA Total (Year)<br />
2004 5,300,035 not in service 5,300,035<br />
2005 5,832,559 1,423,066 7,255,625<br />
2006 4,225,187 7,134,982 11,360,169<br />
2007 4,074,346 8,296,397 12,370,743<br />
BRT System Benefits<br />
service runs entirely in mixed traffic roadways, since acquiring ROW and building<br />
dedicated running ways entail a long implementation process, as well as higher<br />
costs. The agency has indicated that it wanted to deploy the BRT network as<br />
quickly as possible to allow corridor ridership to build and help justify Phase II –<br />
construction <strong>of</strong> on-street dedicated running ways.<br />
The ridership results above indicate the success <strong>of</strong> this strategy, as corridor ridership<br />
has increased significantly since the VIVA opened. They also reveal that<br />
ridership has shifted from the conventional bus service to the VIVA. Agency<br />
representatives have reported anecdotally that riders will let one <strong>of</strong> the regular<br />
fleet buses pass by to wait for a VIVA bus. Phase II is now under way, with the<br />
agency acquiring ROW needed for the on-street busways.<br />
4-5
BRT System Benefits<br />
4-6<br />
Exhibit 4-1: BRT Elements by System and Ridership<br />
City, State / Province / Country Albuquerque Boston Silver Line<br />
BRT Line / System Rapid Ride Washington St Waterfront SL1 - Airport Waterfront SL2 - BMIP<br />
Running Way (miles)<br />
Total Length <strong>of</strong> Route (miles) 13.8 2.4 4.5 2.2<br />
On-Street Running Ways 13.8 2.4 3.5 1.2<br />
On Street Mixed Lanes 13.1 0.2 3.5 1.2<br />
On Street Exclusive Bus Lanes 0.7 2.2<br />
Off Street Mixed Lanes 0.0<br />
Off Street Reserved Lanes 0.0<br />
At-Grade <strong>Transit</strong>way 0.0<br />
Grade-Separated <strong>Transit</strong>way<br />
Queue Jumpers<br />
Performance Indicators<br />
- 1.0 1.0<br />
Travel Time: Change in Corridor Before vs. After 15% 9%<br />
Travel Time: BRT vs. Local Bus in same corridor 9%<br />
Reliability: Ratio <strong>of</strong> Maximum to Minimum Running<br />
Time<br />
1.2 1.5 --<br />
Capacity: Maximum Critical <strong>Link</strong> Throughput (persons<br />
per hour per direction)<br />
600 1,264<br />
Ridership Results SL2 and SL3<br />
Average Weekday Boardings in Corridor before BRT 7,430 7,327 7,507 3,756<br />
Average Weekday Boardings in Corridor after BRT 12,430 14,102 9,338 7,434<br />
% Increase in Ridership 67% 92% 24% 98%<br />
Percentage <strong>of</strong> ridership coming from private<br />
motorized modes<br />
68% 2% 22.0% 8.0%
Exhibit 4-1: BRT Elements by System and Ridership (cont’d.)<br />
BRT System Benefits<br />
City, State / Province / Country Chicago* Cleveland, OH<br />
BRT Line / System Western Avenue Express Irving Park Express Garfield Express<br />
Health line- only running<br />
time<br />
Running Way (miles)<br />
Total Length <strong>of</strong> Route (miles) 18.3 9.0 9.4 7.1<br />
On-Street Running Ways 18.3 9.0 9.4 7.1<br />
On Street Mixed Lanes 18.3 9.0 9.4 2.7<br />
On Street Exclusive Bus Lanes<br />
Off Street Mixed Lanes<br />
Off Street Reserved Lanes<br />
At-Grade <strong>Transit</strong>way<br />
Grade-Separated <strong>Transit</strong>way<br />
Queue Jumpers<br />
Performance Indicators<br />
4.4<br />
Travel Time: Change in Corridor Before vs. After 26%<br />
Travel Time: BRT vs. Local Bus in same corridor 15% 25% 20%<br />
Reliability: Ratio <strong>of</strong> Maximum to Minimum Running<br />
Time<br />
Capacity: Maximum Critical <strong>Link</strong> Throughput (persons<br />
per hour per direction)<br />
1.3 1.2 1.4<br />
Ridership Results<br />
Average Weekday Boardings in Corridor before BRT<br />
Average Weekday Boardings in Corridor after BRT<br />
% Increase in Ridership 9% (2004) 14% (2004)<br />
Percentage <strong>of</strong> ridership coming from private<br />
motorized modes<br />
4-7
BRT System Benefits<br />
4-8<br />
Exhibit 4-1: BRT Elements by System and Ridership (cont’d.)<br />
City, State / Province / Country Cleveland Eugene Honolulu<br />
BRT Line / System HealthLine EmX City Express: A City Express: B<br />
Running Way (miles)<br />
Total Length <strong>of</strong> Route (miles) 7.1 4.0 19.0 8.0<br />
On-Street Running Ways 7.1 4.0 19.0 8.0<br />
On Street Mixed Lanes 2.7 1.4 19.0 8.0<br />
On Street Exclusive Bus Lanes<br />
Off Street Mixed Lanes<br />
Off Street Reserved Lanes<br />
At-Grade <strong>Transit</strong>way<br />
Grade-Separated <strong>Transit</strong>way<br />
4.4 2.6<br />
Queue Jumpers<br />
Performance Indicators<br />
Queue jump<br />
Travel Time: Change in Corridor Before vs. After - -<br />
Travel Time: BRT vs. Local Bus in same corridor - -27%<br />
Reliability: Ratio <strong>of</strong> Maximum to Minimum Running<br />
Time<br />
-- 2.2 1.1 1.3<br />
Capacity: Maximum Critical <strong>Link</strong> Throughput (persons<br />
per hour per direction)<br />
400 260<br />
Ridership Results<br />
Average Weekday Boardings in Corridor before BRT 2,667 40,000 38,000<br />
Average Weekday Boardings in Corridor after BRT 6,200 40,000 33,000<br />
% Increase in Ridership 132% 0% -13%<br />
Percentage <strong>of</strong> ridership coming from private<br />
motorized modes
Exhibit 4-1: BRT Elements by System and Ridership (cont’d.)<br />
BRT System Benefits<br />
City, State / Province / Country Honolulu Kansas City Las Vegas Los Angeles<br />
BRT Line / System Country Express: C MAX - Main St MAX Orange Line<br />
Running Way (miles)<br />
Total Length <strong>of</strong> Route (miles) 39.0 6.0 7.5 14.5<br />
On-Street Running Ways 18.0 6.0 7.5 1.0<br />
On Street Mixed Lanes 18.0 6.0 3.0 1.0<br />
On Street Exclusive Bus Lanes<br />
along certain segments, for certain<br />
times <strong>of</strong> day<br />
4.5 -<br />
Off Street Mixed Lanes 3.5 - 0.0<br />
Off Street Reserved Lanes 17.5 - 0.0<br />
At-Grade <strong>Transit</strong>way - 13.5<br />
Grade-Separated <strong>Transit</strong>way -<br />
Queue Jumpers<br />
Performance Indicators<br />
1 queue jumper<br />
Travel Time: Change in Corridor Before vs. After - 16%<br />
Travel Time: BRT vs. Local Bus in same corridor -27% 25% 25% x<br />
Reliability: Ratio <strong>of</strong> Maximum to Minimum Running<br />
Time<br />
1.2 -- 1.1 1.1<br />
Capacity: Maximum Critical <strong>Link</strong> Throughput (persons<br />
per hour per direction)<br />
200 600 x<br />
Ridership Results<br />
Average Weekday Boardings in Corridor before BRT 11,000 3,400 7,000 41,580<br />
Average Weekday Boardings in Corridor after BRT 12,000 4,450 10,000 62,597<br />
% Increase in Ridership 9% 31% 43% 51%<br />
Percentage <strong>of</strong> ridership coming from private<br />
motorized modes<br />
10% x<br />
4-9
BRT System Benefits<br />
4-10<br />
City, State / Province / Country Los Angeles Miami Oakland<br />
BRT Line / System Metro Rapid (All Routes) Busway Busway Local San Pablo Ave Rapid<br />
Running Way (miles)<br />
Total Length <strong>of</strong> Route (miles) 229.5 20.0 8.0 14.0<br />
On-Street Running Ways 229.5 0.0 0.0 14.0<br />
On Street Mixed Lanes 229.5 14.0<br />
On Street Exclusive Bus Lanes -<br />
Off Street Mixed Lanes 0.0<br />
Off Street Reserved Lanes 0.0<br />
At-Grade <strong>Transit</strong>way 0.0 20.0 8.0<br />
Grade-Separated <strong>Transit</strong>way -<br />
Queue Jumpers<br />
Performance Indicators<br />
Queue Jumpers Queue jumpers<br />
Travel Time: Change in Corridor Before vs. After x 29% (2004) 35%<br />
Travel Time: BRT vs. Local Bus in same corridor<br />
Reliability: Ratio <strong>of</strong> Maximum to Minimum Running<br />
Time<br />
Capacity: Maximum Critical <strong>Link</strong> Throughput (persons<br />
per hour per direction)<br />
Exhibit 4-1: BRT Elements by System and Ridership (cont’d.)<br />
Overall avg. <strong>of</strong> 25% faster than<br />
local bus routes<br />
17% reduction from limited<br />
-stop route<br />
-- 1.0 (2004) 1.0 1.2<br />
x 385<br />
Ridership Results<br />
Average Weekday Boardings in Corridor before BRT 388,400<br />
Average Weekday Boardings in Corridor after BRT 464,600 23,000 13,000<br />
% Increase in Ridership 20% 179% since pre-busway<br />
Percentage <strong>of</strong> ridership coming from private<br />
motorized modes<br />
33% (based on rider surveys) 19%
Exhibit 4-1: BRT Elements by System and Ridership (cont’d.)<br />
City, State / Province / Country Orlando* Phoenix<br />
BRT System Benefits<br />
BRT Line / System LYMMO RAPID - I-10 East RAPID - I-10 West RAPID - SR-51<br />
Running Way (miles)<br />
Total Length <strong>of</strong> Route (miles) 3.0 20.5 12.8 22.5<br />
On-Street Running Ways 0.0 6.5 4.8 12.3<br />
On Street Mixed Lanes 6.5 4.8 12.3<br />
On Street Exclusive Bus Lanes<br />
Off Street Mixed Lanes<br />
-<br />
Off Street Reserved Lanes - 14.0 8.0 10.3<br />
At-Grade <strong>Transit</strong>way<br />
Grade-Separated <strong>Transit</strong>way<br />
Queue Jumpers<br />
Performance Indicators<br />
Travel Time: Change in Corridor Before vs. After<br />
3.0 - - -<br />
Travel Time: BRT vs. Local Bus in same corridor 0%<br />
Reliability: Ratio <strong>of</strong> Maximum to Minimum Running<br />
Time<br />
0.0 -- -- --<br />
Capacity: Maximum Critical <strong>Link</strong> Throughput (persons<br />
per hour per direction)<br />
63/bus 63/bus 63/bus<br />
Ridership Results 2004 data 2004 data 2004 data<br />
Average Weekday Boardings in Corridor before BRT<br />
Average Weekday Boardings in Corridor after BRT 607 435 533<br />
% Increase in Ridership 33% one year after opening 30% 30% 30%<br />
Percentage <strong>of</strong> ridership coming from private<br />
motorized modes<br />
4-11
BRT System Benefits<br />
4-12<br />
Exhibit 4-1: BRT Elements by System and Ridership (cont’d.)<br />
City, State / Province / Country Phoenix Pittsburgh*<br />
BRT Line / System RAPID - I-17 East Busway South Busway West Busway<br />
Running Way (miles)<br />
Total Length <strong>of</strong> Route (miles) 19.5 9.1 4.3 5.0<br />
On-Street Running Ways 8.0 0.0 0.0 0.0<br />
On Street Mixed Lanes<br />
On Street Exclusive Bus Lanes<br />
8.0<br />
Off Street Mixed Lanes 0.4 - 0.4<br />
Off Street Reserved Lanes 11.5 - - -<br />
At-Grade <strong>Transit</strong>way - 4.6<br />
Grade-Separated <strong>Transit</strong>way<br />
Queue Jumpers<br />
Performance Indicators<br />
8.7 4.3<br />
Travel Time: Change in Corridor Before vs. After<br />
Travel Time: BRT vs. Local Bus in same corridor<br />
52% 55% 26%<br />
Reliability: Ratio <strong>of</strong> Maximum to Minimum Running<br />
Time<br />
-- 1.1 1.0 1.2<br />
Capacity: Maximum Critical <strong>Link</strong> Throughput (persons<br />
per hour per direction)<br />
63/bus<br />
Ridership Results 2004 data 2004 data 2004 data 2004 data<br />
Average Weekday Boardings in Corridor before BRT<br />
Average Weekday Boardings in Corridor after BRT 797 30,000 13,000 8,700<br />
% Increase in Ridership 30% 135%<br />
Percentage <strong>of</strong> ridership coming from private<br />
motorized modes
Exhibit 4-1: BRT Elements by System and Ridership (cont’d.)<br />
City, State / Province / Country Sacramento San Jose Halifax Ottawa<br />
BRT Line / System EBus - Stockton Rapid 522 Metro<strong>Link</strong> 95<br />
Running Way (miles)<br />
Total Length <strong>of</strong> Route (miles) 8.0 25.0 23.2 25.9<br />
On-Street Running Ways 8.0 25.0 12.6 2.1<br />
On Street Mixed Lanes 8.0 25.0 12.1 2.1<br />
On Street Exclusive Bus Lanes 0.0 0.0 0.5<br />
Off Street Mixed Lanes 0.0 0.0 10.6 3.2<br />
Off Street Reserved Lanes 0.0 0.0 - 8.7<br />
At-Grade <strong>Transit</strong>way 0.0 0.0 -<br />
Grade-Separated <strong>Transit</strong>way None - - 12.0<br />
Queue Jumpers<br />
Performance Indicators<br />
1 queue jumper Queue Jumpers<br />
Travel Time: Change in Corridor Before vs. After 10% x 33%<br />
Travel Time: BRT vs. Local Bus in same corridor 5% 20% 33%<br />
Reliability: Ratio <strong>of</strong> Maximum to Minimum Running<br />
Time<br />
1.3 -- -- 1.0<br />
Capacity: Maximum Critical <strong>Link</strong> Throughput (persons<br />
per hour per direction)<br />
774 (including local route) 67 passengers / hour 2,400<br />
Ridership Results<br />
Average Weekday Boardings in Corridor before BRT 125 18,023 6,129<br />
Average Weekday Boardings in Corridor after BRT 1,750 21,300 7,266 60,358<br />
% Increase in Ridership 1300% 18% 19%<br />
Percentage <strong>of</strong> ridership coming from private<br />
motorized modes<br />
Not Available x 23%<br />
BRT System Benefits<br />
4-13
BRT System Benefits<br />
4-14<br />
City, State / Province / Country Ottawa York<br />
BRT Line / System 96 97 VIVA Blue VIVA Purple<br />
Running Way (miles)<br />
Total Length <strong>of</strong> Route (miles) 27.2 18.4 20.3 17.1<br />
On-Street Running Ways 2.1 2.1 20.3 17.1<br />
On Street Mixed Lanes<br />
On Street Exclusive Bus Lanes<br />
2.1 2.1 20.3 17.1<br />
Off Street Mixed Lanes 13.1 5.2<br />
Off Street Reserved Lanes<br />
At-Grade <strong>Transit</strong>way<br />
3.8 1.2<br />
Grade-Separated <strong>Transit</strong>way 8.2 9.8<br />
Queue Jumpers<br />
Performance Indicators<br />
Travel Time: Change in Corridor Before vs. After<br />
Travel Time: BRT vs. Local Bus in same corridor<br />
Reliability: Ratio <strong>of</strong> Maximum to Minimum Running<br />
Time<br />
Capacity: Maximum Critical <strong>Link</strong> Throughput (persons<br />
per hour per direction)<br />
Exhibit 4-1: BRT Elements by System and Ridership (cont’d.)<br />
Bus-Only Lanes at some<br />
intersections<br />
Bus-Only Lanes at some<br />
intersections<br />
1.0 1.1 1.4 1.4<br />
1,020 1,000 - -<br />
Ridership Results<br />
Average Weekday Boardings in Corridor before BRT<br />
Average Weekday Boardings in Corridor after BRT 10,893 26,488 28,000 7,300<br />
% Increase in Ridership<br />
Percentage <strong>of</strong> ridership coming from private<br />
motorized modes
Exhibit 4-1: BRT Elements by System and Ridership (cont’d.)<br />
BRT System Benefits<br />
City, State / Province / Country Bogota Guayaquil Pereira Amsterdam<br />
BRT Line / System Transmilenio Metrovia Megabus Zuidtangent<br />
Running Way (miles)<br />
Total Length <strong>of</strong> Route (miles) 52.0 10.0 17.0 25.5<br />
On-Street Running Ways 0.0 0.0 0.0 8.1<br />
On Street Mixed Lanes - - - 1.9<br />
On Street Exclusive Bus Lanes - - - 6.2<br />
Off Street Mixed Lanes - - - 2.5<br />
Off Street Reserved Lanes - - - -<br />
At-Grade <strong>Transit</strong>way<br />
Grade-Separated <strong>Transit</strong>way<br />
52.0 10.0 17.0 14.9<br />
Queue Jumpers<br />
Performance Indicators<br />
- - - Queue Jumper<br />
Travel Time: Change in Corridor Before vs. After x x x<br />
Travel Time: BRT vs. Local Bus in same corridor x x x<br />
Reliability: Ratio <strong>of</strong> Maximum to Minimum Running<br />
Time<br />
-- -- -- --<br />
Capacity: Maximum Critical <strong>Link</strong> Throughput (persons<br />
per hour per direction)<br />
45,000 5,000 5,000<br />
Ridership Results<br />
Average Weekday Boardings in Corridor before BRT x x x<br />
Average Weekday Boardings in Corridor after BRT<br />
% Increase in Ridership<br />
1.26 million >100,000 >100,000 27, 000-28,500<br />
Percentage <strong>of</strong> ridership coming from private<br />
motorized modes<br />
9% x x<br />
4-15
BRT System Benefits<br />
4-16<br />
City, State / Province / Country Caen Edinburgh Eindhoven Leeds<br />
BRT Line / System Tram on Wheels Fastlink Phileas - Western Corridor Superbus<br />
Running Way (miles)<br />
Total Length <strong>of</strong> Route (miles) 9.3 5.0 9.4 6.0<br />
On-Street Running Ways 9.2 4.1 2.2 3.8<br />
On Street Mixed Lanes 1.9 2.2 -<br />
On Street Exclusive Bus Lanes 9.2 2.2 3.8<br />
Off Street Mixed Lanes - - -<br />
Off Street Reserved Lanes - - -<br />
At-Grade <strong>Transit</strong>way<br />
Grade-Separated <strong>Transit</strong>way<br />
Queue Jumpers<br />
Performance Indicators<br />
0.1 0.9 7.2 2.2<br />
Travel Time: Change in Corridor Before vs. After<br />
Travel Time: BRT vs. Local Bus in same corridor<br />
Reliability: Ratio <strong>of</strong> Maximum to Minimum Running<br />
Time<br />
Capacity: Maximum Critical <strong>Link</strong> Throughput (persons<br />
per hour per direction)<br />
Exhibit 4-1: BRT Elements by System and Ridership (cont’d.)<br />
70% reduction in average PM<br />
journey time for guideway segment<br />
3 minute saving outbound<br />
/ up to 11 minute saving<br />
inbound<br />
-- 11.0 -- --<br />
Ridership Results<br />
Average Weekday Boardings in Corridor before BRT<br />
Average Weekday Boardings in Corridor after BRT 45,000<br />
Route has second highest passenger<br />
volumes in Lothian Bus network<br />
28,500<br />
% Increase in Ridership 50% in first 2.5 years<br />
Percentage <strong>of</strong> ridership coming from private<br />
motorized modes<br />
10-20%<br />
1,000
Exhibit 4-1: BRT Elements by System and Ridership (cont’d.)<br />
BRT System Benefits<br />
City, State / Province / Country London Rouen Utrecht Adelaide<br />
BRT Line / System Crawley TEOR Busway North East Busway<br />
Running Way (miles)<br />
Total Length <strong>of</strong> Route (miles) 15.8 23.6 10.3 7.5<br />
On-Street Running Ways 14.9 8.7 5.5 0.0<br />
On Street Mixed Lanes 11.2 8.7 3.5<br />
On Street Exclusive Bus Lanes 3.7 - 2.0<br />
Off Street Mixed Lanes - - -<br />
Off Street Reserved Lanes - - -<br />
At-Grade <strong>Transit</strong>way 0.9 14.9 4.8<br />
Grade-Separated <strong>Transit</strong>way 7.46<br />
Queue Jumpers<br />
Performance Indicators<br />
-<br />
Travel Time: Change in Corridor Before vs. After -40% (Approx)<br />
Travel Time: BRT vs. Local Bus in same corridor -66%<br />
Reliability: Ratio <strong>of</strong> Maximum to Minimum Running<br />
Time<br />
-- -- -- 1.3<br />
Capacity: Maximum Critical <strong>Link</strong> Throughput (persons<br />
per hour per direction)<br />
4,500<br />
Ridership Results<br />
Average Weekday Boardings in Corridor before BRT 3,500<br />
Average Weekday Boardings in Corridor after BRT 10,000 32,000<br />
33,500 with partial operation <strong>of</strong><br />
new line<br />
28,000<br />
% Increase in Ridership 186%<br />
Percentage <strong>of</strong> ridership coming from private<br />
motorized modes<br />
24% 40%<br />
4-17
BRT System Benefits<br />
4-18<br />
Exhibit 4-1: BRT Elements by System and Ridership (cont’d.)<br />
City, State / Province / Country Brisbane Sydney<br />
BRT Line / System South East Busway Inner Northern Busway Liverpool-Parramatta T-Way<br />
North-West T-Way -<br />
Blacktown-Parklea<br />
Running Way (miles)<br />
Total Length <strong>of</strong> Route (miles) 10.3 1.7 19.0 4.7<br />
On-Street Running Ways<br />
On Street Mixed Lanes<br />
0.0 0.0 6.0 0.3<br />
On Street Exclusive Bus Lanes<br />
Off Street Mixed Lanes<br />
Off Street Reserved Lanes<br />
6.0 0.3<br />
At-Grade <strong>Transit</strong>way 13.0 4.4<br />
Grade-Separated <strong>Transit</strong>way<br />
Queue Jumpers<br />
Performance Indicators<br />
10.3 1.7<br />
Travel Time: Change in Corridor Before vs. After -65% in peak 0 - -<br />
Travel Time: BRT vs. Local Bus in same corridor - - - -<br />
Reliability: Ratio <strong>of</strong> Maximum to Minimum Running<br />
Time<br />
1.1 1.1 1.1 1.2<br />
Capacity: Maximum Critical <strong>Link</strong> Throughput (persons<br />
per hour per direction)<br />
15,000 750 850 650<br />
Ridership Results<br />
Average Weekday Boardings in Corridor before BRT -<br />
Average Weekday Boardings in Corridor after BRT<br />
% Increase in Ridership<br />
93,000 7,200<br />
Percentage <strong>of</strong> ridership coming from private<br />
motorized modes<br />
26% 9%
BRT System Benefits<br />
City, State / Province / Country Sydney Beijing Hangzhou Kunming<br />
BRT Line / System<br />
Exhibit 4-1: BRT Elements by System and Ridership (cont’d.)<br />
North-West T-Way -<br />
Parramatta-Rouse Hill<br />
Line 1 BRT Line B1 Busway network<br />
Running Way (miles)<br />
Total Length <strong>of</strong> Route (miles) 1.9 10.3 6.2 24.9<br />
On-Street Running Ways<br />
On Street Mixed Lanes<br />
1.9 0.0 6.2 0.0<br />
On Street Exclusive Bus Lanes 1.9 6.2<br />
Off Street Mixed Lanes 2.2<br />
Off Street Reserved Lanes 24.9<br />
At-Grade <strong>Transit</strong>way<br />
Grade-Separated <strong>Transit</strong>way<br />
Queue Jumpers<br />
Performance Indicators<br />
8.7 8.1<br />
Travel Time: Change in Corridor Before vs. After - -38% Speeds up 68%<br />
Travel Time: BRT vs. Local Bus in same corridor -<br />
Reliability: Ratio <strong>of</strong> Maximum to Minimum Running<br />
Time<br />
1.0 -- -- --<br />
Capacity: Maximum Critical <strong>Link</strong> Throughput (persons<br />
per hour per direction)<br />
1,100 4,500 8,000<br />
Ridership Results<br />
Average Weekday Boardings in Corridor before BRT<br />
Average Weekday Boardings in Corridor after BRT 2,800 85,000 10,000<br />
% Increase in Ridership<br />
Percentage <strong>of</strong> ridership coming from private<br />
motorized modes<br />
4-19
BRT System Benefits<br />
CAPITAL COST EFFECTIVENESS<br />
Benefit <strong>of</strong> Capital Cost Effectiveness<br />
A primary advantage <strong>of</strong> BRT technology is that it can be adapted to meet the<br />
needs <strong>of</strong> a broad variety <strong>of</strong> operating environments while maintaining the ability<br />
to scale service to meet future ridership growth. The challenge in designing a<br />
new BRT system is to select a mixture <strong>of</strong> design and operational elements whose<br />
combined capital costs can be reasonably justified according to expected service<br />
output and ridership levels. In other words, the challenge is to “right size” the<br />
level and types <strong>of</strong> BRT capital investments to meet service quality and throughput<br />
requirements in a cost-effective manner.<br />
Definition <strong>of</strong> Capital Cost Effectiveness<br />
Capital cost effectiveness measures the capital cost to deploy a BRT system per<br />
service output such as per rider, per service-mile, or per user travel time savings.<br />
In general, more cost-effective investments are preferable, as they deliver<br />
more investment benefits per dollar invested. The objective <strong>of</strong> these measures<br />
is not, however, to identify the lowest-cost investment alternative. For transit<br />
investments, it is frequently the case that higher-cost alternatives are more costeffective<br />
if they deliver sufficiently higher benefits, as compared to a lower-cost<br />
alternative. The objective <strong>of</strong> capital cost-effectiveness measures, then, is to help<br />
determine which combinations <strong>of</strong> BRT elements deliver the highest investment<br />
benefits (e.g., passenger throughput or travel time savings) per capital dollar invested.<br />
In practice, project capital costs can vary widely between alternative<br />
BRT investments, and, without the use <strong>of</strong> capital cost-effectiveness measures, it<br />
can be extremely daunting to assess which option represents the best solution<br />
to local transportation needs.<br />
Measures <strong>of</strong> Capital Cost Effectiveness<br />
Cost effectiveness can be defined as the cost per unit <strong>of</strong> service output. Evaluation<br />
<strong>of</strong> the capital cost effectiveness <strong>of</strong> BRT projects can be performed with<br />
respect to:<br />
4-20<br />
user benefits—passenger<br />
trips, passenger miles, cumulative travel time<br />
saved<br />
performance improvements—average<br />
travel time savings, reliability<br />
improvements, safety and security improvements<br />
service outputs—vehicle<br />
service miles (VSM), vehicle service hours (VSH)<br />
facility size—miles<br />
<strong>of</strong> investment, vehicle fleet size<br />
From the viewpoint <strong>of</strong> assessing the desirability <strong>of</strong> alternative BRT investments,<br />
some <strong>of</strong> these measures are more effective than others. Most notably, while<br />
measures <strong>of</strong> capital cost per service hour or per mile <strong>of</strong> alignment can help ensure<br />
that reasonable quantities <strong>of</strong> service or running way are purchased per dollar<br />
invested, they say nothing about whether the amounts invested are commensurate<br />
with the demand for those investments. For example, an investment<br />
alternative with a low capital cost per mile <strong>of</strong> alignment should not be considered<br />
a preferred alternative if it cannot serve supporting the expected passenger<br />
demand. Measures based on user benefits, including cost per rider, per passenger<br />
mile, or per hour <strong>of</strong> travel time savings, are not only useful in determining<br />
which investments provide good value per dollar invested but can also be used<br />
to help logically scale the investment to expected user demand.<br />
Annualized Costs and Benefits<br />
Regardless <strong>of</strong> the measure used, capital cost effectiveness, including both the<br />
cost value in the numerator and the output or benefits value in the denominator,<br />
should always be calculated on an “annualized” basis. The process <strong>of</strong> annualizing<br />
ensures that costs and benefits are compared over an equivalent and comparable<br />
time period (i.e., one year). It also ensures that the costs for all capital<br />
asset types (e.g., running way, vehicles, stations, etc.) are properly discounted to<br />
reflect differences in expected useful life. (Costs for individual investment elements<br />
should be annualized using the capital cost recovery factor x = [i*(1+i)<br />
n/((1+i)n-1)], where i is the discount rate and n is the expected useful life <strong>of</strong> the<br />
asset under consideration.)<br />
Expanding on this last point, the process <strong>of</strong> annualizing costs has the effect <strong>of</strong><br />
spreading the cost <strong>of</strong> project elements over many years, with the effect being<br />
most pronounced for assets with the longest lives. Hence, BRT projects with a<br />
relatively high investment in long-lived assets (e.g., tunnels and other structures)<br />
enjoy a higher level <strong>of</strong> discounting when costs are annualized, as compared to<br />
projects whose costs are more dominated by shorter-lived assets (e.g., vehicles).<br />
Note, however, that this effect is on a per-dollar invested basis. It should also be<br />
expected that projects with higher concentrations <strong>of</strong> longer-lived assets will also<br />
have higher total project costs. These relationships are presented in Exhibit 4-2,<br />
which compares the total capital and annualized costs <strong>of</strong> three different BRT<br />
investments with varying concentrations <strong>of</strong> investment in long-lived assets:
Exhibit 4-2: Per Dollar Invested, Annualized Costs Are Lower for<br />
BRT Investments with Higher Concentrations <strong>of</strong> Long-Lived Assets<br />
1) a mixed traffic ROW alternative (which assumes minimal running way investment<br />
and simple transit stops; average asset useful life <strong>of</strong> 32 years), 2) a fullyexclusive<br />
ROW alternative (which assumes extensive running way investment<br />
and passenger stations with full amenities; average asset useful life <strong>of</strong> 52 years),<br />
and 3) an intermediate controlled-access alternative (average asset useful life <strong>of</strong><br />
48 years).<br />
FTA’s Cost Per Hour <strong>of</strong> User Benefits<br />
One measure <strong>of</strong> cost-effectiveness is cost per hour <strong>of</strong> user benefits, which is used<br />
specifically by the <strong>Federal</strong> <strong>Transit</strong> <strong>Administration</strong> to evaluate projects applying<br />
for funding from the New Starts program. FTA defines cost as the annualized<br />
incremental capital cost <strong>of</strong> the project plus the incremental operating and maintenance<br />
cost <strong>of</strong> the transit system in the forecast year (currently 2030). FTA<br />
defines user benefits as the equivalent hours <strong>of</strong> travel-time savings associated<br />
with improvements in transit service levels for all users <strong>of</strong> the transportation system.<br />
In contrast to the capital-cost-only measures presented above, FTA’s measure<br />
clearly incorporates both capital and operating costs. However, the FTA<br />
measure is clearly <strong>of</strong> interest for two reasons. First, FTA’s project effectiveness<br />
measure (with or without operating costs) <strong>of</strong>fers all <strong>of</strong> the characteristics <strong>of</strong> the<br />
cost-effectiveness measures identified above. Second, FTA currently rates projects<br />
seeking federal funding assistance based on this cost-effectiveness measure<br />
(i.e., high, medium-high, medium, medium-low, and low). By using FTA’s measure,<br />
U.S. transit operators can evaluate the relative cost effectiveness <strong>of</strong> alterna-<br />
BRT System Benefits<br />
tive BRT investments and can also determine how each project would likely rate<br />
within FTA’s New Starts process.<br />
The Effects <strong>of</strong> BRT Elements on Cost Effectiveness<br />
System Effects<br />
By analyzing capital cost effectiveness, planners and decision-makers can identify<br />
mixes <strong>of</strong> BRT elements that deliver the desired service quality characteristics<br />
(e.g., passenger throughput) in the most cost-effective manner. Two examples<br />
show how capital cost-effectiveness measures can be used to help identify a preferred<br />
investment solution, one for a corridor with low ridership potential and<br />
one for a corridor with high unmet transit demand. These examples are only<br />
illustrative <strong>of</strong> the process.<br />
The first case considers a BRT corridor with modest ridership potential. More<br />
specifically, it is assumed that, while ridership demand in this corridor is sufficient<br />
to warrant investment in BRT, total potential demand is relatively low<br />
as compared to other potential BRT corridors and as such will respond only<br />
minimally to increasing levels <strong>of</strong> investment in BRT (to further improvements to<br />
travel time, for example). This situation is presented in Exhibit 4-3.<br />
Exhibit 4-3: Cost Effectiveness Analysis Example for<br />
Corridor with Limited Ridership Potential<br />
!<br />
Here, the cost per hour <strong>of</strong> user benefits (FTA’s cost-effectiveness measure) is calculated<br />
for varying levels <strong>of</strong> investment in BRT, including a simple mixed traffic<br />
investment (low cost), a higher throughput-controlled access BRT investment<br />
4-21
BRT System Benefits<br />
(“mid-level” cost), and a high throughput, fully-exclusive running way alternative<br />
(high cost). Because the corridor has limited ridership potential, project cost effectiveness<br />
declines with investment in BRT improvements within that corridor.<br />
Hence, for this example, investment in a mixed-traffic right-<strong>of</strong>-way solution appears<br />
to be the most cost-effective option.<br />
A second corridor, illustrated in Exhibit 4-4, has relatively high ridership potential.<br />
Moreover, in this example, ridership is very responsive to “higher”-level investments<br />
in BRT (i.e., riders are responsive to additional investments that improve<br />
travel time savings and system throughput). For this example, investment<br />
in the more expensive, fully-exclusive guideway option appears to be the most<br />
cost effective (given its ability to service the high level <strong>of</strong> travel demand in the<br />
corridor).<br />
Exhibit 4-4: Cost Effectiveness Analysis Example<br />
for Corridor with Limited Ridership Potential<br />
In practice, each potential BRT investment will face its own trade<strong>of</strong>fs between<br />
total ridership potential, ridership responsiveness to improvements to speed and<br />
throughput, and overall costs. Here, the characteristics <strong>of</strong> all projects will be<br />
different, with each requiring its own independent analysis. The point is that<br />
project cost-effectiveness analysis provides a valuable tool in identifying which<br />
mix <strong>of</strong> BRT elements and attributes meet the transportation needs <strong>of</strong> any given<br />
corridor in the most cost effective manner.<br />
4-22<br />
Effects by Element<br />
On the cost side, project capital cost effectiveness is driven by the selection <strong>of</strong><br />
BRT elements and the characteristics <strong>of</strong> those elements. In general, elements<br />
designed to support greater passenger throughput will have higher capital costs<br />
as compared to lower throughput alternatives, which may reduce project cost<br />
effectiveness (e.g., if the higher throughput option does not attract sufficient<br />
ridership). As a result, it is important for planners to analyze the primary drivers<br />
<strong>of</strong> capital costs (and, in turn, capital cost effectiveness) for BRT investments<br />
while considering which <strong>of</strong> those costs are subject to the greatest variability and<br />
thus pose the greatest risk to project costs. Exhibits 4-5 and 4-6 address these issues<br />
for two different BRT investment examples, the first being a “low level” BRT<br />
investment using lower-cost mixed traffic running ways and unadorned stops<br />
(Exhibit 4-5) and the second being a “higher-level” and higher-cost example using<br />
fully exclusive ROW and stations with passenger amenities (Exhibit 4-6). These<br />
examples are based on cost data from prior BRT and LRT projects.<br />
Exhibit 4-5: Capital Cost Drivers and Sources<br />
<strong>of</strong> Cost Variability – Low-Level BRT Investment
Exhibit 4-6: Capital Cost Drivers and Sources<br />
<strong>of</strong> Cost Variability – High-Level BRT Investment<br />
For lower throughput BRT investments with relatively simple design characteristics<br />
(Exhibit 4-5), capital costs tend to be dominated by project s<strong>of</strong>t costs (including<br />
the cost <strong>of</strong> project design, construction management, project oversight,<br />
testing, and start-up) and utility relocations and betterments (even projects with<br />
relatively modest improvements to existing roadways to accommodate BRT traffic<br />
tend to require material changes to existing public and private utilities including<br />
sewer and drainage, power distribution, gas lines, and telecommunications<br />
lines). Right-<strong>of</strong>-way acquisition and vehicle purchases should also be expected<br />
to be among the larger contributors to project costs, but to a lesser extent as<br />
compared to either s<strong>of</strong>t costs or utility relocation costs. For these simpler BRT<br />
investments, the greatest sources <strong>of</strong> variation in costs between projects are expected<br />
to originate from project s<strong>of</strong>t-costs and utility relocations, and also from<br />
station/stop costs. These variations in cost reflect differences in conditions encountered<br />
once construction has been initiated (e.g., utility adjustments may<br />
prove to be more or less costly than originally anticipated) and differences in<br />
design standards between projects (e.g., station/stop designs and amenities vary<br />
widely between projects).<br />
BRT System Benefits<br />
In contrast, for higher throughput BRT investments (Exhibit 4-6), capital costs<br />
tend to be driven primarily by running way costs, project s<strong>of</strong>t costs, and likely<br />
station costs. This difference, as compared to the earlier example, reflects the<br />
significantly higher level <strong>of</strong> investment in civil structures for higher throughput<br />
systems, including the cost <strong>of</strong> exclusive running ways (including barriers and<br />
potentially with grade separated crossings) and “complete” passenger stations<br />
with station structures, passenger amenities, parking access, and other features.<br />
Utility relocation and right-<strong>of</strong>-way acquisition costs can also be expected to be<br />
among the higher-cost items for high-throughput BRT investments. For these<br />
project types, the greatest source <strong>of</strong> cost variation originates with station costs<br />
(given the broad array <strong>of</strong> potential station design options) as well as from running<br />
way investment costs (with the potential for some grade separation including<br />
tunnels) and utility relocation needs.<br />
The summary below presents considerations related to individual BRT elements.<br />
Running Ways<br />
—Running ways <strong>of</strong>ten constitute the most significant<br />
potential capital costs, depending on the level <strong>of</strong> separation from other traffic<br />
that the BRT implementation demands (costs increase with the level <strong>of</strong><br />
separation). The least costly running-way option is to provide BRT service in<br />
mixed-flow lanes, similar to conventional bus service, but with the possible<br />
addition <strong>of</strong> queue jumps. This solution does not involve any right-<strong>of</strong>-way<br />
acquisition, road construction, or pavement re-striping. With increasing<br />
segregation <strong>of</strong> BRT service from other traffic, however, costs, requirements<br />
for cooperation with other stakeholders, and environmental mitigation<br />
efforts increase. A designated arterial lane requires improved signage,<br />
pavement re-striping, and installation <strong>of</strong> physical barriers. New segregated<br />
lanes in medians can cost between $2.5 and $2.9 million per mile (excluding<br />
ROW acquisition, which may also be necessary). The most expensive<br />
running way options are exclusive transitway lanes, which can be either<br />
at-grade or grade-separated. While these options <strong>of</strong>fer significant potential<br />
for speed and reliability, they cost between 3 and 20 times more than<br />
designated arterial lanes. Even modest improvements to existing roadways<br />
to accommodate mixed BRT and auto traffic will require material relocations<br />
or improvements to existing public and private utilities. Public or<br />
“wet” utilities (e.g., water and sewer systems), private or “dry” utilities (e.g.,<br />
power, telecommunications, and gas lines) can represent a large proportion<br />
<strong>of</strong> total project costs (particularly for lower throughput investments). These<br />
4-23
BRT System Benefits<br />
4-24<br />
costs tend to vary widely between projects and even segments <strong>of</strong> the same<br />
project. This variation reflects the unique character <strong>of</strong> utility networks<br />
encountered for each project, some <strong>of</strong> which is driven by differences in the<br />
density <strong>of</strong> urban development (with higher development requiring higher<br />
needs) and the age <strong>of</strong> the utility networks (with older networks more likely<br />
to require a utility upgrade).<br />
Stops/Stations—BRT<br />
stops/stations vary widely in concept, ranging from<br />
simple raised-platform bus stops to large transfer centers, and stop/station<br />
costs vary widely to reflect these differences. The cost <strong>of</strong> a station is largely<br />
driven by its size, which, in turn, is driven by the number and frequency <strong>of</strong><br />
routes serving the station. Stop/station costs are also significantly impacted<br />
by the inclusion <strong>of</strong> an enclosed station structure, passenger amenities (e.g.,<br />
bathrooms, elevators, escalators), and external station access (e.g., pedestrian<br />
overpasses, parking).<br />
Vehicles —Cost increases with the complexity <strong>of</strong> the vehicle configuration,<br />
the addition <strong>of</strong> enhancements, and the sophistication <strong>of</strong> the propulsion<br />
system. Specialized BRT vehicles cost the most. Other than right-<strong>of</strong>-way<br />
acquisition and exclusive running-way construction, vehicles constitute the<br />
most significant capital investment for a BRT deployment.<br />
Fare Collection System—BRT<br />
fare collection is <strong>of</strong>ten integrated with<br />
the fare collection systems <strong>of</strong> the broader transit network. Decisions about<br />
system-wide fare collection may be driven by the needs <strong>of</strong> the BRT element<br />
or made independently <strong>of</strong> any BRT-specific needs. Consequently, measuring<br />
the cost <strong>of</strong> fare collection systems as part <strong>of</strong> a cost-effectiveness assessment<br />
must consider the relative costs and benefits <strong>of</strong> fare collection that are specifically<br />
attributable to the BRT component <strong>of</strong> the broader regional transit<br />
system.<br />
ITS—The<br />
role <strong>of</strong> ITS is to facilitate and improve the management and<br />
performance <strong>of</strong> the BRT system. Like fare collection systems, ITS <strong>of</strong>ten<br />
requires application across an entire transit or traffic system to be justified.<br />
System-wide benefits <strong>of</strong> ITS application are relevant for analyses <strong>of</strong> capital<br />
cost effectiveness.<br />
Other Factors Affecting Capital Cost Effectiveness<br />
Several external factors affect capital cost effectiveness:<br />
Labor and Materials Costs—The<br />
strength <strong>of</strong> the local economy will<br />
determine the relative cost <strong>of</strong> labor and materials and will create regional<br />
differences in the costs to develop BRT systems; the global economy is playing<br />
an increasing role in the rise <strong>of</strong> materials costs, especially <strong>of</strong> steel and<br />
concrete.<br />
Property Costs—Because<br />
running ways and stations comprise some <strong>of</strong><br />
the larger expenses in developing BRT, they play a large role in the ability<br />
to develop cost-effective BRT solutions; regions in which right-<strong>of</strong>-way and<br />
property are very expensive will experience higher cost systems.<br />
Performance <strong>of</strong> the Transportation System—The<br />
performance <strong>of</strong> the<br />
existing transportation system drives how much benefit a new BRT system<br />
investment can bring; introducing a superior BRT system into an environment<br />
with a highly-congested transportation system or a low-speed, unreliable<br />
transit system can reap significant benefits to justify an investment.<br />
Summary <strong>of</strong> Impacts on Capital Cost Effectiveness<br />
Exhibit 4-7 presents the capital costs for a selection <strong>of</strong> recently-implemented<br />
BRT systems in the U.S. Because <strong>of</strong> the wide variability in labor, materials, real<br />
estate, and other costs in different regions <strong>of</strong> the world, this report will not compare<br />
capital costs <strong>of</strong> other worldwide BRT systems.<br />
The variation in capital costs among these systems reflects the wide variety <strong>of</strong><br />
BRT system design strategies employed by U.S. transit agencies. The tendency to<br />
use simple running way treatments results in relatively low overall capital costs<br />
for most <strong>of</strong> these BRT systems. The Boston Silver Line Waterfront service and<br />
the Orange Line in Los Angeles are the main exceptions. The Orange Line demonstrates<br />
the high costs <strong>of</strong> building an <strong>of</strong>f-street dedicated transitway, while the<br />
Silver Line Waterfront reflects the extremely high cost associated with the underground<br />
tunnel and three underground stations.<br />
Most <strong>of</strong> the U.S. systems focus significant investment dollars in stylized and highcapacity<br />
vehicles. For the Boston Silver Line Washington Street, the Eugene EmX,<br />
the Las Vegas MAX, and the Sacramento E-Bus, the vehicles represent one-third<br />
to one-half <strong>of</strong> the total budget. The Orange Line and Waterfront service also<br />
have very high vehicle costs. By contrast, the Los Angeles Metro Rapid service
Exhibit 4-7: Capital Costs for Selected Recently-Implemented U.S. BRT Systems<br />
BRT System Benefits<br />
City Boston Eugene Las Vegas Los Angeles Sacramento San Jose<br />
BRT Line / System Silver Line<br />
Washington St<br />
Silver Line<br />
Waterfront<br />
EmX MAX<br />
Orange<br />
Line<br />
Metro Rapid<br />
(All Routes)<br />
EBus - Stockton Rapid 522<br />
Year <strong>of</strong> Opening 2002 2005 2007 2004 2005 2000-today 2004 2005<br />
Length <strong>of</strong> Route (mi) 2.4 4.5 4.0 7.5 14.5 229.5 8.0 25.0<br />
Total Capital Cost by Route $27.29 m $618 m $23.5 m $20.16 m $318 m $7.95 m $3.5 m<br />
Running Way $8.44 m $572.2 m<br />
Stations $5.0 m<br />
included in<br />
Running Way<br />
$18 m for all design<br />
and construction<br />
$0.04 m $180 m $2.7 m<br />
$5.45 m $40 m<br />
Vehicles $13.85 m $42.2 m $6.5 m $12.10 m $16 m<br />
ITS Included in $18 m $0.57 m $10 m<br />
Fare Collection $2.00 m $6 m<br />
$50,000 per<br />
station<br />
$350,000 per<br />
bus<br />
$100,000 per<br />
mile<br />
Other $9.60 m $66 m $1.55 m<br />
and the San Jose Rapid chose to use the same vehicles acquired for their regular<br />
fleet, so the only additional vehicle costs are associated with the distinct livery.<br />
The System Performance Pr<strong>of</strong>iles below provide greater detail on the varying<br />
capital cost strategies <strong>of</strong> several U.S. BRTs.<br />
System Performance Pr<strong>of</strong>iles<br />
Metro Rapid and Orange Line, Los Angeles<br />
Two BRT systems in Los Angeles demonstrate differing approaches to investing<br />
in BRT elements to improve performance and attract riders. The strategy for the<br />
Metro Rapid network was to implement relatively easy and low cost upgrades to<br />
$0.80 m<br />
$3.8 m<br />
$1.8 m<br />
minimal, used<br />
existing stops<br />
$130,000 to<br />
wrap existing<br />
vehicles<br />
Included in<br />
other VTA<br />
projects<br />
No extra<br />
investment<br />
needed<br />
$550k for<br />
planning<br />
and project<br />
management<br />
conventional bus service. The program invests in enhanced stations, with realtime<br />
passenger information, and transit signal priority to improve travel times<br />
in mixed traffic. The Metro Rapid vehicles are primarily 40-ft and 45-ft Metro<br />
fleet vehicles that have a red/silver two-tone paint scheme & Metro Rapid name<br />
branding. By using existing roadways, on-board fare collection, and fleet vehicles<br />
that require only a distinct livery, the transit agency has been able to keep<br />
the program’s costs quite low – the agency estimates that it costs $50,000 per<br />
station and $100,000 per mile for the ITS treatments. This low investment level<br />
has enabled the agency to implement these features across a large network <strong>of</strong><br />
more than 220 miles (with new lines being opened on a regular basis, the total<br />
network length is constantly increasing). The agency reports that, on average,<br />
4-25
BRT System Benefits<br />
travel times have been reduced by 25 percent, and ridership across the entire<br />
network has increased by 20 percent.<br />
The Orange Line BRT represents a very different strategy. With the Orange Line,<br />
the transit agency made a significant investment in deploying all features associated<br />
with a BRT system in a single 14-mile corridor. The corridor primarily<br />
follows an existing ROW on an abandoned rail line; the transit agency had long<br />
planned to implement a rail rapid transit line in this corridor to serve the San<br />
Fernando Valley area and <strong>of</strong>fer an alternative to the congested highway (US-101)<br />
that runs parallel to the corridor. This strategy required relatively high investments<br />
for all BRT components, including a dedicated running way; stations with<br />
real-time information and substantial passenger amenities; high-capacity CNG<br />
vehicles; <strong>of</strong>f-board fare collection; and landscaping, bike and pedestrian paths,<br />
and park-and-ride lots. Total capital costs were $318 million, or $22.7 million per<br />
mile (these costs do not include the ROW acquisition, as this occurred long before<br />
the decision to implement BRT). The Orange Line has surpassed the agency’s<br />
original ridership projections, with a reported 51 percent increase in corridor ridership.<br />
End-to-end travel time has been reduced by only 16 percent, mainly due<br />
to safety concerns surrounding the at-grade intersections which require drivers<br />
to slow down considerably when driving through each intersection.<br />
Silver Line Washington Street, Boston<br />
The Silver Line Washington Street service is another example <strong>of</strong> using existing<br />
roadways to keep overall capital costs down. The cost <strong>of</strong> shelters, kiosks, stop<br />
amenities, and roadway work associated with the project was just $13.4 million,<br />
or $2.84 million per directional route mile. The project realized significant cost<br />
savings by being planned and constructed in conjunction with street reconstruction<br />
supported by state highway funding. By combining these two efforts, the<br />
MBTA not only saved costs, but also supported the Washington Street renovation<br />
that has helped drive development along this corridor. The agency also<br />
saved costs by contracting the construction <strong>of</strong> one Silver Line shelter to a company<br />
that then uses revenue from advertising on stations to pay for the construction<br />
and on-going maintenance. The articulated vehicles were the most<br />
expensive single component; at $13.85 million, they constitute half <strong>of</strong> the total<br />
capital expenditure.<br />
4-26<br />
OPERATING COST EFFICIENCY<br />
Benefit <strong>of</strong> Operating Efficiency<br />
Two <strong>of</strong> the distinguishing attributes <strong>of</strong> BRT are its adaptability to meet the specific<br />
needs <strong>of</strong> an existing transit network and the ability to achieve high levels<br />
<strong>of</strong> operational efficiency at relatively low capital costs. Hence, as with capital<br />
cost efficiency, it is helpful to assess the operating cost efficiency impacts <strong>of</strong> investment<br />
in various combinations <strong>of</strong> BRT elements and complementary service<br />
plans to help identify the most cost effective investment options for any given<br />
travel corridor. The purpose <strong>of</strong> this section is to demonstrate the impact <strong>of</strong> BRT<br />
system design elements on operating efficiency. To do this, it is useful to define<br />
how operating efficiency is measured and to define key performance indicators<br />
that can be used to monitor operating efficiency and productivity.<br />
Definition <strong>of</strong> Operating Efficiency<br />
Operating efficiency is the ability to produce a unit <strong>of</strong> service output from a<br />
unit <strong>of</strong> input. Examples <strong>of</strong> operating cost efficiency measures include cost per<br />
vehicle hour <strong>of</strong> service or cost per passenger. The operating efficiency <strong>of</strong> a BRT<br />
system is influenced by the interplay <strong>of</strong> four critical factors: capital investment<br />
choices, operating plan choices (number <strong>of</strong> service hours), service pricing, and<br />
system ridership. Capital investment choices, operating plan choices, and service<br />
pricing represent decisions the BRT investor/operator can make to ensure the<br />
most efficient service possible. In contrast, the level <strong>of</strong> system ridership, while<br />
influenced by agency service design and pricing decisions, is ultimately the decision<br />
<strong>of</strong> transit riders.<br />
Measures <strong>of</strong> Operating Efficiency<br />
Measures <strong>of</strong> operating efficiency and productivity applied to BRT are common to<br />
the transit industry and enable a comparison between BRT and other local fixed<br />
route service and among BRT systems nationally. Examples <strong>of</strong> performance indicators<br />
used as part <strong>of</strong> an ongoing performance measurement system include:<br />
subsidy per passenger mile<br />
subsidy per passenger<br />
operating cost per passenger<br />
operating cost per vehicle service mile (VSM)
operating cost per vehicle service hour (VSH)<br />
passengers per VSH<br />
passengers per VSM<br />
VSH per full-time equivalent (FTE) employee<br />
Operating efficiency also can be measured in terms <strong>of</strong> dimensions <strong>of</strong> service quality.<br />
For example, BRT systems that operate on exclusive running ways and have<br />
stations with level platform boarding realize operating efficiencies that cannot<br />
be achieved by BRT systems that operate along mixed-flow lanes with uneven<br />
platform boarding. In the latter BRT scenario, running times are less reliable, station<br />
dwell times tend to be longer, and end-to-end travel times tend to be longer.<br />
To compensate for high variation in system performance, the BRT operating<br />
and service plan may involve increased service frequency levels, especially in the<br />
AM and PM peaks, specifically to mitigate schedule adherence problems. In this<br />
case, operating inefficiencies result in service input requirements that are higher<br />
than would otherwise be needed.<br />
The Effects <strong>of</strong> BRT Elements on Operating Efficiency<br />
As noted above, capital investment choices and operating plan choices represent<br />
variables the BRT investor/operator can control. The relationships between<br />
the first two factors and BRT operating costs are outlined in Exhibit 4-8.<br />
Exhibit 4-8: Decisions Impacting Operating Cost Efficiency<br />
Capital Investment Choices<br />
(Differing BRT Configurations)<br />
Level <strong>of</strong> Separation Service Headways<br />
- mixed traffic vs. dedicated ROW - total operating cost<br />
- operating speeds - ridership<br />
Operating Plan Choices<br />
(Different for Same BRT Configuration)<br />
- running way maintenance requirements Non-Productive Vehicle Hours (e.g., layover)<br />
Fare Collection and Fare Structure - cost per revenue hour<br />
- automated vs. staffed kiosks Stations Manned?<br />
- pro<strong>of</strong> <strong>of</strong> payment vs. access-controlled system - labor costs<br />
- stored value vs. single ride (zonal vs. flat fares) <strong>Administration</strong> / Overhead<br />
Vehicle Size / Capacity - total operating cost<br />
- cost per passenger<br />
BRT System Benefits<br />
Capital Investment Choices<br />
Capital investment decisions have varying implications for the subsequent operating<br />
costs and operating cost efficiency <strong>of</strong> the completed system. They determine<br />
the throughput and other physical characteristics <strong>of</strong> the completed BRT<br />
network. Examples include decisions regarding vehicle size/capacity, the use <strong>of</strong><br />
staffed versus unstaffed stations, and the use <strong>of</strong> mixed traffic or exclusive running<br />
ways. Each <strong>of</strong> these capital investment choices has implications for the operating<br />
costs <strong>of</strong> the completed system, and it is generally the case that operating<br />
costs tend to increase as the level <strong>of</strong> investment in BRT element increases.<br />
For example, dedicated right-<strong>of</strong>-way maintained by the operating agency will be<br />
more expensive to operate and maintain than shared traffic right-<strong>of</strong>-way, where<br />
the cost <strong>of</strong> maintenance activities is shared with the local city transportation<br />
department. Similarly, heightened investment in supporting ITS investments requires<br />
sufficient staffing resources to operate and maintain these systems. Large<br />
passenger stations with station attendants, passenger amenities, and parking facilities<br />
are more expensive to operate and maintain than unstaffed stops with a<br />
shelter and raised platform.<br />
Operating Plan Choices<br />
Operating plan choices include decisions regarding the service hours, service frequency<br />
(scheduling), route design, and other service design characteristics <strong>of</strong> the<br />
completed system. For the most part, the principles appropriate to the design<br />
and scheduling <strong>of</strong> cost-efficient BRT service are no different than for conventional<br />
bus or rail services. As with conventional bus service, service planners should design<br />
service that is appropriate to the level <strong>of</strong> travel demand and that minimizes<br />
non-productive vehicle hours (i.e., paid operator time when the vehicle is not in<br />
service). The key difference with conventional bus service relates to the potential<br />
need for additional staff, depending on service design characteristics. Examples<br />
include the need for roving fare inspectors for “pro<strong>of</strong>-<strong>of</strong>-payment” fare systems<br />
and station attendants for large passenger stations and transfer centers.<br />
Other Factors Affecting Operating Efficiency<br />
Labor Costs<br />
Regardless <strong>of</strong> a BRT system’s physical or operating characteristics, operating costs<br />
will be dominated by labor (wage and benefits) costs. Hence, differences in costs<br />
(and operating cost efficiency) between BRT investments primarily reflect differences<br />
in labor requirements based on capital investment and operating plan<br />
4-27
BRT System Benefits<br />
choices. For example, for conventional bus service and light rail operations with<br />
unmanned stations, labor costs make up roughly 70 percent <strong>of</strong> total operating<br />
costs, with the cost <strong>of</strong> fuel, parts, equipment, and services making up most <strong>of</strong><br />
the balance. In contrast, for U.S. rail systems with manned stations, agency labor<br />
costs make up more than 80 percent <strong>of</strong> annual operating costs. This relationship<br />
is further illustrated for the BRT context in Exhibit 4-9.<br />
Exhibit 4-9: Labor Staffing Requirements<br />
for Alternative BRT Investments<br />
Source: Comparison <strong>of</strong> bus and rail budget data from WMATA<br />
The exhibit presents illustrative examples <strong>of</strong> total staffing needs for BRT systems<br />
with differing configurations (i.e., for mixed traffic, controlled access, and exclusive<br />
ROW alternatives). As with earlier examples, this comparison assumes<br />
increasing investment in BRT elements moving from the mixed traffic alternatives<br />
to the exclusive right-<strong>of</strong>-way alternative. In particular, it is assumed that<br />
the mixed traffic alternative uses simple raised platform stops, conventional onboard<br />
fare collection, and minimal investment in ITS. In contrast, the exclusive<br />
ROW alternative is assumed to include several large and manned stations, roving<br />
fare inspectors, and heightened investment in ITS systems (such as real-time passenger<br />
information displays and kiosks). The controlled-access ROW alternative<br />
represents a mid-point between these two extremes. The differing staffing needs<br />
for these alternatives are represented here as the ratio <strong>of</strong> the full-time staffing<br />
4-28<br />
count required for each operational function to the number <strong>of</strong> vehicle operators<br />
required to maintain comparable service levels for each alternative. (In other<br />
words, for each full-time vehicle operator delivering service, the mixed traffic<br />
alternative requires roughly 0.7 additional staff FTE’s to support BRT operations,<br />
including vehicle mechanics, transit police, and administrative staff; in contrast,<br />
the exclusive ROW requires 1.5 additional, non-operator staff per operator.) The<br />
point to note here is that the lower-complexity BRT investments require less<br />
labor to deliver comparable levels <strong>of</strong> service frequency (if not the same service<br />
quality) as compared to more complex BRT investments. However, higher speeds<br />
on busways may need fewer operators for a given level <strong>of</strong> service demand.<br />
To summarize briefly, capital investment and operational design choices both<br />
have material impacts on the operating costs and operating cost efficiency <strong>of</strong><br />
BRT investments. Potential BRT system planners should carefully consider and<br />
evaluate these potential cost implications when identifying the best mix <strong>of</strong> BRT<br />
elements to meet the specific transportation needs <strong>of</strong> any given transportation<br />
corridor.<br />
System Performance Pr<strong>of</strong>iles<br />
The following performance pr<strong>of</strong>iles demonstrate the determinants <strong>of</strong> operating<br />
costs for a selection <strong>of</strong> U.S. BRT systems. Because <strong>of</strong> the wide variability in labor<br />
and other costs in different regions <strong>of</strong> the world, this report will not compare<br />
operating costs for other worldwide BRT systems.<br />
Metro Rapid Wilshire-Whittier, Los Angeles<br />
The Metro Rapid Wilshire–Whittier line in Los Angeles operates in the highest<br />
density transit corridor in the region. Before the implementation <strong>of</strong> Metro<br />
Rapid, a combination <strong>of</strong> seven local and limited service lines operated in the corridor<br />
(five in the Wilshire Boulevard corridor and two in the Whittier Boulevard<br />
corridor). In terms <strong>of</strong> service effectiveness and efficiency variables, Metro Rapid<br />
improved the performance <strong>of</strong> transit service in the corridor, as shown in Exhibit<br />
4-10.
Exhibit 4-10: Operating Efficiencies in the Wilshire–Whittier Metro Rapid Corridor (as <strong>of</strong> 2002)<br />
Route<br />
Metro Rapid’s implementation increased the service productivity from 51 passengers<br />
per vehicle revenue hour to 59.7 passengers per vehicle revenue hour. It<br />
also reduced corridor subsidies related to both passenger miles and total passengers.<br />
Note that the Metro Rapid service increased the combined efficiency<br />
<strong>of</strong> service operated in that combined passengers per revenue hour increased and<br />
combined subsidy per passenger and per passenger mile decreased. The benefit<br />
<strong>of</strong> Metro Rapid is that it improved performance measures for the corridor transit<br />
service as a whole (Transportation Management & Design, Inc., 2002).<br />
West Busway, Pittsburgh<br />
The West Busway in Pittsburgh demonstrated the following performance measures<br />
for operating cost efficiency and cost effectiveness, as illustrated in Exhibit<br />
4-11 and Exhibit 4-12 (U.S. <strong>Department</strong> <strong>of</strong> Transportation 2003):<br />
Exhibit 4-11: Performance Measures for Pittsburgh West Busway<br />
Operating Cost Efficiency (veh mi per veh hr)<br />
Operating Cost Per:<br />
Vehicle revenue mile $6.40<br />
Vehicle revenue hour $81.90<br />
Passenger mile $0.65<br />
Unlinked passenger trip $2.73<br />
Passengers per Revenue Hour Subsidy Per Passenger Mile Subsidy Per Passenger<br />
Before Metro<br />
Rapid<br />
After Metro<br />
Rapid<br />
Before Metro<br />
Rapid<br />
After Metro<br />
Rapid<br />
Martin Luther King Jr. East Busway, Pittsburgh<br />
BRT System Benefits<br />
The speed <strong>of</strong> the East Busway allows more vehicle miles <strong>of</strong> service to be operated<br />
with the same number <strong>of</strong> vehicle hours, which drive major operating costs such<br />
as labor costs. This is because operating speeds are higher.<br />
Exhibit 4-12: Performance Measures for Pittsburgh East Busway<br />
Operating Efficiency (veh mi per veh hr)<br />
Route Type<br />
Before Metro<br />
Rapid<br />
After Metro<br />
Rapid<br />
18 / 318* 62 63 $0.17 $0.18 $0.51 $0.46<br />
20 / 21 / 22 / 320* / 322* 43 61 $0.21 $0.15 $1.08 $0.58<br />
Metro Rapid 720 57.2 $0.14 $0.82<br />
Combined 51 59.7 $0.20 $0.15 $0.79 $0.65<br />
* Service eliminated after implementation <strong>of</strong> Metro Rapid<br />
Vehicle Miles per<br />
Vehicle Hour<br />
New routes 15.8<br />
Routes diverted to East Busway 19.6<br />
Other routes in system 11.5<br />
The comparison <strong>of</strong> vehicle miles per vehicle hour shows that routes on the East<br />
Busway are able to generate between 37 and 70 percent more vehicle miles from<br />
each vehicle hour (Pultz and K<strong>of</strong>fman 1987). An analysis performed by Port Authority<br />
<strong>Transit</strong> (now Port Authority <strong>of</strong> Allegheny County) assigned operating<br />
costs to transit trips and calculated operating cost parameters for different types<br />
<strong>of</strong> routes.<br />
4-29
BRT System Benefits<br />
Exhibit 4-13: Operating Cost per Service Unit by Type <strong>of</strong> Route<br />
for Pittsburgh East Busway (1983 $)<br />
Performance<br />
Measure<br />
4-30<br />
Ridership<br />
New<br />
Routes<br />
Diverted<br />
Routes<br />
All Other Routes<br />
in System<br />
Cost<br />
Effectiveness<br />
Per passenger trip $0.76 $1.95 $1.27<br />
Per peak passenger trip $1.32 $3.19 $3.09<br />
Per passenger mile $0.15 $0.37 $0.24<br />
Per peak passenger mile $0.27 $0.60 $0.58<br />
Cost Efficiency Per seat mile $0.06 $0.06 $0.07<br />
Per peak seat mile $0.12 $0.09 $0.16<br />
Per vehicle vile $3.61 $2.58 $3.26<br />
The analysis shows that new routes and diverted routes on the busway operate<br />
with higher operating efficiencies with respect to capacity operated (seat mile<br />
and peak seat mile). Diverted routes have lower operating costs per vehicle mile<br />
than other non-busway routes. (The higher cost <strong>of</strong> operating vehicle miles for<br />
new routes can be attributed to the fact that those routes are operated with<br />
articulated vehicles.) Furthermore, new routes have higher cost effectiveness,<br />
with lower costs per unit <strong>of</strong> service consumed across the board, especially since<br />
demand is close to the operated capacity. Diverted routes demonstrate lower<br />
cost effectiveness since they tend to generate demand further below capacity<br />
than other routes (Barton-Aschman 1982).<br />
Silver Line Washington Street and Waterfront Service,<br />
Boston<br />
A comparison <strong>of</strong> the Silver Line Washington Street service with the previous local<br />
bus service in the corridor and MBTA’s systemwide bus service demonstrates<br />
how BRT’s greater ridership intensity can improve operating cost efficiencies<br />
even if the costs per vehicle mile are higher.<br />
The Silver Line’s costs are higher on a per vehicle mile basis, largely due to the<br />
higher cost <strong>of</strong> CNG over diesel fuel used by the previous local bus service and by<br />
the rest <strong>of</strong> the MBTA fleet. However, the Silver Line has much higher usage than<br />
the other local services. As a result, MBTA is providing less <strong>of</strong> a rider subsidy for<br />
the Silver Line service than for its local routes.<br />
Early results for the Silver Line Waterfront service show a higher passenger subsidy<br />
rate due to the lower ridership levels than on the Washington Street service.<br />
Two <strong>of</strong> the Waterfront lines operate in corridors not previously served by transit,<br />
and the Waterfront area is still in the early stages <strong>of</strong> a major redevelopment<br />
boom. Therefore, current ridership is lower than would be expected when the<br />
new developments open.<br />
Exhibit 4-14: Comparison <strong>of</strong> MBTA Silver Line<br />
Washington Street Operating Costs<br />
Cost per<br />
Vehicle<br />
Mile<br />
Cost per<br />
Vehicle<br />
Hour<br />
Passengers<br />
per Vehicle<br />
Hour<br />
Cost per<br />
Passenger<br />
Revenue<br />
per<br />
Passenger Differential<br />
Silver<br />
Line<br />
$17 $109 117.4 $0.92 $0.42 ($0.50)<br />
Rt. 49 $13 $102 99.5 $1.03 $0.48 ($0.55)<br />
System $10 $102 51.2 $1.99 $0.53 ($1.46)<br />
Source: 2004 MBTA Service Plan<br />
Cost per<br />
Vehicle<br />
Mile<br />
Exhibit 4-15: MBTA Silver Line Waterfront<br />
Operating Costs, Early Results<br />
Cost per<br />
Vehicle<br />
Hour<br />
Passengers<br />
per Vehicle<br />
Hour<br />
Cost per<br />
Passenger<br />
Revenue<br />
per<br />
Passenger Differential<br />
$11 $142 76 $1.88 $1.15 ($0.73)<br />
TRANSIT-SUPPORTIVE LAND DEVELOPMENT<br />
Benefit <strong>of</strong> <strong>Transit</strong>-Supportive Land Development<br />
Like other forms <strong>of</strong> rapid transit, BRT has a potential to promote transit-supportive<br />
land development, promoting greater accessibility and employment and economic<br />
opportunities by concentrating development, increasing property values,<br />
and creating more livable places. BRT corridors serve both existing land use and
have the ability to create new land forms along the transit system. Definition <strong>of</strong><br />
<strong>Transit</strong>-Supportive Land Development<br />
Definition <strong>of</strong> <strong>Transit</strong>-Supportive Land Development<br />
Investment in public transit facilities such as stations or other transit infrastructure<br />
improves accessibility and attracts new development. <strong>Transit</strong>-supportive<br />
land development leverages the characteristics <strong>of</strong> transit—regular and frequent<br />
flows <strong>of</strong> pedestrians and customers. There are several characteristics <strong>of</strong> transitsupportive<br />
land development. Typically, this development has higher densities<br />
and intensity <strong>of</strong> use. The mix <strong>of</strong> land uses is more diverse, including housing,<br />
employment, retail, and leisure activities. There is less emphasis on automobileoriented<br />
uses and automobile access (less parking).<br />
<strong>Transit</strong>-supportive land development creates many additional benefits. In many<br />
BRT systems, transit-oriented development is being used as a tool to encourage<br />
business growth, to revitalize aging downtowns and declining urban neighborhoods,<br />
and to enhance tax revenues for local jurisdictions. These benefits<br />
contribute to a net regional economic benefit. Most important, these benefits,<br />
in turn, generate a direct net impact for transit system customers by allowing<br />
increased access to jobs and other services as well as improved mobility.<br />
Measures <strong>of</strong> <strong>Transit</strong>-Supportive Land Development<br />
There are several ways to gauge how BRT enables transit-supportive land development.<br />
For the purposes <strong>of</strong> this report, three ways are presented: actual<br />
impacts to the quantity <strong>of</strong> development around transit, actual impacts to the<br />
character <strong>of</strong> development, and the extent <strong>of</strong> changes to land use and development<br />
policy.<br />
Quantity <strong>of</strong> New Development<br />
The quantity <strong>of</strong> new development is usually presented as the amount <strong>of</strong> new<br />
development within a certain distance <strong>of</strong> a transit station or transit running way<br />
alignment. Although there is no uniform measure <strong>of</strong> quantity <strong>of</strong> new development<br />
for comparison corridors, common measures include gross square footage,<br />
number <strong>of</strong> housing units, new population accommodated, and new jobs accommodated.<br />
The area <strong>of</strong> reporting is sometimes represented as one-quarter or<br />
one-half mile from transit stations or transit alignments.<br />
BRT System Benefits<br />
Character <strong>of</strong> New Development<br />
The character <strong>of</strong> new development incorporates many concepts such as land use<br />
mix, extent and quality <strong>of</strong> pedestrian infrastructure and the scale <strong>of</strong> development,<br />
and the extent to which uses are pedestrian-oriented and not automobile-oriented.<br />
Due to the qualitative nature <strong>of</strong> these characteristics, there is no<br />
uniform way to represent the character <strong>of</strong> new development. Simple measures<br />
indicate whether land uses are mixed or not and whether pedestrian infrastructure<br />
is provided.<br />
Changes to Land Development Policy<br />
Changes to land development policy are difficult to characterize. Often, the<br />
strength <strong>of</strong> transit-supportive policies can be rated. For this document, it is reported<br />
whether or not a local agency has adapted land development policy as a<br />
result <strong>of</strong> or in anticipation <strong>of</strong> implementation <strong>of</strong> a BRT system.<br />
Effects <strong>of</strong> BRT Elements on<br />
<strong>Transit</strong>-Supportive Land Development<br />
Specific design elements <strong>of</strong> a BRT system, particularly those that involve physical<br />
infrastructure investment, each have positive effects on land use and development.<br />
Running Way<br />
Research shows that the effect <strong>of</strong> investments in running ways is three-fold:<br />
They improve the convenience <strong>of</strong> accessing other parts <strong>of</strong> a region from station<br />
locations.<br />
Increased accessibility increases the likelihood that property can be developed<br />
or redeveloped to a more valuable and more intense use.<br />
Physical running way investments signal to developers that a local government<br />
is willing to invest in a significant transit investment and suggest a<br />
permanence that attracts private investment in development.<br />
stations<br />
Station design can have significant impacts on the economic vitality <strong>of</strong> an area.<br />
A new BRT station provides opportunity to enhance travel and create a livable<br />
community at the same time. Station designs that effectively link transit service<br />
4-31
BRT System Benefits<br />
to the adjacent land uses maximize the development potential. It is important<br />
to note that the inclusion <strong>of</strong> routes in BRT systems that combine feeder service<br />
and line-haul (trunk) service reduces the need for large parking lots and parking<br />
structures, thereby freeing land at accessible locations for development.<br />
Vehicles<br />
Vehicles can reinforce attractiveness (and, indirectly, the development potential)<br />
<strong>of</strong> BRT-adjacent properties to the extent that they:<br />
4-32<br />
demonstrate attractive aesthetic design and support brand identity <strong>of</strong> the<br />
BRT system<br />
suggest a willingness on the part <strong>of</strong> the public sector to invest in the community<br />
reduce negative environmental impacts such as pollutant emissions and<br />
noise<br />
Experience in Boston and Las Vegas suggests that developers do respond to services<br />
that incorporate vehicles that are attractive and that limit air pollutant<br />
and noise emissions. Successful developments in Pittsburgh and Ottawa, where<br />
more conventionally-designed vehicles are deployed, suggest that development<br />
can still occur with all vehicle types as long as service improvements highlight<br />
the attractiveness <strong>of</strong> station locations.<br />
Service and Operations Plan<br />
The flexible nature and high frequencies <strong>of</strong> BRT service plans allow it to expand<br />
or contract with changes in land use quickly and easily. If the BRT is designed to<br />
provide fast and convenient connections among key activity hubs in an urban or<br />
suburban area, this may help attract developer interest.<br />
Other Factors Affecting <strong>Transit</strong>-Supportive<br />
Land Development<br />
Policy and Planning<br />
In most cases, transit agencies in the United States do not have direct authority<br />
to plan or direct the development patterns <strong>of</strong> areas around stations <strong>of</strong> their<br />
systems. Land development policy is usually the responsibility <strong>of</strong> local municipal<br />
agencies. Land development policy and planning instruments, such as plans and<br />
zoning codes, determine several characteristics that affect development:<br />
land use intensity<br />
mix and variety <strong>of</strong> uses<br />
guidelines for site planning, architecture, pathways, and open spaces that<br />
affect the pedestrian-oriented nature <strong>of</strong> an area<br />
parking requirements<br />
<strong>Transit</strong> agencies do <strong>of</strong>ten support standards that increase the transit market<br />
base – density bonuses, promotion <strong>of</strong> land use mixing, removal or relaxation <strong>of</strong><br />
density caps, removal <strong>of</strong> height limits, and reduction <strong>of</strong> parking ratios.<br />
Economic Environment<br />
Transportation is a necessary condition for development but does not drive development.<br />
The rate <strong>of</strong> regional development is defined by the strength <strong>of</strong> the<br />
local economy. In addition to BRT system characteristics and local planning<br />
and zoning, the local economy drives how much development can occur. While<br />
the local economy is out <strong>of</strong> the control <strong>of</strong> transit agencies, they can play a role in<br />
directly supporting development projects.<br />
System Performance Pr<strong>of</strong>iles<br />
Projects discussed below illustrate the increasing relationship between BRT systems<br />
and transit-supportive development. This information is a compilation <strong>of</strong><br />
qualitative and anecdotal data provided from transit agencies and local city <strong>of</strong>ficials.<br />
Silver Line, Boston<br />
Phase I <strong>of</strong> the Silver Line was developed along the Washington Street corridor,<br />
which originates from downtown Boston to the southwest. The Washington<br />
Street corridor is historically a strong corridor for development, owing to its history<br />
as the primary link between downtown Boston and towns to the south and<br />
west. Previously known as a “gateway” into Boston, it was once served by an<br />
elevated heavy rail line. The corridor had been economically depressed throughout<br />
the 1970s and 1980s and had seen derelict, abandoned, and demolished<br />
structures. Due to the 1973 “transit-first” policy, which increased investment in<br />
public transit, the elevated heavy rail line was removed from Washington Street
etween downtown and Dudley Square in 1987. For 10 years, the corridor was<br />
not served by rapid transit. Discussions were held to determine alternatives,<br />
and the decision to implement Boston’s first BRT system, the Silver Line, was<br />
made. Removing the elevated structure, repaving the roadway, and improving<br />
the streetscape were seen as key elements to the revitalization <strong>of</strong> Washington<br />
Street. Throughout the planning and construction <strong>of</strong> the Silver Line Phase I project,<br />
development has accelerated along the corridor, resulting in at least $93<br />
million in new development. Projects include a mix <strong>of</strong> retail, housing, and institutional<br />
uses, including police stations and medical facilities. Most projects<br />
include retail on the ground level.<br />
Phase II <strong>of</strong> the Silver Line, the Waterfront service, connects South Station, which<br />
is also served by the Red Line subway, commuter rail, Amtrak, and inter-city<br />
buses, to Logan Airport and to the Seaport District. The Seaport District is a<br />
prime real estate development opportunity in Boston; until recently, it had been<br />
dominated by maritime uses and surface parking lots. The 1,000-acre site <strong>of</strong>fers<br />
the city a chance to create the first new transit-oriented development neighborhood<br />
in decades. Massport, the state agency responsible for the management<br />
<strong>of</strong> airports, bridges, and port facilities, owns much <strong>of</strong> the property in this<br />
area. Along with the Boston Redevelopment Authority, Massport is working to<br />
promote dense mixed-use development and create a “new downtown.” The<br />
Seaport District’s transit orientation is being driven in part by a state-imposed<br />
parking freeze.<br />
New development along Boston’s Silver Line<br />
BRT System Benefits<br />
The Courthouse, World Trade Center, and Silver Line Way stations are within<br />
walking distance <strong>of</strong> the majority <strong>of</strong> development. Massport and the MBTA are<br />
working with the site developers to ensure that the planned projects are integrated<br />
with the Silver Line stations. For example, the World Trade Center station<br />
was built jointly by the MBTA, Massport, and the local developer. Riders have<br />
direct pedestrian access into the World Trade Center complex from the Silver<br />
Line station. This same developer is working with Massport on a new project<br />
to be built in the air rights over the World Trade Center station and will have an<br />
entryway directly into the station (Breakthrough Technologies Institute 2008).<br />
The <strong>Transit</strong>way, Ottawa, Ontario<br />
Over one billion Canadian dollars have been invested in new construction<br />
around <strong>Transit</strong>way stations. Since 1987, the following construction projects were<br />
completed:<br />
In 1987, the St. Laurent Shopping Centre completed an expansion that<br />
included 80 additional retail outlets.<br />
Six new <strong>of</strong>fice buildings, a cinema complex, and a community shopping<br />
center have been constructed near Blair station since it opened in 1989.<br />
In 1991, the Riverside Hospital built an expansion over the Riverside station,<br />
and a pedestrian walkway was constructed to connect the station with a<br />
new medical <strong>of</strong>fice building.<br />
The regional planning department found that between 1996 and 1998,<br />
more than $600 million was spent on the construction <strong>of</strong> 3,211 residential<br />
units and 436,858 square meters <strong>of</strong> institutional and commercial buildings<br />
near <strong>Transit</strong>way stations.<br />
From 1988 to 1993, more than 2,300 housing units were built within an 800-meter<br />
radius <strong>of</strong> 14 surveyed <strong>Transit</strong>way stations. The majority <strong>of</strong> this construction<br />
occurred near the Hurdman and Tunney’s Pasture stations. The Tunney’s Pasture<br />
station is surrounded by a federal complex that employs 10,000 workers. A<br />
large mixed-use project was built that featured a residential tower and 18,200<br />
square meters <strong>of</strong> retail (located on the ground floor) and upper-level <strong>of</strong>fices. The<br />
project received approval to lower the parking requirements, given its accessibility<br />
to the transit station. In addition, a significant amount <strong>of</strong> development<br />
has occurred around other stations along the <strong>Transit</strong>way, including the Blair, St.<br />
Laurent, and Riverside stations, and Rideau Center.<br />
4-33
BRT System Benefits<br />
North Las Vegas MAX, Las Vegas<br />
The North Las Vegas Boulevard corridor is a low-density corridor extending from<br />
downtown Las Vegas to the north. The system began operation in summer 2004.<br />
While general development patterns have still not yet transformed due to the<br />
brief period <strong>of</strong> operation, one casino has already invested in pedestrian facilities<br />
and an additional station to attract passengers from the system.<br />
Orange Line, Los Angeles<br />
Opportunities for development along the Metro Rapid Orange Line in Los Angeles<br />
are certain. A Revised Final Environmental Impact Report (RFEIR) for the<br />
Metro Orange Line concluded that the exclusive transitway operation <strong>of</strong> the Orange<br />
Line has potential land use benefits that would encourage transit-oriented<br />
development at or around stations and is consistent with adopted local planning<br />
documents. Potential redevelopment may be a consideration as well. The Community<br />
Redevelopment Agency <strong>of</strong> Los Angeles (CRA) invited the Urban Land Institute<br />
(ULI) to examine development opportunities in the core area <strong>of</strong> the CRA’s<br />
North Hollywood Redevelopment Project, particularly at the North Hollywood<br />
Metro Red Line subway station. Near this station is the terminus for the Metro<br />
Orange Line. The North Hollywood community area was originally a farming<br />
community and eventually became a convenient residential area. Following<br />
freeway construction <strong>of</strong> the 1960s and 1970s, the area experienced decline, but<br />
redevelopment efforts have been made since 1979. Significant changes have occurred<br />
since the opening <strong>of</strong> the Red Line Metro subway station in 2000. This,<br />
in combination with the addition <strong>of</strong> the Metro Orange Line, has resulted in an<br />
increase in revitalization efforts. Commercial and residential investments have<br />
been made, and developers have continued to express interest as well. NoHo<br />
Commons, a multi-phased mixed-use complex several blocks east <strong>of</strong> the North<br />
Hollywood Metro Rail Station, features 220,000 square feet <strong>of</strong> <strong>of</strong>fice space,<br />
228,000 square feet <strong>of</strong> shops and restaurants, 810 units <strong>of</strong> housing, a community<br />
health center, and a child-care center.<br />
LYMMO, Orlando<br />
LYMMO plays a vital role in the economic development <strong>of</strong> downtown Orlando.<br />
Numerous commercial and residential developments have been built since the<br />
inauguration <strong>of</strong> the LYMMO BRT service. By providing a high-quality, frequent,<br />
and reliable transportation choice for downtown employees, visitors, and residents,<br />
LYMMO has increased accessibility to public transit. The City <strong>of</strong> Orlando<br />
4-34<br />
makes use <strong>of</strong> LYMMO as a tool to promote development. As a possible result<br />
<strong>of</strong> this strategy, there are five new <strong>of</strong>fice buildings in Downtown Orlando with<br />
about one million square feet per building. In addition, six new apartment communities<br />
have recently been developed in downtown Orlando (National Bus<br />
Rapid <strong>Transit</strong> Institute 2003).<br />
West Busway, Pittsburgh<br />
The Port Authority <strong>of</strong> Allegheny County has advertised for joint development<br />
opportunities with those interested in using agency-owned land for plans compatible<br />
with adjoining park-and-ride lots. Despite the difficult development<br />
conditions (narrow railroad corridor with limited commercial activity), some<br />
development has been generated. The Borough <strong>of</strong> Carnegie has constructed a<br />
municipal building, including retail services, adjacent to a 215-space park-andride<br />
lot at the terminus <strong>of</strong> the West Busway. The Port Authority also has solicited<br />
development at the West Busway’s Carnegie Borough Park-and-Ride and a<br />
park-and-ride lot in Moon Township near Pittsburgh International Airport. The<br />
Moon Township development is notable since it demonstrates how the flexibility<br />
<strong>of</strong> BRT enables the benefits <strong>of</strong> transit to be transferred to locations not<br />
directly adjacent to the major transportation facility (U.S. <strong>Department</strong> <strong>of</strong> Transportation<br />
2003).<br />
Martin Luther King Jr. East Busway, Pittsburgh<br />
From its inception, the East Busway was envisioned by state and local <strong>of</strong>ficials to<br />
stimulate development through the eastern Pittsburgh suburbs. Early efforts included<br />
promotion <strong>of</strong> development and designation <strong>of</strong> “Enterprise Development<br />
Areas” in the municipalities <strong>of</strong> East Liberty and Wilkinsburg (Pultz and K<strong>of</strong>fman<br />
1987). Fifty-four new developments have occurred within 1500 feet <strong>of</strong> stations.<br />
Overall, the East Busway corridor, since its opening, has experienced approximately<br />
$500 million in land development benefits.
Negley (Shadyside) East Liberty (Shadyside)<br />
EmX, Eugene<br />
In Eugene, Oregon, the Lane <strong>Transit</strong> District (LTD) and city planning agencies<br />
have begun planning exercises to encourage higher density development around<br />
EmX stations. Enhanced bicycle and pedestrian connections address a number<br />
<strong>of</strong> traffic issues and provide a more pedestrian-friendly environment. In December<br />
2006, a 13-acre parcel at the northwest corner <strong>of</strong> International Way and Corporate<br />
Way was sold for $5.8 million. Plans for the property include dividing it<br />
into six different parcels. It was said that the property had generated a lot <strong>of</strong><br />
interest, largely because <strong>of</strong> its location along the EmX route.<br />
Euclid Avenue HealthLine, Cleveland<br />
Real estate development along Cleveland’s Euclid Avenue received a major boost<br />
when plans were unveiled for a BRT line. The presence <strong>of</strong> identifiable station<br />
structures was cited as a key reason for this speculative development. Part <strong>of</strong><br />
this interest may be attributed the fact that the project includes a complete<br />
streetscape renovation by the Greater Cleveland Regional <strong>Transit</strong> Authority<br />
(GCRTA); streetscape enhancements, including pedestrian scale sidewalk lighting,<br />
will enhance the pedestrian character <strong>of</strong> the Euclid Corridor and complement<br />
the recent redevelopment efforts within this area. In February 2008, a<br />
Cleveland Plain Dealer article estimated that more than $4.3 billion in economic<br />
investments have occurred or are planned along this corridor. The article noted<br />
the key role that the Euclid Corridor project had played in revitalizing this area.<br />
ENVIRONMENTAL QUALITY<br />
BRT System Benefits<br />
Benefit <strong>of</strong> Environmental Quality<br />
Environmental quality represents a variety <strong>of</strong> indicators reflecting the local urban<br />
and natural environments, public health, and the global environment.<br />
BRT can improve environmental quality through a variety <strong>of</strong> means, but the<br />
most significant impacts are reduced vehicle emissions <strong>of</strong> local air pollutants,<br />
greenhouse gas reductions, and increased vehicle fuel efficiency. BRT systems<br />
may produce these impacts through three mechanisms that affect the emissions<br />
and fuel consumption <strong>of</strong> both the BRT vehicles and other vehicles operating<br />
around the transit corridor:<br />
Vehicle technology—Many<br />
U.S. BRT systems use alternative fuel vehicles,<br />
primarily compressed natural gas and diesel-hybrid. New diesel buses also<br />
have very low emissions due to stringent federal heavy-duty diesel engine<br />
emissions standards going into effect from 2007 to 2010.<br />
Ridership and mode shift—BRT<br />
systems in the U.S. are attracting drivers<br />
to transit. Shifting trips from private cars to BRT lowers regional vehicle<br />
miles traveled (VMT) and reduces total fuel consumption and emissions<br />
levels.<br />
Traffic system effects—In<br />
some cities, BRT has been shown to reduce<br />
congestion and improve overall traffic speeds, which can improve vehicle<br />
fuel economy and lower vehicle emissions.<br />
Like other transit modes, BRT operations also can have noise or visual “pollution”<br />
impacts. These will primarily affect public health or well-being and the aesthetics<br />
<strong>of</strong> the surrounding community. BRT’s noise and visual impacts are the result<br />
<strong>of</strong> the transit system’s physical infrastructure—vehicles, running way, stations<br />
—as well as the treatments along the corridor. Experience with BRT indicates<br />
that these impacts can be positive or negative. <strong>Transit</strong> agencies will want to<br />
consider both the need to alleviate negative effects that may result from BRT<br />
operations and also how the system design can improve the auditory or visual<br />
environment.<br />
This section reviews the current understanding <strong>of</strong> BRT’s effect on five environmental<br />
quality indicators and explore the BRT system factors that have a significant<br />
impact on them. It considers only the impacts <strong>of</strong> BRT operations, not effects<br />
related to construction activities. Although transit construction may have<br />
4-35
BRT System Benefits<br />
significant environmental consequences, the effects are short-term. This section<br />
focuses upon the long-term environmental benefits that can help support a local<br />
community’s decision to build a BRT system.<br />
Definition <strong>of</strong> Environmental Quality<br />
Environmental quality encompasses a broad array <strong>of</strong> issues. For this discussion,<br />
the focus is on five key environmental indicators:<br />
4-36<br />
Local air pollutants have a significant, direct impact on the local environment<br />
and on public health. Transportation is the primary source <strong>of</strong><br />
urban emissions <strong>of</strong> three local pollutants regulated by the U.S. Environmental<br />
Protection Agency: ground-level ozone, formed by a reaction between<br />
nitrogen oxides (NOx) and volatile organic compounds (VOCs), particulate<br />
matter (PM), and carbon monoxide (CO). This section will focus on BRT<br />
emissions <strong>of</strong> these three local pollutants.<br />
Greenhouse gases—Transportation<br />
is the second biggest fossil fuel<br />
source <strong>of</strong> greenhouse gases (GHG), which can lead to global warming.<br />
Vehicle GHG emissions include carbon dioxide (CO2), methane, and nitrous<br />
oxide. CO2 is the dominant greenhouse gas, comprising more than twothirds<br />
<strong>of</strong> total emissions in the U.S. However, methane is a concern because<br />
it has a much greater global warming impact than CO2. This section will<br />
review both greenhouse gases where possible, but CO2 data is typically<br />
more readily available from transit systems.<br />
Currently, the U.S. EPA does not regulate vehicular GHGs. However, in April<br />
2007, the U.S. Supreme Court ruled that the EPA does have the authority to<br />
regulate greenhouses gases, so it is possible that EPA will develop a GHG regulatory<br />
framework.<br />
Fuel economy relates to the BRT vehicles’ fuel efficiency as well as the<br />
total fuel consumption <strong>of</strong> both BRT and passenger vehicles in the transit<br />
corridor. Fuel economy is <strong>of</strong> interest for promoting operational energy<br />
efficiencies and broader energy security. It should be noted that, while<br />
improved fuel economy may correlate positively with reduced emissions,<br />
this will not always be the case with certain fuel types. Fuel economy does<br />
correlate directly with CO2 emissions.<br />
Noise is becoming a greater environmental concern in neighborhoods with<br />
significant transit activity. In the context <strong>of</strong> BRT systems, this impact is de-<br />
fined as operational vehicle noise that results from the sound <strong>of</strong> the propulsion<br />
system and the vehicle tires on the running way.<br />
Visual impacts from transit operations are typically the result <strong>of</strong> physical<br />
infrastructure components as well as the treatments along the corridor.<br />
Measures <strong>of</strong> Environmental Quality<br />
Transportation environmental impacts can be difficult to quantify because they<br />
occur from a multitude <strong>of</strong> sources that are not easily measured. Environmental<br />
quality is affected by many more factors and within a large area, making it difficult<br />
to separate the impacts <strong>of</strong> a BRT system. In this report, the focus is on the<br />
following measurement mechanisms:<br />
For the first three indicators <strong>of</strong> environmental quality (local air pollutants,<br />
greenhouse gases, and fuel economy), general measures <strong>of</strong> emissions rates<br />
and fuel use <strong>of</strong> the elements used for a BRT system are proxies for specific<br />
measures in a specific corridor. To estimate BRT vehicle emissions, this<br />
section relies on federal transit bus engine emissions standards for CO, PM,<br />
and the two ozone forming pollutants, NOx and HCs. This section also uses<br />
measurements from laboratory testing <strong>of</strong> transit bus emissions and some<br />
limited real-world operational vehicle data collection. When possible, this<br />
section references emissions and fuel economy measurements from realworld<br />
data collection to estimate the overall impact <strong>of</strong> BRT. However, there<br />
has been very little data collection on BRT systems in operation. <strong>Transit</strong><br />
agencies typically do not conduct such analyses, which are complex and<br />
expensive. This section also references the results <strong>of</strong> emissions modeling <strong>of</strong><br />
potential BRT system impacts conducted by independent researchers and<br />
transit agencies for Environmental Impact assessments.<br />
For noise and visual impacts, the section relies upon anecdotal evidence and<br />
assessments <strong>of</strong> impacts. Generally, noise impacts or benefits are measured<br />
as levels <strong>of</strong> noise at specific points along a corridor. Visual impacts are assessed<br />
qualitatively as a positive or negative impact, also at specific points<br />
along a corridor.<br />
Effects <strong>of</strong> BRT Elements on Environmental Quality<br />
This section reviews how BRT system elements may impact each <strong>of</strong> five key environmental<br />
quality indicators for BRT. Vehicle emissions and fuel economy im-
pacts are discussed together, since strategies to improve one <strong>of</strong> these factors will<br />
have a direct impact on the other.<br />
Vehicle Emissions and Fuel Economy<br />
Experience with BRT systems indicates that emissions and fuel economy improvements<br />
generated by BRT are the result <strong>of</strong> three related mechanisms: vehicle<br />
technology, ridership and mode shift, and traffic system effects. These are<br />
summarized in Exhibit 4-16 and described in detail below.<br />
Vehicle Technology<br />
BRT vehicles provide the most direct impact on environmental quality. Low<br />
emission or alternative propulsion systems and fuels, as part <strong>of</strong> a BRT system,<br />
have clear benefits for the environment in reduced pollutant emissions or improved<br />
energy efficiency. As a result <strong>of</strong> increasingly stringent engine emissions<br />
Environmental<br />
Improvement<br />
Mechanism<br />
Vehicle<br />
Technology Effect<br />
Ridership / Mode<br />
Shift Effect<br />
Exhibit 4-16: Emissions and Fuel Economy<br />
Improvement Mechanisms<br />
Sources <strong>of</strong><br />
Pollution<br />
Reduced<br />
BRT vehicle<br />
emissions<br />
Auto emissions<br />
from private, low<br />
occupancy car<br />
trips replaced by<br />
transit<br />
System Effect Local vehicle<br />
emissions<br />
resulting from<br />
traffic congestion<br />
Objective<br />
Reduce direct BRT vehicle pollution<br />
by using:<br />
• larger (and fewer) vehicles<br />
• propulsion systems, fuels, and<br />
pollution control systems with<br />
reduced emissions<br />
Reduce regional vehicle miles<br />
traveled (VMT) by attracting drivers<br />
to BRT through:<br />
• travel time savings<br />
• reliability<br />
• brand identity<br />
• safety and security<br />
• ease <strong>of</strong> use<br />
Reduce all vehicle emissions by:<br />
• reducing conflicts between BRT<br />
vehicles and other traffic<br />
• reducing overall system<br />
congestion<br />
• increasing overall vehicle speeds<br />
Significance<br />
<strong>of</strong> Impact<br />
Moderate<br />
and<br />
immediate<br />
High and<br />
indirect<br />
Moderate/<br />
high and<br />
indirect or<br />
immediate<br />
BRT System Benefits<br />
regulations and innovations in alternative fuel technologies, transit agencies can<br />
choose from many proven clean vehicle options for their BRT operations. (In the<br />
United States, these regulations include new fuel and propulsion system standards<br />
that went into effect in 2007 and 2010.) The most common clean fuel<br />
and propulsion system options are clean diesel, compressed natural gas (CNG),<br />
hybrid-electric, and biodiesel.<br />
Diesel Buses—Over<br />
the past several years, transit agencies have demonstrated<br />
the environmental benefits <strong>of</strong> “clean diesel”: buses that employ engine<br />
controls and exhaust after-treatment devices and run on ultra low sulfur<br />
diesel (ULSD). These treatments significantly lower levels <strong>of</strong> emissions for<br />
particulate matter (PM), oxides <strong>of</strong> nitrogen (NOx), and sulfur dioxide. Two<br />
recent EPA regulatory actions will make clean diesel buses the industry norm.<br />
In October 2006, EPA regulations went into effect that require diesel to meet<br />
ultra-low sulfur emissions levels. Moreover, between 2007 and 2010, new<br />
engine standards will be phased in that will lower buses’ PM emissions by 80<br />
percent and NOx emissions by 90 percent from 2004 levels. The NOx emissions<br />
benefits from replacing very old buses will be even more dramatic.<br />
<strong>Transit</strong> agencies should be aware that these new emissions controls may reduce<br />
the buses’ fuel efficiency. (While there are no current field data on this<br />
impact, this section does review projected fuel economy in the “2007 and Beyond”<br />
subsection.) It is also important to note that emissions control devices<br />
require maintenance to sustain their effectiveness. Overall, transit agencies<br />
that are currently planning BRT will demonstrate significant emissions reductions<br />
simply by replacing older buses with new buses for BRT operations.<br />
Biodiesel—More<br />
transit agencies are using biodiesel fuel for their bus<br />
fleets, primarily for the PM and hydrocarbon emissions benefits. There are<br />
several available biodiesel formulations, but most transit agencies use a mixture<br />
with 20 percent bi<strong>of</strong>uel called B20. A recent biodiesel emissions study<br />
indicated that B20 reduces PM by 20 percent and hydrocarbons emission<br />
by 15 percent. However, the study found that NOx emissions increased by<br />
about 3.3 percent (McCormick et al. 2006). Biodiesel also has lower fuel efficiency<br />
than conventional diesel. The U.S. <strong>Department</strong> <strong>of</strong> Energy estimates<br />
that biodiesel fuel economy is 1-2 percent lower than that <strong>of</strong> diesel fuel<br />
(National Renewable Energy Laboratory 2005).<br />
4-37
BRT System Benefits<br />
4-38<br />
Exhibit 4-17: U.S. EPA Emission Standards for<br />
Diesel Bus Engines (grams/bhp-hr)<br />
Year CO HC(NMHC) NOx PM<br />
1998 15.5 1.3 4.0 0.05<br />
2004 15.5 0.5 2.0 0.05<br />
2007 - 2010 15.5 0.14 0.20 0.01<br />
Compressed Natural Gas (CNG) —CNG buses have been in revenue<br />
transit service for well over a decade, and their emissions benefits are wellestablished.<br />
They <strong>of</strong>fer very low PM emissions, achieving the 2007 diesel<br />
PM levels since 2002. CNG buses also <strong>of</strong>fer low NOx emissions. It should<br />
be noted, however, that the new diesel standards will reduce the differential<br />
between CNG and diesel bus emissions. CNG buses also provide an important<br />
energy security benefit, by diversifying the transportation sector’s fuel<br />
sources.<br />
Diesel-Hybrid—Since<br />
1999, diesel-hybrids have moved from a demonstration<br />
technology to mainstream transit operations, with over 1,500 hybrid<br />
buses in service in the U.S. Because hybrid propulsion systems are not<br />
directly regulated by EPA, emissions and fuel economy estimates come from<br />
laboratory testing or operational data collection. In 2004, New York City<br />
<strong>Transit</strong> released results from its emissions tests on 40-ft hybrid buses, CNG<br />
buses, and diesel buses equipped with particulate traps. The tests showed<br />
that hybrids had the lowest NOx and CO emissions, while all three technologies<br />
had extremely low PM levels.<br />
Exhibit 4-18: New York City <strong>Transit</strong> 40-ft Bus<br />
Emissions Comparison (gm/mi)<br />
CO NOx PM/10<br />
Diesel with particulate filter 0.12 2.79 0.2<br />
CNG 2.12 1.89 0.2<br />
Orion VII hybrid 0.03 0.94 0.2<br />
Source: New York City <strong>Transit</strong> SAE presentation, October 2004<br />
Emissions and fuel economy testing on 60-ft articulated hybrid buses was conducted<br />
at King County <strong>Transit</strong> in Washington. The buses were tested on several<br />
duty cycles, including one that most closely reflects national average bus speeds<br />
(called the “OCTA” cycle). The results from this duty cycle showed that hybrids<br />
had lower PM, NOx, CO and CO2 emissions than a comparable diesel bus:<br />
Exhibit 4-19: King County <strong>Transit</strong> 60-Ft Bus<br />
Emissions Comparison, on OCTA cycle<br />
Emissions in grams per mile CO NOx PM/10 CO2<br />
Diesel 2.29 18.91 0.05 4579<br />
Hybrid 1.55 13.50 0.24 3001<br />
Source: NREL, December 2006<br />
<strong>Transit</strong> agencies should be aware that while hybrid buses have been proven in<br />
transit operations, no data yet exist on the full 12-year life cycle performance<br />
and costs. In addition, some hybrid buses will require additional maintenance,<br />
depending on the battery technology used.<br />
2007 and Beyond<br />
It would be beneficial for agencies planning BRT to understand the expected<br />
in-use emissions and fuel economy benefits <strong>of</strong> their BRT fleet. However, there<br />
are no field data available on buses built to meet the new 2007 - 2010 regulations.<br />
In a July 2007 <strong>Federal</strong> <strong>Transit</strong> <strong>Administration</strong> study, researchers at West<br />
Virginia University estimated the potential emissions and fuel economy benefits<br />
Exhibit 4-20: Emissions and Fuel Economy Estimates for<br />
40-ft Buses, Year 2007 and Beyond (using OCTA cycle) (gm/mi)<br />
NOx PM/10<br />
GHG<br />
(CO2 & methane)<br />
Fuel Economy<br />
(mpg)<br />
Diesel 4.31 .021 2328 4.14<br />
Diesel hybrid 4.41 .006 1972 4.90<br />
B20 biodiesel 4.45 .017 2373 4.08<br />
CNG 4.14 .010 2303 3.52<br />
Source: FTA, “<strong>Transit</strong> Bus Life Cycle Cost and Year 2007 Emissions Estimation,” July 2007
<strong>of</strong> 40-ft buses that will be delivered in 2007 and beyond using current data adjusted<br />
to reflect the new engine standards. These estimates are also based on<br />
performance on the OCTA cycle. The results, shown below, reveal that all bus<br />
technologies are achieving very low emissions levels compared to older diesel<br />
buses while hybrids show the greatest fuel economy improvements and greenhouse<br />
gas reductions.<br />
Ridership/mode shift: BRT can provide environmental benefits (reduce local<br />
pollutants, greenhouse gases, and fuel use) by diverting low-occupancy private<br />
car travel to high-capacity public transit vehicle travel. Shifting trips from private<br />
cars to BRT lowers regional vehicle miles traveled (VMT) and reduces total<br />
fuel consumption.<br />
A 2002 International Energy Agency (IEA) study compared the relative impacts<br />
<strong>of</strong> mode shift and clean propulsion technologies in reducing emissions. The<br />
study assumed a bus load factor <strong>of</strong> 60, with 8 percent <strong>of</strong> the passengers having<br />
switched from private cars. At these high load levels, the IEA found that mode<br />
shift from private cars to public transit has a much greater environmental impact<br />
than use <strong>of</strong> clean vehicle technologies. The overall emissions reductions<br />
changed very little with the change in vehicle propulsion, even when the use <strong>of</strong><br />
fuel cell buses was assumed.<br />
More recently, the American Public Transportation Association (APTA) published<br />
a study on the contribution that public transportation makes to reducing<br />
U.S. greenhouse gas emissions. The study estimated that, in 2005, public transportation<br />
reduced U.S. CO2 emissions by 6.9 million metric tons. The study<br />
determined that, if all current public transportation riders were to use private<br />
vehicles instead <strong>of</strong> transit, they would generate 16.2 million metric tons <strong>of</strong> CO2.<br />
However, APTA calculated that actual operation <strong>of</strong> public transit vehicles resulted<br />
in only 12.3 million metric tons <strong>of</strong> CO2. The study also found that roughly<br />
350 million gallons <strong>of</strong> gas were saved by reduced congestion due to public transit.<br />
However, it should be noted that this study is including all public transit<br />
CO2 emissions, and not only bus-related emissions. Therefore, it is difficult to<br />
extrapolate directly to the potential impacts <strong>of</strong> bus rapid transit.<br />
Indeed, measuring the emissions and fuel use reductions from mode shift is<br />
complicated and costly. To quantify actual results, agencies must establish an<br />
extensive air quality monitoring system that calculates both baseline emissions<br />
levels and emissions after the transit system deployment. In lieu <strong>of</strong> field data collection,<br />
transit agencies use robust emissions models to predict the environmen-<br />
BRT System Benefits<br />
tal impacts <strong>of</strong> VMT changes for proposed transit projects. These estimates are<br />
included in the Environmental Impact assessments required for all new transit<br />
construction projects.<br />
Traffic System Improvements: In some cities, BRT has been shown to reduce<br />
congestion and improve overall traffic speeds, which can improve vehicle<br />
fuel economy and lower vehicle emissions. BRT may reduce regional transportation<br />
emissions by improving overall traffic flow and reducing conflicts between<br />
BRT vehicles and other traffic. However, quantifying this benefit is challenging.<br />
Measuring emissions changes due to improved traffic flow is difficult, as is creating<br />
a model to predict such impacts. However, there have been some efforts to<br />
quantify this impact:<br />
Some models have estimated the reduction <strong>of</strong> overall regional vehicular<br />
emissions from reduced congestion to be on the order <strong>of</strong> several percent<br />
(Darido 2000).<br />
A report on BRT in London found segregated running ways have been<br />
shown to decrease bus emissions by as much as 60 percent through more<br />
efficient speeds and fewer stops (Bayliss 1989).<br />
Preliminary studies <strong>of</strong> the CO2 reductions from Mexico City’s BRT system<br />
found that as much as 46 percent <strong>of</strong> the reductions are the result <strong>of</strong><br />
improved operating conditions for other vehicles (Instituto Nacional de<br />
Ecologia 2006).<br />
noise<br />
As with all transit projects, agencies must consider the noise impacts <strong>of</strong> a BRT<br />
corridor on the local community. For BRT, the primary potential impact is noise<br />
and vibration from BRT vehicles. The level <strong>of</strong> vehicle noise is a function <strong>of</strong> the<br />
following system elements:<br />
propulsion system and configuration<br />
vehicle size<br />
frequency <strong>of</strong> service<br />
running way paving material<br />
Certain propulsion systems are known to produce higher noise levels. This issue<br />
may be exacerbated by the larger engines needed to power articulated buses <strong>of</strong>-<br />
4-39
BRT System Benefits<br />
ten used in high capacity BRT systems. Diesel buses will produce the most noise<br />
pollution. A hybrid-diesel bus is quieter because it uses a smaller diesel engine<br />
and relies on a quiet electric motor for some <strong>of</strong> its power. CNG buses are also<br />
typically quieter than diesel buses, depending on the level <strong>of</strong> maintenance <strong>of</strong> the<br />
propulsion systems; however, some articulated CNG buses have demonstrated<br />
increased vibration.<br />
BRT service designs typically feature shorter headways than conventional bus<br />
service. This may create noise issues due to very frequent bus travel along the<br />
transit corridor. The noise impacts result from both the engine noise and the<br />
sound <strong>of</strong> the tires on the running way. To mitigate this problem, transit agencies<br />
may need to consider using lower-noise bus technologies, noise-reducing running<br />
way materials, or soundwalls. There also has been some interest in new running<br />
way materials designed to mitigate tire noise, such as “rubberized asphalt.”<br />
However, these are still relatively new technologies, and it is not yet proven that<br />
they provide a significant noise mitigation impact. In addition, transit agencies<br />
will need to develop specifications to ensure the long-term durability <strong>of</strong> such<br />
specialized asphalt or pavement.<br />
Visual Impacts<br />
BRT’s major physical infrastructure elements—the running way, vehicles, and<br />
stations—may have visual impacts which should be understood by system<br />
planners. In addition, because BRT infrastructure costs are typically relatively<br />
low, some transit agencies have been able to invest in major landscaping or<br />
streetscape improvements along the BRT corridor, providing both an aesthetic<br />
benefit and enhanced livability for the neighboring community.<br />
Some ways that BRT systems affect the visual environment include:<br />
4-40<br />
Vehicle impacts—BRT<br />
vehicles do not require overhead wires, eliminating<br />
one potential element <strong>of</strong> “visual pollution.”<br />
Station impacts—Stations<br />
relate to surrounding communities and create<br />
new structures that should be in harmony with the surrounding landscape.<br />
Running way impacts—BRT<br />
systems can include major landscaping and<br />
other aesthetic improvements along the BRT corridor. It is also possible<br />
to incorporate landscaping effects within the BRT running way itself to<br />
enhance its visual appeal.<br />
Some transit agencies incorporate bike and walking paths along BRT running<br />
ways, enhancing overall livability.<br />
The need for soundwalls to protect adjacent neighborhoods from BRT<br />
vehicle noise can detract from the look <strong>of</strong> the running way.<br />
Other Factors Affecting Environmental Quality<br />
There are additional environmental impacts from transit systems that are not<br />
evaluated in this report that may have an impact on public health and air quality.<br />
These include:<br />
Unregulated Air Toxics:<br />
In recent years, public <strong>of</strong>ficials have become<br />
aware <strong>of</strong> significant health problems caused by previously unregulated air<br />
toxics. As a result, EPA has been developing a regulatory framework for<br />
these emissions; however, there has not yet been a rule promulgated for<br />
transit bus engines.<br />
Sulfur Dioxide:<br />
While diesel-burning buses emit sulfur dioxide, which<br />
causes acid rain, most emissions are from stationary sources such as power<br />
plants. In addition, diesel buses’ sulfur emissions will be significantly reduced<br />
due to EPA’s ULSD standard, which went into effect nationwide in<br />
2006. By 2010, all highway diesel fuel must be ULSD.<br />
Solid and Liquid Wastes:<br />
All transit operations will generate some solid<br />
and liquid waste products. While transit agencies should seek to limit these<br />
products by using sustainable practices, this issue is not unique to BRT and<br />
is not covered in this document.<br />
In addition, there are many factors that affect the level <strong>of</strong> environmental benefit<br />
provided by a transit system that are beyond the control <strong>of</strong> the agency. Some <strong>of</strong><br />
these factors are:<br />
emissions standards <strong>of</strong> private cars and other private transport<br />
emissions standards <strong>of</strong> freight, air and water transport<br />
levels <strong>of</strong> commercial vehicle traffic<br />
policies that may encourage public transportation over private vehicle use,<br />
such as parking restrictions, HOT lanes, funding apportionments for road<br />
building vs. public transportation infrastructure, etc.
corridor restrictions that limit the ability to implement landscaping and<br />
other aesthetic improvements<br />
Finally, it is important to acknowledge that there are many other activities in a<br />
region that affect environmental quality. The location and types <strong>of</strong> industries and<br />
commercial activities, the organization <strong>of</strong> land development patterns, and local<br />
climatic conditions all affect environmental quality. All <strong>of</strong> these factors cannot be<br />
controlled by an individual transit agency or even a municipal jurisdiction.<br />
Summary <strong>of</strong> Impacts on Environmental Quality<br />
This section summarizes the state <strong>of</strong> research on BRT systems’ impact on each <strong>of</strong><br />
the environmental quality factors.<br />
Criteria Pollutants<br />
<strong>Transit</strong> agencies in the United States typically do not conduct a system-wide<br />
emissions impact analysis once a transit service is in operation. Consequently,<br />
there are no studies quantifying the effect on local or regional criteria pollutant<br />
levels <strong>of</strong> BRT systems in the United States. <strong>Transit</strong> agencies are required to<br />
estimate the potential emissions impact <strong>of</strong> new transit service in Environmental<br />
Impact Assessments and, until recently, the New Starts funding process. A review<br />
<strong>of</strong> recent and planned BRT projects’ environmental analyses showed that<br />
BRT does provide a long-term emissions benefit, although the total reduction<br />
is small. On average, the BRT projects reduced vehicle emissions <strong>of</strong> CO, NOx,<br />
VOCs, and PM by less than one percent over No Build or Transportation System<br />
Management (TSM) alternatives. These levels are comparable to the emissions<br />
projections <strong>of</strong> other rapid transit projects.<br />
One <strong>of</strong> the few BRT systems to analyze emissions impacts using actual service<br />
data, Mexico City’s Metrobús, provides valuable documentation <strong>of</strong> a BRT’s positive<br />
impact on local criteria pollutants and greenhouse gases, as well as insight<br />
into the factors contributing to these reductions. Details are discussed in the<br />
section on System Performance Pr<strong>of</strong>iles.<br />
Greenhouse Gas emissions<br />
Limited research exists that analyzes the potential impact <strong>of</strong> bus rapid transit<br />
on greenhouse gas emissions. However, some recent research suggests that BRT<br />
can have a positive effect:<br />
BRT System Benefits<br />
A 2005 Journal <strong>of</strong> Public Transportation article found that BRT using low<br />
emission vehicles such as compressed natural gas or hybrid-diesel would reduce<br />
overall vehicle-related greenhouse gas emissions (Vincent and Jerram<br />
2005). The study attributed the reductions to use <strong>of</strong> low emission vehicle<br />
technology, passenger loads comparable to light rail, and mode shift from<br />
private car travel to the BRT.<br />
A 2005 FTA report also predicted significant reductions in vehicular CO2<br />
emissions by replacing private vehicle travel with BRT. The FTA study<br />
adapted a model developed by the American Public Transportation Association<br />
designed to quantify the impact <strong>of</strong> public transit on vehicle emissions<br />
and energy use. The FTA version <strong>of</strong> the model calculates the emissions<br />
that would result if BRT passenger miles replaced private vehicle travel. The<br />
model predicted that a 40-mile BRT corridor, based on the Los Angeles<br />
Metro Rapid design, provides a 70 to 74 percent reduction in annual CO2<br />
emissions, depending on the BRT vehicle fuel.<br />
A 2005 study by Wright and Fulton examined the effect <strong>of</strong> mode-shifting<br />
scenarios on CO2 emissions for developing countries. The study predicts<br />
that the largest and most cost effective emissions reductions would come<br />
from implementing BRT systems with pedestrian and cycling improvements<br />
to reduce the level <strong>of</strong> private car travel. This was more effective than implementing<br />
clean bus technologies or implementing BRT without additional<br />
improvements.<br />
As with criteria pollutants, there is little documentation <strong>of</strong> the impact BRT systems<br />
have had on GHG emissions. The best analysis has been completed by<br />
Bogotá to qualify the Transmilenio BRT for carbon trading credits. This effort is<br />
described in the section on System Performance Pr<strong>of</strong>iles.<br />
Noise and Visual Impacts<br />
There are no systematic evaluations <strong>of</strong> noise from BRT systems, so the primary<br />
evidence for any noise impacts is anecdotal. The same is true for visual impacts,<br />
which cannot be measured in any systematic manner. See the section on System<br />
Performance Pr<strong>of</strong>iles for anecdotal experiences <strong>of</strong> BRT’s noise and visual<br />
impacts.<br />
4-41
BRT System Benefits<br />
System Performance Pr<strong>of</strong>iles<br />
Mexico City<br />
Mexico City has more than 20 million inhabitants, who make over 30 million<br />
vehicular trips each day. Between 70 and 80 percent <strong>of</strong> all daily person trips are<br />
by public transport, including 4.5 million trips on the subway. There are roughly<br />
28,000 bus concessions in the city, about 70 percent <strong>of</strong> which are microbuses.<br />
In 2005, the city opened the BRT service Metrobús on Avenida de los Insurgentes,<br />
an 18-mile avenue in the heart <strong>of</strong> Mexico City. Metrobús serves 12 miles <strong>of</strong><br />
Insurgentes with 97 new articulated diesel BRT vehicles.<br />
A March 2006 study (Instituto Nacional de Ecologia 2006) analyzed the greenhouse<br />
gas time savings impact <strong>of</strong> Metrobús since it began operating in June 2005.<br />
Using data on vehicle activity and speeds collected during Metrobús service, the<br />
study calculated BRT vehicle emissions and estimated the emissions that would<br />
have occurred from the trips replaced by the BRT. The authors then developed<br />
an emissions impact projection for 2005 to 2010, with the BRT reducing all pollutants,<br />
as shown below:<br />
4-42<br />
Exhibit 4-21: Emissions Impact <strong>of</strong> Metrobus Vehicles<br />
vs. Trips Replaced<br />
Pollutant Reduction in 2006<br />
Average annual reduction,<br />
2005 - 2010<br />
Total hydrocarbons 194 metric tons 144 metric tons<br />
NOx 824 metric tons 690 metric tons<br />
PM 2.5 4.4 metric tons 2.8 metric tons<br />
The study estimated that the health benefits <strong>of</strong> reduced criteria pollutant emissions<br />
were worth approximately $3 million per year from 2006 to 2010.<br />
Mexico City is also working on a methodology to qualify for credits under the<br />
Kyoto Protocol’s Clean Development Mechanism (CDM). The methodology is in<br />
development, but Metrobús operational data collected for the CDM model was<br />
used in the March 2006 study to estimate CO2 emissions impacts. The study<br />
authors estimate that, from 2005 to 2015, the Metrobús corridor will eliminate<br />
280,000 tons <strong>of</strong> CO2-equivalent emissions.<br />
Bogotá<br />
Bogotá has roughly seven million inhabitants, and more than half <strong>of</strong> its daily trips<br />
are on public transportation. Transmilenio is a 25.6-mile BRT system (with feeder<br />
buses) that uses 160-passenger, biarticulated diesel buses to carry 1.3 million<br />
passengers per average weekday. Prior to Transmilenio, public transportation in<br />
Bogotá was provided almost exclusively by private buses.<br />
Transmilenio is the first transit system to be certified for greenhouse gas emission<br />
credits under the Kyoto Protocol’s CDM. The CDM helps developing countries<br />
finance sustainable development by allowing them to sell credits for reductions<br />
in GHG on a carbon trading market. Transmilenio’s GHG benefits were calculated<br />
after an extensive data collection effort and construction <strong>of</strong> a methodology<br />
that can be used by other developing countries to quantify the GHG impact<br />
<strong>of</strong> BRT. According to the CDM methodology, the Transmilenio reduces nearly<br />
250,000 tons <strong>of</strong> CO2 equivalent gases per year.<br />
The 2007 BRT Planning Guide published by the Institute for Transportation and<br />
Development Policy (ITDP) examined the impact <strong>of</strong> TransMilenio emissions<br />
within the Bogotá region. They found that one <strong>of</strong> the important mechanisms<br />
for achieving these results was the mode shift from private cars to public transit<br />
that resulted from the dramatic improvements in transit service quality provided<br />
by the BRT (i.e., travel time, comfort, security, cleanliness) (Institute for<br />
Transportation and Development Policy 2007).<br />
Lane <strong>Transit</strong> District EmX Green Line<br />
The Lane <strong>Transit</strong> District (LTD) conceived its BRT service, the EmX, as a “green”<br />
system. The EmX Green Line serves Eugene and Springfield, Oregon. The<br />
“green” design elements are an important part <strong>of</strong> the system branding, meant<br />
to complement the area’s natural environment. Some <strong>of</strong> the environmental elements<br />
are:<br />
a hybrid-electric bus fleet<br />
a grass median strip along portions <strong>of</strong> the busway, which enhances the<br />
visual appeal <strong>of</strong> the paved busway and absorbs oil discharge from the bus<br />
extensive landscaping with native plants along the corridor and at stations<br />
a new Springfield bus terminal built to meet national “green building” standards
Los Angeles Orange Line<br />
The Los Angeles Orange Line BRT <strong>of</strong>fers several examples <strong>of</strong> potential noise and<br />
visual impacts from BRT. After the launch <strong>of</strong> the Orange Line in 2005, Metro received<br />
complaints from neighbors along the busway about noise from the 60-ft<br />
CNG buses, which ran at 7- to 12-minute peak headways. Metro responded by<br />
redirecting the CNG vehicles’ exhaust pipes to vent away from the residences<br />
alongside the running way. The agency also installed soundwalls along portions<br />
<strong>of</strong> the busway.<br />
Los Angeles is the only U.S. BRT system to experiment with a new noise reduction<br />
strategy: paving portions <strong>of</strong> the Orange Line busway with rubberized asphalt designed<br />
to minimize tire noise. However, the rubberized asphalt significantly deteriorated<br />
after only one year <strong>of</strong> operation and was replaced with conventional<br />
pavement. As <strong>of</strong> the writing <strong>of</strong> this report, the LA transit agency was working to<br />
definitively determine the cause <strong>of</strong> this problem (Callaghan and Vincent 2007).<br />
The Orange Line is also a good example <strong>of</strong> using landscaping along the BRT corridor<br />
to provide environmental improvements. The Orange Line corridor features<br />
77 acres <strong>of</strong> landscaping with over 800,000 plantings and an irrigation system.<br />
Metro selected native plants that could tolerate drought conditions to minimize<br />
water use (Woodbury 2007).<br />
BRT Elements by System and Environmental Quality<br />
The following section provides available data from worldwide BRT systems on<br />
the use <strong>of</strong> clean vehicles and the ability to impact mode share.<br />
Mode Shift<br />
The results for BRT systems are mixed, but data from operating BRTs demonstrates<br />
that BRT can induce mode shift from private cars to transit:<br />
Exhibit 4-22: Percentage <strong>of</strong> BRT Riders<br />
Shifted from Private Motor Vehicles<br />
BRT Corridor<br />
BRT System Benefits<br />
Percent <strong>of</strong> Ridership From Private<br />
Motor Vehicles<br />
Albuquerque Rapid Ride 33%<br />
Boston Silver Line Washington Street 2%<br />
Boston Silver Line Airport 19.6%<br />
Boston Silver Line BMIP 49.5%<br />
Las Vegas MAX 10%<br />
Los Angeles Orange Line 33%<br />
Oakland San Pablo Rapid 19%<br />
Halifax Metro<strong>Link</strong> (all line) 23-28%<br />
This ability <strong>of</strong> BRT to shift trips from private automobiles to transit is analyzed at<br />
greater length in Section 4.1.4 on BRT’s ridership impacts.<br />
Clean Vehicle Use<br />
In the United States, the transit industry is moving toward greater use <strong>of</strong> alternative<br />
propulsion systems and fuels to reduce emissions and improve fuel<br />
economy. A high percentage <strong>of</strong> BRT systems have been deploying alternative<br />
propulsion buses, with over half <strong>of</strong> those opened since 2004 using either CNG<br />
or hybrid vehicles. In August 2008, WestStart-Calstart published a Vehicle Demand<br />
Analysis. This report surveyed U.S. transit agencies that are planning or<br />
building BRT services. The report’s preliminary findings indicate that U.S. transit<br />
agencies are increasingly interested in using alternative fuel vehicles such as<br />
hybrid-electric, CNG, and biodiesel for their BRT systems. The study found that,<br />
<strong>of</strong> 63 communities planning some form <strong>of</strong> BRT service between 2007 and 2017,<br />
a majority were planning to implement an alternative fuel technology. Hybrids<br />
were the most popular alternative fuel option, with 40 percent <strong>of</strong> the communities<br />
planning or using hybrid buses; 31 percent were committed to CNG, and 12<br />
percent were using biodiesel. This tendency is even more pronounced among<br />
communities planning full-featured BRT. WestStart surveyed 20 communities<br />
planning or building a full-featured BRT system and found that 12 were committed<br />
to deploying hybrid technology, four were committed to CNG, and one<br />
planned on using biodiesel (Weststart-CALSTART 2008).<br />
4-43
BRT System Benefits<br />
The use <strong>of</strong> alternative fuels is much less common outside the U.S. Of the systems<br />
that provided data for this report, there were only four that used vehicles<br />
powered by alternative fuels: Halifax, which uses biodiesel for its Metrolink BRT;<br />
Eindhoven, which used an LPG-electric hybrid; Caen, which uses dual-mode vehicles;<br />
and Brisbane, which uses both diesel and CNG buses.<br />
Exhibit 4-23: Summary <strong>of</strong> U.S. BRT System<br />
Vehicle Propulsion Technologies<br />
4-44<br />
BRT System Vehicle Configuration<br />
Propulsion System<br />
and Fuel<br />
Albuquerque Rapid Ride Articulated Hybrid diesel electric,<br />
ULSD<br />
Boston Silver Line Washington Street Stylized articulated CNG<br />
Boston Silver Line Waterfront Stylized articulated Dual-mode diesel and<br />
electric, ULSD<br />
Chicago Neighborhood Express Conventional standard Diesel, ULSD<br />
Cleveland Health Line (opens 2008) Stylized articulated Hybrid diesel electric<br />
Eugene EmX Green Line Stylized Articulated Hybrid Diesel Electric<br />
Foothill <strong>Transit</strong> Silver Streak Stylized Articulated Hybrid Diesel Electric<br />
Kansas City MAX Stylized 40’ Clean diesel<br />
Las Vegas MAX Stylized articulated Hybrid diesel electric<br />
Los Angeles Metro Rapid Stylized standard and<br />
articulated<br />
CNG<br />
Los Angeles Orange Line Stylized articulated CNG<br />
Miami Busway Conventional standard<br />
and articulated<br />
Diesel, CNG, hybrid<br />
Oakland San Pablo Rapid Bus Stylized 40’ Diesel<br />
Orlando LYMMO Standard Diesel, ULSD<br />
Phoenix RAPID Specialized standard LNG<br />
Pittsburgh Busways Conventional Standard<br />
and articulated<br />
Santa Clara VTA Rapid 522 Stylized standard and<br />
articulated<br />
Diesel<br />
Diesel, ULSD<br />
Sacramento Ebus Standard 40’ CNG
ConClusions and summary<br />
The preceding chapters <strong>of</strong> this report encapsulate the experience<br />
with BRT. Chapter 2 presented a summary <strong>of</strong> the primary physical,<br />
operational, and cost characteristics <strong>of</strong> BRT, organized by the<br />
six major elements <strong>of</strong> BRT: Running Ways, Stations, Vehicles, Fare Collection,<br />
ITS, and the Service and Operations Plan. Chapter 3 highlighted<br />
the attributes <strong>of</strong> performance affected by the BRT system elements:<br />
Travel Time, Reliability, Image and Identity, Passenger Safety and Security,<br />
System Capacity, and Accessibility. Chapter 4 discussed the major<br />
benefits that BRT systems affect: High Ridership, Capital Cost Effectiveness,<br />
Operating Cost Efficiency, <strong>Transit</strong> Supportive Land Development,<br />
and Environmental Quality. Each <strong>of</strong> these chapters included illustrations<br />
<strong>of</strong> specific BRT experience and summaries <strong>of</strong> BRT systems in the United<br />
States and around the world. This presentation <strong>of</strong> the BRT experience<br />
along three dimensions is intended to allow the reader to glean insights<br />
about BRT from any perspective.<br />
This chapter concludes the report in two major ways. First, it provides<br />
an overview <strong>of</strong> BRT experience as presented in the core <strong>of</strong> the report.<br />
Second, it describes the role <strong>of</strong> the report as a living and dynamic document,<br />
intended to reflect the evolving knowledge base related to BRT.<br />
summary oF BrT EXPEriEnCE<br />
summary <strong>of</strong> BrT Elements<br />
Experience in the United States suggests that implementation <strong>of</strong> more<br />
complex BRT system elements is just beginning. Implementation <strong>of</strong><br />
running ways, stations, and vehicles suggests a wide variety <strong>of</strong> applications.<br />
Some <strong>of</strong> the more quickly implemented projects demonstrated<br />
the least amount <strong>of</strong> investment in BRT system elements.<br />
Ch a r aC t e r i s t iC s o f Bu s ra p i d tr a n s i t f o r deCision-Ma k i n g 5-1
Conclusions and Summary<br />
running Ways<br />
BRT systems in North America incorporate all types <strong>of</strong> running ways—mixed<br />
flow arterial operation (Los Angeles, York), mixed flow freeway operation (Phoenix),<br />
dedicated arterial lanes (Boston, Orlando), at-grade transitways (Cleveland,<br />
Eugene, Los Angeles, Miami), fully grade-separated surface transitways (Pittsburgh,<br />
Ottawa), and transitways with some underground operation (Boston).<br />
Overall, use <strong>of</strong> on-street running ways, either mixed-flow or dedicated, continues<br />
to dominate BRT in the United States. However, there have been more dedicated<br />
guideway BRT projects since 2004—both median on-street busways built in Eugene<br />
and Cleveland and the dedicated busway built in Los Angeles. In Europe,<br />
Australia, Latin America, and China, most BRT systems do not operate in mixedflow<br />
lanes, and completely grade-separated busways are common. Use <strong>of</strong> running<br />
way guidance is most common in Europe; few BRT systems elsewhere utilize<br />
either optical or mechanical guidance systems. The only recent BRT system in<br />
the U.S. to implement mechanical guidance is Cleveland. In the United States,<br />
the use <strong>of</strong> unique running way markings to differentiate BRT running ways has<br />
become more common, with signage and striping the most common markings<br />
employed. Some systems, such as the Eugene EmX, use different-colored pavement,<br />
both to differentiate the busway from mixed-flow lanes and to articulate<br />
a distinct brand identity.<br />
stations<br />
There has been a broad range <strong>of</strong> sophistication and design attention in BRT stations.<br />
Almost universally, BRT station designs are significantly different than those<br />
<strong>of</strong> standard local bus stops; the level <strong>of</strong> investment in the stations has generally<br />
been related to the level <strong>of</strong> investment in running way infrastructure. Exclusive<br />
transitways are most <strong>of</strong>ten paired with the most extensive and elaborate station<br />
infrastructure. With more BRT systems in the United States implementing<br />
dedicated busways (although these are still in the minority), there is also greater<br />
investment in stations. The station design also suggests that they are considered<br />
an important part <strong>of</strong> the system branding identity and, in some cases, are being<br />
designed to integrate effectively into the surrounding streetscape. Most <strong>of</strong> these<br />
are still simply enhanced stations, not station buildings, although the MBTA<br />
built two underground stations for the Silver Line Waterfront BRT in Boston. It is<br />
mainly outside the U.S. where cities build substantial enclosed station structures<br />
similar to those found in rail lines. Cities such as Brisbane, Bogotá, Guayaquil, and<br />
Pereira have made significant investments in BRT station infrastructure.<br />
5-2<br />
Level boarding is common in Latin American and European systems. Curitiba,<br />
Brazil and Bogotá, Colombia have the most noteworthy and early level boarding<br />
systems. Many European cites use some type <strong>of</strong> lateral guidance treatment, as<br />
noted below in the ITS Summary. In the United States, Canada, and Australia,<br />
few BRT systems have true level boarding (the Cleveland HealthLine and Las Vegas<br />
MAX are among the few), although some do have raised platforms (Los Angeles<br />
Orange Line) or near-level boarding (Eugene EmX). As would be expected,<br />
passing capability and multiple vehicle berths at station platforms are directly<br />
correlated with degree <strong>of</strong> running way separation. Systems with <strong>of</strong>f-street guideways,<br />
such as Miami, Los Angeles, Ottawa, Pittsburgh, and several Australian<br />
BRT systems, provide additional lanes for passing and longer platforms for multiple<br />
vehicle berthing. On-street running ways typically do not allow several vehicles<br />
to stop at one time and use bus pullouts rather than passing lanes due to<br />
right-<strong>of</strong>-way constraints.<br />
The mix <strong>of</strong> station amenities varies across systems. The most common station<br />
amenities focus on passenger comfort with seating, lighting, and trash receptacles.<br />
Many systems are incorporating real-time schedule and/or vehicle arrival<br />
information, as is noted in the ITS Summary below. Other communications infrastructure<br />
such as public telephones and emergency telephones are starting to<br />
be installed in systems.<br />
Most BRT systems around the world have intermodal transfer facilities where<br />
there are specially-designed interfaces with other bus services and rail rapid transit<br />
systems. In the United States, stations with park-and-ride facilities are generally<br />
part <strong>of</strong> systems with exclusive transitways (e.g., Miami-Dade South Busway,<br />
Pittsburgh busways, Los Angeles Orange Line) or where the BRT connects to a<br />
rail station (San Jose Rapid). Park-and-ride stations are less common outside the<br />
U.S. but still are found in some BRT systems, especially in Australia.<br />
Vehicles<br />
Distinct vehicles are a very common element in United States BRT systems, while<br />
their use in the rest <strong>of</strong> the world varies. In the United States, almost all BRT<br />
systems use vehicles with a distinct livery, at a minimum, and many use vehicles<br />
with specialized exterior styling and interior amenities such as more comfortable<br />
seating, higher quality materials and finishes, and better lighting. It is also very<br />
common for United States BRT vehicles to use alternative propulsion systems,<br />
primarily CNG or diesel-hybrid.
A mix <strong>of</strong> standard and articulated vehicles reflects the different levels <strong>of</strong> demand<br />
and capacity requirements across all BRT systems. In the United States, a majority<br />
<strong>of</strong> BRT systems have at least some articulated vehicles in the fleet, with several<br />
served exclusively by articulated buses. However, use <strong>of</strong> articulated vehicles is<br />
much more common in systems that require very high capacities, such as those<br />
in Latin America, several in Europe, and China. An exception is the Brisbane busway<br />
system, which reaches very high capacities while using standard buses.<br />
Distinct vehicle styling is a strong component in the Latin American and European<br />
systems but is not utilized in the Australian systems. Alternative propulsion<br />
systems are significantly less common outside the United States, with most using<br />
diesel powertrains.<br />
Fare Collection<br />
Most United States BRT systems continue to use on-board fare payment systems.<br />
However, a few systems have implemented alternate fare collection processes<br />
in an effort to reduce dwell times. Because U.S. systems typically do not<br />
feature enclosed stations, the most commonly-used <strong>of</strong>f-board method is either<br />
a pro<strong>of</strong>-<strong>of</strong>-payment system or use <strong>of</strong> transit passes. By contrast, Latin American<br />
BRT systems have enclosed stations that allow them to use barrier-enforced <strong>of</strong>fboard<br />
payment. The European and Canadian systems typically use on-board or<br />
pro<strong>of</strong>-<strong>of</strong>-payment methods, while the Australian BRT systems all utilize pay-onboard<br />
fare collection.<br />
Electronic fare collection using magnetic-stripe cards or smart cards is slowly<br />
being incorporated into BRT systems, but implementation is largely driven by<br />
agency-wide implementation rather than BRT-specific implementation. Smart<br />
cards are gaining wider application than magnetic-stripe cards among BRT systems.<br />
iTs<br />
The most commonly-deployed ITS applications are Operations Management<br />
Systems, especially Automatic Vehicle Location, and <strong>Transit</strong> Signal Priority,<br />
which is especially common for cities seeking to improve travel times without<br />
building dedicated guideways. Real-time traveler information at stations and on<br />
vehicles is becoming increasingly common. Installation <strong>of</strong> security systems such<br />
as emergency telephones at stations and closed-circuit video monitoring is becoming<br />
much more common in the United States, but less so in other worldwide<br />
BRT systems. Use <strong>of</strong> Intelligent Vehicle Systems such as precision docking, lateral<br />
Conclusions and Summary<br />
guidance, or collision avoidance is rare, although, as already noted, some European<br />
BRT systems frequently employ some method <strong>of</strong> precision docking.<br />
service and operating Plans<br />
In general, the structure <strong>of</strong> routes and type <strong>of</strong> service correlates with the degree<br />
<strong>of</strong> running way exclusivity. Since most U.S. BRT systems operate on-street, there<br />
is less opportunity for them to incorporate a variety <strong>of</strong> service routes; most use<br />
single, all-stop routes. The two notable exceptions are Miami-Dade’s at-grade<br />
South Busway and Pittsburgh’s grade-separated transitways, which operate with<br />
integrated networks that include routes that serve all stops and a variety <strong>of</strong> feeders<br />
and express routes with integrated <strong>of</strong>f-line and line-haul operation. This is<br />
the type <strong>of</strong> BRT network plan used for the Latin American BRT systems, the Ottawa<br />
<strong>Transit</strong>way, and the Brisbane busways. These systems have integrated their<br />
citywide bus service to feed into the busways and accommodate multiple routes<br />
<strong>of</strong>fering all-stop, limited-stop, and express service.<br />
Service hours and frequencies correlate with demand and degree <strong>of</strong> running way<br />
segregation in the respective corridors; however, most BRT systems <strong>of</strong>fer all-day<br />
service and peak-hour frequencies <strong>of</strong> 12 minutes or less. Typically, BRT systems<br />
on arterials operate with headways between 5 and 15 minutes. Services operating<br />
on exclusive running ways have much higher frequencies, with at-grade running<br />
ways typically showing 4- to 10-minute headways, while grade-separated<br />
running way frequencies typically have headways less than 5 minutes.<br />
Station spacing generally falls between one-half to one mile. A few BRT systems<br />
do show closer station spacing, down to as little as one-quarter mile, which is<br />
comparable to local bus service. Most, however, achieve one-half-mile spacing<br />
at a minimum, with a few <strong>of</strong> the express services showing even longer station<br />
spacing.<br />
Branding Elements<br />
Experience shows that it is more common than not for BRT systems to be marketed<br />
with some differentiation, most <strong>of</strong>ten as a separate tier <strong>of</strong> service—either<br />
as a service differentiated from local lines or as an entire package <strong>of</strong> BRT elements,<br />
such as the transitways in Miami, Ottawa, and Brisbane. Some locations,<br />
such as Boston and Los Angeles, do market BRT lines (the Silver Line and Orange<br />
Line, respectively) as part <strong>of</strong> the regional rapid transit system, equating the BRT<br />
lines with rail lines.<br />
5-3
Conclusions and Summary<br />
Use <strong>of</strong> branding devices is also very common. When BRT elements are implemented<br />
systemwide, some differentiation with a brand name is most <strong>of</strong>ten employed.<br />
Especially in newer systems, logos and designated colors are <strong>of</strong>ten applied.<br />
Use <strong>of</strong> designated colors is <strong>of</strong>ten used where the goal is to differentiate<br />
from local service and the service plan is <strong>of</strong> a single line nature, rather than an<br />
integrated network (with trunk and branches). This is true in mixed-flow BRT<br />
systems, such as the Metro Rapid in Los Angeles and the Rapid systems in Oakland<br />
and Phoenix. This is also true with newer systems such as the EmX in Eugene<br />
and the HealthLine in Cleveland.<br />
summary <strong>of</strong> BrT Performance<br />
Travel Time<br />
Overall, BRT systems are reporting improvements in travel time over previous<br />
corridor travel times or existing local bus service. Improvements range from 5 to<br />
70 percent, with the median percentage improvement at 25 percent, due mainly<br />
to the large number <strong>of</strong> on-street running way BRTs in the U.S. The strongest indicator<br />
<strong>of</strong> improved travel time is the level <strong>of</strong> running way segregation, and most<br />
systems with less than 25 percent improvement operate on-street in mixed traffic<br />
lanes. The systems with the highest reported travel time savings <strong>of</strong> 40 percent<br />
or higher were those with grade-separated busways. One notable exception is<br />
busways with at-grade intersections, which can require slower bus speeds due<br />
to safety concerns. Few BRT systems provided any data on performance relating<br />
to other travel time indicators such as dwell time or wait and transfer time.<br />
Dwell time, in particular, would be a valuable measurement since BRT systems<br />
are increasingly investing in fare collection, level boarding, and multiple-door<br />
vehicles—features intended to reduce dwell time.<br />
reliability<br />
The key reliability performance indicator for BRT systems is Ratio <strong>of</strong> Maximum<br />
Time to Unconstrained Time, determined by dividing the peak-hour end-to-end<br />
travel time by the non-peak end-to-end travel time. A ratio higher than 1:00 indicates<br />
that peak travel times are longer than non-peak, and the higher the ratio,<br />
the more variable the travel time.<br />
Not surprisingly, the ratio is typically lower for BRT systems that operate along<br />
dedicated or exclusive lanes than for those systems that operate within a mixedflow<br />
environment. Of the systems that provided data for this report, almost all<br />
that operate on a segregated running way have a ratio <strong>of</strong> 1.0 to 1.2. For systems<br />
5-4<br />
that operate along mixed-flow lanes, this ratio was typically higher, particularly<br />
in regions suffering from heavy local traffic conditions. Unlike with travel times,<br />
segregated running ways with at-grade intersection crossings do not appear to<br />
suffer a performance penalty for reliability.<br />
image and identity<br />
Only a few BRT systems report having conducted in-depth passenger surveys to<br />
measure performance in achieving a distinct brand identity. However, results <strong>of</strong><br />
several customer satisfaction surveys have been good. For example, passengers<br />
on the Los Angeles Orange Line rated the MetroLiner vehicles highly; 79 percent<br />
<strong>of</strong> riders on Oakland’s San Pablo Rapid rated the vehicle look as good or very<br />
good, while 90 percent rated ease <strong>of</strong> identifying service as good or very good.<br />
Other customer service surveys in Los Angeles, Kansas City, and Las Vegas have<br />
reported very high customer satisfaction ratings.<br />
In the United States, there is a very strong interest in the branding element <strong>of</strong> BRT,<br />
with vehicles the most commonly-used feature to convey a distinct, high-quality<br />
image. Vehicles are also a strong branding element in Europe and Latin America.<br />
Other systems, such as Brisbane and Ottawa, rely on the fully grade-separated<br />
running way to convey the BRT brand and utilize conventional vehicles.<br />
safety and security<br />
Very few systems have reported any safety data, on either vehicle or passenger<br />
safety, so it is not possible to draw any statistically-significant relationships<br />
between elements and performance. A few have reported both positive and<br />
negative results. Pittsburgh reported fewer bus accidents on the East Busway<br />
corridor once the Busway was opened, not surprising since the East Busway is<br />
fully grade-separated. Many systems with <strong>of</strong>f-street busways operate with atgrade<br />
intersection crossings, a feature that has been identified with increased<br />
accidents between buses and other vehicle traffic or pedestrians. For example,<br />
the Los Angeles Orange Line had several incidents shortly after the at-grade busway<br />
opened. However, recent performance data provided by Metro show that<br />
the Orange Line has a much lower accident rate per mile than the Metro Rapid<br />
service, which operates in mixed traffic. This suggests that greater opportunities<br />
for accidents occur with buses operating in mixed traffic than in at-grade busways.<br />
With limited data reported on safety, however, it is not possible to draw<br />
any definitive conclusions.
Capacity<br />
The primary capacity performance measure provided for this report is Maximum<br />
Critical <strong>Link</strong> Throughput data. The data on this measurement support<br />
the theory that vehicle capacity, station capacity, and running way capacity are<br />
the primary elements impacting total person capacity for a BRT system. The<br />
other element that strongly correlates with maximum throughput is frequency<br />
<strong>of</strong> service. Maximum capacity appears to result from a combination <strong>of</strong> these elements,<br />
rather than any one element being the dominant determinant. In general,<br />
as systems add more intensive elements and more investment, this is reflected<br />
in increased capacity.<br />
The BRT systems with the lowest capacity levels are typically those with onstreet<br />
operations (the most common running way type in the U.S.), less substantial<br />
stations, and standard size vehicles. These systems typically have maximum<br />
capacities from 200 to 400 passengers per direction per hour since they reflect<br />
the low number <strong>of</strong> peak hours buses operated. Systems that can accommodate<br />
600 to 850 passengers per direction per hour typically feature more intensive<br />
elements. The systems that reported passenger capacities between 1,000 and<br />
1,264 passengers per direction per hour operate primarily in exclusive busways,<br />
most located <strong>of</strong>f-street and typically with higher capacity stations; some, but not<br />
all, use articulated vehicles. The five systems that reported passenger capacities<br />
between 2,400 and 5,000 passengers per direction per hour operate on <strong>of</strong>f-street<br />
busways with articulated vehicles. The systems in the world with the highest<br />
reported capacity are Kunming’s BRT network, Brisbane’s South East Busway,<br />
and Bogotá’s Transmilenio, with capacities <strong>of</strong> 15,000 to 45,000 passengers per<br />
direction per hour. These are all BRT networks or services that accommodate<br />
multiple lines and operate <strong>of</strong>f-street with very substantial stations and extremely<br />
high frequencies.<br />
accessibility<br />
Data on accessibility performance for BRT systems are not as readily available.<br />
BRT systems are implementing features intended to improve accessibility for all<br />
passengers, such as low-floor buses, near-level or level-boarding, and vehicle stop<br />
announcements.<br />
Conclusions and Summary<br />
Summary <strong>of</strong> BRT System Benefit Experience<br />
ridership<br />
There have been increases in transit ridership in virtually all corridors where BRT<br />
has been implemented. Increases in BRT ridership have come from both individuals<br />
that used to use transit and totally new transit users that have access to<br />
automobiles.<br />
Data on BRT systems around the world reveal a wide range <strong>of</strong> ridership increases,<br />
from as little as 5 percent to well over 100 percent. Typically, increases are at<br />
least around 35 percent, and many are significantly higher. However, it is difficult<br />
to compare the reported results from various systems, since some systems are<br />
reporting ridership numbers after years <strong>of</strong> operation, others only months. The<br />
data confirm the connection between ridership totals and the type <strong>of</strong> running<br />
way, vehicle, and station elements deployed and service frequency. The ridership<br />
figures also confirm that all types <strong>of</strong> BRT systems can attract ridership and that<br />
BRT can accommodate extremely high transit demand. The data also reveal that<br />
some BRT systems can divert trips from private car to transit.<br />
Aggregate analyses <strong>of</strong> ridership survey results continue to suggest two conclusions:<br />
The ridership impact <strong>of</strong> BRT implementation has been comparable to that<br />
experienced with LRT investment <strong>of</strong> similar scope and complexity.<br />
The ridership increases due to BRT implementation tend to exceed those<br />
that would be expected as the result <strong>of</strong> simple level <strong>of</strong> service improvements.<br />
The implication here is that the identity and passenger information<br />
advantages <strong>of</strong> BRT are seen positively by potential BRT customers when<br />
they make their travel decisions.<br />
Capital Cost Effectiveness<br />
BRT demonstrates relatively low capital costs per mile <strong>of</strong> investment. It is worth<br />
noting, however, that several recently-implemented BRT systems have focused<br />
more capital-intensive investments. Depending on the operating environment,<br />
BRT systems are able to achieve service quality improvements (such as travel<br />
time savings <strong>of</strong> 15 to 25 percent and increases in reliability) and ridership gains<br />
that compare favorably to the capital costs and the short amount <strong>of</strong> time to<br />
implement BRT systems. Furthermore, BRT systems are able to operate with<br />
5-5
Conclusions and Summary<br />
lower ratios <strong>of</strong> vehicles compared to total passengers because <strong>of</strong> their greater<br />
passenger capacity.<br />
Operating Cost Efficiency<br />
BRT systems are able to introduce higher operating efficiency and service productivity<br />
into transit systems that incorporate them. Experience shows that<br />
when BRT is introduced into corridors and passengers are allowed to choose BRT<br />
service, corridor performance indicators (such as passengers per revenue hour,<br />
subsidy per passenger mile, and subsidy per passenger) improve. Furthermore,<br />
travel time savings and higher reliability enable transit agencies to operate more<br />
vehicle miles <strong>of</strong> service from each vehicle hour operated.<br />
<strong>Transit</strong>-supportive land development<br />
In places where there has been significant investment in transit infrastructure<br />
and related streetscape improvements, there have been significant positive development<br />
effects. Examples <strong>of</strong> these include Cleveland, Boston, Brisbane, Pittsburgh,<br />
and Ottawa. In some cases, the development has been located adjacent<br />
to the transit facility, while in other places the development has been integrated<br />
with the transit stations. Although there are very good early indications <strong>of</strong> BRT<br />
systems that can attract TOD, experience is not yet widespread enough to draw<br />
definitive conclusions on the factors that would result in even greater development<br />
benefits from BRT investment. Generally, the factors that do contribute<br />
to more development around BRT are the same as those factors that contribute<br />
to more development around rail modes: conducive market conditions and<br />
land use policies. More research on this topic is under way; early indications are<br />
that a significant level <strong>of</strong> infrastructure investment can improve surrounding<br />
streetscapes and provide assurances <strong>of</strong> the permanence <strong>of</strong> the BRT. However,<br />
other BRT lines with minimal running infrastructure—such as the York Region’s<br />
VIVA—are seeing adjacent development activity as well.<br />
Environmental Quality<br />
Documentation <strong>of</strong> the environmental impacts <strong>of</strong> BRT systems is limited. Experience<br />
shows that there is improvement to environmental quality due to a number<br />
<strong>of</strong> factors. Ridership gains suggest that some former automobile users are using<br />
transit as a result <strong>of</strong> BRT implementation. <strong>Transit</strong> agencies are serving greater<br />
passengers with fewer hours <strong>of</strong> operation, potentially reducing emissions. Most<br />
5-6<br />
importantly, transit agencies are adopting vehicles with alternative fuels, propulsion<br />
systems, and pollutant emissions controls.<br />
susTaininG THE CBrT rEPorT<br />
The CBRT report presents a useful compendium <strong>of</strong> information for supporting<br />
BRT planning, design, and operations. This 2008 edition presents a snapshot <strong>of</strong><br />
the collective experience <strong>of</strong> BRT. Since 2004, the experience with BRT has grown,<br />
and this version <strong>of</strong> CBRT has added more useful cases for study. To enhance the<br />
usefulness <strong>of</strong> this report as a key BRT information source, information from additional<br />
experience with BRT systems and lessons learned from their implementation<br />
and operation have been incorporated. Sustained usefulness <strong>of</strong> the report<br />
relies on future updates that incorporate even more experience with future BRT<br />
applications and ongoing research and development activities.<br />
supplemental Evaluation <strong>of</strong> operating BrT Projects<br />
“Characteristics <strong>of</strong> BRT” builds upon a tradition <strong>of</strong> research on the implementation<br />
<strong>of</strong> BRT elements and BRT projects. FTA has completed evaluation efforts<br />
for at least seven BRT projects: Pittsburgh (Martin Luther King Jr. Busway and<br />
West Busway), Miami, Orlando, Boston, Oakland, Honolulu, and Las Vegas. Project<br />
implementation agencies continue their own ongoing individual evaluation<br />
efforts. Future editions <strong>of</strong> this report can continue to incorporate information<br />
from new and updated evaluations <strong>of</strong> operational systems.<br />
Several new topics should get updated reviews, including safety and security,<br />
accessibility, land use, and environmental benefits. Furthermore, more detailed<br />
measurements <strong>of</strong> certain performance measures, such as reliability and customer<br />
satisfaction, can provide a more thorough and qualitative understanding <strong>of</strong><br />
how BRT elements contribute to them.<br />
Evaluation <strong>of</strong> new BrT Projects<br />
BRT projects currently in development can provide additional sources <strong>of</strong> information.<br />
At least four major BRT projects in the United States began operation<br />
between 2004 and 2008 —Orange Line (Los Angeles), EmX (Emerald Express—<br />
Eugene), HealthLine (Euclid Corridor, Cleveland) and Select Bus Service (Fordham<br />
Road in New York City corridor). In addition, the Hartford-New Britain Busway<br />
(Hartford, Connecticut) is on track to be in operation by 2012. These projects
provide new quantitative data and more complete information on the impact<br />
<strong>of</strong> some BRT elements, such as exclusive transitways, pro<strong>of</strong>-<strong>of</strong>-payment fare collection,<br />
and precision docking systems. Furthermore, they can provide useful<br />
project history on how to address issues such as sharing single-lane guideway<br />
sections, operation adjacent to an active railroad, safety at crossings, and operation<br />
<strong>of</strong> vehicles with doors on both sides <strong>of</strong> a vehicle.<br />
Incorporating International Experience<br />
The international community implementing BRT is growing and increasingly is<br />
exchanging information to learn from each other. This report incorporates data<br />
on BRT systems from Canada, Colombia, Europe, Australia, and China through<br />
specific data collection efforts. Additional data collection is necessary to build<br />
a broader database from existing systems in other locations. Data from several<br />
cities in Brazil, long the pioneer in the development <strong>of</strong> BRT systems, especially<br />
one <strong>of</strong> the original BRT systems in Curitiba, and other locations throughout Latin<br />
America, Europe, and Asia will create a more complete picture <strong>of</strong> the broad<br />
applications <strong>of</strong> BRT. Furthermore, new systems are being developed in Africa,<br />
Southeast Asia, and India. Cases from the more developed systems and newer<br />
systems may provide useful lessons.<br />
Compiling Ongoing Information on Performance and Benefits<br />
To draw more definitive conclusions about the implementation <strong>of</strong> BRT, it is <strong>of</strong>ten<br />
important to have a large set <strong>of</strong> data on several systems over a period <strong>of</strong> several<br />
years. While other modes benefit from longstanding efforts for collecting and<br />
reporting data, such as the National <strong>Transit</strong> Database (NTD), a common platform<br />
or methodology for collecting and reporting BRT system data has yet to be<br />
developed. This report represents an attempt to report on BRT experience (major<br />
project elements, performance, and benefits) in a single, unified format. This<br />
edition has attempted to standardize the set <strong>of</strong> data that are collected. Future<br />
updates can benefit from updates to this data set emphasizing three principles:<br />
Consistency—data<br />
collected consistently, with common definitions and<br />
common units <strong>of</strong> measurement allow for effective comparison across projects<br />
Regularity—data<br />
collected at regular intervals, allowing for a characterization<br />
<strong>of</strong> how BRT systems and their performance evolve over time<br />
Conclusions and Summary<br />
Simplicity—data<br />
collected regularly, requiring that the methods to collect<br />
it be simple and easy to understand<br />
incorporating General <strong>Transit</strong> research<br />
This report has drawn heavily upon general research and syntheses <strong>of</strong> experience<br />
in transit, including several documents produced by industry groups such as the<br />
American Public Transportation Association (APTA) and programs such as the<br />
<strong>Transit</strong> Cooperative Research Program (TCRP). The work conducted under the<br />
auspices <strong>of</strong> TCRP Project A-23 and A-23A (TCRP 118) has advanced research on<br />
BRT even further. Future activities <strong>of</strong> TCRP and the Transportation Research<br />
Board (TRB) can explore topics in greater detail and more systematically. Furthermore,<br />
APTA’s BRT standards development efforts can provide useful guidance<br />
for implementation <strong>of</strong> certain BRT elements and interfaces <strong>of</strong> elements.<br />
This report ultimately relies on an openness to knowledge from all potential<br />
sources. This openness to knowledge from the broader transit community acknowledges<br />
the notion that BRT systems include elements that are not exclusive<br />
to BRT. The development <strong>of</strong> BRT systems involves conscious integration <strong>of</strong> several<br />
transit elements that can be implemented independently. Because the experience<br />
in these elements is broad, the body <strong>of</strong> research from which this report<br />
draws should be just as broad. The report can thus serve as a focal point for this<br />
dialogue between the transit research community and BRT system planners.<br />
ClosinG rEmarKs<br />
This edition <strong>of</strong> “Characteristics <strong>of</strong> BRT” represents a snapshot <strong>of</strong> BRT experience<br />
as <strong>of</strong> Summer 2008. Even as it updates the wealth <strong>of</strong> data and information with<br />
four years <strong>of</strong> additional experience, there is much about BRT that can be explored<br />
further. This report will continue to be a dynamic document, one that<br />
evolves along with the experience <strong>of</strong> the global transit community with BRT. As<br />
the number and sophistication <strong>of</strong> BRT applications increases, “Characteristics <strong>of</strong><br />
BRT” will reflect this experience in future editions. Data on system experience<br />
in future editions will allow for the analyses to be more robust and for lessons<br />
learned to be more definitive. The <strong>Federal</strong> <strong>Transit</strong> <strong>Administration</strong> encourages<br />
the use <strong>of</strong> this document as a tool to disseminate information on the evolution<br />
<strong>of</strong> BRT to the transit community.<br />
5-7
eferences<br />
APTA (2007). “Contactless Fare Media System Standard, Part I (Introduction<br />
and Overview).”<br />
Baltes, M., V. Perk, J. Perone, and C. Thole (2003). “South Miami-Dade Busway<br />
System Summary.” National Bus Rapid <strong>Transit</strong> Institute, University <strong>of</strong> South<br />
Florida.<br />
Ben-Akiva, M., and T. Morikawa (2002). “Comparing Ridership Attraction <strong>of</strong><br />
Rail and Bus.” Transport Policy 9: 107-116.<br />
Booz Allen & Hamilton, Inc. (1995). “TCRP Report 2: Applicability <strong>of</strong> Low-<br />
Floor Light Rail Vehicles in North America.” http://onlinepubs.trb.org/<br />
Onlinepubs/tcrp/tcrp_rpt_02.pdf<br />
Brown, B., C. Werner, and N. Kim (2003). “Personal and Contextual Factors<br />
Supporting the Switch to <strong>Transit</strong> Use: Evaluating a Natural <strong>Transit</strong><br />
Intervention.” Analyses <strong>of</strong> Social Issues and Public Policy 3(1): 139-160.<br />
Cain, A., and J. Sibley-Perone (2005). “Teenage Attitudes and Perceptions<br />
Regarding <strong>Transit</strong> Use.” National Center for <strong>Transit</strong> Research, University <strong>of</strong><br />
South Florida.<br />
Callaghan, L., and W. Vincent (2007). “Bus Rapid <strong>Transit</strong> and <strong>Transit</strong> Oriented<br />
Development: Case Studies on <strong>Transit</strong> Oriented Development Around Bus<br />
Rapid <strong>Transit</strong> Systems in North America and Australia.”<br />
Cobb-Walgren, C., and L. Mohr (1998). “Symbols in Service Advertisements.”<br />
Journal <strong>of</strong> Services Marketing 12(2): 129-151.<br />
Crandall, W., B. L. Bentzen, L. Meyers, D. Steed, and Project ACTION<br />
(2003). “Talking SignsR Remote Infrared Signage: A Guide for <strong>Transit</strong><br />
Managers.” http://projectaction.easterseals.com/site/DocServer/95TSS.<br />
pdf?docID=18924<br />
Currie, G. (2005). “The Demand Performance <strong>of</strong> Bus Rapid <strong>Transit</strong>.” Journal <strong>of</strong><br />
Public Transportation 8(1): 41-55.<br />
APPENDIX A References<br />
Kantor, D., G. Moscoe, and C. Henke (2006). “Issues and Technologies in Level<br />
Boarding Strategies for BRT.” Journal <strong>of</strong> Public Transportation, BRT Special<br />
Issue.<br />
Forsyth, A., J. Jacobson, and K. Thering, in association with the American<br />
Institute <strong>of</strong> Architects (2007). Moving Design: Spaces <strong>of</strong> Transportation,<br />
Report #4 in the series: Moving Communities Forward. Center for<br />
Transportation Studies, University <strong>of</strong> Minnesota.<br />
Heffner, R., T. Turrentine, and K. Kurani (2006). A Primer on Automobile<br />
Semiotics. Research Report UCD-ITS-RR-06-01, University <strong>of</strong> California,<br />
Institute <strong>of</strong> Transportation Studies.<br />
Henke, C. (2007). “How Customer-Appealing Design and Branding Win New<br />
Riders: Data and Best Practices.” Presented at the annual APTA Bus and<br />
Paratransit Conference, Nashville, May.<br />
King, Rolland D. (1998). TCRP Report 41: “New Designs and Operating<br />
Experiences with Low-Floor Buses.” http://onlinepubs.trb.org/Onlinepubs/<br />
tcrp/tcrp_rpt_41-a.pdf<br />
Levinson, H., S. Zimmerman, J. Clinger, J. Gast, S. Rutherford, and E. Bruhn<br />
(2003). TCRP Report 90, Vol II: “Bus Rapid <strong>Transit</strong> - Implementation<br />
Guidelines.” Transportation Research Board, Washington.<br />
Meenaghan, T. (1995). “The Role <strong>of</strong> Advertising in Brand Image Development.”<br />
Journal <strong>of</strong> Product and Brand Management 4(4): 23-34.<br />
Milligan & Company (2003). “Bus Rapid <strong>Transit</strong> Evaluation <strong>of</strong> Port Authority<br />
<strong>of</strong> Allegheny County’s West Busway Bus Rapid <strong>Transit</strong> Project.” U.S.<br />
<strong>Department</strong> <strong>of</strong> Transportation, Washington, DC.<br />
Neckar, L., in association with the American Institute <strong>of</strong> Architects (2007).<br />
“Synthesis, Report #7,” Moving Communities Forward. Center for<br />
Transportation Studies, University <strong>of</strong> Minnesota: Minneapolis, MN.<br />
Onkvisit, S., and J. Shaw (1989). “Service Marketing: Image, Branding, and<br />
Competition.” Business Horizons 32(1): 13-19.<br />
A-1
APPENDIX A References<br />
Peak, M., C. Henke, and L. Wnuk (2005). Bus Rapid <strong>Transit</strong> Ridership Analysis.<br />
A-2<br />
FTA-CA-26-7068-2004.1, U.S. <strong>Federal</strong> <strong>Transit</strong> <strong>Administration</strong>.<br />
Pultz, S. and D. K<strong>of</strong>fman (1987). “The Martin Luther King Jr. East Busway in<br />
Pittsburgh, PA,” U.S. <strong>Department</strong> <strong>of</strong> Transportation, Washington, DC.<br />
Rutenberg, U., and Hemily, B. (2003). TCRP Synthesis 50: “Use <strong>of</strong> Rear-Facing<br />
Position for Common Wheelchairs on <strong>Transit</strong> Buses.” http://onlinepubs.<br />
trb.org/Onlinepubs/tcrp/tcrp_syn_50.pdf<br />
Rutenberg, U., R. Baerg, M. MacNabb, A. K. Little, and B. Hemily (2007).<br />
“Assessment <strong>of</strong> Low-Floor <strong>Transit</strong> Bus G Forces on Rear-Facing<br />
Wheelchair Securement Systems.” http://www.tc.gc.ca/tdc/publication/<br />
pdf/14400/14429e.pdf<br />
<strong>Transit</strong> Cooperative Research Program (1997). TCRP Report 22: “The Role <strong>of</strong><br />
<strong>Transit</strong> in Creating Livable Metropolitan Communities.” Washington, D.C.:<br />
National Academy Press.<br />
<strong>Transit</strong> Cooperative Research Program (2000). TCRP Report 63: “Enhancing<br />
the Visibility and Image <strong>of</strong> <strong>Transit</strong> in the United States and Canada.”<br />
Washington, D.C.: National Academy Press.<br />
Transportation Management & Design, Inc. (2002). “Final Report, Los Angeles<br />
Metro Rapid Demonstration Program.” Los Angeles County Metropolitan<br />
Transportation Authority and Los Angeles <strong>Department</strong> <strong>of</strong> Transportation,<br />
Los Angeles.<br />
Vincent, W., and L. Callaghan (2007). “A Preliminary Evaluation <strong>of</strong> the Metro<br />
Orange Line Bus Rapid <strong>Transit</strong> Project.” Paper presented at the Annual<br />
Meeting <strong>of</strong> the Transportation Research Board, Washington, DC.<br />
WestStart-CALSTART (2004). “BRT Vehicle Market Demand Study.”<br />
U.S. General Accounting Office (2001). Mass <strong>Transit</strong>: Bus Rapid <strong>Transit</strong> Shows<br />
Promise, GAO-01-984.<br />
Zimmerman, S., and H. Levinson (2004). “Vehicle Selection for BRT: Issues and<br />
Options.” Journal <strong>of</strong> Public Transportation 7(1): 83-103.
GLOSSARY OF BRT TERMS<br />
TERM DEFINITION<br />
Alighting When a passenger exits a vehicle.<br />
Articulated Bus A bus composed <strong>of</strong> two vehicle sections connected by an articulated joint. An articulated bus has<br />
a higher passenger capacity than a standard bus.<br />
Automated Passenger Counter<br />
(APC)<br />
Automated Vehicle Location<br />
(AVL)<br />
Barrier-Enforced Fare Payment<br />
System<br />
Barrier-Free Pro<strong>of</strong>-<strong>of</strong>-Payment<br />
(POP) System<br />
Technology that counts passengers automatically when they board and alight vehicles. APC technologies<br />
include treadle mats (registers passengers when they step on a mat) and infrared beams<br />
(registers passengers when they pass through the beam). APC is used to reduce the costs <strong>of</strong> data<br />
collection and to improve data accuracy.<br />
Technology used to monitor bus locations on the street network in real-time. AVL is used to<br />
improve bus dispatch and operation and allow for quicker response time to service disruptions<br />
and emergencies.<br />
A fare collection system (process) where passengers pay fares to pass through turnstiles or gates<br />
prior to boarding the vehicle. This is done to reduce vehicle dwell times.<br />
A fare collection system (process) where passengers purchase fare media before boarding the<br />
vehicle and are required to carry pro<strong>of</strong> <strong>of</strong> valid fare payment while on-board the vehicle. Roving<br />
vehicle inspectors verify that passengers have paid their fare. This is done to reduce vehicle dwell<br />
times.<br />
Boarding When a passenger enters a vehicle.<br />
Branding The use <strong>of</strong> strategies to differentiate a particular product from other products, in order to<br />
strengthen its identity. In the context <strong>of</strong> BRT systems, branding <strong>of</strong>ten involves the introduction<br />
<strong>of</strong> elements to improve performance and differentiate BRT systems, such as the use <strong>of</strong> vehicles<br />
with a different appearance from standard bus services, distinct station architecture, and the use<br />
<strong>of</strong> distinct visual markers such as color schemes and logos.<br />
Brand Identity Represents how a particular product is viewed among the set <strong>of</strong> other product options available.<br />
In the context <strong>of</strong> BRT systems, brand identity is necessary so that passengers distinguish BRT<br />
services from other transit services.<br />
Bus Bulb A section <strong>of</strong> sidewalk that extends from the curb <strong>of</strong> a parking lane to the edge <strong>of</strong> an intersection<br />
or <strong>of</strong>fset through lane. This creates additional space for passenger amenities at stations, reduces<br />
street crossing distances for pedestrians, and eliminates lateral movements <strong>of</strong> buses to enter and<br />
leave stations. However, this may also produce traffic queues behind stopped buses.<br />
Bus Rapid <strong>Transit</strong> (BRT) A flexible, rubber-tired form <strong>of</strong> rapid transit that combines stations, vehicles, running way, and ITS<br />
elements into an integrated system with a strong identity. BRT applications are designed to be appropriate<br />
to the market they serve and to their physical surroundings. BRT can be implemented<br />
in a variety <strong>of</strong> environments, ranging from rights-<strong>of</strong>-way totally dedicated to transit (surface, elevated,<br />
or underground) to mixed traffic rights-<strong>of</strong>-way on streets and highways.<br />
Bus Street Street that is dedicated to bus use only.<br />
Capacity The maximum number <strong>of</strong> passengers that could be served by a BRT system.<br />
APPENDIX B Glossary<br />
B-1
APPENDIX B Glossary<br />
B-2<br />
TERM DEFINITION<br />
Capacity, Person The maximum number <strong>of</strong> passengers that can be carried along the critical section <strong>of</strong> the BRT<br />
route during a given period <strong>of</strong> time, under specified operating conditions, without unreasonable<br />
delay, hazard, or restriction and with reasonable certainty.<br />
Capacity, Facilities The number <strong>of</strong> vehicles per period <strong>of</strong> time that use a specific facility (i.e., running way or station).<br />
Capacity, Vehicle The maximum number <strong>of</strong> seated and standing passengers that a vehicle can safely and comfortably<br />
accommodate. This is determined by the vehicle configuration.<br />
Contextual Design How well a BRT system demonstrates a premium, quality design and is integrated with the surrounding<br />
communities.<br />
Demand The actual number <strong>of</strong> passengers attracted to use a BRT system.<br />
Designated Lane A lane reserved for the exclusive use <strong>of</strong> BRT or transit vehicles. Dedicated lanes can be located in<br />
different positions relative to the arterial street and are classified accordingly:<br />
Concurrent Flow Curb – Next to the curb, used by buses to travel in the same direction as the<br />
adjacent lane.<br />
Concurrent Flow Interior – Between curb parking and the adjacent travel lane, used by transit<br />
vehicles to travel in the same direction as the adjacent travel lane. This is done in situations where<br />
curb parking is to be retained.<br />
Contraflow Curb – Located next to the curb, used by transit vehicles to travel in the opposite<br />
direction <strong>of</strong> the normal traffic flow. Could be used on one-way streets, or for a single block on<br />
two-way streets to enable buses to reverse direction.<br />
Median – Within the center <strong>of</strong> a two-way street.<br />
Dual-Mode Propulsion A propulsion systems that <strong>of</strong>fers the capability to operate with two different modes, usually as a<br />
thermal (internal combustion) engine and in electric (e.g., trolley) mode.<br />
Dwell Time The time associated with a vehicle being stopped at a curb or station for the boarding and alighting<br />
<strong>of</strong> passengers. BRT systems <strong>of</strong>ten intend to reduce dwell times to the extent possible through<br />
such strategies as platform height, platform layout, vehicle configuration, passenger circulation<br />
enhancements, and the fare collection process.<br />
Dwell Time Reliability Ability to maintain consistent dwell times at stations. BRT systems <strong>of</strong>ten intend to improve dwell<br />
time reliabilities to the extent possible through such strategies as platform height, platform layout,<br />
vehicle configuration, passenger circulation enhancements, and the fare collection process.<br />
Driver Assist and Automation<br />
Technology<br />
A form <strong>of</strong> technology that provides automated controls for BRT vehicles. Examples include collision<br />
warning, precision docking, and vehicle guidance systems.<br />
Fare Structure Establishes the ways that fares are assessed and paid. The two basic types <strong>of</strong> fare structures are flat<br />
fares (same fare regardless <strong>of</strong> distance or quality <strong>of</strong> service) and differentiated fares (fare depends<br />
on length <strong>of</strong> trip, time <strong>of</strong> day, and/or type <strong>of</strong> service).
TERM DEFINITION<br />
Fare Transaction Media Type <strong>of</strong> media used for fare payment. Examples include cash (coins and bills), tokens, paper media<br />
(tickets, transfers, flash passes), magnetic stripe media, and smart cards. Electronic fare transaction<br />
media (i.e., magnetic stripe media or smart cards) can reduce dwell times and fare collection<br />
costs, increase customer convenience, and improve data collection.<br />
Global Positioning System (GPS) The use <strong>of</strong> satellites and transponders to locate objects on the earth’s surface. GPS is a widely used<br />
technology for AVL systems.<br />
High Occupancy Vehicle (HOV)<br />
Lane<br />
A street or highway lane designated for use only by vehicles with more than one passenger, including<br />
buses. HOV lanes are <strong>of</strong>ten used on freeways.<br />
Hybrid-Electric Drive A propulsion system using both an internal combustion engine and electric drives that incorporate<br />
an on-board energy storage device.<br />
Intelligent Transportation<br />
Systems (ITS)<br />
Internal Combustion Engine<br />
(ICE) (Thermal Engine)<br />
Advanced transportation technologies that are usually applied to improve transportation system<br />
capacity or to provide travelers with improved travel information. Examples <strong>of</strong> ITS applications<br />
with relevance to BRT systems include vehicle prioritization, driver assist and automation technology,<br />
operations management technology, passenger information, safety and security technology,<br />
and support technologies.<br />
An engine that operates by burning its fuel inside the engine. Combustion engines use the pressure<br />
created by the expansion <strong>of</strong> the gases to provide energy for the vehicle. ICEs typically use<br />
fuels such as diesel or natural gas (in either compressed gas or liquefied form).<br />
Level Boarding An interface between station platform and vehicle that minimizes the horizontal and vertical<br />
gap between the platform edge and the vehicle door area, which speeds up passenger boarding/<br />
alighting times and does not require the use <strong>of</strong> wheelchair lifts or ramps. Level boarding is <strong>of</strong>ten<br />
done through the use <strong>of</strong> station platforms and low-floor vehicles.<br />
Low-Floor Vehicle A vehicle designed with a lower floor (approximately 14 inches from pavement), without stairs or<br />
a wheelchair lift. Use <strong>of</strong> low-floor vehicles could be done in combination with station platforms<br />
to enable level boarding or could be done stand-alone such that passengers are required to take<br />
one step up or use a wheelchair ramp to board the vehicle.<br />
Multiple-Door Boarding Passengers are allowed to board the vehicle at more than one door, which speeds up boarding<br />
times. This typically requires <strong>of</strong>f-board fare collection.<br />
Operations Management<br />
Technology<br />
Automation methods that enhance the management <strong>of</strong> BRT fleets to improve operating efficiencies,<br />
support service reliability, and/or reduce travel times. Examples include automated scheduling<br />
dispatch, vehicle mechanical monitoring and maintenance, and vehicle tracking systems.<br />
Passing Capability The ability for vehicles in service to pass one another. Bus pull-outs and passing lanes at stations<br />
are two primary ways to enhance passing capability for a BRT system.<br />
Passenger Circulation<br />
Enhancement<br />
Features that govern passenger accessibility to vehicles and circulation within vehicles. Examples<br />
include alternative seat layouts, additional door channels, and enhanced wheelchair securements.<br />
APPENDIX B Glossary<br />
B-3
APPENDIX B Glossary<br />
B-4<br />
TERM DEFINITION<br />
Passenger Information System Technologies that provide information to travelers to improve customer satisfaction. The most<br />
common application relevant to BRT systems is the real-time provision <strong>of</strong> information pertaining<br />
to schedules, wait times, and delays to passengers at stations or on-board vehicles using variable<br />
message signs and an automated vehicle location technology.<br />
Pay On-Board System A fare collection system (process) in which passengers pay fares on-board the vehicle at the<br />
farebox or display valid fare media to the bus operator.<br />
Platform A station area used for passenger boarding and alighting. A side platform is adjacent to the curb<br />
or a running way. A center platform is located between the vehicle running way and the center<br />
<strong>of</strong> the running way, or median; this is less common because it requires non-standard vehicle door<br />
locations.<br />
Platform Height Height <strong>of</strong> the platform relative to the running way. The three basic options for platform height are<br />
standard curb, raised curb, and level platform.<br />
Platform Layout Design <strong>of</strong> the platform with respect to vehicle accommodation. The three basic options for platform<br />
layout are single vehicle length platform, extended (i.e., multiple vehicle) platform with unassigned<br />
berths, and extended platform with assigned berths.<br />
Precision Docking System A guidance system used to accurately steer vehicles into alignment with station platforms or<br />
curbs. These may be magnetic or optical-based and require the installation <strong>of</strong> markings on the<br />
pavement (paint or magnets), vehicle-based sensors to read the markings, and linkages with the<br />
vehicle steering system.<br />
Propulsion System, Vehicle<br />
Propulsion System<br />
The means <strong>of</strong> delivering power to enable vehicle movement. The most common propulsion systems<br />
for BRT vehicles include internal combustion engines fueled by diesel or compressed natural<br />
gas, electric drives powered by the use <strong>of</strong> an overhead catenary, and hybrid-electric drives with<br />
an on-board energy storage device. The choice <strong>of</strong> propulsion system affects vehicle capital costs,<br />
vehicle operating and maintenance costs, vehicle performance, ride quality, and environmental<br />
impacts.<br />
Queue Jumper A designated lane segment or traffic signal treatment at signalized or other locations where traffic<br />
backs up. <strong>Transit</strong> vehicles use this lane segment to bypass traffic queues (i.e., traffic backups).<br />
A queue jumper may or may not be shared with turning traffic.<br />
Route Length The length <strong>of</strong> the route affects what locations the route serves and the resources required to<br />
operate that route.<br />
Route Structure How stations and running ways are used to accommodate different vehicles that could potentially<br />
be serving different routes.<br />
Running Time Time that vehicles spend moving from station to station along the running way. BRT systems are<br />
designed to reduce running times to the extent possible through such strategies as running way<br />
segregation, passing capability, station spacing, ITS, and schedule control.<br />
Running Time Reliability Ability to maintain consistent running times along a route. BRT systems are designed to improve<br />
running time reliabilities to the extent possible through such strategies as running way segregation,<br />
passing capability, station spacing, ITS, and schedule control.
TERM DEFINITION<br />
Running Way The space within which the vehicle operates. For BRT systems, the running way could be a fully<br />
grade-separated exclusive transitway, an at-grade transitway, a designated arterial lane, or a<br />
mixed-flow lane. BRT vehicles need not operate in a single type <strong>of</strong> running way for the entire<br />
route length.<br />
Running Way Marking The visible differentiation <strong>of</strong> the running ways used by BRT vehicles from other running ways. Signage<br />
and striping, raised lane delineators, and alternate pavement color/texture represent three<br />
major techniques.<br />
Running Way Segregation Level <strong>of</strong> segregation, or separation, <strong>of</strong> BRT vehicles from general traffic. A fully grade-separated<br />
exclusive transitway for BRT vehicles represents the highest level <strong>of</strong> segregation, followed by an<br />
at-grade transitway (second highest), a designated arterial lane (third highest), and a mixed flow<br />
lane (lowest).<br />
Safety and Security Technology Systems that enhance the safety and security <strong>of</strong> transit operations. Examples include silent alarms<br />
on the vehicle that can be activated by the driver and voice and/or video surveillance monitoring<br />
systems in stations or on-board vehicles.<br />
Schedule Control How vehicle on-time performance is monitored, either to meet specified schedules or to regulate<br />
headways. Headway-based control is more common for very high frequency routes.<br />
Service Frequency The interval <strong>of</strong> time between in-service vehicles on a particular route. Determines how long passengers<br />
must wait at stations and the number <strong>of</strong> vehicles required to serve a particular route.<br />
Service frequencies for BRT systems are typically high relative to standard bus services.<br />
Service Reliability Qualitative characteristics related to the ability <strong>of</strong> a transit operation to provide service that is<br />
consistent with its plans and policies and the expectations <strong>of</strong> its customers.<br />
Service Span The period <strong>of</strong> time that a service is available to passengers. Examples include all-day service and<br />
peak-hour-only service.<br />
Signal Timing/Phasing Involves changes to the normal traffic signal phasing and sequencing cycles in order to provide a<br />
clear path for oncoming buses.<br />
Station Location where passengers board and alight the vehicle. BRT stations can range from simple stops<br />
or enhanced stops to a designated station and an intermodal terminal or transit center. A station<br />
<strong>of</strong>ten has more passenger amenities than a stop (i.e., benches, shelters, landscaping, traveler<br />
information).<br />
Station Access Means <strong>of</strong> linking stations with adjacent communities in order to draw passengers from their market<br />
area. Examples include pedestrian linkages (i.e., sidewalks, overpasses, pedestrian paths) and<br />
park-and-ride facilities.<br />
Station and Lane Access Control Allows vehicle access to dedicated BRT running ways and stations with variable message signs<br />
and/or gate control systems.<br />
Station Spacing The spacing between stations impacts passenger travel times and the number <strong>of</strong> locations served<br />
along the route. Station spacings for BRT systems are typically farther apart relative to standard<br />
bus services.<br />
APPENDIX B Glossary<br />
B-5
APPENDIX B Glossary<br />
B-6<br />
TERM DEFINITION<br />
Support Technologies Technologies used to support ITS applications. Examples include advanced communication systems,<br />
archived data, and automated passenger counters.<br />
Ticket Vending Machine (TVM) A fixed machine that accepts a combination <strong>of</strong> cash, stored-value media, and credit cards to dispense<br />
valid tickets and other fare media<br />
Transfer Time The time associated with a passenger waiting to transfer between particular transit vehicles. The<br />
network design determines where passengers need to make transfers. Service frequency and reliability<br />
are the primary determinants <strong>of</strong> transfer time.<br />
<strong>Transit</strong> Signal Priority Adjustments in signal timing to minimize delays to buses. Passive priority techniques involve<br />
changes to existing signal operations. Active priority techniques involve adjustments <strong>of</strong> signal<br />
timing after a bus is detected (i.e., changing a red light to a green light or extending the green<br />
time).<br />
<strong>Transit</strong>way / Busway Traffic lane dedicated to exclusive use <strong>of</strong> transit vehicles that is physically separated from other<br />
traffic lanes. May or may not be grade separated.<br />
Validator A device that reads a fare instrument (fare transaction medium) to verify if a fare paid is valid for<br />
the trip being taken by the passenger<br />
Variable Message Sign (VMS) A sign that provides flashing messages to its readers. The message posted on the sign is variable<br />
and can be changed in real-time.<br />
Vehicle Configuration The combination <strong>of</strong> length (standard, articulated, or specialized), body type (conventional, stylized,<br />
or specialized), and floor height (standard or low-floor) <strong>of</strong> the vehicle. In practice, BRT systems<br />
can use any combination <strong>of</strong> different vehicle configurations on a single running way.<br />
Vehicle Guidance System A guidance system used to steer vehicles on running ways while maintaining speed. These may be<br />
magnetic, optical, or GPS-based and require the installation <strong>of</strong> markings on the pavement (paint<br />
or magnets), vehicle-based sensors to read the markings, and linkages with the vehicle steering<br />
system. Guidance can be lateral (side-to-side to keep buses within a specified right-<strong>of</strong>-way) or<br />
longitudinal (to minimize the following distance between vehicles).<br />
Vehicle Prioritization Methods to provide travel preference or priority to BRT services. Examples include signal timing/<br />
phasing, station and lane access control, and transit signal priority.<br />
Wait Time The time associated with a passenger waiting at a station before boarding a particular transit<br />
service. Service frequency and reliability are the primary determinants <strong>of</strong> wait time.