review of the forest revenue system in papua new ... - Forest Trends
review of the forest revenue system in papua new ... - Forest Trends
review of the forest revenue system in papua new ... - Forest Trends

Create successful ePaper yourself
Turn your PDF publications into a flip-book with our unique Google optimized e-Paper software.
REVIEW OF THE<br />
FOREST REVENUE SYSTEM<br />
IN PAPUA NEW GUINEA<br />
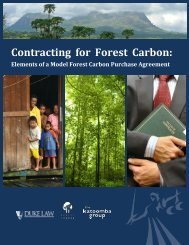
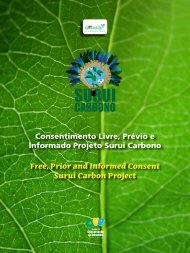
Share <strong>of</strong> <strong>the</strong> returns from logg<strong>in</strong>g (per cent).<br />
100<br />
80<br />
60<br />
40<br />
20<br />
0<br />
-20<br />
-40<br />
Government<br />
Landowner<br />
Operator<br />
90 to 95<br />
96 to 01<br />
90 to 01<br />
FINAL REPORT OF THE FOREST REVENUE REVIEW TEAM<br />
COMMISSIONED BY THE GOVERNMENT OF PAPUA NEW GUINEA<br />
13 MARCH 2002<br />
Do landowners<br />
receive enough ?<br />
Does <strong>the</strong><br />
Government collect<br />
enough ?<br />
Do loggers receive<br />
too much ?
Acknowledgements<br />
2001 FOREST REVENUE REVIEW<br />
The Review Team received valuable help and assistance from numerous organizations and <strong>in</strong>dividuals <strong>in</strong><br />
Papua New Gu<strong>in</strong>ea. Work<strong>in</strong>g facilities were provided at <strong>the</strong> PNG <strong>Forest</strong> Authority (Manag<strong>in</strong>g Director<br />
Mr Thomas Nen) at its Headquarters <strong>in</strong> Port Moresby and staff both at HQ and <strong>in</strong> <strong>the</strong> Regions and<br />
Prov<strong>in</strong>ces assisted with data capture and team travel.<br />
The Papua New Gu<strong>in</strong>ea <strong>Forest</strong> Industries Association (President Mr Stanis Bai) provided an <strong>in</strong>valuable<br />
gateway to consultations with <strong>the</strong> <strong>in</strong>dustry at large and assisted with team travel.<br />
SGS PNG Ltd. (General Manager Mr Bruce Telfer) patiently answered our many queries about <strong>the</strong><br />
operation <strong>of</strong> <strong>the</strong> log export monitor<strong>in</strong>g arrangements.<br />
We would like to thank all those who attended our workshop for presentation <strong>of</strong> <strong>the</strong> prelim<strong>in</strong>ary results<br />
and also <strong>the</strong> follow<strong>in</strong>g <strong>in</strong>dividuals: Ms Felecia Dobunaba, OBE. and Mr Paul Barker (Department <strong>of</strong> <strong>the</strong><br />
Prime M<strong>in</strong>ister & National Executive Council), Ms Colette O’Driscoll (Internal Revenue Commission),<br />
Dr Benno Boeha (National Research Institute), Ms Peter McCrea (Department <strong>of</strong> National Plann<strong>in</strong>g &<br />
Monitor<strong>in</strong>g), Mr Dick McCarthy & Mr Bob Tate (Papua New Gu<strong>in</strong>ea <strong>Forest</strong> Industries Association),<br />
Mr Philip Tiong (Vanimo <strong>Forest</strong> Products Ltd.), Mr Andrew Bond (World Bank), and Mr Ivan Lu<br />
(Rimbunan Hijau Ltd.). Numerous o<strong>the</strong>r persons assisted us, and we apologize for not be<strong>in</strong>g able to name<br />
<strong>the</strong>m all.<br />
None <strong>of</strong> <strong>the</strong> above-named organizations or <strong>in</strong>dividuals are responsible for any errors or omissions that<br />
might rema<strong>in</strong> <strong>in</strong> <strong>the</strong> Review. Such residual matters are subject to <strong>the</strong> disclaimer below.<br />
Disclaimer<br />
This Review was commissioned by <strong>the</strong> Government <strong>of</strong> Papua New Gu<strong>in</strong>ea and funded by <strong>the</strong><br />
Government itself and by <strong>the</strong> Australian Agency for International Development. The Review Team has<br />
made every effort to ensure <strong>the</strong> accuracy <strong>of</strong> <strong>the</strong>ir data and to perform analyses and <strong>in</strong>terpretation to <strong>the</strong><br />
best <strong>of</strong> <strong>the</strong>ir ability but cannot guarantee a perfect result, nor be responsible for <strong>the</strong> results <strong>of</strong> apply<strong>in</strong>g its<br />
recommendations. The Team delivered <strong>the</strong> report to <strong>the</strong> Government for use as it sees fit, and its<br />
responsibility ended at that po<strong>in</strong>t.<br />
PAGE II
TABLE OF CONTENTS<br />
2001 FOREST REVENUE REVIEW<br />
ACRONYMS X<br />
EXECUTIVE SUMMARY 11<br />
PART 1 INTRODUCTION 13<br />
1.1 NATIONAL ECONOMY 13<br />
1.1.1 Demography 13<br />
1.1.2 Growth 13<br />
1.1.3 Sectoral Performance 13<br />
1.1.4 Employment 14<br />
1.1.5 Trade 14<br />
1.1.6 Inflation & Interest Rates 15<br />
1.1.7 Exchange Rate 15<br />
1.1.8 Government F<strong>in</strong>ance and Taxation 15<br />
1.2 THE FORESTRY SECTOR 16<br />
1.2.1 Resource Characteristics 16<br />
1.2.2 Commission <strong>of</strong> Inquiry 17<br />
1.2.3 New <strong>Forest</strong> Act and Policy 17<br />
1.2.4 Market Variations <strong>in</strong> <strong>the</strong> Last Decade 18<br />
1.3 CURRENT STATUS OF THE FOREST REVENUE SYSTEM 18<br />
1.3.1 Summary 18<br />
1.3.2 Log Export Tax 19<br />
1.3.3 Landowners’ Revenue 19<br />
1.3.4 O<strong>the</strong>r Government Revenue 20<br />
1.3.5 Policy Support for Domestic Process<strong>in</strong>g and Revenue Implications 20<br />
1.4 METHODOLOGY ADOPTED BY THIS STUDY 21<br />
PART 2 ANALYSIS OF MARKETS, TRADE AND INDUSTRY 23<br />
2.1 PRODUCTION AND EXPORTS 23<br />
2.2 PAPUA NEW GUINEA’S FOREST PRODUCTS EXPORTS 26<br />
2.3 MARKET OUTLOOK FOR PNG LOGS AND PROCESSED FOREST PRODUCTS 30<br />
2.3.1 The Certa<strong>in</strong>ties <strong>of</strong> Wood Demand 30<br />
2.3.2 The Uncerta<strong>in</strong>ties <strong>of</strong> Wood Demand 31<br />
2.3.3 The Certa<strong>in</strong>ties <strong>of</strong> Wood Supply 31<br />
2.3.4 The Uncerta<strong>in</strong>ties <strong>of</strong> Wood Supply 34<br />
2.4 CONCLUSIONS AND IMPLICATIONS FOR PAPUA NEW GUINEA 35<br />
PAGE III
2001 FOREST REVENUE REVIEW<br />
PART 3 TRANSFER PRICING 36<br />
3.1 ADMINISTRATION 36<br />
3.2 TRANSFER PRICING INVESTIGATION 38<br />
3.2.1 Types <strong>of</strong> Transfer Pric<strong>in</strong>g and Information Sources 38<br />
3.2.2 Volumetric Information 40<br />
3.2.3 Species and Grades 43<br />
3.2.4 Pric<strong>in</strong>g Information 44<br />
3.2.5 Freight & Insurance 47<br />
3.2.6 Taun & Calophyllum Example 49<br />
3.2.7 Ch<strong>in</strong>a, Hong Kong, & Korea 52<br />
PART 4 FINANCIAL MODELLING 54<br />
4.1 LOG PRODUCTION COSTS 54<br />
4.2 OUTLINE OF PROCESSING OPTIONS 57<br />
4.2.1 F<strong>in</strong>ancial Models for Process<strong>in</strong>g 57<br />
4.2.2 Sensitivity Analysis on Base Case F<strong>in</strong>ancial Models 69<br />
4.2.3 Government Revenue Foregone Through Process<strong>in</strong>g <strong>of</strong> Logs 70<br />
4.3 International Competitiveness Issues Relat<strong>in</strong>g to Process<strong>in</strong>g <strong>in</strong> PNG 71<br />
PART 5 RESOURCE RENT 74<br />
5.1 INTRODUCTION 74<br />
5.2 THE FOREST REVENUE SYSTEM AND RESOURCE RENT 75<br />
5.3 THE RESOURCE RENT ON LOG EXPORTS (IN THE ABSENCE OF TRANSFER PRICING) 76<br />
5.4 ARE LOG EXPORT DUTIES TOO HIGH? 82<br />
5.5 THE RESOURCE RENT ON PROCESSED LOGS 84<br />
PART 6 AN ECONOMIC COST-BENEFIT ASSESSMENT OF PROCESSING 87<br />
6.1 INTRODUCTION 87<br />
6.2 THE BENEFITS OF PROCESSING 87<br />
6.3 THE COSTS OF PROCESSING 91<br />
6.4 WEIGHING UP THE BENEFITS AND COSTS OF PROCESSING EXPORT LOGS 93<br />
PART 7 THE DISTRIBUTION OF RESOURCE RENT 99<br />
7.1 AN APPROPRIATE DISTRIBUTION 99<br />
7.2 THOUGHTS ON IMPROVED MECHANISMS FOR DISTRIBUTING THE RESOURCE RENT 102<br />
7.3 OTHER ISSUES 105<br />
PART 8 ESTIMATED ECONOMIC VALUE OF THE FOREST ESTATE 107<br />
PAGE IV
2001 FOREST REVENUE REVIEW<br />
8.1 THE RATIONALE FOR AN ECONOMIC VALUATION OF FORESTS 107<br />
8.2 FOCUS: NATURAL FOREST LOGGING 108<br />
8.3 A FIRST STEP TOWARD ECONOMIC VALUATION 109<br />
8.4 THE ROLE OF FOREST TAXATION 109<br />
8.4.1 <strong>Forest</strong> Asset Depletion 110<br />
8.4.2 Landowner Costs 110<br />
8.4.3 Sub-optimal Selection <strong>of</strong> Logg<strong>in</strong>g Over Alternatives 111<br />
8.4.4 Flow-on or Multiplier Effects 111<br />
8.5 ESTIMATING THE FULL RANGE OF FOREST VALUES 112<br />
PART 9 AN INDUSTRY PERFORMANCE BOND 117<br />
9.1 DESCRIPTION 117<br />
9.2 RATIONALE 117<br />
PART 10 KEY FINDINGS, CONCLUSIONS AND RECOMMENDATIONS 119<br />
10.1 STRUCTURE 119<br />
10.2 KEY FINDINGS ON THE ECONOMIC VALUE OF THE FOREST ESTATE 119<br />
10.2.1 Model F<strong>in</strong>d<strong>in</strong>gs 120<br />
10.3 KEY FINDINGS ON FOREST INDUSTRY 122<br />
10.3.1 Export Logs 122<br />
10.3.2 Process<strong>in</strong>g 122<br />
10.3.3 Market Outlook 122<br />
10.3.4 International Competitiveness 122<br />
10.4 KEY FINDINGS ON TRANSFER PRICING 123<br />
10.4.1 Japan 123<br />
10.4.2 Ch<strong>in</strong>a and Hong Kong 123<br />
10.4.3 Common Evidence 124<br />
10.5 KEY FINDINGS ON RESOURCE RENT 124<br />
10.6 CONCLUSIONS 126<br />
10.6.1 Conclusions on <strong>the</strong> Economic Valuation <strong>of</strong> <strong>the</strong> <strong>Forest</strong> 126<br />
10.6.2 Conclusions on <strong>the</strong> <strong>Forest</strong> Industry 126<br />
10.6.3 Conclusions on Transfer Pric<strong>in</strong>g 127<br />
10.6.4 Conclusions on Resource Rent 127<br />
10.7 RECOMMENDATIONS AND DISCUSSION<br />
10.7.1 Recommendations for fur<strong>the</strong>r study <strong>of</strong> <strong>the</strong> economic value <strong>of</strong> <strong>forest</strong>s from <strong>the</strong><br />
131<br />
perspectives <strong>of</strong> landowners and <strong>the</strong> nation 131<br />
PAGE V
2001 FOREST REVENUE REVIEW<br />
10.7.2 Recommendations for <strong>the</strong> study and pilot<strong>in</strong>g <strong>of</strong> f<strong>in</strong>ancial and operational<br />
mechanisms for enhanc<strong>in</strong>g <strong>the</strong> efficiency <strong>of</strong> <strong>forest</strong> allocation and prevent<strong>in</strong>g<br />
malfeasance 132<br />
10.7.3 Recommendations for <strong>forest</strong> <strong>revenue</strong> policies that promote beneficial changes <strong>in</strong><br />
<strong>the</strong> <strong>forest</strong> sector <strong>in</strong> response to chang<strong>in</strong>g market forces, emerg<strong>in</strong>g markets, <strong>the</strong><br />
condition <strong>of</strong> PNG’s <strong>forest</strong>s, and uncerta<strong>in</strong>ties 133<br />
10.8 RECOMMENDATIONS FOR INDUSTRY 134<br />
10.8.1 Recommendations on Transfer Pric<strong>in</strong>g 134<br />
10.8.2 Recommendations on <strong>the</strong> Industry Performance Bond 135<br />
10.8.3 Recommendations for Short Term Action on Resource Rent Issues 135<br />
10.8.4 A Model System for <strong>the</strong> Longer Term 136<br />
10.8.5 Tax Rates and Thresholds 136<br />
10.8.6 The Revenue Base 137<br />
10.8.7 Adm<strong>in</strong>istration 137<br />
10.8.8 Implementation 137<br />
ANNEX A DATA ON THE FOREST SECTOR 138<br />
ANNEX B THE PERFORMANCE OF ALTERNATIVE LOG EXPORT REVENUE SYSTEMS 145<br />
ANNEX C COST BENEFIT METHODOLOGY 163<br />
C.1 OVERVIEW OF THE METHODOLOGY 163<br />
C.2 INPUT-OUTPUT MULTIPLIERS 164<br />
C.3 DATA 168<br />
ANNEX D MISCELLANEOUS DATA 169<br />
ANNEX E TERMS OF REFERENCE 171<br />
ANNEX F REVIEW TEAM MEMBERS 176<br />
REFERENCES 177<br />
BOXES<br />
Box 6.1 Exist<strong>in</strong>g Tax Incentives for Downstream Process<strong>in</strong>g 89<br />
Box 6.2 An Economic Pr<strong>of</strong>ile <strong>of</strong> Selected Timber Process<strong>in</strong>g Operations 89<br />
Box 7.1 The Extent <strong>of</strong> Competition <strong>in</strong> <strong>the</strong> <strong>Forest</strong> Industry 100<br />
Box 7.2 Criteria Used to Assess Royalty Systems 104<br />
PAGE VI
FIGURES<br />
2001 FOREST REVENUE REVIEW<br />
Figure 3.1 Log Exports from Papua New Gu<strong>in</strong>ea to Japan (SGS vs. JLIA Figures) 41<br />
Figure 3.2 Log Exports from PNG to Ch<strong>in</strong>a and Ch<strong>in</strong>a Log Imports from PNG 41<br />
Figure 3.3 FOB Prices for PNG Logs (1996-1999) 44<br />
Figure 3.4 CIF Prices for Logs Imported <strong>in</strong>to Japan from South Seas 45<br />
Figure 3.5 Japan CIF and PNG FOB Prices for Taun and Calophyllum Logs 46<br />
Figure 3.6 Differences Between cif Japan and fob PNG Prices for Taun/Calophyllum Logs 47<br />
Figure 3.7 Evolution <strong>of</strong> Log Freight Costs to Japan (annual average) 48<br />
Figure 3.8 Cif Prices for Tropical Logs Imported by Korea 53<br />
Figure 5.1 Papua New Gu<strong>in</strong>ea Log Export Volumes and Average Prices 76<br />
Figure 5.2 The Actual Level <strong>of</strong> Resource Rent From Log Exports (<strong>in</strong> <strong>the</strong> absence <strong>of</strong> transfer pric<strong>in</strong>g)78<br />
Figure 5.3 The Estimated Past Distribution <strong>of</strong> Resource Rent (<strong>in</strong> <strong>the</strong> absence <strong>of</strong> transfer pric<strong>in</strong>g) 79<br />
Figure 5.4 The Share <strong>of</strong> Log Exports Accounted for by Low Grade Logs 81<br />
Figure 5.5 The Current Level <strong>of</strong> Costs and Revenue 82<br />
Figure 5.6 The Actual and Potential Level <strong>of</strong> <strong>the</strong> Log Harvest 83<br />
Figure 5.7 Purchase <strong>of</strong> New Heavy Equipment by <strong>the</strong> Logg<strong>in</strong>g Industry 84<br />
Figure 6.1 Net Benefits <strong>of</strong> Process<strong>in</strong>g for a Typical Year 95<br />
Figure 6.2 Export Duty Foregone on ‘Exportable’ Logs Processed 95<br />
Figure 6.3 Landowner Premium Foregone on Processed ‘Exportable’ Logs 98<br />
Figure 10.1 Annual Net Returns to Natural <strong>Forest</strong> Logg<strong>in</strong>g <strong>in</strong> Papua New Gu<strong>in</strong>ea (2001) 121<br />
Figure 10.2 The Past Distribution <strong>of</strong> Rent had <strong>the</strong> Preferred System Applied 128<br />
Figure 10.3 The Actual and Proposed Level <strong>of</strong> Charges Under Different Prices 129<br />
Figure 10.4 The Hypo<strong>the</strong>tical Level <strong>of</strong> Resource Rent From Log Exports (assum<strong>in</strong>g transfer pric<strong>in</strong>g)130<br />
Figure 10.5 The Hypo<strong>the</strong>tical Past Distribution <strong>of</strong> Resource Rent (assum<strong>in</strong>g transfer pric<strong>in</strong>g) 131<br />
Figure B.1 Resource Rent Under <strong>the</strong> Current Revenue System and Variable US$ Prices 148<br />
Figure B.2 Resource Rent Under <strong>the</strong> Current Revenue System and a Variable K<strong>in</strong>a 149<br />
Figure B.3 Resource Rent Under <strong>the</strong> Current Revenue System and Variable Logg<strong>in</strong>g Costs 150<br />
Figure B.4 Resource Rent Under a US$-based Revenue System and Variable US$ Prices 152<br />
Figure B.5 Resource Rent Under a US$-based Revenue System and a Variable K<strong>in</strong>a 154<br />
Figure B.6 Resource Rent Under a US$-based Revenue System and Variable Logg<strong>in</strong>g Costs 156<br />
Figure B.7 Resource Rent Under a More Efficient and Equitable Revenue System and<br />
Variable US$ Prices 158<br />
PAGE VII
2001 FOREST REVENUE REVIEW<br />
Figure B.8 Resource Rent Under a More Efficient and Equitable Revenue System and a<br />
Variable K<strong>in</strong>a 160<br />
Figure B.9 Resource Rent Under a More Efficient and Equitable Revenue System and<br />
Variable Logg<strong>in</strong>g Costs 162<br />
TABLES<br />
Table 2.1 Tropical Timber Production 1995 – 2000 (mill. m³) 23<br />
Table 2.2 Total Exports <strong>of</strong> Selected Tropical Timber Products 1995 - 2000 (mill. m³) 23<br />
Table 2.3 Ma<strong>in</strong> Tropical Log Producers - 2000 24<br />
Table 2.4 Ma<strong>in</strong> Tropical Log Exporters - 2000 24<br />
Table 2.5 Ma<strong>in</strong> Tropical Sawn Timber Exporters - 2000 24<br />
Table 2.6 Ma<strong>in</strong> Tropical Plywood Exporters - 2000 25<br />
Table 2.7 Ma<strong>in</strong> Tropical Log Importers - 2000 25<br />
Table 2.8 Ma<strong>in</strong> Tropical Sawn Timber Importers - 2000 25<br />
Table 2.9 Ma<strong>in</strong> Tropical Plywood Importers - 2000 26<br />
Table 2.10 Evolution <strong>of</strong> PNG Logs and Sawn Timber Exports (‘000m³) 26<br />
Table 2.11 Ma<strong>in</strong> Importers <strong>of</strong> PNG Logs (1,000 m³) 26<br />
Table 2.12 Log Exports by Company - 6 Largest; 1997 & 2000 (Volumes <strong>in</strong> m³; Values <strong>in</strong> US$) 27<br />
Table 2.13 Ma<strong>in</strong> Importers by Market <strong>of</strong> PNG Logs (2000) 28<br />
Table 2.14 Largest Importers <strong>of</strong> PNG Logs (2000) 29<br />
Table 2.15 Ma<strong>in</strong> Species <strong>of</strong> Exported Logs <strong>in</strong> PNG 1997 and 2000 (‘000 m³) 29<br />
Table 2.16 Predicted Production <strong>of</strong> Natural <strong>Forest</strong> Large Diameter Logs from Asia –<br />
Pacific Countries (million m 3 ) 31<br />
Table 2.17 Predicted Contribution <strong>of</strong> Plantation Wood to Regional and World Industrial Wood<br />
Supply 33<br />
Table 2.18 Predicted Production <strong>of</strong> Plantation <strong>Forest</strong> Large Diameter Logs from Asia –<br />
Pacific Countries (million m 3 ) 33<br />
Table 3.1 Volume Differences <strong>in</strong> SGS PNG Export and Ch<strong>in</strong>ese Import Figures 42<br />
Table 3.2 Hong Kong Log Imports (m 3 ) 43<br />
Table 3.3 Re-exports <strong>of</strong> Logs by Hong Kong (m 3 ) 43<br />
Table 3.4 Prices and Costs for Taun and Calophyllum Logs Exported from PNG to Japan<br />
(average Jan-July 2001) 49<br />
Table 3.5 Volume and Average FOB Price by Market 50<br />
Table 3.6 Average Log CIF Price <strong>in</strong> Japan (Custom Clearance) 51<br />
Table 3.7 Wholesale Prices <strong>of</strong> Logs – Nagoya, Japan 51<br />
Table 3.8 Cif Log Price Information – Ch<strong>in</strong>a and Hong Kong 52<br />
PAGE VIII
2001 FOREST REVENUE REVIEW<br />
Table 4.1 Summary <strong>of</strong> Average Logg<strong>in</strong>g Costs by Cost Categories 54<br />
Table 4.2 <strong>Forest</strong> Industry Logg<strong>in</strong>g Cost<strong>in</strong>g Model 55<br />
Table 4.3 Calculation on Indicative Average Pr<strong>of</strong>itability Under Current Log Export Tax System 57<br />
Table 4.4 F<strong>in</strong>ancial Model 1 – A Portable Relocatable Eco-Mill (based on a Lewis Mill) 60<br />
Table 4.5 F<strong>in</strong>ancial Model 2 – A Small Commercial Mill (based on a Wood-Mizer Mill) 61<br />
Table 4.6 F<strong>in</strong>ancial Model 3 – A Medium to Large Sawmill Based on Higher Value Species 62<br />
Table 4.7 F<strong>in</strong>ancial Model 4 – An Integrated Small Sawmill/Jo<strong>in</strong>ery Operation 63<br />
Table 4.8 F<strong>in</strong>ancial Model 5 – A Large Export Orientated Veneer Mill 65<br />
Table 4.9 F<strong>in</strong>ancial Model 6 – A Large Export Plywood Mill 66<br />
Table 4.10 F<strong>in</strong>ancial Model 7 – A Medium Density Fibreboard Mill 68<br />
Table 4.11 Sensitivity Analysis – Impact on F<strong>in</strong>ancial Viability by Chang<strong>in</strong>g Key Variables<br />
Table 4.12 Estimate <strong>of</strong> Revenue Foregone By Government for Each PNG National Employee -<br />
69<br />
Position Created <strong>in</strong> Process<strong>in</strong>g 70<br />
Table 5.1 The Affordable Level <strong>of</strong> Export Duty on Timber Process<strong>in</strong>g Operations 86<br />
Table 6.1 Benefits and Costs <strong>of</strong> Process<strong>in</strong>g for a Typical Year 94<br />
Table 6.2 Export Duty Under Different Scenarios 96<br />
Table 7.1 Comparison <strong>of</strong> Estimated Log Exports 106<br />
Table 8.1 Model Def<strong>in</strong>itions – Rent, F<strong>in</strong>ancial and Economic Returns 114<br />
Table 8.2 Base Case Model – Natural <strong>Forest</strong> Logg<strong>in</strong>g <strong>in</strong> PNG, Assumptions and Sources 115<br />
Table 8.3 Base Case Model – Economic Derivations, Assumptions and Sources 116<br />
Table 10.1 Breakdown <strong>of</strong> Landowner Costs and Follow-On Benefits 121<br />
PAGE IX
ACRONYMS<br />
APEC Asia-Pacific Economic Council<br />
APT Additional Pr<strong>of</strong>its Tax<br />
ASEAN Association <strong>of</strong> South-East Asian Nations<br />
BoPNG Bank <strong>of</strong> Papua New Gu<strong>in</strong>ea<br />
CAF Ch<strong>in</strong>ese Academy <strong>of</strong> <strong>Forest</strong>ry<br />
cif Cost, Insurance and Freight<br />
DTI Department <strong>of</strong> Trade & Industry<br />
fob Free on board<br />
FIRR F<strong>in</strong>ancial Internal Rate <strong>of</strong> Return<br />
FMA <strong>Forest</strong> Management Agreement<br />
GDP Gross domestic product<br />
IMF International Monetary Fund<br />
IRC<br />
ISO<br />
Internal Revenue Commission<br />
ITTO International Tropical Timber Organization<br />
JLIA<br />
LFA<br />
Japan Lumber Importers Association<br />
MDF Medium Density Fibreboard<br />
MLH Mixed Light Hardwoods<br />
NFA National <strong>Forest</strong> Authority<br />
NFS National <strong>Forest</strong> Service<br />
NTFP Non-Timber <strong>Forest</strong> Products<br />
PDB Project Development Benefit<br />
PDL Project Development Levy<br />
PNGFA Papua New Gu<strong>in</strong>ea <strong>Forest</strong> Authority<br />
SGS Société Générale de Surveillance<br />
SPO State Purchase Option<br />
TA Timber Authority<br />
TEV Total Economic Value<br />
TSA Timber Supply Agreement<br />
VAT Value Added Tax<br />
WWF World Wildlife Fund<br />
2001 FOREST REVENUE REVIEW<br />
PAGE X
EXECUTIVE SUMMARY<br />
2001 FOREST REVENUE REVIEW<br />
Papua New Gu<strong>in</strong>ea is engaged <strong>in</strong> <strong>review</strong> <strong>of</strong> <strong>the</strong> <strong>forest</strong> <strong>revenue</strong> <strong>system</strong> as part <strong>of</strong> a broader reform <strong>of</strong> <strong>the</strong><br />
<strong>forest</strong>ry sector. This sector experienced good trad<strong>in</strong>g conditions <strong>in</strong> <strong>the</strong> middle <strong>of</strong> <strong>the</strong> last decade, but is<br />
now adversely affected by a comb<strong>in</strong>ation <strong>of</strong> low export prices and reduced volumes, resource exhaustion<br />
<strong>in</strong> certa<strong>in</strong> prov<strong>in</strong>ces, poor growth rates <strong>in</strong> <strong>the</strong> two ma<strong>in</strong> <strong>in</strong>dustries us<strong>in</strong>g Papua New Gu<strong>in</strong>ea logs (saw and<br />
ply-mill<strong>in</strong>g), <strong>the</strong> impact <strong>of</strong> illegal logg<strong>in</strong>g <strong>in</strong> Indonesia, and <strong>the</strong> prospect <strong>of</strong> certification.<br />
Government obta<strong>in</strong>s its <strong>revenue</strong> from <strong>the</strong> <strong>forest</strong>ry sector primarily through a tax on log exports, receiv<strong>in</strong>g<br />
very little <strong>in</strong> <strong>the</strong> form <strong>of</strong> corporate <strong>in</strong>come tax. There is also a re<strong>forest</strong>ation levy and miscellaneous State<br />
<strong>in</strong>come <strong>in</strong> <strong>the</strong> form <strong>of</strong> various fees. The core <strong>of</strong> <strong>the</strong> Review Team’s analysis was to determ<strong>in</strong>e <strong>the</strong><br />
magnitude <strong>of</strong> <strong>the</strong> resource rent over time, its distribution among beneficiaries, and to propose an<br />
equitable and efficient <strong>system</strong> for allocat<strong>in</strong>g <strong>the</strong> rent <strong>in</strong> <strong>the</strong> future.<br />
Landowners also rely on log exports for royalty and premium <strong>in</strong>come, royalties be<strong>in</strong>g fixed nationwide at<br />
K10 per cubic metre log exported and premia be<strong>in</strong>g <strong>the</strong> amounts developers agree to pay that are specific<br />
to each project. Wages for logg<strong>in</strong>g and process<strong>in</strong>g, where this occurs, are commonly not landowner<br />
benefits, as many staff may be immigrants from o<strong>the</strong>r regions.<br />
A model was developed that suggested a total average cost <strong>of</strong> efficient logg<strong>in</strong>g will be about US$70 per<br />
cubic metre <strong>in</strong> <strong>the</strong> future, with wide local variations due to terra<strong>in</strong> and o<strong>the</strong>r factors, <strong>of</strong> which $39 would<br />
be <strong>the</strong> logg<strong>in</strong>g production cost, and $12 depreciation <strong>of</strong> logg<strong>in</strong>g equipment. Landowners <strong>in</strong>curred costs <strong>of</strong><br />
over $6 per cubic metre, compris<strong>in</strong>g about $2.10 for a compensation payment be<strong>in</strong>g an alternative asset<br />
<strong>of</strong> equal value to <strong>the</strong> productivity loss <strong>in</strong> <strong>the</strong> <strong>in</strong>itial cut <strong>of</strong> <strong>the</strong> virg<strong>in</strong> <strong>forest</strong>, $3.25 for <strong>the</strong> costs <strong>of</strong><br />
environmental disturbance to cropp<strong>in</strong>g, non-timber <strong>forest</strong> products collection etc., and over $1 for <strong>the</strong><br />
costs <strong>of</strong> re<strong>forest</strong>ation and subsequent land management. In <strong>the</strong> preferred <strong>system</strong> <strong>of</strong> <strong>the</strong> model, $9 per<br />
cubic metre rema<strong>in</strong>s for logger’s normal pr<strong>of</strong>it. For an fob (free on board) export price <strong>of</strong> $90 per cubic<br />
metre this would allow <strong>the</strong> Government (<strong>in</strong>clud<strong>in</strong>g prov<strong>in</strong>cial governments) and <strong>the</strong> landowners to<br />
capture 70% <strong>of</strong> <strong>the</strong> difference between <strong>the</strong> fob price and <strong>the</strong> cost <strong>of</strong> logg<strong>in</strong>g, and <strong>the</strong> loggers <strong>the</strong>mselves<br />
to capture <strong>the</strong> o<strong>the</strong>r 30% <strong>of</strong> <strong>the</strong> same difference. Historically, <strong>the</strong> loggers earned a much higher excess<br />
pr<strong>of</strong>it from <strong>the</strong> resource rent until 1996, when <strong>the</strong> Government took over this position.<br />
Conclusions from apply<strong>in</strong>g <strong>the</strong> model rest on <strong>the</strong> assumption that <strong>the</strong>re is no transfer pric<strong>in</strong>g. As <strong>the</strong><br />
Barnett Commission (1989) found this was a common practice, <strong>the</strong> Government took steps to combat it.<br />
It now employs an <strong>in</strong>dependent agency (Société Générale de Surveillance (SGS)) to monitor exports but<br />
this agency’s mandate ends with approval <strong>of</strong> <strong>the</strong> export shipment. The Review Team conducted an<br />
<strong>in</strong>vestigation <strong>in</strong>to log export pric<strong>in</strong>g from Papua New Gu<strong>in</strong>ea to Japan, Korea, and Ch<strong>in</strong>a. It found some<br />
unexpla<strong>in</strong>ed and substantial discrepancies between <strong>the</strong> declared fob prices plus freight and <strong>in</strong>surance and<br />
<strong>the</strong> dest<strong>in</strong>ation cif (cost, <strong>in</strong>surance and freight) prices that warrant fur<strong>the</strong>r <strong>in</strong>vestigation.<br />
Several process<strong>in</strong>g options <strong>in</strong>clud<strong>in</strong>g different sizes <strong>of</strong> sawmill, some secondary process<strong>in</strong>g, plywood,<br />
medium density fibreboard, and a pulp mill were studied <strong>in</strong> a standard cost<strong>in</strong>g format. It was found that<br />
<strong>the</strong> exemption from export duty <strong>of</strong> <strong>the</strong>se products imposed costs on <strong>the</strong> country that substantially<br />
outweighed benefits generated by process<strong>in</strong>g. Indeed, <strong>the</strong> pr<strong>of</strong>itability <strong>of</strong> most types <strong>of</strong> process<strong>in</strong>g was <strong>in</strong><br />
any case very low or even negative at current <strong>in</strong>ternational price levels. This was especially true <strong>of</strong> largescale<br />
operations and those dependent on one type <strong>of</strong> product i.e. <strong>the</strong> <strong>in</strong>tegrated sawmill with secondary<br />
process<strong>in</strong>g scored higher than <strong>the</strong> large secondary mills.<br />
This first attempt to assess <strong>the</strong> true economic value <strong>of</strong> <strong>the</strong> <strong>forest</strong> estate should be supplemented by<br />
targeted empirical studies, an exam<strong>in</strong>ation <strong>of</strong> logg<strong>in</strong>g case histories, and a study <strong>of</strong> how, if at all, <strong>the</strong>re are<br />
flow-on benefits to landowners from export tax receipts. The level <strong>of</strong> log export duties should be reduced<br />
<strong>in</strong> <strong>the</strong> current commercial environment, and a suitable benchmark would be <strong>the</strong> US$ level that prevailed<br />
<strong>in</strong> 1995. Logs harvested from plantations created by <strong>the</strong> exporter should be exempt. Landowner royalties<br />
PAGE 11
2001 FOREST REVENUE REVIEW<br />
need to be raised to compensate for <strong>the</strong> loss <strong>of</strong> <strong>revenue</strong> due to <strong>the</strong> reduction <strong>in</strong> <strong>the</strong> US$ value <strong>of</strong> <strong>the</strong><br />
royalty.<br />
The model <strong>system</strong> should allow loggers to recover <strong>the</strong> full cost <strong>of</strong> efficient operations and provide<br />
enough <strong>revenue</strong> to fund <strong>the</strong> Papua New Gu<strong>in</strong>ea <strong>Forest</strong> Authority. In <strong>the</strong> first <strong>in</strong>stance, landowners should<br />
receive <strong>the</strong> equivalent <strong>of</strong> $6 per cubic metre and consideration should be given to hav<strong>in</strong>g <strong>the</strong> Project<br />
Development Benefit neutral with respect to changes <strong>in</strong> <strong>the</strong> k<strong>in</strong>a. Thresholds for <strong>the</strong> application <strong>of</strong> export<br />
duty should also apply. Government and <strong>the</strong> landowners should secure 70% <strong>of</strong> <strong>the</strong> resource rent, and <strong>the</strong><br />
pr<strong>in</strong>ciples underly<strong>in</strong>g <strong>the</strong>se considerations should be universal enough to apply to non-timber <strong>forest</strong><br />
products too.<br />
At present <strong>the</strong>re is <strong>in</strong>sufficient actuarial evidence <strong>of</strong> <strong>the</strong> risk <strong>of</strong> default to propose any changes <strong>in</strong> <strong>the</strong><br />
<strong>system</strong> <strong>of</strong> performance bonds for <strong>forest</strong> operators now used.<br />
PAGE 12
PART 1 INTRODUCTION<br />
2001 FOREST REVENUE REVIEW<br />
Papua New Gu<strong>in</strong>ea is engaged <strong>in</strong> a <strong>review</strong> process <strong>of</strong> <strong>the</strong> <strong>forest</strong> <strong>revenue</strong> <strong>system</strong>. The <strong>review</strong> is part <strong>of</strong> a<br />
broader reform <strong>of</strong> <strong>the</strong> <strong>forest</strong>ry sector and <strong>in</strong>cludes amendments to <strong>the</strong> <strong>Forest</strong>ry Act to improve<br />
governance and accountability, an Independent Review <strong>of</strong> timber harvest<strong>in</strong>g applications <strong>in</strong> process<br />
dur<strong>in</strong>g <strong>the</strong> current moratorium on grant<strong>in</strong>g <strong>of</strong> <strong>new</strong> concessions, and a proposed <strong>Forest</strong>ry and<br />
Conservation Project supported by <strong>the</strong> World Bank.<br />
1.1 NATIONAL ECONOMY<br />
1.1.1 Demography<br />
Papua New Gu<strong>in</strong>ea’s <strong>forest</strong>ry sector must be viewed aga<strong>in</strong>st <strong>the</strong> backdrop <strong>of</strong> <strong>the</strong> whole economy, which<br />
is essentially dual. The formal sector is predom<strong>in</strong>antly urban, but <strong>the</strong> <strong>in</strong>formal sector supports about 80%<br />
<strong>of</strong> <strong>the</strong> population through subsistence and small hold<strong>in</strong>g activities. Population densities, even <strong>in</strong> <strong>the</strong><br />
Highlands Region where figures reach from 23 to 52 perkm 2 , are still low enough to permit a 20-hour<br />
work<strong>in</strong>g week to provide sustenance even <strong>in</strong> <strong>the</strong> context <strong>of</strong> a total fertility rate <strong>of</strong> 4.6 children per woman<br />
and a population growth rate <strong>of</strong> 3.1% per annum. Smallholders have <strong>in</strong>creased <strong>the</strong>ir proportion <strong>of</strong><br />
national commodity production <strong>in</strong> <strong>the</strong> last two decades, reach<strong>in</strong>g 82% <strong>of</strong> <strong>the</strong> total for c<strong>of</strong>fee, 75% for<br />
cocoa, 83% for copra, and 68% for rubber. Only for oil palm are smallholders <strong>the</strong> m<strong>in</strong>ority producers<br />
(32%). But major <strong>forest</strong>ry activities are concentrated <strong>in</strong> prov<strong>in</strong>ces such as Western, Gulf, Sandaun, West<br />
and East New Brita<strong>in</strong>, where, except for some rubber and much oil palm <strong>in</strong> New Brita<strong>in</strong>, cash crop<br />
plantations are not yet present. In <strong>the</strong> case <strong>of</strong> <strong>the</strong> Western and Sou<strong>the</strong>rn Regions, <strong>the</strong> <strong>forest</strong>ry prov<strong>in</strong>ces<br />
are also those with <strong>the</strong> lowest population densities <strong>of</strong> 2 to 8/km 2 , so <strong>forest</strong> operations have <strong>the</strong> potential<br />
for major local social and economic impact, depend<strong>in</strong>g on <strong>the</strong> degree to which local labour is employed.<br />
1.1.2 Growth<br />
Nom<strong>in</strong>al GDP at K9.8 billion <strong>in</strong> 2000 <strong>in</strong>dicates a GDP/capita <strong>of</strong> US$744. This had been as high as<br />
$1,208 <strong>in</strong> <strong>the</strong> halcyon mid-years <strong>of</strong> <strong>the</strong> last decade, when <strong>the</strong> economy had benefited from <strong>the</strong> end <strong>of</strong> <strong>the</strong><br />
“strong k<strong>in</strong>a” era, <strong>the</strong> October 1994 float lead<strong>in</strong>g steadily down to <strong>the</strong> present exchange rate. Recent<br />
activities by <strong>the</strong> Bank <strong>of</strong> Papua New Gu<strong>in</strong>ea <strong>in</strong> <strong>the</strong> money market suggest that <strong>the</strong> preferred rate is above<br />
<strong>the</strong> 28 US cents mark, but <strong>the</strong> currency is now below this po<strong>in</strong>t. Growth, which had been negative <strong>in</strong><br />
1997-8, returned to 3.2% <strong>in</strong> 1999, as <strong>the</strong> country emerged sca<strong>the</strong>d from <strong>the</strong> Asian f<strong>in</strong>ancial crisis, but <strong>the</strong><br />
estimate <strong>of</strong> 0.8% for 2000 <strong>in</strong>dicates that <strong>the</strong> <strong>of</strong>ficial projection <strong>of</strong> 3.1% for 2001 was highly optimistic. In<br />
fact <strong>in</strong> 2001 <strong>the</strong> economy was <strong>in</strong> recession. Components <strong>of</strong> lower growth performance have been <strong>the</strong><br />
decl<strong>in</strong>e <strong>in</strong> c<strong>of</strong>fee and copra production and prices, and <strong>in</strong> crude oil extraction rates, with fur<strong>the</strong>r reduced<br />
log exports also a factor. Exam<strong>in</strong><strong>in</strong>g <strong>the</strong> trend <strong>of</strong> sectors over <strong>the</strong> last decade <strong>the</strong> smoo<strong>the</strong>d annual growth<br />
rates have been 4.6% per annum for <strong>the</strong> whole economy, 10.7% per annum. for m<strong>in</strong>erals, 6.0% per<br />
annum. for manufactur<strong>in</strong>g, and just 3.1% per annum for agriculture, <strong>forest</strong>ry and fish<strong>in</strong>g. But such rates<br />
conceal <strong>the</strong> sharp fluctuations that afflict commodity-dependent economies; for example <strong>the</strong> m<strong>in</strong>eral<br />
sector GDP contribution <strong>in</strong> real terms contracted 26.0% <strong>in</strong> 1997, but expanded 16.8% <strong>in</strong> 1998.<br />
1.1.3 Sectoral Performance<br />
The relative importance <strong>of</strong> <strong>the</strong> sectors with<strong>in</strong> Papua New Gu<strong>in</strong>ea’s economy, and specifically <strong>forest</strong>ry,<br />
can be gauged by contributions to GDP, to export <strong>revenue</strong>, and to employment. In 2000, <strong>the</strong> m<strong>in</strong>erals and<br />
oil sector accounted for 28.8% <strong>of</strong> GDP and 77.3% <strong>of</strong> exports, both <strong>the</strong>se contributions hav<strong>in</strong>g grown by<br />
20.5% and 27.5% respectively over <strong>the</strong> previous year. But <strong>the</strong> factors beh<strong>in</strong>d <strong>the</strong>se improvements –<br />
higher copper and crude oil prices, <strong>in</strong>creased gold production at Porgera, Ok Tedi and Misima, improved<br />
labour productivity and <strong>the</strong> k<strong>in</strong>a depreciation – must be viewed aga<strong>in</strong>st <strong>the</strong> planned dates for m<strong>in</strong>e<br />
closures, decl<strong>in</strong><strong>in</strong>g reserves, and lower ore grades <strong>in</strong> some case. Low share prices for <strong>the</strong> m<strong>in</strong><strong>in</strong>g<br />
companies reflect <strong>in</strong>vestor pessimism on observation <strong>of</strong> <strong>the</strong> absence <strong>of</strong> <strong>new</strong> exploration activity.<br />
PAGE 13
2001 FOREST REVENUE REVIEW<br />
Manufactur<strong>in</strong>g, with 8.9% <strong>of</strong> total GDP <strong>in</strong> 2000 and 7.5% <strong>of</strong> total exports, is an important sector, with<br />
<strong>forest</strong>s contribut<strong>in</strong>g through sawn timber, plywood, veneers, furniture, and woodchips. It is true that <strong>the</strong><br />
contribution has not grown <strong>in</strong> <strong>the</strong> last decade (9% <strong>of</strong> GDP <strong>in</strong> 1990), but this observation is <strong>in</strong> relative<br />
terms, and due to <strong>the</strong> expansion <strong>in</strong> m<strong>in</strong>erals, as <strong>the</strong> absolute value <strong>of</strong> manufactur<strong>in</strong>g production has<br />
<strong>in</strong>creased. But most manufactures are primary process<strong>in</strong>g operations on local food crops such as palm oil,<br />
copra cake, black tea, sugar, canned meat and fish, and coconut oil based cosmetics. Consequently <strong>the</strong>y<br />
are still vulnerable to commodity market fluctuations such as <strong>the</strong> recent effect <strong>of</strong> <strong>in</strong>creased palm oil<br />
production <strong>in</strong> <strong>the</strong> Philipp<strong>in</strong>es and Indonesia and <strong>in</strong>creased palm oil production <strong>in</strong> Malaysia.<br />
1.1.4 Employment<br />
The importance <strong>of</strong> <strong>the</strong> non-m<strong>in</strong><strong>in</strong>g primary sector is, as mentioned <strong>in</strong> <strong>the</strong> open<strong>in</strong>g paragraph, its provision<br />
<strong>of</strong> a livelihood for over 80% <strong>of</strong> <strong>the</strong> population. Although its share <strong>of</strong> GDP fell <strong>in</strong> 2000 due to depressed<br />
c<strong>of</strong>fee and copra prices, it still comprises 25.6%, only a slight decl<strong>in</strong>e from 29% <strong>in</strong> 1990. The<br />
employment <strong>in</strong> this sector is small, ow<strong>in</strong>g to <strong>the</strong> major subsistence component, and <strong>in</strong>deed because <strong>of</strong> this<br />
<strong>the</strong>re appears to be no <strong>of</strong>ficial estimate <strong>of</strong> <strong>the</strong> size <strong>of</strong> <strong>the</strong> labour force, or <strong>of</strong> <strong>the</strong> rate <strong>of</strong> unemployment (a<br />
figure <strong>of</strong> 60% for this latter statistic quoted <strong>in</strong> <strong>the</strong> media for <strong>the</strong> National Capital District is so extreme as<br />
to suggest <strong>the</strong>re is no proper base on which to make a calculation). Formal private sector employment<br />
statistics tend to be published as <strong>in</strong>dices, and <strong>the</strong> trend s<strong>in</strong>ce <strong>the</strong> base year 1989 is very flat, except for<br />
m<strong>in</strong><strong>in</strong>g, which has risen over 50% i.e. 3.8% per annum.<br />
So <strong>the</strong> population <strong>in</strong>crease <strong>of</strong> 3.3% per annum is not be<strong>in</strong>g absorbed by <strong>in</strong>creased job opportunities,<br />
except for <strong>the</strong> fraction provided by m<strong>in</strong><strong>in</strong>g. Given <strong>the</strong> life expectancy at birth <strong>of</strong> 58 years and assum<strong>in</strong>g<br />
that survivorship from <strong>the</strong> <strong>in</strong>fantile mortality rate <strong>of</strong> 79 per 1000 live births gives a slightly longer life<br />
expectancy for those who reach age 15, <strong>the</strong> labour force from 15 to 55, say, may be composed <strong>of</strong> perhaps<br />
a million workers <strong>in</strong> <strong>the</strong> subsistence sector plus ano<strong>the</strong>r 1.5 million hidden unemployed <strong>in</strong> rural areas,<br />
and a formal private sector workforce <strong>of</strong> 800,000, <strong>of</strong> whom about 30% may be seek<strong>in</strong>g work. Such a total<br />
estimated labour force <strong>of</strong> 3.3 million out <strong>of</strong> <strong>the</strong> population <strong>of</strong> 5.1million (2000 census) also conceals<br />
demographic shifts and regional production changes which have led to a fall <strong>in</strong> employment <strong>in</strong> <strong>the</strong><br />
Highlands region over <strong>the</strong> last five years <strong>of</strong> 19.0%, but a rise <strong>in</strong> Lae <strong>of</strong> 11.8% and <strong>in</strong> Madang and Wewak<br />
<strong>of</strong> 57.7%. The paucity <strong>of</strong> derived demographic data on employment makes <strong>the</strong> calculation <strong>of</strong><br />
employment multipliers for specific <strong>in</strong>dustries such as <strong>forest</strong>ry a daunt<strong>in</strong>g task.<br />
1.1.5 Trade<br />
Dur<strong>in</strong>g <strong>the</strong> last decade Papua New Gu<strong>in</strong>ea has ma<strong>in</strong>ta<strong>in</strong>ed a healthy and grow<strong>in</strong>g balance <strong>of</strong> visible trade<br />
surplus, K3,034 million <strong>in</strong> 2000, <strong>the</strong> sum <strong>of</strong> surpluses with all <strong>in</strong>dividual trad<strong>in</strong>g partners. However,<br />
<strong>in</strong>ternational reserves, which have been <strong>in</strong>creas<strong>in</strong>g, still cover only 4.6 months <strong>of</strong> imports. Moreover, <strong>the</strong><br />
total balance <strong>of</strong> payments situation is affected by a deficit <strong>of</strong> K2,049 million on <strong>in</strong>visibles, leav<strong>in</strong>g a<br />
lower balance <strong>of</strong> K973 million on <strong>the</strong> current account and a residual surplus <strong>of</strong> just K359 million when<br />
<strong>the</strong> capital account deficit is <strong>in</strong>cluded as well. Exports are dom<strong>in</strong>ated by <strong>the</strong> m<strong>in</strong>eral sector, especially<br />
crude oil (33%) and gold (34%), with 77.3% <strong>of</strong> <strong>the</strong> total K5,813 million, and <strong>the</strong> ma<strong>in</strong> commodities <strong>in</strong><br />
<strong>the</strong> agricultural total <strong>of</strong> K838.5 million are c<strong>of</strong>fee and palm oil. Logs now comprise only 4.9% <strong>of</strong> export<br />
<strong>revenue</strong>, but <strong>in</strong> 1995 <strong>the</strong>y had exceeded <strong>the</strong> value <strong>of</strong> <strong>the</strong> output <strong>of</strong> <strong>the</strong> sum <strong>of</strong> all o<strong>the</strong>r agricultural<br />
commodities. It is <strong>in</strong>terest<strong>in</strong>g to note that no o<strong>the</strong>r export commodity from Papua New Gu<strong>in</strong>ea has<br />
suffered so great a fall (55%) <strong>in</strong> its <strong>in</strong>ternational benchmark price as tropical logs dur<strong>in</strong>g <strong>the</strong> last four<br />
years. Even <strong>in</strong> k<strong>in</strong>a terms, <strong>the</strong> trend l<strong>in</strong>e for logs is flat to slightly ris<strong>in</strong>g, whereas o<strong>the</strong>rs, except rubber,<br />
show stronger ris<strong>in</strong>g trends <strong>in</strong> k<strong>in</strong>a unit values.<br />
After Australia, which accounts for 56.2% <strong>of</strong> imports and 52.0% <strong>of</strong> exports, <strong>the</strong> next largest trad<strong>in</strong>g<br />
partners, Japan and <strong>the</strong> USA, account for 7-8% <strong>of</strong> trade respectively. APEC nations account for 83% <strong>of</strong><br />
exports and 86% <strong>of</strong> imports, with ASEAN trade figures below 5% <strong>of</strong> <strong>the</strong> total for both directions.<br />
Australia also dom<strong>in</strong>ates foreign equity hold<strong>in</strong>gs <strong>in</strong> Papua New Gu<strong>in</strong>ea, with about 64% <strong>of</strong> <strong>the</strong> total,<br />
ma<strong>in</strong>ly <strong>in</strong> m<strong>in</strong><strong>in</strong>g, and foreign equity generates about 33% <strong>of</strong> GDP. The next two largest countries <strong>of</strong><br />
PAGE 14
2001 FOREST REVENUE REVIEW<br />
orig<strong>in</strong> <strong>of</strong> foreign <strong>in</strong>vestment are <strong>the</strong> United K<strong>in</strong>gdom (6%), and Malaysia (4%). The latter country is very<br />
important <strong>in</strong> <strong>the</strong> <strong>forest</strong>ry sector, although its <strong>in</strong>vestors are also active <strong>in</strong> o<strong>the</strong>r areas, such as retail<strong>in</strong>g and<br />
<strong>the</strong> media. Some 10-14% <strong>of</strong> foreign equity technically orig<strong>in</strong>ates from companies domiciled <strong>in</strong> tax<br />
havens such as Bermuda and <strong>the</strong> Bahamas, so <strong>the</strong> shares <strong>of</strong> some major <strong>in</strong>vestors are likely to be higher<br />
<strong>in</strong> reality, with <strong>the</strong> current privatisation process lead<strong>in</strong>g to fur<strong>the</strong>r <strong>in</strong>creases. But <strong>the</strong> process <strong>of</strong><br />
privatisation has slowed, <strong>in</strong>troduc<strong>in</strong>g <strong>the</strong> risk <strong>of</strong> <strong>in</strong>ternational aid agency support be<strong>in</strong>g delayed until <strong>the</strong><br />
end <strong>of</strong> <strong>the</strong> process is much more predictable.<br />
1.1.6 Inflation & Interest Rates<br />
Little need be said about <strong>the</strong> level <strong>of</strong> <strong>the</strong> <strong>in</strong>flation rate (15.6% between 1999 and 2000), as <strong>the</strong> consumer<br />
price <strong>in</strong>dex is strongly <strong>in</strong>fluenced by <strong>the</strong> cont<strong>in</strong>ued depreciation <strong>of</strong> <strong>the</strong> k<strong>in</strong>a (7.65% <strong>in</strong> 1999-2000),<br />
especially if <strong>the</strong> underly<strong>in</strong>g <strong>in</strong>flation rate is considered (11.8% <strong>in</strong> 1999-2000), s<strong>in</strong>ce this excludes <strong>the</strong><br />
effects <strong>of</strong> Government policy decisions on excise taxes and valued added tax. By September 2001 <strong>the</strong><br />
<strong>in</strong>flation rate had fallen below 10%. Interest rates also reflect <strong>the</strong> overall monetary position, with<br />
Treasury Bills at 14-15% per annum (<strong>the</strong>y were over 20% per annum a year ago), and weighted average<br />
lend<strong>in</strong>g rates at 17.3% <strong>in</strong> 2000 (<strong>forest</strong>ry loans at commercial banks are relatively low <strong>in</strong> total), with<br />
ord<strong>in</strong>ary passbook sav<strong>in</strong>gs accounts yield<strong>in</strong>g 2.5 to 5.25% per annum, and commercial 180-day bank<br />
deposits at 8.5% compared to nearly 17% last year).<br />
1.1.7 Exchange Rate<br />
The k<strong>in</strong>a was devalued <strong>in</strong> September 1994 and <strong>the</strong>n floated <strong>the</strong> follow<strong>in</strong>g month. A susta<strong>in</strong>ed<br />
depreciation occurred, <strong>the</strong> rate <strong>of</strong> decl<strong>in</strong>e only recently slacken<strong>in</strong>g. Fur<strong>the</strong>r falls are likely. One cause<br />
appears to have been <strong>the</strong> downward trend <strong>in</strong> foreign exchange <strong>in</strong>flows, at times almost exhaust<strong>in</strong>g<br />
<strong>in</strong>ternational reserves, although <strong>the</strong>se are now at $370 million (November 2001) follow<strong>in</strong>g IMF balance<br />
<strong>of</strong> payments support. The o<strong>the</strong>r problem has been <strong>the</strong> dependence on domestically f<strong>in</strong>anced deficits that<br />
have <strong>in</strong>creased import demand. Papua New Gu<strong>in</strong>ea generally has a high degree <strong>of</strong> dependence on<br />
imports.<br />
1.1.8 Government F<strong>in</strong>ance and Taxation<br />
However, <strong>the</strong> fiscal operations <strong>of</strong> central government are <strong>of</strong> particular relevance to this study, ow<strong>in</strong>g to<br />
<strong>the</strong> contribution <strong>of</strong> <strong>the</strong> log export tax, <strong>in</strong> 2000 25.9% <strong>of</strong> all taxes on trade, 15.8% <strong>of</strong> all <strong>in</strong>direct taxes,<br />
5.8% <strong>of</strong> all tax <strong>revenue</strong> and 4.5% <strong>of</strong> total government <strong>revenue</strong> <strong>in</strong>clud<strong>in</strong>g foreign grants. Significant<br />
import duties also protect domestic process<strong>in</strong>g. The budget deficit <strong>in</strong> this year was 192.3 million k<strong>in</strong>a, <strong>of</strong><br />
<strong>the</strong> same order <strong>of</strong> magnitude as <strong>the</strong> log export tax <strong>revenue</strong> at 133.9 million k<strong>in</strong>a (Department <strong>of</strong> Trade &<br />
Industry figure – SGS figure is 135.9 million k<strong>in</strong>a). National expenditure is broken down <strong>in</strong>to recurrent<br />
and development expenditures, with both divisions fur<strong>the</strong>r allocated between national and prov<strong>in</strong>cial<br />
categories, and <strong>in</strong>terest payments (<strong>of</strong> course recurrent) account<strong>in</strong>g for most <strong>of</strong> <strong>the</strong> residual 17% <strong>of</strong><br />
expenditure.<br />
Apart from <strong>the</strong> prov<strong>in</strong>cial government allocation <strong>of</strong> about 18% <strong>of</strong> <strong>the</strong> total and ano<strong>the</strong>r 1% for prov<strong>in</strong>cial<br />
projects, <strong>the</strong>re are no sub-national targets for national expenditure, so <strong>the</strong> log export tax, along with o<strong>the</strong>r<br />
<strong>revenue</strong>s from <strong>the</strong> sector <strong>in</strong> <strong>the</strong> shape <strong>of</strong> excise taxes, company taxes, and personal and VAT taxes paid<br />
by employees, may be allocated to any part <strong>of</strong> <strong>the</strong> economy, or used to pay <strong>in</strong>terest. The budget deficit is<br />
f<strong>in</strong>anced through <strong>the</strong> domestic bank<strong>in</strong>g <strong>system</strong>, plus external concessional and commercial f<strong>in</strong>anc<strong>in</strong>g, <strong>the</strong><br />
proportions vary<strong>in</strong>g year by year. To summarize, <strong>revenue</strong> is obta<strong>in</strong>ed from tax (77%), grants (17%) and<br />
6% o<strong>the</strong>r sources, to be spent on national departments (39%), prov<strong>in</strong>cial governments (18%),<br />
development projects (26%), and <strong>in</strong>terest, etc (17%). Debt is primarily domestic, compris<strong>in</strong>g two-thirds<br />
<strong>of</strong> <strong>the</strong> K419.9 million <strong>in</strong>terest payments paid <strong>in</strong> 2000.<br />
Company tax rates differ by <strong>in</strong>dustry, and by residence or non-residence, and also for <strong>new</strong> and exist<strong>in</strong>g<br />
companies (petroleum). There is also an additional pr<strong>of</strong>its tax for m<strong>in</strong><strong>in</strong>g, petroleum, and gas projects but<br />
<strong>forest</strong>ry falls <strong>in</strong> <strong>the</strong> general category at 25% and 17% withhold<strong>in</strong>g tax on dividends for resident<br />
PAGE 15
2001 FOREST REVENUE REVIEW<br />
companies, with non-resident companies at 48% and 0% for corporate and dividend withhold<strong>in</strong>g tax<br />
respectively. The position <strong>in</strong> non-<strong>forest</strong> <strong>in</strong>dustries is <strong>of</strong> <strong>in</strong>terest and relevance as a possible model for<br />
<strong>forest</strong>ry. Personal <strong>in</strong>come taxes are progressive from 25% to 47% (over K95,000 per annum) for<br />
residents and similar, but with a zero threshold for <strong>the</strong> lowest rate, <strong>in</strong> <strong>the</strong> case <strong>of</strong> non-residents. S<strong>in</strong>ce <strong>the</strong><br />
m<strong>in</strong>imum adult wage is 24.68 k<strong>in</strong>a per week, a worker would need to earn nearly five times this amount<br />
to reach <strong>the</strong> lowest taxable bracket, so it may be assumed that national workers <strong>in</strong> <strong>forest</strong> <strong>in</strong>dustries will<br />
furnish negligible or nil <strong>revenue</strong> to government as personal taxation.<br />
This thumbnail sketch <strong>of</strong> <strong>the</strong> national economy, although limited, is relevant as it gives a framework for<br />
assess<strong>in</strong>g <strong>the</strong> effects <strong>of</strong> any proposed changes <strong>in</strong> <strong>the</strong>ir widest sphere <strong>of</strong> <strong>in</strong>fluence, and also serves as a<br />
rem<strong>in</strong>der that <strong>the</strong> Government has commissioned this work.<br />
1.2 THE FORESTRY SECTOR<br />
1.2.1 Resource Characteristics<br />
Although <strong>the</strong> total land area <strong>of</strong> Papua New Gu<strong>in</strong>ea, 462,840 km 2 , is known with reasonable precision, as<br />
are <strong>the</strong> areas <strong>of</strong> each prov<strong>in</strong>ce and region, it is a relatively static feature, chang<strong>in</strong>g only slowly with geomorphological<br />
processes <strong>of</strong> erosion and deposition. But imprecision beg<strong>in</strong>s with <strong>the</strong> estimate <strong>of</strong> <strong>the</strong><br />
<strong>forest</strong>ed area, and <strong>in</strong>creases with efforts to measure <strong>the</strong> important categories <strong>of</strong> <strong>forest</strong>, such as protection<br />
<strong>forest</strong> and production <strong>forest</strong>, not only because <strong>of</strong> physical changes <strong>in</strong> <strong>the</strong> <strong>forest</strong>, but also because <strong>of</strong><br />
economic, adm<strong>in</strong>istrative and political <strong>in</strong>fluences on <strong>forest</strong> use over time.<br />
The last published Annual Report <strong>of</strong> <strong>the</strong> Papua New Gu<strong>in</strong>ea <strong>Forest</strong> Authority for 1995 and <strong>the</strong> National<br />
<strong>Forest</strong> Plan <strong>of</strong> 1996 have some data on <strong>forest</strong> areas, not necessarily mutually consistent. The total area <strong>of</strong><br />
<strong>forest</strong> was <strong>the</strong>n assessed at 39.4 million hectares (ha), <strong>of</strong> which conifers at higher altitudes accounted for<br />
about 1mill ha. Protection <strong>forest</strong>s totalled 1.66 million ha, and montane <strong>forest</strong>s or those that suffered<br />
seasonal <strong>in</strong>undation, ano<strong>the</strong>r 17.45 million ha, could also be considered unsuitable for wood production.<br />
O<strong>the</strong>r areas not considered <strong>in</strong>cluded 6.71 million ha, part <strong>of</strong> which would have comprised conversion<br />
(salvage) <strong>forest</strong>s and also de-<strong>forest</strong>ed areas, or even non-<strong>forest</strong>ed areas, suitable for re<strong>forest</strong>ation and<br />
af<strong>forest</strong>ation. (54,000 ha <strong>of</strong> plantations were <strong>in</strong> existence at that stage). The significance <strong>of</strong> <strong>the</strong> rema<strong>in</strong>der,<br />
<strong>the</strong> production <strong>forest</strong>, lay <strong>in</strong> whe<strong>the</strong>r it had been acquired by <strong>the</strong> PNGFA i.e. a <strong>Forest</strong> Management<br />
Agreement had been entered <strong>in</strong>to with <strong>the</strong> landowners or whe<strong>the</strong>r it was still just “potential” production<br />
<strong>forest</strong>. By 1996, 3.72 million ha <strong>of</strong> operable <strong>forest</strong> had been acquired, and ano<strong>the</strong>r 5.03 million ha<br />
acquired <strong>of</strong> <strong>in</strong>operable <strong>forest</strong>, accord<strong>in</strong>g to <strong>the</strong> National <strong>Forest</strong> Plan, but accord<strong>in</strong>g to <strong>the</strong> 1995 PNGFA<br />
Annual Report only 6.13 million ha had been acquired <strong>of</strong> which 4.42 had actually been allocated to<br />
developers.<br />
<strong>Forest</strong> resources are widely distributed, have variable characteristics, <strong>in</strong>volve extensive customary<br />
(private) ownership, and are re<strong>new</strong>able to some degree. Inventories <strong>of</strong> <strong>the</strong> <strong>forest</strong> resource have been<br />
developed on <strong>the</strong> basis <strong>of</strong> establish<strong>in</strong>g <strong>the</strong> potential for commercial operations.<br />
<strong>Forest</strong>s are distributed across <strong>the</strong> country from sea level to high altitudes. They are essentially private<br />
<strong>forest</strong>s, whose owners utilize <strong>the</strong>m for various purposes, rang<strong>in</strong>g from commercial to subsistence<br />
application. Only about 15% <strong>of</strong> <strong>forest</strong>ed lands are considered <strong>of</strong> commercial potential, given resource<br />
characteristics, location and access situations, environmental restrictions, and o<strong>the</strong>r limit<strong>in</strong>g factors. The<br />
Rapid Resource Appraisal carried out <strong>in</strong> 1995, whose f<strong>in</strong>d<strong>in</strong>gs were endorsed by <strong>the</strong> National <strong>Forest</strong><br />
Board, <strong>in</strong>dicated an annual susta<strong>in</strong>able volume figure <strong>of</strong> 4.2 million cubic metres. Various o<strong>the</strong>r estimates<br />
have been made, however it appears that this figure has some formal recognition.<br />
A general characteristic <strong>of</strong> PNG <strong>forest</strong>s is <strong>the</strong> multiplicity <strong>of</strong> species. There are only a few exceptions, for<br />
example, <strong>the</strong> Calophyllum <strong>forest</strong>s <strong>of</strong> Manus Island, <strong>the</strong> Term<strong>in</strong>alia <strong>forest</strong>s <strong>of</strong> Bouga<strong>in</strong>ville, <strong>the</strong> Mersawa<br />
<strong>forest</strong>s <strong>of</strong> Morobe south coast and <strong>the</strong> conifer <strong>forest</strong>s <strong>of</strong> <strong>the</strong> Cromwell Mounta<strong>in</strong>s and various locations <strong>in</strong><br />
<strong>the</strong> Highlands. This creates generally low competitive advantage <strong>in</strong> comparison to <strong>the</strong> Dipterocarp<br />
PAGE 16
2001 FOREST REVENUE REVIEW<br />
<strong>forest</strong>s <strong>of</strong> <strong>the</strong> ma<strong>in</strong> production areas <strong>of</strong> South East Asia. Topographical variations and climatic conditions<br />
across <strong>the</strong> regions <strong>of</strong> PNG also affect <strong>the</strong> commercial potential <strong>of</strong> <strong>the</strong> <strong>forest</strong>s, as does proximity to<br />
domestic markets or load<strong>in</strong>g po<strong>in</strong>ts for export.<br />
PNG <strong>forest</strong>s after logg<strong>in</strong>g demonstrate a natural “re<strong>new</strong>ability” dependent on <strong>the</strong> silvicultural dynamics<br />
<strong>of</strong> <strong>the</strong> tree species present, and <strong>the</strong> cont<strong>in</strong>ued exclusion <strong>of</strong> fur<strong>the</strong>r man-made disturbances such that even<br />
<strong>in</strong> a condition <strong>of</strong> “benign neglect”, <strong>the</strong>re is a potential for resource re<strong>new</strong>al. However, as a general rule,<br />
<strong>the</strong> succeed<strong>in</strong>g cutt<strong>in</strong>g cycles will not produce <strong>the</strong> same volume and species mix as <strong>the</strong> orig<strong>in</strong>al harvest.<br />
Aga<strong>in</strong>, however, <strong>the</strong>re are exceptions, dependent on <strong>the</strong> dynamics <strong>of</strong> <strong>the</strong> particular <strong>forest</strong> species and <strong>the</strong><br />
cont<strong>in</strong>uity <strong>of</strong> favourable conditions.<br />
There is some scope for confidence <strong>in</strong> programmes <strong>of</strong> resource replacement and improvement <strong>in</strong><br />
rehabilitation <strong>of</strong> <strong>forest</strong> quality after logg<strong>in</strong>g, over time.<br />
The World Bank is advis<strong>in</strong>g on a structural adjustment programme, with some worries <strong>in</strong> <strong>the</strong> private<br />
sector <strong>of</strong> <strong>the</strong> prospect <strong>of</strong> additional f<strong>in</strong>ancial burdens <strong>in</strong> <strong>the</strong> form <strong>of</strong> value added tax and <strong>in</strong>creased<br />
payments to landowners (Pleydell and Tomaselli, 1999).<br />
In Papua New Gu<strong>in</strong>ea about 97% <strong>of</strong> <strong>the</strong> land is privately owned. In pr<strong>in</strong>ciple, s<strong>in</strong>ce <strong>the</strong> 1991 <strong>Forest</strong>ry Act<br />
(amended <strong>in</strong> 2000), harvest<strong>in</strong>g is arranged by a process <strong>of</strong> group<strong>in</strong>g <strong>forest</strong> owners <strong>in</strong>to representative<br />
resource-owner bodies who lease a sufficiently large operable area to <strong>the</strong> Government, which <strong>the</strong>n is able<br />
to negotiate a <strong>forest</strong>ry project with a developer. However, contracts dat<strong>in</strong>g back before 1991 rema<strong>in</strong> <strong>in</strong><br />
place, and will mostly expire by 2003. This has also a source <strong>of</strong> concern for <strong>the</strong> <strong>forest</strong> <strong>in</strong>dustry operat<strong>in</strong>g<br />
<strong>in</strong> <strong>the</strong> country. Logg<strong>in</strong>g agreements post-1991 are estimated to provide an annual allowable cut <strong>of</strong><br />
between 3 and 4 million m 3 over a 35 to 40 year cycle.<br />
1.2.2 Commission <strong>of</strong> Inquiry<br />
As a result <strong>of</strong> <strong>in</strong>dustry concerns relat<strong>in</strong>g to aspects <strong>of</strong> <strong>the</strong> market<strong>in</strong>g activity <strong>of</strong> <strong>the</strong> <strong>Forest</strong> Industry<br />
Council, <strong>the</strong> Government <strong>of</strong> <strong>the</strong> day <strong>in</strong>stituted a Commission <strong>of</strong> Inquiry <strong>in</strong>to <strong>the</strong>se activities. Monitor<strong>in</strong>g<br />
<strong>of</strong> <strong>the</strong> sector markedly improved, and a general <strong>Forest</strong> Policy <strong>review</strong> was commenced. In <strong>the</strong> process <strong>of</strong><br />
<strong>in</strong>vestigation, additional Terms <strong>of</strong> Reference were developed to cover sector-wide matters.<br />
General f<strong>in</strong>d<strong>in</strong>gs were made public, <strong>the</strong> most topical be<strong>in</strong>g that at <strong>the</strong> time <strong>of</strong> <strong>the</strong> Inquiry, transfer pric<strong>in</strong>g<br />
<strong>of</strong> logs was common, only two operators be<strong>in</strong>g found free <strong>of</strong> <strong>the</strong> practice. Some steps were taken by<br />
Government to achieve more transparent market<strong>in</strong>g practices.<br />
1.2.3 New <strong>Forest</strong> Act and Policy<br />
The last 10 years or so has been one <strong>of</strong> dynamic change. This has <strong>in</strong>cluded <strong>the</strong> development <strong>of</strong> a <strong>new</strong><br />
<strong>Forest</strong> Policy and <strong>the</strong> <strong>Forest</strong> Act, 1991 as amended <strong>in</strong> 2000. Institutional modifications, development <strong>of</strong><br />
<strong>the</strong> required field <strong>system</strong>s, and large variations <strong>of</strong> market conditions have placed <strong>the</strong> sector <strong>in</strong> a condition<br />
<strong>of</strong> transition, fluctuation, and uncerta<strong>in</strong>ty that, unless urgently addressed, will cont<strong>in</strong>ue for some time to<br />
come.<br />
The early 1990s saw a change <strong>in</strong> <strong>the</strong> <strong>in</strong>vestment structure <strong>of</strong> <strong>the</strong> sector. Malaysian <strong>in</strong>vestors entered <strong>the</strong><br />
sector strongly <strong>in</strong> <strong>the</strong> immediate post-Inquiry period. Many exist<strong>in</strong>g operations were acquired by<br />
purchase, broadly spread across PNG, and greatly varied <strong>in</strong> scale. These operations were <strong>in</strong> a position to<br />
take advantage <strong>of</strong> <strong>the</strong> dramatic price hike <strong>in</strong> early 1993, and volumes significantly <strong>in</strong>creased <strong>in</strong> response<br />
<strong>of</strong> strong market demand. This demand has now tapered <strong>of</strong>f to 1992 harvest levels.<br />
A <strong>new</strong> <strong>Forest</strong> Policy was developed and approved by Parliament <strong>in</strong> 1991.The development process<br />
extended over a period <strong>of</strong> three years with contributions from <strong>in</strong>terest groups and Government. <strong>Forest</strong><br />
legislation was drawn from <strong>the</strong> <strong>Forest</strong> Policy. In h<strong>in</strong>dsight this process could have been better managed<br />
PAGE 17
2001 FOREST REVENUE REVIEW<br />
by cont<strong>in</strong>ued <strong>in</strong>put by <strong>the</strong> Interim <strong>Forest</strong> Management Committee which had been established to exam<strong>in</strong>e<br />
and report on policy issues, and which essentially developed <strong>the</strong> <strong>forest</strong> policy draft for consideration.<br />
Adm<strong>in</strong>istration and implementation <strong>of</strong> <strong>the</strong> <strong>new</strong> <strong>Forest</strong> Act’s provisions were handled through <strong>the</strong> formal<br />
establishment <strong>of</strong> <strong>the</strong> National <strong>Forest</strong> Authority (NFA), and <strong>in</strong>stitutional programmes were developed.<br />
The National <strong>Forest</strong> Board bears <strong>the</strong> legislative responsibility and authority for <strong>the</strong> performance <strong>of</strong> <strong>the</strong><br />
National <strong>Forest</strong> Service (NFS), headed by a Manag<strong>in</strong>g Director.<br />
Recent studies and reports <strong>in</strong>dicate that <strong>the</strong> full capacity <strong>of</strong> <strong>the</strong> NFA/NFS <strong>in</strong> management <strong>of</strong> <strong>the</strong> sector<br />
has not yet been achieved, and that fur<strong>the</strong>r <strong>in</strong>stitutional support for <strong>the</strong> sector is justified. Among o<strong>the</strong>r<br />
th<strong>in</strong>gs, <strong>the</strong>re is a need for improved data collection and report<strong>in</strong>g mechanisms.<br />
It is compell<strong>in</strong>g to note that transition with<strong>in</strong> <strong>the</strong> sector has commenced and will cont<strong>in</strong>ue, from a number<br />
<strong>of</strong> standpo<strong>in</strong>ts. Not <strong>the</strong> least <strong>of</strong> <strong>the</strong>se is <strong>the</strong> cont<strong>in</strong>u<strong>in</strong>g requirement for <strong>the</strong> evolution <strong>of</strong> sector<br />
management and adm<strong>in</strong>istration <strong>system</strong>s, which have yet to develop and mature to be effective. While<br />
improvements have been made, recent studies have <strong>in</strong>dicated that <strong>the</strong>re is much left to address.<br />
External <strong>in</strong>fluences will also affect <strong>the</strong> evolution <strong>of</strong> <strong>the</strong> sector, especially from <strong>the</strong> market perspective and<br />
<strong>the</strong> capacity <strong>of</strong> private enterprise <strong>in</strong> <strong>the</strong> operat<strong>in</strong>g environment <strong>of</strong> PNG to establish and ma<strong>in</strong>ta<strong>in</strong> a<br />
position <strong>of</strong> competitive advantage <strong>in</strong>ternationally.<br />
1.2.4 Market Variations <strong>in</strong> <strong>the</strong> Last Decade<br />
The decade’s predom<strong>in</strong>ant landmarks were <strong>the</strong> unpredicted “spike” <strong>in</strong> export log prices experienced <strong>in</strong><br />
1993-5, and <strong>the</strong> current extremely low US$ prices. The former developed <strong>in</strong> response to environmental<br />
restrictions placed on old growth logg<strong>in</strong>g <strong>in</strong> <strong>the</strong> West Coast <strong>of</strong> <strong>the</strong> USA. At that time <strong>the</strong> US$ and <strong>the</strong><br />
k<strong>in</strong>a were close to parity, and <strong>the</strong> k<strong>in</strong>a’s subsequent decl<strong>in</strong>e has ma<strong>in</strong>ta<strong>in</strong>ed prices <strong>in</strong> local currency.<br />
Harvests <strong>in</strong>creased rapidly from 1 million cubic metres <strong>in</strong> 1990, to over 3 million cubic metres <strong>in</strong> 1994.<br />
Export volumes averaged 2.5 million cubic metres until <strong>the</strong> Asian economic crisis <strong>of</strong> 1997/8, and <strong>in</strong> 1998<br />
<strong>the</strong> volume exported was about 1.6 million cubic metres. After a slight rebound to 2 million cubic metres<br />
<strong>in</strong> 1990 and 2000, <strong>the</strong> Review Team estimates that harvests will fall below <strong>the</strong> 1998 level this year.<br />
Government reaction was tardy. Export tax was held at a weighted average <strong>of</strong> 14.3% <strong>of</strong> fob value for<br />
most <strong>of</strong> 1993, with an <strong>in</strong>crease to 17.3% until March 1994, an <strong>in</strong>crease to 31.1% for <strong>the</strong> rema<strong>in</strong>der <strong>of</strong><br />
1994, and an <strong>in</strong>crease to an average level <strong>of</strong> 32% for 1996. A <strong>new</strong> structure def<strong>in</strong>ed <strong>in</strong> <strong>the</strong> 1996 Budget<br />
Measures uses a marg<strong>in</strong>al <strong>in</strong>crease <strong>in</strong> tax rates with <strong>in</strong>creas<strong>in</strong>g log value. At <strong>the</strong> same time, royalty was<br />
<strong>in</strong>creased to K10 per cubic metre payable directly to <strong>the</strong> <strong>in</strong>dividual resource owners.<br />
There is a structural decl<strong>in</strong>e <strong>in</strong> <strong>the</strong> sector, seen through a number <strong>of</strong> deliberate closures <strong>of</strong> logg<strong>in</strong>g camps,<br />
but also at this time <strong>the</strong>re is a natural attrition <strong>of</strong> volumes exported due to <strong>the</strong> expiry <strong>of</strong> operat<strong>in</strong>g timber<br />
authorities.<br />
Currently <strong>the</strong>re is a moratorium imposed on <strong>the</strong> issue <strong>of</strong> <strong>new</strong> operat<strong>in</strong>g authorities until project<br />
preparations have been audited and found appropriate to <strong>the</strong> po<strong>in</strong>t <strong>of</strong> issue. At this stage it is not known<br />
when <strong>new</strong> operations will commence.<br />
1.3 CURRENT STATUS OF THE FOREST REVENUE SYSTEM<br />
1.3.1 Summary<br />
The <strong>forest</strong> sector generates <strong>revenue</strong> for <strong>the</strong> Government ma<strong>in</strong>ly on <strong>the</strong> basis <strong>of</strong> a log export tax levied on<br />
a progressive scale on <strong>the</strong> endorsed fob price <strong>of</strong> <strong>the</strong> log. O<strong>the</strong>r <strong>revenue</strong> accrues from a 5% withhold<strong>in</strong>g<br />
tax levied on royalties belong<strong>in</strong>g to <strong>the</strong> landowners where <strong>forest</strong>ry projects are based, but collected from<br />
PAGE 18
2001 FOREST REVENUE REVIEW<br />
exporters by <strong>the</strong> Government. There is also a re<strong>forest</strong>ation levy, payable to <strong>the</strong> PNGFA, and various<br />
premiums paid on each logg<strong>in</strong>g project to <strong>the</strong> landown<strong>in</strong>g company. Prov<strong>in</strong>cial governments also receive<br />
a portion <strong>of</strong> <strong>the</strong> fob price, collected and transmitted to <strong>the</strong>m by <strong>the</strong> central Government. The picture is<br />
one <strong>of</strong> diversity, as various different payments <strong>in</strong> cash and/or <strong>in</strong> k<strong>in</strong>d may have been negotiated with<br />
landowners and regional governments for one project with o<strong>the</strong>r projects show<strong>in</strong>g a different spectrum <strong>of</strong><br />
payments, with only <strong>the</strong> K10 royalty <strong>in</strong> common.<br />
1.3.2 Log Export Tax<br />
The tax was <strong>in</strong>troduced <strong>in</strong> 1979 with a flat 10% rate on <strong>the</strong> fob value apply<strong>in</strong>g across all species. On<br />
1 January 1991 <strong>the</strong> rate was differentiated by species, with Group 1 species such as kwila, PNG mersawa,<br />
red and white planchonella assessed at 30%, Group 2 species such as taun and calophyllum at 20%,<br />
group 3 at 12% and <strong>the</strong> rema<strong>in</strong>der at 9%. By 1992 <strong>the</strong> weighted average rate had risen to 14.3%. In<br />
November 1993, <strong>the</strong> rates were aga<strong>in</strong> raised by ano<strong>the</strong>r 3 percentage po<strong>in</strong>ts for <strong>the</strong> first three groups and<br />
four for <strong>the</strong> rema<strong>in</strong>der, giv<strong>in</strong>g a weighted average rate <strong>of</strong> 17.3% <strong>in</strong> 1993. Still trail<strong>in</strong>g <strong>the</strong> sharp rise <strong>in</strong><br />
export prices <strong>the</strong> rates reached 46%, 36%, 28%, and 26% for <strong>the</strong> four species groups (1 – 4 respectively)<br />
by March 1994.<br />
At this po<strong>in</strong>t <strong>the</strong> weighted average rate had moved up sharply to 31.1%, but by this time <strong>the</strong> k<strong>in</strong>a had<br />
been first devalued, <strong>the</strong>n floated, and its steady decl<strong>in</strong>e caused <strong>the</strong> weighted average tax rate to rise to<br />
33.0% <strong>in</strong> 1995 and 35.0% <strong>in</strong> 1996 without fur<strong>the</strong>r Government actions i.e. purely through fiscal drag. It<br />
should be noted that as only exported logs were subject to <strong>the</strong> tax <strong>the</strong> weighted average tax rates also<br />
acted as effective subsidy rates for processors. Ano<strong>the</strong>r po<strong>in</strong>t to bear <strong>in</strong> m<strong>in</strong>d is that certa<strong>in</strong> species,<br />
essentially all <strong>the</strong> commercial conifers, plus rosewood, balsa, and blackbean were prohibited from be<strong>in</strong>g<br />
exported <strong>in</strong> log form.<br />
On 22 November 1995 <strong>the</strong> Government abandoned <strong>the</strong> species-based <strong>system</strong> <strong>in</strong> favour <strong>of</strong> an ad valorem<br />
tax on <strong>the</strong> fob value, and <strong>in</strong>stituted <strong>the</strong> <strong>system</strong> now <strong>in</strong> place. As <strong>the</strong> market decl<strong>in</strong>ed some relief was<br />
given to exporters <strong>in</strong> October 1998 when logs valued at less than K110 per cubic metre were exempted<br />
from <strong>the</strong> tax, but this only lasted a few months, as <strong>the</strong> previous <strong>system</strong> was re-imposed <strong>in</strong> August 1999.<br />
As a result <strong>of</strong> <strong>the</strong>se movements <strong>the</strong> weighted average tax rate fell to 21.6% <strong>in</strong> 1998, but rose aga<strong>in</strong> s<strong>in</strong>ce<br />
<strong>the</strong> tax was denom<strong>in</strong>ated <strong>in</strong> <strong>the</strong> weaken<strong>in</strong>g k<strong>in</strong>a so that <strong>in</strong> <strong>the</strong> period January – September 2001, <strong>the</strong> rate<br />
was up to 33.6%, although <strong>of</strong> course absolute Government <strong>revenue</strong>s exhibited a different pattern,<br />
shr<strong>in</strong>k<strong>in</strong>g sharply <strong>in</strong> 1998 after <strong>the</strong> Asian crisis, ris<strong>in</strong>g slowly to 1994 levels by 2000, <strong>the</strong>n fall<strong>in</strong>g this<br />
year (2001) with decl<strong>in</strong><strong>in</strong>g volumes and prices.<br />
The log export tax is a central feature <strong>of</strong> <strong>the</strong> <strong>revenue</strong> <strong>system</strong> and will be discussed <strong>in</strong> considerable detail<br />
<strong>in</strong> Part 3 <strong>of</strong> <strong>the</strong> report.<br />
1.3.3 Landowners’ Revenue<br />
After a period <strong>of</strong> low values with regional and project differences, <strong>the</strong> ma<strong>in</strong> component <strong>of</strong> <strong>the</strong><br />
landowners’ <strong>revenue</strong>, <strong>the</strong> royalty, was applied at a flat rate <strong>of</strong> K10 per cubic metre on all logs harvested,<br />
whe<strong>the</strong>r exported or not. 25% is paid to <strong>the</strong> prov<strong>in</strong>cial government and a fur<strong>the</strong>r withhold<strong>in</strong>g tax <strong>of</strong> 5%<br />
before <strong>the</strong> actual owners are paid <strong>the</strong> balance.<br />
Landowner development premiums are also payable at a m<strong>in</strong>imum level by exporters but not by<br />
processors. They are negotiated and available to all landowners <strong>in</strong> a project area, irrespective <strong>of</strong> whe<strong>the</strong>r<br />
it is <strong>the</strong>ir trees that are harvested or not.<br />
In order to form legal entities, landowners must comb<strong>in</strong>e <strong>in</strong> representative bodies large enough to<br />
negotiate agreements. Incorporated Land Groups emphasise customary land dispute resolution<br />
procedures, but bus<strong>in</strong>ess groups, <strong>in</strong>corporated associations, companies and cooperatives are also legally<br />
feasible. Earlier problems with Land Owner Companies under <strong>the</strong> old legislation evidently stemmed from<br />
<strong>the</strong> non-representative nature <strong>of</strong> <strong>the</strong> management <strong>in</strong> many cases. The manner <strong>of</strong> formation <strong>of</strong> <strong>the</strong> groups<br />
PAGE 19
2001 FOREST REVENUE REVIEW<br />
is outside <strong>the</strong> terms <strong>of</strong> reference <strong>of</strong> this study, but clearly makes a difference to <strong>the</strong> degree to which<br />
landowners can effectively and fairly manage resource payments <strong>the</strong>y receive.<br />
In an attempt to make community benefits, especially local <strong>in</strong>frastructure, more consistent and fair, and<br />
to remove <strong>the</strong> manifold differences across projects, <strong>the</strong> Project Development Levy (PDL) was announced<br />
<strong>in</strong> <strong>the</strong> 1996 Budget, but never implemented, s<strong>in</strong>ce as a general rule legislation cannot be retrospective,<br />
and so application to exist<strong>in</strong>g projects proved impossible. A subsequent replacement, <strong>the</strong> Project<br />
Development Benefit (PDB) endeavours to m<strong>in</strong>imise cash payments to 50% and to have <strong>the</strong> rema<strong>in</strong>der<br />
allocated to community needs through a <strong>forest</strong>ry committee. So far only one company has undertaken <strong>the</strong><br />
<strong>review</strong> and <strong>in</strong>troduced <strong>the</strong> PDB <strong>system</strong>.<br />
1.3.4 O<strong>the</strong>r Government Revenue<br />
A Re<strong>forest</strong>ation Levy <strong>of</strong> averag<strong>in</strong>g about 50 toea per cubic metre is charged accord<strong>in</strong>g to <strong>the</strong> National<br />
Re<strong>forest</strong>ation Policy. The last available data on <strong>the</strong> unused balance is furnished <strong>in</strong> <strong>the</strong> last Annual Report<br />
<strong>of</strong> <strong>the</strong> PNG <strong>Forest</strong> Authority for 1995. 6.932 million k<strong>in</strong>a was held on deposit with <strong>the</strong> PNG Bank<strong>in</strong>g<br />
Corporation compared to 4.484 million k<strong>in</strong>a <strong>in</strong> <strong>the</strong> previous year. Annex D attempts to estimate <strong>the</strong><br />
growth <strong>of</strong> this Fund, but no fur<strong>the</strong>r <strong>in</strong>formation is available on disbursements.<br />
1.3.5 Policy Support for Domestic Process<strong>in</strong>g and Revenue Implications<br />
Under <strong>the</strong> current <strong>forest</strong> <strong>revenue</strong> <strong>system</strong> domestic process<strong>in</strong>g operations receive preference or an implicit<br />
subsidy compared to log exporters, through <strong>the</strong> exemption <strong>of</strong> export taxes on logs (and <strong>in</strong> certa<strong>in</strong> cases<br />
<strong>the</strong> exemption from log export premiums for landowners) processed domestically. The Report <strong>of</strong> <strong>the</strong><br />
Taxation Review (2000) estimated for <strong>the</strong> 1999 year, <strong>the</strong> value <strong>of</strong> log export tax <strong>revenue</strong> foregone on<br />
logs that are domestically processed, as K800,000. This however appears to be an underestimate. The<br />
Review Team estimate, based on a conservative log <strong>in</strong>put for domestic process<strong>in</strong>g <strong>of</strong> 500,000 cubic<br />
metres <strong>in</strong> 1999 and an average log value <strong>of</strong> K140 per cubic metre <strong>in</strong>dicates <strong>the</strong> value <strong>of</strong> log export tax<br />
<strong>revenue</strong> foregone on logs that were domestically processed <strong>in</strong> 1999 was approximately K17.5 million.<br />
Government policy over <strong>the</strong> past 25 years has generally favoured <strong>the</strong> progressive replacement <strong>of</strong> log<br />
export<strong>in</strong>g with domestic process<strong>in</strong>g <strong>of</strong> <strong>forest</strong> products, so long as <strong>the</strong> activity is f<strong>in</strong>ancially viable and<br />
environmentally susta<strong>in</strong>able. It is relevant to briefly exam<strong>in</strong>e <strong>the</strong> evolution <strong>of</strong> policy relat<strong>in</strong>g to <strong>forest</strong><br />
<strong>in</strong>dustries development. The key policy shifts have been as follows:<br />
Pre-1979 <strong>the</strong> policy was to place physical process<strong>in</strong>g targets on all foreign enterprises engaged <strong>in</strong> log<br />
exports, with <strong>the</strong> underly<strong>in</strong>g concept be<strong>in</strong>g that <strong>the</strong> higher pr<strong>of</strong>itability <strong>of</strong> log exports should be utilised to<br />
<strong>in</strong>itially fund <strong>the</strong> capital cost, and <strong>the</strong>n later to cross-subsidise process<strong>in</strong>g.<br />
In 1979, <strong>the</strong> generally low level <strong>of</strong> pr<strong>of</strong>itability <strong>of</strong> domestic process<strong>in</strong>g was recognised and attributed <strong>in</strong><br />
<strong>the</strong> ma<strong>in</strong> to market factors. That is, many species were little known and received low prices <strong>in</strong> processed<br />
form <strong>in</strong> world markets. A relaxation <strong>of</strong> restrictions on log exports was prescribed as a short to medium<br />
term mechanism to improve market acceptance and reliance on PNG species. The relaxation was<br />
comb<strong>in</strong>ed with measures to <strong>in</strong>crease log export taxes and <strong>in</strong>crease domestic ownership <strong>in</strong> log export<strong>in</strong>g<br />
activities. This policy <strong>in</strong> part was responsible for a decl<strong>in</strong>e <strong>in</strong> exports <strong>of</strong> processed products, and a<br />
threefold <strong>in</strong>crease <strong>in</strong> log exports through <strong>the</strong> 1980s. Dur<strong>in</strong>g this time <strong>the</strong> effective monitor<strong>in</strong>g <strong>of</strong> <strong>the</strong><br />
<strong>forest</strong>ry sector by Government, environmental controls on logg<strong>in</strong>g and <strong>the</strong> level <strong>of</strong> benefits derived by<br />
landowners also decl<strong>in</strong>ed.<br />
Follow<strong>in</strong>g <strong>the</strong> Commission <strong>of</strong> Enquiry <strong>in</strong>to Aspects <strong>of</strong> <strong>the</strong> <strong>Forest</strong> Industry <strong>in</strong> 1989, and <strong>the</strong> Tropical<br />
<strong>Forest</strong> Action Plan Review <strong>in</strong> 1990, a <strong>new</strong> <strong>forest</strong> policy and <strong>new</strong> <strong>Forest</strong>ry Act were f<strong>in</strong>alised <strong>in</strong> 1991. The<br />
<strong>new</strong> <strong>forest</strong> policy signalled a move back to <strong>in</strong>creased domestic process<strong>in</strong>g. However, <strong>in</strong> anticipation <strong>of</strong><br />
<strong>the</strong> <strong>new</strong> Act and policy a large number <strong>of</strong> <strong>new</strong> and poorly prepared log export<strong>in</strong>g projects were rushed<br />
through under <strong>the</strong> old Act.<br />
PAGE 20
2001 FOREST REVENUE REVIEW<br />
The 1991 policy was fur<strong>the</strong>r extended by <strong>the</strong> 1993 National <strong>Forest</strong>ry Guidel<strong>in</strong>es, that signalled:<br />
a) a complete log export ban by <strong>the</strong> year 2000; b) <strong>the</strong> <strong>in</strong>troduction <strong>of</strong> fiscal <strong>in</strong>centives to promote<br />
domestic process<strong>in</strong>g; and c) commitments to perpetuity <strong>of</strong> resource supply to processors and<br />
geographical dispersal <strong>of</strong> process<strong>in</strong>g (<strong>the</strong> 25 Timber Supply Agreement [TSA] proposal). In 1994 a<br />
M<strong>in</strong>isterial directive under <strong>the</strong> Guidel<strong>in</strong>es required all current logg<strong>in</strong>g operators to produce process<strong>in</strong>g<br />
plans by <strong>the</strong> end <strong>of</strong> 1994. The 1993 National <strong>Forest</strong>ry Development Guidel<strong>in</strong>es rema<strong>in</strong> <strong>the</strong> <strong>of</strong>ficial<br />
Government policy for process<strong>in</strong>g <strong>in</strong> <strong>the</strong> sector. It was <strong>in</strong>tended that <strong>the</strong> M<strong>in</strong>ister <strong>in</strong> consultation with <strong>the</strong><br />
PNG <strong>Forest</strong> Authority (PNGFA) would <strong>review</strong> <strong>the</strong> Guidel<strong>in</strong>es at three yearly <strong>in</strong>tervals, but s<strong>in</strong>ce 1993 no<br />
fur<strong>the</strong>r <strong>review</strong>s have been undertaken.<br />
The change <strong>of</strong> Government <strong>in</strong> 1994 saw a withdrawal <strong>of</strong> emphasis on process<strong>in</strong>g (but no <strong>of</strong>ficial change<br />
to <strong>the</strong> policy and guidel<strong>in</strong>es), and a strategy to ma<strong>in</strong>ta<strong>in</strong> Government <strong>revenue</strong> from log exports. Also as<br />
part <strong>of</strong> <strong>the</strong> IMF/World Bank structural adjustment package <strong>the</strong> Government have agreed to <strong>the</strong><br />
<strong>in</strong>troduction <strong>of</strong> a <strong>new</strong> national <strong>forest</strong> <strong>revenue</strong> <strong>system</strong> <strong>in</strong>clud<strong>in</strong>g a <strong>review</strong> <strong>of</strong> whe<strong>the</strong>r domestic processors<br />
should pay <strong>the</strong> same tax on logs as direct log exporters.<br />
The May 1996 “National <strong>Forest</strong> Plan” (ratified by <strong>the</strong> National Parliament <strong>in</strong> July 1996), provides <strong>in</strong> its<br />
mission statement and objectives for <strong>the</strong> use <strong>of</strong> <strong>forest</strong> resources “…to achieve economic growth,<br />
employment creation and <strong>in</strong>creased downstream process<strong>in</strong>g…” and, “To promote <strong>in</strong>creased <strong>in</strong>dustrial<br />
wood process<strong>in</strong>g to create employment opportunities.” The Plan envisaged <strong>the</strong> commencement <strong>of</strong> five<br />
major sawmills and two plywood factories over <strong>the</strong> period 1996 to 2001.<br />
In August 2000 <strong>the</strong> PNGFA released a draft discussion document titled “National Policy on Downstream<br />
Process<strong>in</strong>g <strong>of</strong> <strong>Forest</strong> Products”. This document actively promotes an <strong>in</strong>crease <strong>in</strong> domestic process<strong>in</strong>g. It<br />
recommends a strategy <strong>in</strong>clud<strong>in</strong>g priority <strong>of</strong> resource allocation to domestic process<strong>in</strong>g, phas<strong>in</strong>g out <strong>of</strong><br />
log exports <strong>in</strong> certa<strong>in</strong> prov<strong>in</strong>ces, a 70% process<strong>in</strong>g requirement on <strong>new</strong> <strong>Forest</strong> Management Agreements<br />
(FMAs) after year 2002, and no export taxes on processed products. The document has been circulated to<br />
o<strong>the</strong>r relevant Government departments for comment. It is yet to be f<strong>in</strong>alised and accepted by<br />
Government.<br />
Technically <strong>the</strong> M<strong>in</strong>istry <strong>of</strong> Trade and Industry is <strong>the</strong> Government agency vested with <strong>the</strong> role <strong>of</strong><br />
plann<strong>in</strong>g and promot<strong>in</strong>g <strong>in</strong>dustrialisation. In <strong>the</strong> <strong>forest</strong>ry sector however <strong>the</strong>y have largely delegated <strong>the</strong>se<br />
functions to <strong>the</strong> PNGFA. The M<strong>in</strong>istry <strong>of</strong> Trade and Industry has not undertaken any analysis on whe<strong>the</strong>r<br />
<strong>the</strong> implicit subsidy available for <strong>forest</strong> process<strong>in</strong>g through <strong>the</strong> waiver <strong>of</strong> export taxes on logs is fair <strong>in</strong><br />
comparison with direct and <strong>in</strong>direct assistance available to o<strong>the</strong>r sectors.<br />
1.4 METHODOLOGY ADOPTED BY THIS STUDY<br />
The study restricts itself to <strong>the</strong> basic tools <strong>of</strong> economics. In fact, it concentrates on <strong>the</strong> fundamental<br />
notion <strong>of</strong> scarce means to achieve ends and particularly on <strong>the</strong> opportunity cost <strong>of</strong> various courses <strong>of</strong><br />
action.<br />
The Government <strong>of</strong> Papua New Gu<strong>in</strong>ea commissioned this study. Therefore <strong>the</strong> welfare function to be<br />
maximized is that <strong>of</strong> <strong>the</strong> people <strong>of</strong> Papua New Gu<strong>in</strong>ea, s<strong>in</strong>ce <strong>the</strong> Government is <strong>the</strong>ir representative. In<br />
particular, although <strong>the</strong> study addresses <strong>the</strong> <strong>forest</strong>ry sector, and focuses on <strong>the</strong> <strong>revenue</strong> <strong>system</strong>, this<br />
welfare function means that alternative uses <strong>of</strong> public funds used <strong>in</strong> <strong>forest</strong>ry, or not taxed from <strong>forest</strong>ry,<br />
must also be considered.<br />
The Review Team commences by consider<strong>in</strong>g <strong>the</strong> status and prospects <strong>of</strong> <strong>the</strong> <strong>forest</strong>ry sector to determ<strong>in</strong>e<br />
its probable future importance to <strong>the</strong> whole economy. The contribution <strong>of</strong> log exports and domestic<br />
process<strong>in</strong>g to Government <strong>revenue</strong> is considered, and <strong>the</strong> possibility <strong>of</strong> transfer pric<strong>in</strong>g <strong>in</strong>vestigated,<br />
because its existence would render <strong>of</strong>ficial data on Government <strong>revenue</strong>s <strong>in</strong>valid.<br />
PAGE 21
2001 FOREST REVENUE REVIEW<br />
The ma<strong>in</strong> thrust <strong>of</strong> <strong>the</strong> study, <strong>in</strong> Part 5, is <strong>the</strong> exam<strong>in</strong>ation <strong>of</strong> resource rent created <strong>in</strong> <strong>the</strong> log export<br />
bus<strong>in</strong>ess and <strong>the</strong> allocation <strong>of</strong> that rent to <strong>the</strong> various claimants – resource owners, developers,<br />
government (national and regional). However, this analysis is preceded by a descriptive general study <strong>of</strong><br />
<strong>the</strong> sector and a specific study <strong>of</strong> <strong>the</strong> transfer pric<strong>in</strong>g issue.<br />
PAGE 22
PART 2 ANALYSIS OF MARKETS, TRADE AND INDUSTRY<br />
2001 FOREST REVENUE REVIEW<br />
Commenc<strong>in</strong>g with a descriptive overview <strong>of</strong> <strong>the</strong> world tropical timber market, focuss<strong>in</strong>g on logs and<br />
sawn timber, <strong>the</strong> two ma<strong>in</strong> <strong>forest</strong> products exported by Papua New Gu<strong>in</strong>ea, this analysis proceeds to<br />
exam<strong>in</strong>e <strong>the</strong> prospect for PNG <strong>in</strong> <strong>the</strong> context <strong>of</strong> changes <strong>in</strong> <strong>the</strong> global economy and changes specific to<br />
<strong>the</strong> sector.<br />
2.1 PRODUCTION AND EXPORTS<br />
Dur<strong>in</strong>g <strong>the</strong> last three decades tropical timber production has <strong>in</strong>creased at a rate above <strong>the</strong> average<br />
observed for all <strong>forest</strong> products. This was basically a result <strong>of</strong> developments that took place <strong>in</strong> Asia,<br />
particularly <strong>in</strong> Indonesia and Malaysia. Never<strong>the</strong>less tropical timber still has a m<strong>in</strong>or share <strong>in</strong> total world<br />
timber production.<br />
Except for plywood, production stabilised at lower levels after <strong>the</strong> Asian f<strong>in</strong>ancial crisis four years ago,<br />
as shown by Table 2.1. Exports (about 20% <strong>of</strong> production) followed <strong>the</strong> trend as tropical timber ga<strong>in</strong>ed<br />
importance (Table 2.2). Despite <strong>the</strong> <strong>in</strong>crease <strong>in</strong> log export bans, especially that <strong>of</strong> Indonesia, whose<br />
ostensible purpose was to <strong>in</strong>crease domestic process<strong>in</strong>g, log export<strong>in</strong>g rema<strong>in</strong>ed significant, even after<br />
<strong>the</strong> 1997 peak.<br />
TABLE 2.1 TROPICAL TIMBER PRODUCTION 1995 – 2000 (MILL. M³)<br />
Product<br />
Year<br />
1995 1996 1997 1998 1999 2000<br />
Logs 132.0 126.8 132.0 113.3 112.7 112.9<br />
Sawn wood 41.1 40.4 40.0 35.1 34.7 37.1<br />
Plywood 15.6 15.1 19.0 18.3 20.3 20.4<br />
Source: ITTO Annual Review 2000<br />
TABLE 2.2 TOTAL EXPORTS OF SELECTED TROPICAL TIMBER PRODUCTS 1995 - 2000 (MILL. M³)<br />
Product<br />
Year<br />
1995 1996 1997 1998 1999 2000<br />
Logs 15.0 13.2 16.0 12.8 15.1 14.2<br />
Sawn timber 7.9 7.3 6.0 6.4 6.6 6.7<br />
Plywood 12.4 12.2 11.0 16.6 12.5 12.5<br />
Source: ITTO Annual Review 2000<br />
PAGE 23
2001 FOREST REVENUE REVIEW<br />
The five ma<strong>in</strong> producers <strong>in</strong> 2000, Indonesia, Brazil, Malaysia, India and Gabon, contributed more than<br />
80% <strong>of</strong> <strong>the</strong> total world tropical log production (Table 2.3).<br />
TABLE 2.3 MAIN TROPICAL LOG PRODUCERS - 2000<br />
Country Volume (‘000 m³)<br />
Indonesia 27 909<br />
Brazil 24 500<br />
Malaysia 20 000<br />
India 14 000<br />
Gabon 3 914<br />
Source: ITTO Annual Review 2000<br />
The five ma<strong>in</strong> exporters <strong>of</strong> tropical timber logs <strong>in</strong> 2000 (Table 2.4), Malaysia, Gabon, Papua New<br />
Gu<strong>in</strong>ea, Myanmar and Cameroon, accounted for around 90% <strong>of</strong> total world exports <strong>of</strong> tropical timber<br />
logs. Papua New Gu<strong>in</strong>ea’s share is around 14%.<br />
TABLE 2.4 MAIN TROPICAL LOG EXPORTERS - 2000<br />
Country Volume (‘000m³)<br />
Malaysia 5 950<br />
Gabon 2 779<br />
Papua New Gu<strong>in</strong>ea 2 003<br />
Myanmar 1 000<br />
Cameroon 950<br />
Source: ITTO Annual Review 2000<br />
Papua New Gu<strong>in</strong>ea is a much smaller participant <strong>in</strong> <strong>the</strong> export markets for tropical sawn timber and<br />
plywood, whose largest producers <strong>in</strong> 2000 are shown <strong>in</strong> Tables 2.5 & 2.6. The largest exporter <strong>of</strong> tropical<br />
sawn timber is Malaysia, with 40% <strong>of</strong> total world exports, and <strong>the</strong> five major exporters (Malaysia, Brazil,<br />
Indonesia, Cameroon and Ivory Coast) contribute almost 80% <strong>of</strong> <strong>the</strong> total.<br />
TABLE 2.5 MAIN TROPICAL SAWN TIMBER EXPORTERS - 2000<br />
Country Volume (‘000m³)<br />
Malaysia 2 700<br />
Brazil 900<br />
Indonesia 548<br />
Cameroon 540<br />
Ivory Coast 500<br />
Source: ITTO Annual Review 2000<br />
PAGE 24
TABLE 2.6 MAIN TROPICAL PLYWOOD EXPORTERS - 2000<br />
Country Volume (‘000m³)<br />
Indonesia 7 768<br />
Malaysia 3 168<br />
Brazil 574<br />
Guyana 94<br />
Gabon 85<br />
Source: ITTO Annual Review 2000<br />
2001 FOREST REVENUE REVIEW<br />
Tropical plywood production is also concentrated <strong>in</strong> a few countries, <strong>the</strong> three largest account<strong>in</strong>g for 70%<br />
<strong>of</strong> production. Japan used to be a larger producer <strong>of</strong> tropical plywood but reduced its production<br />
drastically dur<strong>in</strong>g <strong>the</strong> last 5-10 years aga<strong>in</strong>st Indonesian competition and through s<strong>of</strong>twood substitution.<br />
It is now fourth, followed by Brazil. For exports, Indonesia and Malaysia account for 87% <strong>of</strong> <strong>the</strong> total<br />
tropical plywood exports, <strong>the</strong> latter for more when its part-ownerships <strong>of</strong> <strong>the</strong> mills <strong>in</strong> Guyana and Gabon<br />
are <strong>in</strong>cluded.<br />
Ch<strong>in</strong>a and Japan import half <strong>of</strong> <strong>the</strong> total world tropical log trade with Japan import<strong>in</strong>g half s<strong>in</strong>ce s<strong>in</strong>ce<br />
1990. The o<strong>the</strong>r large importers are India, Korea and France (Table 2.7).<br />
TABLE 2.7 MAIN TROPICAL LOG IMPORTERS - 2000<br />
Country Volume (‘000m³)<br />
Ch<strong>in</strong>a 5 300<br />
Japan 3 146<br />
India 1 900<br />
Korea 1 000<br />
France 814<br />
Source: ITTO Annual Review 2000<br />
Tropical sawn timber importers are a far more diverse group <strong>of</strong> countries than tropical log importers. The<br />
largest five, shown <strong>in</strong> Table 2.8, only account for half <strong>of</strong> <strong>the</strong> world trade, with many smaller importers.<br />
TABLE 2.8 MAIN TROPICAL SAWN TIMBER IMPORTERS - 2000<br />
Country Volume (‘000m³)<br />
Ch<strong>in</strong>a 1 500<br />
Thailand 1 239<br />
Japan 691<br />
Taiwan (POC) 452<br />
Italy 400<br />
Source: ITTO Annual Review 2000<br />
PAGE 25
2001 FOREST REVENUE REVIEW<br />
Plywood imports are, however, more concentrated, with <strong>the</strong> five importers <strong>in</strong> Table 2.9 account<strong>in</strong>g for<br />
83% <strong>of</strong> world tropical timber plywood traded volumes. Ch<strong>in</strong>a has recently shifted back to a higher ratio<br />
<strong>of</strong> logs.<br />
TABLE 2.9 MAIN TROPICAL PLYWOOD IMPORTERS - 2000<br />
Country Volume (‘000m³)<br />
Japan 4 553<br />
USA 1 700<br />
Ch<strong>in</strong>a 900<br />
Korea 750<br />
United K<strong>in</strong>gdom 600<br />
Source: ITTO Annual Review 2000<br />
2.2 PAPUA NEW GUINEA’S FOREST PRODUCTS EXPORTS<br />
Log exports dom<strong>in</strong>ate with sawn timber occasionally mak<strong>in</strong>g a very marg<strong>in</strong>al contribution. There is also<br />
a wood chip export operation, but <strong>the</strong> chips are produced entirely from plantation timber. Some veneer is<br />
also exported, and local secondary processors also export but <strong>in</strong> general <strong>the</strong>y make available limited<br />
volumes for <strong>the</strong> local market.<br />
Table 2.10 shows <strong>the</strong> evolution <strong>of</strong> <strong>the</strong> log export market, which peaked <strong>in</strong> 1997, <strong>the</strong> year <strong>of</strong> <strong>the</strong> Asian<br />
f<strong>in</strong>ancial crisis, at 3 million m³. Dropp<strong>in</strong>g sharply after <strong>the</strong> crisis, volumes briefly rose to 1993 levels<br />
before decl<strong>in</strong><strong>in</strong>g aga<strong>in</strong>. The Review Team estimates that <strong>the</strong> figure for this year, 2001, will probably only<br />
reach about 1.5 million m³.<br />
TABLE 2.10 EVOLUTION OF PNG LOGS AND SAWN TIMBER EXPORTS (‘000M³)<br />
Products 1995 1996 1997 1998 1999 2000<br />
Logs 2191 2651 3006 1617 1984 1993<br />
Sawn Timber 6 17 38 26 23 25<br />
Sources: PNG <strong>Forest</strong> Authority: Timber Digest; ITTO Annual Review 2000<br />
The ma<strong>in</strong> markets for PNG logs have also altered as shown <strong>in</strong> Table 2.11. The former dom<strong>in</strong>ance <strong>of</strong><br />
Japan, followed by Korea, has now given way to a scene <strong>in</strong> which Ch<strong>in</strong>a is clearly <strong>the</strong> <strong>new</strong> prime market,<br />
with Japan, Korea and <strong>the</strong> Philipp<strong>in</strong>es still important.<br />
TABLE 2.11 MAIN IMPORTERS OF PNG LOGS (1,000 M³)<br />
Countries 1995 1996 1997 1998 1999 2000<br />
Japan 1 237 1 683 1 960 898 989 746<br />
Ch<strong>in</strong>a 46 57 104 158 329 688<br />
Korea 608 487 421 281 417 323<br />
Philipp<strong>in</strong>es 118 269 196 147 136 96<br />
O<strong>the</strong>rs 182 156 324 133 114 141<br />
Sources: PNG <strong>Forest</strong> Authority: Timber Digest; ITTO Annual Review 2000<br />
PAGE 26
2001 FOREST REVENUE REVIEW<br />
At <strong>the</strong> same time <strong>the</strong> composition <strong>of</strong> export<strong>in</strong>g companies has also changed, although <strong>the</strong> pattern has<br />
been relatively static s<strong>in</strong>ce 1997, with <strong>the</strong> largest five hold<strong>in</strong>g companies (some with twelve or more local<br />
area subsidiaries) responsible for more than 70% <strong>of</strong> exports (Table 2.12). Malaysian companies now<br />
dom<strong>in</strong>ate; <strong>the</strong> one rema<strong>in</strong><strong>in</strong>g national company exports less than 1% <strong>of</strong> <strong>the</strong> total.<br />
TABLE 2.12 LOG EXPORTS BY COMPANY - 6 LARGEST; 1997 & 2000 (VOLUMES IN M³; VALUES IN US$)<br />
Company 2000 1997<br />
Volume 666 859 1 094 907<br />
Rimbunan Hijau<br />
Turama <strong>Forest</strong> Industries<br />
WTK Realty<br />
Concord Pacific<br />
Kerawara<br />
TOTAL<br />
% 33.5 36.4<br />
Value 49 654 316 127 085 699<br />
% 34.6 36.2<br />
Avg. Price 75 116<br />
Volume 209 574 357 916<br />
% 10.5 11.9<br />
Value 14 851 269 41 634 222<br />
% 10.3 11.9<br />
Avg. Price 71 116<br />
Volume 255 776 551 847<br />
% 12.8 18.4<br />
Value 20 467 065 72 223 663<br />
% 14.2 20.6<br />
Avg. Price 80 131<br />
Volume 151 459 123 506<br />
% 7.6 4.1<br />
Value 10 993 104 15 675 990<br />
% 7.6 4.5<br />
Avg. Price 73 127<br />
Volume 148 864 53 208<br />
% 7.5 1.8<br />
Value 8 034 691 5 357 094<br />
% 5.6 1.5<br />
Avg. Price 54 101<br />
Volume 1 432 532 2 181 384<br />
% 71.9 72,6<br />
Value 104 000 445 261 977 168<br />
% 72.3 74,6<br />
Avg. Price 73 120<br />
Source: SGS PNG Pty Ltd; Log Export Monitor<strong>in</strong>g: Monthly Report (1996-07/2001)<br />
PAGE 27
2001 FOREST REVENUE REVIEW<br />
The five largest importers <strong>of</strong> PNG logs by country <strong>of</strong> dest<strong>in</strong>ation, based on year 2000 statistics, are listed<br />
<strong>in</strong> Table 2.13. International trade is dom<strong>in</strong>ated by a relatively small number <strong>of</strong> companies. For Ch<strong>in</strong>a and<br />
Korea <strong>the</strong> five largest importers are responsible for around 65% <strong>of</strong> total imports <strong>in</strong> 2000. In Japan two<br />
companies are responsible for more than 50% <strong>of</strong> <strong>the</strong> log imports from PNG, and <strong>the</strong> five largest import<br />
almost 80% <strong>of</strong> <strong>the</strong> total.<br />
TABLE 2.13 MAIN IMPORTERS BY MARKET OF PNG LOGS (2000)<br />
Country Importer Company<br />
Volume<br />
(‘000 m³)<br />
% *<br />
Wayne Wood (HK) Ltd. 110 659 14.6<br />
Lei Sh<strong>in</strong>y Hong Ltd. 95 077 30.0<br />
Ch<strong>in</strong>a<br />
Japan<br />
Korea<br />
Midoriya Mokuzai Co. Ltd. 93 441 43.5<br />
Ichiban Timber Products 71 735 54.0<br />
Far East Treasure 71 190 65.8<br />
Total Ch<strong>in</strong>a 687 779 100.0<br />
Nissho Iwai Corp. 267 841 36.0<br />
Sumitomo <strong>Forest</strong>ry Co. Ltd. 111 111 51.0<br />
Marubeni Corp. 82 083 61.9<br />
Kowa Lumber Corp. 74 419 71.9<br />
San-Mic Trad<strong>in</strong>g Co. (HK) Ltd. 45 286 78.0<br />
Total Japan 745 612 100.0<br />
Eagon Industrial Co. Ltd. 55 324 17.1<br />
Sung Chang Enterprise Co. Ltd. 51 559 33.1<br />
Nam Mok Corp. 50 339 48.6<br />
Sung-Mok Corp. 33 481 58.8<br />
Guymen Enterprise Ltd. 16 106 64.0<br />
Total Korea 323 091 100.0<br />
Total Ch<strong>in</strong>a, Japan and Korea 1 756 482<br />
Total 5 Largest / 3 Markets 1 232 651<br />
% <strong>of</strong> Total Exports by PNG 61.8<br />
* - Accumulated values by Market<br />
Source: Review Team research<br />
PAGE 28
2001 FOREST REVENUE REVIEW<br />
Several companies operate <strong>in</strong> more than one market. Table 2.14 presents <strong>the</strong> <strong>in</strong>formation on volumes <strong>of</strong><br />
logs imported from PNG by company, without reference to <strong>the</strong> import<strong>in</strong>g country. As can be observed<br />
<strong>the</strong> ten largest importers are responsible for almost 60% <strong>of</strong> all logs traded by PNG <strong>in</strong> <strong>the</strong> <strong>in</strong>ternational<br />
market.<br />
TABLE 2.14 LARGEST IMPORTERS OF PNG LOGS (2000)<br />
Company Headquarters Volume (1 000 m³) % *<br />
Nissho Iwai Corp. Japan 353.2 17.7<br />
Sumitomo <strong>Forest</strong>ry Co. Ltd. Japan 111.1 23.3<br />
Wayne Wood (HK) Ltd. Hong Kong 110.7 28.9<br />
Lei Sh<strong>in</strong>y Hong Ltd. Hong Kong 95.1 33.6<br />
Midoriya Mokuzai Co. Ltd. Hong Kong 93.4 38.3<br />
Ichiban Timber Products S<strong>in</strong>gapore 90.8 42.9<br />
Marubeni Corp. Japan 82.1 47.0<br />
Kowa Lumber Corp. Japan 74.4 50.7<br />
Far East Treasure Hong Kong 71.2 54.3<br />
Eagon Industrial Co. Ltd. Korea 55.3 57.0<br />
* - Accumulated values<br />
Source: Review Team Estimates<br />
Table 2.15 shows that efforts to <strong>in</strong>troduce lesser known species have clearly been very limited. Ten listed<br />
species are responsible for around 55% <strong>of</strong> <strong>the</strong> trade, <strong>the</strong> most important be<strong>in</strong>g Calophyllum (Calophyllum<br />
spp.), Taun (Pometia p<strong>in</strong>nata), Malas (Homalium foetidum), PNG Mersawa, Term<strong>in</strong>alia (Term<strong>in</strong>alia<br />
spp.) and Kwila (Intsia spp.).<br />
TABLE 2.15 MAIN SPECIES OF EXPORTED LOGS IN PNG 1997 AND 2000 (‘000 M³)<br />
Species<br />
1997 2000<br />
Volume %* Volume %*<br />
Species<br />
Malas 320.2 10.7 205.1 10.3 Calophyllum<br />
Calophyllum 275.2 19.9 181.3 19.4 Taun<br />
Taun 231.2 27.6 152.5 27.1 Malas<br />
Kwila 167.1 33.2 128.6 33.6 PNG Mersawa<br />
PNG Mersawa 155.8 38.4 101.1 38.7 Term<strong>in</strong>alia<br />
Red Canarium 137.4 43.0 65.4 42.0 Dillenia<br />
Term<strong>in</strong>alia 132.1 47.4 65.2 45.3 Red Canarium<br />
Pencil Cedar 104.9 50.9 61.2 48.4 Pencil Cedar<br />
Dillenia 100.7 54.2 60.7 51.4 Erima<br />
Erima 77.2 56.8 39.9 53.4 Kwila<br />
PAGE 29
* Accumulated percentage<br />
Source: SGS PNG Pty Ltd/PNG <strong>Forest</strong> Authority: Log Export Monitor<strong>in</strong>g Monthly Report<br />
2.3 MARKET OUTLOOK FOR PNG LOGS AND PROCESSED FOREST PRODUCTS<br />
2001 FOREST REVENUE REVIEW<br />
It is useful as part <strong>of</strong> any <strong>revenue</strong> analysis for commodities where <strong>in</strong>ternational prices have fluctuated<br />
widely <strong>in</strong> recent years, to briefly exam<strong>in</strong>e <strong>the</strong> underly<strong>in</strong>g market supply and demand factors, and try to<br />
provide a guide on likely future price trends. This section can only provide a cursory overview and<br />
identify key factors <strong>in</strong> <strong>the</strong> relatively complex overall global timber market outlook. Material for this<br />
section has been drawn from a range <strong>of</strong> published (pr<strong>in</strong>cipally ITTO) and unpublished data available to<br />
<strong>the</strong> Review Team.<br />
There have been a number <strong>of</strong> <strong>in</strong>ternational modell<strong>in</strong>g attempts <strong>in</strong> recent years to look at both <strong>the</strong> global<br />
supply and demand situation for wood. The outcome <strong>of</strong> <strong>the</strong>se modell<strong>in</strong>g attempts has been <strong>in</strong>conclusive.<br />
The material presented <strong>in</strong> this section attempts to separate market certa<strong>in</strong>ties from uncerta<strong>in</strong>ties.<br />
2.3.1 The Certa<strong>in</strong>ties <strong>of</strong> Wood Demand<br />
Industrial wood demand correlates most closely with population <strong>in</strong>creases and secondly with economic<br />
growth rates. Consumption <strong>of</strong> <strong>in</strong>dustrial wood products <strong>in</strong> 1996 <strong>in</strong> <strong>the</strong> world was an average <strong>of</strong> 0.26m/3<br />
per person. The general agreement from most <strong>of</strong> <strong>the</strong> demand models is that <strong>the</strong> average world <strong>in</strong>dustrial<br />
annual round wood demand will <strong>in</strong>crease by around 1.5% to 2.0% per annum over <strong>the</strong> next decade i.e.<br />
16% to 22% over <strong>the</strong> whole period.<br />
The Asia-Pacific region is likely to cont<strong>in</strong>ue to be <strong>the</strong> fastest grow<strong>in</strong>g region <strong>in</strong> <strong>the</strong> world <strong>in</strong> terms <strong>of</strong><br />
consumption <strong>of</strong> all wood products for <strong>the</strong> foreseeable future. It will <strong>the</strong>refore <strong>in</strong>crease its share <strong>of</strong> global<br />
consumption <strong>of</strong> <strong>in</strong>dustrial round wood relative to o<strong>the</strong>r regions from an estimated 22% (330 million m 3 )<br />
<strong>in</strong> 1994 to 25% (500 million m 3 ) <strong>in</strong> <strong>the</strong> year 2010. Japan and <strong>the</strong> P.R. Ch<strong>in</strong>a accounted for 65% <strong>of</strong> world<br />
tropical timber imports <strong>in</strong> 1999 and <strong>the</strong>ir <strong>in</strong>fluence over <strong>the</strong> next 10 years is expected to cont<strong>in</strong>ue, and,<br />
given <strong>the</strong> <strong>in</strong>creas<strong>in</strong>g demand from Ch<strong>in</strong>a, most probably <strong>in</strong>crease.<br />
Plywood and sawn timber demand (<strong>the</strong> two processed commodities that account for <strong>the</strong> bulk <strong>of</strong> PNG’s<br />
log and product exports) are expected to face <strong>the</strong> lowest growth rates <strong>of</strong> all wood products <strong>in</strong> <strong>the</strong> Asia<br />
Pacific region over <strong>the</strong> next 10 years. Lead<strong>in</strong>g consultant predictions are that plywood demand, whilst<br />
recover<strong>in</strong>g from <strong>the</strong> downturn follow<strong>in</strong>g <strong>the</strong> 1997/98 Asian crisis will still not achieve pre-crisis levels.<br />
Asia – Pacific plywood demand is expected to grow by about 1.5% per year (from 18 to 21 million m 3<br />
per year) from 2000-2010, and sawn timber demand by around 2% per year. This is a result <strong>of</strong> three<br />
forces. Firstly <strong>the</strong> relative overall decl<strong>in</strong><strong>in</strong>g availability <strong>of</strong> larger diameter logs suitable for<br />
peel<strong>in</strong>g/saw<strong>in</strong>g; secondly improved technologies for manufactur<strong>in</strong>g eng<strong>in</strong>eered wood and panel products<br />
(pr<strong>in</strong>cipally MDF, OSB and LVL) that will shift demand away from plywood and sawn timber; and<br />
thirdly <strong>the</strong> ongo<strong>in</strong>g switch to wood substitutes.<br />
In pure volume terms <strong>the</strong> largest growth <strong>in</strong> demand will be <strong>in</strong> pulp and paper products. The annual<br />
average growth rate for <strong>the</strong>se products is expected to be <strong>in</strong> <strong>the</strong> 4 - 5% range <strong>in</strong> <strong>the</strong> Asia Pacific region for<br />
<strong>the</strong> next 10 years. However <strong>the</strong> <strong>forest</strong>ry impact <strong>of</strong> this growth <strong>in</strong> consumption will not be so dramatic, as<br />
<strong>the</strong>re is scope for fur<strong>the</strong>r large <strong>in</strong>creases <strong>in</strong> recycl<strong>in</strong>g <strong>in</strong> <strong>the</strong> <strong>new</strong>ly <strong>in</strong>dustrialised countries <strong>in</strong> <strong>the</strong> region.<br />
In addition we are likely to see <strong>the</strong> <strong>in</strong>creased use <strong>of</strong> non-wood fibres to augment fibre supply.<br />
As <strong>the</strong> supply <strong>of</strong> tropical timber products decreases, a number <strong>of</strong> countries <strong>in</strong> <strong>the</strong> Asia Pacific region that<br />
were former large producers <strong>of</strong> tropical timber products (Ch<strong>in</strong>a, Thailand, Philipp<strong>in</strong>es, India and<br />
Vietnam) have <strong>in</strong>stigated measures to reduce wood imports through promot<strong>in</strong>g substitute materials<br />
PAGE 30
2001 FOREST REVENUE REVIEW<br />
(ma<strong>in</strong>ly concrete, steel, and plastics). Wood substitutes are a larger threat to tropical timber market<br />
penetration <strong>in</strong>to markets than competition from alternative suppliers <strong>of</strong> wood products.<br />
2.3.2 The Uncerta<strong>in</strong>ties <strong>of</strong> Wood Demand<br />
World economic growth rates and <strong>the</strong> growth rates <strong>of</strong> countries <strong>in</strong> <strong>the</strong> Asia Pacific region cannot be<br />
predicted with any precision. The 1997/98 Asia economic crisis was not widely predicted by economists.<br />
It has had a major unpredicted impact on wood demand <strong>in</strong> <strong>the</strong> region.<br />
Wood demand is very sensitive to <strong>the</strong> pric<strong>in</strong>g <strong>of</strong> wood substitutes. Dur<strong>in</strong>g <strong>the</strong> 1993/94 tropical log price<br />
spike, solid wood products lost market share to steel and plastics. Pric<strong>in</strong>g <strong>of</strong> energy and o<strong>the</strong>r<br />
commodities will have an important <strong>in</strong>fluence on wood demand and pric<strong>in</strong>g.<br />
The <strong>in</strong>fluence <strong>of</strong> green consumerism upon tropical timber product trade <strong>in</strong> <strong>the</strong> Asia Pacific region is a<br />
major uncerta<strong>in</strong>ty. Commercial logg<strong>in</strong>g <strong>of</strong> natural and semi-natural <strong>forest</strong>s is becom<strong>in</strong>g an <strong>in</strong>creas<strong>in</strong>g<br />
emotive environmental issue worldwide. Over <strong>the</strong> 15 years to 1997 <strong>the</strong>re was a loss <strong>of</strong> 200 million<br />
hectares <strong>of</strong> natural <strong>forest</strong>s <strong>in</strong> develop<strong>in</strong>g countries and <strong>the</strong> loss is still thought to be cont<strong>in</strong>u<strong>in</strong>g at around<br />
12 million hectares per year. Although commercial logg<strong>in</strong>g can only be directly related to about one<br />
quarter <strong>of</strong> this <strong>forest</strong> clearance it does <strong>in</strong>directly provide access for follow-up agricultural encroachment<br />
and markets for <strong>in</strong>formal sector logg<strong>in</strong>g. Wood certification l<strong>in</strong>ked to “green consumerism” is a direct<br />
product <strong>of</strong> <strong>the</strong> concern <strong>in</strong> developed countries to try and slow <strong>the</strong> level <strong>of</strong> unsusta<strong>in</strong>able logg<strong>in</strong>g. In <strong>the</strong><br />
ma<strong>in</strong> Asian markets, <strong>the</strong> <strong>in</strong>fluence <strong>of</strong> green consumerism on tropical timber trade to date has been small.<br />
However when exam<strong>in</strong><strong>in</strong>g <strong>the</strong> worldwide changes <strong>in</strong> society’s perception <strong>of</strong> natural tropical <strong>forest</strong>s, <strong>the</strong><br />
demand <strong>in</strong>fluence <strong>of</strong> susta<strong>in</strong>ability issues surround<strong>in</strong>g natural tropical <strong>forest</strong>s is likely to <strong>in</strong>crease <strong>in</strong> <strong>the</strong><br />
region. This goes wider than just <strong>the</strong> environmental impacts – it requires conv<strong>in</strong>c<strong>in</strong>g <strong>the</strong> consumers on<br />
economic and social issues as well. Managed natural tropical production <strong>forest</strong>ry has still a long way to<br />
go to improve its standards, <strong>in</strong>formation base and image.<br />
2.3.3 The Certa<strong>in</strong>ties <strong>of</strong> Wood Supply<br />
Major supply problems <strong>of</strong> larger diameter natural <strong>forest</strong> logs are loom<strong>in</strong>g <strong>in</strong> Asia through <strong>the</strong> cont<strong>in</strong>u<strong>in</strong>g<br />
over-logg<strong>in</strong>g and clear<strong>in</strong>g <strong>of</strong> <strong>forest</strong>s <strong>in</strong> Malaysia, Indonesia, and Cambodia. Reliable statistics do not<br />
exist <strong>in</strong> Indonesia and Cambodia because <strong>of</strong> illegal logg<strong>in</strong>g, and <strong>the</strong> figures estimated below are believed<br />
to be conservative. Also as volumes decl<strong>in</strong>e, <strong>the</strong> average diameter, percentage <strong>of</strong> premium species and<br />
log quality will decl<strong>in</strong>e while costs <strong>of</strong> production will <strong>in</strong>crease mak<strong>in</strong>g <strong>the</strong> rema<strong>in</strong><strong>in</strong>g volume less<br />
competitive <strong>in</strong> regional markets (Table 2.16).<br />
TABLE 2.16 PREDICTED PRODUCTION OF NATURAL FOREST LARGE DIAMETER LOGS FROM MAIN EXPORTING<br />
ASIA – PACIFIC COUNTRIES (MILLION M 3 )<br />
1998 2010<br />
Malaysia 22 12<br />
Indonesia 50 25<br />
Cambodia 3 1<br />
Papua New Gu<strong>in</strong>ea 2 2<br />
Solomon Islands 1 0<br />
Total 78 40<br />
The impact <strong>of</strong> this decl<strong>in</strong><strong>in</strong>g supply <strong>of</strong> larger natural <strong>forest</strong> hardwood logs is most obvious on <strong>the</strong><br />
regional plywood <strong>in</strong>dustry. The Asian plywood <strong>in</strong>dustry is chang<strong>in</strong>g fast. The ma<strong>in</strong> changes are: a) an<br />
PAGE 31
2001 FOREST REVENUE REVIEW<br />
<strong>in</strong>creas<strong>in</strong>g supply <strong>of</strong> smaller logs <strong>of</strong> lower quality, b) <strong>the</strong> ongo<strong>in</strong>g shift to s<strong>of</strong>twood logs (particularly as<br />
core veneer), c) <strong>the</strong> <strong>in</strong>creased competition from non-plywood wood panel substitutes (particle-board and<br />
MDF) which can be produced from small diameter logs and wood/agricultural residues.<br />
Future <strong>in</strong>creases <strong>in</strong> global wood supply will largely come from plantations (Table 2.17). The annual<br />
global <strong>in</strong>dustrial wood supply from plantations is predicted to <strong>in</strong>crease from 624 million cubic metres <strong>in</strong><br />
2000 to 1,043 million cubic metres <strong>in</strong> 2040 – an <strong>in</strong>crease <strong>of</strong> 67%. Their predicted contribution to regional<br />
and <strong>the</strong> global wood supply is shown as follows.<br />
PAGE 32
2001 FOREST REVENUE REVIEW<br />
TABLE 2.17 PREDICTED CONTRIBUTION OF PLANTATION WOOD TO REGIONAL AND WORLD INDUSTRIAL WOOD<br />
SUPPLY<br />
2000 2020 2040<br />
% % %<br />
Asia 32 46 48<br />
Oceania 55 66 67<br />
World 35 44 46<br />
Source: ABARE/Jaakko Pöyry<br />
With<strong>in</strong> <strong>the</strong> Asia Pacific area, <strong>the</strong> major <strong>in</strong>creases <strong>in</strong> large diameter log supply that will directly compete<br />
with <strong>the</strong> tropical timber product trade, will be from <strong>the</strong> plantation <strong>forest</strong>s <strong>of</strong> New Zealand, Australia and<br />
Chile (Table 2.18).<br />
TABLE 2.18 PREDICTED PRODUCTION OF PLANTATION FOREST LARGE DIAMETER LOGS FROM MAIN EXPORT<br />
ASIA – PACIFIC COUNTRIES (MILLIONS M 3 )<br />
1998 2010<br />
Australia 7 8<br />
Chile 10 16<br />
New Zealand 10 18<br />
Total 27 42<br />
The large diameter log production from <strong>the</strong> Pacific North West <strong>forest</strong>s <strong>of</strong> Canada and <strong>the</strong> United States is<br />
not expected to <strong>in</strong>crease <strong>in</strong> supply. At <strong>the</strong> best <strong>the</strong>se <strong>forest</strong>s are likely to cont<strong>in</strong>ue at its present level <strong>of</strong><br />
supply to <strong>the</strong> Pacific Rim countries <strong>of</strong> around 24 million m 3 (<strong>in</strong> round wood equivalents). O<strong>the</strong>r<br />
commentators expect a slow decl<strong>in</strong>e <strong>in</strong> terms <strong>of</strong> its export supply and competitiveness with<strong>in</strong> <strong>the</strong> region.<br />
By <strong>the</strong> year 2010 Ch<strong>in</strong>a’s domestic supply <strong>of</strong> large diameter logs is expected to be almost exhausted.<br />
Currently Ch<strong>in</strong>a’s <strong>forest</strong>s produce about 50 million m 3 per annum <strong>of</strong> sawlogs and peeler logs. Ano<strong>the</strong>r<br />
10 million.m 3 per annum are imported <strong>of</strong> which 50% is currently sourced from Russia. A number <strong>of</strong><br />
estimates have been made <strong>of</strong> <strong>the</strong> future imports follow<strong>in</strong>g <strong>the</strong> 1998 harvest<strong>in</strong>g bans. All predictions agree<br />
that large diameter log imports will <strong>in</strong>crease.<br />
The Russian Far East <strong>forest</strong>s are still hold<strong>in</strong>g enormous supplies (perhaps 20 billion m 3 ) with an annual<br />
allowable cut <strong>of</strong> 100 million cubic metres per annum. The current cut is around 20 million m 3 per annum.<br />
The certa<strong>in</strong>ties are (a) that Russia’s Far East production is slowly <strong>in</strong>creas<strong>in</strong>g and, (b) that its problems <strong>of</strong><br />
high production cost, <strong>in</strong>adequate <strong>in</strong>frastructure and high risk <strong>in</strong>vestment climate are not likely to change<br />
quickly, and will cont<strong>in</strong>ue to restrict rapid <strong>in</strong>creases <strong>in</strong> supply.<br />
Trees grown outside <strong>forest</strong>s (ma<strong>in</strong>ly small farm woodlots, agricultural trees such as rubberwood, and<br />
home garden trees) are becom<strong>in</strong>g an <strong>in</strong>creas<strong>in</strong>gly important source <strong>of</strong> larger diameter <strong>in</strong>dustrial logs. This<br />
is already evident <strong>in</strong> Ch<strong>in</strong>a, Malaysia, Thailand, India and Vietnam. Estimates <strong>of</strong> this source <strong>of</strong> wood are<br />
unreliable, but based on limited surveys it is estimated to already be as high as 20 million cubic metres<br />
per annum for <strong>the</strong> five countries and <strong>in</strong>creas<strong>in</strong>g rapidly.<br />
PAGE 33
2.3.4 The Uncerta<strong>in</strong>ties <strong>of</strong> Wood Supply<br />
2001 FOREST REVENUE REVIEW<br />
Unreliable supply data will cont<strong>in</strong>ue to create uncerta<strong>in</strong>ties. The most important <strong>in</strong> terms <strong>of</strong> unreliable<br />
data is <strong>the</strong> widespread prevalence <strong>of</strong> illegal logg<strong>in</strong>g. In countries such as Indonesia estimates <strong>in</strong>dicate that<br />
illegal logg<strong>in</strong>g could be supply<strong>in</strong>g around half <strong>of</strong> <strong>the</strong> annual log cut. Illegal logg<strong>in</strong>g has <strong>the</strong> follow<strong>in</strong>g<br />
important, but difficult to quantify, impacts on markets. Firstly illegal logs are generally sold at lower<br />
prices than <strong>the</strong> <strong>of</strong>ficially sanctioned harvest, and <strong>the</strong>refore distort <strong>the</strong> prices <strong>of</strong> wood products <strong>in</strong> both<br />
domestic and <strong>in</strong>ternational markets. (Currently <strong>the</strong> most obvious example that impacts on PNG is<br />
Indonesia’s over production and under-pric<strong>in</strong>g <strong>of</strong> plywood that is partially sourced from illegal log<br />
production. This plywood has underm<strong>in</strong>ed <strong>the</strong> wood pay<strong>in</strong>g capacity <strong>of</strong> o<strong>the</strong>r log import<strong>in</strong>g plywood<br />
producers <strong>in</strong> <strong>the</strong> Asian region). Secondly illegal logg<strong>in</strong>g depletes <strong>the</strong> long-term <strong>forest</strong> grow<strong>in</strong>g stock, and<br />
volumes available for second and subsequent harvest<strong>in</strong>g cycles are likely to be greatly reduced, or <strong>in</strong><br />
many cases through over-cutt<strong>in</strong>g, regeneration will be poor and slow, and a second harvest may be<br />
uneconomic. This makes long term supply estimates from natural <strong>forest</strong>s exceed<strong>in</strong>gly difficult. Thirdly a<br />
high proportion <strong>of</strong> <strong>the</strong> illegal logs end up supply<strong>in</strong>g products for <strong>the</strong> domestic markets, and statistics<br />
relat<strong>in</strong>g to domestic demand are under-reported. This has resulted <strong>in</strong> several produc<strong>in</strong>g countries<br />
chang<strong>in</strong>g much more rapidly than expected, from be<strong>in</strong>g net exporters to large net importers <strong>of</strong> natural<br />
<strong>forest</strong> timber products. Examples <strong>in</strong>clude <strong>the</strong> Philipp<strong>in</strong>es, Thailand, and Vietnam.<br />
Ano<strong>the</strong>r uncerta<strong>in</strong>ty is <strong>the</strong> number <strong>of</strong> Asia’s smaller fast grow<strong>in</strong>g plantation <strong>forest</strong>s, that were <strong>in</strong>tended to<br />
be harvested before age ten for pulpwood, that are unlikely to f<strong>in</strong>d an economic pulpwood market. Many<br />
plantation <strong>forest</strong>s over <strong>the</strong> past 10 years have been planted <strong>in</strong> wrong places (usually too far from reliable<br />
pulpwood markets), and for non-commercial reasons (eg. re-green<strong>in</strong>g and creation <strong>of</strong> employment). The<br />
consequence is that many such <strong>forest</strong>s are grow<strong>in</strong>g <strong>in</strong>to larger diameter logs that will eventually f<strong>in</strong>d <strong>the</strong>ir<br />
way <strong>in</strong>to <strong>the</strong> sawlog and veneer log markets and directly compete with natural <strong>forest</strong> logs. Thailand,<br />
Malaysia, Indonesia, Vietnam, Laos and <strong>the</strong> Philipp<strong>in</strong>es all have a large number <strong>of</strong> examples <strong>of</strong> such<br />
plantation <strong>forest</strong>s. The area <strong>of</strong> <strong>the</strong>se “sawlog plantations by default” is currently estimated at 500,000<br />
hectares <strong>in</strong> <strong>the</strong>se six countries and a major saw mill<strong>in</strong>g <strong>in</strong>dustry is be<strong>in</strong>g developed upon small hardwood<br />
plantation logs.<br />
A <strong>new</strong> but still uncerta<strong>in</strong> <strong>in</strong>fluence on future wood supplies <strong>in</strong> <strong>the</strong> region is <strong>the</strong> grow<strong>in</strong>g <strong>in</strong>terest <strong>in</strong><br />
“carbon <strong>forest</strong>s”. These are plantations established to absorb atmospheric carbon and <strong>of</strong>fset <strong>the</strong> impacts<br />
<strong>of</strong> global warm<strong>in</strong>g from <strong>in</strong>dustrial greenhouse gases. Carbon emission trad<strong>in</strong>g could result <strong>in</strong> major<br />
distortions to <strong>the</strong> <strong>forest</strong> <strong>in</strong>dustry. If accepted we could see major <strong>in</strong>vestments <strong>in</strong> tree crops. They will be<br />
established at <strong>the</strong> lowest overall aggregate cost <strong>in</strong>clud<strong>in</strong>g land, plant<strong>in</strong>g, and ma<strong>in</strong>tenance. Their location<br />
may have little relevance to <strong>the</strong> geography <strong>of</strong> <strong>in</strong>dustrial process<strong>in</strong>g options or markets. There will be a<br />
tendency to plant for high volume growth <strong>of</strong> fibre with lesser emphasis on quality for end use or<br />
silvicultural manipulation. Ultimately this could lead to a global oversupply <strong>of</strong> low quality fibre with<br />
consequent price and hence market implications.<br />
Increased globalisation through improved transport <strong>system</strong>s, lowered tariffs and “brand<strong>in</strong>g” <strong>in</strong> market<strong>in</strong>g<br />
are important but uncerta<strong>in</strong> <strong>in</strong>fluences. Substitution <strong>of</strong> tropical timber products by temperate hardwoods<br />
and coniferous species has been more rapid than predicted, particularly where tropical timber products<br />
are be<strong>in</strong>g utilised as a utility commodity. With <strong>the</strong> reduction <strong>of</strong> larger diameter logs with<strong>in</strong> <strong>the</strong> Asia-<br />
Pacific region, <strong>the</strong> region is <strong>in</strong>creas<strong>in</strong>gly sourc<strong>in</strong>g logs and sawn timber products from non-traditional<br />
sources. For example Scand<strong>in</strong>avian and Sou<strong>the</strong>rn United States saw-millers have significantly <strong>in</strong>creased<br />
<strong>the</strong>ir market shares for sawn timber products <strong>in</strong> Japan and o<strong>the</strong>r Asian markets over <strong>the</strong> past five years.<br />
PAGE 34
2.4 CONCLUSIONS AND IMPLICATIONS FOR PAPUA NEW GUINEA<br />
Three ma<strong>in</strong> conclusions for Papua New Gu<strong>in</strong>ea emerge from this market analysis:<br />
2001 FOREST REVENUE REVIEW<br />
There is a need for considerable care when try<strong>in</strong>g to understand and <strong>in</strong>terpret <strong>the</strong> various supply and<br />
demand modell<strong>in</strong>g attempts <strong>in</strong> recent years. The whole procedure <strong>of</strong> forecast<strong>in</strong>g <strong>the</strong> future wood<br />
supply-demand balance and its impact on prices is extremely complex. The Asia Pacific region will<br />
cont<strong>in</strong>ue to rema<strong>in</strong> <strong>the</strong> largest wood deficit region <strong>in</strong> <strong>the</strong> world, but unfortunately little <strong>of</strong> <strong>the</strong> wood<br />
supply and demand modell<strong>in</strong>g <strong>in</strong> <strong>the</strong> region provides adequate separation <strong>of</strong> larger diameter tropical<br />
logs from smaller diameter logs from o<strong>the</strong>r sources.<br />
There is a general consensus that <strong>the</strong> supply <strong>of</strong> larger diameter logs will decrease, but little<br />
consensus on whe<strong>the</strong>r <strong>the</strong> o<strong>the</strong>r market forces (pr<strong>in</strong>cipally economic growth, chang<strong>in</strong>g technology,<br />
substitution, green consumerism) will allow <strong>the</strong> decrease to be translated <strong>in</strong>to <strong>in</strong>creased prices.<br />
In <strong>the</strong> short term, <strong>the</strong> impact <strong>of</strong> illegal logg<strong>in</strong>g, particularly by Indonesia, is expected to cont<strong>in</strong>ue<br />
underm<strong>in</strong><strong>in</strong>g prices for PNG logs.<br />
PAGE 35
PART 3 TRANSFER PRICING<br />
2001 FOREST REVENUE REVIEW<br />
In this section we exam<strong>in</strong>e firstly <strong>the</strong> <strong>revenue</strong> aspect, namely <strong>the</strong> adm<strong>in</strong>istrative control procedures<br />
currently exercised by <strong>the</strong> Government to prevent transfer pric<strong>in</strong>g, a major term <strong>of</strong> reference for this<br />
study. Secondly, <strong>the</strong> log production costs <strong>in</strong>curred by exporters are considered, and <strong>the</strong> overall<br />
pr<strong>of</strong>itability <strong>of</strong> <strong>the</strong> <strong>in</strong>dustry.<br />
3.1 ADMINISTRATION<br />
S<strong>in</strong>ce log exports are a significant source <strong>of</strong> Government <strong>revenue</strong>, and a major source <strong>of</strong> cash <strong>in</strong>come for<br />
<strong>the</strong> <strong>forest</strong> owner, <strong>the</strong> tax base needs to be verified i.e. export shipments must be checked to ensure<br />
volume, species and grades are correctly stated, and <strong>the</strong> quoted price conforms to <strong>the</strong> prevail<strong>in</strong>g market<br />
price. S<strong>in</strong>ce May 1994, <strong>the</strong> Government has contracted an <strong>in</strong>dependent external <strong>in</strong>spection agency, SGS<br />
PNG Ltd., to undertake log export monitor<strong>in</strong>g and to report discrepancies to <strong>the</strong> PNGFA. Control<br />
procedures, however, rema<strong>in</strong> vested with <strong>the</strong> PNGFA. The parent company, Société Générale de<br />
Surveillance (SGS) S.A., headquartered <strong>in</strong> Geneva, has been operat<strong>in</strong>g trade <strong>in</strong>spection services for over<br />
a century, and now states that it monitors about 5% <strong>of</strong> world trade. Its commercial activities are conf<strong>in</strong>ed<br />
to <strong>in</strong>spection, ISO quality <strong>system</strong>s tra<strong>in</strong><strong>in</strong>g and certification, health and safety standards and similar<br />
activities but it has no manufactur<strong>in</strong>g, trad<strong>in</strong>g, or f<strong>in</strong>ancial operations that could compromise its<br />
<strong>in</strong>dependence. In recent years it has also begun, through an affiliate, to work on certification <strong>of</strong> <strong>forest</strong>s as<br />
susta<strong>in</strong>ably managed.<br />
The SGS PNG Ltd. services to <strong>the</strong> Government <strong>of</strong> Papua New Gu<strong>in</strong>ea <strong>in</strong>clude:<br />
Provision <strong>of</strong> log tags to be affixed to end <strong>of</strong> each log by producers <strong>the</strong>mselves at <strong>the</strong> time <strong>of</strong> scal<strong>in</strong>g<br />
at <strong>the</strong> log land<strong>in</strong>g <strong>in</strong> <strong>the</strong> <strong>forest</strong> accord<strong>in</strong>g to PNGFA regulations;<br />
Check<strong>in</strong>g all logs for species and grade, and scal<strong>in</strong>g a 10% sample for volume at <strong>the</strong> pre-shipment<br />
stage;<br />
Monitor<strong>in</strong>g ships to verify <strong>the</strong> species, grades, and volumes <strong>of</strong> logs actually loaded;<br />
One fur<strong>the</strong>r service is technically required but could not yet be implemented because <strong>of</strong> constra<strong>in</strong>ts<br />
imposed by <strong>the</strong> Bank <strong>of</strong> Papua New Gu<strong>in</strong>ea:<br />
Verify<strong>in</strong>g commercial <strong>in</strong>voices and Bills <strong>of</strong> Lad<strong>in</strong>g before <strong>the</strong>y can be presented aga<strong>in</strong>st a Letter <strong>of</strong><br />
Credit<br />
Exporters are <strong>the</strong>refore required to obta<strong>in</strong> from <strong>the</strong> PNGFA a separate price and volume endorsement for<br />
each saw/veneer log group 1 species, for each log group among <strong>the</strong> o<strong>the</strong>r group, and ano<strong>the</strong>r for <strong>the</strong> low<br />
grade logs. These are all required for every shipment, to obta<strong>in</strong> a log export permit (PNGFA) and license<br />
(Department <strong>of</strong> Trade & Industry), and to comply with <strong>the</strong> monitor<strong>in</strong>g and control operations. They are<br />
supplied with <strong>the</strong> SGS log tags and must use <strong>the</strong> <strong>of</strong>ficial numbered PNGFA Log Scal<strong>in</strong>g Record Sheets.<br />
The legal rights <strong>of</strong> SGS to <strong>in</strong>spect shipments are solely those granted under contract to act as an agent <strong>of</strong><br />
<strong>the</strong> PNGFA.<br />
The bar-coded log tags cost <strong>the</strong> producer 50 toea each, and have two tear-<strong>of</strong>f sections for removal at <strong>the</strong><br />
time <strong>of</strong> shipment, one for <strong>the</strong> SGS <strong>in</strong>spector, and one for <strong>the</strong> exporter. After receiv<strong>in</strong>g a buyer’s <strong>of</strong>fer, <strong>the</strong><br />
exporter must secure PNGFA endorsement before signall<strong>in</strong>g acceptance, a procedure that is supposed to<br />
be completed <strong>in</strong> two work<strong>in</strong>g days where no item <strong>of</strong> <strong>the</strong> proposed sale is questioned. Each <strong>of</strong> <strong>the</strong><br />
seventeen species <strong>in</strong> Group 1 (see Annex D for list) must have its <strong>in</strong>dividual price endorsed but species <strong>in</strong><br />
Groups 2, 3, & 4 may be submitted for endorsement with average group prices. An explanation can be<br />
sought for submitted prices that are below prevail<strong>in</strong>g norms, but this rarely happens. Assembl<strong>in</strong>g a log<br />
shipment is a slow process, and <strong>the</strong> actual volume may not be known accurately until load<strong>in</strong>g is<br />
PAGE 36
2001 FOREST REVENUE REVIEW<br />
complete, but even at an early stage it should be known to with<strong>in</strong> ±10%, and ship clearance is very rarely<br />
delayed.<br />
Shipments may be ei<strong>the</strong>r <strong>of</strong> saw/veneer logs or <strong>of</strong> low grades (old logs/rejects/small logs), or plantation<br />
logs. Mixed shipments composed <strong>of</strong> <strong>the</strong>se types also occur, <strong>in</strong> which case <strong>the</strong> exporter must separate logs<br />
both on paper and on <strong>the</strong> wharf. Saw/veneer logs are freshly cut, have a m<strong>in</strong>imum mid-diameter <strong>of</strong> 40cm,<br />
and reasonably good form. In <strong>the</strong> case <strong>of</strong> low grades <strong>the</strong> PNGFA Project Supervisor must certify <strong>in</strong><br />
writ<strong>in</strong>g <strong>the</strong> reasons for down-grad<strong>in</strong>g, which can be due to over-age (more than three months s<strong>in</strong>ce<br />
fell<strong>in</strong>g), rejection by buyers more than twice, or under-size (less than 40 cm. mid-diameter). The PNGFA<br />
Market<strong>in</strong>g Branch assign to each set <strong>of</strong> price endorsements for each shipment a unique reference number,<br />
allow<strong>in</strong>g <strong>the</strong> shipment to be traced through to completion, and <strong>the</strong> endorsement is valid for two months.<br />
The endorsement entitles <strong>the</strong> log exporter to apply for a Log Export Licence (DTI), which aga<strong>in</strong> details<br />
volumes and species, and a Log Export Permit (PNGFA) and to proceed with prepar<strong>in</strong>g <strong>the</strong> shipment.<br />
SGS PNG is notified <strong>of</strong> <strong>the</strong> impend<strong>in</strong>g shipment by <strong>the</strong> exporter <strong>in</strong>dependently <strong>of</strong> <strong>the</strong> Licence and Permit<br />
application procedures, and <strong>the</strong> exporter must allow a m<strong>in</strong>imum <strong>of</strong> ten work<strong>in</strong>g days to permit SGS PNG<br />
to undertake <strong>the</strong> <strong>in</strong>spection. Moreover, 95% <strong>of</strong> <strong>the</strong> shipment must be available for SGS PNG <strong>in</strong>spection<br />
with<strong>in</strong> five work<strong>in</strong>g days or 72 hours if <strong>the</strong> shipment is less than 10,000 m 3 and <strong>the</strong> statement <strong>of</strong> logs to<br />
be exported is on a computer diskette. The Statement <strong>of</strong> Logs to be exported (now usually computergenerated)<br />
is to <strong>in</strong>clude species, length, average diameter and calculated volume with defect volume, if<br />
any. Both <strong>the</strong> exporter and <strong>the</strong> SGS PNG <strong>in</strong>spector sign this document.<br />
Exporters are encouraged to declare 10% more logs than will be exported s<strong>in</strong>ce <strong>the</strong> buyer’s representative<br />
may reject some, and replacements can be made <strong>in</strong> time for <strong>the</strong> f<strong>in</strong>al load-out statement. The preshipment<br />
SGS PNG <strong>in</strong>spection <strong>in</strong>cludes a 10% random sample (<strong>in</strong>clud<strong>in</strong>g from <strong>the</strong> recommended buffer<br />
for rejects) and if <strong>the</strong> shipment does not meet <strong>the</strong> PNGFA’s criteria a discrepancy notice will be issued.<br />
Generally such discrepancies <strong>in</strong>volve a mis-declaration or mis-identification <strong>of</strong> species (this must be<br />
100% correct) and undeclared logs noted at pre-shipment or on load<strong>in</strong>g (a 10% sample must be correct to<br />
with<strong>in</strong> ± 3.0% <strong>of</strong> <strong>the</strong> sample volume). Individual shipments range from less than 1,000 to more than<br />
7,000 m 3 , and nowadays rarely exceed US$400,000 <strong>in</strong> value each. In terms <strong>of</strong> shipment volumes <strong>the</strong><br />
discrepancy is about twice as likely to be over-load<strong>in</strong>g as under-load<strong>in</strong>g.<br />
In September 2001, when <strong>the</strong> total volume <strong>in</strong>spected was 81,391 m 3 , <strong>the</strong> volume conta<strong>in</strong><strong>in</strong>g discrepancies<br />
was 14,689 m 3 or 18%. This comprised 13 <strong>of</strong> 19 shipments, 68%. The correspond<strong>in</strong>g figures for<br />
December 1997, by way <strong>of</strong> comparison, are 20% and 64% respectively, on a much higher volume –<br />
178,100 m 3 – but <strong>the</strong>re has been a sharp decl<strong>in</strong>e <strong>in</strong> overload<strong>in</strong>g s<strong>in</strong>ce this particular type <strong>of</strong> discrepancy<br />
began to be published <strong>in</strong> SGS PNG monthly reports.<br />
Dur<strong>in</strong>g <strong>the</strong> <strong>in</strong>spection <strong>of</strong> shipments by <strong>the</strong> buyer’s representative, logs may <strong>of</strong> course be rejected, and<br />
replacements may be made. The declaration <strong>of</strong> more logs than <strong>the</strong> ship will load allows for <strong>the</strong><br />
replacements to be made without any delay and <strong>the</strong> “Statement <strong>of</strong> Logs to be Exported” to be altered<br />
accord<strong>in</strong>gly. However, paper trimm<strong>in</strong>g may also occur and is permitted for all Malas (Homalium<br />
foetidum) logs and for a fur<strong>the</strong>r 2% <strong>of</strong> non-Malas logs. Paper trimm<strong>in</strong>g means to alter <strong>the</strong> length and thus<br />
<strong>the</strong> volume recorded downwards without physically trimm<strong>in</strong>g <strong>the</strong> logs. Physical trimm<strong>in</strong>g <strong>of</strong> logs<br />
requires <strong>the</strong> presence <strong>of</strong> <strong>the</strong> SGS PNG <strong>in</strong>spector. After <strong>the</strong> resolution <strong>of</strong> any Discrepancy Notice that<br />
might have been served, <strong>the</strong> PNG Project Supervisor may give permission for load<strong>in</strong>g. However, <strong>the</strong><br />
PNGFA Board<strong>in</strong>g Officer at <strong>the</strong> Declared Customs Port may hold up f<strong>in</strong>al clearance where <strong>the</strong>re is an<br />
<strong>in</strong>consistency <strong>of</strong> more than ± 10% for any group 1 species <strong>of</strong> for <strong>the</strong> 2, 3 or 4 species group<strong>in</strong>gs.<br />
Clearance f<strong>in</strong>ally rests with <strong>the</strong> PNGFA Market<strong>in</strong>g Branch and <strong>the</strong> Customs Officer. Of course underload<strong>in</strong>g<br />
and over-load<strong>in</strong>g may have legitimate reasons such as <strong>the</strong> decision <strong>of</strong> a vessel’s Master to weigh<br />
anchor and sail when freight weight limits are reached.<br />
The complex process <strong>of</strong> follow<strong>in</strong>g all <strong>the</strong> steps detailed above means that <strong>the</strong> log exporter is forced to<br />
operate on <strong>the</strong> spot market i.e. shipment by shipment, s<strong>in</strong>ce any long-term agreement with a buyer for<br />
say, a harvest<strong>in</strong>g season’s supply, would naturally be undertaken at lower unit prices, <strong>the</strong> difference<br />
be<strong>in</strong>g <strong>the</strong> discount granted to <strong>the</strong> trader who would commit his company to advance purchases (a bulk<br />
PAGE 37
2001 FOREST REVENUE REVIEW<br />
discount). Such a lower unit price would raise suspicions <strong>of</strong> transfer pric<strong>in</strong>g <strong>in</strong> be<strong>in</strong>g out <strong>of</strong> l<strong>in</strong>e with <strong>the</strong><br />
spot market, although <strong>in</strong> fact it would be perfectly normal commercial practice. This would <strong>the</strong>oretically<br />
appear to be a competitive disadvantage to PNG exporters but <strong>in</strong> practice it may not be so as it is not<br />
known whe<strong>the</strong>r buyers would be will<strong>in</strong>g to afford <strong>the</strong>m this facility, s<strong>in</strong>ce PNG is a smaller supplier than<br />
Sarawak (but still 35% <strong>of</strong> Sarawak’s log volumes), and such suppliers are typically observed to be “out<br />
on a limb” <strong>in</strong> <strong>the</strong> spot market after buyers have confirmed <strong>the</strong>ir ma<strong>in</strong> security <strong>of</strong> supply with <strong>the</strong> largest<br />
exporters.<br />
3.2 TRANSFER PRICING INVESTIGATION<br />
Transfer pric<strong>in</strong>g, sensu stricto, is <strong>the</strong> method <strong>of</strong> determ<strong>in</strong><strong>in</strong>g <strong>in</strong>ternal prices to be used <strong>in</strong> <strong>the</strong> transfer <strong>of</strong><br />
goods and services between <strong>the</strong> different divisions or sites <strong>of</strong> <strong>the</strong> same company or organization.<br />
Economic <strong>the</strong>ory suggests that <strong>the</strong> most efficient benchmark for sett<strong>in</strong>g such prices is <strong>the</strong> open market<br />
arm’s length price for <strong>the</strong> good or service <strong>in</strong> question. Indeed, some vertically <strong>in</strong>tegrated companies give<br />
<strong>the</strong>ir divisions freedom to purchase or sell outside <strong>the</strong> company if <strong>the</strong>y are able to achieve better prices,<br />
quality, or o<strong>the</strong>r attributes <strong>of</strong> <strong>the</strong> good or service than is <strong>of</strong>fered to <strong>the</strong>m by a division <strong>of</strong> <strong>the</strong>ir own<br />
hold<strong>in</strong>g company.<br />
However, when goods and services are traded <strong>in</strong>ternationally, opportunities may arise for tax evasion <strong>in</strong><br />
export<strong>in</strong>g countries by declar<strong>in</strong>g lower-than-market fob prices, and conversely <strong>in</strong> import<strong>in</strong>g countries by<br />
declar<strong>in</strong>g higher-than-market cif prices for use as deductible costs <strong>in</strong> tax returns. Where a mult<strong>in</strong>ational<br />
company is trad<strong>in</strong>g across an <strong>in</strong>ternational border but with<strong>in</strong> branches <strong>of</strong> <strong>the</strong> same hold<strong>in</strong>g company,<br />
arms’ length transactions may be even less likely, and <strong>the</strong> different rates applied <strong>of</strong> national taxation<br />
<strong>system</strong>s could also be exploited. The objective is to maximize group after-tax pr<strong>of</strong>it.<br />
Pla<strong>in</strong>ly <strong>the</strong> practice is not restricted to <strong>the</strong> <strong>forest</strong>ry sector, but <strong>the</strong> Review Team was requested to exam<strong>in</strong>e<br />
specifically <strong>the</strong> possibility <strong>of</strong> tax losses to Government occurr<strong>in</strong>g <strong>in</strong> <strong>the</strong> PNG <strong>forest</strong>ry sector as a result <strong>of</strong><br />
transfer pric<strong>in</strong>g. Its existence or o<strong>the</strong>rwise obviously affects all conclusions to be drawn from an analysis<br />
<strong>of</strong> <strong>forest</strong>ry <strong>revenue</strong> s<strong>in</strong>ce <strong>the</strong> true value <strong>of</strong> many commercial parameters may be greater or less than that<br />
determ<strong>in</strong>ed.<br />
3.2.1 Types <strong>of</strong> Transfer Pric<strong>in</strong>g and Information Sources<br />
The issue <strong>of</strong> transfer pric<strong>in</strong>g and its implications for <strong>the</strong> <strong>forest</strong> <strong>revenue</strong> <strong>system</strong> have been under<br />
discussion with<strong>in</strong> <strong>the</strong> <strong>forest</strong>ry sector and <strong>in</strong> o<strong>the</strong>r government agencies for <strong>the</strong> last two decades. The first<br />
references are found <strong>in</strong> reports prepared <strong>in</strong> <strong>the</strong> 80’s (APM, 1983; Webber, 1988). In fact documents <strong>of</strong><br />
that period make reference to several areas <strong>of</strong> concern, <strong>in</strong>clud<strong>in</strong>g <strong>the</strong> sub-optimal returns on <strong>in</strong>ternational<br />
markets, loss <strong>of</strong> tax <strong>revenue</strong>s and royalties through transfer pric<strong>in</strong>g, <strong>in</strong>adequate <strong>in</strong>vestments <strong>in</strong> valueadded<br />
process<strong>in</strong>g, malpractice <strong>in</strong> aspects <strong>of</strong> resource management, and o<strong>the</strong>rs. These and o<strong>the</strong>r issues<br />
were said to have generated widespread dissatisfaction with <strong>the</strong> <strong>forest</strong>ry sector, and resulted <strong>in</strong> a<br />
Commission <strong>of</strong> Inquiry (“Barnett” Report, 1989). This Commission found <strong>the</strong> practice <strong>in</strong> all but two<br />
<strong>forest</strong>ry companies operat<strong>in</strong>g <strong>in</strong> Papua New Gu<strong>in</strong>ea.<br />
Actions were taken based on recommendations made by <strong>the</strong> Commission, but it seems that to some<br />
extent most problems have persisted. More recent studies (FORTECH, 1998), po<strong>in</strong>t out that transfer<br />
pric<strong>in</strong>g, for example, is still a problem and PNG has not been able to capture <strong>the</strong> full benefits from its log<br />
exports. Transfer pric<strong>in</strong>g activities are recognised as a common practice <strong>in</strong> most develop<strong>in</strong>g countries,<br />
where external <strong>in</strong>vestors and even local <strong>in</strong>vestors search for alternatives to reduce payment <strong>of</strong> taxes<br />
with<strong>in</strong> <strong>the</strong> country <strong>in</strong> order to <strong>in</strong>crease pr<strong>of</strong>its and also to repatriate or relocate capital. Its occurrence and<br />
magnitude is usually proportional to <strong>the</strong> economic and political uncerta<strong>in</strong>ties with<strong>in</strong> a certa<strong>in</strong> country or<br />
region, but it can also be affected by o<strong>the</strong>r market conditions.<br />
PAGE 38
2001 FOREST REVENUE REVIEW<br />
The problem is not simple to attack, and <strong>in</strong> each case (economic activity, product, country, etc.) <strong>the</strong>re are<br />
specific features that need to be fully understood. The <strong>forest</strong>ry sector is probably <strong>of</strong> <strong>the</strong> more complex<br />
type.<br />
Transfer pric<strong>in</strong>g occurs on two different fronts: over valuation <strong>of</strong> imported goods and services, and under<br />
valuation <strong>of</strong> exported goods and services.<br />
<strong>Forest</strong> operations <strong>in</strong> many tropical countries, and this <strong>in</strong>cludes PNG, are heavily dependent on imported<br />
capital goods, and also consumables and services. In import<strong>in</strong>g goods and services transfer pric<strong>in</strong>g can<br />
take place through:<br />
Over-pric<strong>in</strong>g <strong>of</strong> imported equipment and mach<strong>in</strong>ery and spare parts;<br />
Over-pric<strong>in</strong>g <strong>of</strong> consumables and o<strong>the</strong>r imported items;<br />
Transfer <strong>of</strong> overhead costs from headquarters and <strong>the</strong> costs <strong>of</strong> unrelated bus<strong>in</strong>ess activities to local<br />
operations;<br />
Over-pric<strong>in</strong>g <strong>of</strong> services, and expatriate consultancy work.<br />
On <strong>the</strong> export <strong>of</strong> <strong>forest</strong> products transfer pric<strong>in</strong>g issue <strong>in</strong>clude ma<strong>in</strong>ly:<br />
Mis-declaration <strong>of</strong> species;<br />
Mis-declaration <strong>of</strong> grades;<br />
Under-measurement;<br />
Under-pric<strong>in</strong>g;<br />
Re-issu<strong>in</strong>g <strong>of</strong> documents/double <strong>in</strong>voic<strong>in</strong>g.<br />
Under-pric<strong>in</strong>g is one <strong>of</strong> <strong>the</strong> most frequently used forms and <strong>in</strong> this case several alternatives apply,<br />
<strong>in</strong>clud<strong>in</strong>g:<br />
A direct agreement between buyer and seller on an extra payment to be made <strong>in</strong> addition to <strong>the</strong><br />
formal <strong>in</strong>voice presented by <strong>the</strong> exporter to <strong>the</strong> export<strong>in</strong>g country authorities;<br />
Sell<strong>in</strong>g logs to a <strong>of</strong>fshore parent company that will <strong>the</strong>n re-<strong>in</strong>voice or re-export for a substantially<br />
higher price;<br />
The relative importance <strong>of</strong> each type <strong>of</strong> transfer pric<strong>in</strong>g depends on several aspects, <strong>in</strong>clud<strong>in</strong>g <strong>the</strong><br />
country, product, distribution channel, economic situation and o<strong>the</strong>rs.<br />
In this work we have exam<strong>in</strong>ed export-based transfer pric<strong>in</strong>g only, ow<strong>in</strong>g to <strong>the</strong> terms <strong>of</strong> reference and<br />
time constra<strong>in</strong>ts. It is important to note that discrepancies discovered may be due to transfer pric<strong>in</strong>g by<br />
importers or to o<strong>the</strong>r reasons.<br />
The <strong>in</strong>formation used <strong>in</strong> <strong>the</strong> transfer pric<strong>in</strong>g <strong>in</strong>vestigation was collected from several sources, <strong>in</strong>clud<strong>in</strong>g:<br />
Reviews <strong>of</strong> published data and <strong>in</strong>formation, <strong>in</strong>clud<strong>in</strong>g general trade <strong>of</strong> tropical timber, specific<br />
<strong>in</strong>formation on <strong>the</strong> trade and market for PNG timbers, price data along <strong>the</strong> last 3-4 years;<br />
Visits to several organisations/<strong>in</strong>stitutions for collection <strong>of</strong> data and <strong>in</strong>terviews with persons work<strong>in</strong>g<br />
<strong>in</strong> <strong>the</strong> trade and <strong>in</strong>dustry, or with knowledge <strong>of</strong> tropical timber markets and related issues. This<br />
<strong>in</strong>cluded visits to Japan, Ch<strong>in</strong>a, and Hong Kong as most logs imported by Ch<strong>in</strong>a are traded through<br />
Hong Kong trad<strong>in</strong>g companies.<br />
PAGE 39
2001 FOREST REVENUE REVIEW<br />
Particular attention was given to <strong>the</strong> Log Export Monitor<strong>in</strong>g Monthly Report, prepared by SGS PNG Ltd<br />
(see section 3.1). The document is made available to PNGFA every month and <strong>in</strong>cludes a set <strong>of</strong> 21<br />
different reports, with details <strong>of</strong> volume, values, species, grades, exporters, importers, etc. There is also<br />
<strong>in</strong>formation on discrepancies identified.<br />
Attention was also given to exist<strong>in</strong>g regulations and o<strong>the</strong>r mechanisms established by <strong>the</strong> Government <strong>in</strong><br />
special <strong>the</strong> Procedures for Export<strong>in</strong>g Logs. The Procedures cover aspects related to price approval, export<br />
permit and licence and also aspects related to monitor<strong>in</strong>g and control. Their contents are described <strong>in</strong><br />
section 3.1.<br />
Ano<strong>the</strong>r component analysed was <strong>the</strong> State Purchase Option (SPO) mechanism. The SPO is a mechanism<br />
that enables <strong>the</strong> PNGFA to sell up to 25% <strong>of</strong> an exporter’s output if it believes it can receive a higher<br />
price. In pr<strong>in</strong>ciple this should be a deterrent to artificial under-pric<strong>in</strong>g, but <strong>in</strong> practice it is little used <strong>in</strong> a<br />
decl<strong>in</strong><strong>in</strong>g market and <strong>the</strong> option has not been exercised for some time. The SPO could also serve o<strong>the</strong>r<br />
aims <strong>in</strong>clud<strong>in</strong>g market <strong>in</strong>telligence and market development from <strong>the</strong> national po<strong>in</strong>t <strong>of</strong> view.<br />
3.2.2 Volumetric Information<br />
Volume discrepancies reported monthly by SGS are <strong>of</strong> course by def<strong>in</strong>ition detected and must be<br />
rectified through payment adjustments. The existence <strong>of</strong> SGS activity throughout <strong>the</strong> country implies that<br />
under-measurement at <strong>the</strong> export port is an unlikely method <strong>of</strong> transfer pric<strong>in</strong>g. However, one past study<br />
suggested that PNG logs when re-scaled <strong>in</strong> Japan could be re-assessed at 10% less volume, <strong>in</strong> some case,<br />
and on average approximately 5% (APM, 1983). Highly tra<strong>in</strong>ed pr<strong>of</strong>essionals, licensed by <strong>the</strong><br />
Government as <strong>in</strong>dependent log identifiers and scalers, undertake <strong>the</strong> scal<strong>in</strong>g <strong>in</strong> Japan. From <strong>the</strong> Japanese<br />
importer’s po<strong>in</strong>t <strong>of</strong> view, <strong>the</strong> volume that counts is <strong>the</strong> volume as measured on rescal<strong>in</strong>g <strong>in</strong> Japan, as this<br />
determ<strong>in</strong>es <strong>the</strong> volume that <strong>the</strong> importer has for sale <strong>in</strong> <strong>the</strong> country. The importer has an <strong>in</strong>centive to scale<br />
conservatively if his buyer is l<strong>in</strong>ked <strong>in</strong>to a cost-plus situation on a unit volume basis, as is typically <strong>the</strong><br />
case with a large trad<strong>in</strong>g company. FORTECH (1998), work<strong>in</strong>g with <strong>in</strong>formation <strong>of</strong> logs exported to<br />
Japan from January 1995 to July 1997 (around 63% <strong>of</strong> all PNG log exports), calculated that on average<br />
<strong>the</strong> recorded volume <strong>of</strong> logs imported <strong>in</strong>to Japan from PNG was around 3.2% larger than <strong>the</strong> volume <strong>of</strong><br />
logs exported from PNG to Japan. Such small scal<strong>in</strong>g error differences are not statistically significant if<br />
<strong>the</strong> null hypo<strong>the</strong>sis is that transfer pric<strong>in</strong>g is occurr<strong>in</strong>g through under-measurement. On <strong>the</strong> o<strong>the</strong>r hand,<br />
and more importantly, <strong>the</strong> result implies that scal<strong>in</strong>g differences cannot be adduced as evidence to<br />
account for a discrepancy <strong>in</strong> prices per unit volume.<br />
The Review team re-exam<strong>in</strong>ed <strong>the</strong> scal<strong>in</strong>g issue, by compar<strong>in</strong>g observed volumes exported by PNG, as<br />
reported <strong>in</strong> <strong>the</strong> Monthly Report <strong>of</strong> SGS (PNG source) with those reported by <strong>the</strong> Japan Lumber Importers<br />
Association (JLIA). The JLIA <strong>in</strong>formation is based on <strong>the</strong> Trade Statistics <strong>of</strong> <strong>the</strong> Japanese M<strong>in</strong>istry <strong>of</strong><br />
F<strong>in</strong>ance (Figure 3.1). The trend l<strong>in</strong>es show even less difference than that suggested by <strong>the</strong> previous<br />
studies, and <strong>the</strong> Review Team concludes that <strong>the</strong>re is no evidence for transfer pric<strong>in</strong>g via volumetric mismeasurements<br />
<strong>in</strong> <strong>the</strong> Japanese market, and, as a logical corollary, that <strong>the</strong>re is no evidence that different<br />
scal<strong>in</strong>g modes can account for discrepancies <strong>in</strong> prices per unit volume at a given pric<strong>in</strong>g po<strong>in</strong>t.<br />
PAGE 40
FIGURE 3.1 LOG EXPORTS FROM PAPUA NEW GUINEA TO JAPAN (SGS VS. JLIA FIGURES)<br />
Volumes <strong>in</strong> 1.000 m³<br />
2.000<br />
1.500<br />
1.000<br />
500<br />
2001 FOREST REVENUE REVIEW<br />
0<br />
1996 1997 1998 1999 2000<br />
Sources: Log Exports: SGS PNG Pty Ltd; Log Export Monitor<strong>in</strong>g: Monthly Report (1996-2000); Log Imports: JLIA –<br />
Japan Lumber Importers Association: The Trade Statistics, M<strong>in</strong>istry <strong>of</strong> F<strong>in</strong>ance, Japan<br />
The situation is not <strong>the</strong> same when analys<strong>in</strong>g log exports to Ch<strong>in</strong>a (see Figure 3.2). The volumes reported<br />
as exported to Ch<strong>in</strong>a by PNG (based on SGS PNG reports) are lower than <strong>the</strong> volumes reported by Ch<strong>in</strong>a<br />
(ITTO source) as imported from PNG. Table 3.1 shows that <strong>the</strong>se differences are large and show no<br />
pattern.<br />
FIGURE 3.2 LOG EXPORTS FROM PNG TO CHINA AND CHINA LOG IMPORTS FROM PNG<br />
Volumes <strong>in</strong> 1.000 m³<br />
800<br />
700<br />
600<br />
500<br />
400<br />
300<br />
200<br />
100<br />
Log Exports<br />
from PNG to Japan - SGS<br />
Japan Log Imports<br />
from PNG - JLIA<br />
0<br />
1996 1997 1998 1999 2000<br />
Log Exports from<br />
PNG to Ch<strong>in</strong>a - GSG<br />
Ch<strong>in</strong>a Log Imports<br />
from PNG - ITTO<br />
Sources: Log Exports: SGS PNG Pty Ltd; Log Export Monitor<strong>in</strong>g: Monthly Report (1996-2000); Log Imports: ITTO<br />
Annual Review 2000<br />
PAGE 41
TABLE 3.1 VOLUME DIFFERENCES IN SGS PNG EXPORT AND CHINESE IMPORT FIGURES<br />
Year<br />
1996<br />
1997<br />
1998<br />
1999<br />
2000<br />
Volume Difference<br />
m 3 * % **<br />
-43 595<br />
+78 918<br />
+31 618<br />
+125 504<br />
+88 397<br />
* Ch<strong>in</strong>a - PNG<br />
** Calculated Based on PNG Exports<br />
-76%<br />
+75%<br />
+20%<br />
+38%<br />
+13%<br />
2001 FOREST REVENUE REVIEW<br />
The Review Team identified several possible reasons for <strong>the</strong> differences, but probably <strong>the</strong> ma<strong>in</strong> reason is<br />
that Ch<strong>in</strong>ese statistics are unreliable, a problem encountered <strong>in</strong> several studies. In order to improve <strong>forest</strong><br />
products statistics <strong>in</strong>formation ITTO has supported Ch<strong>in</strong>a with a project, through <strong>the</strong> Ch<strong>in</strong>ese Academy<br />
<strong>of</strong> <strong>Forest</strong>ry (CAF) to help establish a market <strong>in</strong>formation service. Never<strong>the</strong>less this is not an easy task,<br />
especially <strong>in</strong> so large a country, and <strong>in</strong> spite <strong>of</strong> progress made <strong>the</strong> current statistical data still have several<br />
<strong>in</strong>consistencies.<br />
In order to identify possible errors <strong>in</strong> <strong>the</strong> ITTO/CAF statistics (used as <strong>the</strong> basis for <strong>the</strong> Ch<strong>in</strong>a imports)<br />
dur<strong>in</strong>g <strong>the</strong> implementation <strong>of</strong> this study <strong>in</strong>formation was collected directly from <strong>the</strong> Ch<strong>in</strong>ese <strong>of</strong>ficial<br />
statistics. The Ch<strong>in</strong>ese <strong>of</strong>ficial statistics <strong>in</strong>formation checked for 1998 and 1999 for log imports was<br />
found also to be very <strong>in</strong>consistent and did not help to improve <strong>the</strong> precision.<br />
The <strong>in</strong>clusion <strong>of</strong> exports <strong>of</strong> PNG to Hong Kong could expla<strong>in</strong> part <strong>of</strong> <strong>the</strong> discrepancies found. For<br />
example tak<strong>in</strong>g year 2000 <strong>in</strong>formation on log exports <strong>of</strong> PNG to Ch<strong>in</strong>a a discrepancy <strong>of</strong> 88 000 m 3 can be<br />
observed between <strong>the</strong> two sources <strong>of</strong> <strong>in</strong>formation (PNG and Ch<strong>in</strong>a). An explanation for <strong>the</strong> difference<br />
could be that logs are be<strong>in</strong>g re-exported by Hong Kong as <strong>in</strong> that same year <strong>the</strong> total exports to Hong<br />
Kong (based on <strong>the</strong> SGS Report) reached 53,000 m 3 .<br />
To <strong>in</strong>vestigate this possibility <strong>the</strong> Review Team checked <strong>the</strong> Hong Kong <strong>of</strong>ficial statistics. This check<br />
revealed that <strong>the</strong> volume registered <strong>in</strong> <strong>the</strong> <strong>of</strong>ficial Hong Kong statistics for logs imported from PNG was<br />
much smaller than that registered <strong>in</strong> <strong>the</strong> PNG export statistics. The <strong>of</strong>ficial Hong Kong statistics for 2000<br />
register only 25 m 3 <strong>of</strong> logs as imported from PNG. This discrepancy <strong>in</strong>dicates <strong>the</strong> possible use <strong>of</strong> Hong<br />
Kong as a port <strong>of</strong> reference by export<strong>in</strong>g companies, and that documents are later re-issued <strong>in</strong> Hong<br />
Kong for ano<strong>the</strong>r port and importer.<br />
The conclusion <strong>of</strong> this assessment is that <strong>the</strong> discrepancy <strong>in</strong> volume detected for Ch<strong>in</strong>a is probably<br />
largely due to failures <strong>in</strong> <strong>the</strong> import statistics, but it is also likely that export<strong>in</strong>g documents from PNG are<br />
re-issued <strong>in</strong> Hong Kong. This would not be prima facie evidence <strong>of</strong> transfer pric<strong>in</strong>g based on volume<br />
manipulation, but it would be a feasible method <strong>of</strong> transfer pric<strong>in</strong>g. In this form, <strong>the</strong> transfer pric<strong>in</strong>g starts<br />
by under <strong>in</strong>voic<strong>in</strong>g at <strong>the</strong> orig<strong>in</strong>, but <strong>the</strong> potential ga<strong>in</strong> is quite small. Hong Kong statistics were checked<br />
<strong>in</strong> more detail. Information on <strong>in</strong>ternational trade <strong>of</strong> logs <strong>in</strong> <strong>the</strong> Hong Kong statistics is only collected as<br />
two categories: “Tropical Wood <strong>of</strong> Specified Varieties” and “O<strong>the</strong>r Non Coniferous”.<br />
Log imports <strong>of</strong> <strong>the</strong>se categories are shown <strong>in</strong> Table 3.2. Most logs come from Malaysia and Gabon. As<br />
previously mentioned <strong>the</strong> Hong Kong <strong>of</strong>ficial statistics report very small volumes imported from PNG,<br />
and <strong>the</strong> volumes reported have a large discrepancy when compared to those encountered <strong>in</strong> <strong>the</strong> PNG<br />
statistics.<br />
PAGE 42
2001 FOREST REVENUE REVIEW<br />
Practically all logs imported by Hong Kong are re-exported. The Hong Kong <strong>of</strong>ficial statistics from<br />
January 1999 to June 2001 show that around 99% <strong>of</strong> imported logs are re-exported to Ch<strong>in</strong>a. The rest<br />
went basically to Macao and to Taiwan.<br />
Information on Hong Kong re-exports <strong>of</strong> logs is presented <strong>in</strong> Table 3.3. By compar<strong>in</strong>g <strong>the</strong> volumes reexported<br />
with those imported by Hong Kong (Table 3.2), and consider<strong>in</strong>g that practically no log<br />
consumption exists <strong>in</strong> Hong Kong, several <strong>in</strong>consistencies are observed <strong>in</strong> <strong>the</strong> statistics. For this reason<br />
<strong>the</strong> <strong>in</strong>formation cannot be used as a basis to identify possible evidence <strong>of</strong> transfer pric<strong>in</strong>g practices via<br />
volume.<br />
TABLE 3.2 HONG KONG LOG IMPORTS (M 3 )<br />
Log Type Source<br />
Year<br />
1999 2000 2001 *<br />
Malaysia<br />
192 819 269 909 70 370<br />
Tropical Wood <strong>of</strong> Specified Species Gabon<br />
39 430 33 700 17 707<br />
O<strong>the</strong>rs<br />
61 545 49 255 20 898<br />
Subtotal 293 794 352864 108 975<br />
Malaysia<br />
169 507 202 874 120 360<br />
O<strong>the</strong>r Non Coniferous<br />
Germany<br />
272 233 78 680 39 481<br />
O<strong>the</strong>r<br />
429 366 315 883 127 514<br />
Subtotal 871 106 597437 287 355<br />
TOTAL 1 164 900 950301 396 330<br />
* January – July<br />
Source: Hong Kong Trade Statistics<br />
TABLE 3.3 RE-EXPORTS OF LOGS BY HONG KONG (M 3 )<br />
Log Type Markets<br />
1999<br />
Year<br />
2000 2001 *<br />
Tropical Wood <strong>of</strong> Specified Species<br />
Ch<strong>in</strong>a<br />
O<strong>the</strong>rs<br />
288 124<br />
1 090<br />
417 512<br />
985<br />
51 643<br />
162<br />
Subtotal 289 214 418 497 51 805<br />
O<strong>the</strong>r Non Coniferous<br />
Ch<strong>in</strong>a<br />
O<strong>the</strong>rs<br />
525 033<br />
16 185<br />
447 961<br />
4 105<br />
328 457<br />
1 236<br />
Subtotal 541 218 452 066 329 693<br />
TOTAL 830 432 870 563 381 498<br />
* January – July<br />
Source: Hong Kong Trade Statistics<br />
3.2.3 Species and Grades<br />
All exports <strong>of</strong> logs from PNG are checked by SGS PNG Ltd. for species and grade. Their reports show<br />
some discrepancies, both <strong>in</strong> terms <strong>of</strong> species and grade, but <strong>the</strong>se cannot be considered significant. It has<br />
not proved possible for import statistics to be analysed and compared with PNG for this factor, ow<strong>in</strong>g to<br />
difficulties <strong>in</strong> match<strong>in</strong>g species and grades. (Taun and Calophyllum exported to Japan are a possible<br />
PAGE 43
2001 FOREST REVENUE REVIEW<br />
exception – next section). For this comparison, a detailed <strong>in</strong>vestigation last<strong>in</strong>g several months would be<br />
necessary.<br />
One possible way to reduce tax liability is to down-grade logs to a lower bracket. Dur<strong>in</strong>g <strong>the</strong> market<br />
decl<strong>in</strong>e it has been noticed that <strong>the</strong> quantity <strong>of</strong> lower grades be<strong>in</strong>g declared has <strong>in</strong>creased. This is not<br />
commercially logical, s<strong>in</strong>ce as prices decl<strong>in</strong>e <strong>the</strong> least-valued species should tend to be left <strong>in</strong> <strong>the</strong> <strong>forest</strong><br />
as <strong>the</strong>y will be <strong>the</strong> first to reach <strong>the</strong> po<strong>in</strong>t where <strong>the</strong> marg<strong>in</strong>al cost <strong>of</strong> harvest<strong>in</strong>g <strong>the</strong>m exceeds <strong>the</strong>ir<br />
marg<strong>in</strong>al <strong>revenue</strong> contribution.<br />
3.2.4 Pric<strong>in</strong>g Information<br />
Figure 3.3 shows three years <strong>of</strong> price data from <strong>the</strong> ITTO Market Information Service but only up to<br />
November 1999, as unfortunately after that date ITTO stopped report<strong>in</strong>g specific PNG log prices. So<br />
export fob price <strong>in</strong>formation used <strong>in</strong> <strong>the</strong> Review is based on <strong>the</strong> SGS reports. These prices are compared<br />
with import market figures. The sources are publications, country import<strong>in</strong>g statistics and <strong>in</strong>formation<br />
made available dur<strong>in</strong>g <strong>in</strong>terviews.<br />
FIGURE 3.3 FOB PRICES FOR PNG LOGS (1996-1999)<br />
USS/m³ FOB<br />
175<br />
150<br />
125<br />
100<br />
75<br />
50<br />
25<br />
0<br />
JAN/96<br />
MAR/96<br />
Source: MIS – ITTO<br />
MAY/96<br />
JUL/96<br />
SEP/96<br />
NOV/96<br />
JAN/97<br />
MAR/97<br />
CALOPHYLLUM<br />
(GROUP 1)<br />
MAY/97<br />
JUL/97<br />
SEP/97<br />
In <strong>the</strong> case <strong>of</strong> Japan, prices published <strong>in</strong> <strong>the</strong> Nikkan Mokuzai Shimbun (also Japan Lumber Journal and<br />
Report) are generally quoted <strong>in</strong> yen per koku for <strong>the</strong> cif pric<strong>in</strong>g po<strong>in</strong>t. A koku was orig<strong>in</strong>ally a measure <strong>of</strong><br />
volume for rice, be<strong>in</strong>g <strong>the</strong>oretically <strong>the</strong> amount required to feed one person for one year (about 180<br />
litres), and belongs to a decimal measurement <strong>system</strong> adopted from Ch<strong>in</strong>a <strong>in</strong> <strong>the</strong> seventh century, and<br />
used for a millennium to assess land productivity, levy taxes, and pay stipends to <strong>the</strong> non-work<strong>in</strong>g<br />
warrior (samurai) class. However, when Toyetomi Hideyoshi united <strong>the</strong> country <strong>in</strong> <strong>the</strong> late sixteenth<br />
century, he nearly doubled <strong>the</strong> traditional size <strong>of</strong> <strong>the</strong> unit, although <strong>the</strong> traditional size was still used when<br />
all units were standardised <strong>in</strong> 1891. It is true that <strong>the</strong> unit could vary by type <strong>of</strong> article be<strong>in</strong>g measured,<br />
and by region, but Japan <strong>of</strong>ficially metricated all measurements <strong>in</strong> 1959, and <strong>the</strong>re is no reason now to<br />
imply that <strong>the</strong> koku is a unit <strong>of</strong> vary<strong>in</strong>g size for measur<strong>in</strong>g timber. It is accepted as 0.278 m 3 when<br />
compared to <strong>the</strong> Brereton scale.<br />
NOV/97<br />
JAN/98<br />
TERMINALIA<br />
(GROUP 2)<br />
MAR/98<br />
MAY/98<br />
JUL/98<br />
SEP/98<br />
NOV/98<br />
JAN/99<br />
MAR/99<br />
OTHER MIXED<br />
(GROUP 4)<br />
MAY/99<br />
JUL/99<br />
SEP/99<br />
NOV/99<br />
PAGE 44
2001 FOREST REVENUE REVIEW<br />
The term “nan’yō” (South Seas) is used <strong>in</strong> practically all Japanese publications to provide <strong>in</strong>formation on<br />
average prices for tropical logs from South East Asia and <strong>the</strong> Pacific with no specific reference to Papua<br />
New Gu<strong>in</strong>ea. However <strong>in</strong> <strong>the</strong> case <strong>of</strong> Taun and Calophyllum, two species exported by both Papua New<br />
Gu<strong>in</strong>ea and <strong>the</strong> Solomon Islands, direct reference is made. Log quality from <strong>the</strong> latter source is<br />
considered somewhat higher, but market prices should not differ greatly between <strong>the</strong>se two sources. The<br />
Japanese statistics also provides price <strong>in</strong>formation on mixed light hardwoods (MLH) imported from <strong>the</strong><br />
South Seas. These are basically all o<strong>the</strong>r tropical hardwoods species imported <strong>in</strong>to Japan for veneer/<br />
plywood production. In <strong>the</strong> case <strong>of</strong> logs imported from PNG it probably <strong>in</strong>cludes species outside <strong>of</strong><br />
Group 1 (i.e. lower priced species).<br />
Information on cif South Seas log prices from early 1997 to mid 2001 published <strong>in</strong> <strong>the</strong> Japan Lumber<br />
Report is presented <strong>in</strong> Figure 3.4. The <strong>in</strong>formation provided shows that cif prices per cubic metre for<br />
Taun/Calophyllum log types are on average around US$35.00 (rang<strong>in</strong>g mostly from US$31.00 to<br />
US$39.00) higher than for MLH.<br />
The differences between cif prices for higher grade (Taun/Calophyllum) and <strong>the</strong> MLH group reported <strong>in</strong><br />
Japan were compared with differences reported for <strong>the</strong> PNG fob export prices. The comparison <strong>in</strong>dicated<br />
that <strong>the</strong> differences between <strong>the</strong> two groups (first grades and MLH) are basically <strong>in</strong> <strong>the</strong> same range.<br />
FIGURE 3.4 CIF PRICES FOR LOGS IMPORTED INTO JAPAN FROM SOUTH SEAS<br />
US$ / m³<br />
250<br />
200<br />
150<br />
100<br />
50<br />
0<br />
Source: Japan Lumber Journal<br />
1997 - 2<br />
1997 - 4<br />
1997 - 6<br />
1997 - 8<br />
1997 - 10<br />
1997 - 12<br />
1998 - 2<br />
1998 - 4<br />
1998 - 6<br />
1998 - 8<br />
1998 - 10<br />
1998 - 12<br />
1999 - 2<br />
1999 - 4<br />
1999 - 6<br />
1999 - 8<br />
1999 - 10<br />
1999 - 12<br />
2000 - 2<br />
2000 - 4<br />
2000 - 6<br />
2000 - 8<br />
2000 - 10<br />
2000 - 12<br />
2001 - 2<br />
2001 - 4<br />
2001 - 6<br />
2001 - 8<br />
Years - Months<br />
Taun / Calo Mixed (Light<br />
Hardwood)<br />
Figure 3.5 presents a comparison between <strong>the</strong> cif prices <strong>in</strong> Japan and PNG fob prices for Taun and<br />
Calophyllum logs. Taun and Calophyllum were chosen for study as <strong>the</strong>se species are very representative<br />
<strong>of</strong> PNG exports (around 30% <strong>of</strong> total exports <strong>in</strong> 2000) and also because <strong>the</strong> Japanese statistics report<br />
specific price <strong>in</strong>formation for <strong>the</strong>m. The period analysed covers early 1999 to mid-2001. The cif prices<br />
are based on <strong>the</strong> Japan Lumber Report and <strong>the</strong> fob prices are based on SGS reports. The general trend<br />
reflects <strong>the</strong> Asian crisis period, with prices decl<strong>in</strong><strong>in</strong>g by around 50%, and a price recovery <strong>in</strong> 1999. As<br />
can be observed <strong>the</strong> differences between cif and fob prices varied greatly along <strong>the</strong> period, and this was<br />
to be expected when prices were fall<strong>in</strong>g significantly.<br />
PAGE 45
FIGURE 3.5 JAPAN CIF AND PNG FOB PRICES FOR TAUN AND CALOPHYLLUM LOGS<br />
US$ / m³<br />
250<br />
200<br />
150<br />
100<br />
50<br />
0<br />
Sources: SGS PNG Pty Ltd; Log Export Monitor<strong>in</strong>g: Monthly Report (1997-2000) - FOB;<br />
Japan Lumber Report & Nanyozai Freight Agreement- CIF<br />
2001 FOREST REVENUE REVIEW<br />
1997 - 2<br />
1997 - 4<br />
1997 - 6<br />
1997 - 8<br />
1997 - 10<br />
1997 - 12<br />
1998 - 2<br />
1998 - 4<br />
1998 - 6<br />
1998 - 8<br />
1998 - 10<br />
1998 - 12<br />
1999 - 2<br />
1999 - 4<br />
1999 - 6<br />
1999 - 8<br />
1999 - 10<br />
1999 - 12<br />
2000 - 2<br />
2000 - 4<br />
2000 - 6<br />
2000 - 8<br />
2000 - 10<br />
2000 - 12<br />
2001 - 2<br />
2001 - 4<br />
2001 - 6<br />
2001 - 8<br />
YEARS - MONTHS<br />
CIF - JAPAN FOB - AVERAGE<br />
The fluctuations <strong>of</strong> <strong>the</strong> differences between cif and fob prices reported are presented <strong>in</strong> Figure 3.6.<br />
Dur<strong>in</strong>g <strong>the</strong> high price period (before <strong>the</strong> Asian crisis) <strong>the</strong> difference between fob and cif prices was <strong>in</strong> <strong>the</strong><br />
range <strong>of</strong> US$80.00 per cubic metre. At <strong>the</strong> lowest price level (<strong>in</strong> <strong>the</strong> last months <strong>of</strong> 1998) <strong>the</strong> difference<br />
was much smaller: around US$40.00 per cubic metre. With <strong>the</strong> recovery <strong>in</strong> price (dur<strong>in</strong>g <strong>the</strong> second<br />
quarter <strong>of</strong> 1999) <strong>the</strong> difference between cif and fob returned to pre-Asian crisis level <strong>of</strong> around US$80.00<br />
per cubic metre.<br />
PAGE 46
2001 FOREST REVENUE REVIEW<br />
FIGURE 3.6 DIFFERENCES BETWEEN CIF JAPAN AND FOB PNG PRICES FOR TAUN/CALOPHYLLUM LOGS<br />
US$/m3<br />
100<br />
90<br />
80<br />
70<br />
60<br />
50<br />
40<br />
30<br />
20<br />
10<br />
0<br />
Feb-97<br />
May-97<br />
Aug-97<br />
Nov-97<br />
Feb-98<br />
May-98<br />
Source: Japan Lumber Report & Nanyozai Freight Agreement<br />
Aug-98<br />
Nov-98<br />
Feb-99<br />
May-99<br />
Aug-99<br />
Nov-99<br />
Feb-00<br />
The <strong>in</strong>ternationally adopted def<strong>in</strong>ition <strong>of</strong> fob price is expected to <strong>in</strong>clude <strong>the</strong> log price (set by <strong>the</strong> exporter<br />
based on production/operation costs and pr<strong>of</strong>it marg<strong>in</strong>s) and <strong>the</strong> follow<strong>in</strong>g costs:<br />
Costs <strong>of</strong> transportation to <strong>the</strong> port and load<strong>in</strong>g costs to <strong>the</strong> “free on board” po<strong>in</strong>t;<br />
Sales costs, commissions and taxes;<br />
Port charges, which <strong>in</strong> PNG cover: navigational aids, port dues, <strong>in</strong>/out pilotage, launch hire, customs<br />
overtime, health quarant<strong>in</strong>e overtime, freight taxes, and duty on bunkers;<br />
Agency fees: agency fee, pr<strong>in</strong>t<strong>in</strong>g/stationery, postage/courier, phone/ fax and vehicle hire.<br />
The cif price is based on <strong>the</strong> fob price plus freight to dest<strong>in</strong>ation and <strong>in</strong>surance. In some cases <strong>the</strong> cif<br />
prices are expanded to <strong>the</strong> so-called “cif landed” price. The cif landed price <strong>in</strong>cludes all <strong>the</strong> costs from<br />
<strong>the</strong> vessel to a f<strong>in</strong>al dest<strong>in</strong>ation <strong>in</strong> <strong>the</strong> port at <strong>the</strong> so-called “place <strong>of</strong> rest”. In this case <strong>the</strong> costs to be<br />
added are: port costs at f<strong>in</strong>al dest<strong>in</strong>ation, term<strong>in</strong>al costs and some <strong>in</strong>land freight. This can create some<br />
confusion <strong>in</strong> <strong>the</strong> use <strong>of</strong> <strong>the</strong> cif price <strong>in</strong>formation. Some ports, as for example <strong>in</strong> <strong>the</strong> USA, most <strong>of</strong> <strong>the</strong> cif<br />
prices reported <strong>in</strong>clude part <strong>of</strong> <strong>the</strong> f<strong>in</strong>al port dest<strong>in</strong>ation costs (such as term<strong>in</strong>al costs). In <strong>the</strong> case <strong>of</strong><br />
Japan this is not clear, but it may be assumed that at least part <strong>of</strong> f<strong>in</strong>al dest<strong>in</strong>ation costs are <strong>in</strong>cluded <strong>in</strong><br />
<strong>the</strong> cif prices reported.<br />
3.2.5 Freight & Insurance<br />
The evolution <strong>of</strong> log freight costs is presented <strong>in</strong> Figure 3.7. The data is based on <strong>the</strong> Japan Lumber<br />
Journal and <strong>the</strong> Nanyozai (South Seas Timber) Freight Agreement, and <strong>in</strong>cludes freight costs for logs<br />
shipped from Malaysia (Sarawak) and for logs shipped from o<strong>the</strong>r regional dest<strong>in</strong>ations <strong>in</strong>clud<strong>in</strong>g Papua<br />
New Gu<strong>in</strong>ea. As can be observed freight rates were also affected by <strong>the</strong> Asian crisis. The freight costs<br />
dropped <strong>in</strong> 1998, and started to recover <strong>in</strong> 1999. For South Seas log freight costs it was only possible to<br />
collect <strong>in</strong>formation for <strong>the</strong> last 2-3 years, but <strong>the</strong> same trend would be expected.<br />
May-00<br />
Aug-00<br />
Nov-00<br />
Feb-01<br />
May-01<br />
Aug-01<br />
PAGE 47
FIGURE 3.7 EVOLUTION OF LOG FREIGHT COSTS TO JAPAN (ANNUAL AVERAGE)<br />
US$/m3<br />
40<br />
35<br />
30<br />
25<br />
20<br />
15<br />
10<br />
5<br />
0<br />
1991 1992 1993 1994 1995 1996 1997 1998 1999 2000 2001<br />
SARAWAK JAPAN SOUTH SEAS-JAPAN<br />
Source: Japan Lumber Report & Nanyozai Freight Agreement<br />
2001 FOREST REVENUE REVIEW<br />
PAGE 48
2001 FOREST REVENUE REVIEW<br />
The higher freight costs for non-Sarawak South Seas logs are expla<strong>in</strong>ed, accord<strong>in</strong>g to <strong>the</strong> Nanyozai<br />
Freight Agreement, by several reasons <strong>in</strong>clud<strong>in</strong>g larger shipp<strong>in</strong>g distance, smaller vessels and dispersed<br />
load<strong>in</strong>g po<strong>in</strong>ts with small volumes. As <strong>the</strong> difference is very large <strong>the</strong> existence <strong>of</strong> more competition<br />
from chartered hulls (ship-owners not part <strong>of</strong> <strong>the</strong> l<strong>in</strong>er cartel) <strong>in</strong> <strong>the</strong> case <strong>of</strong> Sarawak, may be responsible.<br />
3.2.6 Taun & Calophyllum Example<br />
Table 3.4 presents <strong>the</strong> average fob (PNG data based on SGS reports) and cif prices <strong>in</strong> Japan (based on<br />
Japan Lumber Report) for <strong>the</strong> period January to July 2001. In <strong>the</strong> preparation <strong>of</strong> this table freight costs<br />
were based on <strong>the</strong> Nanyozai Freight Agreement and a flat rate <strong>of</strong> 3% over <strong>the</strong> fob log price was used to<br />
estimate <strong>the</strong> <strong>in</strong>surance costs.<br />
TABLE 3.4 PRICES AND COSTS FOR TAUN AND CALOPHYLLUM LOGS EXPORTED FROM PNG TO JAPAN<br />
(AVERAGE JAN-JULY 2001)<br />
Price at US$ / m 3<br />
fob PNG (SGS)<br />
81.50<br />
cif JAPAN (JLR)<br />
157.00<br />
cif – fob<br />
75.50<br />
Freight Costs (NFA)<br />
35.00<br />
Insurance<br />
2.45<br />
Difference 38.05<br />
Fur<strong>the</strong>r <strong>in</strong>vestigations are obviously needed to exam<strong>in</strong>e <strong>the</strong> possible reasons for <strong>the</strong> difference:<br />
Fob and/or cif prices used as bases for this study are not correct;<br />
Freight and <strong>in</strong>surance costs have been underestimated;<br />
There are o<strong>the</strong>r costs <strong>in</strong> <strong>the</strong> cha<strong>in</strong> that have not been considered;<br />
There are o<strong>the</strong>r factors that need to be taken <strong>in</strong>to account.<br />
A discussion on each possible reason for <strong>the</strong> difference identified follows.<br />
Fob price <strong>in</strong>formation was obta<strong>in</strong>ed from SGS reports, and is actually based on export documents.<br />
Accord<strong>in</strong>g to <strong>the</strong> PNG Procedures for Export<strong>in</strong>g Logs, <strong>the</strong>re is a price approval mechanism <strong>in</strong> place (see<br />
section 3.1). It is very unlikely that this source <strong>of</strong> <strong>in</strong>formation would be a significant source <strong>of</strong> error.<br />
Fur<strong>the</strong>r <strong>in</strong>vestigation has <strong>in</strong>dicated that <strong>the</strong> only possible source <strong>of</strong> error could be related to differences <strong>in</strong><br />
log grade, with<strong>in</strong> a certa<strong>in</strong> Group.<br />
Japan is known for be<strong>in</strong>g more selective when import<strong>in</strong>g goods, and this general rule also applies for<br />
logs. Contacts made by <strong>the</strong> Review Team with Japanese importers have re-affirmed this fact. If that is <strong>the</strong><br />
case, <strong>the</strong> average prices reported <strong>in</strong> Table 3.4 may not apply for Japan, as Japanese importers would be<br />
pay<strong>in</strong>g more for higher quality logs. A more detailed <strong>in</strong>vestigation has shown that this is not <strong>the</strong> case.<br />
The follow<strong>in</strong>g pieces <strong>of</strong> evidence support <strong>the</strong> conclusion that Japanese importers are not pay<strong>in</strong>g a<br />
premium for possibly higher quality requirements for PNG logs than o<strong>the</strong>r importers.<br />
PAGE 49
Observation 1:<br />
2001 FOREST REVENUE REVIEW<br />
Table 3.5 shows <strong>the</strong> average fob price for PNG Grade 1 and for <strong>the</strong> total volume <strong>of</strong> logs exported to<br />
several markets from 1997 to 2000. As can be observed fob prices for Grade 1 logs exported to Japan, or<br />
even average prices for <strong>the</strong> total volume exported to Japan, are very close to <strong>the</strong> average price for all<br />
PNG log exports.<br />
TABLE 3.5 VOLUME AND AVERAGE FOB PRICE BY MARKET<br />
Market<br />
2000 1999 1998 1997<br />
GR. 1 Total GR. 1 Total GR. 1 Total GR. 1 Total<br />
Japan<br />
Vol. 1.000 m³<br />
US$/m³ 83<br />
745,6<br />
76 92<br />
988,7<br />
80 77<br />
897,9<br />
68 98<br />
1.960,2<br />
120<br />
Korea<br />
Vol. 1.000 m³<br />
US$/m³ 74<br />
323,1<br />
67 78<br />
416,7<br />
69 65<br />
281,1<br />
56 83<br />
421,2<br />
107<br />
Ch<strong>in</strong>a<br />
Vol. 1.000 m³<br />
US$/m³ 87<br />
687,8<br />
71 99<br />
328,9<br />
78 81<br />
157,9<br />
63 106<br />
104,4<br />
115<br />
Vol. 1.000 m³<br />
Philipp<strong>in</strong>es<br />
US$/m³ 73<br />
96,2<br />
61 77<br />
136,2<br />
64 66<br />
147,0<br />
51 88<br />
196,0<br />
88<br />
Vol. 1.000 m³<br />
Hong Kong<br />
US$/m³ 91<br />
53,2<br />
84 103<br />
34,2<br />
92 117<br />
39,2<br />
131 90<br />
129,4<br />
161<br />
Taiwan<br />
Vol. 1.000 m³<br />
US$/m³ 68<br />
47,9<br />
58 81<br />
41,0<br />
58 --<br />
24,4<br />
51 90<br />
88,4<br />
81<br />
O<strong>the</strong>rs<br />
Vol. 1.000 m³<br />
US$/m³ 73<br />
38,8<br />
86 --<br />
38,1<br />
102 63<br />
69,1<br />
93 167<br />
106,5<br />
134<br />
Total<br />
Observation 2:<br />
Vol. 1.000 m³ 1.992,5 1.983,9 1.616,6 3.006,2<br />
US$/m³ 83 72 91 77 78 66 98 117<br />
The SGS reports also make available <strong>in</strong>formation on volumes and values exported by company. Some<br />
companies operat<strong>in</strong>g <strong>in</strong> PNG have connections with trad<strong>in</strong>g companies <strong>in</strong> Japan, or even if that is not <strong>the</strong><br />
case export mostly to Japan. The analysis showed that <strong>the</strong>se companies have not paid a higher price for<br />
<strong>the</strong> logs. This corroborates <strong>the</strong> previous comment that Japan is <strong>in</strong> fact not pay<strong>in</strong>g a premium for <strong>the</strong> logs,<br />
or at least not to <strong>the</strong> extent that it could be <strong>the</strong> source <strong>of</strong> significant errors <strong>in</strong> <strong>the</strong> fob prices.<br />
The Review Team also <strong>in</strong>vestigated <strong>in</strong> more detail possible distortions or errors <strong>in</strong> <strong>the</strong> cif price<br />
<strong>in</strong>formation. Table 3.6 provides <strong>in</strong>formation on average cif tropical log prices imported from PNG based<br />
on <strong>the</strong> Customs Clearance and also <strong>the</strong> deviation <strong>in</strong> percentage from <strong>the</strong> Taun/Calophyllum cif prices<br />
reported.<br />
PAGE 50
TABLE 3.6 AVERAGE LOG CIF PRICE IN JAPAN (CUSTOM CLEARANCE)<br />
Year<br />
1998<br />
1999<br />
2000<br />
2001 FOREST REVENUE REVIEW<br />
Total Average CIF Japan<br />
Volume (m 3 ) Value (1,000 US$) US$ / m 3<br />
860 604<br />
942 943<br />
718 817<br />
96.516<br />
122.375<br />
94.395<br />
% - Difference from <strong>the</strong> Taun/Calophyllum cif Prices Reported<br />
112.15<br />
129.77<br />
131.31<br />
The <strong>in</strong>formation presented <strong>in</strong> Table 3.6 does not allow any conclusion to be made <strong>in</strong> <strong>the</strong> absence <strong>of</strong><br />
grade/species composition data. In any case it seems that <strong>the</strong> difference between <strong>the</strong> cif prices for Taun/<br />
Calophyllum logs (superior grade) and <strong>the</strong> cif average price for all logs imported from PNG is <strong>of</strong> a<br />
similar size to <strong>the</strong> same relationship applied to <strong>the</strong> fob price. Tak<strong>in</strong>g as an example <strong>the</strong> year 2000 average<br />
fob price data for Taun and Calophylum, <strong>the</strong> overall mean price difference is around 30%.<br />
Three aspects need to be considered at this stage:<br />
Freight cost is constant regardless <strong>of</strong> <strong>the</strong> log grade, and as a result <strong>the</strong> calculated difference between<br />
<strong>the</strong> price for <strong>the</strong> higher grade logs and that for <strong>the</strong> average should be smaller, at most around 20%;<br />
The Japanese market does not pay a premium, but buys mostly higher quality grades. Under this<br />
condition <strong>the</strong> difference detected also should be smaller, as <strong>the</strong> average price reported for all species<br />
was not weighted by volume.<br />
Japan is not pay<strong>in</strong>g a premium for PNG logs, but Taun and Calophyllum is also imported from<br />
Solomon Islands, and logs <strong>of</strong> this orig<strong>in</strong> are regarded as <strong>of</strong> superior quality. There is some evidence<br />
that <strong>in</strong> this case a premium exists (see section 3.2.7).<br />
Ano<strong>the</strong>r approach was to consider <strong>the</strong> <strong>in</strong>formation on log wholesale prices <strong>in</strong> Japan (Table 3.7). The data<br />
presented is based on prices paid <strong>in</strong> September, 2001, <strong>in</strong> Nagoya, for Calophyllum and mixed species<br />
logs.<br />
TABLE 3.7 WHOLESALE PRICES OF LOGS – NAGOYA, JAPAN<br />
Groups Aug/01 Sep/01<br />
Calophyllum 169 169<br />
Mixed species 147 147<br />
Source: Nikkan Mokuzai Shimbun (06/09/01)<br />
The wholesale prices (loaded on truck) for Calophyllum logs <strong>in</strong> Japan <strong>in</strong> August and September reached<br />
US$169.00/ m3. This is 8% above <strong>the</strong> cif prices reported for Japan, a relatively low marg<strong>in</strong> consider<strong>in</strong>g<br />
all costs <strong>in</strong>volved (port charges, handl<strong>in</strong>g costs, taxes, adm<strong>in</strong>istration <strong>of</strong> <strong>the</strong> operation, etc.) and pr<strong>of</strong>it<br />
marg<strong>in</strong>s.<br />
This re-affirms <strong>the</strong> follow<strong>in</strong>g facts:<br />
A part <strong>of</strong> <strong>the</strong> local costs is <strong>in</strong> fact registered <strong>in</strong>side <strong>the</strong> cif prices for logs imported <strong>in</strong>to Japan, and<br />
prices reported are “cif landed”. It is estimated that <strong>the</strong> addition <strong>of</strong> such <strong>in</strong>ternal costs could make<br />
<strong>the</strong> “cif landed” cost up to 10% greater than <strong>the</strong> true cif price.<br />
%<br />
-19<br />
-29<br />
-32<br />
PAGE 51
2001 FOREST REVENUE REVIEW<br />
Higher quality logs from o<strong>the</strong>r sources <strong>in</strong>flate average prices. Imports <strong>of</strong> higher quality Taun and<br />
Calophyllum logs <strong>the</strong> Solomon Islands could have an impact on average cif prices reported.<br />
Evidence <strong>of</strong> higher priced logs from <strong>the</strong> Solomon Islands is presented <strong>in</strong> Item 3.2.7 (Korea prices).<br />
In any case aga<strong>in</strong> is not easy to quantify <strong>the</strong> impact <strong>of</strong> higher grade logs <strong>in</strong> <strong>the</strong> average price, as <strong>the</strong><br />
proportions are unknown. In any case even assum<strong>in</strong>g that 30% <strong>of</strong> <strong>the</strong> logs would be Solomon<br />
Islands “regular grade” logs, <strong>the</strong> impact on <strong>the</strong> average price would be less than 10%.<br />
The Review Team also <strong>in</strong>vestigated <strong>the</strong> possibility <strong>of</strong> hav<strong>in</strong>g under-estimated <strong>the</strong> freight and <strong>in</strong>surance<br />
costs. The freight costs used <strong>in</strong> this study was based on Nanyozai Freight Agreement and based on this<br />
fact it is very unlikely <strong>the</strong> freight costs have been underestimated. On <strong>the</strong> contrary, <strong>the</strong> freight price<br />
<strong>in</strong>formation obta<strong>in</strong>ed from <strong>the</strong> Agreement is considered to be too high and some exporters might be us<strong>in</strong>g<br />
charter vessels outside <strong>the</strong> Agreement.<br />
Some exporters and importers have mentioned that <strong>in</strong> PNG, due to difficulties <strong>in</strong> operations, payment <strong>of</strong><br />
“demurrage” to port authorities is common. Depend<strong>in</strong>g on <strong>the</strong> delay and on <strong>the</strong> demurrage charges, this<br />
could <strong>in</strong>crease freight costs substantially. Even so, importers would accept hav<strong>in</strong>g to pay for higher<br />
freight, so this would not be reflected <strong>in</strong> cif prices. The percentage used for <strong>in</strong>surance costs (3%) <strong>in</strong> this<br />
report seems to be appropriate. The total impact <strong>of</strong> <strong>in</strong>surance on <strong>the</strong> cif price is very small.<br />
Some importers have mentioned that cif prices <strong>in</strong>clude a f<strong>in</strong>ancial cost. The po<strong>in</strong>t made is that exporters<br />
are normally paid aga<strong>in</strong>st documents (a few days after load<strong>in</strong>g) while trad<strong>in</strong>g companies <strong>in</strong> Japan sell<br />
logs <strong>in</strong> <strong>the</strong> domestic market for payments on 180-day or even 270-day terms. This requires large work<strong>in</strong>g<br />
capital. There is no doubt that <strong>the</strong> amount <strong>in</strong>volved is significant (probably over US$ 50 million), but at<br />
<strong>the</strong> present low <strong>in</strong>terest rate <strong>in</strong> Japan <strong>the</strong> impact on costs is very small. Fur<strong>the</strong>rmore is unlikely that cif<br />
reported prices are affected by <strong>the</strong> <strong>in</strong>terest rate. The impact is only expected to be over <strong>the</strong> wholesale or<br />
f<strong>in</strong>al client price.<br />
3.2.7 Ch<strong>in</strong>a, Hong Kong, & Korea<br />
Both <strong>the</strong> quantity and quality <strong>of</strong> Ch<strong>in</strong>ese <strong>in</strong>formation is poor. Several sources <strong>of</strong> <strong>in</strong>formation were<br />
consulted, but most proved too <strong>in</strong>consistent to use. Table 3.8 does present an amalgam <strong>of</strong> some data,<br />
however. It does not cover specifically <strong>the</strong> logs imported from PNG, but gives a relatively good<br />
<strong>in</strong>dication <strong>of</strong> market prices. Several sources <strong>of</strong> <strong>in</strong>formation were used, <strong>in</strong>clud<strong>in</strong>g <strong>the</strong> Ch<strong>in</strong>a Statistics<br />
Yearbook 2000, Ch<strong>in</strong>a Products Market Information- an ITTO/Ch<strong>in</strong>a Academy <strong>of</strong> <strong>Forest</strong>ry (CAF)<br />
publication, and data from <strong>the</strong> Census and Statistics Department <strong>of</strong> Hong Kong.<br />
TABLE 3.8 CIF LOG PRICE INFORMATION – CHINA AND HONG KONG<br />
Products<br />
Year<br />
1998 1999 2000 2001<br />
Ch<strong>in</strong>a - All Tropical Logs * 124 122 -- --<br />
Ch<strong>in</strong>a – Lauan/Keru<strong>in</strong>g** -- -- -- 160 – 178<br />
Hong Kong – Mixed Species *** -- 99 – 101 101 – 103 99 – 104<br />
* Average price – Source: Ch<strong>in</strong>a Statistic Yearbook (2000)<br />
** Guangzhou Prov<strong>in</strong>ce – Source: Ch<strong>in</strong>a <strong>Forest</strong> Products Market Information – ITTO/CAF<br />
*** Malaysian Supply – Source: Census and Statistics Department / Hong Kong Trade Statistics<br />
The average prices reported <strong>in</strong> <strong>the</strong> Ch<strong>in</strong>a Statistics Yearbook for all tropical logs for 1999 are <strong>in</strong> l<strong>in</strong>e with<br />
prices reported by Japanese sources previously presented. This is not <strong>the</strong> case for <strong>the</strong> 1998 prices that are<br />
higher than expected, as <strong>in</strong> that year <strong>in</strong>ternational prices <strong>of</strong> logs were depressed by <strong>the</strong> Asian crisis. The<br />
PAGE 52
2001 FOREST REVENUE REVIEW<br />
price <strong>in</strong>formation for Lauan and Keru<strong>in</strong>g logs reported <strong>in</strong> <strong>the</strong> ITTO/CAF bullet<strong>in</strong> for Guangzhou<br />
Prov<strong>in</strong>ce is <strong>in</strong> <strong>the</strong> same price range as those reported by <strong>the</strong> Japanese sources.<br />
The largest distortion found is <strong>in</strong> <strong>the</strong> price <strong>in</strong>formation for Hong Kong. The average log cif prices for all<br />
species imported from Malaysia, <strong>in</strong>clud<strong>in</strong>g those classified by <strong>the</strong> Hong Kong Census and Statistics<br />
Department as Tropical Logs <strong>of</strong> Specified Species (code 24751) and logs classified as O<strong>the</strong>r Non-<br />
Coniferous (code 24752), are much lower than those reported <strong>in</strong> Japan and o<strong>the</strong>r markets. As previously<br />
discussed Hong Kong is not a log consumer and most <strong>of</strong> <strong>the</strong> logs are re-exported to Ch<strong>in</strong>a. Based on <strong>the</strong><br />
data collected dur<strong>in</strong>g <strong>the</strong> <strong>in</strong>terviews with persons <strong>in</strong>volved <strong>in</strong> <strong>the</strong> trade and timber <strong>in</strong>dustry <strong>in</strong> Hong Kong<br />
and Ch<strong>in</strong>a, <strong>the</strong> difference between <strong>the</strong> import price and export price <strong>of</strong> logs is estimated to be between<br />
US$30.00 and US$40.00 per cubic metre. This covers costs and pr<strong>of</strong>it <strong>of</strong> <strong>the</strong> trad<strong>in</strong>g company.<br />
Korea is <strong>the</strong> third largest market for PNG logs, but due to time constra<strong>in</strong>ts this market was not visited by<br />
<strong>the</strong> Review Team. Cif log price <strong>in</strong>formation for Korea, based on ITTO MIS reports, is presented <strong>in</strong><br />
Figure 3.8. Korea also imports large volumes <strong>of</strong> logs from <strong>the</strong> Solomon Islands, where <strong>the</strong>re are Korean<br />
companies operat<strong>in</strong>g. Log grad<strong>in</strong>g <strong>in</strong> Korea is slightly different from o<strong>the</strong>r markets. Logs graded as<br />
“regular” are mostly from <strong>the</strong> Solomon Islands. The Group 1 PNG logs would probably fall mostly <strong>in</strong> <strong>the</strong><br />
category named “second”. As can be observed from <strong>the</strong> data presented <strong>in</strong> Figure 3.8 <strong>the</strong> higher quality <strong>of</strong><br />
<strong>the</strong> “regular grade” logs is reflected <strong>in</strong> higher prices. Based on <strong>the</strong> 1999 data cif prices for regular grade<br />
logs imported by Korea were around 30% higher than <strong>the</strong> cif prices for <strong>the</strong> same species imported <strong>in</strong>to<br />
Japan. The cif prices <strong>in</strong> Japan for that year were similar to those reported by Korea for “second” grade.<br />
The premium paid for regular logs dropped to 18% <strong>in</strong> 2000 and to only 7% <strong>in</strong> 2001. The reasons for such<br />
a change are not clear. Among <strong>the</strong> possible explanations are:<br />
The price <strong>in</strong>formation is not reliable;<br />
Log grad<strong>in</strong>g has changed over <strong>the</strong> period;<br />
The prices have been manipulated.<br />
The last is <strong>the</strong> most likely. This would be a result <strong>of</strong> recent <strong>in</strong>vestigations <strong>in</strong> <strong>the</strong> Solomon Islands that<br />
identified evidence <strong>of</strong> under-<strong>in</strong>voic<strong>in</strong>g. The level <strong>of</strong> under-<strong>in</strong>voic<strong>in</strong>g revealed was <strong>of</strong> <strong>the</strong> order <strong>of</strong> 25 to<br />
30% <strong>of</strong> <strong>the</strong> declared fob value (Price Waterhouse, 2000). Based on <strong>the</strong>se facts, and bear<strong>in</strong>g <strong>in</strong> m<strong>in</strong>d no<br />
field visit was undertaken <strong>in</strong> Korea, no general assessment is made <strong>of</strong> prices <strong>in</strong> this market.<br />
However, cif log prices reported for Korea do serve as a basis to analyse <strong>the</strong> reasons for <strong>the</strong> discrepancies<br />
detected <strong>in</strong> Japan.<br />
FIGURE 3.8 CIF PRICES FOR TROPICAL LOGS IMPORTED BY KOREA<br />
250<br />
200<br />
150<br />
100<br />
50<br />
0<br />
CALO / TAUN REG. CALO / TAUN 2ND.<br />
MIXED (LOW GRADE)<br />
PAGE 53
PART 4 FINANCIAL MODELLING<br />
4.1 LOG PRODUCTION COSTS<br />
2001 FOREST REVENUE REVIEW<br />
The log production costs have been updated as part <strong>of</strong> <strong>the</strong> Review. The result<strong>in</strong>g averaged costs are<br />
shown <strong>in</strong> Table 4.1 below. In this table <strong>the</strong> costs have been compared with <strong>the</strong> FORTECH 1997<br />
costs.<br />
TABLE 4.1 SUMMARY OF AVERAGE LOGGING COSTS BY COST CATEGORIES<br />
FORTECH Analysis 1997<br />
2001 Review<br />
Cost Category<br />
Actual costs by Scenarios<br />
Manus Gulf N. Brita<strong>in</strong> Morobe Sandaun Average<br />
Current 1/<br />
K<strong>in</strong>a<br />
US$/m3<br />
Equivalent<br />
US$/m3 K/m3<br />
Wages 3/ 3.78 3.76 4.72 3.74 4.99 4.20 4 15<br />
Fuel & Oil 3/ 4.66 5.28 10.06 7.92 11.08 7.80 8 28<br />
Repairs & ma<strong>in</strong>tenance 3/ 4.52 5.34 10.57 7.82 11.23 7.90 8 28<br />
Operational overheads 4/ 3.48 4.51 5.54 4.84 5.57 4.79 4 13<br />
Stevedor<strong>in</strong>g & port charges 4/ 6.00 15.00 6.00 6.00 3.00 7.20 6 21<br />
Sub-total 22.44 33.89 36.89 30.32 35.87 31.88 29 105<br />
Depreciation 2/ 7.56 10.26 12.12 14.00 11.71 11.13 12 43<br />
Head <strong>of</strong>fice overheads 4/ 13.33 12.22 17.33 13.33 18.86 15.01 10 36<br />
Sub-total 43.33 56.37 66.34 57.65 66.44 58.03 51 184<br />
Allowance for 15% return over 7 years (FORTECH discussed a 20% return over 5 years)<br />
9 32<br />
Total Costs Before Return to Landowners<br />
and Log Export Tax 60 216<br />
Notes:<br />
1/ Currency conversion US$ to K<strong>in</strong>a 0.28 3/ Based on FORTECH 1997 figures<br />
2/ Depreciation based on an average <strong>of</strong> 7 year life for fixed assets 4/ Based on costs collected dur<strong>in</strong>g 2001 Review<br />
The FORTECH 1997 log cost analysis was a relatively exhaustive undertak<strong>in</strong>g, <strong>in</strong>volv<strong>in</strong>g <strong>in</strong> excess <strong>of</strong><br />
three person months. Our current <strong>review</strong> was by comparison, a rapid assessment based on analysis <strong>of</strong><br />
management accounts and discussions with management <strong>of</strong> major logg<strong>in</strong>g companies, (collectively<br />
understood to account for approx. 60% <strong>of</strong> current log export cut). Accord<strong>in</strong>gly unless significant cost<br />
variances were identified, <strong>the</strong> FORTECH costs have been accepted. The analysis <strong>in</strong>dicates that <strong>the</strong><br />
1997 wage, fuel/ oil and repairs/ ma<strong>in</strong>tenance figures are still a reliable <strong>in</strong>dicator <strong>of</strong> current costs. It<br />
had been our expectation that fuel and oil costs may have risen and that salaries and wages should<br />
have decl<strong>in</strong>ed <strong>in</strong> US$ terms over <strong>the</strong> <strong>in</strong>terven<strong>in</strong>g four years. This was not borne out <strong>in</strong> <strong>the</strong> analysis and<br />
variations <strong>in</strong> <strong>the</strong>se costs were found to be small. Our analysis however <strong>in</strong>dicates that <strong>the</strong>re have been<br />
reductions <strong>in</strong> US$ terms <strong>in</strong> <strong>the</strong> cost associated with operational overheads, stevedor<strong>in</strong>g/ port charges,<br />
head <strong>of</strong>fice overheads and royalties/ levies.<br />
The result<strong>in</strong>g updated average logg<strong>in</strong>g cost before export tax <strong>of</strong> K216 per cubic metre must be treated<br />
as an estimate based on “average” PNG conditions and current costs. As an average, it cannot be<br />
directly applied as a reliable cost <strong>in</strong>dicator <strong>of</strong> any s<strong>in</strong>gle operation, as productivities, log stock<strong>in</strong>g per<br />
hectare, terra<strong>in</strong>, wea<strong>the</strong>r, distances to ship load<strong>in</strong>g, age <strong>of</strong> equipment, agreement conditions for<br />
landowner benefits, compliance with <strong>the</strong> PNGFA Logg<strong>in</strong>g Code <strong>of</strong> Practice, overheads and o<strong>the</strong>r cost<br />
factors vary considerably from one operation to ano<strong>the</strong>r.<br />
PAGE 54
2001 FOREST REVENUE REVIEW<br />
For <strong>the</strong> calculation <strong>of</strong> depreciation and return on <strong>in</strong>vestment, <strong>the</strong> Review analysis <strong>in</strong>cluded a project<br />
level cost<strong>in</strong>g (Table 4.2) for a 250,000m 3 per year operation based on <strong>new</strong> equipment with an<br />
estimated capital cost <strong>of</strong> K68 million spread over an average <strong>of</strong> 7 years, <strong>in</strong>clud<strong>in</strong>g with a two year<br />
build-up period to reach full operat<strong>in</strong>g capacity.<br />
TABLE 4.2 FOREST INDUSTRY LOGGING COSTING MODEL<br />
YEAR Plann<strong>in</strong>g 1 2 3 4 5 6 7<br />
Phase Yr 0 All Values <strong>in</strong> '000 K unless stated o<strong>the</strong>rwise<br />
KEY OPERATING ASSUMPTIONS:<br />
Log Input Volume - m3 140,000 200,000 250,000 250,000 250,000 250,000 250,000<br />
Operat<strong>in</strong>g Level - % <strong>of</strong> capacity 50 75 90 90 90 90 90<br />
Operat<strong>in</strong>g hours/ week (9 months <strong>of</strong> year) 50 70 70 70 70 70 70<br />
Employees - # PNG 50 230 350 400 400 400 400 400<br />
Employees - # Foreign 10 20 25 30 30 30 30 30<br />
CAPITAL COSTS<br />
Mach<strong>in</strong>ery and equipment 60,000<br />
Build<strong>in</strong>gs and site 2,000<br />
Tugs/ barges 6,000<br />
PRODUCTION<br />
Typical Production volumes by grade/%<br />
Grade: 1 45% 63,000 90,000 112,500 112,500 112,500 112,500 112,500<br />
Grade: 2 10% 14,000 20,000 25,000 25,000 25,000 25,000 25,000<br />
Grade: 3 20% 28,000 40,000 50,000 50,000 50,000 50,000 50,000<br />
Grade: 4 25% 35,000 50,000 62,500 62,500 62,500 62,500 62,500<br />
Total Production 140,000 200,000 250,000 250,000 250,000 250,000 250,000<br />
REVENUE<br />
US$ Conversion 0.28 US$/m3 K/m3<br />
Average FOB value 59.25 211.61 29,625 42,321 52,902 52,902 52,902 52,902 52,902<br />
AVERAGE OPERATING COSTS<br />
US$ Conversion 0.28 US$/m3 K/m3<br />
Salaries & Wages (PNG) (Note 1) 1.85 6.61 950 1445 1652 1652 1652 1652 1652<br />
Salaries & Wages (Foreign) (Note 1) 2.35 8.39 1399 1749 2098 2098 2098 2098 2098<br />
Repairs & ma<strong>in</strong>tenance materials (% foreign 90%)<br />
( see Note 1) 7.90 28.21 3950 5643 7054 7054 7054 7054 7054<br />
Fuel & oil (see Note 1) 7.80 27.86 3900 5571 6964 6964 6964 6964 6964<br />
Logg<strong>in</strong>g operational overheads (% foreign 50%)<br />
( see Note 2) 3.50 12.50 1750 2500 3125 3125 3125 3125 3125<br />
Stevedor<strong>in</strong>g & port charges (see note 2) 6.00 21.43 3000 4286 5357 5357 5357 5357 5357<br />
Sub-total 29.40 105.00 14949 21194 26250 26250 26250 26250 26250<br />
Head <strong>of</strong>fice overhead (see note 2) 10.00 35.71 5000 7143 8929 8929 8929 8929 8929<br />
Sub-total 39.40 140.71 19700 28143 35179 35179 35179 35179 35179<br />
Royalty/ premium/ landowner benefits (see note 2) 7.28 26.00 3640 5200 6500 6500 6500 6500 6500<br />
TOTAL COSTS BEFORE DEPRECIATION<br />
AND EXPORT TAX 46.68 166.71 68,000 23,340 33,343 41,679 41,679 41,679 41,679 41,679<br />
NET CASH FLOW -68,000 6,285 8,979 11,223 11,223 11,223 11,223 11,223<br />
IRR 1.15%<br />
NOTES:<br />
1. These cost items have been based on <strong>the</strong> FORTECH 1997 (Volume 3) us<strong>in</strong>g average costs for <strong>the</strong> 5 actual cost examples presented.<br />
Costs have been cross-checked aga<strong>in</strong>st <strong>in</strong>dustry data collected and although small differences arise, <strong>the</strong> variations are<br />
not considered to be significant.<br />
2. Costs have been updated us<strong>in</strong>g averaged <strong>in</strong>dustry data collected dur<strong>in</strong>g <strong>the</strong> study.<br />
MARGIN FOR PROFIT CALCULATION Log values<br />
IRR US$/m3 K/m3<br />
a Base case IRR 1.15 59.25 211.61 Based on SGS ave. Sept 01 prices<br />
b Price to get zero IRR 0.00 58.65 209.46<br />
c Price to get IRR 15.00 67.68 241.71<br />
d Price to get IRR 20.00 71.25 254.46<br />
e Calculation <strong>of</strong> price/m3 to give 15% return (c-b) 9.03 32.25<br />
f Calculation <strong>of</strong> price/m3 to give 20% return (d-b) 12.60 45.00<br />
PAGE 55
2001 FOREST REVENUE REVIEW<br />
To calculate <strong>in</strong>dicative pr<strong>of</strong>itability <strong>of</strong> logg<strong>in</strong>g under <strong>the</strong> current Log Export Tax schedule, <strong>the</strong><br />
average logg<strong>in</strong>g cost and export tax payable have been deducted from <strong>the</strong> fob value <strong>of</strong> logs. This<br />
analysis is shown <strong>in</strong> Table 4.3.<br />
PAGE 56
2001 FOREST REVENUE REVIEW<br />
The analysis <strong>in</strong>dicates that when average costs are applied, log exports are unpr<strong>of</strong>itable for all price<br />
levels <strong>of</strong> logs. However <strong>the</strong> level <strong>of</strong> loss <strong>in</strong>creases for lower value logs. Table 4.3 should be read <strong>in</strong><br />
<strong>the</strong> context <strong>of</strong> considerable variability <strong>in</strong> costs as mentioned above. The obvious question to follow<br />
this analysis is however, why do logg<strong>in</strong>g companies cont<strong>in</strong>ue operations when fac<strong>in</strong>g apparent loss<br />
mak<strong>in</strong>g situations? Part <strong>of</strong> <strong>the</strong> answer lies <strong>in</strong> <strong>the</strong> separation <strong>of</strong> “sunk” costs from “cash ongo<strong>in</strong>g costs”.<br />
In <strong>the</strong> short term logg<strong>in</strong>g can cont<strong>in</strong>ue, provided <strong>the</strong> “cash ongo<strong>in</strong>g costs” are met. When depreciation<br />
and head <strong>of</strong>fice overheads are treated as “sunk” costs, <strong>the</strong> analysis shows that for logs with an fob<br />
value <strong>of</strong> greater than US$55 per cubic metre, logg<strong>in</strong>g companies can possibly justify cont<strong>in</strong>u<strong>in</strong>g<br />
logg<strong>in</strong>g until equipment replacement is required. This also assumes that head <strong>of</strong>fice overheads can be<br />
transferred to o<strong>the</strong>r more pr<strong>of</strong>itable activities <strong>of</strong> an <strong>in</strong>tegrated company. This would not apply for a<br />
stand-alone logg<strong>in</strong>g company.<br />
TABLE 4.3 CALCULATION ON INDICATIVE AVERAGE PROFITABILITY UNDER CURRENT LOG EXPORT TAX<br />
SYSTEM<br />
FOB Log Value<br />
Conv. US$/K<strong>in</strong>a<br />
= 0.28<br />
Approximate<br />
logg<strong>in</strong>g<br />
average cost<br />
(<strong>in</strong>cl. royalties<br />
and related<br />
charges) 1<br />
Export tax<br />
based on<br />
current<br />
schedule<br />
Calculated<br />
pr<strong>of</strong>it (loss) on<br />
log export<br />
US$ / m 3 K<strong>in</strong>a / m 3<br />
Depreciation &<br />
head <strong>of</strong>fice<br />
overheads<br />
Calculated<br />
pr<strong>of</strong>it (loss)<br />
after removal<br />
<strong>of</strong> depreciation<br />
& head <strong>of</strong>fice<br />
overheads<br />
120 428.57 209.46 230.50 - 79.00 67.61<br />
110 392.86 209.46 205.50 - 79.00 56.90<br />
90 321.43 209.46 155.50 - 79.00 35.47<br />
80 285.71 209.46 130.50 - 79.00 24.75<br />
75 267.86 209.46 118.00 - 79.00 19.40<br />
70 250.00 209.46 105.50 - 79.00 14.04<br />
65 232.14 209.46 93.00 - 79.00 8.68<br />
60 214.29 209.46 80.50 - 79.00 3.33<br />
55 196.43 209.46 68.36 - 79.00 -<br />
50 178.57 209.46 57.64 - 79.00 -<br />
45 160.71 209.46 46.93 - 79.00 -<br />
40 142.86 209.46 36.57 - 79.00 -<br />
4.2 OUTLINE OF PROCESSING OPTIONS<br />
The Terms <strong>of</strong> Reference for <strong>the</strong> Review Team require an analysis <strong>of</strong> process<strong>in</strong>g options whose<br />
purpose is to exam<strong>in</strong>e <strong>the</strong> costs and benefits to Papua New Gu<strong>in</strong>ea, <strong>in</strong> particular through a comparison<br />
with log export<strong>in</strong>g. The models created serve as a basis for discussions and for calculations on<br />
multiplier effects and ultimately on <strong>the</strong> economic value <strong>of</strong> <strong>the</strong> whole <strong>forest</strong> resource.<br />
4.2.1 F<strong>in</strong>ancial Models for Process<strong>in</strong>g<br />
For <strong>the</strong> purposes <strong>of</strong> <strong>the</strong> Review seven f<strong>in</strong>ancial models have been constructed. The models are<br />
<strong>in</strong>tended to cover a range <strong>of</strong> relevant domestic wood process<strong>in</strong>g options that are ei<strong>the</strong>r <strong>in</strong> existence or<br />
under consideration <strong>in</strong> Papua New Gu<strong>in</strong>ea. The seven cost benefit models developed are:<br />
PAGE 57
Annual Log <strong>in</strong>put m3<br />
1. Re-locatable eco-mill 330<br />
2. Small commercial mill (“Wood-Mizer”) 2,000<br />
3. Medium to large sawmill 63,000<br />
4. Integrated sawmill/ precut hous<strong>in</strong>g/jo<strong>in</strong>ery workshop 10,000<br />
5. Export veneer mill 150,000<br />
6. Export plywood mill 150,000<br />
7. Medium density fibreboard 175,000<br />
2001 FOREST REVENUE REVIEW<br />
The models have been constructed <strong>in</strong>itially as generic f<strong>in</strong>ancial models to provide a base for<br />
subsequent calculations <strong>of</strong> <strong>the</strong> <strong>in</strong>come and employment multiplier effects. To ma<strong>in</strong>ta<strong>in</strong> <strong>the</strong><br />
confidentiality <strong>of</strong> data supplied by <strong>in</strong>dustry <strong>the</strong> f<strong>in</strong>ancial models presented do not purport to replicate<br />
any specific identifiable process<strong>in</strong>g operation. Instead <strong>the</strong> models have been prepared from a<br />
comb<strong>in</strong>ation <strong>of</strong> sources, <strong>in</strong>clud<strong>in</strong>g <strong>the</strong> actual data obta<strong>in</strong>ed from <strong>in</strong>dustry, FORTECH 1997 analysis,<br />
and <strong>in</strong>formation held by <strong>the</strong> Review Team from PNG and o<strong>the</strong>r countries. All <strong>the</strong> models assume a<br />
level <strong>of</strong> efficiency slightly above average to that observed <strong>in</strong> practice <strong>in</strong> PNG, but below optimum,<br />
and atta<strong>in</strong>able with sound management practices. Aga<strong>in</strong>, as was <strong>the</strong> case for <strong>the</strong> logg<strong>in</strong>g modell<strong>in</strong>g,<br />
<strong>the</strong> process<strong>in</strong>g models are generic efficient averages and cannot be directly applied as a reliable cost<br />
<strong>in</strong>dicator <strong>of</strong> any s<strong>in</strong>gle operation, as productivities, distances from markets, mix <strong>of</strong> species, distances<br />
to ship load<strong>in</strong>g, age <strong>of</strong> equipment, overheads and o<strong>the</strong>r cost factors vary considerably from one<br />
operation to ano<strong>the</strong>r.<br />
The Review Team has not been requested to provide an exhaustive study <strong>of</strong> all process<strong>in</strong>g options, but<br />
it is important to recall that Papua New Gu<strong>in</strong>ea has had a chipp<strong>in</strong>g facility operat<strong>in</strong>g out <strong>of</strong> Madang<br />
for many years. Although <strong>the</strong> logs are only partially processed for shipment (de-bark<strong>in</strong>g, chipp<strong>in</strong>g,<br />
and dry<strong>in</strong>g for pulpmill furnish), such process<strong>in</strong>g is sufficient to secure exemption from <strong>the</strong> log export<br />
tax. In any case, <strong>the</strong> logs are supplied by <strong>the</strong> company’s own plantations and this Review will<br />
recommend that, subject to certa<strong>in</strong> conditions, plantation logs should be exempt from <strong>the</strong> log export<br />
tax. S<strong>in</strong>ce only one company is undertak<strong>in</strong>g this operation, it would not be possible to create a generic<br />
<strong>in</strong>dustry-wide model as has been done for o<strong>the</strong>r forms <strong>of</strong> process<strong>in</strong>g, so this form <strong>of</strong> process<strong>in</strong>g has<br />
been excluded from <strong>the</strong> analysis.<br />
As well as provid<strong>in</strong>g <strong>the</strong> <strong>in</strong>put data for economic multiplier calculations, <strong>the</strong> f<strong>in</strong>ancial models have<br />
been prepared on a project cash-flow basis, to allow <strong>the</strong> calculation <strong>of</strong> <strong>in</strong>dicative pre-tax and pref<strong>in</strong>anc<strong>in</strong>g<br />
f<strong>in</strong>ancial <strong>in</strong>ternal rates <strong>of</strong> return (FIRRs) to test project f<strong>in</strong>ancial viability. The FIRRs are<br />
expressed <strong>in</strong> constant or real K<strong>in</strong>a currency terms. As a approximate guide, a m<strong>in</strong>imum <strong>of</strong> a 15% pretax<br />
real FIRR would be necessary <strong>in</strong> PNG to cover project risk and attract equity and loan funds.<br />
The models have been constructed assum<strong>in</strong>g on average a 10-year life (except for <strong>the</strong> small eco-mill<br />
where a 5 year life is assumed) for process<strong>in</strong>g equipment. A 10-year, life with normal ma<strong>in</strong>tenance<br />
costed <strong>in</strong>to <strong>the</strong> model, is considered to be appropriate for PNG conditions, before substantial<br />
replacement capital expenditure would be required. Accord<strong>in</strong>gly <strong>the</strong> cashflow modell<strong>in</strong>g is term<strong>in</strong>ated<br />
at 10 years with no residual values assumed.<br />
The “base case” calculations for <strong>the</strong> seven process<strong>in</strong>g models assume current log <strong>in</strong>put costs based on<br />
market values be<strong>in</strong>g paid for log sales with<strong>in</strong> PNG. Similarly <strong>the</strong> models assume current (September<br />
2001) domestic and export prices. Export prices have been converted us<strong>in</strong>g <strong>the</strong> exchange rate<br />
apply<strong>in</strong>g at <strong>the</strong> end <strong>of</strong> September 2001 (K1.00 = US$0.28). Costs and prices have later <strong>the</strong>n been<br />
sensitivity tested to provide estimates <strong>of</strong> <strong>the</strong> impact <strong>of</strong> chang<strong>in</strong>g market prices and cost scenarios.<br />
PAGE 58
The seven models are discussed <strong>in</strong> <strong>the</strong> ensu<strong>in</strong>g sections.<br />
1. A Relocatable Eco-mill<br />
The f<strong>in</strong>ancial model for this mill is detailed <strong>in</strong> Table 4.4.<br />
2001 FOREST REVENUE REVIEW<br />
This cost<strong>in</strong>g has been based on f<strong>in</strong>ancial calculations published by WWF 1 . The cost<strong>in</strong>g does not<br />
<strong>in</strong>clude subsidisation <strong>of</strong> <strong>in</strong>puts currently provided by donors to set up, operate and obta<strong>in</strong> certification<br />
<strong>of</strong> mills. Also <strong>the</strong> life <strong>of</strong> <strong>the</strong> mill has been reduced from <strong>the</strong> 10 years estimated by WWF, to an<br />
average life 5 years based on <strong>the</strong> judgement <strong>of</strong> <strong>the</strong> Review Team on such mills <strong>in</strong> PNG conditions.<br />
For comparability purposes with <strong>the</strong> o<strong>the</strong>r process<strong>in</strong>g models, 50% <strong>of</strong> <strong>the</strong> wages paid have been<br />
treated as relat<strong>in</strong>g to logg<strong>in</strong>g and removed from <strong>the</strong> “Government Revenue Foregone” calculation.<br />
The result<strong>in</strong>g f<strong>in</strong>ancial cost<strong>in</strong>g shows an FIRR <strong>of</strong> 18%.<br />
1 WWF “A Future for our <strong>forest</strong>s: Strategies for community-based <strong>forest</strong>ry and conservation <strong>in</strong> Papua New Gu<strong>in</strong>ea” (2000)<br />
PAGE 59
2001 FOREST REVENUE REVIEW<br />
TABLE 4.4 FINANCIAL MODEL 1 – A PORTABLE RELOCATABLE ECO-MILL (BASED ON A LEWIS MILL)<br />
F<strong>in</strong>ancial Model 1 - A Portable Re-locatable Eco-mill (based on a Lewis Mill)<br />
YEAR Construct- 1 2 3 4 5<br />
ion Phase<br />
All Values <strong>in</strong> '000 K unless stated o<strong>the</strong>rwise<br />
KEY OPERATING ASSUMPTIONS:<br />
Log Input Volume - m3<br />
Species mix: predom<strong>in</strong>antly Group 1<br />
330 330 330 330 330<br />
Operat<strong>in</strong>g Level - % <strong>of</strong> capacity 70 70 70 70 70<br />
Operat<strong>in</strong>g hours/ week 44 44 44 44 44<br />
Recovery rate % 45 45 45 45 45<br />
Local market sales % 100 100 100 100 100<br />
Employees - # PNG 0 6 6 6 6 6<br />
Employees - # Foreign 0 0 0 0 0 0<br />
CAPITAL COSTS<br />
Mach<strong>in</strong>ery and equipment (100% assumed <strong>new</strong>) 51<br />
Build<strong>in</strong>gs and site 0<br />
Work<strong>in</strong>g Capital (based on 30% year 1 Costs)<br />
REVENUE<br />
9<br />
Sales volumes - m3 airdried, RS, mixed species 149 149 149 149 149<br />
US$ Conversion 0.28 US$ K<br />
Foreign sales FOB/m3 0 0 0 0 0 0 0<br />
Local sales ex mill/m3 92 330 49 49 49 49 49<br />
Total Revenue 49 49 49 49 49<br />
Average Revenue FOB/m3 <strong>of</strong> sales<br />
OPERATING COSTS<br />
330 330 330 330 330<br />
Log costs per unit <strong>of</strong> output - US$/m3 K/m3<br />
Note only royalty and PDB 16 58 9 9 9 9 9<br />
Salaries & Wages (PNG) - <strong>in</strong>cludes fell<strong>in</strong>g 84 12 12 12 12 12<br />
Salaries & Wages (Foreign) 0 0 0 0 0<br />
Operat<strong>in</strong>g Supplies (% foreign 70%) 0 0 0 0 0 0<br />
Repairs & mtnce materials (% foreign 90%) 20 3<br />
3 3 3 3<br />
Fuel & oil 38 6<br />
6 6 6 6<br />
Total costs before depreciation 60 30 30 30 30 30<br />
Average Cost per m3 <strong>of</strong> sales 200 200 200 200 200<br />
ESTIMATED CASHFLOW BEFORE DEPRECIATION<br />
INTEREST AND CORPORATE TAX -60 19 19<br />
Indicative Internal rate <strong>of</strong> return (5yr cash flow) 18%<br />
GOVERNMENT REVENUE FOREGONE US$/m3 K/m3<br />
Assumed FOB sell<strong>in</strong>g price <strong>of</strong> log <strong>in</strong>put<br />
Assumed Export tax (per m3)that would<br />
47 168<br />
be payable under current regime 14 51<br />
Assumed Export tax that would be payable under current<br />
regime assum<strong>in</strong>g that 80% <strong>of</strong> logs are <strong>of</strong> export form (K mill) 0.014 0.014 0.014 0.014 0.014<br />
Assumed # <strong>of</strong> directly employed mill<strong>in</strong>g PNG national employees<br />
Calculated <strong>revenue</strong> foregone per directly employed PNG national<br />
3 3 3 3 3<br />
under current <strong>revenue</strong> regime (K/year) 4,507 4,507 4,507 4,507 4,507<br />
19<br />
19<br />
19<br />
PAGE 60
2. A Small Commercial Mill<br />
2001 FOREST REVENUE REVIEW<br />
The small commercial mill model is based upon <strong>the</strong> operation <strong>of</strong> a “Wood-Mizer” bandmill based<br />
with<strong>in</strong> 100 km <strong>of</strong> Port Moresby or Lae, saw<strong>in</strong>g high value species for export markets. Parcels <strong>of</strong><br />
<strong>in</strong>dividual premium species (probably not more than 10 species) would be aggregated and sold <strong>in</strong>to<br />
export markets. The most likely market would be Australia. The lower grade sawn timber result<strong>in</strong>g<br />
from such saw<strong>in</strong>g, is assumed to be sold <strong>in</strong>to <strong>the</strong> domestic market. Log <strong>in</strong>put cost is based on logs<br />
purchased from logg<strong>in</strong>g companies, and available at export value less export tax payable, plus cartage<br />
to <strong>the</strong> urban based mill. The sawn timber is sold rough sawn and air-dried. The base case cost<strong>in</strong>g for<br />
this operation shows a 22% FIRR. The f<strong>in</strong>ancial model for this mill is shown <strong>in</strong> Table 4.5.<br />
TABLE 4.5 FINANCIAL MODEL 2 – A SMALL COMMERCIAL MILL (BASED ON A WOOD-MIZER MILL)<br />
F<strong>in</strong>ancial Model 2 - A Small Commercial Mill (based on a Wood-Mizer Mill)<br />
YEAR Construct- 1 2 3 4 5<br />
ion Phase<br />
All Values <strong>in</strong> '000 K unless stated o<strong>the</strong>rwise<br />
KEY OPERATING ASSUMPTIONS:<br />
Log Input Volume - m3<br />
Species mix: predom<strong>in</strong>antly Group 1<br />
1,500 2,000 2,000 2,000 2,000<br />
Operat<strong>in</strong>g Level - % <strong>of</strong> capacity 45 90 90 90 90<br />
Operat<strong>in</strong>g hours/ week 35 40 40 40 40<br />
Recovery rate % 35 40 40 40 40<br />
Export market sales % 50 60 60 60 60<br />
Employees - # PNG 14 14 14 14 14<br />
Employees - # Foreign 1 1 1 1 1<br />
CAPITAL COSTS<br />
Mach<strong>in</strong>ery and equipment (30% assumed <strong>new</strong>) 150<br />
Build<strong>in</strong>gs and site 40<br />
Work<strong>in</strong>g Capital (based on 30% year 1 Costs)<br />
REVENUE<br />
147<br />
Utilised and sold volumes - m3 air dried select species 525 800 800 800 800<br />
US$ Conversion 0.28 US$ K<br />
Foreign sales FOB/m3 325 1161 305 557 557 557 557<br />
Local sales - Pt Moresby & Lae 182 650 171 208 208 208 208<br />
Total Revenue 475 765 765 765 765<br />
Average Revenue FOB/m3 <strong>of</strong> sales (see Note 2)<br />
OPERATING COSTS<br />
905 956 956 956 956<br />
Log costs delivered at mill US$ K/m3<br />
US$ Conversion 0.28 60 214 321 429 429 429 429<br />
Salaries & Wages (PNG) 35 35 35 35 35<br />
Salaries & Wages (Foreign) 30 30 30 30 30<br />
Operat<strong>in</strong>g Supplies (% foreign 70%) 5 3 4 4 4 4<br />
Repairs & mntnce materials (% foreign 90%) 10 5 8 8 8 8<br />
Fuel & oil 2 1 2 2 2 2<br />
Electricity 5 3 4 4 4 4<br />
Pack<strong>in</strong>g/ local transport to export port 100 53 80 80 80 80<br />
O<strong>the</strong>r Factory Overhead Costs 25 13 20 20 20 20<br />
O<strong>the</strong>r General & Adm<strong>in</strong>/Mktg Overhead Costs 50 26 40 40 40 40<br />
Total costs before depreciation 337 490 651 651 651 651<br />
Average Cost per m3 <strong>of</strong> sales 933 814 814 814 814<br />
ESTIMATED CASHFLOW BEFORE DEPRECIATION<br />
INTEREST AND CORPORATE TAX -337 -15 114<br />
Indicative Internal rate <strong>of</strong> return (10 yr cash flow) 22%<br />
GOVERNMENT REVENUE FOREGONE US$/m3 K/m3<br />
Assumed FOB sell<strong>in</strong>g price <strong>of</strong> log <strong>in</strong>put<br />
Assumed Export tax (per m3)that would<br />
75 268<br />
be payable under current regime 33 118<br />
Assumed Export tax that would be payable under current<br />
regime assum<strong>in</strong>g that 80% <strong>of</strong> logs are <strong>of</strong> export form (K mill) 0.14 0.19 0.19 0.19 0.19<br />
Assumed # <strong>of</strong> directly employed mill<strong>in</strong>g PNG national employees<br />
Calculated <strong>revenue</strong> foregone per directly employed PNG national<br />
14 14 14 14 14<br />
under current <strong>revenue</strong> regime (K/year) 10,114 13,486 13,486 13,486 13,486<br />
114<br />
114<br />
114<br />
PAGE 61
3. A Medium to Large Sawmill<br />
The f<strong>in</strong>ancial model for this mill is presented <strong>in</strong> Table 4.6<br />
2001 FOREST REVENUE REVIEW<br />
TABLE 4.6 FINANCIAL MODEL 3 – A MEDIUM TO LARGE SAWMILL BASED ON HIGHER VALUE SPECIES<br />
F<strong>in</strong>ancial Model 3 - A Medium to Large Sawmill Based on Higher Value Species<br />
YEAR Construct- 1 2 3 4 5<br />
ion Phase<br />
All Values <strong>in</strong> '000 K unless stated o<strong>the</strong>rwise<br />
KEY OPERATING ASSUMPTIONS:<br />
Log Input Volume - m3<br />
Species mix: predom<strong>in</strong>antly Group 1<br />
21,000 42,000 63,000 63,000 63,000<br />
Operat<strong>in</strong>g Level - % <strong>of</strong> capacity 30 60 90 90 90<br />
Operat<strong>in</strong>g hours/ week 44 44 44 44 44<br />
Recovery rate % 40 42 45 45 45<br />
Local market sales % 30 30 30 30 30<br />
Employees - # PNG 50 200 250 300 300 300<br />
Employees - # Foreign 20 30 25 20 20 20<br />
CAPITAL COSTS<br />
Mach<strong>in</strong>ery and equipment (100% assumed <strong>new</strong>) 9,000<br />
Build<strong>in</strong>gs and site 3,000<br />
Work<strong>in</strong>g Capital (based on 30% year 1 Costs)<br />
REVENUE<br />
1,704<br />
Sales volumes - m3 airdried, RS, 10 prime species 8,400 17,640 28,350 28,350 28,350<br />
US$ Conversion 0.28 US$ K<br />
Foreign sales FOB/m3 250 893 5,250 11,025 17,719 17,719 17,719<br />
Local sales ex mill/m3 110 393 990 2,079 3,341 3,341 3,341<br />
Total Revenue 6,240 13,104 21,060 21,060 21,060<br />
Average Revenue FOB/m3 <strong>of</strong> sales<br />
OPERATING COSTS<br />
743 743 743 743 743<br />
Log costs US$/m3 K/m3<br />
10 prime species 50 179 3750 7500 11250 11250 11250<br />
Salaries & Wages (PNG) 294 564 851 851 851<br />
Salaries & Wages (Foreign) 750 625 500 500 500<br />
Operat<strong>in</strong>g Supplies (% foreign 70%) 10 84 176 284 284 284<br />
Repairs & mtnce materials (% foreign 90%) 30 200 500 851 851 851<br />
Fuel & oil 20 105 221 354 354 354<br />
Transfer to export port/ stevedor<strong>in</strong>g 50 294 617 992 992 992<br />
O<strong>the</strong>r Factory Overhead Costs 12 101 212 340 340 340<br />
O<strong>the</strong>r General & Adm<strong>in</strong> Overhead Costs 12 101 212 340 340 340<br />
Total costs before depreciation 13,704 5,679 10,627 15,762 15,762 15,762<br />
Average Cost per m3 <strong>of</strong> sales 676 602 556 556 556<br />
ESTIMATED CASHFLOW BEFORE DEPRECIATION<br />
INTEREST AND CORPORATE TAX -13,704 561 2,477<br />
Indicative Internal rate <strong>of</strong> return (10yr cash flow) 24%<br />
GOVERNMENT REVENUE FOREGONE US$/m3 K/m3<br />
Assumed FOB sell<strong>in</strong>g price <strong>of</strong> log <strong>in</strong>put<br />
Assumed Export tax (per m3)that would<br />
75 268<br />
be payable under current regime 33 118<br />
Assumed Export tax that would be payable under current<br />
regime assum<strong>in</strong>g that 80% <strong>of</strong> logs are <strong>of</strong> export form (K mill) 2.0 4.0 5.9 5.9 5.9<br />
Assumed # <strong>of</strong> directly employed PNG national employees<br />
Calculated <strong>revenue</strong> foregone per directly employed PNG national<br />
200 250 300 300 300<br />
employee (K/year) 9,912 15,859 19,824 19,824 19,824<br />
This commercial mill model is based upon a much larger bandmill operation sited on one <strong>of</strong> <strong>the</strong> larger<br />
FMA areas. Aga<strong>in</strong> <strong>the</strong> mill would concentrate on saw<strong>in</strong>g high value species for export markets. The<br />
lower grade sawn timber result<strong>in</strong>g from such saw<strong>in</strong>g, is assumed to be sold <strong>in</strong>to <strong>the</strong> domestic market.<br />
Logs are assumed to be transferred at export market value less <strong>the</strong> export tax saved. The sawn timber<br />
5,298<br />
5,298<br />
5,298<br />
PAGE 62
2001 FOREST REVENUE REVIEW<br />
is assumed to be sold rough sawn and air dried, or transferred to an urban based kiln dry<strong>in</strong>g and<br />
mach<strong>in</strong><strong>in</strong>g operation for later export. The base case cost<strong>in</strong>g for this operation shows a 24% FIRR,<br />
reflect<strong>in</strong>g a low level <strong>of</strong> economy <strong>of</strong> scale over <strong>the</strong> small “Wood-Mizer” mill.<br />
4. An Integrated Small Sawmill and Jo<strong>in</strong>ery Operation<br />
The f<strong>in</strong>ancial model for a small mill maximis<strong>in</strong>g added value process<strong>in</strong>g is presented <strong>in</strong> Table 4.7.<br />
TABLE 4.7 FINANCIAL MODEL 4 – AN INTEGRATED SMALL SAWMILL/JOINERY OPERATION<br />
F<strong>in</strong>ancial Model 4 - An Integrated Small Sawmill/ Jo<strong>in</strong>ery Operation<br />
YEAR Construct- 1 2 3 4 5<br />
ion Phase<br />
All Values <strong>in</strong> '000 K unless stated o<strong>the</strong>rwise<br />
KEY OPERATING ASSUMPTIONS:<br />
Log Input Volume - m3<br />
Species mix: predom<strong>in</strong>antly Group 1<br />
5,000 10,000 10,000 10,000 10,000<br />
Operat<strong>in</strong>g Level - % <strong>of</strong> capacity 45 90 90 90 90<br />
Operat<strong>in</strong>g hours/ week 45 70 70 70 70<br />
Recovery rate % 45 50 50 50 50<br />
Local market sales % 92 87 87 87 87<br />
Employees - # PNG 25 80 145 145 145 145<br />
Employees - # Foreign 10 3 3 3 3 3<br />
CAPITAL COSTS<br />
Mach<strong>in</strong>ery and equipment (30% assumed <strong>new</strong>) 6,000<br />
Build<strong>in</strong>gs and site 1,000<br />
Work<strong>in</strong>g Capital (based on 30% year 1 Costs)<br />
REVENUE<br />
457<br />
Utilised and sold volumes - m3 kilndried select species 2,250 5,000 5,000 5,000 5,000<br />
Foreign sales 200 720 720 720 720<br />
Local sales ex mill 2,200 5,000 5,000 5,000 5,000<br />
Total Revenue 2,400 5,720 5,720 5,720 5,720<br />
Average Revenue FOB/m3 <strong>of</strong> sales (see Note 2)<br />
OPERATING COSTS<br />
1067 1144 1144 1144 1144<br />
Log costs delivered at mill US$ K/m3<br />
US$ Conversion 0.28 45 161 804 1607 1607 1607 1607<br />
Salaries & Wages (PNG) 216 435 435 435 435<br />
Salaries & Wages (Foreign) 90 90 90 90 90<br />
Operat<strong>in</strong>g Supplies (% foreign 70%) 30 68 150 150 150 150<br />
Repairs & mtnce materials (% foreign 90%) 30 68 150 150 150 150<br />
Electricity 200 350 350 350 350<br />
O<strong>the</strong>r Factory Overhead Costs 15 34 75 75 75 75<br />
O<strong>the</strong>r General & Adm<strong>in</strong> Overhead Costs 20 45 100 100 100 100<br />
Total costs before depreciation 7,457 1,523 2,957 2,957 2,957 2,957<br />
Average Cost per m3 <strong>of</strong> sales 677 591 591 591 591<br />
ESTIMATED CASHFLOW BEFORE DEPRECIATION<br />
INTEREST AND CORPORATE TAX -7,457 877 2,763<br />
Indicative Internal rate <strong>of</strong> return (10 yr cash flow) 28%<br />
GOVERNMENT REVENUE FOREGONE US$/m3 K/m3<br />
Assumed FOB sell<strong>in</strong>g price <strong>of</strong> log <strong>in</strong>put<br />
Assumed Export tax (per m3)that would<br />
47 168<br />
be payable under current regime 14 51.21<br />
Assumed Export tax that would be payable under current<br />
regime assum<strong>in</strong>g that 80% <strong>of</strong> logs are <strong>of</strong> export form (K mill) 0.20 0.41 0.41 0.41 0.41<br />
Assumed # <strong>of</strong> directly employed mill<strong>in</strong>g PNG national employees<br />
Calculated <strong>revenue</strong> foregone per directly employed PNG national<br />
80 145 145 145 145<br />
under current <strong>revenue</strong> regime (K/year) 2,561 2,826 2,826 2,826 2,826<br />
This mill model would be based <strong>in</strong> Port Moresby or Lae, and modelled on one <strong>of</strong> several similar<br />
smaller tightly managed operations <strong>in</strong> PNG. It is assumed to saw predom<strong>in</strong>antly Group 1 species, but<br />
also saw a small volume <strong>of</strong> lower group species for utility timber. A timber treatment (dip diffusion),<br />
2,763<br />
2,763<br />
2,763<br />
PAGE 63
2001 FOREST REVENUE REVIEW<br />
pre-cut hous<strong>in</strong>g, jo<strong>in</strong>ery, and furniture manufactur<strong>in</strong>g operation are assumed to be <strong>in</strong>cluded on <strong>the</strong><br />
same site as <strong>the</strong> sawmill. It is assumed a small volume <strong>of</strong> furniture componentry is exported. 40% <strong>of</strong><br />
sawmill output is utilised <strong>in</strong> added value process<strong>in</strong>g activities. The mill is assumed to buy logs on <strong>the</strong><br />
open market. Logs are purchased at approximately export market value less <strong>the</strong> export tax saved, plus<br />
cartage. The base case cost<strong>in</strong>g for this operation shows a 28% FIRR, reflect<strong>in</strong>g a well managed added<br />
value operation servic<strong>in</strong>g <strong>the</strong> domestic market.<br />
5. A Large Export Orientated Veneer Mill<br />
This fifth option is based on a rural based large rotary veneer mill, produc<strong>in</strong>g sufficient output to<br />
transfer directly to export charter vessels without <strong>the</strong> need to transfer veneer to a prov<strong>in</strong>cial export<br />
wharf. The operation is based on two (or three if older equipment is <strong>in</strong>stalled) veneer peel<strong>in</strong>g and<br />
dry<strong>in</strong>g l<strong>in</strong>es operat<strong>in</strong>g 24 hours a day. Log <strong>in</strong>put is presumed to be predom<strong>in</strong>antly Group 1 & 2<br />
species for face/back veneers, and Groups 3 & 4 for core veneer. Logs are transferred at<br />
approximately export market value less <strong>the</strong> export tax saved and o<strong>the</strong>r costs saved.<br />
The market for rotary veneer is largely for <strong>the</strong> production <strong>of</strong> plywood <strong>in</strong> Asian markets (ma<strong>in</strong>ly<br />
Korea, Japan, Taiwan & Ch<strong>in</strong>a). Production and <strong>the</strong> competitiveness <strong>of</strong> plywood <strong>in</strong> <strong>the</strong>se markets<br />
have been heavily <strong>in</strong>fluenced by <strong>the</strong> over-supply <strong>of</strong> plywood from Indonesia (and to a lesser extent<br />
Malaysia) <strong>in</strong> recent years. In addition, to reduce cost, thicker plywood <strong>in</strong> Asian markets is<br />
<strong>in</strong>creas<strong>in</strong>gly be<strong>in</strong>g made from a comb<strong>in</strong>ation <strong>of</strong> cheaper s<strong>of</strong>twood veneers (usually from plantation<br />
grown logs) for core, with <strong>the</strong> more expensive natural <strong>forest</strong> hardwood veneers be<strong>in</strong>g reserved for<br />
face/ backs. Accord<strong>in</strong>gly <strong>the</strong> <strong>in</strong>ternational market prices for veneer have been driven down to levels<br />
over <strong>the</strong> last 5 years, which allow only <strong>the</strong> most efficient low cost producers to survive. The future<br />
market prospects for veneer will cont<strong>in</strong>ue to be closely l<strong>in</strong>ked to Indonesia’s plywood production<br />
levels and <strong>the</strong> <strong>in</strong>creas<strong>in</strong>g supply <strong>of</strong> plantation grown s<strong>of</strong>twood logs.<br />
The base case cost<strong>in</strong>g (Table 4.8) for a veneer mill <strong>of</strong> 150,000m 3 per year log <strong>in</strong>put, shows an 8%<br />
FIRR. This level <strong>of</strong> return is <strong>in</strong>sufficient to attract open market f<strong>in</strong>ance. It would not under current<br />
market conditions provide an adequate return for <strong>the</strong> replacement <strong>of</strong> fixed assets over a 10-year life.<br />
PAGE 64
TABLE 4.8 FINANCIAL MODEL 5 – A LARGE EXPORT ORIENTATED VENEER MILL<br />
F<strong>in</strong>ancial Model 5 - A Large Export Orientated Veneer Mill<br />
2001 FOREST REVENUE REVIEW<br />
YEAR Construct- 1 2 3 4 5<br />
ion Phase<br />
All Values <strong>in</strong> '000 K unless stated o<strong>the</strong>rwise<br />
KEY OPERATING ASSUMPTIONS:<br />
Log Input Volume - m3<br />
Species mix: predom<strong>in</strong>antly Group 3 & 4<br />
50,000 100,000 150,000 150,000 150,000<br />
Operat<strong>in</strong>g Level - % <strong>of</strong> capacity 30 60 90 90 90<br />
Operat<strong>in</strong>g hours/ week 120 140 140 140 140<br />
Recovery rate % 35 40 45 45 45<br />
Face/Back % 20 25 35 35 35<br />
Core Veneer % 80 75 65 65 65<br />
Local market sales % Nil Nil Nil Nil Nil<br />
Employees - # PNG 250 300 400 500 500 500<br />
Employees - # Foreign 80 80 60 50 50 50<br />
CAPITAL COSTS<br />
Mach<strong>in</strong>ery and equipment (90% assumed <strong>new</strong>) 65,000<br />
Build<strong>in</strong>gs and site 8,000<br />
Work<strong>in</strong>g Capital (based on 30% year 1 Costs)<br />
REVENUE<br />
3,512<br />
Sales volumes - dried veneer - m3 17,500 40,000 67,500 67,500 67,500<br />
US$ Conversion 0.28 US$ K<br />
Face/backs Ave.Price/m3FOB 260 929 3,250 9,286 21,938 21,938 21,938<br />
Core Ave.Price/m3FOB 150 536 7,500 16,071 23,504 23,504 23,504<br />
Total Revenue 10,750 25,357 45,442 45,442 45,442<br />
Average Revenue FOB/m3 <strong>of</strong> sales<br />
OPERATING COSTS<br />
614 634 673 673 673<br />
Log costs at mill US$/m3 K/m3<br />
85% groups 3 & 4 36 129 6429 12857 19286 19286 19286<br />
Salaries & Wages (PNG) 1014 1352 1690 1690 1690<br />
Salaries & Wages (Foreign) 2000 1500 1250 1250 1250<br />
Operat<strong>in</strong>g Supplies (% foreign 70%) 20 350 800 1350 1350 1350<br />
Repairs & ma<strong>in</strong>tenance materials (% foreign 90%) 200 500 3000 3000 3000<br />
Fuel & oil 600 1100 1500 1500 1500<br />
Transfer to export port/ stevedor<strong>in</strong>g 20 350 800 1350 1350 1350<br />
O<strong>the</strong>r Factory Overhead Costs 15 263 600 1013 1013 1013<br />
O<strong>the</strong>r General & Adm<strong>in</strong> Overhead Costs 500 500 500 500 500<br />
Total costs before depreciation 76,512 11,705 20,009 30,938 30,938 30,938<br />
Average Cost per m3 <strong>of</strong> sales 669 500 458 458 458<br />
ESTIMATED CASHFLOW BEFORE DEPRECIATION<br />
INTEREST AND CORPORATE TAX -76,512 -955 5,348<br />
Indicative Internal rate <strong>of</strong> return (10yr cash flow) 8%<br />
GOVERNMENT REVENUE FOREGONE US$/m3 K/m3<br />
Assumed FOB sell<strong>in</strong>g price <strong>of</strong> log <strong>in</strong>put<br />
Assumed Export tax (per m3)that would<br />
47 168<br />
be payable under current regime 14 51<br />
Assumed Export tax that would be payable under current<br />
regime assum<strong>in</strong>g that 85% <strong>of</strong> logs are <strong>of</strong> export form (K mill) 2.2 4.4 6.5 6.5 6.5<br />
Assumed # <strong>of</strong> directly employed PNG national employees<br />
Calculated <strong>revenue</strong> foregone per directly employed PNG national<br />
300 400 500 500 500<br />
under current <strong>revenue</strong> regime (K/year) 7,255 10,883 13,060 13,060 13,060<br />
14,504<br />
14,504<br />
NOTES:<br />
1. Assumes a rural based rotary veneer mill with transfer <strong>of</strong> output direct for export <strong>in</strong> charter vessels.<br />
2. The operation is assumed to concentrate on predom<strong>in</strong>antly Group 1 and Group 2 species for face and Groups 3 & 4 for backs<br />
and core material.<br />
14,504<br />
PAGE 65
TABLE 4.9 FINANCIAL MODEL 6 – A LARGE EXPORT PLYWOOD MILL<br />
F<strong>in</strong>ancial Model 6 - A Large Export Plywood Mill<br />
2001 FOREST REVENUE REVIEW<br />
YEAR Construct- 1 2 3 4 5<br />
ion Phase<br />
All Values <strong>in</strong> '000 K unless stated o<strong>the</strong>rwise<br />
KEY OPERATING ASSUMPTIONS:<br />
Log Input Volume - m3<br />
Species mix: predom<strong>in</strong>antly Group 3 & 4<br />
50,000 100,000 150,000 150,000 150,000<br />
Operat<strong>in</strong>g Level - % <strong>of</strong> capacity 30 60 90 90 90<br />
Operat<strong>in</strong>g hours/ week 120 140 140 140 140<br />
Recovery rate % 40 45 50 50 50<br />
Local market sales % 20 20 20 20 20<br />
Employees - # PNG 300 350 500 625 625 625<br />
Employees - # Foreign 100 120 75 60 60 60<br />
CAPITAL COSTS<br />
Mach<strong>in</strong>ery and equipment (90% assumed <strong>new</strong>) 80,000<br />
Build<strong>in</strong>gs and site 10,000<br />
Work<strong>in</strong>g Capital (based on 30% year 1 Costs)<br />
REVENUE<br />
4,521<br />
Sales volumes - m3 20,000 45,000 75,000 75,000 75,000<br />
US$ Conversion 0.28 US$ K<br />
Export 6mm+ BB/CC Gde/m3FOB 180 643 10,286 23,143 38,571 38,571 38,571<br />
Local sales 6mm+ 220 786 3,143 7,071 11,786 11,786 11,786<br />
Total Revenue 13,429 30,214 50,357 50,357 50,357<br />
Average Revenue FOB/m3 <strong>of</strong> sales<br />
OPERATING COSTS<br />
671 671 671 671 671<br />
Log costs at mill US$/m3 K/m3<br />
85% groups 3 & 4 36 129 6429 12857 19286 19286 19286<br />
Salaries & Wages (PNG) 1183 1690 2113 2113 2113<br />
Salaries & Wages (Foreign) 3000 1875 1500 1500 1500<br />
Operat<strong>in</strong>g Supplies (% foreign 90%) 110 2200 4950 8250 8250 8250<br />
Repairs & ma<strong>in</strong>tenance materials (% foreign 90%) 250 625 4000 4000 4000<br />
Fuel & oil 35 700 1575 2625 2625 2625<br />
Transfer to export port/ stevedor<strong>in</strong>g 20 400 900 1500 1500 1500<br />
O<strong>the</strong>r Factory Overhead Costs 18 360 810 1350 1350 1350<br />
O<strong>the</strong>r General & Adm<strong>in</strong> Overhead Costs 550 550 550 550 550<br />
Total costs before depreciation 94,521 15,072 25,832 41,173 41,173 41,173<br />
Average Cost per m3 <strong>of</strong> sales 754 574 549 549 549<br />
ESTIMATED CASHFLOW BEFORE DEPRECIATION<br />
INTEREST AND CORPORATE TAX -94,521 -1,643 4,382<br />
Indicative Internal rate <strong>of</strong> return (10yr cash flow) -3%<br />
GOVERNMENT REVENUE FOREGONE US$/m3 K/m3<br />
Assumed FOB sell<strong>in</strong>g price <strong>of</strong> log <strong>in</strong>put<br />
Assumed Export tax (per m3)that would<br />
47 168<br />
be payable under current regime 14 51<br />
Assumed Export tax that would be payable under current<br />
regime assum<strong>in</strong>g that 85% <strong>of</strong> logs are <strong>of</strong> export form (K mill) 2.2 4.4 6.5 6.5 6.5<br />
Assumed # <strong>of</strong> directly employed PNG national employees<br />
Calculated <strong>revenue</strong> foregone per directly employed PNG national<br />
350 500 625 625 625<br />
under current <strong>revenue</strong> regime (K/year)<br />
NOTES:<br />
6,219 8,706 10,448 10,448 10,448<br />
1. Assumes a rural based mill with transfer <strong>of</strong> output direct for export <strong>in</strong> charter vessels.<br />
2. The operation is assumed to concentrate on predom<strong>in</strong>antly Group 1 and Group 2 species for face and Groups 3 & 4 for backs<br />
and core material.<br />
3. The very competitive current market situation caused by oversupply <strong>of</strong> plywood from Indonesia and Malaysia, has a major<br />
<strong>in</strong>fluence on pr<strong>of</strong>itability<br />
9,184<br />
9,184<br />
9,184<br />
PAGE 66
6. A Large Export Plywood Mill<br />
2001 FOREST REVENUE REVIEW<br />
This sixth option is based upon an extension <strong>of</strong> <strong>the</strong> fifth option <strong>in</strong>to a PNG based <strong>in</strong>tegrated veneer<br />
and plywood production mill, ra<strong>the</strong>r than export<strong>in</strong>g <strong>the</strong> veneer to be made up <strong>in</strong>to plywood <strong>of</strong>fshore.<br />
Aga<strong>in</strong> <strong>the</strong> mill is assumed to be produc<strong>in</strong>g sufficient output to transfer directly to export charter<br />
vessels without <strong>the</strong> need to transfer plywood to a prov<strong>in</strong>cial export wharf. As expla<strong>in</strong>ed above for<br />
veneer, <strong>the</strong> market for plywood has been heavily <strong>in</strong>fluenced by <strong>the</strong> over-supply <strong>of</strong> plywood from<br />
Indonesia (and to a lesser extent Malaysia) <strong>in</strong> recent years. Plywood made from tropical hardwoods<br />
sourced from “south sea logs” has to compete directly with Indonesia’s log cost, labour cost and<br />
productivities. The only alternative for higher cost producers to compete, has been to <strong>in</strong>corporate<br />
high technology peel<strong>in</strong>g, clipp<strong>in</strong>g, veneer handl<strong>in</strong>g, glue spread<strong>in</strong>g and press<strong>in</strong>g techniques that would<br />
be unattractive <strong>in</strong> PNG because <strong>of</strong> <strong>the</strong> high level <strong>of</strong> higher cost foreign technical staff that would be<br />
required to ma<strong>in</strong>ta<strong>in</strong> such equipment <strong>in</strong> rural areas. Accord<strong>in</strong>gly <strong>the</strong> cost<strong>in</strong>g (Table 35) is based on<br />
more conventional older technology.<br />
The model assumes that a small volume (20% <strong>of</strong> output) <strong>of</strong> lower grade plywood would be sold <strong>in</strong> <strong>the</strong><br />
domestic market. The base case cost<strong>in</strong>g for <strong>the</strong> plywood mill <strong>of</strong> 150,000m3/ year log <strong>in</strong>put, shows a<br />
negative FIRR. This is largely attributable to <strong>the</strong> current over capacity <strong>of</strong> production <strong>in</strong> <strong>the</strong> region and<br />
PNG’s relatively high cost structure.<br />
7. A Medium Density Fibreboard Mill<br />
Medium density fibreboard (MDF) was first <strong>in</strong>troduced <strong>in</strong>to North America <strong>in</strong> <strong>the</strong> 1970’s. Production<br />
commenced <strong>in</strong> New Zealand <strong>in</strong> 1980 and dur<strong>in</strong>g <strong>the</strong> 1980’s spread to Europe, Lat<strong>in</strong> America. Most<br />
recently, dur<strong>in</strong>g <strong>the</strong> 1990’s production has spread through Asia with Malaysia and Indonesia<br />
becom<strong>in</strong>g major exporters.<br />
MDF is one <strong>of</strong> <strong>the</strong> fastest grow<strong>in</strong>g segments <strong>of</strong> <strong>the</strong> <strong>in</strong>ternational wood products market. Growth <strong>in</strong><br />
demand dur<strong>in</strong>g <strong>the</strong> 1990’s averaged 10%/year. MDF is slowly replac<strong>in</strong>g solid wood, particle-board,<br />
plywood and block-board <strong>in</strong> many build<strong>in</strong>g <strong>in</strong>terior jo<strong>in</strong>ery and furniture end use applications.<br />
Worldwide production dur<strong>in</strong>g <strong>the</strong> mid 1990’s however exceeded demand, and pr<strong>of</strong>itability <strong>of</strong> MDF<br />
manufacture has suffered s<strong>in</strong>ce.<br />
The source <strong>of</strong> wood for MDF manufacture is important, and for export production a s<strong>in</strong>gle species,<br />
light coloured and relatively low density wood source is preferred. MDF would <strong>the</strong>refore need to<br />
source wood from ei<strong>the</strong>r short rotation fast grown hardwoods (most likely eucalyptus or acacia), or<br />
from <strong>the</strong> residues <strong>of</strong> saw<strong>in</strong>g or peel<strong>in</strong>g a very restricted mix <strong>of</strong> species <strong>of</strong> plantation timbers. A net<br />
stocked plantation area <strong>of</strong> approximately 12,000 ha. (assum<strong>in</strong>g an average annual growth <strong>in</strong>crement <strong>of</strong><br />
15m3/ha/year) <strong>of</strong> predom<strong>in</strong>antly one species would be required.<br />
The production <strong>of</strong> MDF is a technology <strong>in</strong>tensive ra<strong>the</strong>r than labour <strong>in</strong>tensive process, with highly<br />
automated computer controlled fibre production, glue mix<strong>in</strong>g, form<strong>in</strong>g and press<strong>in</strong>g processes. The<br />
supply <strong>of</strong> res<strong>in</strong>s and energy are <strong>the</strong> ma<strong>in</strong> manufactur<strong>in</strong>g costs after <strong>the</strong> wood cost.<br />
The FIRR model (Table 4.10) assumes that a small volume (10% <strong>of</strong> output) <strong>of</strong> MDF would be sold <strong>in</strong><br />
<strong>the</strong> domestic market. The base case cost<strong>in</strong>g for a mill <strong>of</strong> 175,000m3/ year log <strong>in</strong>put, (small by<br />
<strong>in</strong>ternational standards) shows a negative FIRR. This is largely attributable to <strong>the</strong> current over<br />
capacity <strong>of</strong> production <strong>in</strong> <strong>the</strong> region and PNG’s relatively high cost structure for energy, imported<br />
res<strong>in</strong> and foreign technical staff.<br />
A Pulp Mill<br />
The Review terms <strong>of</strong> reference require that a process<strong>in</strong>g model for wood pulp be considered. The<br />
design <strong>of</strong> pulp mills has changed significantly over <strong>the</strong> 1980’s and 1990’s. Mill sizes worldwide have<br />
more than doubled dur<strong>in</strong>g <strong>the</strong>se twenty years, from an average size <strong>new</strong> mill <strong>in</strong> <strong>the</strong> 1980’s <strong>of</strong> 250,000<br />
PAGE 67
2001 FOREST REVENUE REVIEW<br />
tonnes/year <strong>of</strong> output to <strong>new</strong> mills at year 2000 hav<strong>in</strong>g a m<strong>in</strong>imum capacity <strong>of</strong> around 600,000<br />
tonnes/year to be competitive. A 600,000 t/year mill would require a log <strong>in</strong>put level <strong>of</strong> 2.8 to 3.0<br />
million m3/year <strong>of</strong> predom<strong>in</strong>antly one specie – more than PNG’s total annual cut <strong>of</strong> all species. A<br />
plantation <strong>forest</strong> <strong>of</strong> approximately 200,000 ha. <strong>of</strong> stocked area, <strong>in</strong> one location, would be required to<br />
support an <strong>in</strong>ternationally cost competitive <strong>new</strong> stand-alone pulp mill.<br />
The ma<strong>in</strong> reasons for such large capacities to rema<strong>in</strong> competitive, are <strong>in</strong> <strong>the</strong> technologies apply<strong>in</strong>g to<br />
cook<strong>in</strong>g <strong>of</strong> wood fibres, bleach<strong>in</strong>g and waste fibre recovery. Pulp mills have also <strong>in</strong>creased <strong>in</strong><br />
automation with reduced personnel.<br />
TABLE 4.10 FINANCIAL MODEL 7 – A MEDIUM DENSITY FIBREBOARD MILL<br />
F<strong>in</strong>ancial Model 7 - A Medium Density Fibreboard Mill<br />
YEAR Construct- 1 2 3 4 5<br />
ion Phase<br />
All Values <strong>in</strong> '000 K unless stated o<strong>the</strong>rwise<br />
KEY OPERATING ASSUMPTIONS:<br />
Log Input Volume -s<strong>in</strong>gle l<strong>in</strong>e - m3<br />
Species mix: plantation grown eucalyptus/acacia<br />
97,000 175,000 175,000 175,000 175,000<br />
Operat<strong>in</strong>g Level - % <strong>of</strong> capacity 50 90 90 90 90<br />
Operat<strong>in</strong>g hours/ week 140 168 168 168 168<br />
Recovery rate % 50 57 57 57 57<br />
Local market sales % 10 10 10 10 10<br />
Employees - # PNG 200 100 130 130 130 130<br />
Employees - # Foreign 400 100 70 70 70 70<br />
CAPITAL COSTS<br />
Mach<strong>in</strong>ery and equipment - all <strong>new</strong> 240,000<br />
Build<strong>in</strong>gs and site 15,000<br />
Work<strong>in</strong>g Capital (based on 30% year 1 Costs)<br />
REVENUE (see note 4)<br />
8,939<br />
Sales volumes - m3 57,059 109,375 109,375 109,375 109,375<br />
US$ Conversion 0.28 US$ K<br />
Export grade 12 - 21mm/m3 FOB 180 643 28,061 57,713 57,713 57,713 57,713<br />
Local sales 210 750 3,638 7,481 7,481 7,481 7,481<br />
Total Revenue 31,698 65,194 65,194 65,194 65,194<br />
Average Revenue FOB/m3 <strong>of</strong> sales<br />
OPERATING COSTS<br />
556 596 596 596 596<br />
Log costs at mill US$/m3 K/m3<br />
Plantation eucalyptus/acacia 25 89 8661 15625 15625 15625 15625<br />
Salaries & Wages (PNG) 500 650 650 650 650<br />
Salaries & Wages (Foreign) 3000 2100 2100 2100 2100<br />
Operat<strong>in</strong>g Supplies (% foreign 90%) 140 8787 15313 15313 15313 15313<br />
Repairs & ma<strong>in</strong>tenance materials (% foreign 90%) 250 4375 4000 4000 4000<br />
Fuel, oil, electricity 90 5649 9844 9844 9844 9844<br />
Pack<strong>in</strong>g materials 12 753 1313 1313 1313 1313<br />
Transfer to export port/ stevedor<strong>in</strong>g 10 628 1094 1094 1094 1094<br />
O<strong>the</strong>r Factory Overhead Costs 10 628 1094 1094 1094 1094<br />
O<strong>the</strong>r General & Adm<strong>in</strong> Overhead Costs 15 941 1641 1641 1641 1641<br />
Total costs before depreciation 263,939 29,797 53,047 52,672 52,672 52,672<br />
Average Cost per m3 <strong>of</strong> sales 522 485 482 482 482<br />
ESTIMATED CASHFLOW BEFORE DEPRECIATION<br />
INTEREST AND CORPORATE TAX -263,939 1,902 12,147<br />
Indicative Internal rate <strong>of</strong> return (10yr cash flow) Negative<br />
GOVERNMENT REVENUE FOREGONE US$/m3 K/m3<br />
Assumed FOB sell<strong>in</strong>g price <strong>of</strong> log <strong>in</strong>put<br />
Assumed Export tax (per m3)that would<br />
25 89<br />
be payable under current regime 4 13<br />
Assumed Export tax that would be payable under current<br />
<strong>revenue</strong> regime (K'millions) (see note 3) 1.3 2.3 2.3 2.3 2.3<br />
Assumed # <strong>of</strong> directly employed PNG national employees<br />
Calculated <strong>revenue</strong> foregone per directly employed PNG national<br />
100 130 130 130 130<br />
under current <strong>revenue</strong> regime (K/year) 12,991 18,029 18,029 18,029 18,029<br />
12,522<br />
12,522<br />
12,522<br />
PAGE 68
2001 FOREST REVENUE REVIEW<br />
Smaller older technology pulp mills are still operat<strong>in</strong>g around <strong>the</strong> world, and can be purchased<br />
second-hand and conceivably relocated to PNG. Such mills would <strong>in</strong>variably have high operational<br />
costs, poor environmental safeguards, provide a lower return to wood growers and need a high level<br />
<strong>of</strong> Government subsidy to export.<br />
4.2.2 Sensitivity Analysis on Base Case F<strong>in</strong>ancial Models<br />
Sensitivity analysis has been undertaken on <strong>the</strong> seven generic f<strong>in</strong>ancial models. This analysis is<br />
presented <strong>in</strong> Table 4.11. The analysis <strong>in</strong>cludes chang<strong>in</strong>g <strong>the</strong> market price, wood <strong>in</strong>put cost and total<br />
costs <strong>of</strong> production.<br />
TABLE 4.11 SENSITIVITY ANALYSIS – IMPACT ON FINANCIAL VIABILITY BY CHANGING KEY VARIABLES<br />
Sensitivity Analysis: Impact on F<strong>in</strong>ancial Viability By Chang<strong>in</strong>g Key Variables<br />
Sensitivity Tests Undertaken<br />
1 2 3<br />
Process<strong>in</strong>g Options<br />
4 5 6 7<br />
Portable/ Relocatable Medium/ Integrated Export Export Medium<br />
Relocatable Wood-Mizer Large Sawmill/ Precut Veneer Plywood Density<br />
Eco-mill Sawmill Sawmill Hous<strong>in</strong>g/<br />
Jo<strong>in</strong>ery<br />
Mill Mill Fibreboard<br />
F<strong>in</strong>ancial Internal Rate <strong>of</strong> Return (FIRR) Percentage (%)<br />
Base Case FIRR 18 22 24 28 8 Negative Negative<br />
Increase sales <strong>revenue</strong> by 5% 24 32 29 32 11 1 Negative<br />
Increase sales <strong>revenue</strong> by 10% 29 41 34 35 13 4 Negative<br />
Decrease sales <strong>revenue</strong> by 5% 13 11 19 25 4 Negative Negative<br />
Decrease sales <strong>revenue</strong> by 10% 6 Negative 12 22 1 Negative Negative<br />
Increase log cost by 10% 16 9 18 26 5 Negative Negative<br />
Decrease log cost by 10% 21 35 30 30 10 Negative Negative<br />
Increase operat<strong>in</strong>g cost by 5% 14 12 20 27 5 Negative Negative<br />
Increase operat<strong>in</strong>g cost by 10% 10 1 15 25 3 Negative Negative<br />
Decrease operat<strong>in</strong>g cost by 5% 21 32 29 30 10 0 Negative<br />
Decrease operat<strong>in</strong>g cost by 10% 27 41 33 32 12 3 Negative<br />
Increase <strong>in</strong>vestment cost by 10% 14 20 22 26 6 Negative Negative<br />
Decrease <strong>in</strong>vestment cost by 10% 23 25 27 32 10 Negative Negative<br />
Base Case Input Log Cost US$/m3 16 60 50 45 36 36 25<br />
Input log cost to achieve a 15% FIRR<br />
US$/m3 19 64 57 73 25 10 -45<br />
Difference: Indicative "Extra Ability<br />
to Pay" From Process<strong>in</strong>g Option - US$/m3 3 4 7 28 -11 -26 Nil<br />
PAGE 69
In summary <strong>the</strong> analysis <strong>in</strong>dicates that:<br />
2001 FOREST REVENUE REVIEW<br />
The four saw mill<strong>in</strong>g options show higher pr<strong>of</strong>itability under all tests than <strong>the</strong> three board<br />
product options;<br />
The small <strong>in</strong>tegrated sawmill/added value process<strong>in</strong>g operation rema<strong>in</strong>ed <strong>the</strong> most pr<strong>of</strong>itable<br />
under all tests;<br />
The larger saw mill<strong>in</strong>g option under option 3, is less sensitive to small changes <strong>in</strong> market prices<br />
for sawn timber and log <strong>in</strong>put prices than smaller mills;<br />
The export veneer mill FIRR rema<strong>in</strong>s positive, but f<strong>in</strong>ancially unattractive under all sensitivity<br />
scenarios modelled;<br />
The export plywood mill FIRR changes from negative only under <strong>the</strong> 4 most optimistic<br />
sensitivity scenarios;<br />
The MDF FIRR is negative under all sensitivity scenarios modelled, and is unlikely to be an<br />
option for PNG.<br />
When <strong>the</strong> log <strong>in</strong>put cost is tested, to provide a 15% FIRR, all four saw mill<strong>in</strong>g options can afford to<br />
pay marg<strong>in</strong>ally higher log prices. This calculation <strong>of</strong> “wood pay<strong>in</strong>g capability” <strong>in</strong>dicates that none <strong>of</strong><br />
<strong>the</strong> board manufactur<strong>in</strong>g options can afford to pay current log prices, yet alone any <strong>in</strong>crease <strong>in</strong> wood<br />
cost.<br />
4.2.3 Government Revenue Foregone Through Process<strong>in</strong>g <strong>of</strong> Logs<br />
As an <strong>in</strong>itial <strong>in</strong>dicator <strong>of</strong> <strong>the</strong> support level provided by Government for wood process<strong>in</strong>g <strong>in</strong> PNG, a<br />
calculation <strong>of</strong> <strong>revenue</strong> foregone for each PNG national salary or wage position established has been<br />
estimated. The calculation is based on <strong>the</strong> current log export tax schedule. The analysis for each<br />
model is shown on <strong>the</strong> bottom <strong>of</strong> each <strong>of</strong> <strong>the</strong> Tables 4.4 to Table 4.10 and summarised <strong>in</strong> Table 4.12.<br />
TABLE 4.12 ESTIMATE OF REVENUE FOREGONE BY GOVERNMENT FOR EACH PNG NATIONAL EMPLOYEE -<br />
POSITION CREATED IN PROCESSING<br />
Process<strong>in</strong>g Model Total Revenue Foregone<br />
Per Million K<strong>in</strong>a<br />
millions per year 1/<br />
Number <strong>of</strong><br />
Employees<br />
Per Mill #<br />
Estimate <strong>of</strong> Revenue<br />
Foregone per PNG<br />
Employee per year<br />
K<strong>in</strong>a/Year<br />
Re-locatable eco-mill 0.014 3 4,507<br />
Small commercial mill 0.190 14 13,486<br />
Medium to large sawmill 5.900 300 19,824<br />
Integrated sawmill/ added value 0.410 145 2,826<br />
Export veneer mill 6.500 500 13,060<br />
Plywood 6.500 625 13,060<br />
MDF 2/ 2.300 130 18,029<br />
Notes: 1/ Based on current Export Log schedule<br />
2/ Calculated assum<strong>in</strong>g Log Export Tax is payable on plantation logs. Under recommendations<br />
currently before Government, it is proposed that Export Taxes on plantation grown logs should be<br />
removed.<br />
PAGE 70
2001 FOREST REVENUE REVIEW<br />
4.3 INTERNATIONAL COMPETITIVENESS ISSUES RELATING TO PROCESSING IN PNG<br />
It is appropriate to briefly exam<strong>in</strong>e selected issues relat<strong>in</strong>g to <strong>in</strong>ternational competitiveness and <strong>the</strong><br />
future prospects for process<strong>in</strong>g <strong>in</strong> PNG. The pr<strong>in</strong>cipal issues <strong>in</strong>cluded are:<br />
Key issues affect<strong>in</strong>g <strong>the</strong> past pr<strong>of</strong>itability <strong>of</strong> process<strong>in</strong>g <strong>in</strong> PNG;<br />
International competitiveness issues likely to <strong>in</strong>fluence future viability;<br />
Comments on <strong>the</strong> recent decisions by <strong>the</strong> private sector to <strong>in</strong>stall export veneer mills.<br />
In 1989 approximately 500,000 m 3 or one third <strong>of</strong> <strong>the</strong> annual log harvest (exclud<strong>in</strong>g wood chips) was<br />
be<strong>in</strong>g processed domestically. By <strong>the</strong> year 2000, our estimate is that domestic process<strong>in</strong>g had<br />
<strong>in</strong>creased to 600,000m 3 represent<strong>in</strong>g approximately 23% <strong>of</strong> total log harvest. The preference or<br />
implicit subsidy to domestic processors, when compared to log exporters under <strong>the</strong> current <strong>forest</strong><br />
<strong>revenue</strong> <strong>system</strong>, through <strong>the</strong> exemption <strong>of</strong> export taxes on logs processed domestically, has not<br />
resulted <strong>in</strong> a major expansion <strong>of</strong> process<strong>in</strong>g.<br />
A considerable amount has been written <strong>in</strong> <strong>the</strong> past, on <strong>the</strong> constra<strong>in</strong>ts <strong>in</strong>fluenc<strong>in</strong>g <strong>forest</strong> <strong>in</strong>dustries<br />
development. In summary <strong>the</strong> key issues are seen as:<br />
High labour cost and low labour productivity factors when compared with o<strong>the</strong>r tropical <strong>forest</strong><br />
product export<strong>in</strong>g countries <strong>in</strong> <strong>the</strong> South East Asian region. This <strong>in</strong>cludes <strong>the</strong> high cost and heavy<br />
reliance upon expatriate technical staff;<br />
High cost and relatively <strong>in</strong>effectual management (reflected particularly <strong>in</strong> <strong>the</strong> low conversion<br />
rates);<br />
High <strong>in</strong>ternal and external freight costs associated with both supply<strong>in</strong>g <strong>the</strong> ma<strong>in</strong> urban centres <strong>in</strong><br />
<strong>the</strong> domestic market and for export<strong>in</strong>g;<br />
High overhead costs affected by <strong>the</strong> remoteness, security, secondary support services and<br />
manag<strong>in</strong>g landowner liaison <strong>in</strong> PNG. This <strong>in</strong>flates both capital and operat<strong>in</strong>g costs;<br />
High energy costs affect<strong>in</strong>g those operations that are not utilis<strong>in</strong>g waste wood for process heat<br />
and/or electricity generation;<br />
The nature and occurrence <strong>of</strong> <strong>the</strong> <strong>forest</strong> resource <strong>in</strong> PNG makes it difficult for any <strong>in</strong>dividual<br />
operator to process and supply significant volumes <strong>of</strong> <strong>the</strong> major market species. This is <strong>in</strong> direct<br />
contrast to <strong>the</strong> relatively homogeneous dipterocarp <strong>forest</strong>s <strong>of</strong> Malaysia and Indonesia;<br />
Uncerta<strong>in</strong>ty and risk associated with resource security and <strong>the</strong> high <strong>in</strong>cidence <strong>of</strong> landowner<br />
disruptions;<br />
The small domestic market. Generally when process<strong>in</strong>g natural <strong>forest</strong> wood products for export a<br />
strong domestic market is important to utilise non-exportable lower grade and residue outputs;<br />
Difficulties <strong>in</strong> compet<strong>in</strong>g with o<strong>the</strong>r South East Asian producers (particularly Indonesia) where<br />
illegally logged resource, fed to producers at lower prices, enhance <strong>the</strong> competitiveness <strong>of</strong> <strong>the</strong>ir<br />
products sold <strong>in</strong> <strong>in</strong>ternational markets;<br />
Reluctance, because <strong>of</strong> <strong>the</strong> perceived low returns and high risks, to <strong>in</strong>vest <strong>in</strong> <strong>new</strong> technology.<br />
The important question is whe<strong>the</strong>r <strong>the</strong>se factors, and <strong>in</strong> turn, <strong>the</strong> <strong>in</strong>ternational competitiveness <strong>of</strong><br />
PNG’s wood process<strong>in</strong>g sector, are likely to improve <strong>in</strong> <strong>the</strong> future. The conclusions reached are:<br />
PAGE 71
2001 FOREST REVENUE REVIEW<br />
Labour cost has decreased significantly <strong>in</strong> real terms over <strong>the</strong> past 5 years as a result <strong>of</strong> k<strong>in</strong>a<br />
devaluation. A cont<strong>in</strong>uation <strong>of</strong> this trend will not however <strong>in</strong> itself have a major impact on<br />
competitiveness, as <strong>the</strong> labour cost <strong>in</strong> a typical medium to large saw mill<strong>in</strong>g operation <strong>in</strong> PNG is<br />
currently around 5% <strong>of</strong> operat<strong>in</strong>g costs before depreciation and f<strong>in</strong>anc<strong>in</strong>g charges. An<br />
improvement <strong>in</strong> productivity and skill levels (through an <strong>in</strong>creased <strong>in</strong>vestment <strong>in</strong> tra<strong>in</strong><strong>in</strong>g)<br />
particularly to reduce <strong>the</strong> need for foreign supervisors and technicians, would appear to have a<br />
larger operat<strong>in</strong>g cost sav<strong>in</strong>g. Such improvements are likely <strong>in</strong> <strong>the</strong> PNG context to be <strong>of</strong> a medium<br />
to long term <strong>in</strong> nature;<br />
Freight, overhead/ energy costs and <strong>the</strong> small domestic market are unlikely to change<br />
significantly relative to competitors <strong>in</strong> <strong>the</strong> medium term;<br />
The future composition and commercial attractiveness <strong>of</strong> <strong>the</strong> PNG <strong>forest</strong> resource is likely to be<br />
relatively neutral <strong>in</strong> terms <strong>of</strong> competitiveness. On one hand <strong>the</strong> cont<strong>in</strong>uity <strong>of</strong> PNG’s resource will<br />
work <strong>in</strong> its favour relative to <strong>the</strong> fast deplet<strong>in</strong>g log producers such as <strong>the</strong> Solomon Islands, Sabah<br />
and western regions <strong>of</strong> Indonesia. On <strong>the</strong> o<strong>the</strong>r hand, <strong>the</strong> rema<strong>in</strong><strong>in</strong>g PNG resource will<br />
<strong>in</strong>creas<strong>in</strong>gly be <strong>in</strong> regions with lower <strong>forest</strong> stock<strong>in</strong>gs, higher costs and a less attractive<br />
commercial mix <strong>of</strong> species;<br />
The competitiveness difficulties and market uncerta<strong>in</strong>ty created by illegal logg<strong>in</strong>g were discussed<br />
<strong>in</strong> section 2.3.4. There is currently considerable <strong>in</strong>ternational donor and NGO effort to try and<br />
improve <strong>forest</strong> governance <strong>in</strong> <strong>the</strong> most countries where illegal logg<strong>in</strong>g is a serious issue.<br />
However it is still very difficult to estimate when <strong>the</strong> problem will reduce, and at least <strong>in</strong> <strong>the</strong><br />
short term it likely to cont<strong>in</strong>ue to underm<strong>in</strong>e <strong>the</strong> competitiveness <strong>of</strong> PNG’s timber products.<br />
In <strong>the</strong> light <strong>of</strong> <strong>the</strong> above, <strong>the</strong> recent decision by <strong>the</strong> private sector to <strong>in</strong>stall a large export veneer mill<br />
<strong>in</strong> <strong>the</strong> Western Prov<strong>in</strong>ce, plus <strong>the</strong> fur<strong>the</strong>r planned mills <strong>in</strong> <strong>the</strong> East Sepik and Sandaun prov<strong>in</strong>ces<br />
warrants fur<strong>the</strong>r analysis and comment. The process<strong>in</strong>g cost benefit models developed as part <strong>of</strong> this<br />
Review would <strong>in</strong>dicate that export veneer mills based on current market conditions are f<strong>in</strong>ancially<br />
unattractive. The rationale for <strong>the</strong>se export veneer mills is most likely to be pr<strong>in</strong>cipally associated<br />
with <strong>the</strong> follow<strong>in</strong>g factors:<br />
The Panakawa mill was planned and committed dur<strong>in</strong>g a period when export veneer prices were<br />
approximately 30% higher;<br />
Despite considerable publicity, <strong>the</strong> mills <strong>in</strong> <strong>the</strong> East Sepik and Sandaun prov<strong>in</strong>ces have not yet<br />
been irrevocably committed. Given current market conditions fur<strong>the</strong>r delays <strong>in</strong> <strong>the</strong> f<strong>in</strong>al<br />
commitment are likely.<br />
The comb<strong>in</strong>ation <strong>of</strong> a <strong>forest</strong> with a poor species mix (a high percentage <strong>of</strong> low value group 3 and<br />
group 4 species), a weaken<strong>in</strong>g market for lower value export logs, and a weaken<strong>in</strong>g k<strong>in</strong>a (ie. <strong>the</strong><br />
weaken<strong>in</strong>g K<strong>in</strong>a <strong>in</strong>creases <strong>the</strong> impact <strong>of</strong> <strong>the</strong> log export tax particularly on low value species through<br />
fixed logg<strong>in</strong>g costs and an <strong>in</strong>creased percentage <strong>of</strong> FOB value payable <strong>in</strong> tax) places concessionaires<br />
with such <strong>forest</strong>s <strong>in</strong> a dilemma. Ei<strong>the</strong>r <strong>the</strong>y can <strong>in</strong>creas<strong>in</strong>gly “high value/ reduce volume” log, with <strong>the</strong><br />
result<strong>in</strong>g <strong>in</strong>crease <strong>in</strong> average logg<strong>in</strong>g costs, or <strong>the</strong>y can try and f<strong>in</strong>d an outlet at marg<strong>in</strong>al cost for <strong>the</strong><br />
lower value logs. Provided this marg<strong>in</strong>al cost for transferr<strong>in</strong>g <strong>the</strong>se logs is higher than <strong>the</strong> net log<br />
export value <strong>of</strong> such low value logs, <strong>the</strong> outcome will <strong>in</strong>crease overall pr<strong>of</strong>it.<br />
Veneer production (particularly core veneer) is able to utilise a number <strong>of</strong> low value “white”<br />
non-durable hardwood species (plus short/certa<strong>in</strong> defect logs <strong>of</strong> o<strong>the</strong>r species) that are not<br />
suitable for export. The Panakawa mill estimated that 15% <strong>of</strong> logs utilised are <strong>in</strong> this category.<br />
This aga<strong>in</strong> improves log recovery per hectare and lowers <strong>the</strong> average cost <strong>of</strong> logg<strong>in</strong>g;<br />
The construction <strong>of</strong> a large utilisation facility <strong>in</strong>creases <strong>the</strong> political leverage for future resource<br />
allocations <strong>of</strong> neighbour<strong>in</strong>g <strong>forest</strong> areas to <strong>the</strong> <strong>in</strong>cumbent concessionaire;<br />
PAGE 72
2001 FOREST REVENUE REVIEW<br />
The whole enterprise, resource rights plus process<strong>in</strong>g facilities, may be “packaged” and<br />
“positioned” <strong>in</strong> <strong>the</strong> market so that it may later be sold <strong>in</strong> toto as a go<strong>in</strong>g concern when market<br />
conditions improve. The presence <strong>of</strong> <strong>the</strong> veneer mill will <strong>in</strong>crease <strong>the</strong> overall capitalisation <strong>of</strong> <strong>the</strong><br />
resource if <strong>the</strong>re is a small change <strong>in</strong> market prices;<br />
A large scale veneer process<strong>in</strong>g facility largely overcomes <strong>the</strong> freight cost disadvantages <strong>of</strong> rural<br />
based facilities <strong>in</strong> PNG, as <strong>the</strong> output is shipped <strong>in</strong> large consignments utilis<strong>in</strong>g direct shipp<strong>in</strong>g<br />
charter vessels. Sawn timber exports by comparison, are normally transhipped to Port Moresby<br />
or Lae for export <strong>in</strong> smaller consignments on regular scheduled ships.<br />
PAGE 73
PART 5 RESOURCE RENT<br />
5.1 INTRODUCTION<br />
2001 FOREST REVENUE REVIEW<br />
Resource rent is an economic term that expla<strong>in</strong>s <strong>the</strong> economic value <strong>of</strong> a resource. With<strong>in</strong> <strong>the</strong> <strong>forest</strong><br />
<strong>in</strong>dustry resource rent is commonly def<strong>in</strong>ed as <strong>the</strong> difference between <strong>the</strong> sales value <strong>of</strong> <strong>the</strong><br />
commercially attractive logs with<strong>in</strong> a <strong>forest</strong> and <strong>the</strong> cost <strong>of</strong> logg<strong>in</strong>g. These logg<strong>in</strong>g costs are broadly<br />
def<strong>in</strong>ed to <strong>in</strong>clude both operat<strong>in</strong>g and capital costs. The capital cost is <strong>in</strong> turn calculated to <strong>in</strong>clude an<br />
appropriate return to <strong>the</strong> logger on <strong>the</strong>ir <strong>in</strong>vestment, be<strong>in</strong>g <strong>the</strong> normal rate <strong>of</strong> return earned <strong>in</strong> <strong>the</strong><br />
economy adjusted for <strong>the</strong> risk specific to <strong>the</strong> logg<strong>in</strong>g sector. The resource rent so def<strong>in</strong>ed is also<br />
called <strong>the</strong> stumpage value or an above-normal or excess pr<strong>of</strong>it.<br />
In broad terms resource rent can arise from <strong>the</strong> scarcity <strong>of</strong> a product or <strong>the</strong> quality <strong>of</strong> one resource<br />
relative to o<strong>the</strong>r resources. A scare timber product can command a price above <strong>the</strong> cost <strong>of</strong> harvest<strong>in</strong>g<br />
if demand is sufficiently high. And a resource that has a lower harvest<strong>in</strong>g cost than <strong>the</strong> marg<strong>in</strong>al<br />
resource (be<strong>in</strong>g <strong>the</strong> highest cost resource harvested) will also earn a resource rent.<br />
A key po<strong>in</strong>t from this simple def<strong>in</strong>ition <strong>of</strong> resource rent is that <strong>the</strong>re is no resource rent when <strong>the</strong> sales<br />
price equals <strong>the</strong> cost <strong>of</strong> logg<strong>in</strong>g. When <strong>the</strong> sales price equals <strong>the</strong> cost <strong>of</strong> logg<strong>in</strong>g, <strong>the</strong> logger has an<br />
<strong>in</strong>centive to log. After all <strong>the</strong>y recover all <strong>the</strong>ir costs. However <strong>the</strong> logger could not afford to pay<br />
anyth<strong>in</strong>g for <strong>the</strong> timber logged. Any such payment would reduce pr<strong>of</strong>its below a normal level. This<br />
would see potential entrants stay away from <strong>the</strong> <strong>in</strong>dustry and exist<strong>in</strong>g loggers leave <strong>the</strong> sector over<br />
time and <strong>in</strong>vest <strong>the</strong>ir funds elsewhere <strong>in</strong> <strong>the</strong> economy (where <strong>the</strong>y can earn <strong>the</strong> normal rate <strong>of</strong> return).<br />
The resource owner can only charge for <strong>the</strong> logs and ensure logg<strong>in</strong>g over <strong>the</strong> long term when <strong>the</strong>re is<br />
resource rent. That is, over <strong>the</strong> long term <strong>the</strong> resource owner can only charge when <strong>the</strong> sales price<br />
exceeds <strong>the</strong> cost <strong>of</strong> logg<strong>in</strong>g. The level <strong>of</strong> resource rent can be thought <strong>of</strong> as sett<strong>in</strong>g <strong>the</strong> upper limit on<br />
<strong>the</strong> charge or price set by <strong>the</strong> resource owner as <strong>the</strong> price charged by <strong>the</strong> owner cannot exceed <strong>the</strong><br />
level <strong>of</strong> resource rent if logg<strong>in</strong>g is to cont<strong>in</strong>ue over <strong>the</strong> long term. If <strong>the</strong> price exceeds <strong>the</strong> level <strong>of</strong><br />
resource rent <strong>the</strong> pr<strong>of</strong>its <strong>of</strong> <strong>the</strong> logger will be reduced below a normal level and logg<strong>in</strong>g will ei<strong>the</strong>r<br />
decl<strong>in</strong>e or not take place at all.<br />
If <strong>the</strong> resource owner set a price for timber less than <strong>the</strong> resource rent, <strong>the</strong> logger would earn more<br />
than a normal rate <strong>of</strong> return (as provided for <strong>in</strong> <strong>the</strong> calculated cost <strong>of</strong> logg<strong>in</strong>g). In a simple model <strong>the</strong><br />
logger only needs a normal rate <strong>of</strong> return to be attracted to <strong>the</strong> <strong>in</strong>dustry, so <strong>the</strong> resource owner would<br />
be giv<strong>in</strong>g away too much.<br />
Resource rent is a concept that attracts attention because it provides a guide as to <strong>the</strong> level <strong>of</strong> charges<br />
that should be paid by logg<strong>in</strong>g companies. 2 This section provides estimates <strong>of</strong> <strong>the</strong> level <strong>of</strong> resource<br />
rent earned <strong>in</strong> <strong>the</strong> <strong>in</strong>dustry and how this rent has been distributed over time. These estimates provide<br />
a precursor to a discussion <strong>of</strong> an appropriate distribution <strong>of</strong> rent and means for distribut<strong>in</strong>g that rent to<br />
land owners, logg<strong>in</strong>g companies and government.<br />
Subsequent sections <strong>of</strong> this report extend <strong>the</strong> above simple explanation <strong>of</strong> resource rent. In particular,<br />
later sections expla<strong>in</strong> why <strong>the</strong> economic value <strong>of</strong> a <strong>forest</strong> resource is broader than just its f<strong>in</strong>ancial<br />
value as def<strong>in</strong>ed above. Recognition <strong>of</strong> <strong>the</strong> non-f<strong>in</strong>ancial values <strong>of</strong> a <strong>forest</strong> means that a deeper<br />
analysis is required, and a broader range <strong>of</strong> considerations comes <strong>in</strong>to play.<br />
2 The resource rent concept has figured prom<strong>in</strong>ently <strong>in</strong> <strong>the</strong> previous reports on <strong>the</strong> <strong>forest</strong> <strong>revenue</strong> <strong>system</strong>. See for example<br />
Shedden Agribus<strong>in</strong>ess (1991, p 49-93), Fortech (1998b), General Woods and Veneers Consultants International,<br />
Nawitka Resource Consultants (1994, pp 5-8) and Levantis and Livernois (1998). Hyde and Sedjo (1992) and V<strong>in</strong>cent<br />
(1990) also provide a good discussion <strong>of</strong> <strong>the</strong> resource rent concept as applied <strong>in</strong> <strong>forest</strong>ry.<br />
PAGE 74
5.2 THE FOREST REVENUE SYSTEM AND RESOURCE RENT<br />
2001 FOREST REVENUE REVIEW<br />
The <strong>forest</strong> <strong>revenue</strong> <strong>system</strong> has two important roles. The most obvious role is <strong>the</strong> distribution <strong>of</strong> <strong>the</strong><br />
<strong>revenue</strong> from logg<strong>in</strong>g. A second important role is <strong>the</strong> encouragement <strong>of</strong> <strong>the</strong> desired rate and form <strong>of</strong><br />
logg<strong>in</strong>g. A <strong>revenue</strong> <strong>system</strong> can be used to send signals to landowners and government about how <strong>the</strong><br />
sector should be evolv<strong>in</strong>g over time <strong>in</strong> response to external market factors and <strong>the</strong> chang<strong>in</strong>g needs <strong>of</strong><br />
<strong>the</strong> nation. A <strong>revenue</strong> <strong>system</strong> can be used as a force for efficiency and positive change by, for<br />
example, discourag<strong>in</strong>g logg<strong>in</strong>g <strong>of</strong> areas where <strong>the</strong> true, full cost to <strong>the</strong> community <strong>of</strong> logg<strong>in</strong>g is very<br />
high (such as <strong>in</strong> fragile habitats with high conservation value).<br />
The resource rent concept can be used to develop an understand<strong>in</strong>g <strong>of</strong> how well <strong>the</strong> <strong>revenue</strong> <strong>system</strong><br />
performs <strong>the</strong>se roles.<br />
If charges are too low, loggers will have an <strong>in</strong>centive to over exploit <strong>the</strong> resource. Whe<strong>the</strong>r <strong>the</strong>y are<br />
able to do so will depend on <strong>the</strong> constra<strong>in</strong>ts imposed by <strong>the</strong> regulatory regime <strong>of</strong> <strong>the</strong> Papua New<br />
Gu<strong>in</strong>ea <strong>Forest</strong> Authority. For some time <strong>the</strong> maximum level <strong>of</strong> logg<strong>in</strong>g allowed under timber permits<br />
etc has exceeded <strong>the</strong> susta<strong>in</strong>able level. This suggests that if <strong>the</strong> <strong>forest</strong> <strong>revenue</strong> <strong>system</strong> had provided<br />
too much rent to logg<strong>in</strong>g companies, <strong>the</strong>re would have been over-logg<strong>in</strong>g.<br />
Ideally taxes and charges should be levied <strong>in</strong> such a way as to ensure all commercial trees are logged<br />
(subject to all non-f<strong>in</strong>ancial costs <strong>of</strong> logg<strong>in</strong>g be<strong>in</strong>g met). If for example a tax were set at K10 per<br />
cubic metre, logg<strong>in</strong>g companies would tend to leave unlogged trees with a resource rent <strong>of</strong> less than<br />
K10 per cubic metre (i.e. any log with a price K10 per cubic metre above <strong>the</strong> logg<strong>in</strong>g cost). This is<br />
because, once <strong>the</strong> logg<strong>in</strong>g companies pay <strong>the</strong> tax, <strong>the</strong>y would be unable to cover all <strong>the</strong>ir costs. In<br />
practical terms this would tend to mean some o<strong>the</strong>rwise commercially viable <strong>forest</strong> areas would<br />
rema<strong>in</strong> unlogged or see certa<strong>in</strong> species or quality <strong>of</strong> trees left stand<strong>in</strong>g after an area has been logged.<br />
For <strong>the</strong> commercial value <strong>of</strong> <strong>the</strong> <strong>forest</strong> to be maximised, taxes and charges on each tree should be no<br />
more than <strong>the</strong> level <strong>of</strong> resource rent available from that tree.<br />
There is an important caveat on this conclusion. A <strong>forest</strong> has alternative uses and values over and<br />
above <strong>the</strong> commercial value <strong>of</strong> <strong>the</strong> timber. As logg<strong>in</strong>g reduces <strong>the</strong> value <strong>of</strong> a <strong>forest</strong> (e.g. as a source<br />
<strong>of</strong> food), charges should be high enough to at least compensate for <strong>the</strong> lost alternative uses and<br />
environmental values. If not, <strong>the</strong> resource is under-valued and too much logg<strong>in</strong>g will take place.<br />
The <strong>forest</strong> <strong>revenue</strong> <strong>system</strong> distributes <strong>the</strong> return from logg<strong>in</strong>g amongst landowners, government and<br />
logg<strong>in</strong>g companies. With<strong>in</strong> Papua New Gu<strong>in</strong>ea landowners receive most <strong>of</strong> <strong>the</strong>ir logg<strong>in</strong>g <strong>revenue</strong> via<br />
royalties and <strong>the</strong> landowners premium. In most cases logg<strong>in</strong>g companies also make a payment <strong>in</strong> <strong>the</strong><br />
form <strong>of</strong> <strong>in</strong>frastructure development. The National Government receives its <strong>revenue</strong> via <strong>the</strong> export<br />
duty, company taxes and a number <strong>of</strong> smaller levies. In some cases Prov<strong>in</strong>cial Governments receive a<br />
small levy to help fund <strong>in</strong>frastructure. Logg<strong>in</strong>g companies receive that share <strong>of</strong> <strong>the</strong> resource rent left<br />
over after <strong>the</strong>se payments are made to <strong>the</strong> government and landowners.<br />
In consider<strong>in</strong>g <strong>the</strong> distribution <strong>of</strong> <strong>the</strong> resource rent, our focus is on <strong>the</strong> largest <strong>revenue</strong> items be<strong>in</strong>g<br />
export duties, landowner royalties, <strong>the</strong> landowner premium and <strong>the</strong> residual left for logg<strong>in</strong>g<br />
companies.<br />
The <strong>in</strong>terpretation <strong>of</strong> <strong>the</strong> export duty as a means <strong>of</strong> distribut<strong>in</strong>g resource rent has important<br />
implications. The <strong>in</strong>ternational ‘norm’ is that export duties are generally seen as undesirable as <strong>the</strong>y<br />
constitute a tax on bus<strong>in</strong>ess activity and reduce <strong>the</strong> <strong>in</strong>ternational competitiveness <strong>of</strong> an economy.<br />
They are <strong>in</strong>consistent with <strong>the</strong> direction <strong>of</strong> tax reform <strong>in</strong> Papua New Gu<strong>in</strong>ea which has recently seen<br />
<strong>the</strong> reduction <strong>of</strong> tariffs and <strong>the</strong> <strong>in</strong>troduction <strong>of</strong> <strong>the</strong> VAT to <strong>in</strong>crease <strong>the</strong> economic efficiency <strong>of</strong> <strong>the</strong> tax<br />
PAGE 75
2001 FOREST REVENUE REVIEW<br />
<strong>system</strong> by reduc<strong>in</strong>g taxes on bus<strong>in</strong>ess activity and plac<strong>in</strong>g more reliance on taxes on consumption. 3<br />
But <strong>the</strong> export duty on <strong>the</strong> <strong>forest</strong> sector is a special case as it is a tax on <strong>the</strong> resource rent <strong>of</strong> <strong>the</strong> sector<br />
and such a tax is justifiable from an economic perspective. 4 This <strong>review</strong> <strong>in</strong>terprets <strong>the</strong> export duty <strong>in</strong><br />
<strong>the</strong>se terms. 5<br />
5.3 THE RESOURCE RENT ON LOG EXPORTS (IN THE ABSENCE OF TRANSFER PRICING)<br />
This section presents estimates <strong>of</strong> <strong>the</strong> level <strong>of</strong> resource rent generated by <strong>the</strong> logg<strong>in</strong>g sector and <strong>the</strong><br />
distribution <strong>of</strong> that rent assum<strong>in</strong>g <strong>the</strong>re is no transfer pric<strong>in</strong>g. The potential effects <strong>of</strong> allow<strong>in</strong>g for <strong>the</strong><br />
presence <strong>of</strong> transfer pric<strong>in</strong>g are considered <strong>in</strong> <strong>the</strong> summary <strong>of</strong> <strong>the</strong> Review’s ma<strong>in</strong> f<strong>in</strong>d<strong>in</strong>gs at <strong>the</strong> end<br />
<strong>of</strong> <strong>the</strong> Report.<br />
The 1990s saw a very large rise <strong>in</strong> <strong>the</strong> US$ price <strong>of</strong> logs dur<strong>in</strong>g 1993. US$ prices rema<strong>in</strong>ed high over<br />
much <strong>of</strong> 1994 but <strong>the</strong>n eased substantially by 1998, return<strong>in</strong>g to <strong>the</strong> levels seen before 1993 (see<br />
Figure 5.1). The fall <strong>in</strong> <strong>the</strong> value <strong>of</strong> <strong>the</strong> k<strong>in</strong>a s<strong>in</strong>ce 1994 has seen k<strong>in</strong>a prices rema<strong>in</strong> very high despite<br />
<strong>the</strong> fall <strong>in</strong> <strong>the</strong> US$ price.<br />
The large rise <strong>in</strong> <strong>the</strong> US$ price helped trigger a surge <strong>in</strong> log exports. Log exports rose to 3 million m 3<br />
<strong>in</strong> 1994, more than twice <strong>the</strong> typical level seen over <strong>the</strong> previous ten years. Log exports trended down<br />
over <strong>the</strong> second half <strong>of</strong> 1990s, but none<strong>the</strong>less rema<strong>in</strong>ed high relative to <strong>the</strong>ir historical levels. The<br />
most recent data suggest that <strong>in</strong>dustry activity has s<strong>of</strong>tened over 2001. Log exports <strong>in</strong> <strong>the</strong> n<strong>in</strong>e<br />
months to September 2001 were 1,145,000 m 3 compared to 1,440,000 m 3 <strong>in</strong> <strong>the</strong> same period <strong>of</strong> <strong>the</strong><br />
previous year.<br />
FIGURE 5.1 PAPUA NEW GUINEA LOG EXPORT VOLUMES AND AVERAGE PRICES<br />
'000 cubic metres<br />
3,500<br />
3,000<br />
2,500<br />
2,000<br />
1,500<br />
1,000<br />
500<br />
0<br />
Export volumes<br />
1985 1988 1991 1994 1997 2000<br />
Per cubic metre<br />
250<br />
200<br />
150<br />
100<br />
50<br />
0<br />
K<strong>in</strong>a FOB price<br />
US$ FOB price<br />
1985 1988 1991 1994 1997 2000<br />
3<br />
See Bogan et al (2000), World Bank (1999) and Economic Insights (1999) for an overview <strong>of</strong> recent tax reforms.<br />
4<br />
General Woods and Veneers Consultants International and Nawitka Resource Consultants (1994 p.16) argue that <strong>the</strong><br />
export tax has <strong>the</strong> effect <strong>of</strong> reduc<strong>in</strong>g <strong>the</strong> domestic price <strong>of</strong> logs by <strong>the</strong> amount <strong>of</strong> <strong>the</strong> tax (because <strong>the</strong> logger is prepared<br />
to sell at a price found as <strong>the</strong> export price less <strong>the</strong> tax). In this way <strong>the</strong>y argue that <strong>the</strong> export tax provides a subsidy to<br />
<strong>the</strong> local timber market and consequently is <strong>in</strong>efficient <strong>in</strong> an economic sense. This argument requires <strong>the</strong> local timber<br />
market to be part <strong>of</strong> <strong>the</strong> world timber market such that <strong>the</strong> world price (adjusted for <strong>the</strong> tax and transport costs) sets <strong>the</strong><br />
local price <strong>of</strong> timber. For reasons developed later, <strong>the</strong> Review Team do not see this as <strong>the</strong> case and argue that <strong>the</strong> local<br />
price <strong>of</strong> timber is primarily determ<strong>in</strong>ed by factors o<strong>the</strong>r than demand and supply conditions <strong>in</strong> world markets.<br />
Consequently <strong>the</strong> efficiency cost argument is not seen as relevant.<br />
5<br />
The terms <strong>of</strong> reference for <strong>the</strong> <strong>review</strong> provided <strong>in</strong> Annex E present a similar <strong>in</strong>terpretation <strong>of</strong> <strong>the</strong> export duty.<br />
PAGE 76
2001 FOREST REVENUE REVIEW<br />
Note: Export volumes for 2001 are an estimate based on data for <strong>the</strong> first 9 months <strong>of</strong> <strong>the</strong> year.<br />
Source: Annex A<br />
Previous reports have po<strong>in</strong>ted to <strong>the</strong> large pr<strong>of</strong>its made by <strong>the</strong> logg<strong>in</strong>g companies <strong>in</strong> <strong>the</strong> early 1990s.<br />
For example, calculations presented <strong>in</strong> Duncan (1995) concluded that <strong>the</strong> resource rent rose sharply <strong>in</strong><br />
1993 and that <strong>the</strong> logg<strong>in</strong>g companies captured most <strong>of</strong> <strong>the</strong> <strong>in</strong>crease (p.18). Our calculations <strong>of</strong> <strong>the</strong><br />
level <strong>of</strong> resource rent earned <strong>in</strong> <strong>the</strong> <strong>in</strong>dustry reach a similar conclusion. This raises <strong>the</strong> concern that<br />
<strong>the</strong> very high level <strong>of</strong> logg<strong>in</strong>g seen <strong>in</strong> 1993 and 1994, which was well above <strong>the</strong> susta<strong>in</strong>able level, was<br />
<strong>in</strong> part a consequence <strong>of</strong> <strong>the</strong> <strong>revenue</strong> <strong>system</strong> fail<strong>in</strong>g to set taxes and charges high enough as prices<br />
rose.<br />
Our best estimates <strong>of</strong> <strong>the</strong> actual level <strong>of</strong> resource rent earned on export logs are provided <strong>in</strong> Figure<br />
5.2. We estimate that, assum<strong>in</strong>g <strong>the</strong>re is no transfer pric<strong>in</strong>g, <strong>the</strong> level <strong>of</strong> resource rent was reasonably<br />
low up until 1992 <strong>the</strong>n rose sharply as both US$ prices and export volumes rose. S<strong>in</strong>ce <strong>the</strong>n <strong>the</strong>re has<br />
been a downward trend <strong>in</strong> <strong>the</strong> resource rent measured. In US$ terms prices have fallen and costs per<br />
cubic metre have been reasonably stable, so <strong>the</strong> resource rent per cubic metre has decl<strong>in</strong>ed. In k<strong>in</strong>a<br />
terms, <strong>the</strong> fall <strong>in</strong> k<strong>in</strong>a has kept k<strong>in</strong>a prices high s<strong>in</strong>ce 1993. But most costs are denom<strong>in</strong>ated <strong>in</strong> foreign<br />
currencies and <strong>in</strong> k<strong>in</strong>a terms costs have risen substantially. 6 The result is that <strong>the</strong> level <strong>of</strong> resource<br />
rent per cubic metre has decl<strong>in</strong>ed <strong>in</strong> k<strong>in</strong>a terms. The downward trend <strong>in</strong> export volumes has also<br />
contributed to <strong>the</strong> decl<strong>in</strong>e <strong>in</strong> <strong>the</strong> overall level <strong>of</strong> resource rent generated by log exports over <strong>the</strong> 1990s.<br />
As well as changes <strong>in</strong> <strong>the</strong> level <strong>of</strong> resource rent, <strong>the</strong>re have also been substantial changes <strong>in</strong> <strong>the</strong><br />
distribution <strong>of</strong> <strong>the</strong> resource rent.<br />
In <strong>the</strong> early 1990s, export duty rates were set as a share <strong>of</strong> <strong>the</strong> export value rang<strong>in</strong>g from 9 to 30 per<br />
cent depend<strong>in</strong>g on <strong>the</strong> species (Shedden Agribus<strong>in</strong>ess, 1991, p.39). The Government was somewhat<br />
slow to <strong>in</strong>crease export duty rates as prices rose. They were <strong>in</strong>creased by 10 percentage po<strong>in</strong>ts <strong>in</strong><br />
1993, and a fur<strong>the</strong>r 13 percentage po<strong>in</strong>ts <strong>in</strong> March 1994 (Duncan, 1994, p.3). The delay <strong>in</strong> <strong>the</strong><br />
<strong>in</strong>crease <strong>in</strong> export duty rates provided logg<strong>in</strong>g companies a large <strong>in</strong>crease <strong>in</strong> pr<strong>of</strong>its, but <strong>the</strong><br />
Government <strong>the</strong>n recouped a substantial amount <strong>of</strong> this as it <strong>in</strong>creased <strong>the</strong> export duty rates. By 1995<br />
<strong>the</strong> Government was captur<strong>in</strong>g more resource rent than <strong>the</strong> logg<strong>in</strong>g companies. The Review Team’s<br />
estimates suggest that, assum<strong>in</strong>g <strong>the</strong>ir was no transfer pric<strong>in</strong>g, <strong>the</strong> Government has earned more<br />
resource rent than <strong>the</strong> logg<strong>in</strong>g companies s<strong>in</strong>ce <strong>the</strong>n, with <strong>the</strong> gap widen<strong>in</strong>g substantially <strong>in</strong> recent<br />
years.<br />
Over 1998 US$ prices cont<strong>in</strong>ued to fall and reduce <strong>the</strong> pr<strong>of</strong>itability <strong>of</strong> logg<strong>in</strong>g. This contributed to a<br />
substantial drop <strong>in</strong> export volumes. In November 1998 <strong>the</strong> Government reduced export duty rates by<br />
forego<strong>in</strong>g any duty on <strong>the</strong> log value up to K130 per cubic metre. Prior to this, a log worth K130 per<br />
cubic metre would have been subject to a duty <strong>of</strong> K29.50 per cubic metre, and a log worth more than<br />
this would have been subject to a duty <strong>of</strong> K29.50 per cubic metre plus a set percentage <strong>of</strong> <strong>the</strong> value<br />
above K130 per cubic metre (where <strong>the</strong> percentage rose from 55 to 70 per cent depend<strong>in</strong>g on log<br />
value).<br />
The reduction <strong>in</strong> export duty rates comb<strong>in</strong>ed with <strong>the</strong> lower export volumes saw total duty collections<br />
fall substantially over 1998. But <strong>the</strong> Government still cont<strong>in</strong>ued to capture more <strong>of</strong> <strong>the</strong> resource rent<br />
than <strong>the</strong> logg<strong>in</strong>g companies (assum<strong>in</strong>g <strong>the</strong>re was no transfer pric<strong>in</strong>g).<br />
The mid-1999 Budget Statement <strong>of</strong> <strong>the</strong> next Government re-<strong>in</strong>stated <strong>the</strong> previous export duty rates.<br />
Total export duty collections rose over 1999 as <strong>the</strong> higher duty rates came <strong>in</strong>to effect and as volumes<br />
and prices rose. Collections have s<strong>in</strong>ce eased. Based on <strong>revenue</strong> collections to <strong>the</strong> end <strong>of</strong> September,<br />
6<br />
Note that with <strong>revenue</strong> and most costs denom<strong>in</strong>ated <strong>in</strong> foreign currencies, predom<strong>in</strong>antly <strong>the</strong> US$, <strong>the</strong> logg<strong>in</strong>g <strong>in</strong>dustry is<br />
essentially a US$ <strong>in</strong>dustry.<br />
PAGE 77
2001 FOREST REVENUE REVIEW<br />
total collections for 2001 are likely to be <strong>in</strong> <strong>the</strong> order <strong>of</strong> K90 million. This compares to <strong>the</strong> 2001<br />
Budget estimate <strong>of</strong> K135 million.<br />
FIGURE 5.2 THE ACTUAL LEVEL OF RESOURCE RENT FROM LOG EXPORTS (IN THE ABSENCE OF TRANSFER<br />
PRICING)<br />
'000 K<strong>in</strong>a<br />
'000 K<strong>in</strong>a<br />
'000 US$<br />
600,000<br />
500,000<br />
400,000<br />
300,000<br />
200,000<br />
100,000<br />
400,000<br />
300,000<br />
200,000<br />
100,000<br />
0<br />
200,000<br />
150,000<br />
100,000<br />
50,000<br />
0<br />
-50,000<br />
-100,000<br />
-150,000<br />
0<br />
US$ export <strong>revenue</strong><br />
Logg<strong>in</strong>g costs<br />
1990 1992 1994 1996 1998 2000<br />
Resource rent<br />
1990 1992 1994 1996 1998 2000<br />
1990 1992 1994 1996 1998 2000<br />
Government<br />
payment<br />
Landowner<br />
payment<br />
Operator<br />
abovenormal<br />
pr<strong>of</strong>it<br />
Company<br />
tax<br />
PAGE 78
2001 FOREST REVENUE REVIEW<br />
Notes: Data for 2001 are an estimate based on data for <strong>the</strong> first 9 months <strong>of</strong> <strong>the</strong> year. The estimates assume<br />
<strong>the</strong>re is no transfer pric<strong>in</strong>g.<br />
Source: Review Team estimate based on <strong>the</strong> data <strong>of</strong> Annex A<br />
Figure 5.2 also presents aggregate estimates <strong>of</strong> <strong>the</strong> resource rent captured by <strong>the</strong> landowners.<br />
Landowners have typically earned <strong>the</strong> smallest share <strong>of</strong> <strong>the</strong> resource rent from export logs (assum<strong>in</strong>g<br />
<strong>the</strong>re is no transfer pric<strong>in</strong>g). Payments to landowners rose <strong>in</strong> 1993, but <strong>the</strong>y received far less <strong>of</strong> <strong>the</strong><br />
ga<strong>in</strong>s from <strong>the</strong> improvement <strong>in</strong> world prices than ei<strong>the</strong>r <strong>the</strong> Government or logg<strong>in</strong>g companies. But<br />
<strong>the</strong> payment has rema<strong>in</strong>ed reasonably stable over time <strong>in</strong> k<strong>in</strong>a terms, and landowners now receive<br />
more than <strong>the</strong> logg<strong>in</strong>g companies. The stability <strong>in</strong> k<strong>in</strong>a terms <strong>in</strong> <strong>the</strong> landowners’ payment is<br />
attributable to <strong>the</strong> nature <strong>of</strong> most payments – <strong>the</strong>y are set <strong>in</strong> k<strong>in</strong>a per cubic metre ra<strong>the</strong>r than be<strong>in</strong>g<br />
based on <strong>the</strong> value <strong>of</strong> exports.<br />
One implication <strong>of</strong> this analysis is that it is difficult to argue that <strong>the</strong> <strong>revenue</strong> <strong>system</strong> has given too<br />
much resource rent to logg<strong>in</strong>g companies <strong>in</strong> recent years. As shown at Figure 5.3, over <strong>the</strong> past 5<br />
years <strong>revenue</strong> collections by Government and landowners are estimated to have exceeded <strong>the</strong><br />
available resource rent (such that <strong>the</strong>re is a negative ratio <strong>of</strong> <strong>the</strong> payment to landowners to rent). This<br />
means that over recent years logg<strong>in</strong>g companies as-a-whole have not made a normal level <strong>of</strong> pr<strong>of</strong>it. 7<br />
A consequence is that is unlikely that <strong>the</strong> observed excess <strong>of</strong> <strong>the</strong> harvest rate over <strong>the</strong> susta<strong>in</strong>able yield<br />
is attributable to any adverse <strong>in</strong>centives to log created by <strong>the</strong> <strong>forest</strong> <strong>revenue</strong> <strong>system</strong> (such as appeared<br />
to exist <strong>in</strong> 1993 and <strong>in</strong>to 1994 when prices rose sharply but government and landowner charges did<br />
not).<br />
FIGURE 5.3 THE ESTIMATED PAST DISTRIBUTION OF RESOURCE RENT (IN THE ABSENCE OF TRANSFER<br />
PRICING)<br />
Ratio <strong>of</strong> payment to rent (per cent)<br />
100<br />
80<br />
60<br />
40<br />
20<br />
0<br />
-20<br />
-40<br />
Government Landowner Operator<br />
90 to 95<br />
96 to 01<br />
90 to 01<br />
7 The general trend <strong>in</strong> company pr<strong>of</strong>itability shown by <strong>the</strong>se estimates <strong>of</strong> resource rent was cross-checked aga<strong>in</strong>st <strong>the</strong><br />
f<strong>in</strong>ancial performance reported <strong>in</strong> a sample <strong>of</strong> tax returns for timber companies (key results were extracted by <strong>the</strong> IRC).<br />
The company tax-returns exam<strong>in</strong>ed showed a similar downward trend <strong>in</strong> pr<strong>of</strong>itability <strong>in</strong> recent years.<br />
PAGE 79
2001 FOREST REVENUE REVIEW<br />
Note: The payment to <strong>the</strong> operator presented <strong>in</strong> <strong>the</strong> figure is <strong>the</strong> estimated above-normal pr<strong>of</strong>it, be<strong>in</strong>g <strong>the</strong><br />
operator’s portion <strong>of</strong> resource rent. The negative above-normal pr<strong>of</strong>it seen from 1996 to 2001 (Sep)<br />
means that operators were unable to earn a normal pr<strong>of</strong>it over <strong>the</strong> period.<br />
Source: Review Team estimates based on <strong>the</strong> data <strong>of</strong> Annex A<br />
PAGE 80
2001 FOREST REVENUE REVIEW<br />
We emphasise that our calculations assume that <strong>the</strong>re is no transfer pric<strong>in</strong>g and that all exports are<br />
recorded at <strong>the</strong>ir correct value. If any <strong>of</strong> <strong>the</strong>se conditions did not hold, <strong>the</strong> picture on <strong>the</strong> level and<br />
distribution <strong>of</strong> resource rent could be very different to that presented above and <strong>the</strong> logg<strong>in</strong>g companies<br />
may <strong>in</strong> fact be earn<strong>in</strong>g adequate pr<strong>of</strong>its.<br />
The Review Team emphasises that <strong>the</strong> calculations assume no transfer pric<strong>in</strong>g through any avenue.<br />
The <strong>in</strong>vestigation <strong>in</strong> Part 3 demonstrated <strong>the</strong> existence <strong>of</strong> serious and unexpla<strong>in</strong>ed discrepancies <strong>in</strong> <strong>the</strong><br />
<strong>in</strong>ternational trade but did not prove <strong>the</strong>se were due to transfer pric<strong>in</strong>g, so <strong>the</strong> caveat rema<strong>in</strong>s <strong>in</strong> place.<br />
If this condition did not hold, <strong>the</strong> picture on <strong>the</strong> level and distribution <strong>of</strong> resource rent could have been<br />
and could still be different to that presented above and <strong>the</strong> logg<strong>in</strong>g companies might <strong>in</strong> fact have<br />
earned and could still be earn<strong>in</strong>g adequate pr<strong>of</strong>its.<br />
We have not been able to assess whe<strong>the</strong>r all exports are recorded at <strong>the</strong>ir correct value. SGS has<br />
advised <strong>the</strong>y have a high level <strong>of</strong> confidence <strong>in</strong> <strong>the</strong>ir monitor<strong>in</strong>g. However, we were advised <strong>of</strong> a<br />
recent case where a logg<strong>in</strong>g ship ran aground <strong>in</strong> which <strong>the</strong> claim submitted to <strong>the</strong> <strong>in</strong>surance company<br />
reported a shipment value around twice that <strong>of</strong>ficially recorded. We are also aware <strong>of</strong> an <strong>of</strong>ficial<br />
concern that <strong>the</strong>re is an <strong>in</strong>crease <strong>in</strong> <strong>the</strong> relative importance <strong>of</strong> lower valued logs. The concern is that<br />
this share has <strong>in</strong>creased as logg<strong>in</strong>g companies have downgraded <strong>the</strong> classification <strong>of</strong> <strong>the</strong>ir logs so as to<br />
substantially lower <strong>the</strong> export duty payable (<strong>the</strong> export duty on low grade logs is much lower because<br />
<strong>the</strong> deemed FOB value <strong>of</strong> low grade logs is substantially lower than for high grade logs).<br />
Figure 5.4 presents <strong>the</strong> share <strong>of</strong> log export volumes accounted for by <strong>the</strong> export logs classified as low<br />
grade (which are meant to be old or poorly formed logs <strong>of</strong> any species). The share <strong>of</strong> low-grade logs<br />
<strong>in</strong> total exports has been on an upward trend s<strong>in</strong>ce October 2001, giv<strong>in</strong>g some support to <strong>the</strong> <strong>of</strong>ficial<br />
concern. However, <strong>the</strong>re was a major correction <strong>in</strong> September 2001. If <strong>the</strong> upward trend were to reemerge,<br />
it would be a cause <strong>of</strong> concern.<br />
FIGURE 5.4 THE SHARE OF LOG EXPORTS ACCOUNTED FOR BY LOW GRADE LOGS<br />
Share <strong>of</strong> total log export volumes<br />
30<br />
25<br />
20<br />
15<br />
10<br />
5<br />
0<br />
Oct '00 Dec '00 Feb '01 Apr '01<br />
Month<br />
Jun '01 Aug 01<br />
Source: Review Team estimates based on data supplied by SGS<br />
PAGE 81
5.4 ARE LOG EXPORT DUTIES TOO HIGH?<br />
2001 FOREST REVENUE REVIEW<br />
Our calculations have concluded that <strong>the</strong> logg<strong>in</strong>g sector has consistently generated resource rent, and<br />
cont<strong>in</strong>ues to do so even at current low world prices. But it is also concluded that <strong>the</strong> logg<strong>in</strong>g<br />
companies have failed to earn a normal rate <strong>of</strong> return over recent years (assum<strong>in</strong>g <strong>the</strong>re is no transfer<br />
pric<strong>in</strong>g or under-report<strong>in</strong>g). Our calculations suggest that <strong>the</strong> substantial <strong>revenue</strong> collected by <strong>the</strong><br />
Government from export duties is prevent<strong>in</strong>g <strong>the</strong> logg<strong>in</strong>g companies earn<strong>in</strong>g a normal rate <strong>of</strong> return<br />
(assum<strong>in</strong>g <strong>the</strong>re is no transfer pric<strong>in</strong>g or under-report<strong>in</strong>g).<br />
As a general rule export duties should not be so high as to prevent a logg<strong>in</strong>g company earn<strong>in</strong>g a<br />
normal rate <strong>of</strong> return over time. As discussed above, <strong>the</strong> export duty, as a tax on resource rent, should<br />
only aim to capture a share <strong>of</strong> <strong>the</strong> resource rent. Our calculations conclude that at present <strong>the</strong> level <strong>of</strong><br />
export duty collected is greater than <strong>the</strong> available resource rent. This, comb<strong>in</strong>ed with <strong>the</strong> payments to<br />
landowners, means logg<strong>in</strong>g companies are <strong>in</strong> total unable to earn a normal level <strong>of</strong> pr<strong>of</strong>its (assum<strong>in</strong>g<br />
<strong>the</strong>re is no transfer pric<strong>in</strong>g or under-report<strong>in</strong>g).<br />
The current situation is summarised <strong>in</strong> Figure 5.5. This shows how on average <strong>the</strong> estimated total<br />
costs paid by <strong>the</strong> logg<strong>in</strong>g companies exceed <strong>the</strong> average price. The issue <strong>of</strong> how operators are able to<br />
rema<strong>in</strong> <strong>in</strong> bus<strong>in</strong>ess and still try to be <strong>in</strong>ternationally competitive even at current low prices has been<br />
addressed <strong>in</strong> section 4.3.<br />
FIGURE 5.5 THE CURRENT LEVEL OF COSTS AND REVENUE<br />
US$ per cubic metre<br />
80<br />
60<br />
40<br />
20<br />
0<br />
Export<br />
Land owner<br />
Depreciation<br />
Production<br />
Current costs and charges Export<br />
Notes: The estimates assume <strong>the</strong>re is no transfer pric<strong>in</strong>g or under-report<strong>in</strong>g <strong>of</strong> exports.<br />
Source: Review Team estimates based on <strong>the</strong> data <strong>of</strong> Annex A.<br />
Our calculations <strong>of</strong> <strong>the</strong> f<strong>in</strong>ancial position <strong>of</strong> logg<strong>in</strong>g companies provide only one means <strong>of</strong> assess<strong>in</strong>g<br />
whe<strong>the</strong>r logg<strong>in</strong>g companies are pr<strong>of</strong>itable. Given <strong>the</strong> central importance <strong>of</strong> <strong>the</strong> pr<strong>of</strong>itability <strong>of</strong> logg<strong>in</strong>g<br />
operations to an assessment as to whe<strong>the</strong>r export duties are too high, alternative ways <strong>of</strong> assess<strong>in</strong>g<br />
pr<strong>of</strong>itability have also been considered.<br />
One alternative is to assess <strong>the</strong> current level <strong>of</strong> <strong>in</strong>dustry activity. As shown <strong>in</strong> Figure 5.6, log exports<br />
are now below <strong>the</strong> pre-1993 level and this may be seen as a sign that pr<strong>of</strong>itability has decl<strong>in</strong>ed.<br />
PAGE 82
2001 FOREST REVENUE REVIEW<br />
Certa<strong>in</strong>ly <strong>in</strong>dustry has advised that logg<strong>in</strong>g operations are be<strong>in</strong>g cut back because losses are be<strong>in</strong>g<br />
<strong>in</strong>curred. It also needs to be kept <strong>in</strong> m<strong>in</strong>d that <strong>the</strong>re has been a rapid decl<strong>in</strong>e <strong>in</strong> recent years <strong>in</strong> <strong>the</strong><br />
availability <strong>of</strong> logs as exist<strong>in</strong>g allocations have been fully logged (see Figure 5.6). The decl<strong>in</strong><strong>in</strong>g<br />
availability would probably have reduced logg<strong>in</strong>g rates regardless <strong>of</strong> <strong>the</strong> level <strong>of</strong> pr<strong>of</strong>itability. This<br />
means that <strong>the</strong> slow down <strong>in</strong> logg<strong>in</strong>g does not <strong>in</strong> itself provide clear evidence that pr<strong>of</strong>itability is low.<br />
The case <strong>of</strong> West New Brita<strong>in</strong> provides a good illustrates <strong>of</strong> <strong>the</strong> issue. Over <strong>the</strong> year 2000 <strong>the</strong><br />
prov<strong>in</strong>ce exported around 400,000 cubic metres <strong>of</strong> logs or 20 per cent <strong>of</strong> total log exports by volume.<br />
But <strong>in</strong> <strong>the</strong> 9 months to September 2001, <strong>the</strong> prov<strong>in</strong>ce only exported 180,000 cubic metres or 16 per<br />
cent <strong>of</strong> total log exports by volume. The Prov<strong>in</strong>cial Office <strong>of</strong> <strong>the</strong> <strong>Forest</strong> Service advised that as <strong>of</strong><br />
October 2001 <strong>the</strong>re were 7 large logg<strong>in</strong>g camps operat<strong>in</strong>g <strong>in</strong> <strong>the</strong> prov<strong>in</strong>ce, with 9 large logg<strong>in</strong>g camps<br />
hav<strong>in</strong>g shut down over <strong>the</strong> past 2 to 3 years. Eight <strong>of</strong> <strong>the</strong>se shut down due to resource depletion, with<br />
only one shutt<strong>in</strong>g down due to low pr<strong>of</strong>its. 8<br />
FIGURE 5.6 THE ACTUAL AND POTENTIAL LEVEL OF THE LOG HARVEST<br />
Million cubic metres<br />
8<br />
6<br />
4<br />
2<br />
0<br />
1993 1996 1999 2002<br />
Year<br />
2005 2008 2011<br />
Source: Papua New Gu<strong>in</strong>ea <strong>Forest</strong> Service<br />
Allocated Projects<br />
Susta<strong>in</strong>able Cut<br />
Maximum Allowable<br />
Cut<br />
Estimated Timber<br />
Permit Harvest<br />
Estimated National<br />
Harvest<br />
Estimated National<br />
Susta<strong>in</strong>able Cut<br />
The rate <strong>of</strong> re-<strong>in</strong>vestment <strong>in</strong> an <strong>in</strong>dustry is <strong>of</strong>ten a good <strong>in</strong>dicator <strong>of</strong> <strong>the</strong> state <strong>of</strong> pr<strong>of</strong>itability. In<br />
general firms will only re-<strong>in</strong>vest when pr<strong>of</strong>it expectations are favourable, and when <strong>the</strong>y are not re<strong>in</strong>vest<strong>in</strong>g<br />
it can reflect a poor outlook for pr<strong>of</strong>its. There has been a sharp drop-<strong>of</strong>f <strong>in</strong> recent years <strong>in</strong><br />
<strong>the</strong> purchases <strong>of</strong> heavy equipment used <strong>in</strong> logg<strong>in</strong>g (see Figure 5.7). It is understood that such<br />
equipment typically has a work<strong>in</strong>g life <strong>of</strong> around 5 years. Very few <strong>new</strong> units have been purchased <strong>in</strong><br />
<strong>the</strong> last 4 years, suggest<strong>in</strong>g much <strong>of</strong> <strong>the</strong> equipment <strong>in</strong> use has reached or exceeded its normal work<strong>in</strong>g<br />
life. 9 Such a run-down <strong>in</strong> capacity is seen as a good <strong>in</strong>dicator that <strong>in</strong>dustry pr<strong>of</strong>itability is poor.<br />
On balance we tend to <strong>the</strong> view that logg<strong>in</strong>g companies are unable to earn a normal level <strong>of</strong> pr<strong>of</strong>its<br />
given current export duty rates. This is <strong>in</strong> conflict with <strong>the</strong> general pr<strong>in</strong>ciple noted above that export<br />
duty rates should not be so high as to prevent a logg<strong>in</strong>g company earn<strong>in</strong>g a normal level <strong>of</strong> pr<strong>of</strong>its.<br />
8<br />
We note that as one <strong>of</strong> <strong>the</strong> most heavily logged prov<strong>in</strong>ces, West New Brita<strong>in</strong> is more exposed to a lack <strong>of</strong> resource<br />
availability than o<strong>the</strong>r prov<strong>in</strong>ces.<br />
9<br />
It is understood that <strong>the</strong>re has been an <strong>in</strong>crease <strong>in</strong> <strong>the</strong> rate <strong>of</strong> refurbishment <strong>of</strong> heavy equipment, but <strong>the</strong> number <strong>of</strong> units<br />
refurbished <strong>in</strong> relatively are small.<br />
PAGE 83
2001 FOREST REVENUE REVIEW<br />
That is, we conclude that current export duty rates are too high (assum<strong>in</strong>g <strong>the</strong>re is no transfer pric<strong>in</strong>g<br />
or under-report<strong>in</strong>g).<br />
FIGURE 5.7 PURCHASE OF NEW HEAVY EQUIPMENT BY THE LOGGING INDUSTRY<br />
Index (1993/94 = 100)<br />
160<br />
120<br />
80<br />
40<br />
0<br />
Over <strong>the</strong> last 4 years purchases<br />
have fallen by around 80 per<br />
cent<br />
94 95 96 97 98 99 00 01<br />
Year ended June<br />
Note: Data have been converted to an <strong>in</strong>dex <strong>in</strong> order to avoid disclos<strong>in</strong>g confidential <strong>in</strong>formation on <strong>the</strong><br />
actual number <strong>of</strong> units purchased.<br />
Source: Review Team estimate based on purchases <strong>of</strong> heavy equipment (exclud<strong>in</strong>g logg<strong>in</strong>g trucks) supplied<br />
by UMW Niug<strong>in</strong>i Limited and Hast<strong>in</strong>gs Deer<strong>in</strong>g.<br />
However, this conclusion does not automatically imply that a reduction <strong>in</strong> export duties is warranted<br />
immediately. It is important to consider developments <strong>in</strong> <strong>the</strong> level <strong>of</strong> taxation over time and <strong>the</strong> level<br />
<strong>of</strong> variable costs. We also emphasise that our conclusion is based on <strong>the</strong> assumption that <strong>the</strong>re is no<br />
transfer pric<strong>in</strong>g and no under-report<strong>in</strong>g.<br />
With respect to <strong>the</strong> variable cost issue, it is important to recognise that a logg<strong>in</strong>g company can operate<br />
at a loss and still have an <strong>in</strong>centive to ma<strong>in</strong>ta<strong>in</strong> logg<strong>in</strong>g rates. In economic terms, as a general<br />
pr<strong>in</strong>ciple as long as prices are high enough to cover variable costs and make some contribution to<br />
fixed costs it makes sense for a logger to cont<strong>in</strong>ue logg<strong>in</strong>g. In practice that means that over <strong>the</strong> short<br />
term <strong>revenue</strong> needs to be high enough to cover <strong>the</strong> cost <strong>of</strong> non-head <strong>of</strong>fice labour, fuel and<br />
stevedor<strong>in</strong>g and port charges, payments to landowners and export duties.<br />
We calculate that for a typical logg<strong>in</strong>g operation even current low prices are sufficient to cover <strong>the</strong>se<br />
variable costs. This suggests that ma<strong>in</strong>ta<strong>in</strong><strong>in</strong>g exist<strong>in</strong>g export duty rates may be unlikely to have a<br />
substantial adverse impact on <strong>the</strong> rate <strong>of</strong> logg<strong>in</strong>g over <strong>the</strong> short term. That said, given <strong>the</strong> variability<br />
<strong>in</strong> costs among operations we would expect that some <strong>in</strong>dividual operations are not cover<strong>in</strong>g variable<br />
costs.<br />
But current export duty rates are probably too high to ensure a susta<strong>in</strong>able <strong>in</strong>dustry over <strong>the</strong> long term.<br />
While it may be possible to ma<strong>in</strong>ta<strong>in</strong> current export duty rates for <strong>the</strong> short term, <strong>the</strong>y can be expected<br />
to eventually cause a problem and lead to <strong>in</strong>dustry contraction. This will occur as ei<strong>the</strong>r <strong>new</strong> entrants<br />
are deterred or as exist<strong>in</strong>g operations allow <strong>the</strong>ir productive capacity to decl<strong>in</strong>e (e.g. by mov<strong>in</strong>g<br />
equipment to o<strong>the</strong>r countries or by not replac<strong>in</strong>g equipment as it wears out).<br />
PAGE 84
5.5 THE RESOURCE RENT ON PROCESSED LOGS<br />
2001 FOREST REVENUE REVIEW<br />
A lack <strong>of</strong> data prevents detailed estimates <strong>of</strong> <strong>the</strong> resource rent on processed logs. None<strong>the</strong>less, some<br />
key issues can be explored us<strong>in</strong>g <strong>the</strong> f<strong>in</strong>ancial models <strong>of</strong> <strong>the</strong> typical process<strong>in</strong>g operations outl<strong>in</strong>ed <strong>in</strong><br />
Section 4.2.<br />
One <strong>of</strong> <strong>the</strong> key policy concerns is whe<strong>the</strong>r <strong>the</strong> process<strong>in</strong>g <strong>of</strong> logs that could be exported reduces <strong>the</strong><br />
value <strong>of</strong> a timber resource. This issue can be expla<strong>in</strong>ed by reference to <strong>the</strong> f<strong>in</strong>ancial analysis <strong>of</strong> a<br />
typical process<strong>in</strong>g operation as presented <strong>in</strong> Section 4.2. Processors do not pay export duty on <strong>the</strong> log<br />
<strong>in</strong>put to <strong>the</strong>ir operation and generally do not pay landowners royalty. The f<strong>in</strong>ancial analysis assumes<br />
<strong>the</strong> price for logs <strong>the</strong>y process is set at <strong>the</strong> cost <strong>of</strong> logg<strong>in</strong>g exclusive <strong>of</strong> <strong>the</strong>se charges. Processors can<br />
only afford to pay a higher price for <strong>the</strong>ir logs if <strong>the</strong> process<strong>in</strong>g operation is sufficiently pr<strong>of</strong>itable (i.e.<br />
is earn<strong>in</strong>g an a normal level <strong>of</strong> pr<strong>of</strong>its).<br />
A key test is whe<strong>the</strong>r <strong>the</strong> processor is able to pay a price that would provide <strong>the</strong> log owner <strong>the</strong> same<br />
resource rent that would be available if <strong>the</strong> timber was exported as a saw log. If this is not <strong>the</strong> case,<br />
<strong>the</strong>n rent has been dissipated (i.e. <strong>the</strong> owner receives less for <strong>the</strong>ir logs when diverted <strong>in</strong>to<br />
process<strong>in</strong>g). This means process<strong>in</strong>g subtracts value from <strong>the</strong> log.<br />
The analysis <strong>of</strong> typical process<strong>in</strong>g operations found that <strong>the</strong> large processors are unpr<strong>of</strong>itable at<br />
current prices and could not afford to pay more for <strong>the</strong> logs <strong>the</strong>y use. Even <strong>the</strong> smaller process<strong>in</strong>g<br />
operations have very limited capacity to pay more for <strong>the</strong> logs <strong>the</strong>y use. This is shown <strong>in</strong> Table 5.1<br />
that presents estimates <strong>of</strong> <strong>the</strong> export duty that, if paid, would, at current export prices, ensure a<br />
reasonable level <strong>of</strong> pr<strong>of</strong>itability. The sawmills could afford to pay some export duty, but <strong>the</strong> larger<br />
processors would actually need a subsidy (i.e. a negative export duty) to be pr<strong>of</strong>itable.<br />
Current export prices are low. They are 55 per cent <strong>of</strong> <strong>the</strong> average level seen s<strong>in</strong>ce 1993, or 70 per<br />
cent <strong>of</strong> <strong>the</strong> average level seen s<strong>in</strong>ce 1996. Table 5.1 also presents estimates <strong>of</strong> <strong>the</strong> export duty that<br />
could be paid if export prices were 25 per cent higher. At <strong>the</strong>se prices <strong>the</strong> sawmills could pay a<br />
substantial export duty, with <strong>the</strong> exception <strong>of</strong> <strong>the</strong> eco mill (which only sells locally and does not<br />
benefit from <strong>the</strong> assumed higher level <strong>of</strong> export prices). But <strong>the</strong> veneer factory could only afford to<br />
pay a low export duty and <strong>the</strong> plywood mill could not afford to pay any export duty on <strong>the</strong> log <strong>in</strong>put.<br />
We estimate <strong>the</strong> average level <strong>of</strong> resource rent at September 2001 prices to be positive but less than<br />
US$5 per cubic metre on average. If export prices were 25 per cent higher, we estimate <strong>the</strong> resource<br />
rent to be around US$15 to US$20 per cubic metre. Only <strong>the</strong> sawmills (exclud<strong>in</strong>g <strong>the</strong> eco-mill) could<br />
pay an export duty that would return to <strong>the</strong> owner <strong>the</strong> resource rent <strong>the</strong>y forego when <strong>the</strong>ir log is not<br />
exported. That is, only <strong>the</strong> sawmills would avoid <strong>the</strong> dissipation <strong>of</strong> rent. In contrast <strong>the</strong> veneer and<br />
plywood mills are found to be rent dissipat<strong>in</strong>g, with <strong>the</strong> problem most severe for <strong>the</strong> plywood mill.<br />
The f<strong>in</strong>ancial analysis estimates that 80 per cent or more <strong>of</strong> <strong>the</strong> logs that would be used <strong>in</strong> <strong>the</strong><br />
production <strong>of</strong> export veneer and export plywood would be <strong>of</strong> export grade. There would be a<br />
substantial loss <strong>of</strong> resource rent from such operations. The parties that pay <strong>the</strong> cost <strong>of</strong> this dissipation<br />
<strong>of</strong> resource rent are Government and <strong>the</strong> landowners as <strong>revenue</strong> foregone.<br />
In <strong>the</strong> case <strong>of</strong> sawmills, <strong>the</strong> rent that is not dissipated flows to <strong>the</strong> processor as pr<strong>of</strong>it. The presence <strong>of</strong><br />
export duty concessions and <strong>the</strong> absence <strong>of</strong> landowner premiums on most logs used <strong>in</strong> process<strong>in</strong>g<br />
means that <strong>the</strong> Government and landowners are without important mechanisms to ensure <strong>the</strong>y capture<br />
a share <strong>of</strong> <strong>the</strong> resource rent. The Government and landowners have recently collected too much <strong>of</strong> <strong>the</strong><br />
resource rent from export logs. But it also appears <strong>the</strong>y have not collected enough <strong>of</strong> <strong>the</strong> resource rent<br />
from <strong>the</strong> timber used <strong>in</strong> sawmills.<br />
PAGE 85
2001 FOREST REVENUE REVIEW<br />
TABLE 5.1 THE AFFORDABLE LEVEL OF EXPORT DUTY ON TIMBER PROCESSING OPERATIONS<br />
Affordable export duty<br />
Portable/<br />
relocatable<br />
eco-mill<br />
Small<br />
commercial<br />
mill<br />
Export duty <strong>in</strong> US$ per m3 <strong>of</strong> log <strong>in</strong>put<br />
Medium to<br />
large<br />
sawmill<br />
Integrated<br />
small<br />
sawmill<br />
Large export<br />
veneer mill<br />
Large export<br />
plywood mill<br />
- at current prices 3 3 7 28 -11 -27<br />
- if export prices were<br />
25 per cent higher<br />
3 28 29 33 9 -5<br />
Note: Calculated as <strong>the</strong> export duty that could be paid on log <strong>in</strong>put so as to ensure a 15 per cent rate <strong>of</strong><br />
return on <strong>in</strong>vestment.<br />
Source: Review Team estimates based on <strong>the</strong> f<strong>in</strong>ancial models presented <strong>in</strong> Part 4<br />
A separate issue is whe<strong>the</strong>r <strong>the</strong>re is resource rent on those logs processed <strong>in</strong>to timber products sold<br />
with<strong>in</strong> Papua New Gu<strong>in</strong>ea. A range <strong>of</strong> above factors lead us to <strong>the</strong> conclusion that <strong>in</strong> general <strong>the</strong>re is<br />
little if any resource rent earned on timber sold on <strong>the</strong> local market as processed product ⎯<br />
Few local buyers demand <strong>the</strong> same high quality as export markets, such that prices are well<br />
below export prices.<br />
We understand that <strong>in</strong> general timber sold locally is not <strong>of</strong> export grade because timber that can<br />
be exported is sold overseas <strong>in</strong> order to capture <strong>the</strong> higher overseas prices.<br />
Local timber prices are constra<strong>in</strong>ed by <strong>the</strong> low <strong>in</strong>comes and <strong>the</strong> low valued use <strong>of</strong> timber (most<br />
timber is used for structural purposes such as <strong>in</strong> house frames, floor<strong>in</strong>g and cladd<strong>in</strong>g).<br />
The presence <strong>of</strong> relatively widespread and low cost suppliers us<strong>in</strong>g small portable mills limits <strong>the</strong><br />
prices that <strong>the</strong> larger mills can sell <strong>the</strong>ir timber for.<br />
Timber prices are also kept down by <strong>the</strong> large potential supply <strong>of</strong> timber relative to demand. If<br />
prices were so high as to generate significant resource rent, <strong>new</strong> supplies would readily enter <strong>the</strong><br />
market from ei<strong>the</strong>r large or smaller suppliers and reduce <strong>the</strong> timber price. In addition, this would<br />
see all rent competed away. We understand <strong>the</strong> ability to br<strong>in</strong>g <strong>in</strong> additional sources <strong>of</strong> supply is<br />
relatively widespread, although <strong>the</strong>re would be some areas where <strong>the</strong> competitive constra<strong>in</strong>t is<br />
weak. 10<br />
10 And this can give rise to monopoly rents <strong>in</strong> some geographic markets. This is most likely where some timber is<br />
available locally but supplies are scarce, and <strong>the</strong> cost <strong>of</strong> transport<strong>in</strong>g timber from o<strong>the</strong>r areas is substantial.<br />
PAGE 86
2001 FOREST REVENUE REVIEW<br />
PART 6 AN ECONOMIC COST-BENEFIT ASSESSMENT OF<br />
PROCESSING<br />
6.1 INTRODUCTION<br />
Loggable <strong>forest</strong>s tend to be <strong>in</strong> areas with low population densities and little agricultural activity<br />
(hence <strong>the</strong> availability <strong>of</strong> timber). The high cost <strong>of</strong> transport<strong>in</strong>g logs means process<strong>in</strong>g operations are<br />
normally located close to logg<strong>in</strong>g areas, and this means that <strong>forest</strong> process<strong>in</strong>g operations tend to be<br />
located <strong>in</strong> remote areas where alternative employment opportunities are scarce. These relatively<br />
remote areas <strong>in</strong> prov<strong>in</strong>ces such as Western, Gulf and West Sepik are amongst <strong>the</strong> most poorly<br />
developed areas <strong>of</strong> Papua New Gu<strong>in</strong>ea. 11 The timber process<strong>in</strong>g provides important <strong>in</strong>jections <strong>of</strong><br />
<strong>in</strong>come and demand <strong>in</strong>to local economies and can be <strong>the</strong> only source <strong>of</strong> physical <strong>in</strong>frastructure,<br />
notably <strong>of</strong> roads, power and water, <strong>in</strong> <strong>the</strong>se areas. It is also common for process<strong>in</strong>g operations to<br />
directly fund <strong>the</strong> construction <strong>of</strong> community assets such as aid cl<strong>in</strong>ics and schools, topp<strong>in</strong>g up <strong>the</strong><br />
scarce government fund<strong>in</strong>g available for <strong>the</strong>se critical services.<br />
So timber process<strong>in</strong>g <strong>of</strong>fers important benefits to <strong>the</strong> Papua New Gu<strong>in</strong>ea economy and <strong>the</strong> country’s<br />
development.<br />
But <strong>the</strong> timber process<strong>in</strong>g <strong>in</strong>dustry has come at a cost. In particular, <strong>the</strong> logs used <strong>in</strong> process<strong>in</strong>g are<br />
free <strong>of</strong> export duty and generally also <strong>of</strong> landowners’ premium. At present tax rates, <strong>the</strong> Government<br />
and landowners toge<strong>the</strong>r forgo 30 to 45 per cent <strong>of</strong> <strong>the</strong> value <strong>of</strong> a log that is processed ra<strong>the</strong>r than<br />
exported. Extensive company tax concessions are also provided to timber processors and local timber<br />
products are protected aga<strong>in</strong>st imports by high tariffs where this may have <strong>the</strong> effect <strong>of</strong> rais<strong>in</strong>g <strong>the</strong><br />
domestic price <strong>of</strong> some products.<br />
This section considers <strong>the</strong>se benefits and costs with a view to assess<strong>in</strong>g whe<strong>the</strong>r <strong>the</strong> sector provides<br />
net benefits to <strong>the</strong> country. That is, whe<strong>the</strong>r <strong>the</strong> benefits exceed <strong>the</strong> costs. A key issue explored<br />
through this analysis is whe<strong>the</strong>r <strong>the</strong>re is a case to remove or w<strong>in</strong>d-back <strong>the</strong> current export duty and<br />
landowner premium concessions provided to process<strong>in</strong>g.<br />
The next sections discusses <strong>in</strong> more detail <strong>the</strong> benefits provided by timber process<strong>in</strong>g. The potential<br />
costs are <strong>the</strong>n discussed. The f<strong>in</strong>al section compares <strong>the</strong> costs and benefits and discusses <strong>the</strong> key<br />
conclusions drawn from <strong>the</strong> analysis.<br />
6.2 THE BENEFITS OF PROCESSING<br />
The ma<strong>in</strong> direct economic effect <strong>of</strong> a timber process<strong>in</strong>g operation flows from <strong>the</strong> employment <strong>of</strong><br />
national labour. This labour is drawn from landowner groups that control <strong>the</strong> timber be<strong>in</strong>g logged,<br />
from those liv<strong>in</strong>g <strong>in</strong> <strong>the</strong> town or village centre where <strong>the</strong> processor is located or from o<strong>the</strong>r prov<strong>in</strong>ces.<br />
Most national labour is unskilled, work<strong>in</strong>g for example on <strong>the</strong> stack<strong>in</strong>g <strong>of</strong> timber, handl<strong>in</strong>g through<br />
<strong>the</strong> process<strong>in</strong>g l<strong>in</strong>e, tally<strong>in</strong>g timber output and timber bundl<strong>in</strong>g and sort<strong>in</strong>g. Skilled labourers, which<br />
account for <strong>in</strong> <strong>the</strong> order <strong>of</strong> 1 <strong>in</strong> 5 <strong>of</strong> national workers, are engaged as sawyers, heavy equipment<br />
operators, saw doctors, timber graders, ma<strong>in</strong>tenance staff, clerical staff and workshop technicians.<br />
Heavy work is typically undertaken by men while women are normally engaged <strong>in</strong> f<strong>in</strong>er tasks such as<br />
sort<strong>in</strong>g.<br />
11 See for example <strong>the</strong> regional and district pr<strong>of</strong>iles available <strong>in</strong> Government <strong>of</strong> Papua New Gu<strong>in</strong>ea and United Nations<br />
Development Program (1998) and Bourke M. et al (2001).<br />
PAGE 87
2001 FOREST REVENUE REVIEW<br />
Landowners also benefit from <strong>the</strong> royalty paid on logs used <strong>in</strong> process<strong>in</strong>g. This is set at 10 k<strong>in</strong>a per<br />
cubic metre across Papua New Gu<strong>in</strong>ea.<br />
Virtually all <strong>of</strong> this labour and royalty <strong>in</strong>come would be spent with<strong>in</strong> Papua New Gu<strong>in</strong>ea on food,<br />
cloth<strong>in</strong>g, hous<strong>in</strong>g, school fees etc. 12 This provides an important <strong>in</strong>jection to <strong>the</strong> economy, with much<br />
flow<strong>in</strong>g <strong>in</strong>to <strong>the</strong> local economy <strong>in</strong> <strong>the</strong> first <strong>in</strong>stance. As <strong>the</strong>se funds are spent, <strong>the</strong>re are multiplier<br />
benefits <strong>in</strong> o<strong>the</strong>r <strong>in</strong>dustries. Both <strong>the</strong> direct and <strong>in</strong>direct multiplier effects need to be taken <strong>in</strong>to<br />
account.<br />
The foreign labour employed <strong>in</strong> <strong>the</strong> <strong>in</strong>dustry also <strong>of</strong>fers benefits for <strong>the</strong> Papua New Gu<strong>in</strong>ea economy.<br />
The workers consume local goods and services and on average pay rates are high enough to see<br />
<strong>in</strong>come taxes paid. 13 These <strong>in</strong>come taxes <strong>in</strong> turn fund government expenditure, where this may be<br />
spent <strong>in</strong> a variety <strong>of</strong> sectors such as education, health and roads. All <strong>the</strong>se benefits must be factored<br />
<strong>in</strong>.<br />
While many <strong>of</strong> <strong>the</strong> non-labour <strong>in</strong>puts to process<strong>in</strong>g such as equipment and materials are imported,<br />
some are purchased locally and this provides an additional source <strong>of</strong> demand for local bus<strong>in</strong>esses.<br />
This <strong>in</strong> turn generates employment and pr<strong>of</strong>its <strong>in</strong> <strong>the</strong> supply<strong>in</strong>g <strong>in</strong>dustry, and <strong>in</strong>creases demand for<br />
o<strong>the</strong>r local <strong>in</strong>puts that <strong>in</strong> turn benefits suppliers fur<strong>the</strong>r down <strong>the</strong> cha<strong>in</strong> <strong>of</strong> supply. Some <strong>in</strong>puts such<br />
as electricity and general overheads have a high local content and can represent an important<br />
economic <strong>in</strong>jection from <strong>the</strong> process<strong>in</strong>g operation.<br />
Many processors also contribute to local <strong>in</strong>frastructure. In some cases <strong>the</strong>y provide <strong>the</strong> materials and<br />
labour to build schools, aid cl<strong>in</strong>ics and o<strong>the</strong>r community build<strong>in</strong>gs. They <strong>of</strong>ten develop <strong>the</strong> local road<br />
network and provide power and water to surround<strong>in</strong>g areas. The provision <strong>of</strong> such services <strong>in</strong>creases<br />
demand <strong>in</strong> <strong>the</strong> economy and has important flow-on benefits as liv<strong>in</strong>g standards improve (e.g.<br />
education levels rise, as health improves or as better road improve access to markets). 14 We term<br />
<strong>the</strong>se flow-on effects productivity effects (<strong>the</strong>y are re-visited below).<br />
Timber process<strong>in</strong>g, <strong>of</strong> course, also use logs. A portion <strong>of</strong> <strong>the</strong> logs processed would have been logged<br />
even <strong>in</strong> <strong>the</strong> absence <strong>of</strong> process<strong>in</strong>g as most logs used <strong>in</strong> process<strong>in</strong>g are <strong>of</strong> export grade (as outl<strong>in</strong>ed <strong>in</strong><br />
<strong>the</strong> discussion <strong>of</strong> <strong>the</strong> f<strong>in</strong>ancial models, it is estimated at least 80 per cent <strong>of</strong> logs used <strong>in</strong> process<strong>in</strong>g are<br />
<strong>of</strong> export grade). The payment <strong>of</strong> wages and salaries, <strong>of</strong> royalties, and <strong>the</strong> use <strong>of</strong> <strong>in</strong>puts to production<br />
etc on export grade logs are not considered a benefit <strong>of</strong> process<strong>in</strong>g (as <strong>the</strong>y would have occurred <strong>in</strong><br />
<strong>the</strong> absence <strong>of</strong> process<strong>in</strong>g). But some <strong>of</strong> <strong>the</strong> lower grade logs and species are only felled because <strong>the</strong>y<br />
can be processed, and <strong>the</strong> additional logg<strong>in</strong>g that takes place <strong>of</strong> <strong>the</strong>se non-export grade logs is a<br />
benefit for <strong>the</strong> economy that needs to be factored <strong>in</strong>to <strong>the</strong> cost-benefit analysis. Up to 20 per cent <strong>of</strong><br />
log <strong>in</strong>put can be assumed to have resulted from logg<strong>in</strong>g that only takes place because <strong>of</strong> process<strong>in</strong>g.<br />
Process<strong>in</strong>g also generates pr<strong>of</strong>its. But <strong>the</strong> <strong>in</strong>dustry is predom<strong>in</strong>ately foreign owned such that most <strong>of</strong><br />
<strong>the</strong> post-tax pr<strong>of</strong>its will ultimately flow overseas. Certa<strong>in</strong>ly all <strong>the</strong> larger operators are foreign owned<br />
(<strong>the</strong> largest locally owned processor be<strong>in</strong>g <strong>the</strong> Ulamona Saw Mill Company <strong>of</strong> West New Brita<strong>in</strong> that<br />
has a typical log <strong>in</strong>put <strong>of</strong> around 20,000 m 3 per annum). One would expect a portion <strong>of</strong> pr<strong>of</strong>its to be<br />
reta<strong>in</strong>ed locally as company tax. But <strong>the</strong> <strong>forest</strong> sector has paid very little company tax (see Figure<br />
5.2), a probable contribut<strong>in</strong>g factor be<strong>in</strong>g <strong>the</strong> generous tax concessions provided to process<strong>in</strong>g as<br />
12 As only a small share <strong>of</strong> national workers would have sufficient <strong>in</strong>come to travel overseas to spend <strong>the</strong>ir wages and<br />
salaries. But is also important to recognise <strong>the</strong> high import content <strong>of</strong> consumption and <strong>the</strong> leakage this represents from<br />
<strong>the</strong> economy. This leakage is factored <strong>in</strong>to <strong>the</strong> multipliers used <strong>in</strong> <strong>the</strong> cost-benefit assessment as presented below.<br />
13 On average <strong>the</strong> wage rates <strong>of</strong> local employees are low and <strong>the</strong>re is no <strong>in</strong>come tax payable by local employees.<br />
14 An important issue for public policy that is not explored <strong>in</strong> this Review is whe<strong>the</strong>r Government and not logg<strong>in</strong>g and<br />
process<strong>in</strong>g companies should be <strong>the</strong> one responsible for <strong>in</strong>frastructure provision <strong>in</strong> <strong>the</strong>se areas. On <strong>the</strong> one hand <strong>the</strong><br />
Government should be better placed to plan and co-ord<strong>in</strong>ate <strong>the</strong> delivery <strong>of</strong> services <strong>in</strong> an area. But on <strong>the</strong> o<strong>the</strong>r hand<br />
<strong>the</strong>re are important efficiency benefits from <strong>the</strong> co-ord<strong>in</strong>ation <strong>of</strong> <strong>in</strong>frastructure provision with <strong>the</strong> availability <strong>of</strong> suitable<br />
equipment and staff, <strong>in</strong>frastructure provision by operators is important to ma<strong>in</strong>ta<strong>in</strong><strong>in</strong>g good relations with landowers and<br />
<strong>in</strong> some circumstance operators may actually be more accountable than government.<br />
PAGE 88
2001 FOREST REVENUE REVIEW<br />
outl<strong>in</strong>ed <strong>in</strong> Box 6.1. The result is that <strong>the</strong>re is very little flow-through to <strong>the</strong> local economy <strong>of</strong> <strong>the</strong><br />
pr<strong>of</strong>its earned from timber process<strong>in</strong>g. Our analysis assumes it is zero.<br />
BOX 6.1 EXISTING TAX INCENTIVES FOR DOWNSTREAM PROCESSING<br />
Export Sales Exemption: This <strong>in</strong>centive allows 100 per cent <strong>of</strong> <strong>the</strong> <strong>in</strong>come derived from export sales <strong>of</strong><br />
specified goods for three years to be treated as exempt <strong>in</strong>come. After this period any export <strong>in</strong>come which is <strong>in</strong><br />
excess <strong>of</strong> <strong>the</strong> average <strong>of</strong> <strong>the</strong> prior years can be treated as exempt. Qualify<strong>in</strong>g goods <strong>in</strong>clude: chopsticks,<br />
matches, paper products, sawn timber, mould<strong>in</strong>gs, plywood, lam<strong>in</strong>ated products and wood pulp.<br />
Export Market Development Double Deduction: The Scheme applies to expenditure on export market<br />
development for goods manufactured <strong>in</strong> Papua New Gu<strong>in</strong>ea. These expenditures qualify for double deduction,<br />
provided <strong>the</strong> tax sav<strong>in</strong>g is less than 75 per cent <strong>of</strong> <strong>the</strong> cost <strong>of</strong> <strong>the</strong> expenditure: i.e. <strong>the</strong> Government is <strong>in</strong> effect<br />
subsidis<strong>in</strong>g up to 75 per cent <strong>of</strong> <strong>the</strong> cost <strong>of</strong> this form <strong>of</strong> expenditure. The types <strong>of</strong> expenditure that qualify<br />
<strong>in</strong>clude overseas publicity and advertis<strong>in</strong>g, market research, tender preparation, samples, trade fair expense,<br />
overseas sales and <strong>of</strong>fice expenses.<br />
Initial Year Accelerated Deduction: The Initial Year Accelerated Deduction encourages companies to <strong>in</strong>vest <strong>in</strong><br />
upgrad<strong>in</strong>g <strong>the</strong>ir plant and o<strong>the</strong>r capital assets. Depreciation <strong>of</strong> <strong>new</strong> plant may be <strong>in</strong>creased by up to 20% <strong>of</strong> <strong>the</strong><br />
cost <strong>of</strong> <strong>the</strong> plant <strong>in</strong> <strong>the</strong> <strong>in</strong>itial year. This allows <strong>the</strong> capital cost <strong>of</strong> <strong>the</strong>se <strong>new</strong> assets to be written down at a faster<br />
rate <strong>the</strong>n would o<strong>the</strong>rwise be possible.<br />
Tariffs on Manufactured Products: Many products enjoy <strong>the</strong> prohibitive or even greater rates <strong>of</strong> tariff<br />
protection s<strong>in</strong>ce 1 July 1999. 25 per cent tariff rates (reduc<strong>in</strong>g to 20 per cent <strong>in</strong> 2003) apply to: Fuel wood and<br />
chips or particles; wood <strong>in</strong> <strong>the</strong> rough, poles, sawn or chipped; wood cont<strong>in</strong>uously shaped; board <strong>of</strong> wood;<br />
pack<strong>in</strong>g cases, boxes, crates and drums; and carpentry articles. 35 per cent tariff rates (reduc<strong>in</strong>g to 30 per cent<br />
<strong>in</strong> 2003) apply to: pr<strong>of</strong>ile shapes; wooden frames; pallets, box pallets and o<strong>the</strong>r load boards; builders’ jo<strong>in</strong>ery<br />
and carpentry <strong>of</strong> wood; statuettes and o<strong>the</strong>r ornaments; and an ‘o<strong>the</strong>r articles’ <strong>of</strong> wood category. A 50 per cent<br />
tariff rate (reduc<strong>in</strong>g to 45 per cent <strong>in</strong> 2003) applies to veneer sheets and sheets for plywood, while <strong>the</strong> highest<br />
tariff rate <strong>of</strong> 85 per cent (reduc<strong>in</strong>g to 75 per cent <strong>in</strong> 2003) applies to plywood, veneered panels and lam<strong>in</strong>ated<br />
wood. O<strong>the</strong>r manufactured products would be eligible for protective tariff rates, subject to <strong>the</strong> approval <strong>of</strong> <strong>the</strong><br />
Industry Assistance Board (currently de facto IRC).<br />
Zero Rat<strong>in</strong>g <strong>of</strong> Exported Goods: All Exported log products <strong>in</strong>clud<strong>in</strong>g round logs are zero-rated for VAT.<br />
Companies export<strong>in</strong>g are able to claim a refund <strong>of</strong> <strong>in</strong>put credits, and so avoid pay<strong>in</strong>g <strong>the</strong> VAT.<br />
Source: Papua New Gu<strong>in</strong>ea Inland Revenue Commission<br />
Box 6.2 provides a pr<strong>of</strong>ile <strong>of</strong> <strong>the</strong> features <strong>of</strong> a number <strong>of</strong> process<strong>in</strong>g operations visited dur<strong>in</strong>g <strong>the</strong><br />
course <strong>of</strong> <strong>the</strong> Review. These visits were used to collect a variety <strong>of</strong> <strong>in</strong>formation, <strong>in</strong>clud<strong>in</strong>g that<br />
required to develop an understand<strong>in</strong>g <strong>of</strong> <strong>the</strong> economic characteristics <strong>of</strong> a typical process<strong>in</strong>g operation<br />
and to cross-check <strong>in</strong>formation collected from non-company sources on <strong>the</strong> economic impact <strong>of</strong><br />
timber process<strong>in</strong>g. The site visits undertaken for <strong>the</strong> cost-benefit assessment covered <strong>the</strong> only<br />
operat<strong>in</strong>g veneer and plywood mills and 4 <strong>of</strong> <strong>the</strong> 50 or so larger sawmills operat<strong>in</strong>g at present.<br />
BOX 6.2 AN ECONOMIC PROFILE OF SELECTED TIMBER PROCESSING OPERATIONS<br />
Bulolo Plyood Mill, Morobe Prov<strong>in</strong>ce (PNG <strong>Forest</strong> Products): The mill is <strong>the</strong> ma<strong>in</strong> economic activity<br />
support<strong>in</strong>g a township <strong>of</strong> around 15,000 people near Lae. The total operation employs around 700 national<br />
workers, and <strong>the</strong> unusually long life <strong>of</strong> <strong>the</strong> mill means that many staff are 2 nd or 3 rd generation workers. The<br />
workers have been drawn from throughout Papua New Gu<strong>in</strong>ea. Around half <strong>of</strong> <strong>the</strong> 700 workers occupy<br />
company hous<strong>in</strong>g <strong>in</strong> Bulolo township, where <strong>the</strong> company also provides school<strong>in</strong>g (for some company<br />
employees) and shops. The facility generates power for <strong>the</strong> townships <strong>of</strong> Bulolo and Wau from a hydro station<br />
(electricity is sold to non-company users) and water for Bulolo town and <strong>the</strong> immediate vic<strong>in</strong>ity. The company<br />
also ma<strong>in</strong>ta<strong>in</strong>s roads <strong>in</strong> <strong>the</strong> area (<strong>in</strong>clud<strong>in</strong>g to Wau, although this support is now be<strong>in</strong>g cut-back) and provides<br />
PAGE 89
2001 FOREST REVENUE REVIEW<br />
support on an ad hoc basis for nearby health and education facilities. There is reported to be very little crime <strong>in</strong><br />
<strong>the</strong> area.<br />
The facility sells most <strong>of</strong> its product locally, and <strong>the</strong> poor level <strong>of</strong> local demand is <strong>the</strong> major commercial issue<br />
fac<strong>in</strong>g <strong>the</strong> facility. The poor demand has led to a recent downsiz<strong>in</strong>g <strong>in</strong> plywood output (<strong>of</strong> around 30 per cent).<br />
There are also concerns <strong>in</strong> <strong>the</strong> future availability and cost <strong>of</strong> <strong>the</strong> logs used <strong>in</strong> <strong>the</strong> facility which are drawn from<br />
surround<strong>in</strong>g Government plantation. At present donor projects (eg <strong>the</strong> re-equipp<strong>in</strong>g <strong>of</strong> schools) are provid<strong>in</strong>g<br />
<strong>the</strong> ma<strong>in</strong> source <strong>of</strong> demand for processed products, but some recent successes have been enjoyed <strong>in</strong> <strong>the</strong> export <strong>of</strong><br />
plywood (eg construction grade plywood to Australia and some Pacific Island nations). High tariffs apply to<br />
compet<strong>in</strong>g imports, but <strong>the</strong>se tariff rates are be<strong>in</strong>g substantially reduced as part <strong>of</strong> Papua New Gu<strong>in</strong>ea’s tariff<br />
reduction program.<br />
Panakawa Veneer Mill, Western Prov<strong>in</strong>ce (Rimbunan Hijau): The mill employs around 700 people, 520 <strong>of</strong><br />
which are locals. Of <strong>the</strong> 160 expatriate staff, most are from Indonesia. The mill is less than four years old with<br />
very few worker facilities available, <strong>the</strong> mill is very remote (<strong>the</strong>re is no road to <strong>the</strong> closest major township <strong>of</strong><br />
Dahru which can be accessed by air or 2 days <strong>in</strong> an outboard) and workers are engaged for 6, 12 hour shifts per<br />
week. The reasonably difficult conditions may expla<strong>in</strong> problems faced by <strong>the</strong> mill <strong>in</strong> engag<strong>in</strong>g and reta<strong>in</strong><strong>in</strong>g<br />
staff from <strong>the</strong> surround<strong>in</strong>g area, with all but 40 <strong>of</strong> <strong>the</strong> national employees drawn from o<strong>the</strong>r parts <strong>of</strong> Papua New<br />
Gu<strong>in</strong>ea (eg Laq, Alotau, Mendi, West New Brita<strong>in</strong>, <strong>the</strong> Highlands). There has been a high turnover <strong>of</strong> staff and<br />
a high absentee rate.<br />
There is a school on-site, but no teacher at this stage (a teacher is expected next year). The company reported<br />
that is spends K15,000 to K20,000 per month on medic<strong>in</strong>e for staff and <strong>the</strong> local area (<strong>in</strong>clud<strong>in</strong>g nearby<br />
Kamusie). While <strong>the</strong>re is no obligation to assist non-employees, it is considered impractical not to do so and <strong>the</strong><br />
company argues it provides health care for much <strong>of</strong> <strong>the</strong> surround<strong>in</strong>g area (although it is very sparsely<br />
populated). The company funds an expatriate doctor and two local mid-wives.<br />
Pay rates are around 80t per hour for unskilled labour and up to K1.20 per hour for skilled labour. There are<br />
very few alternative employment opportunities <strong>in</strong> <strong>the</strong> area, with <strong>the</strong> ma<strong>in</strong> alternative cash crop be<strong>in</strong>g sago. The<br />
current logg<strong>in</strong>g area is around 100 km away <strong>in</strong> a direct l<strong>in</strong>e, or around 200 km by river (logs are barged to <strong>the</strong><br />
mill). The use <strong>of</strong> barges to transport logs means <strong>the</strong> road network has not been as well developed as <strong>in</strong> o<strong>the</strong>r<br />
logg<strong>in</strong>g areas.<br />
A nearby sawmill at Kamusie has been established for some time, and operates with a considerably higher<br />
representation <strong>of</strong> local employees. The sawmill employs around 100 nationals (most are from <strong>the</strong> surround<strong>in</strong>g<br />
area) and 15 expatriates, with pay rates rang<strong>in</strong>g from 50t per hour (for ‘tra<strong>in</strong>ee’ unskilled labour) to K1 to K1.50<br />
per hour for skilled labour. The typical work<strong>in</strong>g week is 88 hours. The township <strong>of</strong> 2,000 to 3,000 people<br />
conta<strong>in</strong>s a health post, school and police station, with <strong>the</strong> company report<strong>in</strong>g 50 to 80 patients visit<strong>in</strong>g <strong>the</strong> health<br />
post each day.<br />
Kwila Saw Mill, Saudaun Prov<strong>in</strong>ce (Vanimo <strong>Forest</strong> Products): The mill operates 1, 10 hour shift 6 days per<br />
week. 300 to 400 people are engaged <strong>in</strong> <strong>the</strong> sawmill operation and ano<strong>the</strong>r 600 to 700 <strong>in</strong> <strong>the</strong> support<strong>in</strong>g logg<strong>in</strong>g<br />
operation. Of <strong>the</strong> mill workers, <strong>the</strong>re are around 20 expatriate workers, who tend to be <strong>the</strong> higher skilled<br />
operators. Pay rates start from 60t per hour for an unskilled probationer and are K1.30 to K.150 per hour for<br />
skilled labour. The absentee rate is around 20 per cent.<br />
The company ma<strong>in</strong>ta<strong>in</strong>s roads <strong>in</strong> <strong>the</strong> area (<strong>in</strong>clud<strong>in</strong>g <strong>the</strong> ma<strong>in</strong>, gravel road to <strong>the</strong> township) and has supported<br />
<strong>the</strong> construction <strong>of</strong> nearby government schools. While schools and health facilities are under-funded, <strong>the</strong>y are<br />
operational and reasonably well staffed and serviced (relative to surround<strong>in</strong>g areas).<br />
Most <strong>of</strong> <strong>the</strong> mills’ labour is drawn from <strong>the</strong> prov<strong>in</strong>ce. A large share live <strong>in</strong> un-serviced squatter settlements on<br />
adjo<strong>in</strong><strong>in</strong>g state land, with many houses made from kwila <strong>of</strong>f-cuts. Surround<strong>in</strong>g areas are poorly serviced by<br />
Government health and education facilities (eg mobile cl<strong>in</strong>ics have stopped because <strong>of</strong> a lack <strong>of</strong> transport funds)<br />
and <strong>the</strong> ability to work <strong>in</strong> town provides an opportunity for children to access such facilities. This appears to be<br />
a key factor attract<strong>in</strong>g labour and keep<strong>in</strong>g families <strong>in</strong> town even though only one <strong>in</strong> 10 adults may be work<strong>in</strong>g <strong>in</strong><br />
a group (a more typical number is 1 <strong>in</strong> 3).<br />
Apart from Government and some trade activities, <strong>the</strong>re are few alternative employment opportunities <strong>in</strong> <strong>the</strong><br />
area (<strong>the</strong>re is very little cash cropp<strong>in</strong>g despite <strong>the</strong> close proximity to <strong>the</strong> capital <strong>of</strong> West Papua). The prov<strong>in</strong>ce is<br />
particularly poorly serviced by road, with for example no all wea<strong>the</strong>r roads outside <strong>of</strong> Vanimo township and no<br />
road connection between Vanimo and <strong>the</strong> four districts <strong>of</strong> <strong>the</strong> prov<strong>in</strong>ce. This may expla<strong>in</strong> <strong>the</strong> low level <strong>of</strong> cash<br />
activity <strong>in</strong> <strong>the</strong> area surround<strong>in</strong>g <strong>the</strong> mill.<br />
The law and order situation is reported to be good <strong>in</strong> Vanimo but most o<strong>the</strong>r development <strong>in</strong>dicators for <strong>the</strong><br />
prov<strong>in</strong>ce are very poor.<br />
PAGE 90
2001 FOREST REVENUE REVIEW<br />
Stett<strong>in</strong> Bay Lumber Company (Nissho Iwai and PNG Government), West New Brita<strong>in</strong> Prov<strong>in</strong>ce: The company<br />
has sizeable land hold<strong>in</strong>gs on which most <strong>of</strong> <strong>the</strong> senior to middle level staff live, with <strong>the</strong> children <strong>of</strong> employees<br />
attend<strong>in</strong>g a Government school on company land. The company is <strong>the</strong> only operator <strong>in</strong> Papua New Gu<strong>in</strong>ea<br />
pay<strong>in</strong>g a Project Development Benefit. 40 per cent <strong>of</strong> this is paid <strong>in</strong> cash with <strong>the</strong> rema<strong>in</strong>der allocated to an<br />
Infrastructure Development Fund to be used to fund local <strong>in</strong>frastructure.<br />
There has been a substantial cut-back <strong>in</strong> activity recently with logg<strong>in</strong>g suspended <strong>in</strong> company areas on <strong>the</strong><br />
sou<strong>the</strong>rn side <strong>of</strong> West New Brita<strong>in</strong>. The ma<strong>in</strong> source <strong>of</strong> logs at present is an areas be<strong>in</strong>g clear-felled to establish<br />
a palm oil plantation. When operat<strong>in</strong>g at full capacity <strong>the</strong> mill employs 500 or so people. When <strong>the</strong> workforce<br />
was scaled back, around 200 returned to o<strong>the</strong>r prov<strong>in</strong>ces, 100 moved from <strong>the</strong> company to <strong>the</strong> contractor that<br />
took over <strong>the</strong> operation <strong>of</strong> <strong>the</strong> mill and around 200 stayed with <strong>the</strong> company <strong>in</strong> non-mill positions. Of <strong>the</strong><br />
current mill workforce <strong>of</strong> around 100, <strong>the</strong>re are 9 expatriates. There is strong local pressure for <strong>the</strong> mill operator<br />
to use local labour, and most current national employees are from <strong>the</strong> local area. One shift operates 5 days a<br />
week, 8 hours per day. Pay rates for national employees range from 65 t per hour for probationers to K1 per<br />
hour for semi-skilled labour.<br />
There appear to be reasonably good alternative employment opportunities for local labour. The ma<strong>in</strong> source is<br />
small holder palm oil, a result <strong>of</strong> <strong>the</strong> rapidly expand<strong>in</strong>g palm oil <strong>in</strong>dustry <strong>in</strong> <strong>the</strong> prov<strong>in</strong>ce, but o<strong>the</strong>r cash crops<br />
also provide opportunities.<br />
Ulamona Sawmill Development Corporation, West New Brita<strong>in</strong> Prov<strong>in</strong>ce: The mill was purchased by 8 local<br />
landowners companies from <strong>the</strong> Catholic Church. It is a long-lived operation with some surround<strong>in</strong>g <strong>forest</strong><br />
areas <strong>in</strong>to <strong>the</strong>ir third cut. Most sawn timber is sold with<strong>in</strong> Papua New Gu<strong>in</strong>ea. Weak demand has seen sawn<br />
timber output cutback, while high export duty rates are attributed with <strong>the</strong> recent cessation <strong>of</strong> log exports.<br />
Around 90 per cent <strong>of</strong> <strong>the</strong> mill employee’s are local, with some be<strong>in</strong>g 4 th generation workers. There is only one<br />
expatriate worker. Total comb<strong>in</strong>ed employment for <strong>the</strong> mill and logg<strong>in</strong>g operation is 115 at present. 105 staff<br />
were recently laid <strong>of</strong>f most <strong>of</strong> whom returned to <strong>the</strong>ir (local) villages while some obta<strong>in</strong>ed work at a nearby<br />
palm oil plantation/mill. Pay rates start at 86t per hour for unskilled labour ris<strong>in</strong>g to K2.10 per hour for truck<br />
and dozer drivers.<br />
The company has been relied upon to supply most <strong>of</strong> <strong>the</strong> timber for <strong>the</strong> construction <strong>of</strong> schools build<strong>in</strong>g and<br />
facilities and a 40 bed health facility <strong>in</strong> Ulamona township. The presence <strong>of</strong> a nearby active volcano has cut<br />
back <strong>the</strong> operation <strong>of</strong> <strong>the</strong>se facilities, with temporary settlements established fur<strong>the</strong>r away from <strong>the</strong> volcano.<br />
The company supplies water and electricity to <strong>the</strong> areas adjacent to <strong>the</strong> mill <strong>in</strong>clud<strong>in</strong>g <strong>the</strong> school and <strong>the</strong> health<br />
facility. The company also undertakes most road ma<strong>in</strong>tenance <strong>in</strong> and around Ulamona.<br />
Some <strong>of</strong> <strong>the</strong> operator’s permit area has been converted to palm oil, and small holder palm oil is provid<strong>in</strong>g<br />
<strong>in</strong>creas<strong>in</strong>gly important alternative employment opportunities. Palm oil can <strong>of</strong>fer broadly comparable <strong>in</strong>comes to<br />
work<strong>in</strong>g <strong>in</strong> <strong>the</strong> mill. The next most important alternative activity is subsistence farm<strong>in</strong>g.<br />
6.3 THE COSTS OF PROCESSING<br />
The ma<strong>in</strong> cost <strong>of</strong> process<strong>in</strong>g is <strong>the</strong> loss <strong>of</strong> government <strong>revenue</strong> from export duties as export grade logs<br />
are diverted from export<strong>in</strong>g to process<strong>in</strong>g. With 80 to 85 per cent <strong>of</strong> <strong>the</strong> log <strong>in</strong>put to <strong>the</strong> larger<br />
process<strong>in</strong>g operations understood to be <strong>of</strong> export log quality, <strong>the</strong> loss <strong>in</strong> <strong>revenue</strong> is potentially large.<br />
The loss <strong>of</strong> government <strong>revenue</strong> means that some government expenditure is forgone. This has what<br />
we call both an expenditure effect and a productivity effect. The expenditure effect flows from <strong>the</strong><br />
reduction <strong>in</strong> employment and demand by government for materials, which <strong>in</strong> turn has a flow-on cost<br />
to bus<strong>in</strong>esses that would have supplied <strong>the</strong> government materials, those that would have supplied<br />
consumption items to government employees items, etc. The productivity effect captures <strong>the</strong> <strong>in</strong>direct<br />
benefits that would have generated by <strong>the</strong> government program that is forgone. For example, <strong>the</strong><br />
benefit <strong>of</strong> improved education, better health care or improved roads.<br />
For <strong>the</strong> purposes <strong>of</strong> analysis we assume <strong>the</strong> productivity effect can be measured by <strong>the</strong> potential<br />
benefits <strong>of</strong> ma<strong>in</strong>ta<strong>in</strong><strong>in</strong>g roads. Road ma<strong>in</strong>tenance reduces <strong>the</strong> cost <strong>of</strong> travel by reduc<strong>in</strong>g wear and tear<br />
PAGE 91
2001 FOREST REVENUE REVIEW<br />
on vehicles, reduc<strong>in</strong>g <strong>the</strong> use <strong>of</strong> fuel and reduc<strong>in</strong>g <strong>the</strong> time taken to travel. Road ma<strong>in</strong>tenance also<br />
<strong>of</strong>fers o<strong>the</strong>r benefits by provid<strong>in</strong>g improved access to markets, to schools and health facilities.<br />
Estimates for selected coastal regions <strong>of</strong> Papua New Gu<strong>in</strong>ea suggest that every k<strong>in</strong>a spent on road<br />
ma<strong>in</strong>tenance <strong>of</strong>fers at least K3 <strong>in</strong> sav<strong>in</strong>gs <strong>in</strong> vehicle operat<strong>in</strong>g costs alone (AusAID, 2000).<br />
We use this estimate <strong>of</strong> <strong>the</strong> potential sav<strong>in</strong>gs as a proxy for <strong>the</strong> productivity effect associated with<br />
foregone expenditure. This can be expla<strong>in</strong>ed <strong>in</strong> <strong>the</strong> follow<strong>in</strong>g terms.<br />
Consider a simple case where <strong>the</strong> resource rent generated on an export log is K1. The Government<br />
could allow <strong>the</strong> operator to take this K1 as pr<strong>of</strong>it, which would be sent overseas. 15 Or <strong>the</strong> Government<br />
could collect K1 from <strong>the</strong> export <strong>of</strong> a log and reta<strong>in</strong> <strong>the</strong> resource rent. This K1 collected from <strong>the</strong><br />
export log could <strong>the</strong>n be spent on road ma<strong>in</strong>tenance, which would generate multiplier effects as it is<br />
spent and, <strong>in</strong> addition, reduce <strong>the</strong> cost <strong>of</strong> travel by K3. Instead <strong>the</strong> Government actually decides to<br />
forego this K1 <strong>in</strong> order to promote timber process<strong>in</strong>g and does not collect <strong>the</strong> K1 <strong>in</strong> export tax. In<br />
effect it is forego<strong>in</strong>g <strong>the</strong> boost to demand <strong>of</strong> K1 and <strong>the</strong> productivity effect <strong>of</strong> K3.<br />
The underly<strong>in</strong>g assumption <strong>of</strong> this cost benefit analysis is that road ma<strong>in</strong>tenance is <strong>the</strong> marg<strong>in</strong>al<br />
expenditure foregone by <strong>the</strong> concession on export duties. The realism <strong>of</strong> this assumption can be seen<br />
by <strong>the</strong> recent history <strong>of</strong> budget allocations by <strong>the</strong> National Government to road ma<strong>in</strong>tenance. They<br />
have frequently been one <strong>of</strong> <strong>the</strong> first expenditure items cut as o<strong>the</strong>r <strong>in</strong>itiatives have emerged or<br />
<strong>revenue</strong> has fallen short <strong>of</strong> expectations. This is despite road ma<strong>in</strong>tenance be<strong>in</strong>g frequently described<br />
by <strong>the</strong> Government as a high priority. An alternative assumption is that <strong>the</strong> funds would have been<br />
allocated to a less effective use that generated no benefits. We take this argument <strong>in</strong>to account by<br />
conservatively assum<strong>in</strong>g that <strong>of</strong> a K1 <strong>in</strong> expenditure foregone, a third would have been spent on<br />
activities that generate no productivity effect (eg K0.33 <strong>of</strong> every K1 is <strong>in</strong> effect wasted). This means<br />
<strong>the</strong> productivity effect foregone for every K1 <strong>of</strong> export duty foregone is assumed to be K2 (ie 3 x 0.66<br />
= 2).<br />
Most process<strong>in</strong>g operations also do not pay landowners premiums on logs used <strong>in</strong> process<strong>in</strong>g. 16 This<br />
means that landowners forgo <strong>in</strong>come and hence consumption when logs are diverted from export to<br />
process<strong>in</strong>g. This represents a loss <strong>in</strong> demand for those bus<strong>in</strong>esses that would have supplied goods and<br />
services to landowners, to <strong>the</strong>ir supply<strong>in</strong>g bus<strong>in</strong>esses, etc.<br />
Our analysis makes <strong>the</strong> assumption that all jobs for national employees <strong>in</strong> timber process<strong>in</strong>g represent<br />
<strong>new</strong> jobs for <strong>the</strong> economy. This means that any <strong>in</strong>dividual employed <strong>in</strong> <strong>the</strong> <strong>in</strong>dustry was assumed to<br />
be previously unemployed or, if <strong>the</strong>y were previously employed, <strong>the</strong> position <strong>the</strong>y left has (ultimately)<br />
been filled by an unemployed person. This assumption is based on consultation at a number <strong>of</strong><br />
process<strong>in</strong>g operations that <strong>in</strong>dicated most national employees were from <strong>the</strong> local area and would be<br />
unemployed <strong>in</strong> <strong>the</strong> absence <strong>of</strong> <strong>the</strong> process<strong>in</strong>g operation.<br />
While most national employees are unskilled and, given <strong>the</strong> economic remoteness <strong>of</strong> most timber<br />
process<strong>in</strong>g operations, would be unlikely to have held formal employment previously, a small share<br />
are skilled. Given <strong>the</strong> shortage <strong>of</strong> skilled labour <strong>in</strong> Papua New Gu<strong>in</strong>ea, it is somewhat unrealistic to<br />
assume, as we have, that previously unemployed workers fill all skilled positions. The analysis does<br />
not factor <strong>in</strong> <strong>the</strong> loss from any <strong>in</strong>formal activity previously undertaken by <strong>the</strong> employee (e.g. tend<strong>in</strong>g<br />
<strong>the</strong> family garden, fish<strong>in</strong>g, car<strong>in</strong>g for children). Clearly <strong>the</strong> opportunity cost is not zero as our<br />
analysis assumes. For <strong>the</strong>se reasons our labour assumptions are seen to under-estimate <strong>the</strong> full costs<br />
<strong>of</strong> process<strong>in</strong>g.<br />
15 Note that most logg<strong>in</strong>g companies are foreign owned and (for reasons we do not totally understand) <strong>in</strong> practice <strong>the</strong><br />
company tax payments for <strong>the</strong> <strong>forest</strong> sector have been close to zero for many years.<br />
16 We understand that <strong>the</strong> Wawoi Guavi operation <strong>of</strong> Western Prov<strong>in</strong>ce pays K1.75 per cubic metre <strong>in</strong> landowners<br />
premium (see Groome Poyry (1998)).<br />
PAGE 92
2001 FOREST REVENUE REVIEW<br />
Ideally, <strong>the</strong> analysis should also have factored <strong>in</strong> <strong>the</strong> effect <strong>of</strong> tariffs on processed timber products on<br />
<strong>the</strong> cost <strong>of</strong> such products sold locally. The ma<strong>in</strong> concern is <strong>the</strong> high tariff on plywood that (comb<strong>in</strong>ed<br />
with <strong>the</strong> presence <strong>of</strong> only one local supplier) may allow local plywood prices to be almost twice <strong>the</strong><br />
<strong>in</strong>ternational price (given <strong>the</strong> 85 per cent tariff, see Box 6.1). However, this issue was not explored<br />
because <strong>of</strong> a shortage <strong>of</strong> data.<br />
6.4 WEIGHING UP THE BENEFITS AND COSTS OF PROCESSING EXPORT LOGS<br />
The decision rule that we apply <strong>in</strong> our cost-benefit analysis is that process<strong>in</strong>g must <strong>in</strong>crease <strong>the</strong><br />
consumption <strong>of</strong> Papua New Gu<strong>in</strong>eans. That is, for <strong>the</strong> benefits to outweigh <strong>the</strong> costs, <strong>the</strong> benefits<br />
from process<strong>in</strong>g must add more to consumption that <strong>the</strong> consumption forgone because <strong>of</strong> <strong>the</strong> costs <strong>of</strong><br />
process<strong>in</strong>g. Consumption is focused on as a measurable and readily understood <strong>in</strong>dicator <strong>of</strong><br />
community well be<strong>in</strong>g. 17<br />
In prepar<strong>in</strong>g our analysis, we assume that <strong>the</strong> process<strong>in</strong>g operation only exists because <strong>of</strong> <strong>the</strong> absence<br />
<strong>of</strong> export duties and landowner premiums. That is, <strong>the</strong> costs as described above need to be <strong>in</strong>curred to<br />
trigger <strong>the</strong> benefits from process<strong>in</strong>g as described above. We discuss <strong>the</strong> impact <strong>of</strong> relax<strong>in</strong>g this<br />
assumption below.<br />
The methodology used to estimate <strong>the</strong> impact on consumption is described <strong>in</strong> Annex C. 18 The results<br />
<strong>of</strong> <strong>the</strong> analysis are summarised <strong>in</strong> Table 6.1 and Figure 6.1.<br />
The ma<strong>in</strong> f<strong>in</strong>d<strong>in</strong>g is that all process<strong>in</strong>g operations but <strong>the</strong> <strong>in</strong>tegrated saw mill <strong>the</strong> costs <strong>of</strong> process<strong>in</strong>g<br />
are larger than <strong>the</strong> benefits <strong>of</strong> process<strong>in</strong>g under <strong>the</strong> current policy regime and at current prices. That<br />
is, most timber process<strong>in</strong>g makes Papua New Gu<strong>in</strong>ea worse <strong>of</strong>f. This can be seen from <strong>the</strong> estimated<br />
negative net benefit for all stylised process<strong>in</strong>g operations except for <strong>the</strong> <strong>in</strong>tegrated saw mill. The<br />
problem is most severe for <strong>the</strong> medium to large sawmill, with <strong>the</strong> <strong>in</strong>tegrated sawmill <strong>the</strong> relatively<br />
better performer.<br />
17 An underly<strong>in</strong>g assumption is that all <strong>in</strong>come generated by or lost because <strong>of</strong> process<strong>in</strong>g is/would have been consumed.<br />
In o<strong>the</strong>r words, we assume that what goes <strong>in</strong>to <strong>the</strong> community’s ‘wallet’ equals what comes out.<br />
18 It may be unclear how <strong>the</strong> productivity effect feeds <strong>in</strong>to our consumption-based measure <strong>of</strong> costs and benefits. The<br />
sav<strong>in</strong>g <strong>in</strong> vehicle operat<strong>in</strong>g costs can be <strong>in</strong>terpreted as provid<strong>in</strong>g an estimate <strong>of</strong> <strong>the</strong> <strong>in</strong>direct boost to consumption from<br />
road ma<strong>in</strong>tenance expenditure. The road ma<strong>in</strong>tenance means that households can undertake a given level <strong>of</strong> travel but at<br />
lower cost. The cost sav<strong>in</strong>g can be redirected to o<strong>the</strong>r consumption items (or potentially more travel) with <strong>the</strong> result that<br />
<strong>the</strong> households can consume more goods and services because <strong>of</strong> <strong>the</strong> road ma<strong>in</strong>tenance. For commercial road users, this<br />
sav<strong>in</strong>g <strong>in</strong> travel costs lowers bus<strong>in</strong>ess costs that can be assumed to add to pr<strong>of</strong>its and hence personal <strong>in</strong>come. It is also<br />
reasonable to assume that <strong>the</strong>se additional pr<strong>of</strong>its are ultimately consumed. The estimated additional consumption is <strong>the</strong><br />
estimated value <strong>of</strong> <strong>the</strong> sav<strong>in</strong>gs <strong>in</strong> travel costs.<br />
PAGE 93
TABLE 6.1 BENEFITS AND COSTS OF PROCESSING FOR A TYPICAL YEAR<br />
Benefits <strong>of</strong> Process<strong>in</strong>g from <strong>the</strong> ⎯<br />
Logg<strong>in</strong>g Relocatable<br />
eco-mill<br />
2001 FOREST REVENUE REVIEW<br />
K<strong>in</strong>a per m3 <strong>of</strong> log <strong>in</strong>put<br />
Small<br />
commercial<br />
mill<br />
Medium<br />
to large<br />
sawmill<br />
Integrated<br />
small<br />
sawmill<br />
Large<br />
export<br />
veneer<br />
mill<br />
PAGE 94<br />
Large<br />
export<br />
plywood<br />
mill<br />
Consumption by national workers <strong>of</strong><br />
<strong>the</strong>ir wages<br />
13 77 35 27 88 23 29<br />
Payment <strong>of</strong> landowners royalty 45 20 20 20 20 20 20<br />
Increased demand for locally supplied<br />
<strong>in</strong>puts to production<br />
39 3 31 14 51 14 29<br />
Government expenditure funded by <strong>the</strong><br />
tax on <strong>the</strong> wage and salary <strong>in</strong>come <strong>of</strong><br />
foreign workers<br />
12 0 19 10 11 10 12<br />
- boost to demand <strong>in</strong> <strong>the</strong> economy 4 0 6 3 4 3 4<br />
- productivity effect 8 0 12 6 7 7 8<br />
Consumption by foreign workers <strong>of</strong> part<br />
<strong>of</strong> <strong>the</strong>ir wages<br />
1 0 5 3 3 4 4<br />
Local <strong>in</strong>frastructure funded by <strong>the</strong><br />
process<strong>in</strong>g operation<br />
8 3 3 3 3 3 3<br />
- boost to demand <strong>in</strong> <strong>the</strong> economy 3 1 1 1 1 1 1<br />
- productivity effect 5 2 2 2 2 2 2<br />
Logg<strong>in</strong>g triggered by process<strong>in</strong>g 0 24 24 24 24 24 24<br />
Total Benefits 118 126 137 101 200 97 120<br />
Costs <strong>of</strong> Process<strong>in</strong>g Flow<strong>in</strong>g from -<br />
Government expenditure foregone<br />
because <strong>of</strong> <strong>the</strong> export tax exemption<br />
0 277 319 319 139 147 147<br />
- lost demand <strong>in</strong> <strong>the</strong> economy 0 116 133 133 58 62 62<br />
- productivity effect 0 161 186 186 81 86 86<br />
Consumption foregone by <strong>the</strong> absence<br />
<strong>of</strong> a landowners’ premium on most logs<br />
0 32 32 32 32 32 32<br />
Total Costs 0 309 351 351 171 179 179<br />
Net Benefits 118 -183 -214 -250 30 -82 -59<br />
Source: Review Team estimates
FIGURE 6.1 NET BENEFITS OF PROCESSING FOR A TYPICAL YEAR<br />
K<strong>in</strong>a per cubic metre <strong>of</strong> log <strong>in</strong>put.<br />
100<br />
0<br />
-100<br />
-200<br />
-300<br />
Portable/<br />
relocatable<br />
eco-mill<br />
Small<br />
commercial<br />
mill<br />
Source: Review Team estimates<br />
Medium to<br />
large<br />
sawmill<br />
Integrated<br />
small<br />
sawmill<br />
Large<br />
export<br />
veneer<br />
mill<br />
FIGURE 6.2 EXPORT DUTY FOREGONE ON ‘EXPORTABLE’ LOGS PROCESSED<br />
Export plywood mill<br />
Export veneer mill<br />
Integrated sawmill<br />
Medium to large sawmill<br />
Small commercial mill<br />
Portable/ relocatable<br />
eco-mill<br />
Source: Review Team estimates<br />
2001 FOREST REVENUE REVIEW<br />
Large<br />
export<br />
plywood<br />
mill<br />
0 5,000 10,000 15,000 20,000 25,000<br />
K<strong>in</strong>a per annum<br />
Duty foregone per<br />
national employee<br />
Wages per national<br />
employee<br />
PAGE 95
2001 FOREST REVENUE REVIEW<br />
The problem can be largely traced back to <strong>the</strong> high level <strong>of</strong> export duty foregone on timber<br />
process<strong>in</strong>g. One <strong>of</strong> <strong>the</strong> most important benefits <strong>of</strong> timber process<strong>in</strong>g is that it generates employment<br />
for nationals. But for most process<strong>in</strong>g operations <strong>the</strong> tax foregone far outweighs <strong>the</strong> value <strong>of</strong> <strong>the</strong> extra<br />
wages generated. For example, for <strong>the</strong> medium to large sawmill <strong>the</strong> Government is forego<strong>in</strong>g around<br />
K20,000 to generate one national job pay<strong>in</strong>g K5,000 (see Figure 6.2). Expressed alternatively, <strong>the</strong><br />
Government could collect <strong>the</strong> export duty and employ four unskilled labourers on a community<br />
project that has flow-on benefits. Under <strong>the</strong> current policy it is <strong>in</strong> effect <strong>in</strong>stead choos<strong>in</strong>g to employ<br />
one unskilled labourer on a project that has relatively weaker flow-on effects. The economy is worse<br />
<strong>of</strong>f under such a policy.<br />
The level <strong>of</strong> <strong>the</strong> costs is primarily determ<strong>in</strong>ed by <strong>the</strong> level <strong>of</strong> export duty foregone. That is, <strong>the</strong> lower<br />
<strong>the</strong> export duty foregone <strong>the</strong> lower <strong>the</strong> costs imposed by process<strong>in</strong>g. Table 6.2 presents estimates <strong>of</strong><br />
how low <strong>the</strong> correct level <strong>of</strong> export duty would need to be before <strong>the</strong> calculated benefits <strong>of</strong> process<strong>in</strong>g<br />
outweigh <strong>the</strong> costs. We describe <strong>the</strong> level <strong>of</strong> duty at which <strong>the</strong> process<strong>in</strong>g operation passes <strong>the</strong> costbenefit<br />
test as <strong>the</strong> ‘breakeven’ export duty. For example, it is calculated that if <strong>the</strong> correct level <strong>of</strong><br />
export duty on log exports was US$4 per cubic metre, <strong>the</strong> export duty foregone would only be US$4<br />
per cubic metre and <strong>the</strong> medium to large mill would pass <strong>the</strong> cost-benefit test.<br />
The reduction required <strong>in</strong> <strong>the</strong> correct level <strong>of</strong> export duty to reach <strong>the</strong> ‘breakeven’ duty ranges from<br />
41 to 79 per cent (exclud<strong>in</strong>g <strong>the</strong> <strong>in</strong>tegrated saw mill which could receive a small subsidy and still pass<br />
<strong>the</strong> cost-benefit test). The calculated ‘breakeven’ level <strong>of</strong> duty is substantially below <strong>the</strong> average,<br />
actual level seen over <strong>the</strong> 1990s. This ‘breakeven’ level is unrealistically low and it is very unlikely<br />
that <strong>the</strong> correct level <strong>of</strong> export duty would be so low as to see <strong>the</strong> larger processors pass a cost-benefit<br />
test.<br />
TABLE 6.2 EXPORT DUTY UNDER DIFFERENT SCENARIOS<br />
Portable/ Small<br />
relocatable commercial<br />
eco-mill mill<br />
Export duty <strong>in</strong> US$ per m3 <strong>of</strong> log <strong>in</strong>put<br />
Medium<br />
to large<br />
sawmill<br />
Integrated<br />
small<br />
sawmill<br />
Large<br />
export<br />
veneer mill<br />
Large export<br />
plywood mill<br />
Currently foregone 31 35 35 15 16 16<br />
'Breakeven' export duty 8 9 6 15 6 8<br />
Average export duty paid across all log grades<br />
- from Jan 1996 to Sep 2001 24 24 24 24 24 24<br />
- from Jan 1990 to Sep 2001 27 27 27 27 27 27<br />
Source: Review Team estimates based on <strong>the</strong> data <strong>of</strong> Annex A.<br />
It is also important to consider <strong>the</strong> effect <strong>of</strong> relax<strong>in</strong>g <strong>the</strong> assumption that <strong>the</strong> process<strong>in</strong>g operation only<br />
exists because <strong>of</strong> <strong>the</strong> absence <strong>of</strong> export duties and landowner premiums. Do<strong>in</strong>g so allows us to better<br />
understand whe<strong>the</strong>r it is good public policy to forego export duties and landowners premium on<br />
processed logs.<br />
Assume that <strong>the</strong> process<strong>in</strong>g operation would have operated even if taxes and charges were levied at<br />
<strong>the</strong> same rate that would have applied had <strong>the</strong> log be<strong>in</strong>g exported. In which case <strong>the</strong> absence <strong>of</strong><br />
export duties and landowner premiums has no impact ⎯ <strong>the</strong> same operation exists regardless <strong>of</strong> <strong>the</strong><br />
concessions. This means <strong>the</strong>re are no benefits generated by <strong>the</strong> foregone export duties and landowner<br />
PAGE 96
2001 FOREST REVENUE REVIEW<br />
premiums. But <strong>the</strong>re would still be costs, flow<strong>in</strong>g from <strong>the</strong> foregone <strong>revenue</strong>. The provision <strong>of</strong><br />
concessions would clearly fail <strong>the</strong> cost-benefit test.<br />
Now assume that <strong>in</strong>stead <strong>the</strong> process<strong>in</strong>g operation could pay some export duty. This means that only<br />
a portion <strong>of</strong> <strong>the</strong> benefits described <strong>in</strong> Table 6.1 could be attributed to <strong>the</strong> policy <strong>of</strong> forego<strong>in</strong>g export<br />
duties and landowners premium. How much would depend on <strong>the</strong> capacity to pay.<br />
We know from Table 6.1 that <strong>the</strong> sawmills do have some capacity to pay export duty, even at current<br />
low prices. At <strong>the</strong> level <strong>of</strong> prices seen over recent years <strong>the</strong>y could almost pay <strong>the</strong> same level <strong>of</strong> duty<br />
as would be payable on an export log. This means that <strong>the</strong> benefits <strong>of</strong> forego<strong>in</strong>g export duty are<br />
considerably lower than <strong>the</strong> benefits quantified <strong>in</strong> Table 6.1. The costs <strong>of</strong> forego<strong>in</strong>g export duty<br />
substantially outweigh <strong>the</strong> benefits.<br />
The export veneer mill and large export plywood mill also has some capacity to pay export duty. A<br />
similar conclusion applies.<br />
It is very difficult to envisage how reasonable variations to <strong>the</strong> analysis could lead to <strong>the</strong> conclusion<br />
that a blanket policy <strong>of</strong> provid<strong>in</strong>g duty concessions makes Papua New Gu<strong>in</strong>ea better <strong>of</strong>f. The<br />
economic analysis suggests <strong>the</strong> policy makes <strong>the</strong> community, broadly def<strong>in</strong>ed, worse <strong>of</strong>f.<br />
It is also clearly helpful to consider <strong>the</strong> impact <strong>of</strong> <strong>the</strong> absence <strong>of</strong> export premiums on <strong>the</strong> economy <strong>in</strong><br />
<strong>the</strong> immediate vic<strong>in</strong>ity <strong>of</strong> a process<strong>in</strong>g plant. The ma<strong>in</strong> benefit <strong>of</strong> process<strong>in</strong>g to this nearby economy<br />
is via <strong>the</strong> payment <strong>of</strong> wages and salaries to national employees. Our fieldwork has concluded that<br />
typically most <strong>of</strong> <strong>the</strong>se employees are from <strong>the</strong> surround<strong>in</strong>g villages, and will spend <strong>the</strong>ir earn<strong>in</strong>gs <strong>in</strong><br />
<strong>the</strong> area. Even those employees from o<strong>the</strong>r regions spend most <strong>of</strong> <strong>the</strong>ir <strong>in</strong>come <strong>in</strong> <strong>the</strong> area<br />
surround<strong>in</strong>g <strong>the</strong> process<strong>in</strong>g plant. This expenditure provides an important boost to <strong>the</strong> nearby<br />
economy.<br />
But most landowners forego premiums on logs that are processed. This means <strong>the</strong>y have less money<br />
to spend <strong>in</strong> <strong>the</strong> absence <strong>of</strong> process<strong>in</strong>g. This represents a loss to <strong>the</strong> nearby economy.<br />
Which is larger – <strong>the</strong> benefit flow<strong>in</strong>g from wages and salaries, or <strong>the</strong> cost flow<strong>in</strong>g from premium<br />
foregone? Figure 6.3 presents estimates for <strong>the</strong> stylised process<strong>in</strong>g plants based on different<br />
assumptions regard<strong>in</strong>g log prices and <strong>the</strong> share <strong>of</strong> <strong>the</strong> national workforce account for by local people.<br />
In most cases <strong>the</strong> costs outweigh <strong>the</strong> benefits. That is, more money is foregone than is earned. Only<br />
<strong>the</strong> <strong>in</strong>tegrated sawmill and relocatable eco-mill <strong>of</strong>fer benefits greater than <strong>the</strong> costs.<br />
For <strong>the</strong> veneer and plywood mills and <strong>the</strong> large sawmill under <strong>the</strong> most favourable scenario, <strong>the</strong><br />
<strong>in</strong>jection to <strong>the</strong> nearby economy from wages and salaries is approximately equal to <strong>the</strong> loss from<br />
foregone premiums. But <strong>the</strong> local economy has to work to earn what it would have been given had<br />
<strong>the</strong>ir been no process<strong>in</strong>g (and <strong>the</strong> logs were exported). Clearly <strong>the</strong> local community is worse <strong>of</strong>f<br />
under even <strong>the</strong> most favourable scenarios. For <strong>the</strong>se operations, process<strong>in</strong>g would fail a cost benefit<br />
test conducted at a local level.<br />
PAGE 97
FIGURE 6.3 LANDOWNER PREMIUM FOREGONE ON PROCESSED ‘EXPORTABLE’ LOGS<br />
At current market prices when local labour accounts for<br />
90 per cent <strong>of</strong> <strong>the</strong> national workforce 50 per cent <strong>of</strong> <strong>the</strong> national workforce<br />
Large export<br />
plywood mill<br />
Large export<br />
veneer mill<br />
Integrated small<br />
sawmill<br />
Medium to large<br />
sawmill<br />
Small<br />
commercial mill<br />
Portable/<br />
relocatable ecomill<br />
0 10 20 30 40 50<br />
At <strong>the</strong> average US$ price seen over <strong>the</strong> last 4 years when local labour accounts for<br />
90 per cent <strong>of</strong> <strong>the</strong> national workforce 50 per cent <strong>of</strong> <strong>the</strong> national workforce<br />
Large export<br />
plywood mill<br />
Large export<br />
veneer mill<br />
Integrated small<br />
sawmill<br />
Medium to large<br />
sawmill<br />
Small<br />
commercial mill<br />
Portable/<br />
relocatable ecomill<br />
K<strong>in</strong>a per m3 <strong>of</strong> log <strong>in</strong>put<br />
0 10 20 30 40 50<br />
K<strong>in</strong>a per m3 <strong>of</strong> log <strong>in</strong>put<br />
Large export<br />
plywood mill<br />
Large export<br />
veneer mill<br />
Integrated small<br />
sawmill<br />
Medium to large<br />
sawmill<br />
Small<br />
commercial mill<br />
Portable/<br />
relocatable ecomill<br />
Large export<br />
plywood mill<br />
Large export<br />
veneer mill<br />
Integrated small<br />
sawmill<br />
Medium to large<br />
sawmill<br />
Small<br />
commercial mill<br />
Portable/<br />
relocatable ecomill<br />
Forgone landowners premium Wages for local employees<br />
When is larger than locals earn more money when a log is processed<br />
0 10 20 30 40 50<br />
K<strong>in</strong>a per m3 <strong>of</strong> log <strong>in</strong>put<br />
0 10 20 30 40 50<br />
K<strong>in</strong>a per m3 <strong>of</strong> log <strong>in</strong>put<br />
When is larger than locals earn more money when a log is exported (ie not processed)<br />
2001 FOREST REVENUE REVIEW<br />
Note: Based on <strong>the</strong> assumption that <strong>the</strong> landowner premium apply<strong>in</strong>g to: <strong>the</strong> export plywood mill is an<br />
average <strong>of</strong> <strong>the</strong> premium paid at Panakawa and Vanimo; <strong>the</strong> export veneer mill equals <strong>the</strong> premium<br />
paid at Panakawa; and for all o<strong>the</strong>r operations is <strong>the</strong> weighted average across all areas <strong>review</strong>ed<br />
exclud<strong>in</strong>g Panakawa. Rent or landowner premiums as drawn from Groome and Poyry (2000).<br />
PAGE 98
PART 7 THE DISTRIBUTION OF RESOURCE RENT<br />
7.1 AN APPROPRIATE DISTRIBUTION<br />
2001 FOREST REVENUE REVIEW<br />
Simple economic models suggest that logg<strong>in</strong>g companies need not reta<strong>in</strong> any <strong>of</strong> <strong>the</strong> resource rent<br />
earned on logg<strong>in</strong>g. The argument is that logg<strong>in</strong>g companies need only earn a normal rate <strong>of</strong> return <strong>in</strong><br />
order to be attracted to <strong>the</strong> <strong>in</strong>dustry. This is essentially because <strong>the</strong> normal rate <strong>of</strong> return is <strong>the</strong> best<br />
that logg<strong>in</strong>g companies could expect <strong>in</strong> an alternative <strong>in</strong>vestment (be<strong>in</strong>g an <strong>in</strong>vestment <strong>in</strong> ano<strong>the</strong>r<br />
sector <strong>of</strong> <strong>the</strong> economy). Anyth<strong>in</strong>g above this is seen as an unnecessary bonus. Duncan (1995) for<br />
example argues that logg<strong>in</strong>g companies should not reta<strong>in</strong> any <strong>of</strong> <strong>the</strong> resource rent (p. xvii). And <strong>the</strong><br />
National <strong>Forest</strong>ry Development Guidel<strong>in</strong>es prepared <strong>in</strong> 1993 proposed a <strong>revenue</strong> <strong>system</strong> that would<br />
have seen landowners and <strong>the</strong> Government capture 85 to 90 per cent <strong>of</strong> <strong>the</strong> resource rent (Economic<br />
Insights, 1996).<br />
But <strong>the</strong>re are a number <strong>of</strong> practical and <strong>the</strong>oretical reasons why it is unwise for Government and<br />
landowners to try and capture all <strong>the</strong> resource rent. In particular ⎯<br />
There is some uncerta<strong>in</strong>ty as to how exactly how high a normal, risk adjusted rate <strong>of</strong> return<br />
should be. If <strong>the</strong> normal rate <strong>of</strong> return is under-estimated, landowner and government taxes and<br />
charges will capture too much <strong>revenue</strong> and logg<strong>in</strong>g pr<strong>of</strong>its will be too low. The <strong>in</strong>dustry will<br />
tend to contract and this would reduce <strong>revenue</strong> collections. Attempts to collect all <strong>the</strong> resource<br />
rent run <strong>the</strong> risk <strong>of</strong> collect<strong>in</strong>g too much <strong>revenue</strong> <strong>in</strong> <strong>the</strong> short term, deterr<strong>in</strong>g activity and reduc<strong>in</strong>g<br />
<strong>revenue</strong> collections over <strong>the</strong> long term.<br />
Ma<strong>in</strong>ta<strong>in</strong><strong>in</strong>g <strong>the</strong> level <strong>of</strong> landowner or government charges at <strong>the</strong> maximum level will normally<br />
require reasonably sophisticated royalty and charg<strong>in</strong>g <strong>system</strong>s, and such <strong>system</strong>s are probably<br />
beyond <strong>the</strong> adm<strong>in</strong>istrative capacity <strong>of</strong> landowners and <strong>the</strong> Government and provide too many<br />
opportunities for malfeasance.<br />
Loggers can probably expect to capture part <strong>of</strong> <strong>the</strong> resource rent from <strong>forest</strong>ry <strong>in</strong> a number <strong>of</strong><br />
Papua New Gu<strong>in</strong>ea’s key competitors. Unless Papua New Gu<strong>in</strong>ea also <strong>of</strong>fers a share <strong>of</strong> <strong>the</strong> rent,<br />
it may be difficult to attract efficient logg<strong>in</strong>g companies.<br />
The logg<strong>in</strong>g companies face little if any <strong>in</strong>centive to maximise efficiency when <strong>the</strong>y do not<br />
receive any <strong>of</strong> <strong>the</strong> resource rent. If for example logg<strong>in</strong>g companies are only entitled to earn<br />
enough money to cover <strong>the</strong> cost <strong>of</strong> logg<strong>in</strong>g, and prices more than cover such costs, <strong>the</strong>y have no<br />
<strong>in</strong>centive to maximise <strong>the</strong> quality <strong>of</strong> a log through appropriate fell<strong>in</strong>g and transport practices.<br />
This is because <strong>the</strong>y receive <strong>the</strong> same payment for both a poor and high quality log. They would<br />
also tend to lack an <strong>in</strong>centive to get <strong>the</strong> market<strong>in</strong>g right as <strong>the</strong>y do not share <strong>in</strong> <strong>the</strong> higher price<br />
provided by better market<strong>in</strong>g, and <strong>the</strong>y may over-<strong>in</strong>vest <strong>in</strong> capital (a so-called Averch-Johnson<br />
effect).<br />
If all <strong>the</strong> resource rent is collected on successful projects, <strong>the</strong> <strong>revenue</strong> <strong>system</strong> will only be<br />
economically efficient if <strong>the</strong> landowners and Government fund all losses on unpr<strong>of</strong>itable (but<br />
efficient) operations, or alternatively allows all losses to be <strong>of</strong>fset aga<strong>in</strong>st <strong>the</strong> pr<strong>of</strong>its on<br />
successful projects. If not, <strong>the</strong> expected return across <strong>the</strong> <strong>in</strong>dustry will fall below a normal level<br />
and <strong>the</strong> <strong>in</strong>dustry will tend to contract (see Garnaut and Clunies Ross (1979) p.196). Because <strong>the</strong><br />
<strong>revenue</strong> <strong>system</strong> used <strong>in</strong> practice will typically not be so generous as to allow all costs <strong>of</strong> lossmak<strong>in</strong>g<br />
activities to be recovered, <strong>in</strong> practice a <strong>revenue</strong> <strong>system</strong> that sought 100 per cent <strong>of</strong> <strong>the</strong><br />
rent on successful projects would reduce <strong>the</strong> expected return below a normal level. This would<br />
defer <strong>in</strong>dustry development.<br />
One way <strong>of</strong> try<strong>in</strong>g to deal with uncerta<strong>in</strong>ty as to what is an appropriate share <strong>of</strong> resource rent to<br />
provide loggers is to auction <strong>the</strong> rights to timber resources. If logg<strong>in</strong>g companies do not require any<br />
PAGE 99
2001 FOREST REVENUE REVIEW<br />
share <strong>of</strong> <strong>the</strong> resource rent, <strong>the</strong>y will bid a price that transfers to <strong>the</strong> landowners and Government <strong>the</strong><br />
full resource rent. Or alternately, <strong>the</strong>y will bid that share <strong>of</strong> rent that <strong>the</strong> market is prepared to let <strong>the</strong><br />
government and landowners capture. However our assessment is that <strong>the</strong>re are too few operators <strong>in</strong><br />
<strong>the</strong> <strong>in</strong>dustry to ensure a competitive bidd<strong>in</strong>g process and a <strong>system</strong> <strong>of</strong> bidd<strong>in</strong>g would probably be<br />
abused (see Box 7.1 for an analysis <strong>of</strong> this issue).<br />
BOX 7.1 THE EXTENT OF COMPETITION IN THE FOREST INDUSTRY<br />
A simple <strong>in</strong>dicator <strong>of</strong> <strong>the</strong> extent <strong>of</strong> competition <strong>in</strong> a market can be provided by calculat<strong>in</strong>g measures <strong>of</strong> <strong>in</strong>dustry<br />
concentration. Such measures are used to <strong>in</strong>dicate <strong>the</strong> extent to which a market can be controlled by any large<br />
<strong>in</strong>dustry participants. That is, whe<strong>the</strong>r a market is subject to vigorous competition<br />
For example, <strong>the</strong> US Department <strong>of</strong> Justice and <strong>the</strong> Federal Trade Commission apply <strong>the</strong> Herf<strong>in</strong>dahl-Hirschman<br />
Index, an <strong>in</strong>dex derived from <strong>the</strong> market shares <strong>of</strong> <strong>in</strong>dividual suppliers. The <strong>in</strong>dex ranges from 0 to 10,000,<br />
where a value greater than 1,000 seen <strong>in</strong> <strong>the</strong> US as a sign that a market lacks effective competitive pressure<br />
(Carlton and Perl<strong>of</strong>f (2000), p.613). We estimate <strong>the</strong> relevant Herf<strong>in</strong>dahl-Hirschman Index for <strong>the</strong> PNG <strong>forest</strong><br />
<strong>in</strong>dustry as <strong>in</strong> <strong>the</strong> range <strong>of</strong> 1,500 to 2,500 (depend<strong>in</strong>g on assumed <strong>in</strong>ter-relationships among operators). This is a<br />
high number and is a warn<strong>in</strong>g sign that <strong>the</strong> <strong>in</strong>dustry may lack effective competition.<br />
These calculations are based on a market def<strong>in</strong>ed as <strong>the</strong> market for <strong>the</strong> rights to Papua New Gu<strong>in</strong>ea’s <strong>forest</strong><br />
resources. They also assume that <strong>the</strong> market shares <strong>in</strong> this market match each operator’s share <strong>of</strong> log exports as<br />
identified <strong>in</strong> SGS data.<br />
The calculated level <strong>of</strong> <strong>in</strong>dustry concentration is above what is normally seen as a critical level that m<strong>in</strong>or<br />
ref<strong>in</strong>ements to <strong>the</strong> assumed market shares are unlikely to alter <strong>the</strong> basic conclusion that it lacks effective<br />
competition. However, a much broader geographic scope <strong>of</strong> <strong>the</strong> market could lead to much lower estimates <strong>of</strong><br />
<strong>the</strong> extent <strong>of</strong> <strong>in</strong>dustry concentration. For example, if <strong>the</strong>re was one world market for <strong>the</strong> rights to access tropical<br />
timber, <strong>the</strong> market shares would probably be quite different. However, we consider that <strong>the</strong> relevant market is<br />
limited to Papua New Gu<strong>in</strong>ea for <strong>the</strong> follow<strong>in</strong>g reasons ⎯<br />
The likely presence <strong>of</strong> some economies from a larger operation.<br />
Substantial sunk costs, particularly <strong>in</strong> process<strong>in</strong>g.<br />
The superior knowledge <strong>of</strong> <strong>the</strong> resource held by exist<strong>in</strong>g operators and ga<strong>in</strong>ed through first-hand experience.<br />
The familiarity <strong>of</strong> exist<strong>in</strong>g operators with <strong>the</strong> regulatory <strong>system</strong> and country-specific risks.<br />
An implication <strong>of</strong> <strong>the</strong> above is that a standard tender<strong>in</strong>g process for <strong>the</strong> access rights to timber is extremely<br />
unlikely to be competitive. It is possible that <strong>new</strong> entrants may be attracted to bid for any tender <strong>of</strong> access<br />
rights, and this could <strong>in</strong>troduce an effective constra<strong>in</strong>t on <strong>the</strong> exist<strong>in</strong>g participants. In this way <strong>new</strong> entrants, or<br />
at least <strong>the</strong> threat <strong>of</strong> <strong>the</strong>ir entry could ensure a competitive outcome. However it is a high risk strategy to<br />
assume that such competitive pressures would emerge.<br />
Duncan (1995) recommended that a <strong>system</strong> <strong>of</strong> bidd<strong>in</strong>g for access rights be adopted. The above analysis<br />
suggests that such a bidd<strong>in</strong>g process would not be competitive and would lead to resource owners and <strong>the</strong><br />
Government receiv<strong>in</strong>g too little for <strong>the</strong> <strong>forest</strong> resources.<br />
In practice it is sensible for government and landowners to have <strong>in</strong> m<strong>in</strong>d a target share <strong>of</strong> <strong>the</strong> resource<br />
rent that can be drawn upon <strong>in</strong> design<strong>in</strong>g a <strong>revenue</strong> <strong>system</strong>.<br />
A potential benchmark for <strong>the</strong> level <strong>of</strong> resource rent to be collected is provided by <strong>the</strong> m<strong>in</strong><strong>in</strong>g and oil<br />
sector. 19 As well as pay<strong>in</strong>g an ad valorem royalty and company tax, <strong>the</strong> sector is subject to an<br />
additional pr<strong>of</strong>its tax (APT). This is an economically sophisticated royalty <strong>system</strong> based on <strong>the</strong><br />
resource rent tax developed for Papua New Gu<strong>in</strong>ea <strong>in</strong> <strong>the</strong> mid 1970s (see Garnaut and Clunies Ross<br />
(1975, 1979) and Emerson and Lloyd (1983)). The APT was orig<strong>in</strong>ally designed to collect 70-n per<br />
cent <strong>of</strong> <strong>the</strong> resource rent earned <strong>in</strong> <strong>the</strong> m<strong>in</strong><strong>in</strong>g and oil sector, where n is <strong>the</strong> company tax rate (see<br />
Daniel et al (2000)). This means <strong>the</strong> APT was designed to collect 40 per cent <strong>of</strong> <strong>the</strong> resource rent,<br />
19 The potential to use <strong>the</strong> m<strong>in</strong><strong>in</strong>g and oil sector as a benchmark was also noted <strong>in</strong> Shedden Agribus<strong>in</strong>ess (1991).<br />
PAGE 100
2001 FOREST REVENUE REVIEW<br />
with a fur<strong>the</strong>r 30 per cent to be collected via company tax. This would leave 30 per cent <strong>of</strong> <strong>the</strong><br />
resource rent for <strong>the</strong> operators. Current APT rates are somewhat below <strong>the</strong>se orig<strong>in</strong>al levels but <strong>the</strong><br />
Government still targets a collection <strong>of</strong> at least half <strong>the</strong> resource rent. With<strong>in</strong> Australia, <strong>the</strong> resource<br />
rent tax applied to most <strong>of</strong>fshore oil and gas is set at 40 per cent <strong>of</strong> <strong>the</strong> resource rent (with a company<br />
tax rate <strong>of</strong> 30 per cent also apply<strong>in</strong>g). 20<br />
There are no hard and fast rules on how much resource rent should be provided to operators, with <strong>the</strong><br />
decision <strong>in</strong> part a subjective one requir<strong>in</strong>g careful judgement. We conclude that a 70:30 split (ie.<br />
70 per cent to Government and landowners and 30 per cent to operators) is an appropriate distribution<br />
<strong>of</strong> <strong>the</strong> resource rent from logg<strong>in</strong>g.<br />
An important difference between <strong>the</strong> <strong>forest</strong> sector and <strong>the</strong> m<strong>in</strong><strong>in</strong>g and oil sector is <strong>the</strong> ownership <strong>of</strong><br />
<strong>the</strong> resource. M<strong>in</strong>eral and oil resources are owned by <strong>the</strong> State, and as <strong>the</strong> owner <strong>of</strong> <strong>the</strong> resource, <strong>the</strong><br />
National Government is clearly entitled to collect a share <strong>of</strong> <strong>the</strong> resource rent. But <strong>the</strong> <strong>forest</strong><br />
resources are owned by landowners (with <strong>the</strong> exception <strong>of</strong> a small area <strong>of</strong> plantations). Yet <strong>the</strong><br />
National Government has captured considerably more <strong>of</strong> <strong>the</strong> resource rent from <strong>forest</strong>ry than<br />
landowners have.<br />
Certa<strong>in</strong>ly <strong>the</strong> National Government has a legitimate right to recover <strong>the</strong> costs it <strong>in</strong>curs <strong>in</strong> manag<strong>in</strong>g <strong>the</strong><br />
<strong>forest</strong> sector (via <strong>the</strong> Papua New Gu<strong>in</strong>ea <strong>Forest</strong> Authority <strong>in</strong>clusive <strong>of</strong> SGS). This sets a m<strong>in</strong>imum<br />
level <strong>of</strong> National Government charges. This would normally be seen as a user charge. At present <strong>the</strong><br />
National Government spends around K21 million per annum manag<strong>in</strong>g <strong>the</strong> <strong>forest</strong> sector, which has<br />
typically been less than 20 per cent <strong>of</strong> its collections from export duty. 21<br />
The export duty has at various times been described as a means <strong>of</strong> correct<strong>in</strong>g for transfer pric<strong>in</strong>g or<br />
difficulties <strong>in</strong> adm<strong>in</strong>ister<strong>in</strong>g <strong>the</strong> company tax regime. 22 Even if such a justifications for <strong>the</strong> export tax<br />
are valid, <strong>the</strong>y do not address <strong>the</strong> question <strong>of</strong> an appropriate distribution. After all, <strong>the</strong> <strong>revenue</strong> could<br />
easily be returned to landowners if <strong>the</strong>y were <strong>the</strong> rightful ‘owners’ <strong>of</strong> <strong>the</strong> rent (<strong>in</strong> <strong>the</strong> same way that<br />
<strong>the</strong> <strong>Forest</strong> Service currently collects royalty on behalf <strong>of</strong> landowners and returns it to <strong>the</strong>m).<br />
There are no <strong>in</strong>dications that <strong>the</strong> export duty collected from <strong>the</strong> <strong>forest</strong> sector is returned to landowners<br />
<strong>in</strong> ei<strong>the</strong>r cash or non-cash form. Instead <strong>the</strong> export duty feeds <strong>in</strong>to general <strong>revenue</strong> that is<br />
re-distributed throughout Papua New Gu<strong>in</strong>ea via <strong>the</strong> budget process. One rationale for this<br />
re-distribution <strong>of</strong> <strong>the</strong> resource rent is provided by <strong>the</strong> aim expressed <strong>in</strong> <strong>the</strong> preface to <strong>the</strong> Constitution<br />
that <strong>forest</strong> resources be managed for all Papua New Gu<strong>in</strong>eans.<br />
Whe<strong>the</strong>r it is appropriate for <strong>the</strong> National Government to capture a share <strong>of</strong> <strong>the</strong> resource rent from<br />
<strong>forest</strong>ry and, if so, what share, is a value judgement best made through <strong>the</strong> political process.<br />
However, <strong>the</strong>re are three po<strong>in</strong>ts that appear reasonable to make ⎯<br />
The substantial decl<strong>in</strong>e <strong>in</strong> <strong>the</strong> share <strong>of</strong> rent captured by landowners over recent years appears to<br />
be un<strong>in</strong>tended and a consequence <strong>of</strong> <strong>the</strong> poor design <strong>of</strong> <strong>the</strong> <strong>revenue</strong> <strong>system</strong>. In particular, <strong>the</strong><br />
specification <strong>of</strong> <strong>the</strong> royalty and some landowner premiums <strong>in</strong> k<strong>in</strong>a per cubic metres has seen a<br />
decl<strong>in</strong>e <strong>in</strong> <strong>the</strong> US$ value <strong>of</strong> <strong>the</strong> payment and <strong>the</strong> Government earn far more from <strong>forest</strong>ry than<br />
landowners.<br />
20<br />
An important difference to Australia is that dividend imputation effectively removes company tax for domestic residents<br />
and substantially removes company tax for <strong>in</strong>dividuals. For domestic residents any resource rent distributed to<br />
shareholders would ultimately be taxed at <strong>the</strong> <strong>in</strong>dividual’s personal <strong>in</strong>come tax.<br />
21<br />
It is reasonable to argue that <strong>the</strong>se costs should have been added <strong>in</strong>to <strong>the</strong> cost <strong>of</strong> logg<strong>in</strong>g and <strong>the</strong>refore be excluded from<br />
<strong>the</strong> resource rent. However for ease <strong>of</strong> exposition we have excluded <strong>the</strong>se costs from logg<strong>in</strong>g costs.<br />
22<br />
For example, <strong>the</strong> World Bank (1999) presents <strong>the</strong> argument that <strong>the</strong> export duty compensates for poor company tax<br />
adm<strong>in</strong>istration.<br />
PAGE 101
2001 FOREST REVENUE REVIEW<br />
Landowners lose rent when timber is processed because landowner premium that would be paid<br />
on export logs is not payable on processed logs. As discussed <strong>in</strong> <strong>the</strong> cost benefit analysis, this<br />
practice makes landowners worse <strong>of</strong>f.<br />
There appears to be widespread support amongst government <strong>of</strong>ficials and most logg<strong>in</strong>g and<br />
process<strong>in</strong>g companies that <strong>the</strong> use <strong>of</strong> landowner payments be subject to tighter controls and<br />
directed to susta<strong>in</strong>able purposes. Some landowners consulted were also <strong>of</strong> this view. Many <strong>of</strong><br />
<strong>the</strong> stakeholders we consulted were <strong>of</strong> <strong>the</strong> view that most <strong>of</strong> <strong>the</strong> payments to landowners had<br />
been wasted and those from logged areas were made worse <strong>of</strong>f by logg<strong>in</strong>g.<br />
These considerations suggest that significant changes are warranted to both <strong>the</strong> distribution <strong>of</strong><br />
resource rent between logg<strong>in</strong>g companies and landowners and <strong>the</strong> use <strong>of</strong> payments to<br />
landowners.<br />
7.2 THOUGHTS ON IMPROVED MECHANISMS FOR DISTRIBUTING THE RESOURCE RENT<br />
The design <strong>of</strong> <strong>revenue</strong> <strong>system</strong>s <strong>in</strong>volves reach<strong>in</strong>g a trade-<strong>of</strong>f between compet<strong>in</strong>g objectives. As<br />
expla<strong>in</strong>ed <strong>in</strong> Box 7.1, ideally <strong>revenue</strong> <strong>system</strong>s would be –<br />
economically efficient, <strong>in</strong> that <strong>the</strong>y should allow all pr<strong>of</strong>itable logg<strong>in</strong>g to take place (subject to all<br />
non-f<strong>in</strong>ancial costs be<strong>in</strong>g met).<br />
equitable, <strong>in</strong> particular by provid<strong>in</strong>g a fair distribution <strong>of</strong> <strong>the</strong> resource rent between logg<strong>in</strong>g<br />
companies, landowners and government.<br />
be simple to adm<strong>in</strong>ister.<br />
provide a stable source <strong>of</strong> <strong>revenue</strong>.<br />
Typically a <strong>revenue</strong> <strong>system</strong> can only satisfy some <strong>of</strong> <strong>the</strong>se criteria. For example, a pure pr<strong>of</strong>it-based<br />
<strong>system</strong> that l<strong>in</strong>ked payments to <strong>the</strong> pr<strong>of</strong>its earned on each log would probably be economically<br />
efficient and equitable. But it would be too hard to adm<strong>in</strong>ister <strong>in</strong> Papua New Gu<strong>in</strong>ea and lead to<br />
unstable <strong>revenue</strong> flows (because payments vary as prices, costs and volumes change and all must be<br />
regularly monitored).<br />
A <strong>revenue</strong> <strong>system</strong> based on ad valorem rates (be<strong>in</strong>g a share <strong>of</strong> sales <strong>revenue</strong>), such as <strong>the</strong> current<br />
export duty, is simpler to adm<strong>in</strong>ister and provides more stable <strong>revenue</strong>. But it would tend to be<br />
<strong>in</strong>efficient and <strong>in</strong>equitable <strong>in</strong> that <strong>the</strong> charge could exceed <strong>the</strong> level <strong>of</strong> resource rent on some logs.<br />
This is particularly <strong>the</strong> case for high cost operations or high cost logs. Consider a case where a log<br />
sold for K200 cost K150 to log <strong>in</strong> one area but K180 <strong>in</strong> ano<strong>the</strong>r area. A fixed ad valorem rate <strong>of</strong> 20<br />
per cent <strong>of</strong> <strong>the</strong> log value would see a charge <strong>of</strong> K40 levied on <strong>the</strong>se logs. It would be pr<strong>of</strong>itable to<br />
harvest <strong>the</strong> lower cost log (because K200 > K150 + K40), but not <strong>the</strong> higher cost log (because K200 <<br />
K180 + K40). Thus, some o<strong>the</strong>rwise commercially viable logg<strong>in</strong>g would be ruled out under such a<br />
<strong>revenue</strong> <strong>system</strong> and this is economically <strong>in</strong>efficient.<br />
The simplest <strong>revenue</strong> <strong>system</strong> is based on specific charges, be<strong>in</strong>g a fixed K<strong>in</strong>a or US$ charge per unit<br />
<strong>of</strong> output. The exist<strong>in</strong>g landowners royalty is a specific charge set <strong>in</strong> K<strong>in</strong>a. Specific charges are<br />
simple to adm<strong>in</strong>ister because <strong>the</strong>y only require a measurement <strong>of</strong> log volume. And because <strong>the</strong><br />
charge is <strong>in</strong>dependent <strong>of</strong> log price or logg<strong>in</strong>g costs (only vary<strong>in</strong>g with volumes), <strong>the</strong>y provide<br />
relatively stable <strong>revenue</strong>. But <strong>the</strong>y are more <strong>in</strong>efficient and <strong>in</strong>equitable than ad valorem royalties. For<br />
example, if <strong>the</strong> specific charge is K40 and <strong>the</strong> price is K200 and costs are K150, it is pr<strong>of</strong>itable to log.<br />
But as soon as prices fall below K190 it is unpr<strong>of</strong>itable to log and over time logg<strong>in</strong>g would cease at<br />
<strong>the</strong>se prices. Specific charges need to be regularly adjusted if <strong>the</strong> adverse efficiency and equity<br />
effects are to be avoided.<br />
PAGE 102
2001 FOREST REVENUE REVIEW<br />
The current <strong>revenue</strong> <strong>system</strong> is a mixture <strong>of</strong> ad valorem charges (ie. <strong>the</strong> export duty, some landowners’<br />
premiums and miscellaneous levies) and specific charges (<strong>the</strong> landowner royalty and some landowner<br />
premiums). One <strong>of</strong> <strong>the</strong> weaknesses <strong>of</strong> <strong>the</strong> current <strong>system</strong> is that <strong>the</strong> export duty rates <strong>in</strong>crease as <strong>the</strong><br />
K<strong>in</strong>a price <strong>of</strong> logs <strong>in</strong>creases (because <strong>the</strong> duty thresholds are set <strong>in</strong> K<strong>in</strong>a terms). This means that <strong>the</strong><br />
share <strong>of</strong> rent captured by <strong>the</strong> government rises as <strong>the</strong> K<strong>in</strong>a depreciates. The problem with this is that<br />
<strong>the</strong> export logg<strong>in</strong>g <strong>in</strong>dustry is essentially a US$ <strong>in</strong>dustry, with <strong>revenue</strong> and most costs denom<strong>in</strong>ated <strong>in</strong><br />
US$s. A fall <strong>in</strong> <strong>the</strong> K<strong>in</strong>a has very little effect on <strong>the</strong> level <strong>of</strong> resource rent when correctly measured <strong>in</strong><br />
US$ terms. This means <strong>the</strong> government share <strong>of</strong> rent should not rise as <strong>the</strong> K<strong>in</strong>a falls. To be efficient<br />
and equitable, <strong>the</strong> government share <strong>of</strong> <strong>the</strong> resource rent should not vary as <strong>the</strong> K<strong>in</strong>a changes.<br />
This weakness <strong>of</strong> <strong>the</strong> current export duty is shown <strong>in</strong> Figures B.1 to B.3 <strong>of</strong> Annex B. As <strong>the</strong> K<strong>in</strong>a<br />
rises, <strong>the</strong> ratio <strong>of</strong> <strong>the</strong> government payment to resource rent can rise above 100 per cent (see Figure<br />
B.1). This will deter logg<strong>in</strong>g and is <strong>in</strong>equitable. At low US$ prices, <strong>the</strong> ratio <strong>of</strong> <strong>the</strong> government<br />
payment to resource rent is also greater than 100 per cent (see Figure B.2).<br />
The problem arises because <strong>the</strong> export duty is based on FOB <strong>revenue</strong> without any duty free threshold.<br />
In effect, this means that <strong>the</strong> duty is levied on costs and can be paid even when <strong>the</strong>re is no resource<br />
rent (ie. it is payable even when price falls below <strong>the</strong> logg<strong>in</strong>g cost). The level <strong>of</strong> export duties is also<br />
too high for high cost logg<strong>in</strong>g operations even under favourable prices (see Figure B.3).<br />
The weaknesses <strong>of</strong> <strong>the</strong> export duty <strong>system</strong> can be lessened if <strong>the</strong> duty thresholds are denom<strong>in</strong>ated <strong>in</strong><br />
US$ terms (or alternatively <strong>in</strong> K<strong>in</strong>a terms with regular adjustments for changes <strong>in</strong> <strong>the</strong> K<strong>in</strong>a). Under<br />
such a <strong>system</strong>, government charges are less likely to exceed <strong>the</strong> level <strong>of</strong> resource rent. This is shown<br />
<strong>in</strong> Figures B.4 to B.6 <strong>of</strong> Annex B, which looks at <strong>the</strong> <strong>revenue</strong> <strong>system</strong> that sets <strong>the</strong> export duty<br />
thresholds at <strong>the</strong> US$ level that applied when <strong>the</strong> current <strong>system</strong> was first <strong>in</strong>troduced (<strong>in</strong> late 1995).<br />
The performance <strong>of</strong> an efficient and equitable <strong>revenue</strong> <strong>system</strong> is summarised <strong>in</strong> Figures B.7 to B.9 <strong>of</strong><br />
Annex B. This <strong>system</strong> is based on an ad valorem export duty that provides a duty free threshold set at<br />
<strong>the</strong> estimated cost <strong>of</strong> logg<strong>in</strong>g. That is, export duty is only payable when <strong>the</strong> price exceeds <strong>the</strong> cost <strong>of</strong><br />
logg<strong>in</strong>g. Under such a <strong>system</strong> <strong>the</strong> ratio <strong>of</strong> <strong>the</strong> Government payment to resource rent is largely<br />
<strong>in</strong>variant to change <strong>in</strong> US$ prices, <strong>the</strong> K<strong>in</strong>a or logg<strong>in</strong>g costs.<br />
Under <strong>the</strong> current <strong>revenue</strong> <strong>system</strong> landowners are poorly placed to capture an appropriate distribution<br />
<strong>of</strong> <strong>the</strong> resource rent. A key contributor to this problem is <strong>the</strong> sett<strong>in</strong>g <strong>of</strong> <strong>the</strong> most landowner payments<br />
as a specific charge <strong>in</strong> K<strong>in</strong>a terms without a periodic adjustment for charges <strong>in</strong> US$ prices or <strong>the</strong><br />
K<strong>in</strong>a.<br />
The problem is illustrated <strong>in</strong> Figures B.1 to B.3 <strong>of</strong> Annex B. As <strong>the</strong> K<strong>in</strong>a falls, <strong>the</strong> landowners’ share<br />
<strong>of</strong> resource rent falls because <strong>the</strong> US$ value <strong>of</strong> <strong>the</strong> payment falls. Under <strong>the</strong> current <strong>revenue</strong> <strong>system</strong>,<br />
<strong>the</strong> government benefits from a fall <strong>in</strong> <strong>the</strong> K<strong>in</strong>a but landowners lose (see Figure B.2). The problem<br />
would be lessened if <strong>the</strong> K<strong>in</strong>a value <strong>of</strong> landowner payments had been periodically adjusted for<br />
charges <strong>in</strong> <strong>the</strong> K<strong>in</strong>a such that <strong>the</strong> US$ value had rema<strong>in</strong>ed at <strong>the</strong> orig<strong>in</strong>al level (seen at <strong>the</strong><br />
<strong>in</strong>troduction <strong>of</strong> <strong>the</strong> <strong>revenue</strong> <strong>system</strong>). The landowners also fail to share <strong>in</strong> <strong>the</strong> benefits <strong>of</strong> a ris<strong>in</strong>g US$<br />
price <strong>of</strong> logs (see Figure B.1).<br />
The efficiency and equity <strong>of</strong> <strong>the</strong> current landowner payment <strong>system</strong> could be improved by provid<strong>in</strong>g a<br />
l<strong>in</strong>k between <strong>the</strong> landowner royalty and <strong>the</strong> price <strong>of</strong> export logs, or better still <strong>the</strong> pr<strong>of</strong>itability <strong>of</strong><br />
operators. But a <strong>system</strong> that achieved this would be too complicated for landowners to negotiate or<br />
monitor effectively. An alternative solution is to reta<strong>in</strong> specific royalties but provide better<br />
<strong>in</strong>formation to landowners so <strong>the</strong>y can negotiate reasonable royalties and to also allow for periodic<br />
adjustments <strong>in</strong> <strong>the</strong> rate as <strong>the</strong> value <strong>of</strong> logs changes. Under this approach it would be desirable to set<br />
m<strong>in</strong>imum royalty rates as a safeguard aga<strong>in</strong>st <strong>the</strong> exploitation <strong>of</strong> landowners and as a reflection <strong>of</strong> <strong>the</strong><br />
non-f<strong>in</strong>ancial values <strong>of</strong> a <strong>forest</strong>.<br />
PAGE 103
BOX 7.2 CRITERIA USED TO ASSESS ROYALTY SYSTEMS<br />
2001 FOREST REVENUE REVIEW<br />
The performance <strong>of</strong> a royalty <strong>system</strong> is commonly assessed aga<strong>in</strong>st four criteria <strong>of</strong> economic efficiency, equity,<br />
adm<strong>in</strong>istrative simplicity and <strong>revenue</strong>. An economically efficient outcome is achieved when an economy’s<br />
resources are used <strong>in</strong> such a way as to maximise community welfare or wellbe<strong>in</strong>g (for a given distribution <strong>of</strong><br />
resources). In a simple situation it is normally reasonable to see this as achieved when <strong>the</strong> <strong>in</strong>come generated by<br />
an economy is maximised.<br />
Royalties can affect efficiency by chang<strong>in</strong>g <strong>the</strong> <strong>in</strong>centives fac<strong>in</strong>g a logger. For example, consider <strong>the</strong> case <strong>of</strong> a<br />
log that could be sold for K200 per cubic metre and logg<strong>in</strong>g costs exclud<strong>in</strong>g royalty (but <strong>in</strong>clud<strong>in</strong>g a normal rate<br />
<strong>of</strong> return for <strong>the</strong> logger on capital <strong>in</strong>vested) are K150 per cubic metre. This would leave a resource rent <strong>of</strong> K50<br />
per cubic metre. If <strong>the</strong> royalty on a log was fixed at K100 per cubic metre, it would not be pr<strong>of</strong>itable to fell <strong>the</strong><br />
tree and <strong>the</strong>re would be no <strong>in</strong>come for ei<strong>the</strong>r <strong>the</strong> landowner or logger. The resource rent would be foregone and<br />
<strong>the</strong> <strong>revenue</strong> <strong>system</strong> would be described as <strong>in</strong>efficient. But if <strong>the</strong> royalty was K30 per cubic metre for <strong>the</strong> log,<br />
logg<strong>in</strong>g would take place, <strong>the</strong> resource rent would be realised and both <strong>the</strong> landowner and logger would earn<br />
<strong>in</strong>come.<br />
Efficiency also has a time aspect. The <strong>forest</strong> should be harvested <strong>in</strong> such a way as to maximise <strong>the</strong> resource rent<br />
over time. So under some conditions it may make sense to set royalties at a high enough level to defer logg<strong>in</strong>g<br />
to a time when greater resource rent is achieved.<br />
It is important to note that environmental concerns are important when consider<strong>in</strong>g efficiency. A royalty <strong>system</strong><br />
that leads to excessive exploitation <strong>of</strong> <strong>the</strong> environment (eg because <strong>of</strong> over-logg<strong>in</strong>g) is very unlikely to<br />
maximise community welfare and would normally be considered economically <strong>in</strong>efficient.<br />
A second criterion used to assess royalty <strong>system</strong>s is equity. This ma<strong>in</strong>ly relates to <strong>the</strong> distribution <strong>of</strong> <strong>the</strong><br />
resource rent, where a key concern is that resource owners receive a fair payment for <strong>the</strong>ir logs. Two forms <strong>of</strong><br />
equity are commonly def<strong>in</strong>ed, horizontal equity and vertical equity. Horizontal equity can be thought <strong>of</strong> as<br />
be<strong>in</strong>g achieved when logs <strong>of</strong> similar value receive <strong>the</strong> same royalty, and achiev<strong>in</strong>g vertical equity requires a<br />
higher valued log pay<strong>in</strong>g a higher royalty than a lower valued log (as a share <strong>of</strong> rent). Ensur<strong>in</strong>g<br />
<strong>in</strong>ter-generational equity is also important.<br />
The two o<strong>the</strong>r criteria are adm<strong>in</strong>istrative simplicity and <strong>the</strong> capacity to generate predictable and/or stable<br />
<strong>in</strong>come. Adm<strong>in</strong>istrative simplicity covers <strong>the</strong> cost to logg<strong>in</strong>g companies <strong>of</strong> compliance and <strong>the</strong> cost to<br />
landowners and <strong>the</strong> government <strong>of</strong> adm<strong>in</strong>istration and enforcement. If a royalty <strong>system</strong> is difficult to<br />
understand, it would rank poorly aga<strong>in</strong>st <strong>the</strong> criterion.<br />
These four criterion can be <strong>in</strong> conflict. For example, a royalty set as a fixed rate per log is simple to adm<strong>in</strong>ister<br />
because calculat<strong>in</strong>g <strong>the</strong> total royalty only requires a log count. But it can deter logg<strong>in</strong>g if <strong>the</strong> rate is too high on<br />
high cost logs, and this leads to economic <strong>in</strong>efficiency. A royalty based on <strong>the</strong> value <strong>of</strong> <strong>the</strong> log is less likely to<br />
deter logg<strong>in</strong>g and more likely to provide an equitable outcome, but it is harder to adm<strong>in</strong>ister because <strong>the</strong> log<br />
value must be known.<br />
It is important that logg<strong>in</strong>g companies cover all costs <strong>in</strong>curred by <strong>the</strong> government <strong>in</strong> manag<strong>in</strong>g <strong>the</strong><br />
<strong>forest</strong>. Logg<strong>in</strong>g companies impose <strong>the</strong>se management costs on government through <strong>the</strong> need to<br />
oversee <strong>the</strong>ir operations, and as a general pr<strong>in</strong>ciple <strong>of</strong> public policy, those that impose costs should<br />
cover <strong>the</strong> cost. These management costs set a floor on <strong>the</strong> level <strong>of</strong> government charges. This<br />
m<strong>in</strong>imum level is best seen as a user charge ra<strong>the</strong>r than a distribution <strong>of</strong> rent. Unlike a royalty, a user<br />
charge paid by logg<strong>in</strong>g companies need not be related to <strong>the</strong> value <strong>of</strong> <strong>the</strong> logs harvested. Instead it<br />
should be related to <strong>the</strong> costs <strong>in</strong>curred <strong>in</strong> manag<strong>in</strong>g <strong>the</strong> <strong>forest</strong>.<br />
In sett<strong>in</strong>g a user charge to recover <strong>the</strong> cost <strong>of</strong> manag<strong>in</strong>g <strong>the</strong> <strong>forest</strong> sector, <strong>the</strong> dist<strong>in</strong>ction between fixed<br />
and variable costs is important. The PNG <strong>Forest</strong> Authority faces large fixed costs <strong>in</strong> establish<strong>in</strong>g a<br />
monitor<strong>in</strong>g <strong>system</strong>, such as <strong>in</strong> sett<strong>in</strong>g up an appropriate policy and regulatory environment, tra<strong>in</strong><strong>in</strong>g<br />
staff, vehicle purchase and sett<strong>in</strong>g up regional <strong>of</strong>fices. There is also a variable cost, largely<br />
attributable to <strong>the</strong> time spent prepar<strong>in</strong>g <strong>of</strong>ficial measurements <strong>of</strong> logs, <strong>review</strong><strong>in</strong>g operat<strong>in</strong>g practices<br />
etc. An efficient <strong>revenue</strong> <strong>system</strong> would recover fixed costs via fixed charges and variable charges<br />
l<strong>in</strong>ked to <strong>the</strong> source <strong>of</strong> variability <strong>in</strong> costs.<br />
PAGE 104
7.3 OTHER ISSUES<br />
2001 FOREST REVENUE REVIEW<br />
There is a surpris<strong>in</strong>gly low payment <strong>of</strong> company tax by <strong>the</strong> <strong>forest</strong> sector. As shown <strong>in</strong> Annex A,<br />
company tax payments for <strong>the</strong> sector as-a-whole are estimated to be less than 10 per cent <strong>of</strong> <strong>the</strong><br />
operat<strong>in</strong>g pr<strong>of</strong>it after depreciation <strong>of</strong> <strong>the</strong> log export sector even though <strong>the</strong> company tax rate is 30 per<br />
cent. There are at least two potential explanations for <strong>the</strong> low company tax payments. It is<br />
understood that <strong>the</strong>re are no checks or audits undertaken with<strong>in</strong> Government <strong>of</strong> <strong>the</strong> company tax<br />
returns <strong>of</strong> logg<strong>in</strong>g and timber process<strong>in</strong>g companies and <strong>the</strong> absence <strong>of</strong> <strong>the</strong>se checks could expla<strong>in</strong> <strong>the</strong><br />
low payments. It is important that such checks or audits are undertaken so as to ensure <strong>the</strong><br />
Government collects an appropriate payment and to curb any <strong>in</strong>correct record<strong>in</strong>g by <strong>the</strong> companies.<br />
This po<strong>in</strong>t was highlighted by <strong>the</strong> Bogan Review (see Bogan (2000)). A second explanation is that<br />
<strong>the</strong> pr<strong>of</strong>its on log exports are <strong>of</strong>fset by <strong>the</strong> losses on process<strong>in</strong>g. The extensive company tax<br />
concessions provided on process<strong>in</strong>g has probably added to <strong>the</strong> expansion <strong>of</strong> process<strong>in</strong>g and what is <strong>in</strong><br />
effect a dissipation <strong>of</strong> <strong>the</strong> pr<strong>of</strong>its from log exports. This highlights <strong>the</strong> potential costs <strong>of</strong> <strong>the</strong> current<br />
company tax concessions provided to process<strong>in</strong>g.<br />
A case can be made to exempt from export duty any plantation logs developed by <strong>the</strong> private sector<br />
(<strong>in</strong>clud<strong>in</strong>g landowners) at <strong>the</strong>ir own <strong>in</strong>itiative and cost provided that a fair price has been paid for <strong>the</strong><br />
<strong>in</strong>puts (<strong>in</strong> particular land). As a general pr<strong>in</strong>ciple resource rent should be acquired by <strong>the</strong> owner or<br />
generator <strong>of</strong> that rent, <strong>in</strong> this case <strong>the</strong> private sector, and <strong>the</strong>re is no basis for <strong>the</strong> Government seek<strong>in</strong>g<br />
to acquire a share via <strong>the</strong> export duty. Instead <strong>the</strong> Government is only entitled to normal <strong>in</strong>come taxes<br />
from company pr<strong>of</strong>its.<br />
However, it is noted that not all plantation timber is grown on land owned or leased by <strong>the</strong> private<br />
operator, a case <strong>in</strong> po<strong>in</strong>t be<strong>in</strong>g plantations developed by Stett<strong>in</strong> Bay Timber Company on State land<br />
(be<strong>in</strong>g around two-thirds <strong>of</strong> <strong>the</strong> plantation area developed by <strong>the</strong> company). Fur<strong>the</strong>r, if <strong>the</strong> plantation<br />
has been developed as an obligation <strong>of</strong> <strong>the</strong> timber access rights, it may be arguable that <strong>the</strong> landowner<br />
reta<strong>in</strong>s some rights <strong>in</strong> <strong>the</strong> plantation timber even though all costs have been paid directly by <strong>the</strong><br />
logg<strong>in</strong>g company.<br />
One <strong>of</strong> <strong>the</strong> problems faced <strong>in</strong> monitor<strong>in</strong>g <strong>the</strong> <strong>forest</strong> sector is <strong>the</strong> variability across data sources on <strong>the</strong><br />
level <strong>of</strong> activity. As shown <strong>in</strong> Table 7.1, <strong>the</strong> recent data from <strong>the</strong> Bank <strong>of</strong> Papua New Gu<strong>in</strong>ea<br />
(BoPNG) has underestimated <strong>the</strong> level <strong>of</strong> exports. This problem appears to arise from <strong>the</strong> BoPNG’s<br />
reliance on export documentation obta<strong>in</strong>ed from <strong>the</strong> bank<strong>in</strong>g sector ra<strong>the</strong>r than <strong>the</strong> more reliable SGS<br />
data. The differences are worth <strong>in</strong>vestigat<strong>in</strong>g.<br />
The PNG <strong>Forest</strong> Service records data on log exports from areas for which it manages royalty<br />
distribution. This is understood to be all areas o<strong>the</strong>r than LFA areas. But <strong>the</strong>re are small differences<br />
between SGS data on export volumes from non-LFA areas and <strong>the</strong> <strong>Forest</strong> Service data (see Table<br />
7.1). These differences may be worth <strong>in</strong>vestigat<strong>in</strong>g.<br />
PAGE 105
TABLE 7.1 COMPARISON OF ESTIMATED LOG EXPORTS<br />
Total Exports by Source<br />
Log exports <strong>in</strong> cubic metres<br />
2001 FOREST REVENUE REVIEW<br />
1994 1995 1996 1997 1998 1999 2000<br />
Internal Revenue<br />
Commission<br />
3,050,340 1,998,187 2,625,861 3,006,157 1,612,566 1,983,853 1,992,526<br />
BoPNG<br />
Selected Data<br />
2,943,900 2,512,500 2,607,400 2,375,900 1,066,900 1,312,300 1,398,500<br />
PNG <strong>Forest</strong> Service<br />
royalty collections<br />
2,005,829 2,070,124 2,275,701 2,520,839 1,198,291 2,004,066 1,896,232<br />
SGS (non LFA areas) n.a. n.a. n.a. 2,202,368 1,211,799 1,641,140 1,760,551<br />
Source: Internal Revenue Commission, SGS, Bank <strong>of</strong> Papua New Gu<strong>in</strong>ea Quarterly Economic Bullet<strong>in</strong>s and<br />
Papua New Gu<strong>in</strong>ea <strong>Forest</strong> Service<br />
Under <strong>the</strong> current export duty <strong>system</strong> logg<strong>in</strong>g companies are required to make <strong>the</strong>ir payments <strong>in</strong> k<strong>in</strong>a.<br />
This requires <strong>the</strong> companies to convert <strong>the</strong>ir US$ <strong>revenue</strong> <strong>in</strong>to k<strong>in</strong>a on <strong>the</strong> local foreign exchange<br />
market. The volatility <strong>in</strong> <strong>the</strong> k<strong>in</strong>a has encouraged exporters to time <strong>the</strong>ir local payments to take<br />
advantage <strong>of</strong> expected movements <strong>in</strong> <strong>the</strong> k<strong>in</strong>a. For example, if exporters expect <strong>the</strong> k<strong>in</strong>a to fall fur<strong>the</strong>r<br />
<strong>the</strong>y will tend to delay br<strong>in</strong>g<strong>in</strong>g US$ <strong>in</strong>to <strong>the</strong> foreign exchange market to take advantage <strong>of</strong> <strong>the</strong><br />
expected decl<strong>in</strong>e. This actually helps br<strong>in</strong>g forward <strong>the</strong> expected fall <strong>in</strong> <strong>the</strong> k<strong>in</strong>a and tends to add to<br />
<strong>the</strong> volatility <strong>in</strong> <strong>the</strong> k<strong>in</strong>a. Such strategic behaviour can be <strong>of</strong> particular concern when <strong>the</strong> balance <strong>of</strong><br />
payments position is very tight, such as most recently seen <strong>in</strong> mid 1999.<br />
An alternative approach would be to require <strong>the</strong> logg<strong>in</strong>g companies to make <strong>the</strong>ir export duty<br />
payments <strong>in</strong> US$. This would provide <strong>the</strong> Bank <strong>of</strong> Papua New Gu<strong>in</strong>ea additional control over foreign<br />
exchange and assist <strong>the</strong> Bank’s management <strong>of</strong> <strong>the</strong> foreign exchange market. A similar arrangement<br />
is understood to apply to <strong>the</strong> m<strong>in</strong><strong>in</strong>g and oil sector.<br />
PAGE 106
2001 FOREST REVENUE REVIEW<br />
PART 8 ESTIMATED ECONOMIC VALUE OF THE FOREST ESTATE<br />
8.1 THE RATIONALE FOR AN ECONOMIC VALUATION OF FORESTS<br />
The PNG Constitution (Fourth Goal) stipulates use <strong>of</strong> natural resources to derive maximum public<br />
welfare:<br />
“… for Papua New Gu<strong>in</strong>ea’s natural resources and environment to be conserved and used for <strong>the</strong><br />
collective benefit <strong>of</strong> us all, and to be replenished for <strong>the</strong> benefit <strong>of</strong> future generations.”<br />
Source: National <strong>Forest</strong> Policy, M<strong>in</strong>istry <strong>of</strong> <strong>Forest</strong>s, 1991<br />
The current <strong>forest</strong> <strong>revenue</strong> regime consists <strong>of</strong> a tax <strong>system</strong> for commercial-scale logg<strong>in</strong>g activities. It<br />
is focussed on captur<strong>in</strong>g a share <strong>of</strong> f<strong>in</strong>ancial proceeds from <strong>the</strong> sale <strong>of</strong> commercially harvested logs.<br />
The primary underp<strong>in</strong>n<strong>in</strong>g <strong>of</strong> <strong>the</strong> tax schedule is <strong>the</strong> perceived ability <strong>of</strong> firms operat<strong>in</strong>g <strong>in</strong> PNG to<br />
pay export taxes and royalties, based on <strong>the</strong> volume <strong>of</strong> timber harvested.<br />
In addition to <strong>the</strong> proceeds <strong>of</strong> commercial-scale harvest<strong>in</strong>g, <strong>forest</strong>s <strong>in</strong> PNG provide a multitude <strong>of</strong><br />
values, <strong>in</strong> <strong>the</strong> form <strong>of</strong> tangible goods and services used directly by landowners, and <strong>in</strong>direct benefits<br />
<strong>in</strong>clud<strong>in</strong>g ma<strong>in</strong>tenance <strong>of</strong> basic production <strong>in</strong>puts such as soil and water. They also evoke <strong>in</strong>tangible<br />
values relat<strong>in</strong>g to natural heritage and culture. Moreover, <strong>the</strong>y may hold commercial and noncommercial<br />
assets that are as yet <strong>in</strong>accessible, i.e. <strong>the</strong>y have an option value.<br />
It will be difficult for landowners and government to maximize and susta<strong>in</strong> <strong>forest</strong>-derived welfare<br />
without some understand<strong>in</strong>g <strong>of</strong> <strong>the</strong>se values and how <strong>the</strong>y may be chang<strong>in</strong>g over time or affected by<br />
current uses. Most pert<strong>in</strong>ent to this work is modify<strong>in</strong>g <strong>the</strong> current tax <strong>system</strong> so that it recognizes a<br />
fuller range <strong>of</strong> <strong>forest</strong> values, promotes <strong>the</strong> efficient use and beneficial evolution <strong>of</strong> <strong>the</strong>se values over<br />
time, and prevents <strong>the</strong>m from leak<strong>in</strong>g out <strong>of</strong> <strong>the</strong> country.<br />
The flow <strong>of</strong> <strong>forest</strong> values is capable <strong>of</strong> be<strong>in</strong>g disrupted, dim<strong>in</strong>ished, or enhanced by commercial-scale<br />
harvest<strong>in</strong>g activities. The scope, scale, and developmental pace <strong>of</strong> commercial activities is, <strong>in</strong> turn,<br />
affected by <strong>the</strong> type <strong>of</strong> tax structure imposed on <strong>the</strong> <strong>forest</strong> <strong>in</strong>dustry (among o<strong>the</strong>r variables). The flow<br />
<strong>of</strong> non-commercial benefits from <strong>forest</strong>s, consequently, is affected by how commercial scale entities<br />
are taxed and managed.<br />
Chang<strong>in</strong>g <strong>the</strong> basis <strong>of</strong> <strong>the</strong> <strong>forest</strong> <strong>revenue</strong> regime from <strong>the</strong> firm’s ability to pay to national welfare<br />
requires acknowledg<strong>in</strong>g that <strong>forest</strong>s have multiple values that vary spatially and can be dim<strong>in</strong>ished or<br />
enhanced by commercial-scale timber production activities. Realign<strong>in</strong>g <strong>the</strong> basis <strong>of</strong> PNG’s <strong>forest</strong><br />
<strong>revenue</strong> regime <strong>in</strong> this way would seem to make an important aspect <strong>of</strong> <strong>forest</strong> policy significantly<br />
more compatible with <strong>the</strong> country’s constitution.<br />
In terms <strong>of</strong> human welfare maximization, <strong>the</strong>re are additional reasons to address <strong>the</strong> full range <strong>of</strong><br />
<strong>forest</strong> values. Many aspects <strong>of</strong> <strong>forest</strong> use result <strong>in</strong> positive or negative outcomes that do not affect <strong>the</strong><br />
behaviour <strong>of</strong> primary <strong>forest</strong> users. Of concern is when <strong>the</strong> use by one party results <strong>in</strong> <strong>the</strong> loss <strong>of</strong><br />
benefits by ano<strong>the</strong>r <strong>forest</strong> user. For example, commercial timber cuts that do not adhere to established<br />
codes <strong>of</strong> practice may <strong>in</strong>directly dim<strong>in</strong>ish <strong>the</strong> availability <strong>of</strong> high quality dr<strong>in</strong>k<strong>in</strong>g water and <strong>the</strong><br />
reproductive success <strong>of</strong> food fish <strong>in</strong> adjacent locations. The loss <strong>of</strong> <strong>the</strong>se benefits (some time later)<br />
does not directly <strong>in</strong>fluence <strong>the</strong> behaviour <strong>of</strong> <strong>the</strong> logg<strong>in</strong>g firm; it does impose costs upon o<strong>the</strong>r <strong>forest</strong><br />
users. If such costs could be recognized, a basis for avoid<strong>in</strong>g or compensat<strong>in</strong>g for <strong>the</strong>m can be<br />
established. Likewise, recogniz<strong>in</strong>g <strong>the</strong> <strong>in</strong>direct benefits <strong>forest</strong>s provide (e.g., ma<strong>in</strong>tenance <strong>of</strong> dr<strong>in</strong>k<strong>in</strong>g<br />
water supplies) is a first step toward captur<strong>in</strong>g such values <strong>in</strong> ways that directly and positively affect<br />
PAGE 107
2001 FOREST REVENUE REVIEW<br />
<strong>the</strong> efficiency <strong>of</strong> <strong>forest</strong> allocation. Valuation can provide <strong>the</strong> raw material for more efficient <strong>forest</strong> use<br />
decisions.<br />
Yet even an <strong>in</strong>timate knowledge <strong>of</strong> <strong>the</strong> range <strong>of</strong> <strong>forest</strong> values does not guarantee that <strong>forest</strong>s will be<br />
used <strong>in</strong> <strong>the</strong> best manner possible for <strong>the</strong> collective benefit <strong>of</strong> <strong>the</strong> nation. In large part, know<strong>in</strong>g values<br />
is <strong>of</strong> limited use unless actions that will result <strong>in</strong> full capture or <strong>in</strong>ternalisation <strong>of</strong> <strong>the</strong> values by <strong>the</strong><br />
parties who dictate <strong>forest</strong> use can be successfully implemented. For example, <strong>the</strong>re are <strong>in</strong>dividuals<br />
outside PNG who are will<strong>in</strong>g to pay toward <strong>the</strong> protection and management <strong>of</strong> <strong>the</strong> biodiversity<br />
conta<strong>in</strong>ed <strong>in</strong> some <strong>forest</strong>s. There is currently no mechanism that would allow such <strong>in</strong>dividuals to act<br />
on <strong>the</strong>se <strong>in</strong>tentions by provid<strong>in</strong>g tangible benefits to landowners; consequently, such conservation<br />
values are unlikely to affect landowner decisions. Likewise, <strong>the</strong> decisions <strong>of</strong> a logg<strong>in</strong>g firm that is<br />
<strong>in</strong>directly impos<strong>in</strong>g costs on o<strong>the</strong>r <strong>forest</strong> users is unlikely to change unless such costs can be imposed<br />
directly on <strong>the</strong> firm.<br />
The first step <strong>in</strong> mitigat<strong>in</strong>g <strong>the</strong> above situations is more fully account<strong>in</strong>g for values associated with<br />
current use <strong>of</strong> <strong>forest</strong>s (i.e. mov<strong>in</strong>g from a f<strong>in</strong>ancial to an economic underp<strong>in</strong>n<strong>in</strong>g), and recogniz<strong>in</strong>g<br />
where important values are be<strong>in</strong>g externalised from <strong>forest</strong> use decisions or escap<strong>in</strong>g capture by <strong>the</strong><br />
nation altoge<strong>the</strong>r. Invariably, some <strong>of</strong> <strong>the</strong>se values will be attached to tangible direct benefits while<br />
o<strong>the</strong>rs are l<strong>in</strong>ked to <strong>in</strong>direct services and <strong>in</strong>tangible values people attach to <strong>forest</strong>s (mak<strong>in</strong>g some<br />
values simple and o<strong>the</strong>rs nearly impossible to address quantitatively). Underp<strong>in</strong>n<strong>in</strong>g a <strong>forest</strong> <strong>revenue</strong><br />
<strong>system</strong> with an economic derivation <strong>of</strong> <strong>the</strong> full range <strong>of</strong> <strong>forest</strong> values will <strong>in</strong>volve address<strong>in</strong>g both <strong>of</strong><br />
<strong>the</strong>se types <strong>of</strong> values.<br />
8.2 FOCUS: NATURAL FOREST LOGGING<br />
This first effort is focused on obta<strong>in</strong><strong>in</strong>g a more realistic view <strong>of</strong> <strong>the</strong> value to PNG <strong>of</strong> natural <strong>forest</strong><br />
logg<strong>in</strong>g, given that this <strong>review</strong> is tasked with reorient<strong>in</strong>g <strong>the</strong> underp<strong>in</strong>n<strong>in</strong>g <strong>of</strong> <strong>the</strong> (<strong>in</strong>dustrial-scale)<br />
<strong>forest</strong> <strong>revenue</strong> regime. It is a departure from previous <strong>revenue</strong> <strong>review</strong>s because it formally recognizes<br />
non-logg<strong>in</strong>g values <strong>of</strong> <strong>forest</strong>s. It focuses on account<strong>in</strong>g for a greater spectrum <strong>of</strong> values associated<br />
with natural <strong>forest</strong> logg<strong>in</strong>g to obta<strong>in</strong> a partial picture <strong>of</strong> <strong>the</strong> value <strong>of</strong> logg<strong>in</strong>g from <strong>the</strong> societal welfare<br />
or economic perspective, ra<strong>the</strong>r than <strong>the</strong> perspective <strong>of</strong> maximiz<strong>in</strong>g rent capture from exist<strong>in</strong>g<br />
commercial stands.<br />
PNG <strong>forest</strong>s underp<strong>in</strong> <strong>in</strong>calculable goods and services for <strong>the</strong> country. Attempt<strong>in</strong>g to value all <strong>of</strong> <strong>the</strong>m<br />
comprehensively without a notion <strong>of</strong> which decision problems need to be addressed first is unlikely to<br />
promote <strong>forest</strong> policies that result <strong>in</strong> enhanced and last<strong>in</strong>g benefits from <strong>forest</strong>s. Natural <strong>forest</strong> logg<strong>in</strong>g<br />
is seen as <strong>the</strong> start<strong>in</strong>g po<strong>in</strong>t for economic valuation because it occupies centre stage <strong>in</strong> <strong>the</strong> <strong>forest</strong><br />
sector, from <strong>the</strong> <strong>in</strong>dustrial-scale perspective <strong>of</strong> government. For many years it has been relied upon to<br />
capture significant levels <strong>of</strong> foreign currency us<strong>in</strong>g a <strong>revenue</strong> regime. <strong>Forest</strong> plantations and<br />
process<strong>in</strong>g <strong>in</strong>dustry have played relatively small roles <strong>in</strong> currency capture to date; hence, <strong>the</strong>y are not<br />
analysed directly <strong>in</strong> this effort. There are additional reasons:<br />
Natural <strong>forest</strong> stands are, for practical purposes, not a fully re<strong>new</strong>able resource. Hence, as<br />
available stands become smaller, a national asset is dim<strong>in</strong>ished <strong>in</strong> value.<br />
Third-party effects stemm<strong>in</strong>g from <strong>the</strong> environmental ramifications <strong>of</strong> natural <strong>forest</strong> logg<strong>in</strong>g are<br />
more significant relative to o<strong>the</strong>r <strong>forest</strong> uses that are ei<strong>the</strong>r currently or potentially relevant to <strong>the</strong><br />
current <strong>revenue</strong> regime.<br />
Natural <strong>forest</strong> logg<strong>in</strong>g is probably <strong>in</strong> a state <strong>of</strong> decl<strong>in</strong>e, given current and probable future external<br />
market conditions and <strong>the</strong> size and nature <strong>of</strong> rema<strong>in</strong><strong>in</strong>g natural stands <strong>in</strong> PNG. Consequently,<br />
<strong>the</strong>re is a grow<strong>in</strong>g need to structure <strong>the</strong> tax <strong>system</strong> so that it facilitates a smooth transition away<br />
from a dependence on natural <strong>forest</strong> logg<strong>in</strong>g.<br />
PAGE 108
8.3 A FIRST STEP TOWARD ECONOMIC VALUATION<br />
2001 FOREST REVENUE REVIEW<br />
The goal <strong>of</strong> this work is to articulate a pragmatic <strong>in</strong>cremental process for generat<strong>in</strong>g such an economic<br />
underp<strong>in</strong>n<strong>in</strong>g. It takes several broad steps:<br />
Creates a partial picture <strong>of</strong> PNG’s <strong>forest</strong> values by us<strong>in</strong>g <strong>the</strong> range <strong>of</strong> values derived throughout <strong>the</strong><br />
world’s humid tropical <strong>forest</strong>s to suggest <strong>in</strong>dicative values that are likely to have some transferability<br />
to PNG. While some quantitative estimates are employed, <strong>the</strong> effort is focused on illum<strong>in</strong>at<strong>in</strong>g <strong>the</strong><br />
relative magnitude and significance <strong>of</strong> <strong>the</strong> full range <strong>of</strong> <strong>forest</strong> values, not provid<strong>in</strong>g an absolute<br />
derivation.<br />
Recommends steps that can be used to ga<strong>in</strong> <strong>in</strong>creas<strong>in</strong>gly more accurate pictures <strong>of</strong> PNG <strong>forest</strong> values,<br />
and, most importantly, l<strong>in</strong>k such studies to <strong>the</strong> most press<strong>in</strong>g <strong>forest</strong> policy problems.<br />
Specifically, it takes several steps to derive an economic underp<strong>in</strong>n<strong>in</strong>g for <strong>the</strong> <strong>forest</strong> <strong>revenue</strong> regime:<br />
The f<strong>in</strong>ancial pr<strong>of</strong>itability <strong>of</strong> logg<strong>in</strong>g and rent capture by government and landowners is used a<br />
start<strong>in</strong>g po<strong>in</strong>t.<br />
Recogniz<strong>in</strong>g that logg<strong>in</strong>g <strong>in</strong>curs unaccounted costs that directly affect human welfare, it uses<br />
available <strong>in</strong>formation and simple assumptions to beg<strong>in</strong> account<strong>in</strong>g for <strong>the</strong> most significant and<br />
quantifiable costs. Costs considered are related to environmental and social effects <strong>of</strong> logg<strong>in</strong>g, and <strong>the</strong><br />
fact that <strong>the</strong> <strong>in</strong>itial natural <strong>forest</strong> cut is worth substantially more than any subsequent cuts.<br />
It also recognizes that logg<strong>in</strong>g creates assets (e.g. <strong>in</strong>frastructure) and secondary flow-on benefits that<br />
are not captured by f<strong>in</strong>ancial analyses but which also affect human welfare. Attempts are also made to<br />
account for <strong>the</strong>se factors.<br />
It notes limitations and takes steps to circumvent <strong>the</strong>m:<br />
It acknowledges that <strong>in</strong>formation necessary to quantitatively and comprehensively estimate <strong>forest</strong><br />
values is ei<strong>the</strong>r unavailable or <strong>in</strong>complete at this time.<br />
It takes a subjective venture at estimat<strong>in</strong>g economic values <strong>in</strong> order to <strong>in</strong>itiate a process.<br />
It concedes that some values will never be quantified and, <strong>the</strong>refore, must be represented and<br />
accounted for us<strong>in</strong>g o<strong>the</strong>r means, assum<strong>in</strong>g <strong>the</strong>y are important to press<strong>in</strong>g decisions.<br />
It recognizes that <strong>the</strong>re is significant spatial and temporal variability with respect to <strong>the</strong>se values.<br />
Therefore, this work derives lower-bound values that can be applied more broadly with greater<br />
confidence.<br />
It focuses on values that could be affected by commercial logg<strong>in</strong>g activities upon which export<br />
duties and landowner royalties are imposed.<br />
8.4 THE ROLE OF FOREST TAXATION<br />
Current tax policy captures and distributes <strong>forest</strong> rent result<strong>in</strong>g from <strong>the</strong> harvest and export <strong>of</strong> raw<br />
logs on a commercial scale. In turn, it <strong>in</strong>fluences <strong>the</strong> behaviour <strong>of</strong> firms that, <strong>in</strong> <strong>the</strong> process <strong>of</strong><br />
generat<strong>in</strong>g f<strong>in</strong>ancial benefits, are capable <strong>of</strong> impos<strong>in</strong>g direct or <strong>in</strong>direct costs and benefits on <strong>forest</strong><br />
users. There are several categories: environmental and social costs result<strong>in</strong>g from <strong>the</strong> biophysical and<br />
social ramifications <strong>of</strong> logg<strong>in</strong>g operations; displacement <strong>of</strong> o<strong>the</strong>r potential <strong>forest</strong> uses that could result<br />
<strong>in</strong> <strong>the</strong> capture <strong>of</strong> non-commercial benefits; follow-on or multiplier effects from employment and<br />
developed <strong>in</strong>frastructure.<br />
Address<strong>in</strong>g <strong>the</strong> welfare effects from <strong>the</strong> complex mix <strong>of</strong> economic costs and benefits would almost<br />
certa<strong>in</strong>ly require a range <strong>of</strong> <strong>in</strong>stitutional, political, and social <strong>in</strong>terventions. Tax policy may be able to<br />
contribute <strong>in</strong> several dist<strong>in</strong>ct ways:<br />
PAGE 109
2001 FOREST REVENUE REVIEW<br />
Account<strong>in</strong>g for benefits and costs that are external to <strong>the</strong> f<strong>in</strong>ancial decisions made by logg<strong>in</strong>g<br />
operators, but that have welfare effects for landowners and <strong>the</strong> nation.<br />
Account<strong>in</strong>g for effects on <strong>the</strong> public goods that are necessary to ma<strong>in</strong>ta<strong>in</strong><strong>in</strong>g a constant flow <strong>of</strong><br />
<strong>forest</strong> values.<br />
Creation <strong>of</strong> an economic environment <strong>in</strong> which <strong>the</strong> decision to engage <strong>in</strong> commercial logg<strong>in</strong>g is<br />
made with a fuller view <strong>of</strong> <strong>the</strong> value <strong>of</strong> alternatives.<br />
Elim<strong>in</strong>ation <strong>of</strong> some opportunities for malfeasance that result <strong>in</strong> <strong>the</strong> leakage <strong>of</strong> <strong>forest</strong> values out<br />
<strong>of</strong> PNG.<br />
Specifically, limited <strong>forest</strong> valuation can provide <strong>the</strong> basis for <strong>in</strong>form<strong>in</strong>g effective tax policy<br />
<strong>in</strong>tervention if certa<strong>in</strong> conditions are met:<br />
Values are directly relevant to a decision problem relat<strong>in</strong>g to <strong>forest</strong> use, enhancement, or<br />
protection (i.e. values reflect <strong>the</strong> real <strong>in</strong>centives fac<strong>in</strong>g <strong>forest</strong> resource users and owners).<br />
Pert<strong>in</strong>ent values can be ascerta<strong>in</strong>ed precisely enough so that decisions that rest upon <strong>the</strong>m result<br />
<strong>in</strong> enhanced economic welfare most <strong>of</strong> <strong>the</strong> time (<strong>in</strong> a fashion that is believable and relatively<br />
simple to expla<strong>in</strong>).<br />
Tax imposition holds promise for <strong>in</strong>terfac<strong>in</strong>g previously displaced or unrecognised <strong>forest</strong> values<br />
with on-<strong>the</strong>-ground <strong>forest</strong> allocation and management decisions, and overall <strong>forest</strong> allocation<br />
policy for <strong>the</strong> nation.<br />
Several specific decision problems could be addressed with an amended tax policy that is underp<strong>in</strong>ned<br />
by knowledge <strong>of</strong> <strong>the</strong> full range <strong>of</strong> economic values.<br />
8.4.1 <strong>Forest</strong> Asset Depletion<br />
<strong>Forest</strong>s have a f<strong>in</strong>ite potential to provide a return to <strong>forest</strong> users through <strong>the</strong> myriad <strong>of</strong> possible uses<br />
(what is be<strong>in</strong>g realized may be ano<strong>the</strong>r matter). Any activity that results <strong>in</strong> <strong>the</strong> reduction <strong>of</strong> such<br />
potential is impos<strong>in</strong>g a cost on future users. Commercial harvest <strong>of</strong> natural <strong>forest</strong> <strong>in</strong>volves <strong>the</strong><br />
liquidation <strong>of</strong> a resource (i.e. <strong>in</strong>itial cuts <strong>of</strong> natural <strong>forest</strong>) that is non-re<strong>new</strong>able. Subsequent cuts will<br />
command significantly lower f<strong>in</strong>ancial returns, assum<strong>in</strong>g <strong>the</strong>y are viable. Tax<strong>in</strong>g natural <strong>forest</strong> cuts<br />
potentially solves this <strong>in</strong>tergenerational equity problem if tax proceeds are successfully used to create<br />
alternative assets (e.g. education, <strong>in</strong>frastructure) that fairly compensate future users for <strong>the</strong> loss <strong>of</strong><br />
potential returns from <strong>the</strong> <strong>in</strong>itial cut.<br />
8.4.2 Landowner Costs<br />
Environmental and social disruption (even under <strong>the</strong> best circumstances) imposes costs on<br />
landowners. The real value <strong>of</strong> logg<strong>in</strong>g to landowners, consequently, is equal to <strong>the</strong> payments made to<br />
<strong>the</strong>m m<strong>in</strong>us such costs 23 . Unanticipated costs borne by landowners have reduced <strong>the</strong> real returns <strong>of</strong><br />
logg<strong>in</strong>g to landowners. The effect is acute where multiplier benefits from logg<strong>in</strong>g are weak and<br />
appropriate and well-ma<strong>in</strong>ta<strong>in</strong>ed <strong>in</strong>frastructure falls short <strong>of</strong> expectations. The effect is probably most<br />
acutely felt <strong>in</strong> areas that upon project <strong>in</strong>ception had no previous experience with <strong>the</strong> implications <strong>of</strong><br />
logg<strong>in</strong>g. The problem is almost certa<strong>in</strong>ly exacerbated if landowners were not aware <strong>of</strong> alternative<br />
economic options or <strong>the</strong> commercial value <strong>of</strong> trees on <strong>the</strong>ir land when agreements to log were made.<br />
<strong>Forest</strong> taxation may be able to partially rectify <strong>the</strong> problem by identify<strong>in</strong>g some payments as<br />
compensation for <strong>the</strong>se costs. Efficiency is enhanced when <strong>the</strong> behaviour <strong>of</strong> loggers and <strong>the</strong> sites<br />
selected for logg<strong>in</strong>g are tied directly to a more complete account<strong>in</strong>g <strong>of</strong> relevant costs and benefits.<br />
23 The focus is on costs because at least some <strong>of</strong> <strong>the</strong> secondary benefits from logg<strong>in</strong>g have been accounted for through a<br />
formal audit process. Audits identify <strong>the</strong> cost <strong>of</strong> developed <strong>in</strong>frastructure and award credits toward <strong>in</strong>dustry payments to<br />
government and landowners (See Groome Poyry report).<br />
PAGE 110
8.4.3 Sub-optimal Selection <strong>of</strong> Logg<strong>in</strong>g Over Alternatives<br />
2001 FOREST REVENUE REVIEW<br />
Mean<strong>in</strong>gful consideration <strong>of</strong> <strong>the</strong> full value <strong>of</strong> <strong>forest</strong>s means that commercial logg<strong>in</strong>g is one <strong>of</strong><br />
numerous options that, <strong>in</strong> welfare maximization terms, should “compete” aga<strong>in</strong>st o<strong>the</strong>rs to provide <strong>the</strong><br />
greatest welfare to owners. The current tax <strong>system</strong>, because <strong>of</strong> its orientation around logg<strong>in</strong>g,<br />
potentially biases land use <strong>in</strong> favour <strong>of</strong> logg<strong>in</strong>g: It <strong>in</strong>stigates a powerful political force by creat<strong>in</strong>g<br />
f<strong>in</strong>ancial flows that are augmented by <strong>the</strong> one-<strong>of</strong>f payment from natural <strong>forest</strong> cuts. Moreover,<br />
logg<strong>in</strong>g is supported and promoted by a government agency (PNGFA), a favourable condition that<br />
does not apply to many alternatives. A tax <strong>system</strong> that contributes to <strong>the</strong>se ends can do landowners<br />
and <strong>the</strong> government a disservice by encourag<strong>in</strong>g <strong>the</strong>m to select logg<strong>in</strong>g without giv<strong>in</strong>g unbiased<br />
consideration to alternatives.<br />
In addition to <strong>the</strong> focus on commercial logg<strong>in</strong>g <strong>the</strong>re are o<strong>the</strong>r factors that <strong>in</strong>hibit <strong>the</strong> capture <strong>of</strong> all<br />
<strong>forest</strong> values: some <strong>forest</strong> goods and services are tied to national or global markets that rema<strong>in</strong><br />
<strong>in</strong>accessible to landowners that decide <strong>forest</strong> use. For example, <strong>the</strong>re is a national demand for <strong>the</strong><br />
ma<strong>in</strong>tenance <strong>of</strong> ecological functions (to conserve soil and protect water quality) required to ensure<br />
that <strong>forest</strong>s assets can cont<strong>in</strong>ue to provide a steady return to human endeavours. If <strong>the</strong>y are not<br />
ma<strong>in</strong>ta<strong>in</strong>ed, <strong>the</strong>n <strong>the</strong> supply <strong>of</strong> valuable factors <strong>of</strong> production (such as fertile cropp<strong>in</strong>g land) decl<strong>in</strong>es<br />
and benefits are lost. It is a rational response <strong>of</strong> landowners – and loggers – to ignore <strong>the</strong> potential<br />
effects on ecological functions if <strong>the</strong>re is no benefit or cost to <strong>the</strong>ir action (logg<strong>in</strong>g operations are,<br />
after all, pr<strong>of</strong>it maximiz<strong>in</strong>g firms beholden to shareholders). The same situation arises <strong>in</strong> relation to<br />
global markets for biodiversity services and carbon <strong>of</strong>fsets.<br />
There are potential solutions available <strong>in</strong> <strong>the</strong> form <strong>of</strong> mechanisms that may bridge <strong>the</strong> gap between<br />
local costs (<strong>the</strong> economic environment faced by landowners and loggers) and global benefits. The<br />
premise is that <strong>forest</strong>-derived welfare would <strong>in</strong>crease if local-level <strong>forest</strong> users could tap <strong>in</strong>to national<br />
and <strong>in</strong>ternational markets for <strong>forest</strong> goods. In o<strong>the</strong>r words, some potential markets are be<strong>in</strong>g<br />
overlooked, most notably <strong>the</strong> national market for ecological functions that form a cornerstone <strong>of</strong> many<br />
land-based economic options, and biodiversity services, an emerg<strong>in</strong>g market on which PNG may be <strong>in</strong><br />
a premier position to capitalize.<br />
8.4.4 Flow-on or Multiplier Effects<br />
In addition to direct payments made to government and landowners, natural <strong>forest</strong> logg<strong>in</strong>g results <strong>in</strong><br />
o<strong>the</strong>r <strong>in</strong>direct benefits not normally accounted for <strong>in</strong> f<strong>in</strong>ancial analyses:<br />
Employment is created at logg<strong>in</strong>g sites (private) or by government (public) that has both direct<br />
benefits (wages) and flow-on effects (boost to consumption). Employees pay taxes that augment<br />
<strong>the</strong> direct benefits to government and flow-on effects result<strong>in</strong>g from government budget<br />
expenditure (e.g. boost to consumption).<br />
Infrastructure is created ei<strong>the</strong>r by logg<strong>in</strong>g companies or through government-sponsored<br />
programs. It creates direct benefits and can promote flow-on <strong>in</strong>direct benefits that are l<strong>in</strong>ked to<br />
better access to markets, improved education, and better health care.<br />
The direct values are relatively simple to treat quantitatively. These generally <strong>in</strong>volve <strong>the</strong> sum total <strong>of</strong><br />
wages to PNG National and cost <strong>of</strong> developed <strong>in</strong>frastructure. Account<strong>in</strong>g for <strong>the</strong> <strong>in</strong>direct flow-on<br />
effects is a much more difficult and <strong>in</strong>formation-<strong>in</strong>tensive exercise. Flow-on effects only occur <strong>in</strong> <strong>the</strong><br />
presence <strong>of</strong> a sufficiently developed and diversified domestic economic architecture that can facilitate<br />
<strong>the</strong> spread and augmentation <strong>of</strong> wealth effects and o<strong>the</strong>r benefits.<br />
For example, when a wage earner spends <strong>in</strong>come <strong>in</strong> a remote area <strong>in</strong> which mostly imported goods are<br />
available, few flow-on benefits are created (currency is leaked out <strong>of</strong> <strong>the</strong> country and few if any jobs<br />
are created for nationals <strong>in</strong> <strong>the</strong> process <strong>of</strong> support<strong>in</strong>g such transactions). Roads created for logg<strong>in</strong>g<br />
PAGE 111
2001 FOREST REVENUE REVIEW<br />
purposes may only marg<strong>in</strong>ally enhance access to markets (spawn<strong>in</strong>g <strong>new</strong> bus<strong>in</strong>esses) if <strong>the</strong>y are not<br />
part <strong>of</strong> a plann<strong>in</strong>g process that recognizes non-logg<strong>in</strong>g needs, and if o<strong>the</strong>r aspects <strong>of</strong> successful<br />
bus<strong>in</strong>ess development (such as human skills or knowledge <strong>of</strong> untapped markets) are absent 24 . Sealed<br />
roads may reduce <strong>the</strong> ma<strong>in</strong>tenance costs <strong>of</strong> vehicles, but this may produce few flow-on benefits if<br />
vehicles are imported, and primarily owned and ma<strong>in</strong>ta<strong>in</strong>ed by expatriates or outsiders. Schools<br />
produce few benefits if skilled teachers are not consistently available to teach <strong>in</strong> <strong>the</strong>m.<br />
In short, flow-on or multiplied benefits are likely to be scant where economic structure is undeveloped<br />
or <strong>in</strong>complete, markets are immature, or distorted by monopolistic elements, and necessary support<strong>in</strong>g<br />
elements (such as government services) are absent. The degree to which such conditions prevent flowon<br />
benefits <strong>in</strong> PNG is highly variable across <strong>the</strong> country: some areas will benefit significantly while<br />
o<strong>the</strong>rs almost not at all.<br />
8.5 ESTIMATING THE FULL RANGE OF FOREST VALUES<br />
Economists commonly conceptualise <strong>forest</strong> values by us<strong>in</strong>g <strong>the</strong> total economic value (TEV) <strong>of</strong> an<br />
environmental asset method (See Pearce and Turner, 1990) 25 . TEV divides all values <strong>in</strong>to use and<br />
non-use values that are, <strong>in</strong> turn, subdivided aga<strong>in</strong> <strong>in</strong>to various o<strong>the</strong>r categories. Many <strong>of</strong> <strong>the</strong><br />
subcategories relate to <strong>in</strong>tangible values such as option and existence values <strong>of</strong> <strong>forest</strong>s. While<br />
<strong>in</strong>tangible values are likely to be important <strong>in</strong> PNG, <strong>the</strong>y are not valued <strong>in</strong> this work for several<br />
reasons: <strong>the</strong>re is a paucity <strong>of</strong> data and <strong>in</strong>formation relat<strong>in</strong>g to <strong>the</strong>m, and resource owners and<br />
government cannot easily capture <strong>the</strong>m (and thus <strong>the</strong>y have a very small bear<strong>in</strong>g on how <strong>forest</strong>s are<br />
actually used and managed).<br />
Still, a significant step is taken toward replac<strong>in</strong>g <strong>the</strong> f<strong>in</strong>ancial underp<strong>in</strong>n<strong>in</strong>g <strong>of</strong> today’s <strong>revenue</strong> regime<br />
with an economic one. A spreadsheet model is specified that accounts for previously overlooked<br />
<strong>forest</strong> values that broadly affect human welfare <strong>in</strong> PNG <strong>in</strong> <strong>the</strong> short and long-term. It estimates both<br />
<strong>the</strong> f<strong>in</strong>ancial return and <strong>the</strong> economic (welfare) value <strong>of</strong> natural <strong>forest</strong> logg<strong>in</strong>g from <strong>the</strong> perspective <strong>of</strong><br />
<strong>the</strong> nation. Every national is assumed to receive logg<strong>in</strong>g benefits ei<strong>the</strong>r directly as a landowner,<br />
<strong>in</strong>directly through government, or both. Hence, <strong>the</strong> total value is equal to <strong>the</strong> sum <strong>of</strong> net benefits<br />
enjoyed by landowners and government.<br />
The focus <strong>of</strong> this effort is account<strong>in</strong>g for several types <strong>of</strong> use values:<br />
The value <strong>of</strong> <strong>the</strong> depreciation <strong>of</strong> natural <strong>forest</strong>s as an asset due to <strong>the</strong> commercial value <strong>of</strong> <strong>the</strong><br />
first natural <strong>forest</strong> cut 26 ,<br />
The costs that landowners bear when commercial-scale logg<strong>in</strong>g operations impact local-level<br />
environments, and<br />
The flow-on or multiplier effects from logg<strong>in</strong>g (simple equations for both f<strong>in</strong>ancial and economic<br />
value <strong>of</strong> natural <strong>forest</strong> logg<strong>in</strong>g are found <strong>in</strong> Table 8.1 below). These first two values are selected<br />
because <strong>the</strong>y meet several criteria:<br />
<strong>the</strong>y directly relate to tangible goods derived from <strong>forest</strong>s that are commonly used to satisfy<br />
landowner needs for stable foods, shelter, and livelihood security (thus spatial variability is<br />
likely to be relatively small).<br />
<strong>the</strong>y represent <strong>forest</strong> benefits that are commonly enjoyed by <strong>the</strong> vast majority <strong>of</strong> <strong>the</strong><br />
population <strong>in</strong> PNG and can be reasonably valued <strong>in</strong> a believable fashion us<strong>in</strong>g exist<strong>in</strong>g<br />
24<br />
This is especially true if <strong>the</strong>y are ma<strong>in</strong>ta<strong>in</strong>ed exclusively for <strong>the</strong> purpose <strong>of</strong> logg<strong>in</strong>g and left <strong>in</strong> a state <strong>of</strong> disrepair after<br />
logg<strong>in</strong>g <strong>in</strong> <strong>the</strong> area has term<strong>in</strong>ated.<br />
25<br />
A full explanation <strong>of</strong> TEV is beyond <strong>the</strong> scope <strong>of</strong> this report.<br />
26<br />
The <strong>forest</strong> is treated as an asset that can be employed to ei<strong>the</strong>r deliver streams <strong>of</strong> benefits over time <strong>in</strong> its current form, or<br />
be partially transformed to o<strong>the</strong>r types <strong>of</strong> assets capable <strong>of</strong> deliver<strong>in</strong>g equal or greater benefit streams.<br />
PAGE 112
2001 FOREST REVENUE REVIEW<br />
<strong>in</strong>formation and a few simple assumptions (thus <strong>the</strong>y represent values that are easily<br />
perceived and widely cared about <strong>in</strong> <strong>the</strong> short-term).<br />
account<strong>in</strong>g for <strong>the</strong>m is consistent with PNG’s constitution.<br />
The effort is prelim<strong>in</strong>ary because it uses lower-bound values for tangible goods and <strong>in</strong>direct benefits<br />
only (derived from transfer values) 27 , and does not account for all <strong>forest</strong> values. In order to take a first<br />
step that can be broadly accepted, estimates <strong>of</strong> landowner costs and <strong>forest</strong> asset depletion are<br />
conservative, and estimates <strong>of</strong> flow-on effects give <strong>the</strong> benefit <strong>of</strong> <strong>the</strong> doubt to logg<strong>in</strong>g enterprises,<br />
despite <strong>the</strong> fact that significant flow-on effects seem unproven given <strong>the</strong> <strong>in</strong>complete and distorted<br />
nature <strong>of</strong> many economic <strong>system</strong>s observed dur<strong>in</strong>g field visits to logg<strong>in</strong>g sites. While this effort<br />
should be used to adjust <strong>the</strong> <strong>system</strong> to reflect some previously disregarded costs and benefits, it should<br />
be followed up with more complete economic estimates <strong>of</strong> <strong>forest</strong> values that are, at least <strong>in</strong> part, based<br />
on empirical data collected <strong>in</strong> PNG. Also, thought should be given to creat<strong>in</strong>g an alternative to<br />
method (that does not rely on multipliers) for estimat<strong>in</strong>g flow-on effects, especially for areas<br />
characterized by <strong>in</strong>complete and distorted economic <strong>system</strong>s that are highly isolated from major<br />
market channels.<br />
The primary output <strong>of</strong> <strong>the</strong> model is estimates <strong>of</strong> <strong>the</strong> both <strong>the</strong> f<strong>in</strong>ancial and economic value to<br />
landowners and government <strong>of</strong> a typical natural <strong>forest</strong> logg<strong>in</strong>g operation. On balance, <strong>the</strong> economic<br />
value <strong>of</strong> logg<strong>in</strong>g is different from <strong>the</strong> f<strong>in</strong>ancial value from <strong>the</strong> national perspective because <strong>the</strong><br />
economic analysis <strong>in</strong>troduces additional costs and benefits (see Table 8.1).<br />
Commercial-scale logg<strong>in</strong>g concessions generate monetary flows that are tied to <strong>the</strong> value <strong>of</strong> natural<br />
<strong>forest</strong> cuts. The vast majority <strong>of</strong> cuts are from stands that have accumulated over 100 years or longer<br />
and can deliver a premium one-<strong>of</strong>f value that can’t be duplicated. Subsequent cuts will generate a<br />
substantially lower return to all parties <strong>in</strong>volved (40% lower is assumed for this work). This leaves<br />
future landowners with an asset that is able to deliver only about 60% <strong>of</strong> what current owners enjoy<br />
(<strong>in</strong> terms <strong>of</strong> commercial logg<strong>in</strong>g and almost certa<strong>in</strong>ly o<strong>the</strong>r goods and services).<br />
The model accounts for <strong>the</strong> loss <strong>of</strong> <strong>the</strong> one-<strong>of</strong>f value by estimat<strong>in</strong>g <strong>the</strong> cost <strong>of</strong> creat<strong>in</strong>g an alternative<br />
asset that is equal <strong>in</strong> monetary value (<strong>in</strong> present value terms) to 40% <strong>of</strong> <strong>the</strong> first cut. Specifically, it<br />
estimates <strong>the</strong> cost <strong>of</strong> enrichment plant<strong>in</strong>g and <strong>forest</strong> management that would be required to ensure that<br />
a second cut is viable (and likely to be worth about 60% <strong>of</strong> <strong>the</strong> first cut). It also simulates <strong>the</strong> creation<br />
<strong>of</strong> an alternative asset by estimat<strong>in</strong>g <strong>the</strong> monetary flow required to generate an annuity 28 that would be<br />
worth 40% <strong>of</strong> <strong>the</strong> <strong>in</strong>itial cut after 40 years (<strong>the</strong> end <strong>of</strong> <strong>the</strong> first cutt<strong>in</strong>g cycle). Investment <strong>in</strong> plantations<br />
and process<strong>in</strong>g operations also create assets that are worth <strong>the</strong> value <strong>of</strong> susta<strong>in</strong>able employment,<br />
<strong>in</strong>frastructure, and last<strong>in</strong>g follow-on effects that would be available to multiple generations <strong>of</strong> Papua<br />
New Gu<strong>in</strong>eans.<br />
Landowner environmental costs valued are tied to subsistence activities, small-scale cash cropp<strong>in</strong>g,<br />
collection <strong>of</strong> non-timber <strong>forest</strong> products (NTFPs), and ecological functions that ma<strong>in</strong>ta<strong>in</strong> soil stability,<br />
water supply quality, and o<strong>the</strong>r hydrologic and geomorphologic conditions that underlie rural<br />
economies across PNG. It is assumed that environmental disturbance will result <strong>in</strong> costs to<br />
landowners, even under ideal conditions <strong>in</strong> which logg<strong>in</strong>g codes <strong>of</strong> practice are followed.<br />
Environmental costs can take on numerous forms: for example, sago palms and o<strong>the</strong>r food-bear<strong>in</strong>g<br />
trees may be accidentally disturbed, sediment flow regimes negatively altered, and labour<br />
requirements to collect stable goods such as firewood or build<strong>in</strong>g materials <strong>in</strong>creased. Moreover, for<br />
27<br />
Given <strong>the</strong> high spatial variability across PNG <strong>of</strong> conditions that <strong>in</strong>fluence such values and <strong>the</strong> general paucity <strong>of</strong> good<br />
empirical <strong>in</strong>formation, a conservative approach is taken to target lower bound values that can be applied more broadly<br />
with greater confidence (employ<strong>in</strong>g a “base case” scenario). Long-term recommendations address <strong>the</strong> need to undertake<br />
empirically based work that encompasses a greater scope <strong>of</strong> values that can be captured. There is also a need to identify<br />
how values change accord<strong>in</strong>g to vary<strong>in</strong>g site characteristics.<br />
28<br />
Use <strong>of</strong> an annuity fund is strictly for <strong>the</strong> purpose <strong>of</strong> simulat<strong>in</strong>g a lost benefit and does not imply that this mechanism<br />
should be recommended for implementation.<br />
PAGE 113
2001 FOREST REVENUE REVIEW<br />
all <strong>the</strong> trees cut and exported, <strong>the</strong>re will be potentially valuable stems destroyed for which landowners<br />
collect no compensation.<br />
To an uncerta<strong>in</strong> degree, logg<strong>in</strong>g natural <strong>forest</strong>s is <strong>in</strong>compatible with o<strong>the</strong>r <strong>forest</strong> uses. The model<br />
estimates <strong>the</strong> value <strong>of</strong> displaced goods and services (only) by assum<strong>in</strong>g that logg<strong>in</strong>g displaces about<br />
one-third <strong>of</strong> <strong>the</strong> total value <strong>of</strong> <strong>the</strong>se benefits (to derive landowner environmental costs). All values are<br />
based on lower-bound estimates <strong>of</strong> local-level goods and services that represent <strong>the</strong> m<strong>in</strong>imum core<br />
benefits which typical rural communities derive from natural <strong>forest</strong>s. Given that <strong>the</strong>re is little<br />
empirical data on subsistence values, NTFPs, and ecological function value, a range <strong>of</strong> values is<br />
employed that are transferred from numerous studies <strong>of</strong> resource use by rural communities <strong>in</strong> tropical<br />
<strong>forest</strong>s <strong>in</strong> o<strong>the</strong>r counties. A proxy or placeholder value is derived us<strong>in</strong>g <strong>the</strong> lower end <strong>of</strong> <strong>the</strong> range <strong>of</strong><br />
values reported <strong>in</strong> an array <strong>of</strong> studies (primary source <strong>of</strong> summarised values: L<strong>in</strong>ddal and Lubowski,<br />
1999).<br />
Normally, <strong>the</strong> value <strong>of</strong> <strong>the</strong> next best alternative (opportunity cost) is also accounted for <strong>in</strong> economic<br />
valuations. Opportunity costs are assumed to be zero <strong>in</strong> <strong>the</strong> model, due to <strong>the</strong> large perceived<br />
variability <strong>of</strong> such alternatives, and <strong>the</strong> likelihood <strong>in</strong> many areas that ano<strong>the</strong>r economic option<br />
(especially one that viably generates cash) is unavailable <strong>in</strong> <strong>the</strong> near term.<br />
The flow-on effects from logg<strong>in</strong>g are accounted for us<strong>in</strong>g simple multipliers (that magnify <strong>the</strong> value<br />
<strong>of</strong> direct benefits to simulate a flow-on value). They multiply <strong>the</strong> value <strong>of</strong> direct payment made to<br />
government, wages paid to PNG Nationals, and estimates <strong>of</strong> <strong>the</strong> value <strong>of</strong> developed <strong>in</strong>frastructure.<br />
Flow-on effects are equal to about one-third <strong>of</strong> <strong>the</strong> total direct value (e.g. export taxes and salaries<br />
paid); this means that for every three K<strong>in</strong>a collected through <strong>the</strong> <strong>forest</strong> <strong>revenue</strong> regime, ano<strong>the</strong>r 1 K<strong>in</strong>a<br />
<strong>in</strong> value is created through secondary economic activity. The assumed multiplier should be viewed at<br />
this time as “placeholder” that recognize that flow-on values exist, but is very prelim<strong>in</strong>ary and has<br />
virtually no known empirical basis. Obviously, more work is needed <strong>in</strong> this area.<br />
TABLE 8.1 MODEL DEFINITIONS – RENT, FINANCIAL AND ECONOMIC RETURNS<br />
<strong>Forest</strong> Rent = F<strong>in</strong>ancial Return = Economic Return =<br />
fob International Price ($US per<br />
cubic metre)<br />
–<br />
Cost <strong>of</strong> logg<strong>in</strong>g (private fixed and<br />
variable cost to <strong>in</strong>dustry, <strong>in</strong>clud<strong>in</strong>g<br />
‘normal’ pr<strong>of</strong>its)<br />
Sum <strong>of</strong> rent captured by<br />
government (1)<br />
–<br />
Cost <strong>of</strong> adm<strong>in</strong>ister<strong>in</strong>g <strong>the</strong> logg<strong>in</strong>g<br />
<strong>in</strong>dustry (<strong>forest</strong> authority and<br />
SGS)<br />
+<br />
Sum <strong>of</strong> rent captured by<br />
landowners (2)<br />
Sum <strong>of</strong> rent captured by<br />
government (1)<br />
–<br />
Cost <strong>of</strong> adm<strong>in</strong>ister<strong>in</strong>g <strong>the</strong> logg<strong>in</strong>g<br />
<strong>in</strong>dustry (<strong>forest</strong> authority and<br />
SGS)<br />
+<br />
Sum <strong>of</strong> rent captured by<br />
landowners (2)<br />
–<br />
Landowner costs: environmental<br />
and social costs <strong>of</strong> logg<strong>in</strong>g<br />
–<br />
<strong>Forest</strong> asset depletion<br />
+<br />
Flow-on/multiplier effects (from<br />
employment, <strong>in</strong>frastructure,<br />
expenditure effects)<br />
–<br />
Opportunity cost <strong>of</strong> next best<br />
alternative to logg<strong>in</strong>g<br />
PAGE 114
2001 FOREST REVENUE REVIEW<br />
1. Proceeds from export taxes, re<strong>forest</strong>ation and agricultural levies.<br />
2. Proceeds from royalties, Project Development Benefits (received as <strong>in</strong>frastructure and cash),<br />
negotiated premiums, and employment salaries.<br />
To estimate f<strong>in</strong>ancial and economic returns to landowners and government, <strong>the</strong> model simulates a<br />
base case natural <strong>forest</strong> logg<strong>in</strong>g enterprise <strong>in</strong> PNG (Table 8.2).<br />
TABLE 8.2 BASE CASE MODEL – NATURAL FOREST LOGGING IN PNG, ASSUMPTIONS AND SOURCES<br />
Parameters Assumptions Sources<br />
Timber yield (<strong>in</strong> operable area): 30 m 3 per hectare Review team assumption<br />
Gross concession area: 150,000 hectares Review team assumption<br />
Net operable area (65% <strong>of</strong> gross): 97,500 hectares Review team assumption<br />
Project time horizon: 40 years Review team assumption<br />
Area harvested annually: 2,437.5 hectares = Operable area /time horizon<br />
Annual export volume: 73,125 m 3 = Area harvested annually X<br />
Timber yield<br />
Average FOB log price: 58 $US per cubic metre -<br />
Assumed export tax rate (%FOB): 36% Current tax schedule applied to<br />
FOB price<br />
$US/K<strong>in</strong>a exchange rate: 0.28 -<br />
Volume exported annually by<br />
PNG:<br />
1,750,000 m 3 SGS reports<br />
Annual Government budget 21 million K<strong>in</strong>a M<strong>in</strong>istry <strong>of</strong> F<strong>in</strong>ance (most recent<br />
(<strong>Forest</strong> Authority and SGS):<br />
figures)<br />
To estimate an economic return to landowners and government, <strong>the</strong> model makes additional<br />
calculations and assumptions (Table 8.3).<br />
Key f<strong>in</strong>d<strong>in</strong>gs, conclusions and recommendations on <strong>the</strong> economic value <strong>of</strong> <strong>the</strong> <strong>forest</strong> are presented <strong>in</strong><br />
Part 10 along with those perta<strong>in</strong><strong>in</strong>g to <strong>the</strong> earlier parts <strong>of</strong> this Review. First, however, it is necessary to<br />
consider one <strong>of</strong> <strong>the</strong> terms <strong>of</strong> reference that does not fit easily <strong>in</strong>to to general pattern <strong>of</strong> this Review.<br />
PAGE 115
TABLE 8.3 BASE CASE MODEL – ECONOMIC DERIVATIONS, ASSUMPTIONS AND SOURCES<br />
Parameters Assumptions Sources/Remarks<br />
Landowner environmental costs Accounts for modest (33%)<br />
displacement <strong>of</strong> direct/tangible<br />
goods:<br />
Cropp<strong>in</strong>g (own consumption)<br />
Cash cropp<strong>in</strong>g<br />
Bush meat/fish<br />
Collectable foods such as<br />
nuts/fruits<br />
Build<strong>in</strong>g materials<br />
Medic<strong>in</strong>als<br />
Indirect use:<br />
Soil retention<br />
Water quality effects<br />
2001 FOREST REVENUE REVIEW<br />
Sources: 1. L<strong>in</strong>ddal and<br />
Lubowski, 1999. 2. Lampietti and<br />
Dixon, 1995.<br />
Remark: Transfer data derived<br />
from summaries <strong>of</strong> empirical<br />
f<strong>in</strong>d<strong>in</strong>gs from studies <strong>of</strong> resource<br />
direct/<strong>in</strong>direct use <strong>in</strong> tropical<br />
<strong>forest</strong>s (NTFPs, ecological<br />
functions only)<br />
Remark: Cash cropp<strong>in</strong>g and<br />
cropp<strong>in</strong>g for own consumption<br />
assumed to equal about 28% <strong>of</strong><br />
average per capita <strong>in</strong>come<br />
recorded for PNG<br />
Landowner social costs No treatment <strong>in</strong> model Remark: paucity <strong>of</strong> data and<br />
difficulty <strong>of</strong> translat<strong>in</strong>g highly<br />
variable social outcomes <strong>in</strong>to<br />
economic costs/benefits<br />
<strong>Forest</strong> asset depletion Simulates cost <strong>of</strong> alternative asset<br />
creation to compensate for loss <strong>of</strong><br />
f<strong>in</strong>ancial value associated with<br />
<strong>in</strong>itial cut; uses an annuity that<br />
matures after 40 year time<br />
horizon<br />
Flow-on/Multiplier effects Assumes that benefits are created<br />
when logg<strong>in</strong>g company<br />
employees spend wages and<br />
<strong>in</strong>frastructure creates better<br />
access to markets, jobs, etc.<br />
Also assumes flow-on benefits<br />
are created through government<br />
expenditures and employment.<br />
Source: Consultant assumption<br />
Remark: Assumes real rate <strong>of</strong><br />
return <strong>of</strong> 2% per annum<br />
Remark: Cost per m 3 set to<br />
generate a fund that equals 40%<br />
<strong>of</strong> <strong>the</strong> net present value (@ 7%)<br />
<strong>of</strong> <strong>in</strong>itial cut at year 40<br />
Source: Various multipliers<br />
reported for PNG<br />
Remark: Results <strong>of</strong> field visits<br />
suggests that multiplier effects are<br />
very small or even negligible,<br />
especially <strong>in</strong> areas where logg<strong>in</strong>g<br />
operations represent <strong>the</strong> s<strong>in</strong>gle<br />
significant source <strong>of</strong> cash <strong>in</strong>come<br />
and employment<br />
Landowner opportunity costs Assumed to be zero Remark: Assumed to be too<br />
uncerta<strong>in</strong> and variable for<br />
treatment <strong>in</strong> a base case model<br />
PAGE 116
PART 9 AN INDUSTRY PERFORMANCE BOND<br />
9.1 DESCRIPTION<br />
2001 FOREST REVENUE REVIEW<br />
Section 87 <strong>of</strong> <strong>the</strong> <strong>Forest</strong>ry Act 1991 requires <strong>the</strong> performance bond to be fixed for each Timber<br />
Authority issued, and Section 98 gives details <strong>of</strong> how this provision is to be implemented, not only <strong>in</strong><br />
respect <strong>of</strong> TAs but also <strong>of</strong> Timber Permits and licences.<br />
The bonds are generally <strong>in</strong>tended to secure payment <strong>of</strong> royalties and o<strong>the</strong>r levies, and may be drawn<br />
on by <strong>the</strong> PNGFA <strong>in</strong> <strong>the</strong> case <strong>of</strong> default by <strong>the</strong> holder. In certa<strong>in</strong> case, <strong>the</strong> PNGFA may require <strong>the</strong><br />
lodgement <strong>of</strong> an additional accumulat<strong>in</strong>g bond, compris<strong>in</strong>g a percentage <strong>of</strong> <strong>the</strong> fob value <strong>of</strong> each<br />
export shipment, as security for <strong>the</strong> performance <strong>of</strong> subsequent obligations.<br />
For <strong>the</strong> holder <strong>the</strong> bonds represent an additional cost, be<strong>in</strong>g <strong>the</strong> opportunity cost <strong>of</strong> <strong>the</strong> return on <strong>the</strong>se<br />
funds, had <strong>the</strong>y rema<strong>in</strong>ed part <strong>of</strong> work<strong>in</strong>g capital, less <strong>the</strong> <strong>in</strong>terest earned through <strong>the</strong> bank where <strong>the</strong><br />
deposit has been made, which still belongs to <strong>the</strong> holder. This cost might <strong>in</strong>deed be negative.<br />
The magnitude <strong>of</strong> <strong>the</strong> bond is calculated on estimates <strong>of</strong> two-month royalty-equivalents, and <strong>in</strong> <strong>the</strong><br />
case <strong>of</strong> domestic process<strong>in</strong>g Timber Authorities it is based on one-sixth <strong>of</strong> <strong>the</strong> annual allowable cut.<br />
When additional landowner premium levies are payable those are factored <strong>in</strong> to <strong>the</strong> calculation as<br />
well. Amounts are specified <strong>in</strong> Schedule 4 <strong>of</strong> <strong>the</strong> Act.<br />
The performance bonds are a s<strong>in</strong>e qua non for <strong>the</strong> operator, as until <strong>the</strong> bond is lodged <strong>the</strong> Timber<br />
Authority is <strong>of</strong> no effect. The bond is only released on <strong>the</strong> Manag<strong>in</strong>g Director <strong>of</strong> <strong>the</strong> PNGFA’s written<br />
authority and this is only forthcom<strong>in</strong>g once <strong>the</strong> completion report has been submitted to <strong>the</strong> Resource<br />
Development Division, and <strong>the</strong>re has been an opportunity to <strong>in</strong>spect <strong>the</strong> Project Area.<br />
In <strong>the</strong> case <strong>of</strong> a breach <strong>of</strong> <strong>the</strong> Agreement, conditions, or requirements, <strong>the</strong> PNGFA may drawn upon<br />
<strong>the</strong> bond only after follow<strong>in</strong>g <strong>the</strong> correct procedures and only to <strong>the</strong> extent determ<strong>in</strong>ed by <strong>the</strong> nature<br />
<strong>of</strong> <strong>the</strong> breach. The holder must re<strong>in</strong>state <strong>the</strong> amount drawn with<strong>in</strong> 30 days <strong>of</strong> be<strong>in</strong>g notified <strong>of</strong> <strong>the</strong><br />
withdrawal.<br />
The holder and his bank must provide evidence <strong>of</strong> lodgement <strong>of</strong> <strong>the</strong> bond to <strong>the</strong> PNGFA.<br />
9.2 RATIONALE<br />
The rationale for <strong>the</strong> bond is to protect <strong>the</strong> issuer <strong>of</strong> a valuable permit, authority or licence (<strong>the</strong><br />
Government) aga<strong>in</strong>st default by <strong>the</strong> holder <strong>in</strong> any respect. It is logically appropriate that <strong>the</strong> existence<br />
and magnitude <strong>of</strong> <strong>the</strong> bond should be proportional to <strong>the</strong> actuarial risk <strong>of</strong> default and <strong>the</strong> probable<br />
levels <strong>of</strong> damage suffered by <strong>the</strong> issuer <strong>in</strong> that event. Thus, to take <strong>the</strong> extreme case, for a wholly<br />
trustworthy holder operat<strong>in</strong>g <strong>in</strong> an environment free <strong>of</strong> adverse bus<strong>in</strong>ess events, <strong>the</strong> bond size would<br />
be zero, but <strong>in</strong> a situation with poor legal enforcement <strong>of</strong> contracts and highly risky trad<strong>in</strong>g<br />
conditions, <strong>the</strong> bond size might be so large that <strong>the</strong> holder would be unwill<strong>in</strong>g to proceed with <strong>the</strong><br />
application.<br />
In between such hypo<strong>the</strong>tical extremes, <strong>the</strong>re must exist actuarial data on <strong>the</strong> extent and magnitude <strong>of</strong><br />
default. Such data, if it exists, has not been available for <strong>the</strong> Review Team to consult, so <strong>the</strong> proper<br />
analytical approach is difficult to apply. However, <strong>the</strong> issue is one <strong>of</strong> <strong>the</strong> Terms <strong>of</strong> Reference and<br />
must be addressed.<br />
The classic use <strong>of</strong> performance bonds is <strong>in</strong> <strong>the</strong> area <strong>of</strong> large eng<strong>in</strong>eer<strong>in</strong>g contracts for public<br />
authorities, <strong>in</strong> which case <strong>the</strong> deposited sum normally exceeds <strong>the</strong> total value <strong>of</strong> <strong>the</strong> contract. In effect,<br />
PAGE 117
2001 FOREST REVENUE REVIEW<br />
this is a form <strong>of</strong> guarantee, with <strong>the</strong> bank agree<strong>in</strong>g to release <strong>the</strong> bond to <strong>the</strong> contractor’s client <strong>in</strong> <strong>the</strong><br />
event <strong>of</strong> default on services to be rendered. The contractor can also <strong>in</strong>demnify himself aga<strong>in</strong>st loss <strong>of</strong><br />
<strong>the</strong> bond <strong>in</strong> circumstances beyond his control by tak<strong>in</strong>g out an <strong>in</strong>surance policy or arrang<strong>in</strong>g ano<strong>the</strong>r<br />
form <strong>of</strong> <strong>in</strong>demnity. So, for some price, <strong>the</strong>re is always an economic agent will<strong>in</strong>g to shoulder <strong>the</strong> risk.<br />
PAGE 118
2001 FOREST REVENUE REVIEW<br />
PART 10 KEY FINDINGS, CONCLUSIONS AND RECOMMENDATIONS<br />
10.1 STRUCTURE<br />
In this f<strong>in</strong>al part <strong>of</strong> <strong>the</strong> Review, we address under each head<strong>in</strong>g (key f<strong>in</strong>d<strong>in</strong>gs, conclusions, and<br />
recommendations), <strong>the</strong> four important core issues, namely <strong>the</strong> economic value <strong>of</strong> <strong>the</strong> <strong>forest</strong> estate, <strong>the</strong><br />
<strong>forest</strong> <strong>in</strong>dustry, transfer pric<strong>in</strong>g, and resource rent.<br />
The key f<strong>in</strong>d<strong>in</strong>gs beg<strong>in</strong> with <strong>the</strong> study <strong>of</strong> <strong>the</strong> economic value <strong>of</strong> <strong>the</strong> <strong>forest</strong>, primarily as it is more<br />
fundamental than <strong>the</strong> f<strong>in</strong>ancial analysis f<strong>in</strong>d<strong>in</strong>gs, but also because this Review is <strong>the</strong> first study<br />
commissioned by <strong>the</strong> Government to exam<strong>in</strong>e <strong>the</strong> worth <strong>of</strong> <strong>the</strong> national <strong>forest</strong> patrimony. For both<br />
reasons, it needs to be set <strong>in</strong> <strong>the</strong> context <strong>of</strong> <strong>the</strong> o<strong>the</strong>r terms <strong>of</strong> reference and this will be easier for <strong>the</strong><br />
reader to do if it precedes <strong>the</strong>m.<br />
The next step is to consider <strong>the</strong> f<strong>in</strong>d<strong>in</strong>gs on <strong>the</strong> <strong>in</strong>dustry, which will essentially be summaries <strong>of</strong> <strong>the</strong><br />
results obta<strong>in</strong>ed <strong>in</strong> Part 3. The resource rent study, Parts 5, 6 & 7, is <strong>the</strong> core <strong>of</strong> <strong>the</strong> analysis, but <strong>in</strong><br />
order to consider it transfer pric<strong>in</strong>g (Part 4) must first be considered because its existence and<br />
magnitude would alter <strong>the</strong> results <strong>of</strong> all o<strong>the</strong>r calculations.<br />
The components <strong>of</strong> conclusions and recommendations are treated <strong>in</strong> <strong>the</strong> same sequence.<br />
10.2 KEY FINDINGS ON THE ECONOMIC VALUE OF THE FOREST ESTATE<br />
After adjust<strong>in</strong>g for previously unaccounted costs, <strong>the</strong> net economic return to natural <strong>forest</strong> logg<strong>in</strong>g, as<br />
predicted by <strong>the</strong> model, is significantly positive (about 100 k<strong>in</strong>a per cubic metre exported log). While<br />
<strong>the</strong> model outl<strong>in</strong>ed <strong>in</strong> Part 8 produces some <strong>in</strong>sightful f<strong>in</strong>d<strong>in</strong>gs, it should be carefully <strong>in</strong>terpreted.<br />
First, <strong>the</strong>se values correspond to what has been captured; current and probable future market<br />
conditions do not augur well for cont<strong>in</strong>ued flows on <strong>the</strong>se terms (this subject is addressed <strong>in</strong> several<br />
o<strong>the</strong>r sections, especially <strong>in</strong> Part 2). Secondly, <strong>the</strong> value to <strong>the</strong> nation <strong>in</strong> societal welfare terms is<br />
almost certa<strong>in</strong>ly less than predicted values:<br />
Given <strong>the</strong> general paucity <strong>of</strong> good empirical <strong>in</strong>formation, <strong>the</strong> model assumes conditions that are<br />
<strong>in</strong> most cases overly idealistic. For example, it assumes that <strong>forest</strong>s are managed for a second cut<br />
and areas <strong>of</strong> obviously high conservation value are not logged, etc. The model predicts values<br />
based on conditions that should apply, not <strong>the</strong> conditions that are probable <strong>in</strong> PNG. With<br />
additional <strong>in</strong>formation, <strong>the</strong> model could be updated to simulate more realistically actual<br />
conditions.<br />
Many important values that are likely to be dim<strong>in</strong>ished or displaced by logg<strong>in</strong>g are not addressed<br />
by this prelim<strong>in</strong>ary effort. For example, <strong>the</strong> social ramifications <strong>of</strong> logg<strong>in</strong>g are not addressed.<br />
Transfer values from o<strong>the</strong>r studies are used to estimate environmental values relat<strong>in</strong>g to nontimber<br />
products, subsistence-based activities, and <strong>the</strong> ma<strong>in</strong>tenance <strong>of</strong> soils and water quality (socalled<br />
ecological functions). Only values from formal empirical studies <strong>of</strong> <strong>forest</strong>s <strong>in</strong> <strong>the</strong> humid<br />
tropics were considered. However, because it is not known how relevant <strong>the</strong>se values are to PNG<br />
<strong>forest</strong>s, estimates are purposefully conservative.<br />
It is anticipated that fur<strong>the</strong>r study would reveal that landowner costs especially are greater <strong>in</strong><br />
most <strong>in</strong>stances, although spatial variability is certa<strong>in</strong>ly very significant.<br />
Environmental costs estimated by <strong>the</strong> model are likely to represent areas that do not have<br />
outstand<strong>in</strong>g considerations related to fragile <strong>forest</strong>s, high endemism, extreme terra<strong>in</strong>, or o<strong>the</strong>r<br />
biophysical features that typically co<strong>in</strong>cide with high conservation value. Model predictions<br />
PAGE 119
2001 FOREST REVENUE REVIEW<br />
would not hold under such conditions, and logg<strong>in</strong>g may be altoge<strong>the</strong>r unfavourable, from a<br />
welfare perspective, if such features are present.<br />
Flow-on benefits from logg<strong>in</strong>g are highly uncerta<strong>in</strong> and variable, be<strong>in</strong>g dependent on a number <strong>of</strong><br />
previously discussed conditions. In economically disadvantaged areas, it is possible that flow-on<br />
values are relatively small or even negligible, while <strong>the</strong>y could be higher than values predicted by <strong>the</strong><br />
model where conditions allow. Simple multipliers used <strong>in</strong> <strong>the</strong> model are designed to represent a<br />
scenario <strong>in</strong> which at least m<strong>in</strong>imal economic structure exists to allow <strong>the</strong> spread and magnification <strong>of</strong><br />
expenditures brought about through logg<strong>in</strong>g enterprises. In fact <strong>the</strong>y may not fairly represent <strong>the</strong><br />
logg<strong>in</strong>g sites observed by <strong>the</strong> Review Team dur<strong>in</strong>g brief field visits to logg<strong>in</strong>g operations and<br />
surround<strong>in</strong>g communities <strong>in</strong> September and October <strong>of</strong> 2001.<br />
In summary, model conclusions best represent areas that exhibit several base conditions:<br />
Low or perhaps modest conservation values.<br />
Sufficient economic and <strong>in</strong>stitutional architecture to facilitate flow-on effects.<br />
Low or negligible propensity for social conflict.<br />
Absence <strong>of</strong> transfer pric<strong>in</strong>g or o<strong>the</strong>r forms <strong>of</strong> malfeasance.<br />
Areas that do not meet <strong>the</strong>se conditions are likely to have significantly higher environmental costs, <strong>the</strong><br />
possibility <strong>of</strong> social unrest, and much lower flow-on benefits. Consequently, <strong>in</strong> areas that do not<br />
exhibit <strong>the</strong>se features, logg<strong>in</strong>g would almost certa<strong>in</strong>ly compare unfavourable to alternatives – from <strong>the</strong><br />
societal welfare perspective <strong>of</strong> PNG nationals and <strong>the</strong>ir descendents.<br />
10.2.1 Model F<strong>in</strong>d<strong>in</strong>gs<br />
Derived values suggest that landowners appear to be much worse <strong>of</strong>f when environmental costs are<br />
considered. Account<strong>in</strong>g for such costs, even when <strong>of</strong>fset by previously unaccounted flowon/multiplier<br />
effects, suggests that <strong>the</strong> return to <strong>the</strong>m is about 70% lower than f<strong>in</strong>ancial estimates<br />
would <strong>in</strong>dicate. Net benefit drops from about K29 per cubic metre to about K9 per cubic metre (see<br />
Figure 10.1).<br />
The model estimates that almost $US 7 per cubic metre would be required to compensate for <strong>the</strong><br />
overall net cost or “burden” borne by landowners dur<strong>in</strong>g logg<strong>in</strong>g operations 29 (see Table 10.1 for a<br />
breakdown <strong>of</strong> this estimate). The f<strong>in</strong>d<strong>in</strong>g implies that this amount paid to landowners makes <strong>the</strong>m as<br />
well <strong>of</strong>f with logg<strong>in</strong>g as without. Any benefit from logg<strong>in</strong>g to landowner welfare would require<br />
compensation <strong>in</strong> addition to $US 7 per cubic metre. Figure 10.1 <strong>in</strong>dicates that after landowner costs<br />
are accounted for, about 9 k<strong>in</strong>a per cubic metre rema<strong>in</strong>s. By def<strong>in</strong>ition this is <strong>the</strong> economic return to<br />
landowners at present.<br />
Conversely, <strong>the</strong> economic values <strong>of</strong> natural <strong>forest</strong> logg<strong>in</strong>g derived through government appear<br />
significantly greater than <strong>the</strong> f<strong>in</strong>ancial values because flow-on effects are accounted for (and<br />
environmental costs are borne by <strong>the</strong> landowners, not government). Values on <strong>the</strong> government end are<br />
estimated at about K91 per cubic metre, an <strong>in</strong>crease <strong>of</strong> about 39% over <strong>the</strong> strictly f<strong>in</strong>ancial return to<br />
government.<br />
Overall, <strong>the</strong> differences between f<strong>in</strong>ancial and economic values appear negligible and uncerta<strong>in</strong> after<br />
this <strong>in</strong>itial effort. On balance estimated flow-on benefits slightly exceed previously unaccounted costs.<br />
See Table 10.1 for a breakdown <strong>of</strong> <strong>the</strong> costs and benefits that differentiate f<strong>in</strong>ancial from economic<br />
derivations.<br />
29<br />
Recall that this figure represents a lower bound <strong>of</strong> only <strong>the</strong> factors that <strong>the</strong> model is able to represent. Many more <strong>forest</strong><br />
values exist that rema<strong>in</strong> unaccounted.<br />
PAGE 120
2001 FOREST REVENUE REVIEW<br />
The estimated total net economic value (to landowners and government) <strong>of</strong> one cubic metre <strong>of</strong> log is<br />
about K100 or $US 28, provid<strong>in</strong>g <strong>the</strong> four conditions above are met.<br />
FIGURE 10.1 ANNUAL NET RETURNS TO NATURAL FOREST LOGGING IN PAPUA NEW GUINEA (2001)<br />
K<strong>in</strong>a/M3<br />
120.00<br />
100.00<br />
80.00<br />
60.00<br />
40.00<br />
20.00<br />
-<br />
Annual Net Returns to Natural <strong>Forest</strong> Logg<strong>in</strong>g <strong>in</strong> Papua<br />
New Gu<strong>in</strong>ea (2001)<br />
65.50<br />
91.08<br />
29.00<br />
8.94<br />
94.50<br />
Gov Landowners Total<br />
F<strong>in</strong>ancial Economic<br />
TABLE 10.1 BREAKDOWN OF LANDOWNER COSTS AND FOLLOW-ON BENEFITS<br />
Cost/Benefit Component $US per cubic<br />
metre<br />
Economic Costs <strong>of</strong> Logg<strong>in</strong>g:<br />
100.01<br />
K<strong>in</strong>a per cubic<br />
metre<br />
Limited enrichment plant<strong>in</strong>g and land management<br />
Creation <strong>of</strong> alternative asset to compensate for one-<strong>of</strong>f value <strong>of</strong><br />
1.54 5.50<br />
<strong>in</strong>itial cut 2.10 7.50<br />
Environmental disturbance (cropp<strong>in</strong>g, NTFP, ecological effects, etc.) 3.25 11.62<br />
Social disruption and related effects (1.)<br />
Opportunity cost (1.)<br />
- -<br />
Total 6.89 24.62<br />
Follow-on/Multiplier Benefits <strong>of</strong> Logg<strong>in</strong>g<br />
From Government expenditure/employment/<strong>in</strong>frastructure 7.16 25.6<br />
From logg<strong>in</strong>g employment 0.55 2.0<br />
From <strong>in</strong>frastructure provided by logg<strong>in</strong>g companies 0.72 2.6<br />
Total 8.44 30.13<br />
These values are likely to be positive <strong>in</strong> many cases; however, <strong>the</strong>y were not estimated quantitatively<br />
due to a paucity <strong>of</strong> <strong>in</strong>formation and resources.<br />
PAGE 121
10.3 KEY FINDINGS ON FOREST INDUSTRY<br />
10.3.1 Export Logs<br />
2001 FOREST REVENUE REVIEW<br />
The analysis <strong>in</strong>dicates that when average costs are applied, log exports are currently unpr<strong>of</strong>itable for<br />
all price levels <strong>of</strong> logs, and losses are greater for lower value logs. The logg<strong>in</strong>g <strong>in</strong>dustry cont<strong>in</strong>ues<br />
wherever companies can meet “cash ongo<strong>in</strong>g costs”. Integrated companies are better placed than<br />
stand-alone companies as <strong>the</strong>y can re-allocate head <strong>of</strong>fice overheads to o<strong>the</strong>r more pr<strong>of</strong>itable<br />
activities.<br />
10.3.2 Process<strong>in</strong>g<br />
The small, <strong>in</strong>tegrated sawmill/added value process<strong>in</strong>g operation is <strong>the</strong> most pr<strong>of</strong>itable under all tests;<br />
saw mill<strong>in</strong>g is more pr<strong>of</strong>itable than <strong>the</strong> three board product options, which ei<strong>the</strong>r have negative<br />
f<strong>in</strong>ancial <strong>in</strong>ternal rates <strong>of</strong> return (plywood and medium density fibreboard) or are very marg<strong>in</strong>al<br />
(veneer).<br />
The small, <strong>in</strong>tegrated sawmill/added value process<strong>in</strong>g operation also demonstrates <strong>the</strong> least loss <strong>of</strong><br />
Government <strong>revenue</strong> per national job created from foregone log export taxes, followed by <strong>the</strong><br />
re-locatable eco-mill (whose products are not exported). All o<strong>the</strong>r process<strong>in</strong>g options show relatively<br />
high rates <strong>of</strong> loss <strong>of</strong> Government <strong>revenue</strong> per national job created.<br />
10.3.3 Market Outlook<br />
Plywood and sawn timber demand (<strong>the</strong> ma<strong>in</strong> uses for PNG’s logs) face <strong>the</strong> lowest projected growth<br />
rates <strong>of</strong> all wood products <strong>in</strong> <strong>the</strong> Asia Pacific region over <strong>the</strong> next 10 years. Wood substitutes are a<br />
larger threat to tropical timber market penetration <strong>in</strong>to markets than competition from alternative<br />
suppliers <strong>of</strong> wood products. On <strong>the</strong> supply side, plantation log production (predictable with greater<br />
precision than natural <strong>forest</strong> harvests) is expand<strong>in</strong>g rapidly. There is a shift to s<strong>of</strong>twood logs<br />
(particularly as core veneer), and competition from non-plywood wood panel substitutes that can be<br />
produced from small diameter logs and wood or agricultural residues.<br />
Factors with uncerta<strong>in</strong> effects <strong>in</strong>clude <strong>the</strong> Russian Far East <strong>forest</strong> reserve, Asian pulpwood <strong>forest</strong>s<br />
be<strong>in</strong>g grown on to sawlog dimensions, Ch<strong>in</strong>a’s per capita <strong>in</strong>come growth and <strong>the</strong> exhaustion <strong>of</strong> her<br />
domestic sawlog supply, carbon credits, and green consumerism associated with certification,<br />
demand<strong>in</strong>g changes <strong>in</strong> social as well as environmental management.<br />
10.3.4 International Competitiveness<br />
Compared to her South East Asian competitors, Papua New Gu<strong>in</strong>ea has been hampered by high<br />
labour cost (recently decreas<strong>in</strong>g) and low labour productivity, reliance upon expensive expatriate<br />
technical staff, high <strong>in</strong>ternal and external freight costs, high energy costs, and high overhead costs<br />
affected by remoteness, security, secondary support services and manag<strong>in</strong>g landowner liaison.<br />
Aga<strong>in</strong>st <strong>the</strong> same yardstick, <strong>the</strong> <strong>forest</strong> resource is more diverse, rights <strong>of</strong> use are more <strong>in</strong>secure, and<br />
landowner disruption more common. A <strong>new</strong> aggravat<strong>in</strong>g factor is <strong>the</strong> implicit <strong>in</strong>put subsidies to<br />
Indonesian mills from illegal logg<strong>in</strong>g <strong>in</strong> that country.<br />
Process<strong>in</strong>g is afflicted by relatively <strong>in</strong>effectual management, which is reflected particularly <strong>in</strong> <strong>the</strong> low<br />
conversion rates. The domestic market is small and unable to utilise many non-exportable lower grade<br />
and residue outputs. Owners are reluctant to <strong>in</strong>vest <strong>in</strong> <strong>new</strong> technology, because <strong>of</strong> <strong>the</strong> perceived low<br />
returns and high risks. New mills announced will not necessarily be equipped with <strong>new</strong> mach<strong>in</strong>ery.<br />
Such mills cannot operate pr<strong>of</strong>itably <strong>in</strong> current conditions, but may serve o<strong>the</strong>r purposes <strong>in</strong> corporate<br />
PAGE 122
2001 FOREST REVENUE REVIEW<br />
strategy, such as political leverage for future resource allocations <strong>of</strong> neighbour<strong>in</strong>g <strong>forest</strong> areas to <strong>the</strong><br />
<strong>in</strong>cumbent concessionaire, or <strong>the</strong> whole enterprise, resource rights plus process<strong>in</strong>g facilities, may be<br />
“packaged” and later sold <strong>in</strong> toto when market conditions improve.<br />
10.4 KEY FINDINGS ON TRANSFER PRICING<br />
Papua New Gu<strong>in</strong>ea has a well-established <strong>system</strong> to monitor and control exports (section 3.1). It<br />
covers volumes, species, grades and prices. At <strong>the</strong> field level, volumes, species and grades are<br />
physically checked. The field data is compared with <strong>in</strong>formation provided <strong>in</strong> <strong>the</strong> export documents.<br />
The only weak po<strong>in</strong>t <strong>of</strong> <strong>the</strong> monitor<strong>in</strong>g process is <strong>the</strong> price <strong>in</strong>formation, where <strong>the</strong> work is limited to<br />
comparison with approved prices, and <strong>the</strong>se are simply projections <strong>of</strong> recent locally observed data.<br />
10.4.1 Japan<br />
The result <strong>of</strong> <strong>the</strong> assessment made on log exports to Japan highlights an unexpla<strong>in</strong>ed difference<br />
between fob log prices reported <strong>in</strong> PNG documents and cif prices reported <strong>in</strong> Japan. Two reasons<br />
were identified by this study that might expla<strong>in</strong> <strong>the</strong> discrepancy found:<br />
Cif prices needs to be adjusted to “cif landed”. However even when adjustments <strong>of</strong> around 10%<br />
are made, <strong>the</strong> total difference detected (<strong>of</strong> around US$38.00 per cubic metre), could not be fully<br />
expla<strong>in</strong>ed.<br />
Cif average prices have been <strong>in</strong>flated. This would be basically a reflection <strong>of</strong> <strong>the</strong> so-called<br />
“regular grade” logs imported from <strong>the</strong> Solomon Islands. The possible impact <strong>of</strong> this factor is<br />
also estimated to be <strong>in</strong> <strong>the</strong> range <strong>of</strong> 10 percent.<br />
However, <strong>the</strong> two reasons would have to occur simultaneously to expla<strong>in</strong> <strong>the</strong> discrepancy. This is<br />
extremely unlikely. Perhaps only a 15 percent adjustment to cif figures could be considered. This<br />
fails to expla<strong>in</strong> fully <strong>the</strong> difference identified for Japan.<br />
Demonstrat<strong>in</strong>g a price difference exists does not prove that it is a result <strong>of</strong> transfer pric<strong>in</strong>g practices.<br />
In <strong>the</strong> trade cha<strong>in</strong> analysed <strong>the</strong> only possible practice that could be adopted would be a re-issue <strong>of</strong><br />
export<strong>in</strong>g documents (or double <strong>in</strong>voic<strong>in</strong>g). This study did not cover such analysis, and <strong>in</strong> export<strong>in</strong>g to<br />
Japan this practice is not expected to happen, although it is possible. The analysis has also not covered<br />
<strong>the</strong> possibility <strong>of</strong> transfer pric<strong>in</strong>g by import agents based <strong>in</strong> Japan, whose tax avoidance <strong>in</strong>centives<br />
would be <strong>the</strong> converse <strong>of</strong> that <strong>of</strong> a Papua New Gu<strong>in</strong>ea exporter i.e. to record <strong>the</strong> highest possible<br />
purchase price, s<strong>in</strong>ce <strong>in</strong>puts to a process are tax-deductible allowances. Long distribution cha<strong>in</strong>s are<br />
typical <strong>of</strong> <strong>the</strong> Japanese economy, and various commissions and agent pr<strong>of</strong>its <strong>in</strong> this cha<strong>in</strong> would be<br />
accepted as normal bus<strong>in</strong>ess practice.<br />
10.4.2 Ch<strong>in</strong>a and Hong Kong<br />
Ch<strong>in</strong>a and Hong Kong statistics are nei<strong>the</strong>r detailed nor reliable. This makes an <strong>in</strong>-depth analysis<br />
impossible. In any case volume discrepancies have been detected <strong>in</strong> Ch<strong>in</strong>ese imports. There is some<br />
<strong>in</strong>dication <strong>of</strong> <strong>the</strong> possible use <strong>of</strong> Hong Kong as a port <strong>of</strong> transference, where export documents are reissued.<br />
This could be an <strong>in</strong>dication <strong>of</strong> transfer pric<strong>in</strong>g. Also Hong Kong cif prices for tropical logs are<br />
lower than those <strong>in</strong> o<strong>the</strong>r markets. This corroborates with <strong>the</strong> evidence that Hong Kong has been used<br />
as a transit port. Difference <strong>in</strong> prices covers, <strong>of</strong> course, costs and pr<strong>of</strong>it. Most <strong>of</strong> <strong>the</strong> difference is<br />
probably pr<strong>of</strong>it, <strong>in</strong>dicat<strong>in</strong>g that Hong Kong operations are used for transfer pric<strong>in</strong>g practices. In any<br />
case this is at <strong>the</strong> moment not very relevant to PNG as exports to Hong Kong have been relatively<br />
small, around 3% <strong>of</strong> <strong>the</strong> total volume <strong>in</strong> 2000 and 5% <strong>in</strong> 2001.<br />
PAGE 123
10.4.3 Common Evidence<br />
2001 FOREST REVENUE REVIEW<br />
The overall f<strong>in</strong>d<strong>in</strong>g is that discrepancies <strong>in</strong> price and volumes do exist that could be evidence <strong>of</strong><br />
transfer pric<strong>in</strong>g. Adjustments made to cif prices for Japan were not sufficient to expla<strong>in</strong> <strong>the</strong><br />
discrepancies. The Hong Kong/Ch<strong>in</strong>a markets also show discrepancies <strong>in</strong> terms <strong>of</strong> volume and value<br />
that could not be expla<strong>in</strong>ed. However, it is important to note that this f<strong>in</strong>d<strong>in</strong>g does not prove that <strong>the</strong><br />
difference <strong>in</strong> price and discrepancies <strong>in</strong> volumes are associated with transfer pric<strong>in</strong>g practices. To<br />
reach a f<strong>in</strong>al conclusion fur<strong>the</strong>r <strong>in</strong>vestigation, beyond <strong>the</strong> terms <strong>of</strong> reference for <strong>the</strong> present work, will<br />
be necessary.<br />
F<strong>in</strong>ally, it is important to stress that this study only <strong>in</strong>vestigated part <strong>of</strong> <strong>the</strong> possibilities related to<br />
transfer pric<strong>in</strong>g practices. It is a matter for tax authorities <strong>in</strong> import<strong>in</strong>g countries to assess <strong>the</strong> possible<br />
existence <strong>of</strong> such practices on <strong>the</strong> import<strong>in</strong>g side (<strong>in</strong>clud<strong>in</strong>g over-pric<strong>in</strong>g <strong>of</strong> imported goods and<br />
services, transfer <strong>of</strong> overhead costs and o<strong>the</strong>r forms).<br />
10.5 KEY FINDINGS ON RESOURCE RENT<br />
There has been substantial resource rent earned on log exports over <strong>the</strong> 1990s. However, <strong>the</strong> decl<strong>in</strong>e<br />
<strong>in</strong> world prices has brought <strong>the</strong> current average export price (<strong>of</strong> less than US$60 per cubic metre on<br />
average) close to <strong>the</strong> full cost <strong>of</strong> logg<strong>in</strong>g. This means that on average <strong>the</strong>re is little or no resource rent<br />
be<strong>in</strong>g earned on log exports at present.<br />
Logg<strong>in</strong>g companies were major beneficiaries <strong>of</strong> <strong>the</strong> jump <strong>in</strong> world prices <strong>in</strong> 1993. The Government’s<br />
adjustment to <strong>the</strong> export duty <strong>system</strong> corrected for this and over <strong>the</strong> 1990s <strong>the</strong> Government has<br />
collected a reasonable share <strong>of</strong> <strong>the</strong> resource rent. Log export duties are now too high and unless<br />
reduced <strong>the</strong>re is a high risk that <strong>the</strong> export duties will see <strong>the</strong> <strong>in</strong>dustry contract fur<strong>the</strong>r. The <strong>in</strong>dustry<br />
needs to re-equip over <strong>the</strong> next two to three years and early action is required to ensure <strong>the</strong> right<br />
conditions are <strong>in</strong> place.<br />
The current situation has ma<strong>in</strong>ly come about because <strong>the</strong> devaluation <strong>of</strong> <strong>the</strong> k<strong>in</strong>a has substantially<br />
<strong>in</strong>creased effective export duty rates. 30 The <strong>in</strong>dustry is essentially a US$ <strong>in</strong>dustry and efficiency and<br />
equity considerations lead to <strong>the</strong> conclusion that duty rates should be neutral with respect to <strong>the</strong> k<strong>in</strong>a.<br />
A re-design <strong>of</strong> <strong>the</strong> export duty <strong>system</strong> is justified along with a substantial reduction <strong>in</strong> effective duty<br />
rates.<br />
It is unlikely that much if any resource rent has been earned on processed timber sold locally. This is<br />
ma<strong>in</strong>ly because demand and supply conditions will tend to keep prices close to <strong>the</strong> cost <strong>of</strong> supply over<br />
time. The Review Team is uncerta<strong>in</strong> as to whe<strong>the</strong>r export processed timber that is exported earned<br />
resource rent. However <strong>the</strong> low pr<strong>of</strong>itability <strong>of</strong> process<strong>in</strong>g operations and an associated low capacity<br />
to pay for <strong>the</strong> timber <strong>in</strong>dicates that resource rent is be<strong>in</strong>g dissipated through process<strong>in</strong>g and that for<br />
some logs, process<strong>in</strong>g is an <strong>in</strong>efficient use <strong>of</strong> <strong>the</strong> timber resource.<br />
It was found that <strong>the</strong> exemption from export duties and landowner premiums <strong>of</strong> log that are processed<br />
but could have been exported imposes costs that are substantially higher than <strong>the</strong> benefits generated<br />
by process<strong>in</strong>g. There is a clear case to levy export duties and landowner premiums on such logs, be<strong>in</strong>g<br />
from all species except those banned from export <strong>in</strong> log form (<strong>the</strong> conifers and rosewood).<br />
30 Note that effective duty rates should be calculated as <strong>the</strong> tax payment relative to <strong>the</strong> tax base. In this case, <strong>the</strong> tax base is<br />
<strong>the</strong> resource rent. The calculation <strong>of</strong> effective duty rates as a share <strong>of</strong> FOB values is <strong>in</strong>correct and creates a mislead<strong>in</strong>g<br />
picture.<br />
PAGE 124
TABLE 10.2 EXPORT DUTY UNDER DIFFERENT SCENARIOS<br />
Relocatable<br />
eco-mill<br />
Export duty <strong>in</strong> US$ per m 3 <strong>of</strong> log <strong>in</strong>put<br />
Small<br />
commercial<br />
mill<br />
Medium to<br />
large<br />
sawmill<br />
2001 FOREST REVENUE REVIEW<br />
Integrated<br />
small<br />
sawmill<br />
Large<br />
export<br />
veneer mill<br />
Large<br />
export<br />
plywood<br />
mill<br />
'Breakeven' export duty 4 7 4 10 3 5<br />
Export duty payable under <strong>the</strong> preferred <strong>system</strong> at average FOB prices<br />
- as currently apply<strong>in</strong>g 0 0 0 0 0 0<br />
- as seen from Jan 1996-Sep 2001 20 20 20 13 3 3<br />
- from Jan 1990 to Sep 2001 34 34 34 25 13 13<br />
Source: Review Team Estimates<br />
The outcome shown <strong>in</strong> Table 10.2 is not surpris<strong>in</strong>g given <strong>the</strong> design <strong>of</strong> <strong>the</strong> <strong>revenue</strong> <strong>system</strong>. The<br />
provision <strong>of</strong> concessions does not take <strong>in</strong>to account process<strong>in</strong>g operations’ need for assistance, and it<br />
is <strong>in</strong>evitable that concessions will be provided to operations that do not require support, and that too<br />
much will be provided to some operators while o<strong>the</strong>r operations will not be provided with enough<br />
assistance.<br />
In effect <strong>the</strong> current <strong>system</strong> provides timber processors <strong>the</strong> first call on Government resources. Under<br />
<strong>the</strong> current <strong>system</strong> <strong>the</strong> provision <strong>of</strong> subsidies to <strong>the</strong> process<strong>in</strong>g <strong>of</strong> logs that could be exported is given<br />
a higher priority that expenditure on basic health, education and physical <strong>in</strong>frastructure. These<br />
expenditure items are considerably more important from a development perspective and it would be<br />
better for <strong>the</strong> Government to collect more <strong>revenue</strong> from process<strong>in</strong>g and allocate <strong>the</strong>se funds to basic<br />
health, education and physical <strong>in</strong>frastructure.<br />
The exemption from landowner premiums <strong>of</strong> those logs that could have been exported but were<br />
processed onshore <strong>in</strong>stead has a very peculiar effect. In some cases <strong>the</strong> concession will see<br />
landowners work for <strong>the</strong> same level <strong>of</strong> <strong>in</strong>come that would have been earned via <strong>the</strong> premium had <strong>the</strong><br />
timber be<strong>in</strong>g exported as a log. This means that <strong>in</strong> effect some landowners are work<strong>in</strong>g <strong>in</strong> process<strong>in</strong>g<br />
operations for noth<strong>in</strong>g or very low rates <strong>of</strong> pay.<br />
An appropriate mechanism for levy<strong>in</strong>g charges on logs that could be sold as export logs are but are<br />
actually processed is somewhat unclear at this stage and requires fur<strong>the</strong>r <strong>in</strong>vestigation. While <strong>the</strong>re is<br />
a case for <strong>in</strong>creas<strong>in</strong>g taxes and charges on exported product, <strong>the</strong>re is probably no case for levy<strong>in</strong>g<br />
charges on timber products that are sold locally.<br />
Substantial changes are required to <strong>the</strong> <strong>revenue</strong> <strong>system</strong> to lessen distortions <strong>in</strong> <strong>the</strong> economy, to<br />
provide for a more equitable distribution <strong>of</strong> <strong>the</strong> resource rent and ensure a susta<strong>in</strong>able logg<strong>in</strong>g and<br />
process<strong>in</strong>g <strong>in</strong>dustry. Fur<strong>the</strong>r work is required to design and improved <strong>system</strong>. The broad parameters<br />
<strong>of</strong> a desirable <strong>system</strong> can be specified relatively easily, but <strong>the</strong>re are important adm<strong>in</strong>istrative and<br />
implementation issues that need to be considered before a sensible revised <strong>system</strong> can be put <strong>in</strong> place.<br />
PAGE 125
10.6 CONCLUSIONS<br />
10.6.1 Conclusions on <strong>the</strong> Economic Valuation <strong>of</strong> <strong>the</strong> <strong>Forest</strong><br />
2001 FOREST REVENUE REVIEW<br />
The benefits to <strong>the</strong> nation <strong>of</strong> natural <strong>forest</strong> logg<strong>in</strong>g appear significant if <strong>the</strong>re is adequate spatial area<br />
<strong>in</strong> PNG that meets <strong>the</strong> base conditions stated at <strong>the</strong> beg<strong>in</strong>n<strong>in</strong>g <strong>of</strong> this section (an uncerta<strong>in</strong> condition).<br />
However <strong>the</strong>re are several large caveats that, depend<strong>in</strong>g on how <strong>the</strong>y are <strong>in</strong>terpreted, suggest that<br />
natural <strong>forest</strong> logg<strong>in</strong>g is not result<strong>in</strong>g <strong>in</strong> <strong>the</strong> benefits it could be deliver<strong>in</strong>g (that this model estimates),<br />
and should be promoted by government and allowed by landowners only with great caution. Even<br />
with respect to areas that meet <strong>the</strong> base conditions, estimates should be <strong>in</strong>terpreted with caution as<br />
<strong>the</strong>y presume:<br />
A well-managed logg<strong>in</strong>g <strong>in</strong>dustry that takes a long-term <strong>in</strong>vestment view (undertakes good<br />
management and makes <strong>in</strong>vestments required to make a second cut viable).<br />
Successful creation and equitable shar<strong>in</strong>g <strong>of</strong> alternative assets to <strong>of</strong>fset <strong>the</strong> one-<strong>of</strong>f nature <strong>of</strong><br />
<strong>in</strong>itial cuts.<br />
Good spatial plann<strong>in</strong>g that prohibits logg<strong>in</strong>g <strong>of</strong> areas that are thought to have high conservation<br />
value or unusually valuable alternative development pathways.<br />
Government that is well situated and properly motivated to maximize <strong>the</strong> welfare benefits that<br />
can be derived from tax receipts.<br />
The economic and <strong>in</strong>stitutional architecture necessary to ensure susta<strong>in</strong>able flow-on benefits and<br />
long-term <strong>in</strong>vestment <strong>in</strong> public goods rang<strong>in</strong>g from appropriate <strong>in</strong>frastructure to better healthcare<br />
and education.<br />
Model f<strong>in</strong>d<strong>in</strong>gs simulate natural <strong>forest</strong> logg<strong>in</strong>g under <strong>the</strong>se idealized conditions that are unlikely to<br />
ever exist <strong>in</strong> <strong>the</strong>ir entirely <strong>in</strong> PNG (or anywhere else). Results need to be adjusted (downward) to<br />
conform to actual conditions <strong>in</strong> PNG. Specifically, several o<strong>the</strong>r conclusions and related <strong>in</strong>formation<br />
gaps need to be addressed:<br />
1. The overall value to <strong>the</strong> nation <strong>of</strong> natural <strong>forest</strong> logg<strong>in</strong>g, <strong>the</strong> primary foreign-<strong>in</strong>come earner <strong>in</strong> <strong>the</strong><br />
<strong>forest</strong> sector at present, is highly sensitive to flow-on benefits. This topic is complex and relates to<br />
several disparate factors <strong>in</strong>clud<strong>in</strong>g <strong>the</strong> economic and social conditions at proposed logg<strong>in</strong>g sites<br />
and <strong>the</strong> way <strong>in</strong> which government spends or <strong>in</strong>vests export tax receipts.<br />
2. The economic return to landowners is highly sensitive to conditions that <strong>in</strong>fluence landowner<br />
costs (e.g., natural features, code <strong>of</strong> practice adherence), and <strong>the</strong> opportunity cost <strong>of</strong> alternative<br />
development pathways that may change significantly dur<strong>in</strong>g a 20-40 year cutt<strong>in</strong>g cycle.<br />
Landowners are operat<strong>in</strong>g on a very small marg<strong>in</strong> (about K9 per cubic metre); <strong>in</strong> cases where<br />
landowner costs are 50% greater than model estimates, landowner returns are essentially negative.<br />
Additionally, <strong>the</strong> value <strong>of</strong> logg<strong>in</strong>g to <strong>the</strong> nation is affected by external conditions, notably fluctuat<strong>in</strong>g<br />
fob prices, and o<strong>the</strong>r factors analysed as part <strong>of</strong> this <strong>review</strong>. These issues and <strong>the</strong> need for additional<br />
study and action are addressed <strong>in</strong> <strong>the</strong> section on long-term recommendations below.<br />
10.6.2 Conclusions on <strong>the</strong> <strong>Forest</strong> Industry<br />
In discuss<strong>in</strong>g <strong>the</strong> probable effect <strong>of</strong> <strong>the</strong> <strong>in</strong>troduction <strong>of</strong> <strong>the</strong> <strong>new</strong> <strong>revenue</strong> <strong>system</strong> <strong>in</strong> February 1996, <strong>the</strong><br />
PNGFA <strong>review</strong>ed <strong>the</strong> average prices <strong>of</strong> log exports from <strong>the</strong>ir <strong>in</strong>ception <strong>in</strong> 1951 until 1993. Despite<br />
<strong>the</strong> existence <strong>of</strong> a three-decade average <strong>of</strong> about US$20-30 per cubic metre, <strong>the</strong> dramatic rise over <strong>the</strong><br />
eighties and <strong>the</strong> price peak at <strong>the</strong> time <strong>of</strong> writ<strong>in</strong>g emboldened <strong>the</strong> authors to state “ow<strong>in</strong>g to <strong>the</strong><br />
current and cont<strong>in</strong>u<strong>in</strong>g world shortage it is highly improbable that prices will fall below this l<strong>in</strong>e (90<br />
PAGE 126
2001 FOREST REVENUE REVIEW<br />
k<strong>in</strong>a = US$90 per cubic metre )”. The average price is currently below $60/m 3 but <strong>in</strong> <strong>the</strong> light <strong>of</strong> this<br />
sharp change with<strong>in</strong> half a decade <strong>the</strong> Review Team would be rash to state that ow<strong>in</strong>g to <strong>the</strong><br />
cont<strong>in</strong>u<strong>in</strong>g world glut it is highly unlikely prices would ever rise above US$90 per cubic metre.<br />
Never<strong>the</strong>less it is our view that <strong>the</strong> market outlook and <strong>the</strong> level <strong>of</strong> competitiveness <strong>of</strong> <strong>the</strong> national<br />
<strong>forest</strong>ry sector caution conservative projections <strong>of</strong> both real prices and volumes with cont<strong>in</strong>u<strong>in</strong>g low<br />
prices <strong>in</strong> <strong>the</strong> short term and a long-term outlook for tight pr<strong>of</strong>it marg<strong>in</strong>s. The process<strong>in</strong>g <strong>in</strong>dustry<br />
would not be competitive if it paid <strong>the</strong> opportunity cost <strong>of</strong> <strong>the</strong> logs it used plus <strong>the</strong> export tax <strong>the</strong>y<br />
normally bear.<br />
10.6.3 Conclusions on Transfer Pric<strong>in</strong>g<br />
The case is unproven. However, sufficient evidence exists <strong>of</strong> price and volume discrepancies that<br />
cannot be expla<strong>in</strong>ed. The <strong>in</strong>vestigation did make some progress by rul<strong>in</strong>g out explanations previously<br />
adduced, such as scal<strong>in</strong>g differences for <strong>the</strong> Japanese market (non-existent), <strong>the</strong> supposed premium<br />
paid for higher quality logs by Japan (non-existent), and under-estimated freight rates (probably overestimated).<br />
The cont<strong>in</strong>ued existence <strong>of</strong> an <strong>in</strong>explicable price gap (fob PNG – cif E. Asia) warrants<br />
fur<strong>the</strong>r <strong>in</strong>vestigation.<br />
10.6.4 Conclusions on Resource Rent<br />
The broad parameters flow<strong>in</strong>g from <strong>the</strong> Review Team’s work are summarised <strong>in</strong> Table 10.3. We have<br />
<strong>in</strong> m<strong>in</strong>d an export duty based on fob log value but provid<strong>in</strong>g a duty exemption up to <strong>the</strong> estimated<br />
total cost <strong>of</strong> logg<strong>in</strong>g. This total cost has been calculated on a forward-look<strong>in</strong>g basis. In particular, it<br />
provides for a recovery <strong>of</strong> depreciation and a normal pr<strong>of</strong>it based on <strong>the</strong> cost <strong>of</strong> all <strong>new</strong> equipment (<strong>in</strong><br />
contrast our estimates <strong>of</strong> <strong>the</strong> past level <strong>of</strong> resource rent have been based on actual, written down<br />
values). This reflects <strong>the</strong> need for <strong>the</strong> <strong>in</strong>dustry to re-equip.<br />
This model <strong>system</strong> would see a substantial reduction <strong>in</strong> government charges. Comparisons between<br />
<strong>the</strong> current and preferred <strong>system</strong>s are provided <strong>in</strong> Figure 10.3. Estimates <strong>of</strong> <strong>the</strong> distribution <strong>of</strong><br />
resource rent that would have applied over <strong>the</strong> 1990s had our preferred <strong>system</strong> been <strong>in</strong> place are<br />
provided <strong>in</strong> Annex A, and summarised <strong>in</strong> Figure 10.2.<br />
Our analysis <strong>of</strong> resource rent issues has been based on <strong>the</strong> assumption that <strong>the</strong>re is no transfer pric<strong>in</strong>g.<br />
The conclusions could be substantially different if transfer pric<strong>in</strong>g was <strong>in</strong>stead assumed to be<br />
significant. The potential effect <strong>of</strong> transfer pric<strong>in</strong>g on our key estimates are shown <strong>in</strong> Figures 10.4<br />
and 10.5, which are based on <strong>the</strong> assumption <strong>the</strong>re has been transfer pric<strong>in</strong>g worth US$30 per cubic<br />
metre on every saw log exported. The alternative, hypo<strong>the</strong>tical estimates, if correct, would lead to <strong>the</strong><br />
conclusion that logg<strong>in</strong>g companies had collected too much <strong>of</strong> <strong>the</strong> resource rent over <strong>the</strong> 1990s and<br />
significantly higher export rates would have been justified.<br />
PAGE 127
TABLE 10.3 THE PREFERRED DISTRIBUTION OF EXPORT LOG REVENUE<br />
2001 FOREST REVENUE REVIEW<br />
US$ per cubic metre a To be distributed to<br />
Production Cost 39 Loggers<br />
Depreciation 12 Loggers<br />
Government Cost b 4 PNG <strong>Forest</strong> Service<br />
Landowner cost 6<br />
- Environmental cost 2.5 Landowners<br />
- Depletion cost 2.5 Landowners<br />
- Re<strong>forest</strong>ation and management 1.1 Landowners<br />
Loggers pr<strong>of</strong>it 9 Loggers<br />
Total cost <strong>of</strong> logg<strong>in</strong>g 70<br />
O<strong>the</strong>r National Government, Prov<strong>in</strong>cial<br />
70 per cent <strong>of</strong> <strong>the</strong> fob price National and prov<strong>in</strong>cial<br />
Government and landowner duties and charges less <strong>the</strong> total cost <strong>of</strong> logg<strong>in</strong>g governments and landowners<br />
Logger’s excess pr<strong>of</strong>it 30 per cent <strong>of</strong> <strong>the</strong> fob price<br />
less <strong>the</strong> total cost <strong>of</strong> logg<strong>in</strong>g<br />
Loggers<br />
Average price 1985 - 2001 90<br />
a Calculations are based on <strong>in</strong>dustry average costs.<br />
b This is a k<strong>in</strong>a cost expressed <strong>in</strong> US$ at current prices. It covers <strong>the</strong> cost <strong>of</strong> operat<strong>in</strong>g <strong>the</strong> Papua New<br />
Gu<strong>in</strong>ea <strong>Forest</strong> Service (which <strong>in</strong>cludes SGS PNG Ltd.).<br />
FIGURE 10.2 THE PAST DISTRIBUTION OF RENT HAD THE PREFERRED SYSTEM APPLIED<br />
Ration <strong>of</strong> payment to rent (per cent)<br />
70<br />
60<br />
50<br />
40<br />
30<br />
20<br />
10<br />
0<br />
Source: Review Team estimates<br />
Government Landowner Operator<br />
90 to 95<br />
96 to 01<br />
90 to 01<br />
PAGE 128
FIGURE 10.3 THE ACTUAL AND PROPOSED LEVEL OF CHARGES UNDER DIFFERENT PRICES<br />
US$ per cubic metre<br />
US$ per cubic metre<br />
US$ per cubic metre<br />
US$ per cubic metre<br />
100<br />
80<br />
60<br />
40<br />
20<br />
0<br />
120<br />
80<br />
40<br />
160<br />
120<br />
80<br />
40<br />
0<br />
0<br />
160<br />
120<br />
80<br />
40<br />
0<br />
Source: Review Team estimates<br />
At current average prices <strong>of</strong> US$56 per cubic metre<br />
Current Preferred Price<br />
At a price <strong>of</strong> US$80 per cubic metre<br />
At a price <strong>of</strong> US$100 per cubic metre<br />
At a price <strong>of</strong> US$120 per cubic metre<br />
Production cost Depreciation<br />
Landowner charge Government charge<br />
Production cost Depreciation<br />
Landowner charge Government charge<br />
Current Preferred Price<br />
Production cost Depreciation<br />
Landowner charge Government charge<br />
Current Preferred Price<br />
Production cost Depreciation<br />
Landowner charge Government charge<br />
Current Preferred Price<br />
2001 FOREST REVENUE REVIEW<br />
PAGE 129
2001 FOREST REVENUE REVIEW<br />
FIGURE 10.4 THE HYPOTHETICAL LEVEL OF RESOURCE RENT FROM LOG EXPORTS (ASSUMING TRANSFER<br />
PRICING)<br />
'000 K<strong>in</strong>a<br />
'000 K<strong>in</strong>a<br />
'000 US$<br />
600,000<br />
500,000<br />
400,000<br />
300,000<br />
200,000<br />
100,000<br />
500,000<br />
400,000<br />
300,000<br />
200,000<br />
100,000<br />
0<br />
250,000<br />
200,000<br />
150,000<br />
100,000<br />
50,000<br />
0<br />
0<br />
US$ export <strong>revenue</strong><br />
Logg<strong>in</strong>g costs<br />
1990 1992 1994 1996 1998 2000<br />
Resource rent<br />
1990 1992 1994 1996 1998 2000<br />
1990 1992 1994 1996 1998 2000<br />
Government<br />
payment<br />
Landowner<br />
payment<br />
Operator<br />
abovenormal<br />
pr<strong>of</strong>it<br />
Company<br />
tax<br />
Notes: Export volumes for 2001 are an estimate based on data for <strong>the</strong> first 9 months <strong>of</strong> <strong>the</strong> year. The<br />
estimates assume transfer pric<strong>in</strong>g <strong>of</strong> US$30 per cubic metre.<br />
Source: Review Team estimates based on <strong>the</strong> data <strong>in</strong> Annex A<br />
PAGE 130
2001 FOREST REVENUE REVIEW<br />
FIGURE 10.5 THE HYPOTHETICAL PAST DISTRIBUTION OF RESOURCE RENT (ASSUMING TRANSFER PRICING)<br />
Ratio <strong>of</strong> payment to rent (per cent)..<br />
50<br />
40<br />
30<br />
20<br />
10<br />
0<br />
Government Landowner Operator<br />
90 to 95<br />
96 to 01<br />
90 to 01<br />
Note: The payment to <strong>the</strong> operator presented <strong>in</strong> <strong>the</strong> figure is <strong>the</strong> estimated above-normal pr<strong>of</strong>it, be<strong>in</strong>g <strong>the</strong><br />
operator’s portion <strong>of</strong> resource rent. The negative above-normal pr<strong>of</strong>it seen from 1996 to 2001 (Sep)<br />
shows that operators were unable even to earn a normal pr<strong>of</strong>it over <strong>the</strong> period. The estimates assume<br />
transfer pric<strong>in</strong>g <strong>of</strong> US$30 per cubic metre.<br />
Source: Review Team estimates based on <strong>the</strong> data <strong>in</strong> Annex A<br />
10.7 RECOMMENDATIONS AND DISCUSSION<br />
10.7.1 Recommendations for fur<strong>the</strong>r study <strong>of</strong> <strong>the</strong> economic value <strong>of</strong> <strong>forest</strong>s from <strong>the</strong><br />
perspectives <strong>of</strong> landowners and <strong>the</strong> nation<br />
a. Conduct targeted empirical study on <strong>the</strong> economic value <strong>of</strong> <strong>forest</strong>s, to ref<strong>in</strong>e and expand <strong>the</strong><br />
current work.<br />
Discussion: The issue <strong>of</strong> landowner costs ensu<strong>in</strong>g from environmental and social disturbance needs<br />
greater attention. There is a dearth <strong>of</strong> <strong>in</strong>formation on <strong>the</strong> role and significance <strong>of</strong> subsistence-based<br />
activities <strong>in</strong> PNG rural society, <strong>in</strong>clud<strong>in</strong>g <strong>in</strong>sights <strong>in</strong>to how such activities are likely to change and<br />
grow or decl<strong>in</strong>e <strong>in</strong> importance over time. Local-level economies, <strong>of</strong>ten isolated from national and<br />
<strong>in</strong>ternational market channels, form <strong>the</strong> base fabric <strong>of</strong> critical livelihood strategies that are <strong>in</strong>timately<br />
l<strong>in</strong>ked to <strong>the</strong> welfare <strong>of</strong> <strong>the</strong> vast majority <strong>of</strong> <strong>the</strong> country’s citizens. More <strong>in</strong>formation is needed on<br />
how <strong>forest</strong>s contribute to <strong>the</strong> economy, social stability, and risk management at this level, <strong>in</strong>clud<strong>in</strong>g<br />
an applied understand<strong>in</strong>g <strong>of</strong> how <strong>forest</strong>s contribute to food and economic security and cop<strong>in</strong>g<br />
mechanisms.<br />
Focus study on values that can be captured at <strong>the</strong> local or national level (us<strong>in</strong>g exist<strong>in</strong>g or emerg<strong>in</strong>g<br />
markets only), analysed <strong>in</strong> a believable and understandable fashion, and <strong>of</strong> expressed importance to<br />
landowners. Ra<strong>the</strong>r than attempt<strong>in</strong>g a total economic valuation, focus on acquir<strong>in</strong>g <strong>in</strong>formation<br />
PAGE 131
2001 FOREST REVENUE REVIEW<br />
required to answer <strong>the</strong> most press<strong>in</strong>g decision problems that ga<strong>in</strong> traction with landowners and<br />
government. S<strong>in</strong>ce <strong>the</strong> result is <strong>of</strong> great importance to Papua New Gu<strong>in</strong>ea, such studies should be<br />
conducted irrespective <strong>of</strong> whe<strong>the</strong>r <strong>the</strong> FCP proceeds or not.<br />
b. Develop an array <strong>of</strong> diverse case histories that illum<strong>in</strong>ate <strong>the</strong> economic and social effects <strong>of</strong><br />
logg<strong>in</strong>g and <strong>in</strong>dustrial scale process<strong>in</strong>g. Make such <strong>in</strong>formation accessible to communities.<br />
Discussion: Logg<strong>in</strong>g <strong>of</strong> natural <strong>forest</strong>s is an unprecedented development with potentially huge<br />
implications for landowners. Because landowners, <strong>in</strong> most cases, have not directly experienced<br />
logg<strong>in</strong>g <strong>in</strong> <strong>the</strong>ir area, <strong>the</strong> value <strong>of</strong> clear, unbiased, and timely <strong>in</strong>formation on <strong>the</strong> ramifications is<br />
extremely high. An array <strong>of</strong> brief case studies, <strong>in</strong>formed by <strong>the</strong> work done for recommendation “b”<br />
above could provide <strong>the</strong> <strong>in</strong>gredients for better participation, representation, and decisions by<br />
landowners.<br />
c. Identify <strong>the</strong> natural, economic, and social conditions that make natural <strong>forest</strong> logg<strong>in</strong>g particularly<br />
attractive or unattractive to landowners and <strong>the</strong> nation. Of particular importance is ga<strong>in</strong><strong>in</strong>g an<br />
understand<strong>in</strong>g <strong>of</strong> how export tax receipts and o<strong>the</strong>r direct benefits are creat<strong>in</strong>g flow-on benefits. If<br />
capacity allows, use f<strong>in</strong>d<strong>in</strong>gs from “a” and “b” to construct a mechanism for adjust<strong>in</strong>g landowner<br />
costs accord<strong>in</strong>g to anticipated conditions at sites where <strong>new</strong> concessions are be<strong>in</strong>g considered.<br />
Discussion: Landowner costs and benefits vary broadly accord<strong>in</strong>g to site selection, spatial plann<strong>in</strong>g,<br />
and management <strong>of</strong> operations. A variety <strong>of</strong> factors are worthy <strong>of</strong> consideration: terra<strong>in</strong>, <strong>forest</strong> type<br />
and condition, undeveloped options that could be precluded by logg<strong>in</strong>g, fragility <strong>of</strong> some highly<br />
diverse <strong>forest</strong>s, availability <strong>of</strong> cash <strong>in</strong>come, <strong>the</strong> ability <strong>of</strong> <strong>the</strong> local economy to facilitate follow-on or<br />
multiplier effects, <strong>the</strong> expressed needs and economic aspirations <strong>of</strong> landowners, potential for conflict,<br />
etc. Field observations by several team members <strong>in</strong>dicate that logg<strong>in</strong>g activities can cause local<br />
populations to move settlements and replace some subsistence activities with cash-derived benefits (a<br />
normal phase <strong>of</strong> mov<strong>in</strong>g to an <strong>in</strong>creas<strong>in</strong>gly cash-based economy). Several possible outcomes and <strong>the</strong>ir<br />
effects should be weighed: a lower capture <strong>of</strong> “traditional” <strong>forest</strong> <strong>system</strong> values may be traded for an<br />
<strong>in</strong>crease <strong>in</strong> labour jobs that could facilitate access to improved health care, education, and o<strong>the</strong>r<br />
previously scarce benefits. However, this dynamic can also lead to <strong>in</strong>creased exposure to <strong>the</strong> effects <strong>of</strong><br />
<strong>in</strong>ternational commodity price risk, and loss <strong>of</strong> local knowledge/skills be<strong>in</strong>g effectively passed on to<br />
young members <strong>of</strong> <strong>the</strong> community. Displacement <strong>of</strong> traditional skills/knowledge may negatively<br />
impact food security, accessible forms <strong>of</strong> social welfare, and <strong>the</strong> capacity <strong>of</strong> families to take economic<br />
risks that could lead to atta<strong>in</strong>ment <strong>of</strong> long-term economic aspirations. Especially when cash earn<strong>in</strong>g<br />
alternatives are few, this process may lead to an <strong>in</strong>creas<strong>in</strong>gly smaller <strong>in</strong>fluence over logg<strong>in</strong>g company<br />
activities that affect a relatively large area, and policies that imp<strong>in</strong>ge upon landowner economic<br />
security and overall welfare (especially if <strong>the</strong> logg<strong>in</strong>g <strong>in</strong>dustry is monopolized). The later effects may<br />
be most acutely felt when unprecedented cash <strong>in</strong>comes do not result <strong>in</strong> last<strong>in</strong>g and stable benefits,<br />
and/or do not create multiplier effects that benefit wider segments <strong>of</strong> local populations. Exacerbation<br />
<strong>of</strong> <strong>the</strong>se outcomes may result when <strong>new</strong>ly enriched consumers have limited choices for spend<strong>in</strong>g<br />
cash; a case <strong>in</strong> po<strong>in</strong>t occurs when logg<strong>in</strong>g companies own or control a majority <strong>of</strong> mercantile outlets<br />
<strong>in</strong> areas that are economically and spatially isolated, and <strong>in</strong> which <strong>the</strong> capacity <strong>of</strong> government to act<br />
on behalf <strong>of</strong> landowners is severely limited.<br />
10.7.2 Recommendations for <strong>the</strong> study and pilot<strong>in</strong>g <strong>of</strong> f<strong>in</strong>ancial and operational mechanisms<br />
for enhanc<strong>in</strong>g <strong>the</strong> efficiency <strong>of</strong> <strong>forest</strong> allocation and prevent<strong>in</strong>g malfeasance<br />
a. Consider a variety <strong>of</strong> options for ensur<strong>in</strong>g that reductions <strong>in</strong> <strong>the</strong> value <strong>of</strong> <strong>the</strong> <strong>forest</strong> asset only<br />
occur if <strong>new</strong> assets <strong>of</strong> equal or greater value are created for landowners and <strong>the</strong>ir descendants.<br />
Implement <strong>the</strong> PDB <strong>system</strong> and predicate it on <strong>the</strong> government’s responsibility to <strong>in</strong>vest <strong>in</strong> public<br />
goods. Recreate <strong>the</strong> Development Options Study to ensure that it is performed prior to <strong>the</strong><br />
decision to commit to logg<strong>in</strong>g and fairly considers non-logg<strong>in</strong>g economic options.<br />
PAGE 132
2001 FOREST REVENUE REVIEW<br />
b. Search for modifications to <strong>the</strong> current form <strong>of</strong> <strong>the</strong> taxation regime that can prevent some forms <strong>of</strong><br />
malfeasance and enhance <strong>the</strong> transactional position <strong>of</strong> landowners and government.<br />
Discussion: Landowner and government returns to logg<strong>in</strong>g are tied to volume <strong>of</strong> timber cut and not to<br />
land area granted to logg<strong>in</strong>g operations. This practice can create several disadvantages for landowners<br />
and government. It encourages loggers to apply for areas that may be much larger than <strong>the</strong>y <strong>in</strong>tend to<br />
use, except under <strong>the</strong> most ideal market conditions. Loggers can ramp <strong>the</strong>ir level <strong>of</strong> production up or<br />
down accord<strong>in</strong>g to exist<strong>in</strong>g market forces, without concern that pressure will be felt to reallocate some<br />
<strong>forest</strong> areas to o<strong>the</strong>r uses dur<strong>in</strong>g prolonged periods <strong>of</strong> poor market conditions, a significant factor if<br />
concession periods are longer than 20 years. While <strong>the</strong> later is arguably a necessary condition for<br />
logg<strong>in</strong>g company <strong>in</strong>vestment, it can result <strong>in</strong> losses to landowners and government:<br />
It facilitates barriers to entry for o<strong>the</strong>r logg<strong>in</strong>g firms and helps to cement monopolization <strong>of</strong> <strong>the</strong><br />
<strong>in</strong>dustry, a condition currently aris<strong>in</strong>g <strong>in</strong> PNG.<br />
It exposes landowners and government more directly to <strong>the</strong> effects <strong>of</strong> fluctuat<strong>in</strong>g FOB log prices.<br />
It imposes f<strong>in</strong>ancial losses on landowners when concessions are oversized and <strong>the</strong> opportunity<br />
cost <strong>of</strong> land is greater than zero.<br />
The practice <strong>of</strong> tax<strong>in</strong>g volume creates opportunities for malfeasance, requires relatively higher<br />
adm<strong>in</strong>istration costs, and necessitates adm<strong>in</strong>istrative capacity that may be lack<strong>in</strong>g <strong>in</strong> some areas.<br />
Volume taxes, however, have <strong>the</strong> advantage <strong>of</strong> tax<strong>in</strong>g logg<strong>in</strong>g companies accord<strong>in</strong>g to production<br />
levels. Impos<strong>in</strong>g some portion <strong>of</strong> taxes <strong>in</strong> <strong>the</strong> form <strong>of</strong> a land area tax has several advantages that may<br />
outweigh any negatives:<br />
1. It is virtually impossible to evade.<br />
2. It reduces adm<strong>in</strong>istration costs.<br />
3. It encourages logg<strong>in</strong>g operations to bid for control only over areas <strong>the</strong>y are almost certa<strong>in</strong> to<br />
utilize.<br />
4. It promotes competition among firms.<br />
5. It forces poorly perform<strong>in</strong>g firms to rel<strong>in</strong>quish <strong>the</strong>ir rights to ei<strong>the</strong>r more efficient firms or an<br />
alternative land use practice that may emerge to compare favourably dur<strong>in</strong>g <strong>the</strong> course <strong>of</strong> a<br />
planned cutt<strong>in</strong>g cycle. If a land area tax were to be used to capture all or most <strong>of</strong> <strong>forest</strong> taxes, it<br />
could be imposed under a competitive bid process with a set m<strong>in</strong>imum cost per hectare that would<br />
vary accord<strong>in</strong>g to anticipated landowner costs, opportunity costs, etc. Impos<strong>in</strong>g such a <strong>system</strong>,<br />
while simplify<strong>in</strong>g <strong>in</strong> some regards, does not negate <strong>the</strong> need for some m<strong>in</strong>imum level <strong>of</strong> under<br />
stand<strong>in</strong>g <strong>of</strong> <strong>forest</strong> values.<br />
10.7.3 Recommendations for <strong>forest</strong> <strong>revenue</strong> policies that promote beneficial changes <strong>in</strong> <strong>the</strong><br />
<strong>forest</strong> sector <strong>in</strong> response to chang<strong>in</strong>g market forces, emerg<strong>in</strong>g markets, <strong>the</strong> condition <strong>of</strong><br />
PNG’s <strong>forest</strong>s, and uncerta<strong>in</strong>ties<br />
a. Create an <strong>in</strong>stitutional environment that places alternatives on a level play<strong>in</strong>g field with natural<br />
<strong>forest</strong> logg<strong>in</strong>g. Ensure that non-logg<strong>in</strong>g <strong>in</strong>terests be given equal and fair access to bidd<strong>in</strong>g on<br />
timber/land concessions or similar opportunities. Create any necessary <strong>in</strong>stitutional architecture<br />
that would be required to allow PNG to access potentially emerg<strong>in</strong>g global markets for<br />
conservation services, carbon <strong>of</strong>fsets, or any o<strong>the</strong>r foreign <strong>in</strong>come-captur<strong>in</strong>g market or <strong>in</strong>vestment<br />
that may compete with natural <strong>forest</strong> logg<strong>in</strong>g.<br />
Discussion: Initial cuts <strong>of</strong> natural <strong>forest</strong> are a f<strong>in</strong>ite resource and compet<strong>in</strong>g uses for such stands are<br />
emerg<strong>in</strong>g. As <strong>the</strong>se stands become scarcer and <strong>in</strong>creas<strong>in</strong>gly more expensive to log, <strong>the</strong> comparable<br />
value <strong>of</strong> alternatives will become greater. Some <strong>of</strong> <strong>the</strong>se areas may evolve <strong>in</strong>to viable<br />
plantation/process<strong>in</strong>g areas or agricultural estates after be<strong>in</strong>g logged over.<br />
PAGE 133
2001 FOREST REVENUE REVIEW<br />
Current market conditions and prospects for improvement, <strong>in</strong> conjunction with <strong>the</strong> f<strong>in</strong>d<strong>in</strong>gs <strong>of</strong> this<br />
work, punctuate <strong>the</strong> need for adaptive <strong>forest</strong> policy. Average FOB prices (about $US 58) are below<br />
<strong>the</strong> estimated m<strong>in</strong>imum “budget” (about $US 70) needed to cover <strong>the</strong> private cost <strong>of</strong> logg<strong>in</strong>g, <strong>the</strong><br />
adm<strong>in</strong>istrative costs to government, and landowner costs. Prospects for significant price <strong>in</strong>creases <strong>in</strong><br />
<strong>the</strong> short-run seem small, consider<strong>in</strong>g <strong>the</strong> likelihood that illegal logg<strong>in</strong>g will cont<strong>in</strong>ue on a massive<br />
scale <strong>in</strong> Indonesia, thus cont<strong>in</strong>u<strong>in</strong>g to flood <strong>the</strong> market and drive prices down. The general state <strong>of</strong> <strong>the</strong><br />
world economy may also act to keep prices flat. Long-term outlook for price <strong>in</strong>creases is uncerta<strong>in</strong><br />
and seems to depend on two factors that contravene each o<strong>the</strong>r:<br />
1. The <strong>in</strong>creas<strong>in</strong>g scarcity <strong>of</strong> raw logs from natural <strong>forest</strong> cuts (scarcity drives prices up); and<br />
2. The <strong>in</strong>creas<strong>in</strong>g availability <strong>of</strong> close substitutes for <strong>the</strong> products produced from <strong>the</strong>se logs that<br />
could drive <strong>the</strong> log market demand, and prices, down.<br />
New alternatives for use <strong>of</strong> <strong>forest</strong>s to capture foreign currency may be emerg<strong>in</strong>g: a market for<br />
conservation services (compensation for <strong>the</strong> right to conserve biodiversity) has reached about $US500<br />
million and is likely to cont<strong>in</strong>ue expand<strong>in</strong>g 31 (pers. comm. J. Hardner). Information on recent<br />
proposals suggests that this market may be significantly larger (see Gullison et al, 2000).<br />
Conceivably, deals currently under negotiation are likely to result <strong>in</strong> payments <strong>of</strong> up to $US4/hectare<br />
per annum for several decades if not longer (Rice, 2001). As natural <strong>forest</strong>s <strong>in</strong> PNG become<br />
<strong>in</strong>creas<strong>in</strong>gly expensive to log, <strong>the</strong> opportunity cost <strong>of</strong> conserv<strong>in</strong>g rema<strong>in</strong><strong>in</strong>g natural stands will<br />
become lower, perhaps lower than <strong>of</strong>fers made to preserve <strong>the</strong>m. Recogniz<strong>in</strong>g and anticipat<strong>in</strong>g how<br />
such changes may create opportunities for PNG will help <strong>the</strong> country position itself to take advantage<br />
<strong>of</strong> mechanisms that may <strong>in</strong> <strong>the</strong> future allow government and landowners to access emerg<strong>in</strong>g markets<br />
and transition smoothly from natural <strong>forest</strong> logg<strong>in</strong>g to o<strong>the</strong>r <strong>forest</strong> uses.<br />
b. Consider develop<strong>in</strong>g mechanisms that directly l<strong>in</strong>k any decision to award or defer proposed<br />
logg<strong>in</strong>g concessions to <strong>the</strong> follow<strong>in</strong>g conditions:<br />
Prolonged FOB prices that are lower than <strong>the</strong> estimated m<strong>in</strong>imum required “budget” for logg<strong>in</strong>g<br />
(about $US 70 per cubic metre given current estimates, which need to be progressively ref<strong>in</strong>ed).<br />
Transfer pric<strong>in</strong>g and o<strong>the</strong>r forms <strong>of</strong> malfeasance rema<strong>in</strong> suspect (leakage <strong>of</strong> <strong>forest</strong> values is<br />
potentially significant).<br />
The <strong>forest</strong> asset is be<strong>in</strong>g dim<strong>in</strong>ished <strong>in</strong> value but alternative assets <strong>of</strong> equal or greater value are<br />
not be<strong>in</strong>g created <strong>in</strong> <strong>the</strong> wake (i.e. <strong>the</strong>re exists little or no capacity to <strong>in</strong>vest <strong>in</strong> public goods or<br />
assets such as plantations and wood process<strong>in</strong>g).<br />
10.8 RECOMMENDATIONS FOR INDUSTRY<br />
These emerge from <strong>the</strong> recommendations on resource rent below.<br />
10.8.1 Recommendations on Transfer Pric<strong>in</strong>g<br />
Two recommendations are made <strong>in</strong> relation to <strong>the</strong> present monitor<strong>in</strong>g and control <strong>system</strong>:<br />
The <strong>system</strong> needs to be audited periodically by an <strong>in</strong>dependent third party. The auditor should focus<br />
on <strong>the</strong> quality <strong>of</strong> work and coverage, as well as identify<strong>in</strong>g ways <strong>of</strong> streaml<strong>in</strong><strong>in</strong>g <strong>the</strong> work to improve<br />
<strong>the</strong> work efficiency. This will ensure a cont<strong>in</strong>uous improvement <strong>of</strong> <strong>the</strong> <strong>system</strong> and also help to reduce<br />
costs.<br />
A market <strong>in</strong>telligence service should be created by <strong>the</strong> PNGFA. This service would help to monitor<br />
prices, as well as to identify market opportunities for <strong>the</strong> PNG <strong>forest</strong> <strong>in</strong>dustry as a whole. The State<br />
31 This is <strong>in</strong>tended as one example <strong>of</strong> several emerg<strong>in</strong>g options. Fur<strong>the</strong>r study would be needed to determ<strong>in</strong>e whe<strong>the</strong>r and<br />
under what conditions such options will be viable <strong>in</strong> PNG.<br />
PAGE 134
2001 FOREST REVENUE REVIEW<br />
Purchase Option has not functioned well <strong>in</strong> this role. Hav<strong>in</strong>g a broader market <strong>in</strong>telligence service,<br />
beyond <strong>the</strong> focus on regulatory issues, has already been recommended by previous studies.<br />
In case PNG decides to go <strong>in</strong>to a more detailed <strong>in</strong>vestigation it will be necessary to work at <strong>the</strong><br />
shipment level, and to establish l<strong>in</strong>ks between documents issued <strong>in</strong> PNG and <strong>the</strong> correspond<strong>in</strong>g<br />
documents at <strong>the</strong> f<strong>in</strong>al dest<strong>in</strong>ation <strong>in</strong> <strong>the</strong> import<strong>in</strong>g port. This basically means to take random sample<br />
shipments and audit <strong>the</strong>m along <strong>the</strong> cha<strong>in</strong> <strong>of</strong> custody. The alternative is to move back to a <strong>system</strong> <strong>of</strong><br />
sett<strong>in</strong>g benchmark prices for assess<strong>in</strong>g export tax liability.<br />
A firm recommendation is for Government to take a decision on deal<strong>in</strong>g with <strong>the</strong> issue, based on <strong>the</strong><br />
results <strong>of</strong> this <strong>in</strong>vestigation, which are that unexpla<strong>in</strong>ed discrepancies exist but no transfer pric<strong>in</strong>g<br />
practice has been proven. The options are:<br />
Move to a <strong>system</strong> <strong>of</strong> endorsed prices based on cif values less assessed freight and <strong>in</strong>surance<br />
costs.<br />
Exam<strong>in</strong>e by random samples shipments where an audit trail can be determ<strong>in</strong>ed and observed,<br />
with <strong>the</strong> cooperation <strong>of</strong> import<strong>in</strong>g country tax authorities.<br />
Accept <strong>the</strong> status quo. This implies eschew<strong>in</strong>g <strong>the</strong> use <strong>of</strong> unproven transfer pric<strong>in</strong>g practices<br />
when mak<strong>in</strong>g fiscal policy and calculat<strong>in</strong>g its effects on taxpayers.<br />
10.8.2 Recommendations on <strong>the</strong> Industry Performance Bond<br />
At present <strong>the</strong>re is <strong>in</strong>sufficient actuarial data on <strong>the</strong> nature and extent <strong>of</strong> contractual default and <strong>the</strong><br />
present <strong>system</strong> should rema<strong>in</strong> <strong>in</strong> place until this evidence has been ga<strong>the</strong>red and can be analysed.<br />
10.8.3 Recommendations for Short Term Action on Resource Rent Issues<br />
Take no action to adjust <strong>the</strong> <strong>revenue</strong> <strong>system</strong> until a decision is made and implemented as detailed<br />
above on <strong>the</strong> existence and extent <strong>of</strong> transfer pric<strong>in</strong>g. If transfer pric<strong>in</strong>g is a substantial problem,<br />
replace ad valorem duties and charges with specific duties and charges automatically updated for<br />
changes <strong>in</strong> an endorsed price derived from cif values.<br />
Reduce <strong>the</strong> level <strong>of</strong> log export duties. This is important to reduce <strong>the</strong> risk <strong>of</strong> a substantial<br />
contraction <strong>in</strong> <strong>the</strong> rate <strong>of</strong> logg<strong>in</strong>g and hence <strong>in</strong> total payments to <strong>the</strong> Government and<br />
landowners.<br />
Give consideration to <strong>the</strong> follow<strong>in</strong>g <strong>in</strong>terim changes to <strong>the</strong> export duty ⎯<br />
Re-<strong>in</strong>statement <strong>of</strong> <strong>the</strong> thresholds at <strong>the</strong> US$ value that applied on 22 November 1995. This<br />
would reduce <strong>the</strong> average export duty at current prices from approximately K57 per cubic metre<br />
to approximately K30 per cubic metre (but is more likely to susta<strong>in</strong> logg<strong>in</strong>g than <strong>the</strong> current<br />
export duty rates); or<br />
Exempt exports from duty up to a specified, m<strong>in</strong>imum level (eg US$39 per cubic metre, be<strong>in</strong>g<br />
<strong>the</strong> estimated cash cost <strong>of</strong> logg<strong>in</strong>g exclud<strong>in</strong>g duties and charges) with exist<strong>in</strong>g marg<strong>in</strong>al duty<br />
rates to apply. This would reduce <strong>the</strong> average export duty at current prices from approximately<br />
K57 per cubic metre to approximately K33 per cubic metre (but is more likely to susta<strong>in</strong> logg<strong>in</strong>g<br />
than <strong>the</strong> current export duty rates).<br />
Remove export duties on logs harvested from plantations that have been developed by <strong>the</strong> private<br />
sector (<strong>in</strong>clud<strong>in</strong>g landowners) at <strong>the</strong>ir own <strong>in</strong>itiative and cost provided that a fair price has been<br />
paid for <strong>the</strong> <strong>in</strong>puts (<strong>in</strong> particular land).<br />
Increase payments to landowners provided mechanisms are <strong>in</strong> place to ensure <strong>the</strong> susta<strong>in</strong>able use<br />
<strong>of</strong> <strong>the</strong> extra funds provided.<br />
PAGE 135
2001 FOREST REVENUE REVIEW<br />
Give consideration to, as an <strong>in</strong>terim measure, compensat<strong>in</strong>g landowners for <strong>the</strong> reduction <strong>in</strong> <strong>the</strong><br />
US$ value <strong>of</strong> <strong>the</strong> royalty s<strong>in</strong>ce 22 November 1995, provided a management <strong>system</strong> is <strong>in</strong> place<br />
similar to that to be established under <strong>the</strong> Project Development Benefit. This would <strong>in</strong>volve an<br />
<strong>in</strong>crease <strong>in</strong> landowner benefits <strong>of</strong> approximately K17 per cubic metre.<br />
10.8.4 A Model System for <strong>the</strong> Longer Term<br />
Re-design <strong>the</strong> <strong>revenue</strong> <strong>system</strong> to ⎯<br />
allow operators to re-cover <strong>the</strong> full costs <strong>of</strong> efficient operations over time.<br />
as a m<strong>in</strong>imum, provide <strong>the</strong> National Government at least enough <strong>revenue</strong> to fund <strong>the</strong> Papua New<br />
Gu<strong>in</strong>ea <strong>Forest</strong> Authority to adequately implement <strong>the</strong> National <strong>Forest</strong> Policy.<br />
ensure that landowner payments at least match <strong>the</strong> <strong>in</strong>come <strong>of</strong>fered by alternative uses <strong>of</strong> <strong>the</strong><br />
<strong>forest</strong> and <strong>the</strong> reduced environmental value result<strong>in</strong>g from <strong>forest</strong> activities.<br />
provide landowners and <strong>the</strong> government 70 per cent or more <strong>of</strong> <strong>the</strong> resource rent generated by<br />
logg<strong>in</strong>g (be<strong>in</strong>g <strong>the</strong> difference between <strong>revenue</strong> and <strong>the</strong> total cost for an efficient operation).<br />
subject both export logs and logs that could be exported but are processed to a similar level <strong>of</strong><br />
government and landowner charges.<br />
build <strong>the</strong> future <strong>revenue</strong> <strong>system</strong> upon <strong>the</strong> parameters shown <strong>in</strong> Table 10.3<br />
10.8.5 Tax Rates and Thresholds<br />
Establish <strong>the</strong> payment to landowners <strong>in</strong> <strong>the</strong> first <strong>in</strong>stance, and subsequently set export duty rates<br />
and thresholds for export logs so as to ensure that <strong>the</strong> share <strong>of</strong> resource rent captured by<br />
government and landowners is at least 70 per cent over time. This could be implemented, for<br />
example, by calculat<strong>in</strong>g <strong>the</strong> export duty for logs as 70 per cent <strong>of</strong> <strong>the</strong> difference between <strong>the</strong><br />
actual fob price and <strong>the</strong> <strong>in</strong>dustry’s average, total cost <strong>of</strong> logg<strong>in</strong>g (as shown <strong>in</strong> Table 10.3) less<br />
actual payments to landowners.<br />
Give consideration to establish<strong>in</strong>g <strong>the</strong> export duty on export logs as a de facto company tax on<br />
<strong>the</strong> logg<strong>in</strong>g sector. Extend<strong>in</strong>g <strong>the</strong> example <strong>of</strong> <strong>the</strong> previous paragraph, this could be implemented<br />
by deduct<strong>in</strong>g from <strong>the</strong> total cost <strong>of</strong> logg<strong>in</strong>g <strong>the</strong> <strong>in</strong>dustry’s average pr<strong>of</strong>it (as shown <strong>in</strong> Table 10.3)<br />
with an appropriate marg<strong>in</strong>al duty rate to apply (i.e. <strong>of</strong> 30 per cent).<br />
Set thresholds for <strong>the</strong> export duty apply<strong>in</strong>g to export logs ei<strong>the</strong>r <strong>in</strong> US$ or automatically adjust<br />
<strong>the</strong>m for changes <strong>in</strong> <strong>the</strong> K<strong>in</strong>a/US$ rate. This would ensure <strong>the</strong> duty is largely neutral with respect<br />
to changes <strong>in</strong> <strong>the</strong> k<strong>in</strong>a.<br />
Give consideration to ensur<strong>in</strong>g <strong>the</strong> Project Development Benefit is neutral with respect to <strong>the</strong><br />
k<strong>in</strong>a. This would mean <strong>the</strong> effective rate <strong>of</strong> levy would be <strong>in</strong>variant to changes <strong>in</strong> <strong>the</strong> k<strong>in</strong>a.<br />
Thresholds and any specific charge (i.e. a charge def<strong>in</strong>ed as a set amount per cubic metre) could<br />
be specified <strong>in</strong> k<strong>in</strong>a provided thresholds and specific charges are automatically adjusted to<br />
compensate for movements <strong>in</strong> <strong>the</strong> k<strong>in</strong>a.<br />
Set <strong>the</strong> m<strong>in</strong>imum payment to landowners for commercial <strong>forest</strong>ry at <strong>the</strong> estimated landowner<br />
cost <strong>of</strong> US$6 per cubic metre. Landowners would also receive a share <strong>of</strong> <strong>the</strong> resource rent (be<strong>in</strong>g<br />
<strong>the</strong> difference between <strong>revenue</strong> and <strong>the</strong> total cost <strong>of</strong> logg<strong>in</strong>g).<br />
Base <strong>the</strong> landowner payments for operations o<strong>the</strong>r than commercial <strong>forest</strong>ry (e.g. conservation<br />
areas or non-wood <strong>forest</strong> products such as eaglewood) on <strong>the</strong> same pr<strong>in</strong>ciples as <strong>the</strong> <strong>forest</strong><br />
<strong>revenue</strong> <strong>system</strong>.<br />
PAGE 136
10.8.6 The Revenue Base<br />
2001 FOREST REVENUE REVIEW<br />
Undertake <strong>in</strong>vestigations <strong>of</strong> <strong>the</strong> feasibility <strong>of</strong> levy<strong>in</strong>g export duties and landowner charges on<br />
logs that could be exported but are processed (at a level to that apply<strong>in</strong>g to export logs <strong>of</strong> similar<br />
value).<br />
Subject all logg<strong>in</strong>g activities to a charge that recovers average government and landowner costs.<br />
The National Government should exempt plantation timber from export duties, provided <strong>the</strong><br />
plantation has been developed by a logg<strong>in</strong>g company or landowner group at <strong>the</strong>ir own <strong>in</strong>itiative<br />
and cost and provided a fair price has been paid for <strong>the</strong> <strong>in</strong>puts (<strong>in</strong> particular land).<br />
10.8.7 Adm<strong>in</strong>istration<br />
Progressively <strong>in</strong>troduce <strong>the</strong> Project Development Benefit to consolidate and standardise <strong>the</strong><br />
various landowner charges, to m<strong>in</strong>imise <strong>the</strong> potential for non-payment and to help ensure that<br />
payments to landowners are allocated for susta<strong>in</strong>able uses.<br />
Install improved mechanisms to ensure <strong>the</strong> accountability <strong>of</strong> payments to landowners.<br />
Improve <strong>in</strong>formation shar<strong>in</strong>g arrangements between <strong>the</strong> IRC, <strong>the</strong> <strong>Forest</strong> Authority (<strong>in</strong>clud<strong>in</strong>g<br />
SGS PNG) and BoPNG to ensure consistency and <strong>the</strong> cross-check<strong>in</strong>g <strong>of</strong> data.<br />
Consider <strong>the</strong> possibility <strong>of</strong> requir<strong>in</strong>g companies to make <strong>the</strong>ir export duty payments <strong>in</strong> US$.<br />
10.8.8 Implementation<br />
Develop an <strong>in</strong>dustry action plan between government, landowners and operators to provide for a<br />
phased and predictable <strong>in</strong>troduction <strong>of</strong> <strong>the</strong> revised <strong>revenue</strong> <strong>system</strong>.<br />
Give fur<strong>the</strong>r consideration to ensur<strong>in</strong>g methods are <strong>in</strong> place to, over <strong>the</strong> long run, ensure a<br />
reduction <strong>in</strong> <strong>the</strong> value <strong>of</strong> <strong>the</strong> <strong>forest</strong> asset only occurs if <strong>new</strong> assets <strong>of</strong> equal value are created for<br />
landowners.<br />
PAGE 137
ANNEX A DATA ON THE FOREST SECTOR<br />
2001 FOREST REVENUE REVIEW<br />
A number <strong>of</strong> qualifications apply to <strong>the</strong> data and methodology used to prepare <strong>the</strong> estimates <strong>of</strong><br />
resource rent and actual and potential <strong>revenue</strong> collections as summarised <strong>in</strong> Tables A.1 to A.3 ⎯<br />
Ideally resource rent calculations should be based on <strong>the</strong> marg<strong>in</strong>al cost <strong>of</strong> logg<strong>in</strong>g, where price<br />
received on each log should be compares with this marg<strong>in</strong>al cost <strong>of</strong> harvest<strong>in</strong>g that log. However<br />
this study has not been able to estimate <strong>the</strong> marg<strong>in</strong>al cost <strong>of</strong> logg<strong>in</strong>g, and <strong>in</strong>stead <strong>the</strong> resource<br />
rent calculations are based on <strong>the</strong> average cost <strong>of</strong> logg<strong>in</strong>g.<br />
The methodology employed can be expected to under-estimate <strong>the</strong> level <strong>of</strong> resource rent that<br />
could be generated by <strong>the</strong> <strong>forest</strong> sector. The royalties and export duty set a m<strong>in</strong>imum charge per<br />
cubic metre. If <strong>the</strong> resource rent on a log is less than this m<strong>in</strong>imum charge, it will not be logged<br />
because <strong>the</strong> <strong>revenue</strong> from <strong>the</strong> sale <strong>of</strong> <strong>the</strong> log will be less than <strong>the</strong> total costs faced by <strong>the</strong> logg<strong>in</strong>g<br />
company (ie <strong>the</strong> harvest<strong>in</strong>g cost <strong>in</strong>clusive <strong>of</strong> a normal return on capital <strong>in</strong>vested and <strong>the</strong><br />
landowner and government charge). This means that <strong>the</strong>re are trees rema<strong>in</strong><strong>in</strong>g that do <strong>of</strong>fer<br />
resource rent that rema<strong>in</strong> un-harvested. This resource rent is not estimated. 32<br />
It is assumed <strong>the</strong>re is no transfer pric<strong>in</strong>g and that <strong>the</strong> volume and value <strong>of</strong> all logs are correctly<br />
recorded.<br />
The estimates <strong>of</strong> <strong>the</strong> landowner payments are approximates only based on assumptions regard<strong>in</strong>g<br />
<strong>the</strong> charge <strong>system</strong>s <strong>in</strong> place. Data on actual payments were not available. Estimates are based on<br />
Groome Poyry (1998) as summarised <strong>in</strong> Table A.4.<br />
The calculations assume that <strong>the</strong> average cost <strong>of</strong> logg<strong>in</strong>g has been constant s<strong>in</strong>ce 1985 <strong>in</strong> US$<br />
terms. This is a simplify<strong>in</strong>g assumption made due to data limitations. In practice it is likely <strong>the</strong><br />
cost <strong>of</strong> logg<strong>in</strong>g was lower <strong>in</strong> earlier years. This effect would tend to under-estimate <strong>the</strong> level <strong>of</strong><br />
resource rent seen <strong>in</strong> earlier years.<br />
The normal level <strong>of</strong> pr<strong>of</strong>it and depreciation is based on our estimate <strong>of</strong> <strong>the</strong> typical, actual written<br />
down value <strong>of</strong> logg<strong>in</strong>g capital. This is seen as 67 per cent <strong>of</strong> <strong>the</strong> cost <strong>of</strong> <strong>new</strong> equipment.<br />
The full dataset is conta<strong>in</strong>ed <strong>in</strong> spreadsheets used to estimate resource rent, its distribution and to<br />
prepare <strong>the</strong> cost-benefit assessment <strong>of</strong> process<strong>in</strong>g which have been provided to <strong>the</strong> PNGFS.<br />
32 V<strong>in</strong>cent (1990) presents a methodology for estimat<strong>in</strong>g this additional component <strong>of</strong> resource rent based on estimates <strong>of</strong><br />
<strong>the</strong> marg<strong>in</strong>al cost curve. However, we do not have <strong>in</strong>formation on key parameters required to apply <strong>the</strong> methodology<br />
mean<strong>in</strong>gfully.<br />
PAGE 138
TABLE A.1 BACKGROUND DATA AND ASSUMPTIONS<br />
2001 FOREST REVENUE REVIEW<br />
Units 1990 1991 1992 1993 1994 1995 1996 1997 1998 1999 2000 2001 (Sep)<br />
Total/Simple<br />
Average<br />
Export volumes m3 990,200 1,061,800 1,601,000 2,374,900 3,050,340 1,998,187 2,625,861 3,006,157 1,612,566 1,983,853 1,992,526 1,145,252 23,442,642<br />
K<strong>in</strong>a FOB price K per m3 66 76 87 169 158 167 133 166 136 193 189 181 144<br />
US$ FOB price US$ per m3 69 80 89 172 157 131 101 117 66 77 72 59 99<br />
K<strong>in</strong>a export <strong>revenue</strong> '000 K 65,200 81,200 140,000 400,200 483,585 329,544 349,471 496,138 217,544 385,569 379,825 206,820 3,535,095<br />
US$ export <strong>revenue</strong> '000 US$ 68,532 85,244 141,778 407,804 478,757 260,977 264,831 351,114 106,646 151,918 143,713 67,350 2,528,662<br />
Logg<strong>in</strong>g costs '000 US$ 52,728 56,541 85,253 126,463 162,431 106,403 139,827 160,078 85,869 105,640 106,102 60,985 1,248,321<br />
Resource rent '000 K 12,472 24,659 54,747 273,737 318,592 195,187 164,860 268,752 41,466 118,249 99,551 19,355 1,591,627<br />
- K<strong>in</strong>a per m3 K per m3 13 23 34 115 108 99 63 88 23 61 50 14 58<br />
- US$ per m3<br />
Operator normal<br />
pr<strong>of</strong>it<br />
US$ per m3 13 24 35 117 107 77 48 63 11 24 19 5 45<br />
- K<strong>in</strong>a '000 K 13,048 14,008 21,896 32,279 42,914 34,946 48,016 59,142 45,797 69,528 72,897 48,758 503,228<br />
- US$<br />
Depreciation<br />
'000 US$ 13,714 14,706 22,174 32,892 42,247 27,675 36,368 41,635 22,334 27,476 27,596 15,862 324,681<br />
- K<strong>in</strong>a '000 K 7,442 7,990 12,489 18,412 24,478 19,933 27,388 33,734 26,122 39,659 41,580 27,812 287,040<br />
- US$<br />
Production cost<br />
'000 US$ 7,823 8,388 12,648 18,762 24,098 15,786 20,744 23,749 12,739 15,672 15,741 9,047 185,197<br />
- K<strong>in</strong>a '000 K 37,117 39,850 62,288 91,826 122,079 99,412 136,595 168,244 130,281 197,792 207,376 138,706 1,431,567<br />
- US$<br />
Parameters<br />
Total operator cost<br />
'000 US$ 39,014 41,835 63,079 93,571 120,183 78,729 103,459 118,443 63,535 78,164 78,506 45,123 923,640<br />
(<strong>in</strong>cl <strong>of</strong> normal pr<strong>of</strong>it)<br />
Operator normal<br />
pr<strong>of</strong>it (<strong>in</strong>cl <strong>of</strong><br />
US$ per m3 53 53 53 53 53 53 53 53 53 53 53 53 53<br />
depreciation) US$ per m3 14 14 14 14 14 14 14 14 14 14 14 14 14<br />
Depreciation<br />
Operator normal<br />
pr<strong>of</strong>it m<strong>in</strong>us<br />
US$ per m3 8 8 8 8 8 8 8 8 8 8 8 8 8<br />
depreciation US$ per m3 6 6 6 6 6 6 6 6 6 6 6 6 6<br />
Production cost US$ per m3 39 39 39 39 39 39 39 39 39 39 39 39 39<br />
US$/K<strong>in</strong>a 1.05 1.05 1.01 1.02 0.99 0.78 0.76 0.70 0.49 0.40 0.38 0.32 0.75<br />
PAGE 139
TABLE A.2 ESTIMATED REVENUE COLLECTIONS UNDER THE ACTUAL REVENUE SYSTEM<br />
2001 FOREST REVENUE REVIEW<br />
Units 1990 1991 1992 1993 1994 1995 1996 1997 1998 1999 2000 2001 (Sep) Total/Simple<br />
Average<br />
Payment to National Government '000 K 12,865 16,049 27,289 75,375 150,018 140,088 114,167 156,706 48,628 99,367 138,069 68,885 1,047,506<br />
Export duty '000 K 11,140 14,200 24,500 71,600 147,418 138,237 111,658 153,588 47,027 97,134 135,875 67,595 1,019,972<br />
- unit rate <strong>in</strong> k<strong>in</strong>a K per m3 11 13 15 30 48 69 43 51 29 49 68 59 41<br />
- unit rate <strong>in</strong> US$ US$ per m3 12 14 15 31 49 56 33 36 14 19 26 19 27<br />
Withhold<strong>in</strong>g tax on royalty '000 K 1,124 1,205 1,817 2,333 748 638 915 1,293 622 1,029 984 595 13,302<br />
- unit rate K per m3 0 0 0 1 0 0 0 1 1 1 1 0 0<br />
Payment to <strong>Forest</strong> Authority '000 K 601 645 972 1,442 1,852 1,213 1,594 1,825 979 1,204 1,210 695 14,232<br />
Payment to prov<strong>in</strong>cial governments '000 K 1,555 1,668 2,514 3,440 5,013 3,877 1,740 1,993 1,069 1,315 1,321 759 26,264<br />
Royalty to prov<strong>in</strong>cial governments '000 K 899 964 1,453 1,866 2,991 2,553 0 0 0 0 0 0 10,726<br />
- unit rate K per m3 0 0 0 1 1 1 0 0 0 0 0 0 0<br />
Levies to prov<strong>in</strong>cial governments '000 K 656 704 1,061 1,574 2,022 1,324 1,740 1,993 1,069 1,315 1,321 759 15,538<br />
Landowner payment '000 K 13,841 15,584 24,655 57,550 48,519 30,268 44,949 60,953 31,282 43,730 44,207 25,031 440,569<br />
- unit rate K per m3 14 15 15 24 16 15 17 20 19 22 22 22 19<br />
Landowner royalty '000 K 6,920 7,792 12,327 32,276 17,058 9,240 20,065 29,305 15,905 19,350 19,655 11,297 201,192<br />
Land owner premium '000 K 5,250 6,001 9,626 21,267 26,313 17,657 20,453 26,576 12,657 21,032 21,190 11,801 199,822<br />
O<strong>the</strong>r payments to landowners<br />
Operator above-normal pr<strong>of</strong>it<br />
'000 K 1,671 1,792 2,701 4,007 5,147 3,372 4,431 5,072 2,721 3,347 3,362 1,932 39,555<br />
- K<strong>in</strong>a '000 K -15,789 -8,642 289 137,372 115,042 20,953 4,003 49,100 -39,513 -26,163 -84,045 -75,319 77,288<br />
- US$ '000 US$ -16,596 -9,073 293 139,982 113,001 17,252 3,007 35,319 -19,186 -9,500 -31,690 -24,479 198,328<br />
- US$ per cubic metre US$ per m3 -17 -9 0 59 38 7 1 15 -18 -7 -23 -87 -3<br />
Operator pr<strong>of</strong>it before depreciation '000 K -2,741 5,366 22,185 169,651 156,009 56,010 51,879 107,993 6,069 43,376 -11,198 -26,561 578,036<br />
Operator pr<strong>of</strong>it after depreciation '000 K -10,184 -2,624 9,696 151,239 131,531 36,077 24,490 74,259 -20,054 3,717 -52,778 -54,373 290,996<br />
Company tax<br />
Distribution <strong>of</strong> rent<br />
'000 K 0 0 11 226 6,890 5,107 1,910 0 56 0 0 0 14,201<br />
Government ratio to rent (%) 116 72 54 29 49 74 70 59 120 85 140 360 102<br />
Landowner ratio to rent (%) 111 63 45 21 15 16 27 23 75 37 44 129 51<br />
Operator ratio to rent (%) -127 -35 1 50 36 11 2 18 -95 -22 -84 -389 -53<br />
PAGE 140
TABLE A.2 ESTIMATED REVENUE COLLECTIONS UNDER THE ACTUAL REVENUE SYSTEM (CONT)<br />
Parameters <strong>of</strong> actual <strong>system</strong><br />
Units 1990 1991 1992 1993 1994 1995 1996 1997 1998 1999 2000<br />
2001 FOREST REVENUE REVIEW<br />
2001<br />
(Sep)<br />
Total/Simple<br />
Average<br />
Landowners royalty<br />
k<strong>in</strong>a per cubic<br />
metre<br />
3 3 3 3 6 5 8 10 10 10 10 10 7<br />
Share <strong>of</strong> landowners premium specified on 0 0 0 0 0 0 0 0 0 0 0 0 0<br />
- per cubic metre basis per cent 57 57 57 57 57 57 57 57 57 57 57 57 57<br />
- share <strong>of</strong> FOB value<br />
Landowners premium<br />
per cent 43 43 43 43 43 43 43 43 43 43 43 43 43<br />
- per cubic metre basis<br />
k<strong>in</strong>a per cubic<br />
metre<br />
6 6 6 6 6 6 6 6 6 6 6 6 6<br />
- share <strong>of</strong> FOB value per cent 8 8 8 8 8 8 8 8 8 8 8 8 8<br />
Infrastructure benefits to<br />
landowners<br />
O<strong>the</strong>r payments to landowners<br />
Payments to prov<strong>in</strong>cial<br />
governments<br />
k<strong>in</strong>a per cubic<br />
metre<br />
k<strong>in</strong>a per cubic<br />
metre<br />
k<strong>in</strong>a per cubic<br />
metre<br />
1 1 1 1 1 1 1 1 1 1 1 1 1<br />
1 1 1 1 4 4 4 4 4 4 4 4 3<br />
1 1 1 1 4 4 4 4 4 4 4 4 3<br />
Payments to <strong>Forest</strong> Authority<br />
k<strong>in</strong>a per cubic<br />
metre<br />
1 1 1 1 4 4 4 4 4 4 4 4 3<br />
Rent based duty rate per cent 35 35 35 35 35 35 35 35 35 35 35 35 35<br />
PAGE 141
TABLE A.3 HYPOTHETICAL ESTIMATED REVENUE CALCULATIONS AS IF THE PREFERRED REVENUE SYSTEM HAD APPLIED<br />
Units 1990 1991 1992 1993 1994 1995 1996 1997 1998 1999 2000<br />
2001 FOREST REVENUE REVIEW<br />
2001<br />
(Sep)<br />
Total/Simple<br />
Average<br />
Landowner cost '000 K 5,652 6,069 9,486 13,984 18,591 15,139 20,801 25,621 19,840 30,121 31,580 21,123 218,005<br />
O<strong>the</strong>r payments '000 K 4,710 5,057 7,905 11,653 15,492 12,616 17,334 21,351 16,533 25,100 26,317 17,602 181,671<br />
Government cost<br />
Actual normal pr<strong>of</strong>it m<strong>in</strong>us<br />
'000 K 3,768 4,046 6,324 9,322 12,394 10,093 13,867 17,081 13,226 20,080 21,053 14,082 145,337<br />
depreciation '000 K 5,605 6,018 9,406 13,867 18,436 15,013 20,628 25,407 19,674 29,870 31,317 20,035 215,277<br />
- unit rate <strong>in</strong> k<strong>in</strong>a k<strong>in</strong>a per m3 6 6 6 6 6 8 8 9 12 15 16 17 9<br />
- unit rate <strong>in</strong> US$s US$ per m3 6 6 6 6 6 6 6 6 6 6 6 6 6<br />
De-facto company tax '000 K 1,682 1,805 2,822 4,160 5,531 4,504 6,188 7,622 5,902 8,961 9,395 6,011 64,583<br />
- tax rate per cent 30 30 30 30 30 30 30 30 30 30 30 30 30<br />
Additional pr<strong>of</strong>its tax '000 K 0 2,090 14,609 156,656 176,538 98,784 63,399 124,074 1,501 8,897 1,057 0 647,605<br />
- tax rate per cent 70 70 70 70 70 70 70 70 70 70 70 70 70<br />
Government payment '000 K 5,450 7,941 23,755 170,139 194,462 113,380 83,455 148,777 20,630 37,939 31,505 20,092 857,525<br />
Operator pr<strong>of</strong>it before depreciation<br />
Operator pr<strong>of</strong>it after depreciation<br />
'000 K 12,270 22,283 36,567 112,598 132,960 88,998 91,286 132,145 30,260 94,618 83,047 9,296 846,327<br />
- <strong>in</strong> k<strong>in</strong>a '000 K 4,828 14,293 24,078 94,186 108,483 69,065 63,897 98,411 4,138 54,959 41,466 -18,515 559,287<br />
- <strong>in</strong> US$ 000 US$ 5,075 15,004 24,383 95,976 107,603 54,695 48,438 69,831 2,454 21,481 15,637 -5,959 454,618<br />
- US$ per m3 US$ per m3 5 14 15 40 36 27 18 23 0 11 8 -6 16<br />
Operator above-normal pr<strong>of</strong>it '000 K -3,341 5,592 13,602 77,961 90,047 54,052 43,270 73,004 -15,537 25,089 10,149 -39,462 334,426<br />
- share <strong>of</strong> rent per cent -27 23 25 28 28 28 26 27 -96 20 9 -324 -19<br />
Parameters<br />
Landowner cost US$ per m3 6 6 6 6 6 6 6 6 6 6 6 6 6<br />
O<strong>the</strong>r landowner payments US$ per m3 5 5 5 5 5 5 5 5 5 5 5 5 5<br />
Government cost<br />
Distribution <strong>of</strong> rent<br />
US$ per m3 4 4 4 4 4 4 4 4 4 4 4 4 4<br />
Government ratio to rent (%) 44 32 43 62 61 58 51 55 50 32 32 104 52<br />
Landowner ratio to rent (%) 83 45 32 9 11 14 23 17 88 47 58 200 52<br />
Operator ratio to rent (%) -27 23 25 28 28 28 26 27 -37 21 10 -204 -4<br />
PAGE 142
TABLE A.4 LANDOWNER PREMIUMS AND THE OTHER LEVIES BY LOGGING AREA<br />
2001 FOREST REVENUE REVIEW<br />
Logg<strong>in</strong>g area Exports from Estimated<br />
O<strong>the</strong>r levies <strong>in</strong> K per cubic metre<br />
Jul ’96 - Nov ‘97 landowners premium<br />
<strong>in</strong> K per cubic metre<br />
Km FOB at current prices<br />
Landowners Prov Govt PNGFA<br />
LFA-10-1 25 79.2 2.0 1.0 0.0<br />
LFA-10-2 14 6.5 2.0 1.0 1.0<br />
LFA-11-1 1 n.c. 1.0 0.5 1.0<br />
LFA-11-2 n.a. 5.0 1.0 1.0 1.0<br />
LFA-14-10 21 10.0 2.0 2.5 1.0<br />
LFA-14-11 13 5.0 1.0 1.5 1.0<br />
LFA-14-13 12 20.0 2.0 1.0 1.0<br />
LFA-14-2 9 16.0 3.0 0.0 0.0<br />
LFA-14-3 10 16.0 3.0 0.0 0.0<br />
LFA-14-4 19 12.5 3.0 0.5 1.0<br />
LFA-14-7 12 5.5 1.0 1.5 1.0<br />
LFA-14-8 15 20.0 2.0 1.0 1.0<br />
LFA-14-9 14 5.5 1.0 1.5 1.0<br />
LFA-18-1 7 12.0 2.0 1.0 0.0<br />
LFA-18-2 3 18.0 2.0 2.0 1.0<br />
LFA-3-2 1 4.0 3.0 0.5 1.0<br />
LFA-5-1 9 12.0 6.0 0.0 1.0<br />
TP-10-8 55 15.0 1.0 2.0 1.0<br />
TP-12-18 6 8.0 1.0 1.5 1.0<br />
TP-12-20 9 10.0 0.0 0.5 1.0<br />
TP-12-22 6 12.0 0.0 0.0 0.0<br />
TP-13-27 8 20.0 2.0 5.0 1.0<br />
TP-13-35 4 n.c. 0.0 0.0 0.0<br />
TP-14-41 6 n.c. 0.0 0.0 0.0<br />
TP-14-50 15 6.0 0.0 0.0 0.0<br />
TP-14-52 21 4.0 0.0 0.0 0.0<br />
TP-14-53 18 35.0 1.5 0.0 1.0<br />
TP-14-54 16 35.0 3.0 0.0 1.0<br />
TP-14-55 22 35.0 2.0 0.0 2.0<br />
TP-14-58 1 n.c. 0.0 0.0 0.0<br />
TP-15-49 2 n.c. 0.0 0.0 0.0<br />
TP-15-52 12 4.0 1.0 0.0 1.0<br />
TP-15-53 12 n.c. 0.0 0.0 0.0<br />
TP-15-56 12 20.0 3.0 1.0 1.0<br />
TP-16-43 7 7.1 3.0 0.0 1.3<br />
TP-16-48 5 4.0 1.0 1.0 0.0<br />
TP-1-7 74 1.8 0.0 0.0 0.5<br />
TP-18-2 8 13.0 0.0 0.0 0.0<br />
TP-2-12 38 10.0 0.0 0.0 0.0<br />
PAGE 143
2001 FOREST REVENUE REVIEW<br />
Logg<strong>in</strong>g area Exports from Estimated<br />
O<strong>the</strong>r levies <strong>in</strong> K per cubic metre<br />
Jul ’96 - Nov ‘97 landowners premium<br />
<strong>in</strong> K per cubic metre<br />
Km FOB at current prices<br />
Landowners Prov Govt PNGFA<br />
TP-2-12a 21 14.0 0.0 0.0 0.0<br />
TP-2-14 2 n.c. 0.0 0.0 0.0<br />
TP-2-15 13 3.0 1.0 1.0 0.0<br />
TP-2-16 0 13.0 1.5 1.0 0.0<br />
TP-3-27 7 10.0 2.0 0.0 0.0<br />
TP-3-28 1 19.5 0.0 0.0 0.0<br />
TP-3-29 2 12.0 2.0 1.0 0.0<br />
TP-3-35 4 7.0 1.0 1.0 0.0<br />
TP-4-3 16 10.0 0.0 0.0 0.5<br />
TP-4-6 2 11.0 2.5 1.0 0.0<br />
Weighted average/total 605 12.0 1.2 0.7 0.6<br />
na not available<br />
nc not calculated<br />
Source: Review Team estimates based on Groome and Poyry (1998)<br />
PAGE 144
2001 FOREST REVENUE REVIEW<br />
ANNEX B THE PERFORMANCE OF ALTERNATIVE LOG EXPORT<br />
REVENUE SYSTEMS<br />
TABLE B.1 ASSUMED PARAMETERS OF THE CURRENT REVENUE SYSTEM<br />
Export duty schedule - actual<br />
Threshold Base duty Marg<strong>in</strong>al duty rate<br />
90 0 15<br />
110 13.5 30<br />
130 19.5 50<br />
150 29.5 55<br />
200 40.5 60<br />
70.5 70<br />
Logg<strong>in</strong>g cost US$ per cubic metre 53<br />
Landowners royalty k<strong>in</strong>a per cubic metre 10<br />
Share <strong>of</strong> landowners premium specified on<br />
- per cubic metre basis per cent 57<br />
- share <strong>of</strong> FOB value per cent 43<br />
Landowners premium<br />
- per cubic metre basis k<strong>in</strong>a per cubic metre 6<br />
- share <strong>of</strong> FOB value per cent 8<br />
Share <strong>of</strong> misc government levies specified on<br />
- per cubic metre basis per cent 100<br />
- share <strong>of</strong> FOB value per cent 0<br />
Misc government levies<br />
- per cubic metre basis k<strong>in</strong>a per cubic metre 2<br />
- share <strong>of</strong> FOB value per cent 0<br />
PAGE 145
TABLE B.2 ASSUMED PARAMETERS OF A US$ BASED REVENUE SYSTEM<br />
Export duty schedule<br />
Threshold Base duty Marg<strong>in</strong>al duty rate<br />
68 0 15<br />
83 10 30<br />
98 15 50<br />
113 22 55<br />
150 30 60<br />
53 70<br />
Logg<strong>in</strong>g cost US$ per cubic metre 53<br />
Landowners royalty k<strong>in</strong>a per cubic metre 10<br />
Share <strong>of</strong> landowners premium specified on<br />
- per cubic metre basis per cent 57<br />
- share <strong>of</strong> FOB value per cent 43<br />
Landowners premium<br />
- per cubic metre basis k<strong>in</strong>a per cubic metre 6<br />
- share <strong>of</strong> FOB value per cent 8<br />
Share <strong>of</strong> misc government levies specified on<br />
- per cubic metre basis per cent 100<br />
- share <strong>of</strong> FOB value per cent 0<br />
Misc government levies<br />
- per cubic metre basis k<strong>in</strong>a per cubic metre 2<br />
- share <strong>of</strong> FOB value per cent 0<br />
2001 FOREST REVENUE REVIEW<br />
PAGE 146
2001 FOREST REVENUE REVIEW<br />
TABLE B.3 ASSUMED PARAMETERS OF AN EFFICIENT AND EQUITABLE REVENUE SYSTEM<br />
Marg<strong>in</strong>al export duty rate per cent 45<br />
Logg<strong>in</strong>g cost US$ per cubic metre 53<br />
Landowners royalty US$ per cubic metre 10<br />
Share <strong>of</strong> landowners premium specified on<br />
- per cubic metre basis per cent 57<br />
- share <strong>of</strong> FOB value per cent 43<br />
Landowners premium<br />
- per cubic metre basis k<strong>in</strong>a per cubic metre 6<br />
- share <strong>of</strong> FOB value per cent 8<br />
Share <strong>of</strong> misc government levies specified on<br />
- per cubic metre basis per cent 100<br />
- share <strong>of</strong> FOB value per cent 0<br />
Misc government levies<br />
- per cubic metre basis k<strong>in</strong>a per cubic metre 2<br />
- share <strong>of</strong> FOB value per cent 0<br />
PAGE 147
2001 FOREST REVENUE REVIEW<br />
FIGURE B.1 RESOURCE RENT UNDER THE CURRENT REVENUE SYSTEM AND VARIABLE US$ PRICES<br />
US$ per m 3<br />
US$ per m 3<br />
K<strong>in</strong>a per m 3<br />
K<strong>in</strong>a per m 3<br />
Per cent<br />
200<br />
150<br />
100<br />
50<br />
0<br />
Resource rent<br />
30<br />
-50<br />
80 130 180 230<br />
Log price (US$ per m 3 )<br />
200<br />
150<br />
100<br />
50<br />
0<br />
Landowner payment<br />
30 80 130 180 230<br />
Log price (US$ per m 3 )<br />
800<br />
600<br />
400<br />
200<br />
0<br />
Resource rent<br />
30<br />
-200<br />
80 130 180 230<br />
Log price (US$ per m 3 )<br />
800<br />
600<br />
400<br />
200<br />
300<br />
200<br />
100<br />
0<br />
0<br />
Landowner payment<br />
30 80 130 180 230<br />
Log price (US$ per m 3 )<br />
Government<br />
30 80 130 180 230<br />
Log price (US$ per m 3 )<br />
Source: Review Team estimates<br />
Per cent<br />
300<br />
200<br />
100<br />
0<br />
US$s terms<br />
K<strong>in</strong>a terms<br />
Share <strong>of</strong> rent<br />
US$ per m 3<br />
US$ per m 3<br />
K<strong>in</strong>a per m 3<br />
K<strong>in</strong>a per m 3<br />
Landowners<br />
200<br />
150<br />
100<br />
50<br />
0<br />
200<br />
150<br />
100<br />
50<br />
Export duty<br />
30 80 130 180 230<br />
Log price (US$ per m 3 )<br />
Operator's excess pr<strong>of</strong>it<br />
0<br />
30<br />
-50<br />
80 130 180 230<br />
Log price (US$ per m 3 )<br />
800<br />
600<br />
400<br />
200<br />
0<br />
800<br />
600<br />
400<br />
200<br />
30 80 130 180 230<br />
Log price (US$ per m 3 )<br />
Export duty<br />
30 80 130 180 230<br />
Log price (US$ per m 3 )<br />
Operator's excess pr<strong>of</strong>it<br />
0<br />
30<br />
-200<br />
80 130 180 230<br />
Log price (US$ per m 3 )<br />
Per cent<br />
300<br />
150<br />
0<br />
-300<br />
Operator<br />
30 80 130 180 230<br />
-150<br />
Log price (US$ per m 3 )<br />
PAGE 148
2001 FOREST REVENUE REVIEW<br />
FIGURE B.2 RESOURCE RENT UNDER THE CURRENT REVENUE SYSTEM AND A VARIABLE KINA<br />
US$ per m 3<br />
US$ per m 3<br />
K<strong>in</strong>a per m 3<br />
K<strong>in</strong>a per m 3<br />
Per cent<br />
50<br />
40<br />
30<br />
20<br />
10<br />
0<br />
50<br />
40<br />
30<br />
20<br />
10<br />
0<br />
Resource rent<br />
0.80 0.65 0.50<br />
K<strong>in</strong>a/US$<br />
0.35 0.20<br />
Landowner payment<br />
0.80 0.65 0.50<br />
K<strong>in</strong>a/US$<br />
0.35 0.20<br />
300<br />
200<br />
100<br />
0<br />
300<br />
200<br />
100<br />
150<br />
100<br />
50<br />
0<br />
Resource rent<br />
0.80 0.65 0.50<br />
K<strong>in</strong>a/US$<br />
0.35 0.20<br />
0<br />
Landowner payment<br />
0.80 0.65 0.50<br />
K<strong>in</strong>a/US$<br />
0.35 0.20<br />
Government<br />
0.80 0.65 0.50 0.35 0.20<br />
K<strong>in</strong>a/US$<br />
Per cent<br />
150<br />
100<br />
50<br />
0<br />
US$s terms<br />
K<strong>in</strong>a terms<br />
Share <strong>of</strong> rent<br />
US$ per m 3<br />
US$ per m 3<br />
K<strong>in</strong>a per m 3<br />
K<strong>in</strong>a per m 3<br />
Landowners<br />
50<br />
40<br />
30<br />
20<br />
10<br />
0<br />
Export duty<br />
0.80 0.65 0.50<br />
K<strong>in</strong>a/US$<br />
0.35 0.20<br />
50<br />
40<br />
30<br />
20<br />
10<br />
0<br />
Operator's excess pr<strong>of</strong>it<br />
-100.80<br />
-20<br />
-30<br />
0.65 0.50<br />
K<strong>in</strong>a/US$<br />
0.35 0.20<br />
300<br />
200<br />
100<br />
0<br />
300<br />
200<br />
100<br />
0.80 0.65 0.50 0.35 0.20<br />
K<strong>in</strong>a/US$<br />
Export duty<br />
0.80 0.65 0.50<br />
K<strong>in</strong>a/US$<br />
0.35 0.20<br />
Operator's excess pr<strong>of</strong>it<br />
0<br />
0.80<br />
-100<br />
0.65 0.50<br />
K<strong>in</strong>a/US$<br />
0.35 0.20<br />
Per cent<br />
100<br />
0<br />
-100<br />
Operator<br />
0.80 0.65 0.50 0.35 0.20<br />
K<strong>in</strong>a/US$<br />
PAGE 149
Source: Review Team estimates<br />
2001 FOREST REVENUE REVIEW<br />
FIGURE B.3 RESOURCE RENT UNDER THE CURRENT REVENUE SYSTEM AND VARIABLE LOGGING<br />
COSTS<br />
US$ per m 3<br />
US$ per m 3<br />
K<strong>in</strong>a per m 3<br />
K<strong>in</strong>a per m 3<br />
Per cent<br />
60<br />
40<br />
20<br />
0<br />
60<br />
40<br />
20<br />
0<br />
Resource rent<br />
30 35 40 45 50<br />
Logg<strong>in</strong>g cost (US$ per m 3 )<br />
Landowner payment<br />
30 35 40 45 50<br />
Logg<strong>in</strong>g cost (US$ per m 3 )<br />
200<br />
150<br />
100<br />
50<br />
0<br />
200<br />
150<br />
100<br />
150<br />
100<br />
50<br />
50<br />
0<br />
0<br />
Resource rent<br />
30 35 40 45 50<br />
Logg<strong>in</strong>g cost (US$ per m 3 )<br />
Landowner payment<br />
30 35 40 45 50<br />
Logg<strong>in</strong>g cost (US$ per m 3 )<br />
Government<br />
30 35 40 45 50<br />
Logg<strong>in</strong>g cost (US$ per m 3 )<br />
Per cent<br />
150<br />
100<br />
50<br />
0<br />
US$s terms<br />
K<strong>in</strong>a terms<br />
Share <strong>of</strong> rent<br />
US$ per m 3<br />
US$ per m 3<br />
K<strong>in</strong>a per m 3<br />
K<strong>in</strong>a per m 3<br />
Landowners<br />
60<br />
40<br />
20<br />
0<br />
60<br />
40<br />
20<br />
Export duty<br />
30 35 40 45 50<br />
Logg<strong>in</strong>g cost (US$ per m 3 )<br />
Operator's excess pr<strong>of</strong>it<br />
0<br />
30 35 40 45 50<br />
-20<br />
Logg<strong>in</strong>g cost (US$ per m 3 )<br />
200<br />
150<br />
100<br />
50<br />
30 35 40 45 50<br />
Logg<strong>in</strong>g cost (US$ per m 3 )<br />
0<br />
Export duty<br />
30 35 40 45 50<br />
Logg<strong>in</strong>g cost (US$ per m 3 )<br />
200<br />
150<br />
100<br />
50<br />
0<br />
Operator's excess pr<strong>of</strong>it<br />
-50 30<br />
-100<br />
35 40 45 50<br />
Logg<strong>in</strong>g cost (US$ per m 3 )<br />
Per cent<br />
150<br />
100<br />
50<br />
0<br />
Operator<br />
30 35 40 45 50<br />
-50<br />
Logg<strong>in</strong>g cost (US$ per m 3 )<br />
PAGE 150
Source: Review Team estimates<br />
2001 FOREST REVENUE REVIEW<br />
PAGE 151
2001 FOREST REVENUE REVIEW<br />
FIGURE B.4 RESOURCE RENT UNDER A US$-BASED REVENUE SYSTEM AND VARIABLE US$ PRICES<br />
US$ per m 3<br />
US$ per m 3<br />
K<strong>in</strong>a per m 3<br />
K<strong>in</strong>a per m 3<br />
Per cent<br />
200<br />
150<br />
100<br />
50<br />
0<br />
Resource rent<br />
30<br />
-50<br />
80 130 180 230<br />
Log price (US$ per m 3 )<br />
200<br />
150<br />
100<br />
50<br />
0<br />
800<br />
600<br />
400<br />
200<br />
Landowner payment<br />
30 80 130 180 230<br />
Log price (US$ per m 3 )<br />
Resource rent<br />
0<br />
30<br />
-200<br />
80 130 180 230<br />
Log price (US$ per m 3 )<br />
800<br />
600<br />
400<br />
200<br />
300<br />
200<br />
100<br />
0<br />
0<br />
Landowner payment<br />
30 80 130 180 230<br />
Log price (US$ per m 3 )<br />
Government<br />
30 80 130 180 230<br />
Log price (US$ per m 3 )<br />
Per cent<br />
300<br />
200<br />
100<br />
0<br />
US$s terms<br />
K<strong>in</strong>a terms<br />
Share <strong>of</strong> rent<br />
US$ per m 3<br />
US$ per m 3<br />
K<strong>in</strong>a per m 3<br />
K<strong>in</strong>a per m 3<br />
Landowners<br />
200<br />
150<br />
100<br />
50<br />
0<br />
200<br />
150<br />
100<br />
50<br />
Export duty<br />
30 80 130 180 230<br />
Log price (US$ per m 3 )<br />
Operator's excess pr<strong>of</strong>it<br />
0<br />
30<br />
-50<br />
80 130 180 230<br />
Log price (US$ per m 3 )<br />
800<br />
600<br />
400<br />
200<br />
0<br />
800<br />
600<br />
400<br />
200<br />
30 80 130 180 230<br />
Log price (US$ per m 3 )<br />
Export duty<br />
30 80 130 180 230<br />
Log price (US$ per m 3 )<br />
Operator's excess pr<strong>of</strong>it<br />
0<br />
30<br />
-200<br />
80 130 180 230<br />
Log price (US$ per m 3 )<br />
Per cent<br />
300<br />
150<br />
0<br />
-150<br />
Operator<br />
30 80 130 180 230<br />
Log price (US$ per m 3 )<br />
PAGE 152
Source: Review Team estimates<br />
2001 FOREST REVENUE REVIEW<br />
PAGE 153
2001 FOREST REVENUE REVIEW<br />
FIGURE B.5 RESOURCE RENT UNDER A US$-BASED REVENUE SYSTEM AND A VARIABLE KINA<br />
US$ per m 3<br />
US$ per m 3<br />
K<strong>in</strong>a per m 3<br />
K<strong>in</strong>a per m 3<br />
Per cent<br />
50<br />
40<br />
30<br />
20<br />
10<br />
0<br />
50<br />
40<br />
30<br />
20<br />
10<br />
0<br />
Resource rent<br />
0.80 0.65 0.50<br />
K<strong>in</strong>a/US$<br />
0.35 0.20<br />
Landowner payment<br />
0.80 0.65 0.50<br />
K<strong>in</strong>a/US$<br />
0.35 0.20<br />
300<br />
200<br />
100<br />
0<br />
300<br />
200<br />
100<br />
150<br />
100<br />
50<br />
0<br />
Resource rent<br />
0.80 0.65 0.50<br />
K<strong>in</strong>a/US$<br />
0.35 0.20<br />
0<br />
Landowner payment<br />
0.80 0.65 0.50<br />
K<strong>in</strong>a/US$<br />
0.35 0.20<br />
Government<br />
0.80 0.65 0.50 0.35 0.20<br />
K<strong>in</strong>a/US$<br />
Per cent<br />
150<br />
100<br />
50<br />
0<br />
US$s terms<br />
K<strong>in</strong>a terms<br />
Share <strong>of</strong> rent<br />
US$ per m 3<br />
US$ per m 3<br />
K<strong>in</strong>a per m 3<br />
K<strong>in</strong>a per m 3<br />
Landowners<br />
50<br />
40<br />
30<br />
20<br />
10<br />
0<br />
Export duty<br />
0.80 0.65 0.50<br />
K<strong>in</strong>a/US$<br />
0.35 0.20<br />
50<br />
40<br />
30<br />
20<br />
10<br />
0<br />
Operator's excess pr<strong>of</strong>it<br />
-100.80<br />
0.65 0.50<br />
K<strong>in</strong>a/US$<br />
0.35 0.20<br />
300<br />
200<br />
100<br />
0<br />
300<br />
200<br />
100<br />
0.80 0.65 0.50 0.35 0.20<br />
K<strong>in</strong>a/US$<br />
Export duty<br />
0.80 0.65 0.50<br />
K<strong>in</strong>a/US$<br />
0.35 0.20<br />
Operator's excess pr<strong>of</strong>it<br />
0<br />
0.80<br />
-100<br />
0.65 0.50<br />
K<strong>in</strong>a/US$<br />
0.35 0.20<br />
Per cent<br />
100<br />
0<br />
-100<br />
Operator<br />
0.80 0.65 0.50 0.35 0.20<br />
K<strong>in</strong>a/US$<br />
PAGE 154
Source: Review Team estimates<br />
2001 FOREST REVENUE REVIEW<br />
PAGE 155
2001 FOREST REVENUE REVIEW<br />
FIGURE B.6 RESOURCE RENT UNDER A US$-BASED REVENUE SYSTEM AND VARIABLE LOGGING<br />
COSTS<br />
US$ per m 3<br />
US$ per m 3<br />
K<strong>in</strong>a per m 3<br />
K<strong>in</strong>a per m 3<br />
Per cent<br />
60<br />
40<br />
20<br />
0<br />
60<br />
40<br />
20<br />
0<br />
200<br />
150<br />
100<br />
Resource rent<br />
30 35 40 45 50<br />
Logg<strong>in</strong>g cost (US$ per m 3 )<br />
Landowner payment<br />
30 35 40 45 50<br />
Logg<strong>in</strong>g cost (US$ per m 3 )<br />
50<br />
0<br />
200<br />
150<br />
100<br />
100<br />
75<br />
50<br />
25<br />
50<br />
0<br />
0<br />
Resource rent<br />
30 35 40 45 50<br />
Logg<strong>in</strong>g cost (US$ per m 3 )<br />
Landowner payment<br />
30 35 40 45 50<br />
Logg<strong>in</strong>g cost (US$ per m 3 )<br />
Government<br />
30 35 40 45 50<br />
Logg<strong>in</strong>g cost (US$ per m 3 )<br />
Per cent<br />
100<br />
75<br />
50<br />
25<br />
0<br />
US$s terms<br />
K<strong>in</strong>a terms<br />
Share <strong>of</strong> rent<br />
US$ per m 3<br />
US$ per m 3<br />
K<strong>in</strong>a per m 3<br />
K<strong>in</strong>a per m 3<br />
Landowners<br />
60<br />
40<br />
20<br />
0<br />
60<br />
40<br />
20<br />
0<br />
200<br />
150<br />
100<br />
Export duty<br />
30 35 40 45 50<br />
Logg<strong>in</strong>g cost (US$ per m 3 )<br />
50<br />
Operator's excess pr<strong>of</strong>it<br />
30 35 40 45 50<br />
Logg<strong>in</strong>g cost (US$ per m 3 )<br />
0<br />
200<br />
150<br />
100<br />
50<br />
30 35 40 45 50<br />
Logg<strong>in</strong>g cost (US$ per m 3 )<br />
0<br />
Export duty<br />
30 35 40 45 50<br />
Logg<strong>in</strong>g cost (US$ per m 3 )<br />
Operator's excess pr<strong>of</strong>it<br />
30 35 40 45 50<br />
Logg<strong>in</strong>g cost (US$ per m 3 )<br />
Per cent<br />
100<br />
75<br />
50<br />
25<br />
0<br />
Operator<br />
30 35 40 45 50<br />
Logg<strong>in</strong>g cost (US$ per m 3 )<br />
PAGE 156
Source: Review Team estimates<br />
2001 FOREST REVENUE REVIEW<br />
PAGE 157
2001 FOREST REVENUE REVIEW<br />
FIGURE B.7 RESOURCE RENT UNDER A MORE EFFICIENT AND EQUITABLE REVENUE SYSTEM AND<br />
VARIABLE US$ PRICES<br />
US$ per m 3<br />
US$ per m 3<br />
K<strong>in</strong>a per m 3<br />
K<strong>in</strong>a per m 3<br />
Per cent<br />
200<br />
150<br />
100<br />
50<br />
0<br />
Resource rent<br />
30<br />
-50<br />
80 130 180 230<br />
Log price (US$ per m 3 )<br />
200<br />
150<br />
100<br />
50<br />
0<br />
Landowner payment<br />
30 80 130 180 230<br />
Log price (US$ per m 3 )<br />
800<br />
600<br />
400<br />
200<br />
0<br />
Resource rent<br />
30<br />
-200<br />
80 130 180 230<br />
Log price (US$ per m 3 )<br />
800<br />
600<br />
400<br />
200<br />
200<br />
150<br />
100<br />
50<br />
0<br />
0<br />
Landowner payment<br />
30 80 130 180 230<br />
Log price (US$ per m 3 )<br />
Government<br />
30 80 130 180 230<br />
Log price (US$ per m 3 )<br />
Source: Review Team estimates<br />
Per cent<br />
200<br />
150<br />
100<br />
50<br />
0<br />
US$s terms<br />
K<strong>in</strong>a terms<br />
Share <strong>of</strong> rent<br />
US$ per m 3<br />
US$ per m 3<br />
K<strong>in</strong>a per m 3<br />
K<strong>in</strong>a per m 3<br />
Landowners<br />
200<br />
150<br />
100<br />
50<br />
0<br />
200<br />
150<br />
100<br />
50<br />
Export duty<br />
30 80 130 180 230<br />
Log price (US$ per m 3 )<br />
Operator's excess pr<strong>of</strong>it<br />
0<br />
30<br />
-50<br />
80 130 180 230<br />
Log price (US$ per m 3 )<br />
800<br />
600<br />
400<br />
200<br />
0<br />
800<br />
600<br />
400<br />
200<br />
30 80 130 180 230<br />
Log price (US$ per m 3 )<br />
Export duty<br />
30 80 130 180 230<br />
Log price (US$ per m 3 )<br />
Operator's excess pr<strong>of</strong>it<br />
0<br />
30<br />
-200<br />
80 130 180 230<br />
Log price (US$ per m 3 )<br />
Per cent<br />
200<br />
100<br />
0<br />
-200<br />
Operator<br />
30 80 130 180 230<br />
-100<br />
Log price (US$ per m 3 )<br />
PAGE 158
2001 FOREST REVENUE REVIEW<br />
PAGE 159
2001 FOREST REVENUE REVIEW<br />
FIGURE B.8 RESOURCE RENT UNDER A MORE EFFICIENT AND EQUITABLE REVENUE SYSTEM AND A<br />
VARIABLE KINA<br />
US$ per m 3<br />
US$ per m 3<br />
K<strong>in</strong>a per m 3<br />
K<strong>in</strong>a per m 3<br />
Per cent<br />
50<br />
40<br />
30<br />
20<br />
10<br />
0<br />
50<br />
40<br />
30<br />
20<br />
10<br />
0<br />
Resource rent<br />
0.80 0.65 0.50<br />
K<strong>in</strong>a/US$<br />
0.35 0.20<br />
Landowner payment<br />
0.80 0.65 0.50<br />
K<strong>in</strong>a/US$<br />
0.35 0.20<br />
300<br />
200<br />
100<br />
0<br />
300<br />
200<br />
100<br />
150<br />
100<br />
50<br />
0<br />
Resource rent<br />
0.80 0.65 0.50<br />
K<strong>in</strong>a/US$<br />
0.35 0.20<br />
0<br />
Landowner payment<br />
0.80 0.65 0.50<br />
K<strong>in</strong>a/US$<br />
0.35 0.20<br />
Government<br />
0.80 0.65 0.50 0.35 0.20<br />
K<strong>in</strong>a/US$<br />
Per cent<br />
150<br />
100<br />
50<br />
0<br />
US$s terms<br />
K<strong>in</strong>a terms<br />
Share <strong>of</strong> rent<br />
US$ per m 3<br />
US$ per m 3<br />
K<strong>in</strong>a per m 3<br />
K<strong>in</strong>a per m 3<br />
Landowners<br />
50<br />
40<br />
30<br />
20<br />
10<br />
0<br />
Export duty<br />
0.80 0.65 0.50<br />
K<strong>in</strong>a/US$<br />
0.35 0.20<br />
50<br />
40<br />
30<br />
20<br />
10<br />
0<br />
Operator's excess pr<strong>of</strong>it<br />
-100.80<br />
0.65 0.50<br />
K<strong>in</strong>a/US$<br />
0.35 0.20<br />
300<br />
200<br />
100<br />
0<br />
300<br />
200<br />
100<br />
0.80 0.65 0.50 0.35 0.20<br />
K<strong>in</strong>a/US$<br />
Export duty<br />
0.80 0.65 0.50<br />
K<strong>in</strong>a/US$<br />
0.35 0.20<br />
Operator's excess pr<strong>of</strong>it<br />
0<br />
0.80<br />
-100<br />
0.65 0.50<br />
K<strong>in</strong>a/US$<br />
0.35 0.20<br />
Per cent<br />
100<br />
0<br />
-100<br />
Operator<br />
0.80 0.65 0.50 0.35 0.20<br />
K<strong>in</strong>a/US$<br />
PAGE 160
Source: Review Team estimates<br />
2001 FOREST REVENUE REVIEW<br />
PAGE 161
2001 FOREST REVENUE REVIEW<br />
FIGURE B.9 RESOURCE RENT UNDER A MORE EFFICIENT AND EQUITABLE REVENUE SYSTEM AND<br />
VARIABLE LOGGING COSTS<br />
US$ per m 3<br />
US$ per m 3<br />
K<strong>in</strong>a per m 3<br />
K<strong>in</strong>a per m 3<br />
Per cent<br />
60<br />
40<br />
20<br />
0<br />
60<br />
40<br />
20<br />
0<br />
200<br />
150<br />
100<br />
Resource rent<br />
30 35 40 45 50<br />
Logg<strong>in</strong>g cost (US$ per m 3 )<br />
Landowner payment<br />
30 35 40 45 50<br />
Logg<strong>in</strong>g cost (US$ per m 3 )<br />
50<br />
0<br />
200<br />
150<br />
100<br />
100<br />
75<br />
50<br />
25<br />
50<br />
0<br />
0<br />
Resource rent<br />
30 35 40 45 50<br />
Logg<strong>in</strong>g cost (US$ per m 3 )<br />
Landowner payment<br />
30 35 40 45 50<br />
Logg<strong>in</strong>g cost (US$ per m 3 )<br />
Government<br />
30 35 40 45 50<br />
Logg<strong>in</strong>g cost (US$ per m 3 )<br />
Per cent<br />
100<br />
75<br />
50<br />
25<br />
0<br />
US$s terms<br />
K<strong>in</strong>a terms<br />
Share <strong>of</strong> rent<br />
US$ per m 3<br />
US$ per m 3<br />
K<strong>in</strong>a per m 3<br />
K<strong>in</strong>a per m 3<br />
Landowners<br />
60<br />
40<br />
20<br />
0<br />
60<br />
40<br />
20<br />
0<br />
200<br />
150<br />
100<br />
Export duty<br />
30 35 40 45 50<br />
Logg<strong>in</strong>g cost (US$ per m 3 )<br />
50<br />
Operator's excess pr<strong>of</strong>it<br />
30 35 40 45 50<br />
Logg<strong>in</strong>g cost (US$ per m 3 )<br />
0<br />
200<br />
150<br />
100<br />
50<br />
30 35 40 45 50<br />
Logg<strong>in</strong>g cost (US$ per m 3 )<br />
0<br />
Export duty<br />
30 35 40 45 50<br />
Logg<strong>in</strong>g cost (US$ per m 3 )<br />
Operator's excess pr<strong>of</strong>it<br />
30 35 40 45 50<br />
Logg<strong>in</strong>g cost (US$ per m 3 )<br />
Per cent<br />
100<br />
75<br />
50<br />
25<br />
0<br />
Operator<br />
30 35 40 45 50<br />
Logg<strong>in</strong>g cost (US$ per m 3 )<br />
PAGE 162
ANNEX C COST BENEFIT METHODOLOGY<br />
C.1 OVERVIEW OF THE METHODOLOGY<br />
2001 FOREST REVENUE REVIEW<br />
The Review Team’s cost-benefit analysis <strong>of</strong> timber process<strong>in</strong>g focuses on <strong>the</strong> impact <strong>of</strong><br />
process<strong>in</strong>g on <strong>the</strong> level <strong>of</strong> consumption by Papua New Gu<strong>in</strong>eans. The test rule applied is as<br />
follows - if higher consumption levels are possible because <strong>of</strong> <strong>the</strong> timber process<strong>in</strong>g operation,<br />
Papua New Gu<strong>in</strong>ea is better <strong>of</strong>f and timber process<strong>in</strong>g passes <strong>the</strong> cost-benefit assessment. If<br />
<strong>in</strong>stead <strong>the</strong> costs are so high such that <strong>the</strong> process<strong>in</strong>g operation actually reduces potential<br />
consumption levels, Papua New Gu<strong>in</strong>ea is <strong>in</strong>terpreted as worse <strong>of</strong>f and timber process<strong>in</strong>g fails <strong>the</strong><br />
cost-benefit assessment.<br />
Timber process<strong>in</strong>g has both direct and <strong>in</strong>direct effects on <strong>the</strong> consumption levels <strong>of</strong> Papua New<br />
Gu<strong>in</strong>eas. There are both direct and <strong>in</strong>direct benefits, and direct and <strong>in</strong>direct costs.<br />
The direct benefits are relatively straightforward to quantify. They arise as national workers earn<br />
salaries and wages and as landowners are paid royalty. It is assumed that all this <strong>in</strong>come and<br />
royalty payments are spent such that <strong>the</strong> direct effect on consumption equals <strong>the</strong> level <strong>of</strong> <strong>the</strong><br />
payment. 33<br />
Indirect benefits are harder to quantify. Ideally a representative survey would be conducted <strong>of</strong> <strong>the</strong><br />
timber process<strong>in</strong>g <strong>in</strong>dustry and associated activities and such that typical <strong>in</strong>direct effects could be<br />
calculated. However this is impractical (as is usually <strong>the</strong> case <strong>in</strong> economic impact analysis).<br />
Some simplify<strong>in</strong>g assumptions are <strong>in</strong>stead made <strong>in</strong> order to quantify <strong>the</strong> <strong>in</strong>direct effects.<br />
Some <strong>in</strong>direct benefits arise as <strong>the</strong> expenditure from process<strong>in</strong>g operations on <strong>the</strong> <strong>in</strong>puts to<br />
production feed through <strong>the</strong> economy. For example, as <strong>the</strong> demand for local <strong>in</strong>puts creates<br />
opportunities for <strong>in</strong>come to be earned <strong>in</strong> support<strong>in</strong>g <strong>in</strong>dustries. This extra <strong>in</strong>come boosts<br />
consumption (on <strong>the</strong> assumption that all <strong>in</strong>come is consumed) and this is a benefit <strong>of</strong>fered by <strong>the</strong><br />
process<strong>in</strong>g operation. The total effect <strong>of</strong> <strong>the</strong>se purchases <strong>of</strong> production <strong>in</strong>puts on economy-wide<br />
<strong>in</strong>come can be estimated us<strong>in</strong>g what are termed value-added, <strong>in</strong>put-output multipliers (valueadded<br />
is <strong>the</strong> addition <strong>of</strong> wages and salaries, pr<strong>of</strong>its and rents and equals <strong>in</strong>come). These<br />
multipliers capture <strong>the</strong> total effect on value-added (ie on <strong>in</strong>come) aris<strong>in</strong>g from <strong>the</strong> extra<br />
production from an <strong>in</strong>dustry as demand for its output <strong>in</strong>creases (ie <strong>in</strong> effect <strong>the</strong> multiplier adds up<br />
<strong>the</strong> value-added created <strong>in</strong> <strong>the</strong> supply<strong>in</strong>g <strong>in</strong>dustry, <strong>the</strong> value-added created <strong>in</strong> its supply<strong>in</strong>g<br />
<strong>in</strong>dustries etc and <strong>the</strong> extra value-added subsequently created as <strong>the</strong> <strong>in</strong>itial <strong>in</strong>crease <strong>in</strong> valueadded<br />
is used to fund household consumption etc, where <strong>the</strong> leakage from <strong>the</strong> economy via<br />
imports is taken <strong>in</strong>to account at each stage).<br />
The extra consumption flow<strong>in</strong>g directly from payments <strong>of</strong> wages and salaries to national<br />
employees and <strong>of</strong> royalty to landowners also create <strong>in</strong>direct benefits as it flows through <strong>the</strong><br />
economy. These arise as suppliers <strong>of</strong> consumption goods and services employ labour, demand<br />
<strong>in</strong>puts to production etc. These <strong>in</strong>direct benefits flow<strong>in</strong>g from consumption can also be estimated<br />
33 It would be possible to assume that some <strong>of</strong> <strong>the</strong>se payments are saved. If <strong>the</strong> sav<strong>in</strong>gs are <strong>in</strong>vested efficiently (and<br />
<strong>the</strong> rate <strong>of</strong> return on <strong>in</strong>vestment equals <strong>the</strong> social opportunity cost), <strong>the</strong> net present value <strong>of</strong> <strong>the</strong> consumption<br />
ultimately funded by <strong>the</strong>se sav<strong>in</strong>gs equals <strong>the</strong> <strong>in</strong>itial level <strong>of</strong> sav<strong>in</strong>gs. In which case <strong>the</strong> <strong>in</strong>itial level <strong>of</strong> sav<strong>in</strong>gs can<br />
be <strong>in</strong>terpreted as equal to <strong>the</strong> level <strong>of</strong> consumption and <strong>the</strong> assumption that some payments are saved would not<br />
affect <strong>the</strong> estimates <strong>of</strong> <strong>the</strong> impact on consumption.<br />
PAGE 163
2001 FOREST REVENUE REVIEW<br />
us<strong>in</strong>g value-added, <strong>in</strong>put-output multipliers to show <strong>the</strong> total effect on value-added (ie <strong>in</strong>come)<br />
made possible by <strong>the</strong> direct boost to sales <strong>of</strong> those <strong>in</strong>dustries supply<strong>in</strong>g consumption goods and<br />
services (aga<strong>in</strong> assum<strong>in</strong>g that all <strong>in</strong>come is consumed). Indirect benefits also arise from <strong>the</strong> extra<br />
demand generated by <strong>the</strong> consumption <strong>of</strong> foreign workers, and <strong>the</strong>se benefits can be estimated <strong>in</strong><br />
a similar fashion.<br />
Taxes collected from <strong>the</strong> timber process<strong>in</strong>g operation and its workers fund government<br />
expenditure and this also generates value-added as it feeds through <strong>the</strong> economy. Aga<strong>in</strong> valueadded,<br />
<strong>in</strong>put-output multipliers can be used to calculate <strong>the</strong> total effect on value-added <strong>of</strong> this<br />
<strong>in</strong>crease <strong>in</strong> expenditure (where <strong>the</strong> additional value-added is assumed to be fully consumed for<br />
<strong>the</strong> purposes <strong>of</strong> <strong>the</strong> cost-benefit test).<br />
As expla<strong>in</strong>ed <strong>in</strong> <strong>the</strong> body <strong>of</strong> <strong>the</strong> report, government expenditure and <strong>in</strong>frastructure funded by <strong>the</strong><br />
timber processors are assumed to have important, additional flow-on effects because <strong>the</strong>y help<br />
develop <strong>the</strong> economy. The method for quantify<strong>in</strong>g <strong>the</strong>se so-called productivity effects and <strong>the</strong>ir<br />
effect on consumption is discussed <strong>in</strong> <strong>the</strong> body <strong>of</strong> <strong>the</strong> report. Data on <strong>the</strong> value <strong>of</strong> <strong>in</strong>frastructure<br />
benefits paid by processors are unavailable, and are assumed to equal <strong>the</strong> estimate by Groome<br />
Poyry (1998) <strong>of</strong> <strong>the</strong> average value <strong>of</strong> <strong>the</strong> <strong>in</strong>frastructure levy paid by logg<strong>in</strong>g companies to<br />
Prov<strong>in</strong>cial Governments.<br />
The direct costs <strong>of</strong> <strong>the</strong> timber process<strong>in</strong>g operation are, like <strong>the</strong> direct benefits, relatively easy to<br />
quantify. It is assumed that consumption is forgone equal to <strong>the</strong> level <strong>of</strong> landowner premiums<br />
forgone.<br />
The cost <strong>of</strong> timber process<strong>in</strong>g arises from <strong>the</strong> export duty forgone. This means government<br />
expenditure is forgone. This would have generated value-added <strong>in</strong> <strong>the</strong> economy had it been<br />
spent, and <strong>of</strong>fered productivity benefits. The method for quantify<strong>in</strong>g <strong>the</strong> direct and <strong>in</strong>direct<br />
effects is as employed to estimate <strong>the</strong> benefits flow<strong>in</strong>g from government expenditure (except <strong>the</strong><br />
estimated flows are <strong>in</strong>terpreted as costs because <strong>the</strong>y are forgone under timber process<strong>in</strong>g).<br />
C.2 INPUT-OUTPUT MULTIPLIERS<br />
This section expla<strong>in</strong>s <strong>the</strong> basis <strong>of</strong> <strong>the</strong> <strong>in</strong>put-output multipliers used <strong>in</strong> <strong>the</strong> cost-benefit assessment.<br />
Input-output models provide a disaggregated description <strong>of</strong> an economy that identifies <strong>the</strong> <strong>in</strong>terrelationships<br />
between <strong>in</strong>dustries <strong>in</strong> a region. An <strong>in</strong>dustry's <strong>in</strong>puts <strong>in</strong>to production are separated<br />
<strong>in</strong>to <strong>in</strong>termediate materials and services, which are purchased from o<strong>the</strong>r <strong>in</strong>dustries, and <strong>the</strong> factor<br />
<strong>in</strong>puts <strong>of</strong> land, labour and capital. An <strong>in</strong>dustry's output is sold to ei<strong>the</strong>r o<strong>the</strong>r <strong>in</strong>dustries or <strong>the</strong><br />
'f<strong>in</strong>al demand' categories that normally comprise consumption, <strong>in</strong>vestment, government and<br />
exports. An <strong>in</strong>put-output table also shows <strong>the</strong> level <strong>of</strong> imports <strong>in</strong> an economy and <strong>the</strong> level <strong>of</strong><br />
<strong>in</strong>direct commodity taxes paid.<br />
Multipliers can be derived from an <strong>in</strong>put-output model to measure <strong>the</strong> impact <strong>of</strong> a change <strong>in</strong> sales<br />
by an <strong>in</strong>dustry or <strong>the</strong> value added <strong>of</strong> an <strong>in</strong>dustry on key economic aggregates. These aggregates<br />
are typically total sales, value added (i.e. wages, salaries and supplements, gross operat<strong>in</strong>g surplus<br />
and <strong>in</strong>direct taxes paid by <strong>in</strong>dustry), labour <strong>in</strong>come (i.e. wages, salaries and supplements) and <strong>the</strong><br />
number <strong>of</strong> persons employed. For example, an <strong>in</strong>come multiplier for farm<strong>in</strong>g <strong>of</strong> 0.5 would imply<br />
that for every $1 <strong>in</strong>crease <strong>in</strong> farm sales, total <strong>in</strong>come <strong>in</strong> <strong>the</strong> economy would <strong>in</strong>crease by $0.5. The<br />
PAGE 164
2001 FOREST REVENUE REVIEW<br />
multipliers capture both <strong>the</strong> direct effect <strong>of</strong> an <strong>in</strong>dustry's expansion/contraction and <strong>the</strong> flow-on<br />
effect as expenditure changes feed through <strong>the</strong> economy.<br />
Three types <strong>of</strong> multipliers are normally derived, be<strong>in</strong>g ⎯<br />
an <strong>in</strong>itial multiplier. This looks at <strong>the</strong> direct effect <strong>of</strong> a change <strong>in</strong> <strong>in</strong>dustry output, such as a<br />
change <strong>in</strong> <strong>in</strong>come paid to those work<strong>in</strong>g <strong>in</strong> <strong>the</strong> <strong>in</strong>dustry and <strong>the</strong> number <strong>of</strong> people employed<br />
<strong>in</strong> <strong>the</strong> <strong>in</strong>dustry.<br />
a Type I multiplier. This captures both <strong>the</strong> direct and <strong>in</strong>direct, production-<strong>in</strong>duced effect.<br />
The latter refers to <strong>the</strong> <strong>in</strong>dustry's purchase <strong>of</strong> <strong>in</strong>puts from o<strong>the</strong>r bus<strong>in</strong>esses <strong>in</strong> <strong>the</strong> economy<br />
and <strong>the</strong> fur<strong>the</strong>r purchase <strong>of</strong> <strong>in</strong>puts by those o<strong>the</strong>r bus<strong>in</strong>esses.<br />
a Type II multiplier that also captures an <strong>in</strong>direct consumption effect that flows from <strong>the</strong><br />
spend<strong>in</strong>g <strong>of</strong> household <strong>in</strong>come.<br />
We have used Type II value-added multipliers <strong>in</strong> our analysis. The underly<strong>in</strong>g assumption is that<br />
all value added, <strong>in</strong>clud<strong>in</strong>g pr<strong>of</strong>it, flow<strong>in</strong>g from <strong>the</strong> expenditure triggered by process<strong>in</strong>g flows to<br />
residents and ultimately is spent with<strong>in</strong> Papua New Gu<strong>in</strong>ea (and vice versa for forgone valueadded).<br />
Ideally, <strong>the</strong> <strong>in</strong>put-output multipliers would be drawn from an <strong>in</strong>put-output table for Papua New<br />
Gu<strong>in</strong>ea that separately identified <strong>the</strong> five stylised process<strong>in</strong>g projects we consider. However, no<br />
such table exists (and cannot exist as some <strong>of</strong> <strong>the</strong> projects are hypo<strong>the</strong>tical and do not operate at<br />
present).<br />
An alternative approach to <strong>the</strong> application <strong>of</strong> multipliers is adopted that rests on –<br />
estimat<strong>in</strong>g <strong>the</strong> local <strong>in</strong>puts to <strong>the</strong> production process. Multipliers for <strong>the</strong> relevant <strong>in</strong>dustry (ie<br />
<strong>the</strong> supply<strong>in</strong>g <strong>in</strong>dustry) are applied to <strong>the</strong> estimated levels <strong>of</strong> sales by that <strong>in</strong>dustry to <strong>the</strong><br />
stylised process<strong>in</strong>g operation. So, for example, we estimate that every cubic metre <strong>of</strong> log<br />
<strong>in</strong>put required K5 worth <strong>of</strong> oil and fuel dur<strong>in</strong>g process<strong>in</strong>g. If <strong>the</strong> value-added multiplier for<br />
<strong>the</strong> oil and fuel <strong>in</strong>dustry is 2, we calculate <strong>the</strong> total direct and <strong>in</strong>direct effect <strong>of</strong> <strong>the</strong> purchase<br />
<strong>of</strong> oil and fuel by process<strong>in</strong>g as K10 (i.e. K5 x 2).<br />
estimat<strong>in</strong>g <strong>the</strong> <strong>in</strong>come earned by national labour, <strong>the</strong> payment <strong>of</strong> royalty to landowners and<br />
<strong>the</strong> local consumption <strong>of</strong> foreign works (as K100 per week per employee) and apply<strong>in</strong>g a<br />
weighted average multiplier calculated for consumption <strong>of</strong> goods to <strong>the</strong>se flows.<br />
separately estimat<strong>in</strong>g <strong>the</strong> government expenditure funded by taxes on foreign labour <strong>in</strong>come<br />
or foregone via <strong>the</strong> export duty concessions and apply<strong>in</strong>g an average multiplier calculated<br />
for government expenditure to <strong>the</strong>se flows.<br />
The multipliers used <strong>in</strong> this analysis are drawn from an <strong>in</strong>put-output table prepared for <strong>the</strong> Fiji<br />
Islands for 1997 by <strong>the</strong> Fiji National Statistics Office <strong>of</strong> Fiji Islands (see Table C.1). These<br />
multipliers are consistent with those estimated by <strong>the</strong> Queensland Government Statistician for<br />
native <strong>forest</strong> logg<strong>in</strong>g areas <strong>of</strong> Queensland, giv<strong>in</strong>g some confidence <strong>in</strong> <strong>the</strong>ir reliability (see Table<br />
C.2).<br />
PAGE 165
TABLE C.1 MULTIPLIERS FOR SELECTED INDUSTRIES FOR THE FIJI ISLANDS<br />
Industry Value added multipliers a<br />
Fiji Islands (1997)<br />
Type I Type II<br />
<strong>Forest</strong>ry 0.83 1.15<br />
O<strong>the</strong>r manufacturers 0.60 0.83<br />
Electricity & water 0.87 1.01<br />
Construction 0.68 1.07<br />
Transport 0.64 0.96<br />
Bus<strong>in</strong>ess services 0.76 1.12<br />
O<strong>the</strong>r Priv services 0.79 1.18<br />
Health 0.82 1.27<br />
Education 0.94 1.61<br />
O<strong>the</strong>r gov services 0.92 1.36<br />
‘Consumption basket’ 0.74 1.02<br />
2001 FOREST REVENUE REVIEW<br />
a The Type I multipliers show <strong>the</strong> $ <strong>in</strong>crease <strong>in</strong> regional value-added (ie <strong>the</strong> <strong>in</strong>come generated <strong>in</strong> a<br />
region) for a $1 <strong>in</strong>crease <strong>in</strong> sales tak<strong>in</strong>g <strong>in</strong>to account <strong>the</strong> <strong>in</strong>creased demand for <strong>the</strong> output <strong>of</strong> o<strong>the</strong>r<br />
<strong>in</strong>dustries only. The Type II multipliers also factor <strong>in</strong> <strong>the</strong> $ <strong>in</strong>crease <strong>in</strong> regional value-added<br />
result<strong>in</strong>g from <strong>the</strong> expansion <strong>in</strong> o<strong>the</strong>r <strong>in</strong>dustries as household expenditure <strong>in</strong>creases<br />
Source: Consultants estimates based on <strong>the</strong> <strong>in</strong>put-output tables for <strong>the</strong> Fiji Islands for 1997 as prepared<br />
by <strong>the</strong> National Statistics Office <strong>of</strong> <strong>the</strong> Fiji Islands (and reproduced <strong>in</strong> Levantis (1997)).<br />
PAGE 166
2001 FOREST REVENUE REVIEW<br />
TABLE C.2 MULTIPLIERS FOR SELECTED INDUSTRIES FOR NATIVE FOREST LOGGING REGIONS OF<br />
QUEENSLAND<br />
Industry Value added multipliers a<br />
Type I Type II<br />
Nor<strong>the</strong>rn Region (1989-90)<br />
<strong>Forest</strong>ry 0.90 1.23<br />
Wood and paper 0.78 1.18<br />
Chemicals, petroleum and coal products 0.68 0.94<br />
O<strong>the</strong>r manufactur<strong>in</strong>g 0.66 0.97<br />
Electricity 0.75 0.94<br />
O<strong>the</strong>r build<strong>in</strong>g and construction 0.79 1.16<br />
Non-rail transport 0.84 1.13<br />
F<strong>in</strong>ance, property and bus<strong>in</strong>ess services 0.82 1.20<br />
Public adm<strong>in</strong>istration 0.87 1.41<br />
‘Consumption basket’<br />
Fitzroy Region (1989-90)<br />
0.84 1.12<br />
<strong>Forest</strong>ry 0.81 1.03<br />
Wood and paper 0.72 1.03<br />
Chemicals, petroleum and coal products 0.60 0.76<br />
O<strong>the</strong>r manufactur<strong>in</strong>g 0.63 0.90<br />
Electricity 0.79 0.95<br />
O<strong>the</strong>r build<strong>in</strong>g and construction 0.70 0.96<br />
Non-rail transport 0.77 0.98<br />
F<strong>in</strong>ance, property and bus<strong>in</strong>ess services 0.75 1.03<br />
Public adm<strong>in</strong>istration 0.85 1.28<br />
‘Consumption basket’<br />
Darl<strong>in</strong>g Downs Region (1989-90)<br />
0.78 1.00<br />
<strong>Forest</strong>ry 0.82 1.10<br />
Wood and paper 0.76 1.16<br />
Chemicals, petroleum and coal products 0.74 0.98<br />
O<strong>the</strong>r manufactur<strong>in</strong>g 0.58 0.81<br />
Electricity 0.82 1.00<br />
O<strong>the</strong>r build<strong>in</strong>g and construction 0.75 1.10<br />
Non-rail transport 0.82 1.08<br />
F<strong>in</strong>ance, property and bus<strong>in</strong>ess services 0.80 1.15<br />
Public adm<strong>in</strong>istration 0.86 1.37<br />
‘Consumption basket’ 0.83 1.07<br />
a The Type I multipliers show <strong>the</strong> $ <strong>in</strong>crease <strong>in</strong> regional value-added (ie <strong>the</strong> <strong>in</strong>come generated <strong>in</strong> a<br />
region) for a $1 <strong>in</strong>crease <strong>in</strong> sales tak<strong>in</strong>g <strong>in</strong>to account <strong>the</strong> <strong>in</strong>creased demand for <strong>the</strong> output <strong>of</strong> o<strong>the</strong>r<br />
<strong>in</strong>dustries only. The Type II multipliers also factor <strong>in</strong> <strong>the</strong> $ <strong>in</strong>crease <strong>in</strong> regional value-added<br />
result<strong>in</strong>g from <strong>the</strong> expansion <strong>in</strong> o<strong>the</strong>r <strong>in</strong>dustries as household expenditure <strong>in</strong>creases<br />
Source: Regional <strong>in</strong>put-output tables for 1989-90 prepared by <strong>the</strong> Queensland Government Statistician’s<br />
Office<br />
PAGE 167
C.3 DATA<br />
The data drawn upon for <strong>the</strong> analysis are summarised at Table C.3.<br />
TABLE C.3 CHARACTERISTICS OF THE STYLISED OPERATIONS<br />
Logg<strong>in</strong>g<br />
Portable/<br />
relocatable<br />
eco-mill<br />
Small<br />
commercial<br />
mill<br />
Medium to<br />
large<br />
sawmill<br />
2001 FOREST REVENUE REVIEW<br />
Integrated<br />
small<br />
sawmill<br />
Large<br />
export<br />
veneer mill<br />
Large<br />
export<br />
plywood<br />
mill<br />
Log <strong>in</strong>put ('000 m3/yr) 250,000 330 2,000 63,000 10,000 150,000 150,000<br />
IRR (per cent) 0 18 22 24 28 8 -3<br />
Log price paid (US$/m3)<br />
Base Case<br />
For a 15 per cent IRR at current prices<br />
For a 15 per cent IRR if prices were 50 per cent<br />
higher<br />
Affordable export duty (US$/m3)<br />
For a 15 per cent IRR at current prices<br />
For a 15 per cent IRR if prices were 50 per cent<br />
higher<br />
Foreign employees<br />
Number<br />
Wages ('000 K)<br />
Wages per employee (K)<br />
Income tax per employee (K)<br />
Total <strong>in</strong>come tax from foreign employees<br />
(K/year)<br />
Total local expenditure <strong>of</strong> foreign employees<br />
(K/year)<br />
National employees<br />
Number<br />
Wages ('000 K)<br />
Wages per employee (K)<br />
Inputs to production ('000 k<strong>in</strong>a)<br />
Operat<strong>in</strong>g supplies<br />
Repairs and ma<strong>in</strong>tenance<br />
Fuel and oil<br />
Electricity<br />
Transport<br />
O<strong>the</strong>r overheads<br />
O<strong>the</strong>r general and adm<strong>in</strong><br />
Total<br />
Local <strong>in</strong>puts ('000 k<strong>in</strong>a)<br />
Operat<strong>in</strong>g supplies<br />
Repairs and ma<strong>in</strong>tenance<br />
Fuel and oil<br />
Electricity<br />
Transport<br />
O<strong>the</strong>r overheads<br />
O<strong>the</strong>r general and adm<strong>in</strong><br />
Total<br />
Infrastructure<br />
Benefit <strong>in</strong> K<strong>in</strong>a per m3 <strong>of</strong> log <strong>in</strong>put<br />
Royalty <strong>in</strong> k<strong>in</strong>a per m3 <strong>of</strong> log <strong>in</strong>put<br />
Best estimate <strong>of</strong> export duty forgone<br />
K<strong>in</strong>a per national employee per annum<br />
Per m3 <strong>of</strong> log <strong>in</strong>put<br />
Best estimate <strong>of</strong> premium forgone<br />
At current prices per m3 <strong>of</strong> log <strong>in</strong>put<br />
Stylised Operation<br />
0 16 60 50 45 36 36<br />
0 19 63 57 73 26 9<br />
0 19 88 79 78 45 32<br />
0 3 3 7 28 -11 -27<br />
0 3 28 29 33 9 -5<br />
30 0 1 20 3 50 60<br />
2,098 0 30 500 90 1,250 1,500<br />
69,940 0 30,000 25,000 30,000 25,000 25,000<br />
22,879 0 8,900 7,150 8,900 7,150 7,150<br />
686,375 0 8,900 143,000 26,700 357,500 429,000<br />
156,000 0 5,200 104,000 15,600 260,000 312,000<br />
400 6 14 300 145 500 625<br />
1,652 12 35 851 435 1,690 2,113<br />
4,129 2,079 2,500 2,835 3,000 3,380 3,380<br />
0 0 4 284 150 1,350 8,250<br />
7,054 3 8 851 150 3,000 4,000<br />
6,964 6 2 354 0 1,500 2,625<br />
0 0 4 0 350 0 0<br />
5,357 0 80 992 0 1,350 1,500<br />
3,125 0 20 340 75 1,013 1,350<br />
8,929 0 40 340 100 500 550<br />
31,429 9 158 3,161 825 8,713 18,275<br />
0 0 1 85 45 405 2,475<br />
705 0 1 85 15 300 400<br />
696 1 0 35 0 150 263<br />
0 0 4 0 350 0 0<br />
1,607 0 24 298 0 405 450<br />
1,563 0 10 170 38 506 675<br />
4,464 0 20 170 50 250 275<br />
9,036 1 60 843 498 2,016 4,538<br />
2 1 1 1 1 1 1<br />
10 10 10 10 10 10 10<br />
0 4,507 13,486 19,824 2,826 13,060 10,448<br />
0 82 94 94 41 44 44<br />
0 12 12 12 12 12 12<br />
PAGE 168
ANNEX D MISCELLANEOUS DATA<br />
TABLE D1 ESTIMATES OF THE CURRENT REFORESTATION LEVY TRUST FUND<br />
K<strong>in</strong>a<br />
2001 FOREST REVENUE REVIEW<br />
Levy<br />
Collected Capital Plus Interest<br />
5.00% 10.00% 15.00%<br />
Balance <strong>in</strong> 1994 4,484,412<br />
Balance <strong>in</strong> 1995 6,931,607 6,931,607 6,931,607 6,931,607 6,931,607<br />
Deposits Net <strong>of</strong> Draw<strong>in</strong>gs dur<strong>in</strong>g 1995 2,447,195<br />
Export Volume 1995 (m3) 2,400,000<br />
Re<strong>forest</strong>ation Levy K per cubic metre 1.019664583<br />
Export Volume 1996 2,600,000 2,651,128 9,929,315 10,275,896 10,622,476<br />
Export Volume 1997 3,006,157 3,065,272 13,491,053 14,368,757 15,281,119<br />
Export Volume 1998 1,612,567 1,644,277 15,809,883 17,449,910 19,217,565<br />
Export Volume 1999 1,983,852 2,022,864 18,623,241 21,217,765 24,123,063<br />
Export Volume 2000 1,992,527 2,031,709 21,586,112 25,371,250 29,773,231<br />
Export Volume 2001 Estimated 1,564,190 1,594,949 24,260,367 29,503,325 35,834,165<br />
Total Estimated Re<strong>forest</strong>ation Levy<br />
at 31.12.'01 before draw<strong>in</strong>gs 1996-2001 19,941,806<br />
and ignor<strong>in</strong>g <strong>in</strong>terest earned<br />
Total Estimated Re<strong>forest</strong>ation Levy<br />
at 31.12.'01 before draw<strong>in</strong>gs 1996-2001 24,260,367 29,503,325 35,834,165<br />
Notes: 1994 & 1995 actual from PNGFA 1995 Annual Report<br />
Estimates for 1996-2001 use average rate derived from 1994-95 and actual volumes, except<br />
2001 estimated volume<br />
Assumption: No draw<strong>in</strong>gs between 1995 and 2001<br />
PAGE 169
2001 FOREST REVENUE REVIEW<br />
TABLE D2 LIST OF GROUP 1 SPECIES & CURRENT VALUES, VOLUMES & AVERAGE PROPENSITY TO<br />
DOWNGRADE<br />
Mean Fob P<br />
Price Index<br />
Mean Fob P<br />
Average Average<br />
US$ per<br />
cubic metre<br />
1=<br />
US$ per m3 Sales Volume Propensity to<br />
<strong>in</strong> Sept m3/month <strong>in</strong> Downgrade<br />
Commercial Name Scientific Name <strong>in</strong> 2001 US$75.39 2001 2001 (0-1)<br />
Kwila Intsia spp. $99.04 1.314 N/a 133 0.79<br />
PNG Mersawa Anisoptera thurifera $90.20 1.196 $78.19 10425 0.23<br />
Pencil Cedar Palaquium warburgianum $86.71 1.150 $73.17 5799 0.12<br />
Taun Pometia p<strong>in</strong>nata $84.98 1.127 $69.13 12680 0.21<br />
Calophyllum Calophyllum spp. $84.73 1.124 $71.52 15804 0.12<br />
Red Planchonella Planchonella torricellensis $70.55 0.936 $54.54 173 0.14<br />
Red Canarium Canarium <strong>in</strong>dicum $68.17 0.904 $58.65 4040 0.20<br />
Hekakoro Gluta <strong>papua</strong>na $67.52 0.896 N/a 41 0.00<br />
Burckella Burckella obovata/B. sorei $67.26 0.892 $57.57 4336 0.10<br />
Grey Canarium Canarium oleosum $67.24 0.892 $56.69 2045 0.10<br />
Term<strong>in</strong>alia Term<strong>in</strong>alia spp.<br />
Planchonella<br />
$66.65 0.884 $56.87 5951 0.16<br />
White Planchonella kaembachiana $65.74 0.872 $55.91 1096 0.07<br />
Dillenia Dillenia <strong>papua</strong>na<br />
Lophopetalum<br />
$64.51 0.856 $53.32 4685 0.16<br />
Lophopetalum/Perupok torricellense $64.34 0.853 $58.89 1013 0.10<br />
Erima Octomeles sumatrana $63.64 0.844 $55.19 5019 0.14<br />
Malas Homalium foetidum $63.28 0.839 $54.80 15279 0.06<br />
PNG Walnut Dracontomelon dao $60.21 0.799 $50.55 2750 0.15<br />
Group 1 All Species $75.39 1.000 $67.29 91269 0.15<br />
Group 2 All Species $59.31 0.787 $48.89 11950 0.12<br />
Group 3 All Species $55.26 0.733 $45.34 33387 0.07<br />
Group 4 All Species $50.80 0.674 $42.62 28070 0.08<br />
Group 2 Plantation Regular $57.00 0.756 N/a 2757 0.00<br />
All Groups Saw/Veneer $65.95 0.875 $59.25 164676 N/a<br />
All Groups All Logs $62.55 0.830 $56.28 188972 0.12<br />
All Groups Low Grade $39.14 0.519 $35.86 22652 N/a<br />
Source: SGS Log Export Monitor<strong>in</strong>g Report for September 2001<br />
PAGE 170
ANNEX E TERMS OF REFERENCE<br />
1 Introduction<br />
REVIEW OF THE FOREST REVENUE SYSTEM<br />
2001 FOREST REVENUE REVIEW<br />
As part <strong>of</strong> <strong>the</strong> Government’s announced <strong>in</strong>itiative to encourage susta<strong>in</strong>able <strong>forest</strong> management, it<br />
has commissioned <strong>the</strong> Review team to undertake a Review <strong>of</strong> <strong>the</strong> <strong>Forest</strong>ry Revenue System and<br />
Taxation Regime. The Review will be transparent and <strong>in</strong>volve consultation and dialogue with<br />
stakeholders.<br />
In 2000, <strong>the</strong> Review completed a partial <strong>review</strong> <strong>of</strong> various aspects <strong>of</strong> <strong>forest</strong>ry taxation and <strong>the</strong><br />
result<strong>in</strong>g recommendations were <strong>in</strong>cluded <strong>in</strong> <strong>the</strong> 2001 Budget. As a cont<strong>in</strong>uation <strong>of</strong> this process a<br />
more comprehensive exam<strong>in</strong>ation <strong>of</strong> <strong>the</strong> <strong>forest</strong>ry <strong>revenue</strong> and tax <strong>system</strong> is proposed that will not<br />
only build on this previous work but will also <strong>in</strong>clude a number <strong>of</strong> o<strong>the</strong>r previous <strong>forest</strong> <strong>revenue</strong><br />
studies with<strong>in</strong> PNG and overseas. It is envisaged that implementation <strong>of</strong> more medium-term<br />
reform options/recommendations <strong>of</strong> <strong>the</strong> <strong>forest</strong>ry <strong>revenue</strong> <strong>system</strong> and taxation regime will be<br />
facilitated through <strong>the</strong> proposed <strong>Forest</strong>ry and Conservation Project.<br />
The Government’s objectives for <strong>the</strong> development <strong>of</strong> <strong>the</strong> <strong>forest</strong>ry <strong>revenue</strong> <strong>system</strong> are:<br />
To improve <strong>the</strong> <strong>forest</strong>ry <strong>revenue</strong> and taxation <strong>system</strong> to encourage tax efficiency and<br />
buoyancy, susta<strong>in</strong>able <strong>forest</strong>ry management, adequate economic rent capture and good<br />
governance, tak<strong>in</strong>g <strong>in</strong>to account <strong>the</strong> importance <strong>of</strong> susta<strong>in</strong><strong>in</strong>g robust <strong>revenue</strong>s to <strong>the</strong> State<br />
and reduc<strong>in</strong>g distortions to resource allocation decisions (allocative efficiency);<br />
To enhance equity <strong>in</strong> <strong>the</strong> <strong>forest</strong>ry <strong>revenue</strong> and taxation <strong>system</strong> to ensure a fair distribution <strong>of</strong><br />
benefit between resource owners, <strong>the</strong> community and <strong>the</strong> State, while m<strong>in</strong>imiz<strong>in</strong>g distortions<br />
to commercial <strong>in</strong>vestment and operational decisions and returns;<br />
To reduce impediments to <strong>the</strong> development <strong>of</strong> economically viable and susta<strong>in</strong>able <strong>forest</strong>rybased<br />
opportunities, <strong>in</strong>clud<strong>in</strong>g domestic process<strong>in</strong>g, plantations and natural <strong>forest</strong><br />
regeneration improvement, and evaluat<strong>in</strong>g options for charges and/or <strong>in</strong>centives while<br />
m<strong>in</strong>imiz<strong>in</strong>g <strong>the</strong> impact on allocative economic efficiency; and<br />
To improve <strong>the</strong> adm<strong>in</strong>istration <strong>of</strong> <strong>the</strong> <strong>system</strong> through measures designed to enhance<br />
compliance and good management practice, <strong>in</strong>crease transparency and accountability, limit<br />
<strong>the</strong> <strong>of</strong>ficial management <strong>of</strong> trust funds and reduce discretion by <strong>of</strong>ficials, <strong>the</strong>reby reduc<strong>in</strong>g<br />
<strong>the</strong> scope for malfeasance.<br />
In this Review, <strong>the</strong> primary focus will be to assist <strong>the</strong> Government lay <strong>the</strong> foundations for an<br />
efficient, robust and equitable tax and <strong>revenue</strong> regime that will underp<strong>in</strong> <strong>the</strong> long-term susta<strong>in</strong>able<br />
development <strong>of</strong> <strong>forest</strong>ry <strong>in</strong> Papua New Gu<strong>in</strong>ea. It is imperative that this <strong>review</strong> be conducted<br />
from a long-term national economic perspective, ra<strong>the</strong>r than <strong>the</strong> more narrow f<strong>in</strong>ancial<br />
perspective <strong>of</strong> <strong>the</strong> firm’s ability to pay, as has been <strong>the</strong> case <strong>in</strong> all previous <strong>forest</strong> <strong>revenue</strong> studies.<br />
PAGE 171
2 Background<br />
2001 FOREST REVENUE REVIEW<br />
This Review is part <strong>of</strong> a broader reform <strong>of</strong> <strong>the</strong> <strong>forest</strong>ry sector which has <strong>in</strong>cluded: amendments to<br />
<strong>the</strong> <strong>Forest</strong>ry Act to improve governance and accountability; an Independent Review <strong>of</strong> FMAs and<br />
o<strong>the</strong>r timber harvest<strong>in</strong>g applications; and a proposed <strong>Forest</strong>ry and Conservation Project<br />
(supported by <strong>the</strong> World Bank).<br />
Current <strong>forest</strong> tax and <strong>revenue</strong> arrangements are set out <strong>in</strong> <strong>the</strong> table below:<br />
National Government Prov<strong>in</strong>cial Governments Resource Owners<br />
Company <strong>in</strong>come tax <strong>in</strong>clud<strong>in</strong>g<br />
concession arrangements<br />
Withhold<strong>in</strong>g tax<br />
Log Export tax<br />
VAT (now zero rated)<br />
Re<strong>forest</strong>ation levy adm<strong>in</strong>istered by<br />
PNGFA<br />
Personal <strong>in</strong>come tax<br />
VAT (now zero rated)<br />
Infrastructure development levies<br />
Royalties<br />
Project Development Benefit<br />
(formerly Levies)<br />
Premiums and development levies<br />
(some projects);<br />
Re<strong>forest</strong>ation levy adm<strong>in</strong>istered by<br />
PNGFA<br />
It is recognised that <strong>the</strong> current <strong>revenue</strong> <strong>system</strong> is not consistently applied to all projects (partly<br />
on <strong>the</strong> basis <strong>of</strong> prior project agreements, etc.), and is relatively limited <strong>in</strong> its objectives and<br />
coverage.<br />
3 Issues for Review<br />
The proposed <strong>revenue</strong> <strong>system</strong> should be developed on <strong>the</strong> basis <strong>of</strong> <strong>the</strong> current <strong>forest</strong> tax and<br />
<strong>revenue</strong> <strong>system</strong> elements (taxes, royalties, levies, <strong>in</strong>centives and fees) aga<strong>in</strong>st generally accepted<br />
tax pr<strong>in</strong>ciples (efficiency, buoyancy, adm<strong>in</strong>istrative simplicity, user pays attributes etc.) and<br />
account<strong>in</strong>g for <strong>the</strong> <strong>in</strong>terdependencies <strong>of</strong> tax and <strong>revenue</strong> components with<strong>in</strong> a whole <strong>forest</strong>ry<br />
<strong>revenue</strong> <strong>system</strong>. In addition, charges and levies should be evaluated aga<strong>in</strong>st <strong>the</strong>ir objectives and<br />
aga<strong>in</strong>st <strong>the</strong> overall <strong>forest</strong> policy <strong>of</strong> <strong>the</strong> PNG Government. In this respect, <strong>the</strong> <strong>review</strong> should<br />
generally take <strong>forest</strong> policy as set by Government as a given, unless changes can demonstrably<br />
and significantly improve <strong>the</strong> efficiency and adm<strong>in</strong>istration <strong>of</strong> <strong>the</strong> <strong>forest</strong> <strong>revenue</strong> <strong>system</strong>. The<br />
<strong>review</strong> should also attempt to establish/ma<strong>in</strong>ta<strong>in</strong> a level play<strong>in</strong>g field framework both with<strong>in</strong> <strong>the</strong><br />
<strong>forest</strong> and related <strong>forest</strong> <strong>in</strong>dustries and with o<strong>the</strong>r <strong>in</strong>dustries <strong>in</strong> PNG.<br />
The proposed <strong>revenue</strong> <strong>system</strong> should ultimately relate to <strong>the</strong> entire <strong>forest</strong>ry sector, notably:<br />
natural <strong>forest</strong> utilisation (<strong>in</strong>clud<strong>in</strong>g <strong>in</strong>dustrial logg<strong>in</strong>g, community <strong>forest</strong>ry and eco-<strong>forest</strong>ry);<br />
plantation <strong>forest</strong>ry;<br />
non-timber <strong>forest</strong> products (<strong>in</strong>clud<strong>in</strong>g rattan, eaglewood, etc); and<br />
timber process<strong>in</strong>g.<br />
Resource Owner Benefits<br />
PAGE 172
2001 FOREST REVENUE REVIEW<br />
Until 1996, royalty rates varied between projects, <strong>in</strong> accordance with project agreements and<br />
related project conditions, when <strong>the</strong>y were standardised at K10 per cubic metre. Levies,<br />
premiums and o<strong>the</strong>r non-monetary contractual requirements for landowner benefits still vary<br />
markedly between projects.<br />
The Project Development Levy (PDL) was announced <strong>in</strong> <strong>the</strong> context <strong>of</strong> <strong>the</strong> 1996 Budget, to<br />
ensure greater consistency <strong>in</strong> community benefits between projects, notably <strong>in</strong> terms <strong>of</strong> a floor<br />
level, and to ensure better delivery <strong>of</strong> longer term community benefits, especially local<br />
<strong>in</strong>frastructure, etc. The PDL was never implemented, as a result <strong>of</strong> a comb<strong>in</strong>ation <strong>of</strong> <strong>in</strong>dustry<br />
resistance and legal difficulties with its retrospective application to exist<strong>in</strong>g projects.<br />
Subsequently, a similar Project Development Benefit (PDB) has been adopted by <strong>the</strong> National<br />
<strong>Forest</strong> Board on <strong>the</strong> same basis as <strong>the</strong> PDL, but restricted only to <strong>new</strong> projects and those exist<strong>in</strong>g<br />
projects that come up for contractual <strong>review</strong>.<br />
It is important to note that <strong>the</strong> PDL/PDB on log exports was only <strong>in</strong>tended to serve as an <strong>in</strong>terim<br />
measure, until a study <strong>of</strong> domestic process<strong>in</strong>g costs and benefits, and <strong>forest</strong> <strong>revenue</strong> was to have<br />
been conducted <strong>in</strong> 1997. Unfortunately, that study did not complete its terms <strong>of</strong> reference, notably<br />
<strong>in</strong> terms <strong>of</strong> economic assessment. Options, such as some form <strong>of</strong> <strong>revenue</strong> recycl<strong>in</strong>g to fund<br />
ongo<strong>in</strong>g <strong>in</strong>frastructure projects, need to be presented/<strong>review</strong>ed to address <strong>the</strong> problem <strong>of</strong> very<br />
long rotations, which effectively remove <strong>in</strong>centives for <strong>in</strong>dividual clan groups to participate <strong>in</strong><br />
longer term development decision frameworks.<br />
Corporate Income Tax and Transfer Pric<strong>in</strong>g<br />
Apparent transfer pric<strong>in</strong>g is a major issue <strong>of</strong> concern. For example, published log trade data has<br />
revealed unexpla<strong>in</strong>ed <strong>in</strong>consistencies, after account<strong>in</strong>g for freight and <strong>in</strong>surance, between PNG<br />
FOB log prices and Japanese CIF log prices, <strong>of</strong> up to US$35 (This refers specifically to taun and<br />
calophyllum saw/veneer logs) per cubic metre for premium timber species.<br />
In addition, many logg<strong>in</strong>g companies have ei<strong>the</strong>r never paid corporate <strong>in</strong>come tax or paid very<br />
limited tax, despite operat<strong>in</strong>g <strong>in</strong> PNG for many years. Consequently, corporate tax adm<strong>in</strong>istration<br />
with respect to <strong>forest</strong>ry would appear to be <strong>the</strong> key issue to be <strong>review</strong>ed, particularly <strong>the</strong> extent <strong>of</strong><br />
transfer pric<strong>in</strong>g, and recommendations should focus on how to improve compliance. In this<br />
respect, <strong>the</strong> log export tax should not, <strong>in</strong> <strong>the</strong> first <strong>in</strong>stance, be used beyond economic rent capture<br />
to <strong>of</strong>fset compliance <strong>in</strong>adequacies <strong>in</strong> corporate tax collections. Recommendations should focus on<br />
rectify<strong>in</strong>g <strong>the</strong>se directly if plausible. The structure <strong>of</strong> corporate taxation would appear<br />
appropriate and level play<strong>in</strong>g field considerations should steer <strong>the</strong> evaluation and<br />
recommendations away from alter<strong>in</strong>g corporate tax rate structures.<br />
Domestic Process<strong>in</strong>g<br />
Domestic timber processors currently receive preference compared to log exporters, as a result <strong>of</strong><br />
be<strong>in</strong>g exempt from export taxes, PDB and log export premiums <strong>of</strong> about US$35 per cubic metre.<br />
The 2000 Taxation Review raised concerns regard<strong>in</strong>g this apparent distortion. The level <strong>of</strong><br />
preference depends substantially on <strong>the</strong> economic rent captured by <strong>the</strong> log export tax etc. that is<br />
<strong>the</strong> real benefit to processors, not necessarily <strong>the</strong> current level <strong>of</strong> <strong>the</strong> tax. In general explicit tax<br />
<strong>in</strong>centives should be avoided and focus should be on impediments to process<strong>in</strong>g etc. If fiscal<br />
<strong>in</strong>centives are to be granted, <strong>the</strong>n for transparency reasons, direct budget payments should be<br />
considered.<br />
PAGE 173
2001 FOREST REVENUE REVIEW<br />
Long-term Government policy favours <strong>the</strong> progressive replacement <strong>of</strong> log export<strong>in</strong>g with<br />
domestic process<strong>in</strong>g <strong>of</strong> <strong>forest</strong> products, so long as <strong>the</strong> activity is economically viable and<br />
susta<strong>in</strong>able. It is recognised that value-added may be achieved, and greater local employment<br />
secured, both <strong>in</strong> major process<strong>in</strong>g operations and small-scale saw-mill<strong>in</strong>g. However, while <strong>in</strong>itial<br />
concessions may be justified (as an <strong>in</strong>fant <strong>in</strong>dustry), it is important to ensure <strong>the</strong> fundamental<br />
consistency <strong>of</strong> <strong>the</strong> basic tax regime. General concessions are already available under <strong>the</strong> exist<strong>in</strong>g<br />
Income Tax Act for all resource process<strong>in</strong>g activities. Some m<strong>in</strong>or <strong>forest</strong> products, such as<br />
eaglewood, are currently be<strong>in</strong>g exported without any export tax, royalties, or management<br />
conditions be<strong>in</strong>g applied.<br />
Recommendations <strong>in</strong> this sector should focus on <strong>the</strong> measurement <strong>of</strong> short and long term<br />
economic benefits <strong>of</strong> various downstream process<strong>in</strong>g options.<br />
Log Export Tax<br />
The <strong>revenue</strong> and many <strong>of</strong> <strong>the</strong> costs for timber companies are denom<strong>in</strong>ated <strong>in</strong> US dollars, or o<strong>the</strong>r<br />
currencies ra<strong>the</strong>r than K<strong>in</strong>a. Fluctuat<strong>in</strong>g and generally decl<strong>in</strong><strong>in</strong>g K<strong>in</strong>a to Dollar exchange rates<br />
over <strong>the</strong> past decade, coupled with <strong>the</strong> progressive structure <strong>of</strong> <strong>the</strong> tax bands, have lead to sharp<br />
variations <strong>in</strong> effective export tax rates. With improved compliance, <strong>in</strong> large part <strong>the</strong> result <strong>of</strong> <strong>the</strong><br />
contract<strong>in</strong>g <strong>of</strong> <strong>the</strong> monitor<strong>in</strong>g to an external company, this would appear to have resulted <strong>in</strong> less<br />
compliance with payment <strong>of</strong> o<strong>the</strong>r <strong>forest</strong>ry taxes and charges. In 2000, <strong>the</strong> Review briefly<br />
considered this issue, but fur<strong>the</strong>r exam<strong>in</strong>ation is required. This tax should be predom<strong>in</strong>antly tied<br />
to <strong>the</strong> capture <strong>of</strong> economic rents.<br />
4 Specific Outputs<br />
The Review shall:<br />
derive an estimate <strong>of</strong> economic value 34 for <strong>the</strong> natural <strong>forest</strong> resources which can used as<br />
basis to underp<strong>in</strong> a <strong>forest</strong> <strong>revenue</strong> regime;<br />
conduct an economic cost-benefit appraisal for a range <strong>of</strong> <strong>in</strong>dustrial timber process<strong>in</strong>g<br />
options, notably:- large and small scale timber process<strong>in</strong>g, veneer/plywood mill, and pulp<br />
mill. The appraisal shall assess <strong>the</strong> <strong>in</strong>come and employment multiplier effect from <strong>the</strong>se<br />
options;<br />
ascerta<strong>in</strong> <strong>the</strong> level <strong>of</strong> transfer pric<strong>in</strong>g if any, and recommend strategies to overcome <strong>the</strong><br />
practice or alleviate <strong>the</strong> impact <strong>of</strong> transfer pric<strong>in</strong>g to PNG;<br />
assess <strong>the</strong> potential resource rental from log exports;<br />
establish a broad base for allocation <strong>of</strong> resource rents;<br />
recommend a level and an adm<strong>in</strong>istrative mechanism for <strong>in</strong>dustry performance bonds.<br />
Recommendations should be separated <strong>in</strong>to those that can be adopted <strong>in</strong> <strong>the</strong> short term and those<br />
that will need a longer-term implementation phase and/or require capacity build<strong>in</strong>g or fur<strong>the</strong>r<br />
<strong>review</strong>.<br />
34 Consist<strong>in</strong>g <strong>of</strong> environmental value (<strong>in</strong>clud<strong>in</strong>g watershed management, etc.), customary social and economic<br />
resource use (<strong>in</strong>clud<strong>in</strong>g timber and non-timber <strong>forest</strong> products for subsistence and cash <strong>in</strong>come, etc.), as well as<br />
commercial timber value.<br />
PAGE 174
5 Review Team<br />
2001 FOREST REVENUE REVIEW<br />
The Review Team will work closely with <strong>the</strong> Inter-agency technical work<strong>in</strong>g committee from <strong>the</strong><br />
PNG <strong>Forest</strong> Authority, Internal Revenue Commission, Department <strong>of</strong> Treasury, Department <strong>of</strong><br />
Plann<strong>in</strong>g and Monitor<strong>in</strong>g and <strong>the</strong> Department <strong>of</strong> Prime M<strong>in</strong>ister and <strong>the</strong> National Executive<br />
Council.<br />
The Review Team will consist <strong>of</strong>:<br />
A Team Leader, who shall be a highly experienced <strong>Forest</strong> Economist, with wide-rang<strong>in</strong>g<br />
background <strong>in</strong> natural resource management, <strong>in</strong>clud<strong>in</strong>g tropical <strong>forest</strong>ry, <strong>revenue</strong> <strong>system</strong>s<br />
and downstream process<strong>in</strong>g;<br />
An Economist with experience <strong>of</strong> economic issues and analysis <strong>in</strong> Papua New Gu<strong>in</strong>ea,<br />
<strong>in</strong>clud<strong>in</strong>g <strong>forest</strong> <strong>revenue</strong> <strong>system</strong>s;<br />
A Natural Resource Economist with experience <strong>in</strong> resource valuation, externalities and<br />
multipliers.<br />
A <strong>Forest</strong>ry Specialist with experience <strong>in</strong> PNG <strong>forest</strong>ry management and development.<br />
A Process<strong>in</strong>g Specialist with experience <strong>in</strong> domestic process<strong>in</strong>g.<br />
A <strong>Forest</strong>ry Market<strong>in</strong>g Specialist, with knowledge <strong>of</strong> market<strong>in</strong>g channels, especially for<br />
tropical timber (<strong>the</strong> South Sea Log Trade), cost<strong>in</strong>g <strong>system</strong>s, market<strong>in</strong>g mechanisms etc.<br />
The <strong>review</strong> team shall convene a workshop to consult with landowners, non-government<br />
organisations, logg<strong>in</strong>g and process<strong>in</strong>g <strong>in</strong>dustries, and <strong>of</strong>ficials.<br />
PAGE 175
ANNEX F REVIEW TEAM MEMBERS<br />
Jim Belford, <strong>Forest</strong>ry Specialist, Papua New Gu<strong>in</strong>ea<br />
Lachlan Hunter, Team Leader, New Zealand<br />
Chris LaFranchi, Resource Economist, USA<br />
Alan Ogle, <strong>Forest</strong> Industry Specialist, New Zealand<br />
Craig Sugden, Economist, Australia<br />
Ivan Tomaselli, <strong>Forest</strong> Products Market<strong>in</strong>g Specialist, Brazil<br />
2001 FOREST REVENUE REVIEW<br />
PAGE 176
REFERENCES<br />
2001 FOREST REVENUE REVIEW<br />
APM (1983) - The Japanese Market for South Seas Logs - With Particular Reference to Papua<br />
New Gu<strong>in</strong>ea Log Exports, Volume one - 71 pages, Volume two- 188 pages<br />
Ashenden Pacific Market<strong>in</strong>g (1984) The Japanese Market for South Sea Logs with Partial<br />
Reference to Papua New Gu<strong>in</strong>ea Log Exports<br />
Association <strong>of</strong> Pr<strong>of</strong>essional <strong>Forest</strong>er <strong>of</strong> Papua New Gu<strong>in</strong>ea (1998) Planim Dewai (Plant<strong>in</strong>g<br />
Trees) Proc.2 nd AFPNG Biennial Conf.<br />
Association <strong>of</strong> Pr<strong>of</strong>essional <strong>Forest</strong>er <strong>of</strong> Papua New Gu<strong>in</strong>ea (2000) Wokim Dewai (Investment <strong>in</strong><br />
<strong>Forest</strong>ry) Proc.3 rd AFPNG Biennial Conf.<br />
AusAID (2000) Papua New Gu<strong>in</strong>ea National Road and Bridge Ma<strong>in</strong>tenance Project, Project<br />
Design Document, February.<br />
Bartelmus, Peter et al. (1991) Integrated Environmental and Economic Account<strong>in</strong>g: A PNG Case<br />
Study<br />
Bass, Stephen et al. (1997) Private Sector <strong>Forest</strong>ry: Review <strong>of</strong> Instruments Ensur<strong>in</strong>g<br />
Susta<strong>in</strong>ability IIED, London<br />
Bogan N. et al (2000) Ref<strong>in</strong><strong>in</strong>g <strong>the</strong> Tax System, Report <strong>of</strong> <strong>the</strong> Taxation Review, Port Moresby,<br />
October.<br />
Brown, Chris (1997) Asia-Pacific <strong>Forest</strong>ry Sector Outlook Study Work<strong>in</strong>g Paper Series<br />
APFSOS/WP/01 FAO Pacific<br />
Bourke M. et al (2001), Rural Plann<strong>in</strong>g Handbook for Papua New Gu<strong>in</strong>ea, Research School <strong>of</strong><br />
Pacific and Asian Studies, The Australian National University, November.<br />
Carlton D. W. and Perl<strong>of</strong>f J. M. (2000), Modern Industrial Organisation, 3 rd Edition, Addison-<br />
Wesley.<br />
Census and Statistics Department (1999). Hong Kong Trade Statistics, Domestic Exports and Reexports,<br />
December 1999<br />
Census and Statistics Department (1999). Hong Kong Trade Statistics, Imports, December 1999<br />
Census and Statistics Department (2000). Hong Kong Trade Statistics, Domestic Exports and Reexports,<br />
December 2000<br />
Census and Statistics Department (2000). Hong Kong Trade Statistics, Imports, December 2000<br />
Census and Statistics Department (2001). Hong Kong Trade Statistics, Domestic Exports and Reexports,<br />
June 2001<br />
Census and Statistics Department (2001). Hong Kong Trade Statistics, Imports, June 2001<br />
PAGE 177
2001 FOREST REVENUE REVIEW<br />
Chatterton et al (1999) Papua New Gu<strong>in</strong>ea Susta<strong>in</strong>able <strong>Forest</strong>ry Assessment WB/WWF<br />
Daniel P., Palmer K., Watson A and Brown R. (2000) Review <strong>of</strong> <strong>the</strong> Fiscal Regimes for M<strong>in</strong><strong>in</strong>g<br />
and Hydrocarbons, Prepared for <strong>the</strong> Papua New Gu<strong>in</strong>ea Tax Review, October.<br />
Department <strong>of</strong> Trade and Industry (2001) Statistical Digest 2000<br />
Department <strong>of</strong> Trade and Industry (1998) National Investment Policy<br />
Department <strong>of</strong> Trade and Industry (2001) Industrial Development Plan Twenty 2002-20<br />
Duncan R., (1995) Melanesian <strong>Forest</strong> Sector Study, AIDAB International Development Series<br />
No. 36.<br />
Economic Insights (1996) The Economy <strong>of</strong> Papua New Gu<strong>in</strong>ea – 1996 Report, AusAID<br />
International Development Issues No.46.<br />
Economic Insights (1999) The 1999 Economic Report – Informal Sector…., AusAID<br />
International Development Issues No.46.<br />
Economic Insights and Imps Research, Insights Papua New Gu<strong>in</strong>ea, various quarters.<br />
Eddawes, P. (1997) Commercial Timber <strong>of</strong> Papua New Gu<strong>in</strong>ea PNG; <strong>Forest</strong> Research Center<br />
Ellis, Julie-Ann (1999) Race for <strong>the</strong> Ra<strong>in</strong><strong>forest</strong> II: Apply<strong>in</strong>g Lessons Learned <strong>in</strong> <strong>the</strong> Bismarck-<br />
Ramu Archipelago<br />
Emerson C. and Lloyd P.J. (1983) Improv<strong>in</strong>g M<strong>in</strong>eral Taxation Policy <strong>in</strong> Australia, Economic<br />
Record, Volume 59, September, pp.232-244.<br />
Filer, Col<strong>in</strong> et al. (1999) Green Tail Wags Brown Dog; World Bank Leverage and <strong>Forest</strong> Policy<br />
Reform <strong>in</strong> Papua New Gu<strong>in</strong>ea<br />
FORTECH (1998) Market<strong>in</strong>g <strong>of</strong> Papua New Gu<strong>in</strong>ea <strong>Forest</strong> Products F<strong>in</strong>al Report ITTO Project<br />
PD 35/94 Rev.4 (M) Submitted by The PNG <strong>Forest</strong> Authority – <strong>in</strong>cludes:<br />
_____Cost-benefit analysis <strong>of</strong> log export operations <strong>in</strong> Papua New Gu<strong>in</strong>ea, Milestone Report 5.<br />
…………Domestic Process<strong>in</strong>g Policy – Cost Benefit Analysis <strong>of</strong> Domestic Process<strong>in</strong>g <strong>in</strong> Papua<br />
New Gu<strong>in</strong>ea, Milestone Report 6, June.<br />
Garnaut R. and Clunies Ross (1975) Uncerta<strong>in</strong>ty, Risk Aversion and <strong>the</strong> Tax<strong>in</strong>g <strong>of</strong> Natural<br />
Resource Projects, Economic Journal, Volume 85, Issue 338, pp. 272-287.<br />
_________________________ (1979) The Neutrality <strong>of</strong> <strong>the</strong> Resource Rent Tax, Economic<br />
Record, Volume 55, September, pp. 193-201.<br />
General Wood & Veneers (1994) <strong>Forest</strong> Industries Development Studies. Documents prepared<br />
for PNG <strong>Forest</strong> Authority – ITTO Project PD108/90 Ver.1 (I)<br />
Document 1 - ITTO Terms <strong>of</strong> Reference, FIDS Project Inception, Sector Background Work<strong>in</strong>g<br />
Papers, <strong>Forest</strong> Sector Review<br />
PAGE 178
Document 2 - Industrial Process<strong>in</strong>g Sector<br />
Document 3 - Harvest<strong>in</strong>g and Transportation Review and Projection<br />
2001 FOREST REVENUE REVIEW<br />
Document 4 - F<strong>in</strong>ancial and Economic Incentives <strong>in</strong> Management <strong>of</strong> PNG’s <strong>Forest</strong> Resources<br />
Document 5 - Domestic Market Study<br />
Document 6 - International Market Study<br />
Government <strong>of</strong> Papua New Gu<strong>in</strong>ea and United Nations Development Programme (1998) Papua<br />
New Gu<strong>in</strong>ea Human Development Report 1998, Office <strong>of</strong> National Plann<strong>in</strong>g, Port Moresby<br />
Government <strong>of</strong> Papua New Gu<strong>in</strong>ea (1988) Commission <strong>of</strong> Enquiry <strong>in</strong>to Aspects <strong>of</strong> <strong>the</strong> <strong>Forest</strong><br />
Industry Corporation as a State Market<strong>in</strong>g Agency (Barnett Report)<br />
Government <strong>of</strong> Papua New Gu<strong>in</strong>ea (1995) <strong>Forest</strong>ry Regulations Vol. 1 List Vol.2 Forms<br />
Greenpeace Pacific (1999) Islands Adrift? Compar<strong>in</strong>g Industrial and Small-scale Options,<br />
Marovo, Solomon Islands<br />
Groome Poyry Ltd (1998) Audit <strong>of</strong> Landowner Benefits Received from Harvest<strong>in</strong>g Operations<br />
Under Timber Permit, F<strong>in</strong>al Report, Volumes 1 and 2, April.<br />
Grut, Mikael et al. (1991) <strong>Forest</strong> Pric<strong>in</strong>g and Concession Policies: Manag<strong>in</strong>g High <strong>Forest</strong>s, West<br />
& Central Africa<br />
Gullison, R.E., R.E. Rice, and A.G. Blundell (2000) ‘Market<strong>in</strong>g’ Species Conservation. Nature,<br />
27 April, Vol 404, www.nature.com<br />
van Helden, Flip (1998) Between Cash & Conservation: <strong>the</strong> Social Context <strong>of</strong> <strong>the</strong> Bismarck-<br />
Ramu Project NRI Monograph 33<br />
Higham, Clarrie (1995) A Revenue System for <strong>the</strong> Department <strong>of</strong> Environment and<br />
Conservation: Stage 1 Foundations & Issues<br />
Hunt C. (2000) Revenue Implications <strong>of</strong> Export Tax Denom<strong>in</strong>ation <strong>in</strong> Develop<strong>in</strong>g Countries: The<br />
Case <strong>of</strong> <strong>Forest</strong>ry <strong>in</strong> Papua New Gu<strong>in</strong>ea, Economic Analysis & Policy, Vol. 30, No. 2, September.<br />
Hunt, C. (2000) Reform<strong>in</strong>g <strong>the</strong> <strong>Forest</strong> Revenue Systems <strong>of</strong> Papua New Gu<strong>in</strong>ea Discussion Paper<br />
IIED, NRI<br />
Hyde W.F. and Sedjo R.A. (1992) Manag<strong>in</strong>g Tropical <strong>Forest</strong>s: Reflections on <strong>the</strong> Rent<br />
Distribution Discussion, Land Economics, Volume 68(3), August, pp.343-350.<br />
Independent Review Team (2001) Review <strong>of</strong> <strong>Forest</strong> Harvest<strong>in</strong>g Projects be<strong>in</strong>g Processed to a<br />
Timber Permit or a Timber Authority<br />
ITTO (1999) Report on <strong>the</strong> Downturn <strong>in</strong> <strong>the</strong> International Tropical Timber Market: A Study<br />
Aris<strong>in</strong>g from Decision 6 (XXIV) <strong>of</strong> <strong>the</strong> International Tropical Timber Council - Report prepared<br />
by Mr. Ge<strong>of</strong>frey Pleydell and Dr. Ivan Tomaselli<br />
PAGE 179
2001 FOREST REVENUE REVIEW<br />
ITTO (1999) Report on <strong>the</strong> Impediments to Market Access for Tropical Timber: Pursuant to<br />
Decision 2 (XXIII) - Report prepared by Tan Sri Dato'Wong Kum Choon and J. Michael<br />
G<strong>in</strong>n<strong>in</strong>gs<br />
ITTO (1996-2000) Annual Review and Assessment <strong>of</strong> <strong>the</strong> World Timber Situation<br />
ITTO (1996-2001) Market Information Service January/1996 - September/2001<br />
ITTO (1998) PNG Market<strong>in</strong>g <strong>of</strong> Papua New Gu<strong>in</strong>ea <strong>Forest</strong> Products Project, PD 35/94 – Rev.4<br />
(M)<br />
ITTO / CAF (2001) Ch<strong>in</strong>a <strong>Forest</strong> Products Market Information, n o 11, August<br />
Japan Lumber Importers Association (2001) – JLIA, Timber Trade Reports, 1990 - March<br />
Japan Lumber Journal, 1998 to July 2001<br />
Japan Lumber Report, 1994-Sep 2001<br />
Lampietti, J.A., and J.A. Dixon (1995) To See <strong>the</strong> <strong>Forest</strong> for <strong>the</strong> Trees: A Guide to Non-Timber<br />
<strong>Forest</strong> Benefits, Environment Department <strong>of</strong> <strong>the</strong> World Bank, Wash<strong>in</strong>gton, D.C. Paper No. 013.<br />
Leslie, A.J. (1990) The Scope for Investment <strong>in</strong> Market<strong>in</strong>g: Tropical Timber and Timber Products<br />
from Asia. World Bank<br />
L<strong>in</strong>ddal, M. and R. Lubowski. (1999) Uses and Abuses <strong>of</strong> <strong>Forest</strong> Valuation – What Can Policy<br />
Makers Ga<strong>in</strong>? Environmental Economics and Indicators Program. Environment Department <strong>of</strong><br />
<strong>the</strong> World Bank, Wash<strong>in</strong>gton, D.C.<br />
Levantis T. (2000) Work<strong>in</strong>g Manual for <strong>the</strong> CGE model <strong>of</strong> <strong>the</strong> Fiji Economy, Version 2, National<br />
Centre for Development Studies, Australian National University.<br />
Levantis T. (1998) Tak<strong>in</strong>g a Piece <strong>of</strong> <strong>the</strong> Pie: PNG’s Log Exports and Optimal Taxation Pacific<br />
Economic Bullet<strong>in</strong> 13 (2)<br />
LTS International (2001) Study <strong>of</strong> <strong>the</strong> Medium-term and Long-term Outlook for Tropical Timber<br />
Markets [report on ITTO Project PPD 27/99 (M)]<br />
MASKAYU (2001) - Monthly Bullet<strong>in</strong> <strong>of</strong> <strong>the</strong> Malaysian Timber Industry Board, 2000 – January<br />
McCallum, Rob et al. (1997) Race for <strong>the</strong> Ra<strong>in</strong><strong>forest</strong>: Evaluat<strong>in</strong>g Lessons from <strong>the</strong> ICD<br />
“Experiment”, New Ireland UNDP/GEF/DEC<br />
M<strong>in</strong>ister for <strong>Forest</strong>s / Endorsed by National Executive Council (1993) National <strong>Forest</strong>ry<br />
Development Guidel<strong>in</strong>es<br />
M<strong>in</strong>istry <strong>of</strong> <strong>Forest</strong>s - PNG (1991) National <strong>Forest</strong> Policy<br />
Mokuzai Shikko Geppo - <strong>Forest</strong>ry Agency (MAFF)<br />
PAGE 180
2001 FOREST REVENUE REVIEW<br />
National Research Institute (2000) Issues and <strong>Trends</strong> <strong>in</strong> National Development: Searchlight on<br />
Papua New Gu<strong>in</strong>ea<br />
Nikkan Mokuzai Shimbun (2001): Japan Trade Journal (Whole Prices) – 6 September<br />
OECD (1984) Transfer Pric<strong>in</strong>g and Mult<strong>in</strong>ational Enterprises: Three Taxation Issues, Paris.<br />
Pearce, D. and R. Turner (1990) Economics <strong>of</strong> Natural Resources and <strong>the</strong> Environment The<br />
Johns Hopk<strong>in</strong>s University Press Baltimore<br />
Personal Communication (2001), Mr. Jared Hardner, Hardner and Gullison Associates, LLC.<br />
November. Palo Alto, California, USA.<br />
Pleydell. G., and Tomaselli. I (1999) Report on <strong>the</strong> Downturn <strong>in</strong> <strong>the</strong> International Tropical<br />
Timber Market. ITTO, Yokohama, 162p.<br />
PNGFA – Timber Digest ( December 1996, 1997, 1998, 1999, and 2000)<br />
PNGFA (1996) Procedures for Export<strong>in</strong>g Logs<br />
PNGFA (1995) Guidel<strong>in</strong>es for Issu<strong>in</strong>g Timber Authorities<br />
PNGFA (1996) National <strong>Forest</strong> Plan<br />
PNGFA (1996) National Policy on Downstream Process<strong>in</strong>g <strong>of</strong> <strong>Forest</strong> Products<br />
PNGFA-Jaakko Poyry (1998) Veneer-Plywood Process<strong>in</strong>g Project, Panakawa<br />
PNGFA (1999) Brief for Incom<strong>in</strong>g M<strong>in</strong>ister for <strong>Forest</strong>s<br />
PNGFA (1995) Village Guide to Land Incorporation<br />
PNGFA (1993) - National <strong>Forest</strong> Development Guidel<strong>in</strong>es<br />
PNGFA (1996) Logg<strong>in</strong>g Code <strong>of</strong> Practice<br />
PNGFA (1995) Plann<strong>in</strong>g, Monitor<strong>in</strong>g & Control <strong>of</strong> Natural <strong>Forest</strong> Logg<strong>in</strong>g; Key Standards for<br />
Selection Logg<strong>in</strong>g <strong>in</strong> Papua New Gu<strong>in</strong>ea<br />
PNGFA (2001) National Re<strong>forest</strong>ation Policy (Draft 2)<br />
PNGFA (2001) <strong>Forest</strong>ry (Amendment) Act 2000<br />
PNGFA (1995) Manual on Land Group Incorporation<br />
PNGFA (1996) Annual Report 1995<br />
PNGFA (1996) Procedures fir Identification, Scal<strong>in</strong>g, and Report<strong>in</strong>g on Logs Harvested from<br />
Natural <strong>Forest</strong>s<br />
PNGFA (1996) Procedures for Assess<strong>in</strong>g Post-Logg<strong>in</strong>g Waste<br />
PAGE 181
2001 FOREST REVENUE REVIEW<br />
PNGFA (1995) Representative Resource Owner Bodies; <strong>Forest</strong> Management and Plann<strong>in</strong>g<br />
Projects (Groome-Poyry)<br />
PNG For Industries Assoc. (2001) a Work<strong>in</strong>g Guide to Papua New Gu<strong>in</strong>ea Timbers<br />
PNG <strong>Forest</strong> Industries Association 2001 <strong>Forest</strong> Investment Sem<strong>in</strong>ar (PNG Institute <strong>of</strong> <strong>Forest</strong>ers<br />
Conference)<br />
P.R. Ch<strong>in</strong>a (2000) Ch<strong>in</strong>a Statistical Yearbook; National Bureau <strong>of</strong> Statistics: Ch<strong>in</strong>a Statistics<br />
Report<br />
Price Waterhouse (2000) <strong>Forest</strong> Taxation and Domestic Process<strong>in</strong>g Study, A study for <strong>the</strong><br />
M<strong>in</strong>istry <strong>of</strong> F<strong>in</strong>ance and <strong>the</strong> M<strong>in</strong>istry <strong>of</strong> <strong>Forest</strong>s, Environment and Conservation, Solomon Island<br />
Government<br />
Rice, R. 2001. Conservation Concessions – Concept Description. Center for Applied<br />
Biodiversity Science. Wash<strong>in</strong>gton DC.<br />
Sehran, Nik (1996) Biodiversity on a Tightrope: Incentives for Ra<strong>in</strong><strong>forest</strong> Conservation <strong>in</strong> PNG<br />
Shedden Agribus<strong>in</strong>ess Pty Ltd (1991) Papua New Gu<strong>in</strong>ea <strong>Forest</strong> Revenue and F<strong>in</strong>ancial Study:<br />
Ma<strong>in</strong> Report, Volume 1, prepared for AusAID.<br />
SGS PNG (1997-2001) Log Export Monitor<strong>in</strong>g: Monthly Report to <strong>the</strong> Papua New Gu<strong>in</strong>ea <strong>Forest</strong><br />
Authority<br />
Solomon Islands M<strong>in</strong>istry <strong>of</strong> <strong>Forest</strong>ry (1999) <strong>Forest</strong>ry Taxation Review<br />
Tacconi, Luca (1995) Review <strong>of</strong> <strong>the</strong> <strong>Forest</strong> Revenue System <strong>of</strong> Vanuatu Research Report No.8<br />
UNSW Economics and Management<br />
Thompson, Herb et al. (2000) Economic Logg<strong>in</strong>g & Plywood <strong>in</strong> Indonesia Journal <strong>of</strong> Regional<br />
Studies 2 (2)<br />
V<strong>in</strong>cent J.R. (1990) Rent Capture and <strong>the</strong> Feasibility <strong>of</strong> Tropical Management, Land Economics,<br />
Volume 66, No.2, May, pp.212-223.<br />
Webber, D (1988) Pric<strong>in</strong>g and Revenue Issues <strong>in</strong> <strong>the</strong> <strong>Forest</strong>ry Industry - Report <strong>of</strong> Reconnaisance<br />
Visit to PNG<br />
World Bank (1990) Papua New Gu<strong>in</strong>ea: The <strong>Forest</strong>ry Sector; A TFAP Review<br />
World Bank (1999) Papua New Gu<strong>in</strong>ea – Improv<strong>in</strong>g Governance and Performance, October<br />
Worldwide Fund for Nature (2000) Future <strong>of</strong> <strong>the</strong> <strong>Forest</strong>s: Strategies for Community <strong>Forest</strong>ry <strong>in</strong><br />
Papua New Gu<strong>in</strong>ea<br />
PAGE 182
Websites<br />
2001 FOREST REVENUE REVIEW<br />
www.fao.org - <strong>Forest</strong>ry Database<br />
www.<strong>forest</strong>ry.ac.cn - Ch<strong>in</strong>ese Academy <strong>of</strong> <strong>Forest</strong>ry<br />
www.<strong>forest</strong>ry.eazier.com - Ch<strong>in</strong>a <strong>Forest</strong>ry Information Center<br />
www.jawic.or.jp - Japan Wood Products Information and Research Center (JAWIC)<br />
www.jlj.gr.jp - Japan Lumber Journal<br />
www.nichigouren.or.jp - Japan Plywood Manufactures’ Association<br />
www.yardeni.com/ - http://www.yardeni.com/public/shfxas_c.pdf, Macro economic <strong>in</strong>formation,<br />
etc., world wide.<br />
PAGE 183